Embed Size (px)
Citation preview

Public Service Enterprise Group
PSEG Earnings Conference Call4th Quarter and Year-end 2007
February 1, 2008

1
Disclaimer Statement
The statements contained in this communication about our and our subsidiaries’ future performance, including, without limitation, future revenues, earnings, strategies, prospects and all other statements that are not purely historical, are forward-looking statements for purposes of the safe harbor provisions under The Private Securities Litigation Reform Act of 1995. Although we believe that our expectations are based on information currently available and on reasonable assumptions, we can give no assurance they will be achieved. There are a number of risks and uncertainties that could cause actual results to differ materially from the forward-looking statements made herein. A discussion of some of these risks and uncertainties is contained in our Annual Report on Form 10-K and subsequent reports on Form 10-Q and Form 8-K filed with the Securities and Exchange Commission (SEC), and available on our website: http://www.pseg.com. These documents address in further detail our business, industry issues and other factors that could cause actual results to differ materially from those indicated in this communication. In addition, any forward-looking statements included herein represent our estimates only as of today and should not be relied upon as representing our estimates as of any subsequent date. While we may elect to update forward-looking statements from time to time, we specifically disclaim any obligation to do so, even if our estimates change, unless otherwise required by applicable securities laws.
2
GAAP Disclaimer
PSEG presents Operating Earnings in addition to its Net Income reported in accordance with generally accepted accounting principles (GAAP). Operating Earnings is a non-GAAP financial measure that differs from Net Income because it excludes the impact of the sale of certain non-core domestic and international assets and costs stemming from the terminated merger agreement with Exelon Corporation. PSEG presents Operating Earnings because management believes that it is appropriate for investors to consider results excluding these items in addition to the results reported in accordance with GAAP. PSEG believes that the non- GAAP financial measure of Operating Earnings provides a consistent and comparable measure of performance of its businesses to help shareholders understand performance trends. This information is not intended to be viewed as an alternative to GAAP information. The last slide in this presentation includes a list of items excluded from Net Income to reconcile to Operating Earnings, with a reference to that slide included on each of the slides where the non-GAAP information appears. These slides are only intended to be reviewed in conjunction with the oral presentation to which they relate.

PSEG 2007 Q4 Review
Ralph Izzo Chairman, President and Chief Executive Officer

4
Q4 2007 EPS Summary
$ millions (except EPS) Q4 2007 Q4 2006
Operating Earnings $ 277 $ 136
Impact of Asset Sales ($ 51) -
Merger Costs - ($ 1)
Income from Continuing Operations $ 226 $ 135
Discontinued Operations, net of tax ($ 2) ($ 182)
Net Income $ 224 ($ 47)
EPS from Operating Earnings $ 1.09 $ 0.54
* See page 32 for Items excluded from Net Income to reconcile to Operating Earnings

5
Full year 2007 Income Summary
$ millions (except EPS) 2007 2006
Operating Earnings $ 1,377 $ 872
Impact of Asset Sales ($ 58) ($ 185)
Merger Costs - ($ 8)
Income from Continuing Operations $ 1,319 $ 679
Discontinued Operations, net of tax $ 16 $ 60
Net Income $ 1,335 $ 739
EPS from Operating Earnings $ 5.41 $ 3.45
For the years ended December 31,
* See page 32 for Items excluded from Net Income to reconcile to Operating Earnings
6
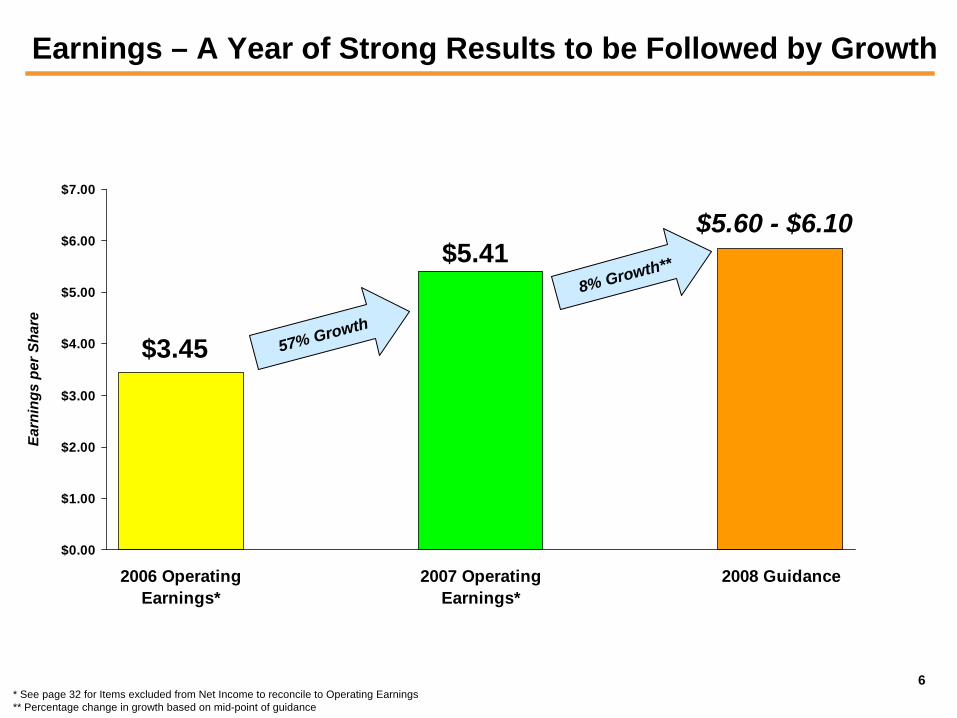
Earnings – A Year of Strong Results to be Followed by Growth
$0.00
$1.00
$2.00
$3.00
$4.00
$5.00
$6.00
$7.00
2006 OperatingEarnings*
2007 OperatingEarnings*
2008 Guidance
$5.41$5.60 - $6.10
Earn
ings
per
Sha
re
$3.45 57% Growth
8% Growth**
* See page 32 for Items excluded from Net Income to reconcile to Operating Earnings ** Percentage change in growth based on mid-point of guidance

7
PSEG – 2007: A Defining Year• 2007 earnings at top end of guidance
• Focus on core businesses• Resumed independent operation of nuclear• Top decile reliability standards maintained at PSE&G• Latin American assets sold at attractive values
• Meeting commitment to system reliability• Transmission investment announced• New peaking investment announced
• Addressing NJ’s clean energy goals• Multi-faceted strategy
• Financial risk reduced with stronger balance sheet• Debt reduced
• Cash returned to shareholders• 10% increase in common dividend announced

PSEG 2007 Q4 Operating Company Review
Tom O’Flynn
Executive Vice President and Chief Financial Officer President – PSEG Energy Holdings

9
Q4 Operating Earnings by Subsidiary
$ Millions (except EPS) Operating Earnings Per Share
2007 2006 2007 2006
PSEG Power $ 205 $ 102 $ 0.80 $ 0.40
PSE&G 77 64 0.30 0.25
PSEG Energy Holdings 15 (14) 0.06 (0.05)
Enterprise (20) (16) (0.07) (0.06)
PSEG $ 277 $ 136 $ 1.09 $ 0.54
For the Quarters ended December 31,
* See page 32 for Items excluded from Net Income to reconcile to Operating Earnings

10
Full Year 2007 Operating Earnings by Subsidiary
$ Millions (except EPS) Operating Earnings Per Share
2007 2006 2007 2006
PSEG Power $ 949 $ 515 $ 3.73 $ 2.04
PSE&G 376 262 1.48 1.04
PSEG Energy Holdings 115 161 0.45 0.63
Enterprise (63) (66) (0.25) (0.26)
PSEG $ 1,377 $ 872 $ 5.41 $ 3.45
For the years ended December 31,
* See page 32 for Items excluded from Net Income to reconcile to Operating Earnings

11
0.00
0.50
1.00
1.50
$ / s
hare
PSEG EPS Reconciliation – Q4 2006 versus Q4 2007
Q4 2007 operating earnings
Q4 2006 operating earnings
* See page 32 for Items excluded from Net Income to reconcile to Operating Earnings
Weather .06
Rate relief .04
Volume & demand .03
Transmission .01
O&M (.06)
Other (.03)
Recontracting & strong markets .32
BGSS .06
MTM .01
O&M .01
Global
Texas – MTM .06 & operations .01
Effective tax rate .05
Interest expense .02
Other operations (.02)
Resources
Interest expense .02
Effective tax rate (.02)
Other (.01)
Interest .03
Misc. (.04)
$0.54
$0.40$0.05
$0.11 ($0.01) $1.09
PSE&GPower Holdings Enterprise
12
0.00
2.00
4.00
6.00
$ / s
hare
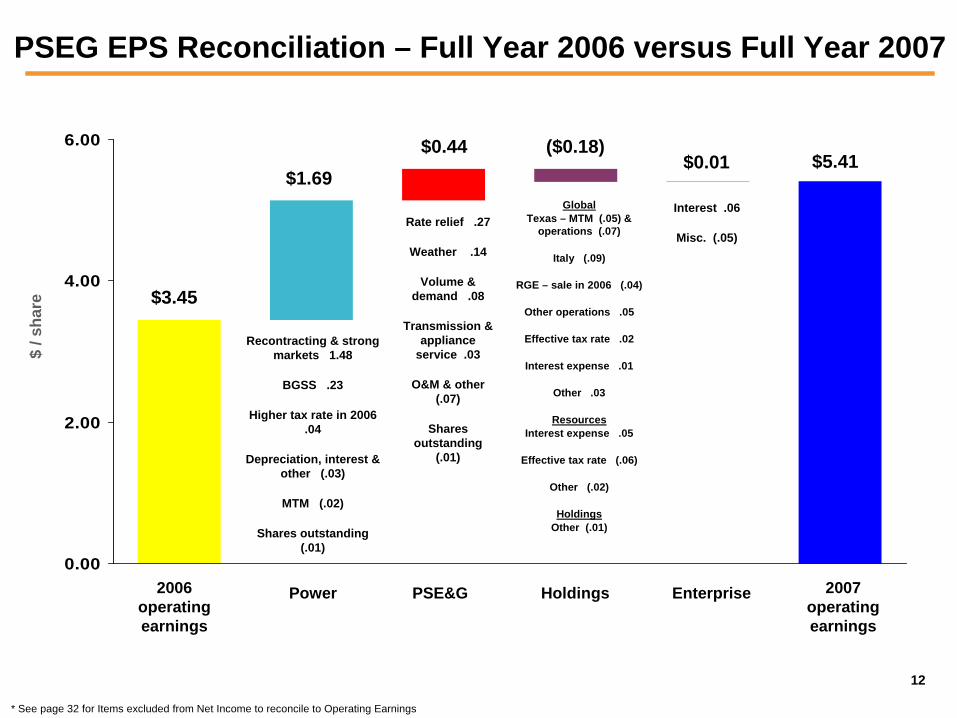
PSEG EPS Reconciliation – Full Year 2006 versus Full Year 2007
2007 operating earnings
2006 operating earnings
* See page 32 for Items excluded from Net Income to reconcile to Operating Earnings
$3.45
$0.44$1.69
($0.18)$0.01 $5.41
PSE&GPower Holdings Enterprise
Recontracting & strong markets 1.48
BGSS .23
Higher tax rate in 2006 .04
Depreciation, interest & other (.03)
MTM (.02)
Shares outstanding (.01)
Rate relief .27
Weather .14
Volume & demand .08
Transmission & appliance
service .03
O&M & other (.07)
Shares outstanding
(.01)
GlobalTexas – MTM (.05) &
operations (.07)
Italy (.09)
RGE – sale in 2006 (.04)
Other operations .05
Effective tax rate .02
Interest expense .01
Other .03
ResourcesInterest expense .05
Effective tax rate (.06)
Other (.02)
HoldingsOther (.01)
Interest .06
Misc. (.05)

PSEG Power 2007 Q4 Review

14
PSEG Power – Q4 2007 EPS Summary
$ millions (except EPS) Q4 2007 Q4 2006 Variance
Operating Revenues $ 1,762 $ 1,506 $ 256
Operating Earnings $ 205 $ 102 $ 103
Income from Continuing Operations $ 205 $ 102 $ 103
Discontinued Operations, net of tax - ($ 220) $ 220
Net Income (Loss) $ 205 ($ 118) $ 323
EPS from Operating Earnings $ 0.80 $ 0.40 $ 0.40
* See page 32 for Items excluded from Net Income to reconcile to Operating Earnings

15
$0.40
$0.32
$0.06$0.02 $0.80
0.00
0.30
0.60
0.90
Recontracting & strong markets
$ / s
hare
PSEG Power EPS Reconciliation – Q4 2006 versus Q4 2007
Q4 2007 operating earnings
Q4 2006 operating earnings
BGSS
MTM .01
O&M .01
* See page 32 for Items excluded from Net Income to reconcile to Operating Earnings

16
Prices and Operations Yield Margin Increase
$0
$20
$40
$60
Q4 2006 Q4 2007
PSEG Power Realized Gross Margin ($/MWh)
$38
$51
$0
$20
$40
$60
2006 2007
$38
$50+34% +32%

17
PSEG Power – Generation Measures
7,3436,541
3,779
3,083
1,924
2,767
0
5,000
10,000
15,000
2006 2007
29,108 28,363
14,84113,014
9,19011,819
0
20,000
40,000
60,000
2006 2007
4th Quarter Years ended December 31,
Total Nuclear Total Coal* Total Oil & Natural Gas
* Includes figures for Pumped Storage; excludes Lawrenceburg
PSEG Power – Generation (GWh)
13,046 12,39153,139 53,196

18
RPM Capacity Auction – Transparent Pricing Model
• RPM has had an influence on the market – forced outage rates declining, retirements slowing, more DSM bid into market.
• PSEG Power is taking steps to add 300 – 400MW ($250 - $350 million) of new gas-fired peaking capacity that may be bid into PJM’s Reliability Pricing Model (RPM) base residual auctions in 2008.
• The final decision to proceed with construction will take into account capital and interconnection costs, available siting and potential for environmental limitations.
• Auctions scheduled in the next year provide price certainty through the 2011-2012 delivery year.
Planning Year Auction Date
2010 – 2011 January 2008
2011 – 2012 May 2008
Annual base auction in May of each subsequent year

19
PSEG Power – Q4 Highlights
OperationsPSEG Nuclear resumed independent operation of Salem and Hope Creek at year-endNRC approval of Hope Creek 125MW uprate expected by July 1Overall generation output – Q4 decline; full year at record levels
Nuclear down 11%Fossil up 2.6%
MarketsImproved pricing for energy in PJM, New York and New EnglandBenefiting from roll-off of below market contracts
FinancialConstruction of back-end technology on Fossil units - on time and on budget$250 million dividend paid to Enterprise

PSE&G 2007 Q4 Review

21
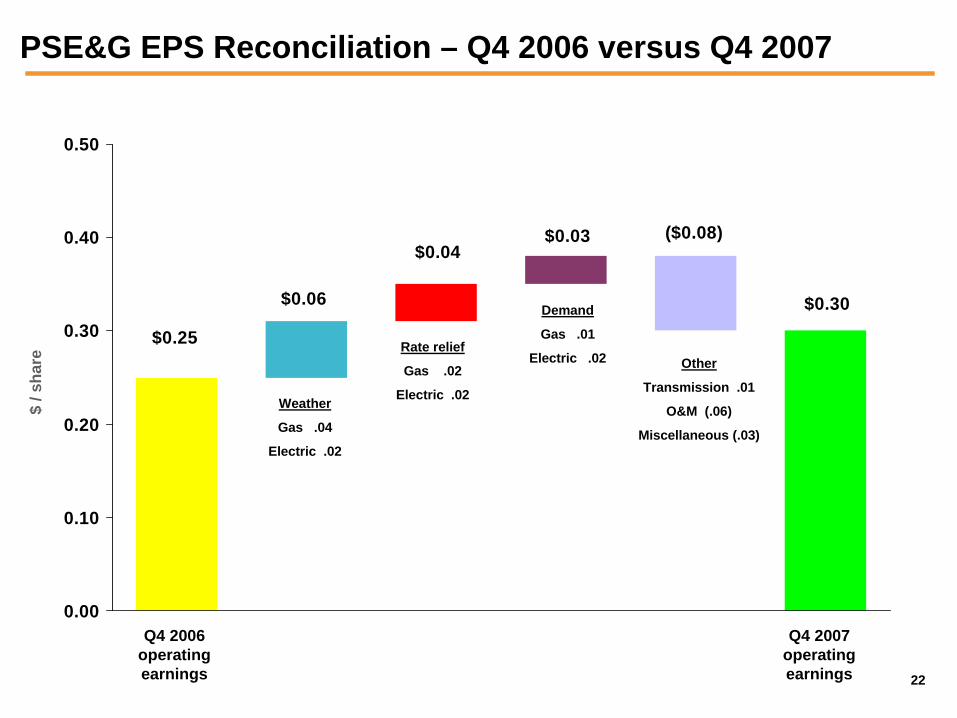
PSE&G – Q4 2007 EPS Summary
$ millions (except EPS) Q4 2007 Q4 2006 Variance
Operating Revenues $ 2,153 $ 1,815 $ 338
Operating Earnings $ 77 $ 64 $ 13
Income from Continuing Operations/ Net Income
$ 77 $ 64 $ 13
EPS from Operating Earnings $ 0.30 $ 0.25 $ 0.05
22
$0.25
$0.06
$0.04$0.03 ($0.08)
$0.30
0.00
0.10
0.20
0.30
0.40
0.50
Rate relief
Gas .02
Electric .02
$ / s
hare
PSE&G EPS Reconciliation – Q4 2006 versus Q4 2007
Q4 2007 operating earnings
Q4 2006 operating earnings
Weather
Gas .04
Electric .02
Other
Transmission .01
O&M (.06)
Miscellaneous (.03)
Demand
Gas .01
Electric .02

23
PSE&G – Q4 Highlights
OperationsSales growth reflects:
• Weather normalized growth from all customer classes – annual increase of 1.7%• Weather – more normal versus less than optimal conditions
Re-staffing of organization nearly complete – 2% increase for year
RegulatoryNJ enacts Regional Greenhouse Gas Initiative in January 2008PSE&G files initiatives with NJ BPU to reduce carbon, explore AMIPSE&G files for incentives on new transmission capital investmentAwaiting BPU response to $100M solar initiativeNJ Energy Master Plan – draft proposal expected in Spring 2008
Financial$100 million dividend paid to Enterprise

PSEG Energy Holdings 2007 Q4 Review

25
PSEG Energy Holdings – Q4 2007 EPS Summary
$ millions (except EPS) Q4 2007 Q4 2006 Variance
Operating Earnings $ 15 ($ 14) $ 29
Sale of Chilquinta & Luz del Sur ($ 23) - ($ 23)
Bond Redemption Costs ($ 28) - ($ 28)
Income (Loss) from Continuing Operations
($ 36) ($ 14) ($ 22)
Discontinued Operations, net of tax ($ 2) $ 38 ($ 40)
Net Income ($ 38) $ 24 ($ 62)
EPS from Operating Earnings $ 0.06 ($ 0.05) $ 0.11
* See page 32 for Items excluded from Net Income to reconcile to Operating Earnings

26
-0.07
-0.03
0.01
0.05
0.09
$ / s
hare
PSEG Energy Holdings EPS Reconciliation – Q4 2006 versus Q4 2007
Q4 2007 operating earnings
Q4 2006 operating earnings
* See page 32 for Items excluded from Net Income to reconcile to Operating Earnings
($0.05)
$0.07
$0.05
$0.02 ($0.02)
$0.06
Texas – MTM .06 & lower
maintenance expense .01
Interest expense
Effective tax rate
Other operations
$0.02
($0.01)
($0.02)
Interest expense
Effective tax rate
Other
ResourcesGlobal

27
PSEG Energy Holdings – Q4 Highlights
OperationsContinued strong operations in Texas and other domestic facilities
MarketsValuations remain strong for international assetsTexas near-term spark spreads lower
FinancialElectroandes closed in October for $284 million; Chilquinta and Luz del Sur sale closed in December for $685 millionDiscontinued operations for SAESA with intent to sellCalled $400 million of Holdings 10% debt maturing in 2009Filed with SEC to de-register Holdings$210 million dividend paid to Enterprise

PSEG 2007 Q4 Review
29
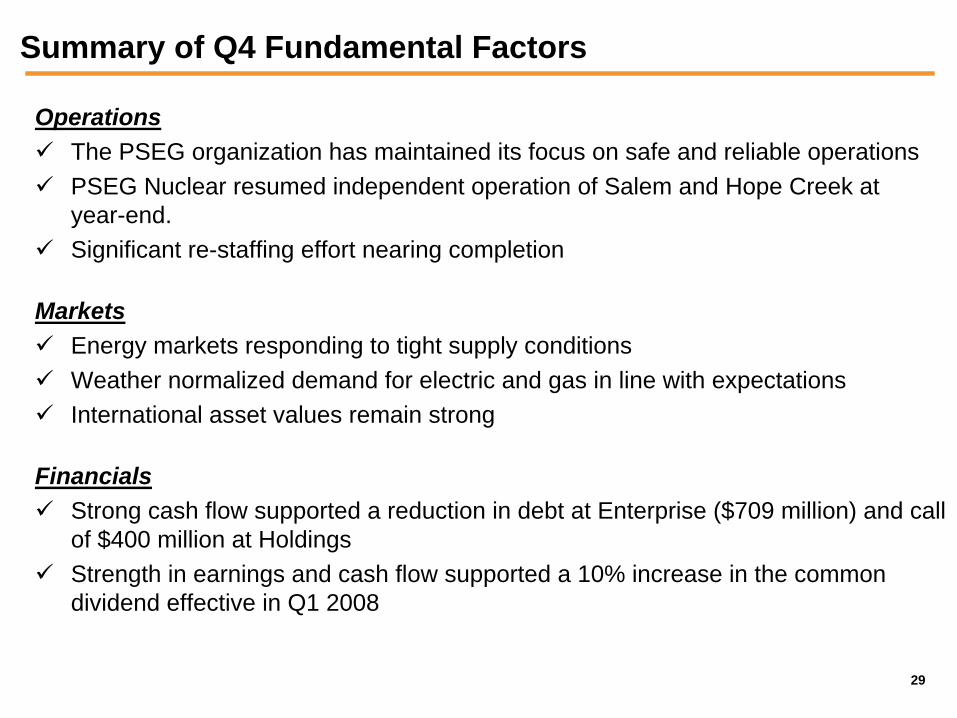
Summary of Q4 Fundamental Factors
OperationsThe PSEG organization has maintained its focus on safe and reliable operationsPSEG Nuclear resumed independent operation of Salem and Hope Creek at year-end. Significant re-staffing effort nearing completion
MarketsEnergy markets responding to tight supply conditionsWeather normalized demand for electric and gas in line with expectationsInternational asset values remain strong
FinancialsStrong cash flow supported a reduction in debt at Enterprise ($709 million) and call of $400 million at HoldingsStrength in earnings and cash flow supported a 10% increase in the common dividend effective in Q1 2008

30
Cash Outlook – Forecast Intact
• We remain comfortable with improvement in cash• Operating income exceeding expectations• Successful asset sales• Planned rate mechanisms for transmission investments
would provide cash recovery during construction
• Excess cash between $2.0 billion and $2.5 billion will be available through 2011
• Excess cash expected to be used to retire debt and further strengthen the balance sheet, invest in target markets, and/or share repurchase

31
2008 Operating Earnings Guidance – Continued Growth
$ millions (except EPS) 2007A 2008E
PSEG Power $ 949 $ 1,040 - $ 1,140
PSE&G $ 376 $ 350 - $ 370
PSEG Energy Holdings $ 115 $ 45 - $ 60
Parent ($ 63) ($ 15) - ($ 10)
Operating Earnings $ 1,377 $ 1,420 - $ 1,560
Earnings per Share $ 5.41 $ 5.60 - $ 6.10

32
Items Excluded from Net Income to Reconcile to Operating Earnings
Please see Slide 2 for an explanation of PSEG’s use of Operating Earnings as a non-GAAP financial measure and howit differs from Net Income.
$ Millions (except EPS)2007 2006 2007 2006 2007 2006 2007 2006
Merger related Costs:PSE&G -$ -$ -$ (1)$ Enterprise - (1) - (7)
Total Merger related Costs -$ (1)$ -$ (8)$ -$ -$ -$ (0.03)$
Impact of Asset Sales:Loss on Sale of RGE - - - (178) -$ -$ -$ (0.70)$ Chilquinta & Luz Del Sur (23) - (23) - (0.09) - (0.09) - Write down of Turboven - - (7) - - - (0.03) - Premium on bond redemption (28) - (28) (7) (0.11) - (0.11) (0.03)
Total Impact of Asset Sales (51)$ -$ (58)$ (185)$ (0.20)$ -$ (0.23)$ (0.73)$
Discontinued Operations:Power - Lawrenceburg -$ (220)$ (8)$ (239)$ -$ (0.87)$ (0.03)$ (0.95)$
Holdings:SAESA (69) 32 (33) 57 (0.27) 0.12 (0.13) 0.23 Electroandes 67 6 57 16 0.26 0.03 0.22 0.06 Elcho and Skawina - - - 226 - - - 0.90
Total Holdings (2)$ 38$ 24$ 299$ (0.01)$ 0.15$ 0.09$ 1.19$ Total Discontinued Operations (2)$ (182)$ 16$ 60$ (0.01)$ (0.72)$ 0.06$ 0.24$
Quarters Ended Dec. 31, Years Ended Dec. 31,Impact to PSEG EPS
Quarters Ended Dec. 31, Years Ended Dec. 31,