Embed Size (px)
Citation preview
PSEG PowerStrategic Direction
Frank CassidyPresident & COO

35
Power OverviewPSEG Power’s portfolio optimization strategy provides incremental
profit opportunities while mitigating risks
PSEG EnergyResources & Trade (ER&T)
PSEG Power LLC
PSEGNuclear
PSEGFossil
Energy &
Capacity$
Energy &
Capacity
$
Other Energy Related
Products and
Services
Wholesale Electric Energy
Markets• BGS• Other firm contracts• Spot market Gas
Markets
• Wholesale gas customers• Retail gas customers
Gas Contracts& Storage
$Wholesale
Gas & Storage
36
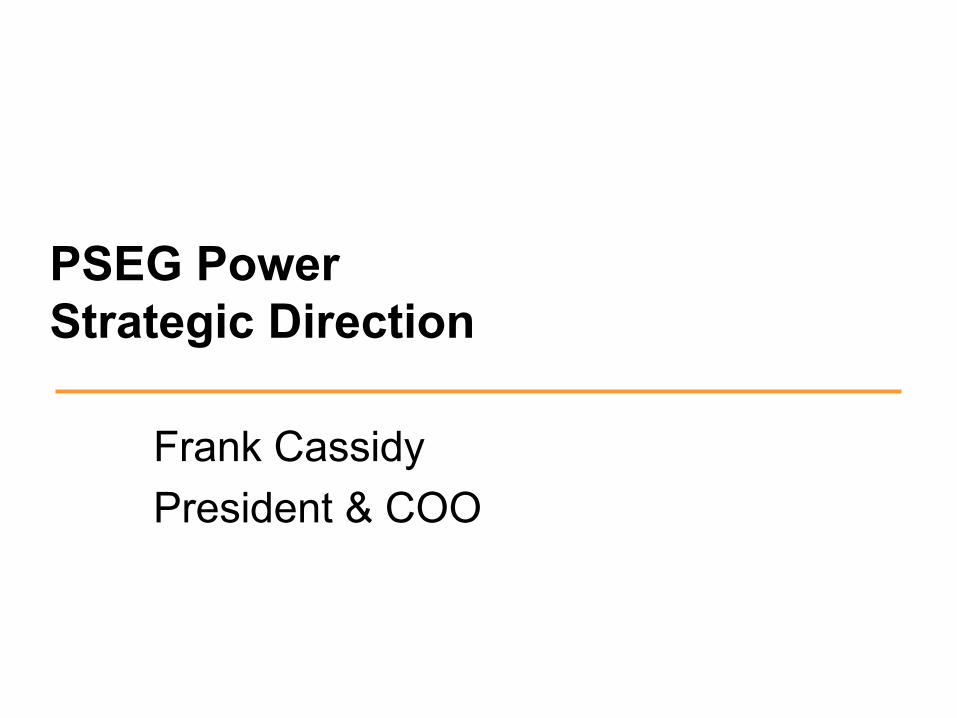
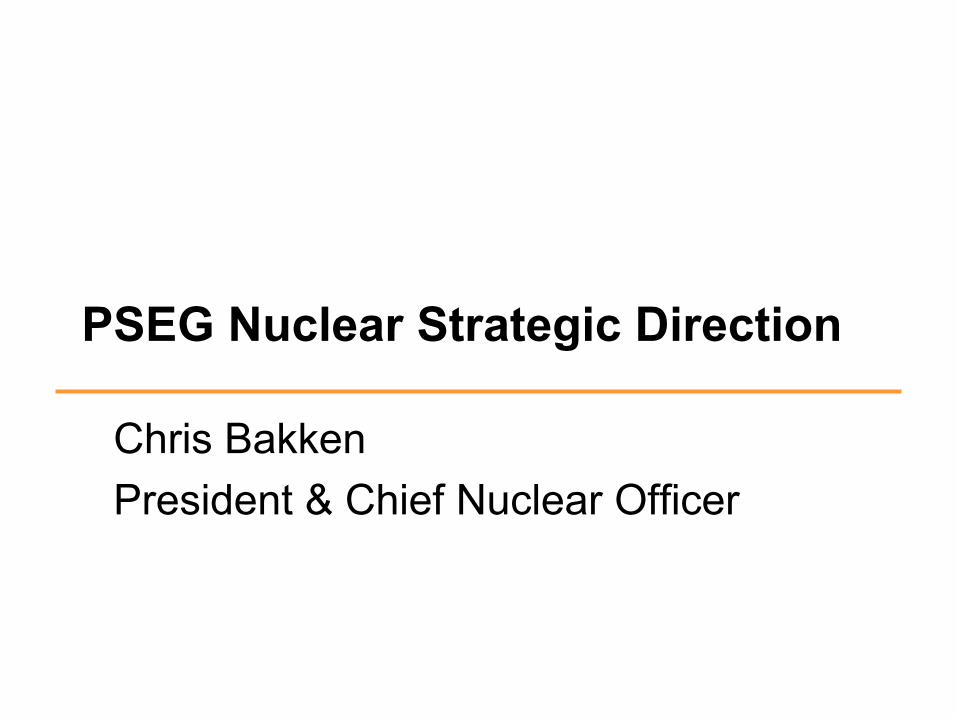
Key Issues
NRC ResolvedOperational ExcellenceMean/Top Quartile89-92%~$100 million
7%$25 millionRealized~$100 million
Received NRC letterCNO Transition+$50 million 85%$150-200 million
11%BaseDeveloped$350-400 million
Contracted
BGS Margins
Augment Staff
NRC LetterOrganizationO&MCapacity FactorCapEx
Forced Outage-CoalO&M EfficiencyPlaybookCapEx
Market Prices
Diversification
Trading
2004 2005 Long-Term
NRC MonitoringOrganizational Stability+$50 million 91%$150-$175 million
10%$5 millionImplemented$150-$175 million
Realize Higher Market Prices
Contract Diversification
Increased Origination & Market Liquidity
Issues
NU
CLE
AR
FOSS
ILER
&T

37
Key Issues
7%$25 millionRealized~$100 million
11%BaseDeveloped$350-400 million
Contracted
BGS Margins
Augment Staff
Forced Outage-CoalO&M EfficiencyPlaybookCapEx
Market Prices
Diversification
Trading
10%$5 millionImplemented$150-$175 million
Realize Higher Market Prices
Contract Diversification
Increased Origination & Market Liquidity
FOSS
ILER
&T
NRC ResolvedOperational ExcellenceMean/Top Quartile89-92%~$100 million
Received NRC letterCNO Transition+$50 million 85%$150-200 million
NRC LetterOrganizationO&MCapacity FactorCapEx
NRC MonitoringOrganizational Stability+$50 million 91%$150-$175 million
NU
CLE
AR

38
NRC ResolvedOperational ExcellenceMean/Top Quartile89-92%~$100 million
Received NRC letterCNO Transition+$50 million 85%$150-200 million
NRC LetterOrganizationO&MCapacity FactorCapEx
NRC MonitoringOrganizational Stability+$50 million 91%$150-$175 millionN
UC
LEA
RKey Issues
7%$15 millionRealized$100 million
11%BaseDeveloped$350-400 million
Contracted
BGS Margins
Augment Staff
Forced Outage-CoalO&M EfficiencyPlaybookCapEx
Market Prices
Diversification
Trading
2004 2005 Long-Term
10%$5 millionImplemented$165 million
Realize Higher Market Prices
Contract Diversification
Increased Origination & Market Liquidity
Issues
FOSS
ILER
&T
Long-Term7%$25 millionRealized~$100 million
200411%BaseDeveloped$350-400 million
IssuesForced Outage-CoalO&M EfficiencyPlaybookCapEx
200510%$5 millionImplemented$150-$175 million
FOSS
IL

39
NRC MonitoringOrganizational Stability+$50 million 91%$150-$175 million
Key Issues
NRC ResolvedOperational ExcellenceMean/Top Quartile89-92%~$100 million
7%$25 millionRealized$100 million
Received NRC letterCNO Transition$50 million 85%$150-200 million
11%BaseDeveloped$350-400 million
Contracted
BGS Margins
Augment Staff
NRC LetterOrganizationO&MCapacity FactorCapEx
Forced Outage-CoalO&M EfficiencyPlaybookCapEx
Market Prices
Diversification
Trading
2004 2005 Long-Term
10%$5 millionImplemented$165 million
Realize Higher Market Prices
Contract Diversification
Increased Origination & Market Liquidity
Issues
NU
CLE
AR
FOSS
ILER
&T
2004
Contracted
BGS Margins
Augment Staff
Issues
Market Prices
Diversification
Trading
2005 & Long-TermRealize Higher Market Prices
Contract Diversification
Increased Origination & Market Liquidity
ER&
T

40
PSEG Power Business Objectives• Nuclear Operations
– Operate safely– Improve capacity factor– Upgrade assets– Operate at industry mean O&M levels
• Fossil Operations– Operate safely and predictably– Implement industry best practices– Reduce O&M
• ER&T Operations– Realize value of diverse electric and gas asset portfolio
PSEG Nuclear Strategic Direction
Chris Bakken President & Chief Nuclear Officer

42
PSEG Nuclear: Asset Profile
• Operated by PSEG Nuclear
• PSEG Ownership: 100%
• Technology:Boiling Water Reactor
• Total Capacity: 1,049 MW
• Owned Capacity: 1,049 MW
• License Expiration: 2026
• Operated by PSEG Nuclear
• PSEG Ownership: 57% Exelon other Co-Owner
• Technology: Pressurized Water Reactor
• Total Capacity: 2,275 MW
• Owned Capacity: 1,306 MW
• License Expiration: 2016 and 2020
• Operated by Exelon
• PSEG Ownership: 50%
• Technology:Boiling Water Reactor
• Total Capacity: 2,224 MW
• Owned Capacity: 1,112 MW
• License Expiration: 2033 and 2034
Hope Creek
Salem Units 1 and 2
Peach Bottom Units 2 and 3
43
• Operate safely
• Improve capacity factor
• Upgrade assets
• Operate at industry mean O&M levels
Key Objectives
44
Discussion Points
• Work Environment Progress
• Plant Operations
• O&M

45
Work Environment - Current Status
• NRC closed investigation
• Two cross-cutting issues– Problem Identification and Resolution– Safety Conscious Work Environment
• Issues being addressed
• NRC concurrence with approach
• Monitor progress going forward

46
MAY 05MAR 05FEB 05 APR 05JAN 05DEC 04NOV 04OCT 04SEP 04
HOPE CREEK OUTAGEHOPE CREEK OUTAGE
Work Environment - Next Steps
Public Meeting
with NRC
Public Meeting
with NRC
Post SCWE Metrics
SALEM OUTAGESALEM OUTAGE
Post SCWE Metrics
Post SCWE Metrics
SYNERGY SURVEYSYNERGY SURVEY
47
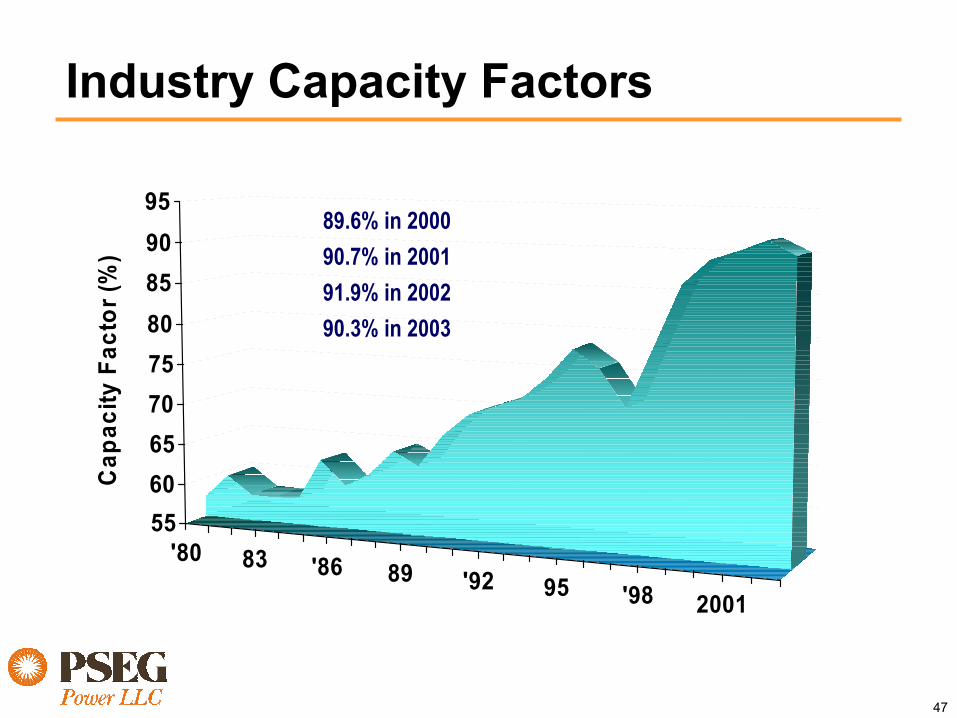
Industry Capacity Factors
'80 83 '86 89 '92 95 '98 2001
556065707580859095
Cap
acity
Fac
tor (
%)
89.6% in 200090.7% in 200191.9% in 200290.3% in 2003

48
75
80
85
90
95
100
Cap
acity
Fac
tor %
2000 2001 2002 2003 2004 2005 2006 2007
Industry PSEG Nuclear
PSEG Capacity Factor
49
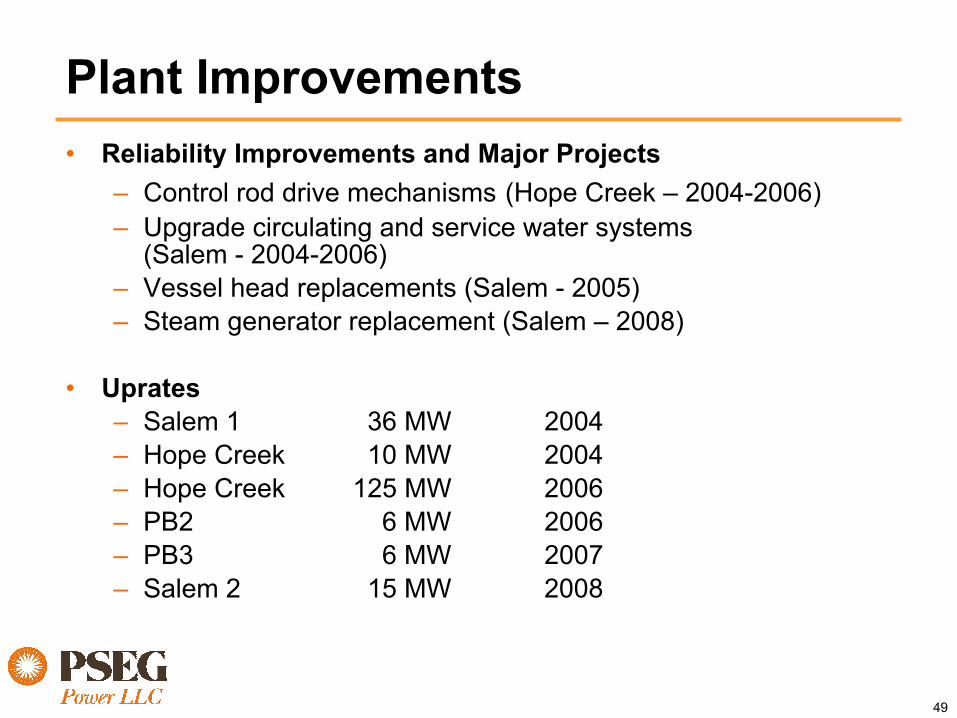
Plant Improvements• Reliability Improvements and Major Projects
– Control rod drive mechanisms (Hope Creek – 2004-2006)– Upgrade circulating and service water systems
(Salem - 2004-2006)– Vessel head replacements (Salem - 2005)– Steam generator replacement (Salem – 2008)
• Uprates– Salem 1 36 MW 2004– Hope Creek 10 MW 2004– Hope Creek 125 MW 2006– PB2 6 MW 2006– PB3 6 MW 2007– Salem 2 15 MW 2008

50
Capital Program
Expected 5-yr capital investment to be approximately $640 million
Capital Expenditures - PSEG Share
$0
$20
$40
$60
$80
$100
$120
$140
$160
$180
2005 2006 2007 2008 2009
Mill
ions
51
PSEG / Exelon Employee Exchange
• Leverage Exelon’s Strengths– Outage Management– Equipment Reliability
• Develop PSEG Employees
• Positions Exchanged– Outage Management– Engineering Management– Operations Management– Project Management– Business / Financial Management

52
Value of Increased Nuclear Output
• PSEG share of NJ output increases by nearly 3,000 GWhrs/yr by 2007 – an improvement of more than 10% over 2004
• At a $35 - $40 gross margin, the opportunity to Power is $100 - $120 million– $65 – $80 million from performance improvement– $35 – $40 million from uprates

53
Near-Term O&M Cost Drivers• Increased Outage Scope
– Control rod drive mechanism– Reliability improvements
• Upgrade of Facilities
• Supplemental Labor to Address Issues
• Security

54
Key TakeawaysNuclear has a strong plan for performance improvement, resulting
in considerable financial upside to Power
$45 M - $55 MO&M
Uprates
Unit Performance
$35 M - $40 M
$65 M - $80 M
Pretax margin opportunity $ 145 M - $175 M

PSEG Fossil Strategic Direction
Mike Thomson President

56
PSEG Fossil: Asset Profile
Variable Cost
Low
High
Coal
CCGT
Peaking (simple cycle & steam)
Demand On SystemLow High
2396 MW 5121 MW 4774 MW
46 Units in NJ/CT/PA Bergen (NJ) 1221 MWWaterford (OH) 821 MWLawrenceburg (IN) 1096 MWBEC (NY 2005) 763 MWLinden (NJ 2006) 1220 MWKeystone (PA) 388 MW
Conemaugh (PA) 382 MWHudson (NJ) 608 MWMercer (NJ) 648 MWBridgeport (CT) 370 MW
$25 - $45/mwh $40 - $60/mwh $60 + /mwh
57
Key Objectives
• Continue positive results in safety and environmental stewardship
• Consistently keep the breakers closed
• Capture O&M efficiencies
58
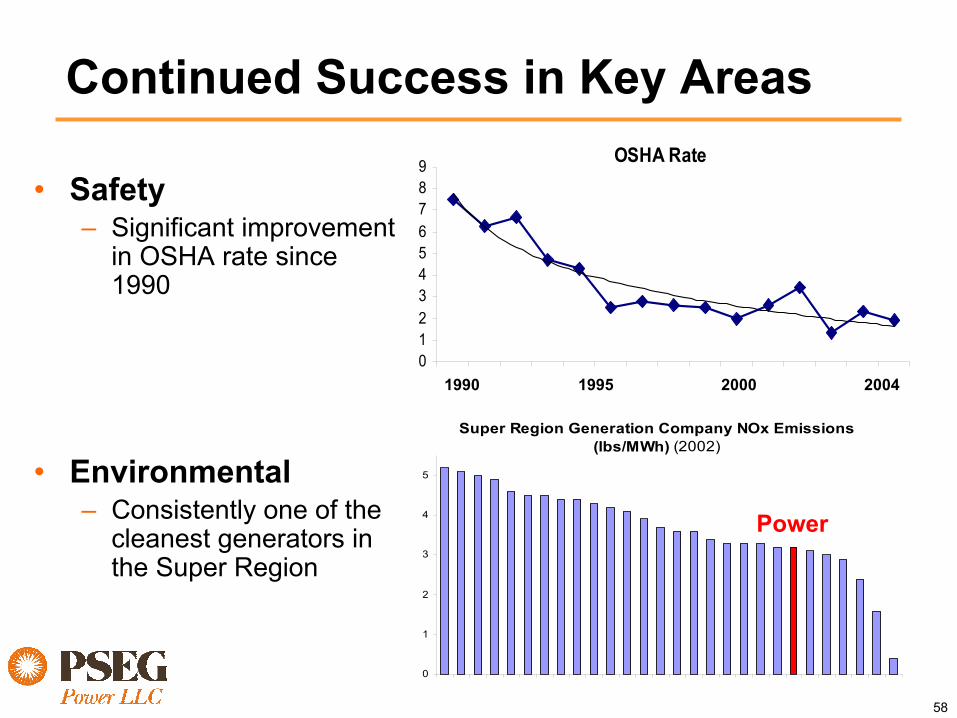
Continued Success in Key Areas
• Safety– Significant improvement
in OSHA rate since 1990
• Environmental– Consistently one of the
cleanest generators in the Super Region
Super Region Generation Company NOx Emissions (lbs/MWh) (2002)
0
1
2
3
4
5
Power
OSHA Rate
0123456789
1990 1995 20001990 1995 2000 2004

59
Revenue Enhancement Opportunity
Fossil Generation at Market Prices($ million)
• Fossil plays an integral part in Power’s profitability
• Opportunity exists to further enhance margin contribution to Power
• Points of attack:– Address existing issues– Rigorous preventative
maintenance program 050
100150200250300350400450500
2003A 2004F
MaintenancePlanning &ExecutionOperatingPerformance
Market BasedRevenues

60
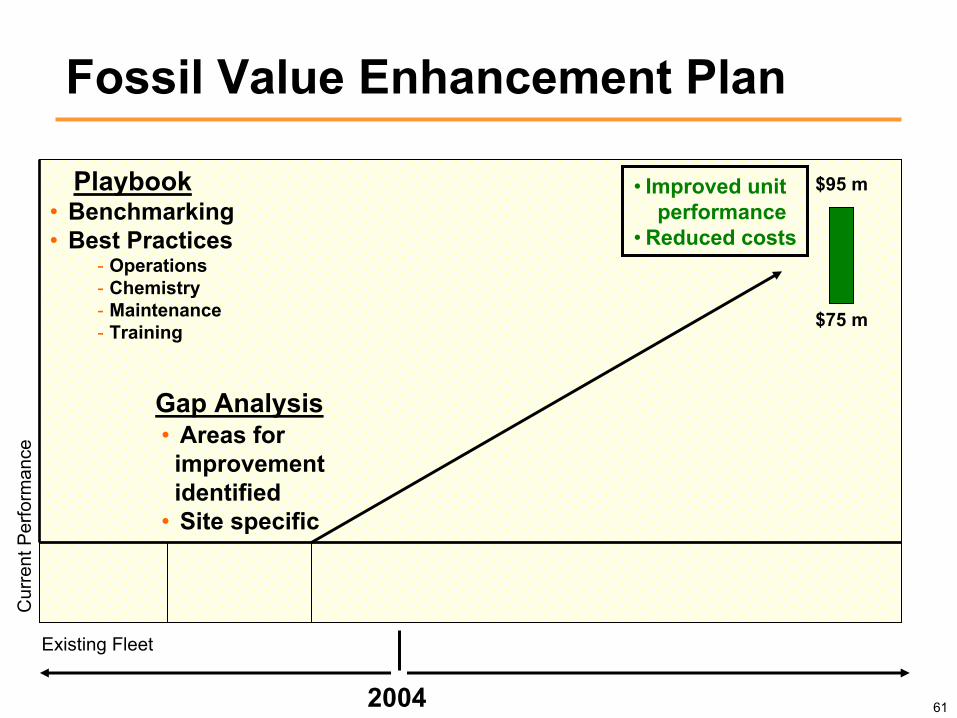
• Improved unit performance- $60-$70 million
• Capture O&M efficiencies inexecution of planned maintenance
- $15-$25 million
Fossil Value Enhancement Plan C
urre
nt P
erfo
rman
ce
$95 m
$75 m
2004
Existing Fleet
61
Playbook • Improved unitperformance
• Reduced costs• Benchmarking• Best Practices
- Operations- Chemistry- Maintenance- Training
Cur
rent
Per
form
ance
Gap Analysis• Areas forimprovement identified
• Site specific
$95 m
$75 m
Fossil Value Enhancement Plan
Existing Fleet
2004

62
Playbook Gap Analysis
• Establish the actionable priorities and responsibilities for Playbook implementation
• Actions target specific operating & productivity metrics
• Plant investment and operations tied to asset mission
• Integrated into performance management and compensation plans
36 Month Plan
Cur
rent
Per
form
ance
$95 m
$75 m
• Improved unitperformance
• Reduced costs
Fossil Value Enhancement Plan
Existing Fleet
2004
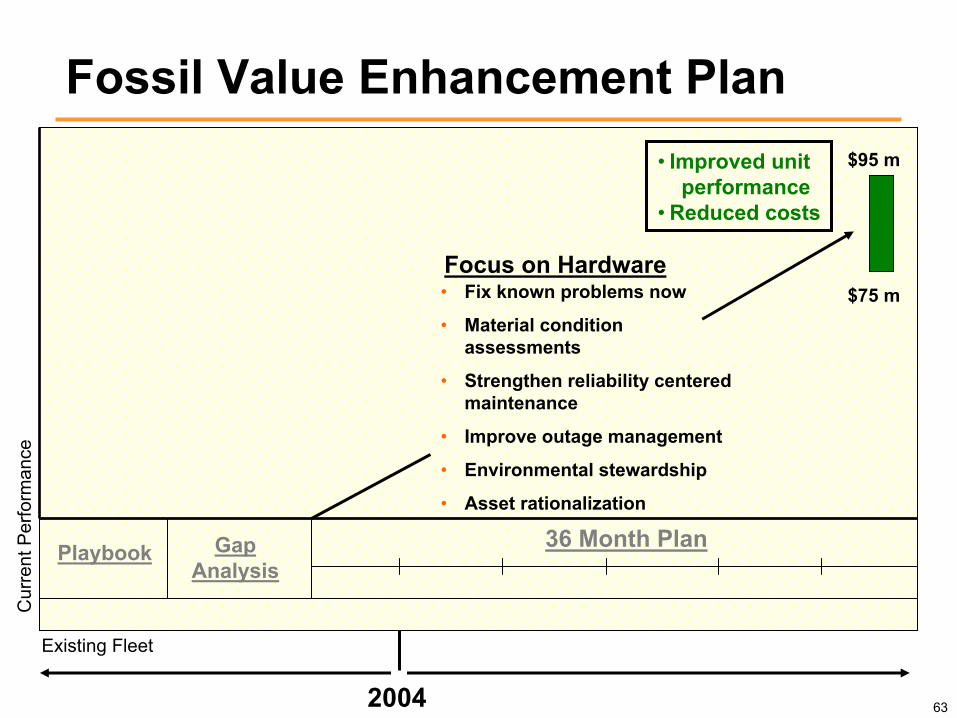
63
Playbook Gap Analysis
36 Month Plan
Cur
rent
Per
form
ance
Focus on Hardware• Fix known problems now
• Material condition assessments
• Strengthen reliability centered maintenance
• Improve outage management
• Environmental stewardship
• Asset rationalization
$95 m
$75 m
• Improved unitperformance
• Reduced costs
Fossil Value Enhancement Plan
Existing Fleet
2004
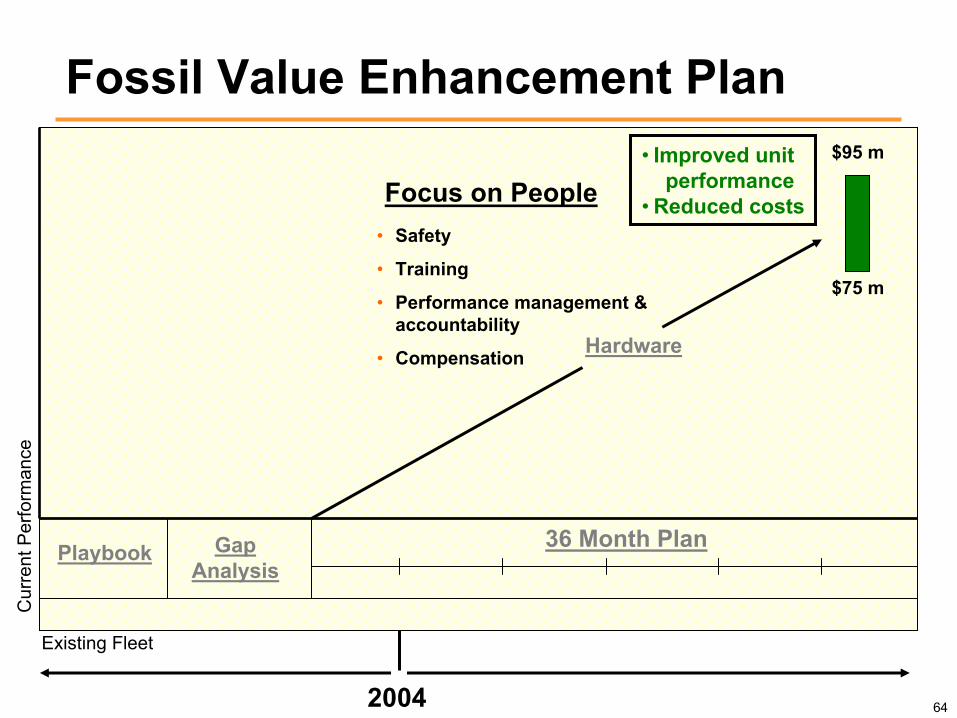
64
• Safety
• Training
• Performance management & accountability
• Compensation
Playbook Gap Analysis
36 Month Plan
Cur
rent
Per
form
ance
Hardware
$95 m
$75 m
Focus on People• Improved unit
performance• Reduced costs
Fossil Value Enhancement Plan
Existing Fleet
2004
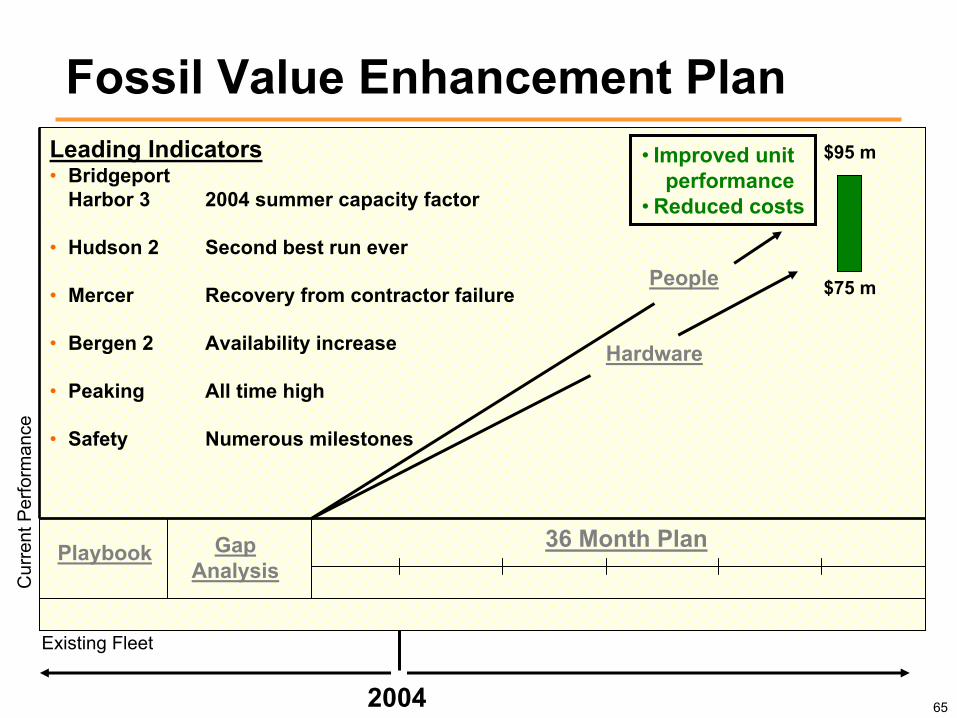
65
Playbook Gap Analysis
36 Month Plan
Cur
rent
Per
form
ance
Hardware
$95 m
$75 mPeople
Leading Indicators• Bridgeport
Harbor 3 2004 summer capacity factor
• Hudson 2 Second best run ever
• Mercer Recovery from contractor failure
• Bergen 2 Availability increase
• Peaking All time high
• Safety Numerous milestones
• Improved unitperformance
• Reduced costs
Fossil Value Enhancement Plan
Existing Fleet
2004

66
Playbook Gap Analysis
36 Month Plan
Cur
rent
Per
form
ance
Hardware
$95 m
$75 mPeople
Fossil Value Enhancement Plan
Existing Fleet
2004
• Improved unit performance- $60-$70 million
• Capture O&M efficiencies inexecution of planned maintenance
- $15-$25 million
PSEG ER&T Strategic Direction
Steve Teitelman President

68
Energy Resources & Trade (ER&T) Business Profile
ER&T
PortfolioManagement
FuelSupply
AssetBacked
WholesaleCommodity
Trading
RiskManagement
Market/BusinessDevelopment
Single point accountability for gross margin optimization

69
Portfolio Management – Operational Strategy
• Maximize cash in the short term relative to unit cost, availability, spot price, fuel price and import capability
• Portfolio provides opportunities to seek structured transactions that provide higher margins
• Understand and influence the development of fair market rules
• Same proven business model for 5 years

70
Portfolio Management - Net PositionPower’s objective is to contract over 75% of its planned
generation for the next 18-24 months
-
1,000
2,000
3,000
4,000
5,000
6,000
7,000
GW
h
Nuclear Baseload Coal Intermediate Coal CC
Steam / CT Contracted Load & Sales Contracted Load
2004 2005 2006 2007
Total Fleet Monthly RTC GWh Position

71
Portfolio Management – Fuel Strategy
• Maximize value relative to the spark spread
• Fuel switch to extract value
• Hedge coal, oil and gas relative to contracts and hedges
• Utilize wholesale gas system for balancing fuel consumption and option value
• Trade fuels (gas, coal and oil) in conjunction with the portfolio position
• Modify fuel inventory to maximize value
• Gas throughput
• Gas storage capacity
• Coal contracts
• Oil storage capacity
• Emissions credits
• Generation assets/contracts
• Gas contracts
• Transmission rights
Assets Strategy

72
Fuel Strategy - Coal
Domestic
South America
Indonesia
24% 6%
70%
Source of Supply
-
1
2
3
4
5
6
7
2005 2006 2007 2008Year
Milli
on T
ons
0%
10%
20%
30%
40%
50%
60%
70%
80%
90%
100%
Keystone Conemaugh Bridgeport HarborMercer Hudson Contracted
Continuity of Supply
73
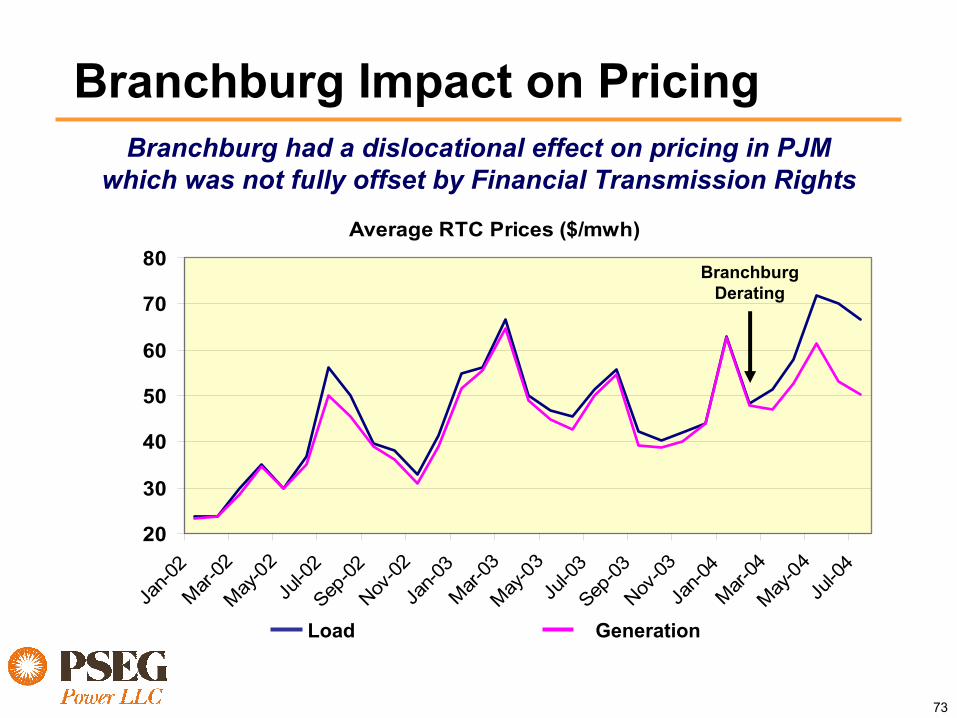
Branchburg Impact on Pricing
Average RTC Prices ($/mwh)
20
30
40
50
60
70
80
Jan-0
2Mar-
02May
-02
Jul-0
2Sep
-02Nov
-02Ja
n-03
Mar-03
May-0
3Ju
l-03
Sep-03
Nov-03
Jan-0
4Mar-
04May
-04
Jul-0
4
Branchburg had a dislocational effect on pricing in PJMwhich was not fully offset by Financial Transmission Rights
BranchburgDerating
Load Generation

74
ER&T Historical PerformanceER&T’s diverse portfolio has provided growth through varying market conditions,
with an increasing reliance on lower risk products
020406080
100120140160180200
1997 1998 1999 2000 2001 2002 2003 2004Est.
ER&T Margins ($ millions)
Asset Based Margins- Greater predictability
Trading -Reduced market making opportunities-Shift from fundamentalto financial players
Reduced market exposure at ER&T is aligned with shifting market conditions
75
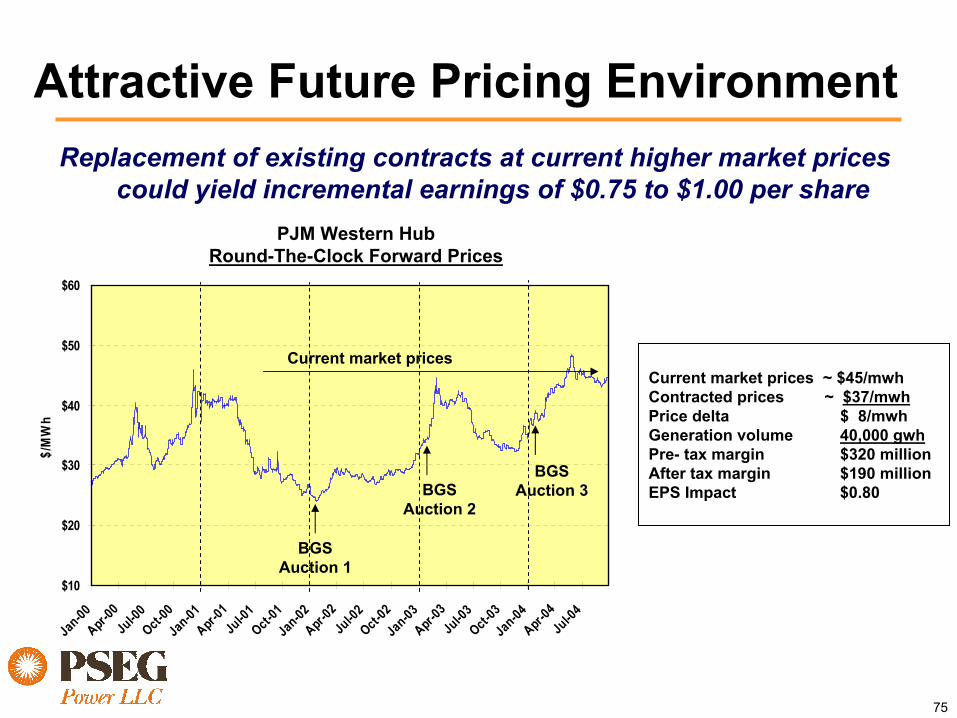
Attractive Future Pricing EnvironmentReplacement of existing contracts at current higher market prices
could yield incremental earnings of $0.75 to $1.00 per share
Current market prices ~ $45/mwhContracted prices ~ $37/mwhPrice delta $ 8/mwhGeneration volume 40,000 gwhPre- tax margin $320 millionAfter tax margin $190 millionEPS Impact $0.80
PJM Western HubRound-The-Clock Forward Prices
$10
$20
$30
$40
$50
$60
Jan-00
Apr-00
Jul-00
Oct-00
Jan-01
Apr-01
Jul-0
1Oct-
01Ja
n-02Apr-
02Ju
l-02
Oct-02
Jan-03
Apr-03
Jul-03
Oct-03
Jan-04
Apr-04
Jul-0
4
$/M
Wh
BGS Auction 1
BGS Auction 2
BGS Auction 3
Current market prices

Summary and 2005 Outlook
Frank Cassidy
77
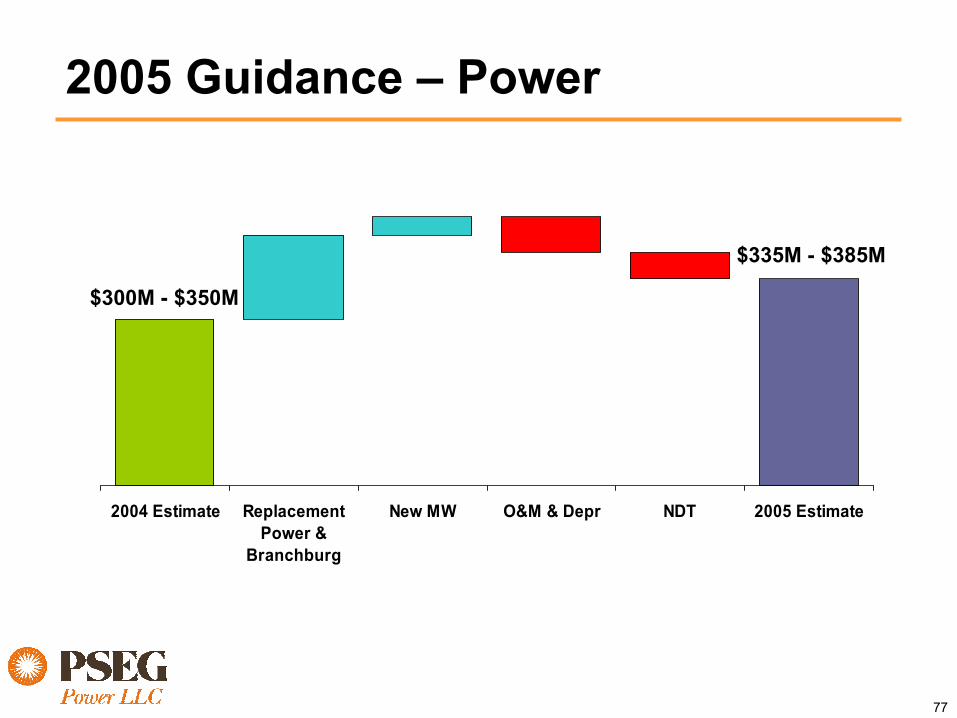
2005 Guidance – Power
2004 Estimate ReplacementPower &
Branchburg
New MW O&M & Depr NDT 2005 Estimate
$300M - $350M
$335M - $385M

78
2005 Assumptions
• Natural gas prices $6.30/mmbtu
• RTC Energy (PJM West) $45/mwh
• East/West differential $2.30/mwh
• Capacity Prices $10/kw-yr
• Nuclear Capacity Factors 91%

79
Sensitivity of 2005 Assumptions
• Natural gas prices +/- $1/mmbtu $.01• RTC energy (PJM West) +/- $5/mwh $.08• Capacity prices +/- $5/kw-yr $.04• East/West differential +/- $2/mwh $.03• Nuclear capacity factors +/- 1% fleet $.03• 2005 BGS auction prices +/- $1/mwh $.01• Coal prices +/- $10/ton $.02
80
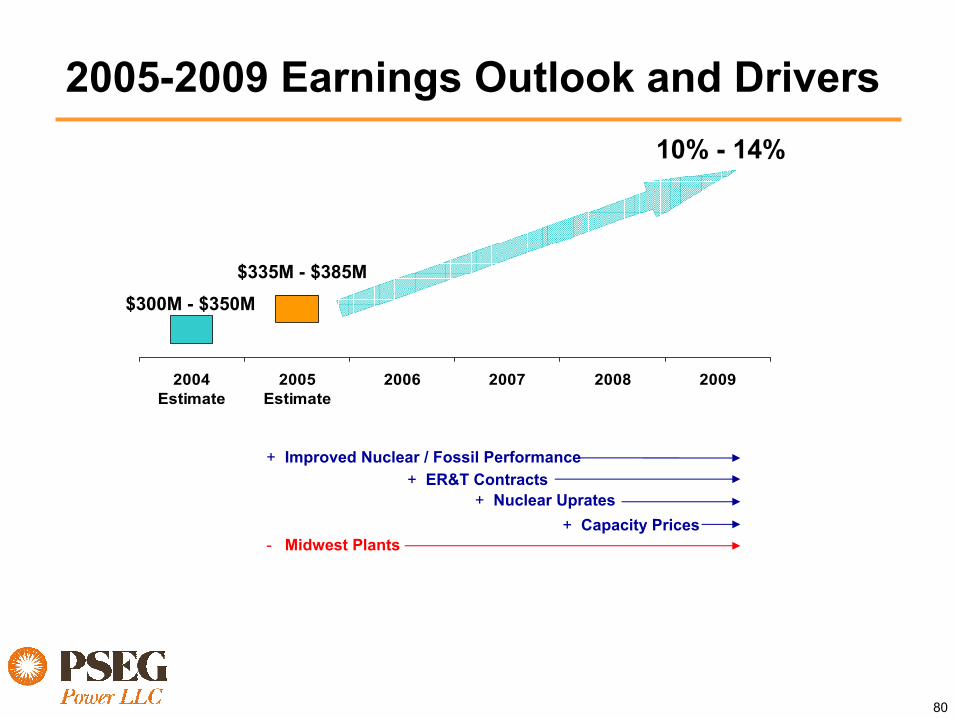
2004Estimate
2005Estimate
2006 2007 2008 2009
10% - 14%
$300M - $350M
+ Capacity Prices
+ Improved Nuclear / Fossil Performance
+ Nuclear Uprates+ ER&T Contracts
- Midwest Plants
$335M - $385M
2005-2009 Earnings Outlook and Drivers

81
Key Takeaways• Power’s forecast has considerable upside• Nuclear
– Enhanced capacity factor $65 - $80M– O&M $50M– Uprates $35 - $40M
• Fossil– Unit performance $60 - $70M– O&M $15 - $25M
• ER&T– Contract repricing at current prices $320M