Embed Size (px)
Citation preview

POVERTY REDUCTION STRATEGY PAPER
ON
NORTH WESTERN FRONTIER PROVINCE OF PAKISTAN
PLANNING AND DEVELOPMENT DEPARTMENT
GOVERNMENT OF N.W.F.P.
April 2003

ACRONYMS AND ABBREVIATIONS
ADB Asian Development Bank
AIT Agriculture Income Tax
AWB Area Water Boards
CBO Community Based Organization
CCO Citizen Community Organization
CRPRID Centre for Research on Poverty Reduction and Income Distribution
CWD Communications and Works Department
DAC Departmental Account Committee
DAO District Accounting Officer
DCO District Coordination Officer
DFID Department for International Development
EIROP Essential Institutional Reform Operationalization Project
EMIS Education Management Information System
EOBI Employees Old-age Benefits Institution
FBS Federal Bureau of Statistics
FMC Fiscal Monitoring Committee
GAVI Global Alliance for Vaccination Initiative
GTZ German Development Corporation
HMIS Health Management Information Survey
HR Human Resource
IM&R Instructional Materials and Minor Repair
IPRSP Interim Poverty Reduction Strategy Paper
LHW Lady Health Worker
M&E Monitoring and Evaluation
MICS Multiple Indicators Cluster Survey
MTBF Medium Term Budget Framework
NAB National Accountability Bureau
NGO Non –governmental Organization
NWFP North West Frontier Province
O&M Operation & Maintenance
P&D Planning and Development
PAC Public Accounts Committee
PFAA Provincial Financial Accountability Assessment
PIHS Pakistan Integrated Household Survey
PRP Poverty Reduction Plan
PRSP Poverty Reduction Strategy Paper
PSC Public Service Commission
PTA Parent-teacher Associations
SBP State Bank of Pakistan
SDC Swiss Development Corporation
SME Small and Medium Enterprise
SPDC Social Policy Development Center
SWOT Strengths, Weaknesses, Opportunities and Threats
UNDP United Nations Development Program
WAPDA Water and Power Development Authority

TABLE OF CONTENTS
Executive Summary i
Chapter 1 Introduction 1
Chapter 2 Poverty in NWFP 3
Chapter 3 PRSP Dialogue – The Consultative Process 11
Chapter 4 The Poverty Reduction Strategy 14
Chapter 5 The Medium term Budgetary Framework 40
Chapter 6 Monitoring and Evaluation 44
Annex 1 Poverty in NWFP 47
Annex ll: Gender 60
Annex lll Policy Matrix NWFP Structural Adjustment 64
Annex lV: Pakistan’s IPRSP Summary 72
Annex V Decentralization in Pakistan 80

ACKNOWLEDGEMENTS
This document reflects an extensive process of consultations and builds on the ongoing
Poverty Reduction Plan of the Government of the NWFP.
Thanks are due to the Nazims and elected Governments as well as the District
Coordination Officers and staff of all the districts of the NWFP for their input into this
strategy. Thanks are also due to the Secretaries and staff of all the line departments of the
Provincial government for their input.
This strategy reflects the hard work of the Planning and Development Department of the
Government of the NWFP who worked zealously to put it together in a very short time.
The financial assistance and technical support of UNICEF and especially its local office
in Peshawar is also gratefully acknowledged

i
EXECUTIVE SUMMARY
NWFP is by far the poorest province of Pakistan, with an overall incidence of poverty
substantially higher than that for the country as a whole (poverty headcount in 1998-99
for NWFP is 43% as compared to 33% for Pakistan). Both urban and rural poverty in
NWFP are higher than that for the entire country (poverty headcounts for urban and rural
NWFP are 31% and 47% respectively, compared to 24% and 36% respectively for all of
Pakistan). Moreover, the depth of both urban and rural poverty, measured by the poverty
gap is relatively higher for NWFP than for the rest of the country. Consistent with the
poverty estimates, the average per-capita consumption expenditures are also lower for
NWFP vis-à-vis the rest of the country.
Poverty in NWFP has changed significantly over the decade. The trends are very mixed
depending on the choice of the base year for comparison. If 1990-91 is compared to
1998-99, then urban poverty in NWFP appears to have declined substantially (by close to
6 percentage points)—even more than the decline in national urban poverty. Meanwhile,
the rural poverty in NWFP seems to have increased by more than 4 percentage points
over the same period. However, it is also important to note that notwithstanding the
decline in urban poverty in NWFP during this period the urban areas in this province still
remain the poorest in the country by a large margin. And even more alarming is the fact
that if there is a comparison between 1993 and 1999 then the available evidence indicates
a dramatic and consistent worsening of poverty in NWFP in both the rural and urban
sectors
Several characteristics of poverty in NWFP based on the available research are listed
below:
• NWFP faces difficult challenges due to its geography, history and location
• NWFP is the poorest Province of Pakistan
• NWFP has poor social indicators and highest gender disparity
• Gender gaps are significant for all socio-economic indicators in NWFP
• Gender gaps tend to be wider in rural areas than in urban areas of NWFP.
• Gender gaps in NWFP are found to be larger than for the country as a whole
• Land ownership in rural NWFP is less concentrated than for the rest of the country,
and there is prevalence of small landholdings, low agriculture productivity and high
rural poverty
A large proportion of the paid employees in the urban sector of NWFP are engaged as
wage labor in the informal sector, which is a significant employer in urban areas. The
poor have relatively low access to safe drinking water and sanitation facilities.
Availability of safe drinking water and sanitation facilities is characterized by large rural-
urban gaps in NWFP. In terms of access to safe water and drainage in NWFP both urban
and rural sectors alike fare significantly worse than the country as a whole

ii
•NWFP has a limited resource base
•Province’s own revenues are low and its fiscal position has deteriorated during 1990
•Province’s financial management has remained weak
Much of province’s economic potential is still unexploited – while this is at present a
major weakness it also offers a major opportunity in the future.
In addition to using the individual characteristics of poverty geographic targeting also
provides an effective method for improving the efficiency of resource use for poverty
reduction. This paper uses levels of deprivation to rank districts. The deprivation indices
presented here are based on the recently released Government of the NWFP Multi
Indicator Cluster Survey 2001 data set. These data were especially collected with support
from UNICEF to provide district-level indicators and benchmarks for poverty reduction.
The overarching objective of the Poverty Reduction Strategy for the NWFP is poverty
reduction through efforts to restore good governance and the respect for the rule of law,
enhance the effectiveness of public expenditure especially in the key social sectors and
re-establish the integrity of state institutions and their accountability to the public. Of
course, no poverty reduction strategy can be complete without efforts to promote pro-
poor growth. The PRSP for the NWFP, therefore, has the following five main pillars with
strengthening governance to improve public service delivery as the central cross cutting
theme:
1. Governance reforms to achieve an efficient, accountable, and service oriented
civil service;
2. Reforms to improve service delivery in key sectors (especially basic social
services); Fiscal and financial management reforms to improve governance in
budget and financial management,
3. A medium term budget framework (MTBF), enhance effectiveness and
accountability of expenditures, and strengthen resource mobilization;
4. Promote sustainable private sector development to accelerate economic growth.
5. Addressing vulnerability to shocks
Given the larger gender disparities in the NWFP mainstreaming gender is an essential
element of all strategic interventions proposed here. It is not only important from a rights
based perspective but is also the most optimal poverty reduction strategy given the ease
with which more than fifty percent of the poor can be targeted.
This strategy is based on an extensive consultative process that was initiated in December
2002. These consultations covered the entire Province and involved stakeholders
meetings at the grass roots level for the identification of the perceived strengths,
weaknesses, opportunities and threat in each district and sector, as well as the
recommendations to ensure opportunity, security and empowerment so necessary for
effective poverty reduction. Based on this consultative process, it has become quite clear

iii
that for the five pronged strategy to be successful the following basic measures must
adopted:
• Training and support to enable the local Governments to think along modern lines
in order to enable them to function as sustainable entities with proactive planning
for the development and promotion of all available resources at the district level
• Specific training for the local Governments to enable them to prepare business
plans and advertise the business and tourism possibilities in their districts along
modern lines.
• Strengthening of the office of the District Planning Officer with equipment and
training to act as a Business Development and Support Units for all the citizens of
the districts. This office would be charged with providing essential links to the on-
going national level support initiatives such as SMEDA, Qaumi Zarat Bank,
Khushali Bank and other initiatives that can be tapped to develop the small and
medium industries and the agriculture sector. These offices should act as conduits
for business promotion in the districts and for attracting investment and finding
markets to assist the local inhabitants. Over time these offices will be in a position
to charge a fee for such services.
• Initiating district level studies to assess how best to develop and promote the
comparative advantage of the Province, in particular horticulture and vegetable
farming; processing and marketing of foods, development of timber and non-timber
forest products; and the exploitation and development of minerals and gem stones
on modern business lines;
• Setting up Poverty Reduction Associations of concerned well to do citizens with
logistical support from the District Governments to evolve and implement schemes
to improve the opportunity, security and empowerment of the vulnerable at the
grassroots level. These associations should also be charged with ensuring that all
such schemes are environmentally sustainable and biodiversity conserving and
provide adequate opportunities to the vulnerable especially women. In addition
these associations can serve as the focal mechanism for the supervision and
distribution of basic food items at cost price to the poor and vulnerable as well as
the provision of basic cooked food (dal and roti at designated tanoors) to the
destitute in each locality through informal collections from philanthropists in and
around the area.
The detailed Medium Term Budgetary framework presented here was agreed upon by the
Government of the NWFP in line with the initiatives proposed under the four pillars of
the original Poverty Reduction Plan in 2001. The Monitoring and Evaluation Framework
with the clear designation of responsibilities and next steps was also agreed upon at that
time.
Risks to the success of the overall strategy for NWFP include backsliding on the key
fiscal and financial steps committed to by the Government of NWFP in 2001 as part of
the conditionality for the World Bank structural adjustment credit. Additional risks come
from the lack of smooth functioning of the devolved local government; the lack of
effective consensus building amongst the district level government and elected officials

iv
to ensure ownership of the poverty reduction strategy; and lack of momentum in the
overall national PRSP efforts.

1
CHAPTER 1. INTRODUCTION
This Poverty Reduction Strategy Paper (PRSP) for the North West Frontier Province
reinforces the poverty reduction strategy for Pakistan. Within the overall parameters of
the national PRSP the strategy for the NWFP integrates the existing Provincial Poverty
Reduction Plan (PRP) and the Medium Term Budgetary Framework into a three-year
strategy. The PRP for the NWFP was built on four pillars that more or less overlapped
the national Interim Poverty Reduction Strategy Paper (I-PRSP). The NWFP PRP
however, did not suggest any interventions for addressing aspects of vulnerability to
shocks. In this important dimension the PRSP for the NWFP takes the strategic
interventions that are part of the national IPRSP as given and incorporates a
recommendation for strengthening the informal system of philanthropy.
The unexploited strength of the NWFP economy lies, amongst other sources, in its
tremendous potential in its minerals, value-added agriculture, timber and non-timber
products, hydel resources and potential for tourism development. This PRSP recognizes
that accelerating economic growth and generating employment for the poor is key to
poverty reduction. In this the private sector has to be the engine of growth. Such growth
should be based in the rural sector where the majority of the poor reside and where the
highest employment multipliers are evidenced.
The NWFP like the country as a whole is faced with the twin challenges of reviving
growth and reducing poverty. There is realization that restoring economic growth and
improving access to basic needs, such as primary education, preventive health care, and
population welfare services, is essential for winning the fight against poverty. The
complex and multidimensional nature of poverty thus warrants a poverty reduction
strategy that ensures rapid pro-poor economic growth through sound macroeconomic
reforms, improved access to social services, broad based governance reforms, and
targeted interventions Pakistan’s interim poverty reduction strategy I-PRSP put in place
in November 2001 takes into account the economic, social, and governance dimensions.
Like the national strategy this provincial strategy also emphasizes policies for economic
and social development but also seeks greater involvement of the poor in the formulation
of these policies and management of their affairs. The strategy aims at forging broad-
based alliances with civil society and the private sector in the quest for eliminating
poverty and accelerating growth
The strategy is based on an extensive consultative process initiated in December 2002
that covered the entire Province and involved stakeholders meetings at the grass roots
level for the identification of the strengths, weaknesses, opportunities and threat in each
district and sector as well as the interventions to ensure opportunity, security and
empowerment so necessary for effective poverty reduction.
This consultative process is essential for ensuring ownership and hence sustainability of
any strategy. The strategic recommendations presented in this paper are backed by a well-

2
defined Medium term budgetary framework. This framework enables expenditures to be
directed to the key areas and then tracked over the period of implementation.
Additionally The paper also presents a Monitoring and Evaluation strategy which is
critical to the success of the poverty reduction strategy.
Pakistan’s I-PRSP is backed with a strong program of monitoring as well as capacity
development, including that for gathering and analyzing information for impact
assessment. The I-PRSP outlines new institutional mechanisms that will be employed for
the regular/periodic monitoring and evaluation of poverty reduction expenditures and
corresponding outcome indicators at the federal, provincial, and district levels. These
institutional arrangements are presently evolving and will be finalized in consultations
with provincial governments. Key outcome indictors have also been suggested. The final
benchmarks and targets will be set after consultations with national and provincial
statistical agencies, federal line departments, and provincial governments.
The PRSP for the NWFP draws on these aspects of Monitoring and Evaluation. Its
eventual success will rest in the continuation of the reforms committed to under the
structural adjustment program by the Government of NWFP and on the ownership that
can be built through an ongoing process of consultations. It is imperative, therefore, that
the political consensus to the reform package underlying this strategy be obtained as
quickly as possible and the process of consultations at the grass roots level be concluded
as quickly as possible. The NWFP is the first Province to put together a draft PRSP.
The medium term prospects for economic growth for the economy of the NWFP as the
frontline province have been uncertain since September 11, 2001. This uncertainty has
serious implications for the stability of NWFP’s macroeconomic and planning framework
and can significantly undermine the reform efforts outlined in this PRSP. The strategy
presented here therefore is based on the assumption of ceterus paribus i.e. other things
remaining the same.
This strategy paper is divided into six chapters. The Poverty Profile for NWFP is
summarily described in the second Chapter. Details are presented in the Annexure. The
process of dialogue is presented in Chapter three. The strategic plan forms the fourth
chapter. The medium term budgetary framework is described in the fifth chapter.
Monitoring and Evaluation processes are described in the sixth chapter.

3
CHAPTER 2. POVERTY IN NWFP
Poverty in NWFP should be understood in the broader context of poverty in Pakistan.1 In
addition, understanding issues specific to poverty in the province also requires examining
the concentration of poverty across areas within NWFP. Such an understanding can help
to inform policymakers by identifying priority needs and target groups for intervention.
Detailed analysis of the poverty situation in NWFP is presented in Annex I. A summary
is presented here to give context to the strategy presented in later chapters. The NWFP is
the poorest Province of Pakistan.
Table 2.1: Poverty Trends by Province
Province FY93 FY94 FY97 FY99
Urban Areas 20.7 16.3 16.1 22.4
Punjab 22.0 18.1 1.16.9 25.5
Sindh 17.3 11.8 12.0 16.1
NWFP 25.3 26.9 27.2 29.2
Balochistan 31.8 16.8 23.0 24.3
Rural Areas 28.9 34.7 30.7 36.3
Punjab 26.5 33.9 28.3 36.0
Sindh 29.5 31.8 19.6 34.7
NWFP 37.0 40.0 43.4 44.9
Balochistan 28.1 37.9 42.5 22.5
Overall 26.6 29.3 26.3 32.2
Punjab 25.2 29.5 25.0 33.0
Sindh 24.1 22.6 15.7 26.6
NWFP 35.5 38.1 41.2 42.6
Balochistan 28.6 35.5 38.4 22.8
Source: ADB (2002). Poverty in Pakistan: Issues, Causes and Institutional Responses
The overall picture of consumption /income poverty in NWFP corresponds closely with
that of Pakistan as a whole—higher concentration of the poor in rural areas, lower
average consumption levels in rural areas, and relatively higher inequality in urban areas.
Moreover, as Table 2.1 shows that the 15 percentage point rural-urban gap in headcount
rates for NWFP in 1998-99 is higher than that for the whole of Pakistan and second only
to Sindh among all provinces. The high rural-urban gap has all the more significance for
overall poverty in NWFP - since the province is much more rural than the country as a
1 The source for all data, unless otherwise specified, is the Pakistan Integrated Household Survey (1998/99). More
recent data for the PIHS 2000-1 are not used because of the as yet unresolved controversy associated with the
educational enrollment and other numbers based on this data set. The data from the NWFP MICS are also not used.
These data require further analysis for validation.

4
whole. Around 85% of the NWFP population lives in the rural areas as compared to
about 72% of the country’s population. Meanwhile, the rural areas of NWFP account for
around 90% of the total number of poor people in the province. NWFP is by far the
poorest province of Pakistan, with an overall incidence of poverty substantially higher
than that for the country as a whole (poverty headcount for NWFP is 44%, compared to
33% for Pakistan). As shown in Table 1, both urban and rural poverty in NWFP are
higher than that for the entire country (poverty headcounts for urban and rural NWFP are
31% and 47% respectively, compared to 24% and 36% respectively for all of Pakistan).
Moreover, depth of both urban and rural poverty, measured by poverty gap is relatively
higher for NWFP than for the rest of the country. Consistent with the poverty estimates,
the average per-capita consumption expenditures are also lower for NWFP vis-à-vis the
rest of the country.
High Rural Poverty
The overall picture of consumption /income poverty in NWFP corresponds closely with
that of Pakistan as a whole—higher concentration of the poor in rural areas; lower
average consumption levels in rural areas; and, relatively higher inequality in urban areas
There is a 15 percentage point rural-urban gap in headcount rates estimated for NWFP in
1998-99. This is higher than that for the whole of Pakistan and second only to the Sindh
province. The high rural-urban gap has all the more significance for overall poverty in
NWFP - since the province is much more rural than the country as a whole. Around 85%
of the NWFP population lives in the rural areas as compared to about 72% of the
country’s population. Moreover, the rural areas of NWFP account for around 90% of the
total number of poor people in the province.
NWFP Poorest Province of Pakistan
NWFP is by far the poorest province of Pakistan, with an overall incidence of poverty
substantially higher than that for the country as a whole (poverty headcount in 1998-99
for NWFP is 43% as compared to 33% for Pakistan). Both urban and rural poverty in
NWFP are higher than that for the entire country (poverty headcounts for urban and rural
NWFP are 31% and 47% respectively, compared to 24% and 36% respectively for all of
Pakistan). Moreover, the depth of both urban and rural poverty, measured by the poverty
gap is relatively higher for NWFP than for the rest of the country. Consistent with the
poverty estimates, the average per-capita consumption expenditures are also lower for
NWFP vis-à-vis the rest of the country.
Inequality in NWFP, as measured by the gini coefficient for per equivalent adult
consumption, is very similar to that for the country, in both the rural and urban areas.
Note that overall gini for NWFP is slightly lower than that for the country, while the
urban and rural ginis are identical. This apparent paradox is caused simply by the fact that
NWFP is significantly more rural (in terms of share of population) than the country as a
whole, which means that the rural gini has a larger weighted in the average gini for
NWFP than for Pakistan.

5
Poverty Trends in NWFP
Poverty in NWFP has changed over the decade. The trends are very mixed. In comparing
1990-91 to 1998-99, urban poverty in NWFP appears to have declined substantially (by
close to 6 percentage points)—even more than the decline in national urban poverty.
Meanwhile, the incidence of poverty in rural NWFP seems to have increased by more
than 4 percentage points over the same period; although the rural poverty headcount for
the country actually fell slightly over the same period. Poverty reduction in NWFP when
comparing the estimates for 1990-1 with those for 1998-99 appears to have occurred only
in urban areas while rural areas have become poorer on the average. However, it is also
important to note that notwithstanding the decline in urban poverty in NWFP during this
period the urban areas in this province still remain the poorest in the country by a large
margin. And even more alarming is the fact that if there is a comparison between 1993
and 1999 then the available evidence indicates a dramatic and consistent worsening of
poverty in NWFP in both the rural and urban sectors. [Figure 2.1].
Figure 2.1: The Continuously Deteriorating NWFP Poverty Situation 1993 to 1999
Characteristics of Poverty
Several Characteristics of poverty in NWFP based on the available research are listed
below:
• NWFP faces difficult challenges due to its geography, history and location
• NWFP is the poorest Province of Pakistan
• NWFP has poor social indicators and highest gender disparity
• Gender gaps are significant for all socio-economic indicators in NWFP
• Gender gaps tend to be wider in rural areas than in urban areas of NWFP.
• Gender gaps in NWFP are found to be larger than for the country as a whole
26.629.3
26.3
32.2
35.538.1
41.242.6
0.0
5.0
10.0
15.0
20.0
25.0
30.0
35.0
40.0
45.0
FY93 FY94 FY97 FY99
Pakistan NWFP

6
• Land ownership in rural NWFP is less concentrated than for the rest of the country,
and there is prevalence of small landholdings, low agriculture productivity and high
rural poverty
• A large proportion of the paid employees in the urban sector of NWFP are engaged as
wage labor in the informal sector, which is a significant employer in urban areas.
• The poor have relatively low access to safe drinking water and sanitation facilities
• Availability of safe drinking water and sanitation facilities is characterized by large
rural-urban gaps in NWFP.
• In terms of access to safe water and drainage in NWFP both urban and rural sectors
alike fare significantly worse than the country as a whole
• NWFP has a limited resource base
• Province’s own revenues are low and its fiscal position has deteriorated during 1990s
• Province’s financial management has remained weak
• Much of province’s economic potential is still unexploited – while this is at present a
major weakness it also offers a major opportunity in the future.
Correlates of Poverty
Several correlates of household characteristics and income poverty can be established
from the available research for the NWFP:
• The poor are more likely to live in larger households
• Poverty is associated with lack of asset ownership. The average size of agricultural
land owned by poor households is 0.25 hectares in rural NWFP, compared to 0.71
hectares for the non-poor
• Rural poverty headcount falls as the size of land holdings increases
• Small and marginal landholders are almost equally poor as those who own no land,
• Poverty among large landowners is significantly lower
• Poverty, is strongly associated with lack of human capital, measured by the
education and literacy status of the head of the household
• In urban NWFP, employment of the household head does not show clear patterns
with poverty status, partly due to the lack of detailed employment data.
• However, a much larger proportion of households in the bottom quintile of
expenditure have the head of the household working as paid employees, as
compared to the urban population as a whole.
• In rural NWFP, the poor households are relatively more likely to be headed by
individuals working as a paid employee
These correlations along with the characteristics of poverty listed above provide the
indicative framework for the effective targeting of scarce resources within the poverty
reduction strategy for NWFP.

7
The Multiple Indicator Cluster Survey
Geographic targeting provides a method for improving the efficiency of resource use for
poverty reduction. Resources can be assigned on the basis of district ranking. In order to
collect information on key social and economic indicators at district level, the
government of NWFP, through the Planning and Development Department (P&DD) and
support from UNICEF conducted a household survey (Multiple Indicators Cluster Survey
MICS) from September to December 2001. A total of 13,076 households drawn from 873
primary sampling units of which 223 were urban and 650 rural were interviewed. This
survey is the first attempt to get district-level representative estimates in the NWFP. This
survey collected data on wide range of indicators concerning children and women.
Indicators comprise income, infant and under-five child mortality, under nutrition,
education, adult literacy, water and sanitation, ante-natal and birth care, birth registration,
feeding patterns, young child recent illness and cost of treatment, and use of
contraceptives and awareness of HIV/AIDS. The aims of this survey were:
• To establishes a credible baseline for monitoring socioeconomic status of districts at
the start of the new decade and devolution process
• To develop ranking of districts to highlight the inter-district disparities in social and
economic indicators so as to be able to address these through appropriate district
level social sector planning efforts by the provincial government.
• To provide information on the situation of children and women, as well as child-
focused benchmarking for measuring progress in post devolution era and for
reporting on the World Summit Goals for Children.
• Rectify data gaps in information systems from national surveys and sectoral
databases; and address gender disparities and lack of uniformity in resource
distribution among districts.
• Building capacity of relevant government institutions, especially the provincial
Bureau of Statistics, through their active involvement in all the phases of the
survey.
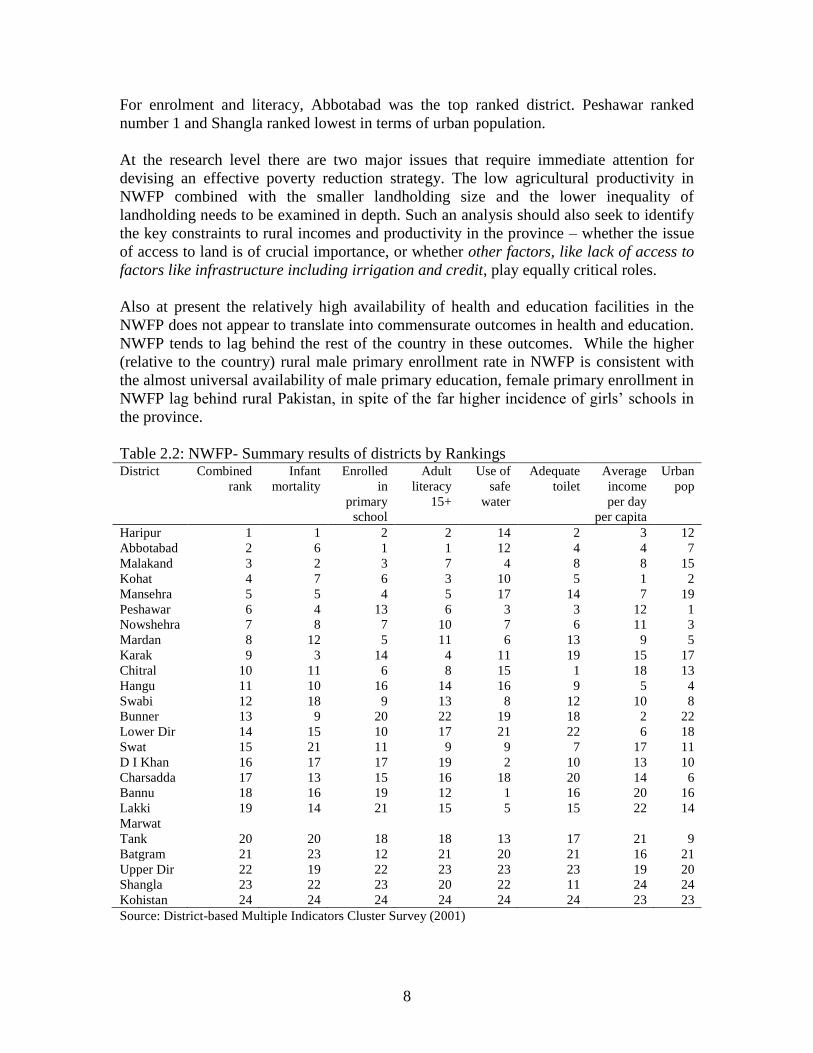
Based on the data of this survey, Table 2.2 below presents ranking of districts based on
six key indicators: infant mortality, primary school enrolment, adult literacy, water and
sanitation and income per day per capita. The results from MICS show that there is
considerable variation within the province in terms of poverty and social indicators.
Districts of Kohistan, Upper Dir, Bunner, Batagram, Shanga and Tank are among the
poorest six districts in NWFP, and ranking extremely low in terms of social indicators.
The composite rank is the weighted sum of all ranks for these six indicators. The
composite rank indicates that Haripur is the least deprived district while Kohistan is the
most deprived district of NWFP. Looking at other indicators, this table shows that
Kohistan ranked lowest for 5 out of the six indicators. Haripur remained on top for infant
mortality while for safe water it ranked 14. Bannu was observed to be number 1 for the
use of safe water. However, for all the othert indicators it is amongst the most deprived.
8
For enrolment and literacy, Abbotabad was the top ranked district. Peshawar ranked
number 1 and Shangla ranked lowest in terms of urban population.
At the research level there are two major issues that require immediate attention for
devising an effective poverty reduction strategy. The low agricultural productivity in
NWFP combined with the smaller landholding size and the lower inequality of
landholding needs to be examined in depth. Such an analysis should also seek to identify
the key constraints to rural incomes and productivity in the province – whether the issue
of access to land is of crucial importance, or whether other factors, like lack of access to
factors like infrastructure including irrigation and credit, play equally critical roles.
Also at present the relatively high availability of health and education facilities in the
NWFP does not appear to translate into commensurate outcomes in health and education.
NWFP tends to lag behind the rest of the country in these outcomes. While the higher
(relative to the country) rural male primary enrollment rate in NWFP is consistent with
the almost universal availability of male primary education, female primary enrollment in
NWFP lag behind rural Pakistan, in spite of the far higher incidence of girls’ schools in
the province.
Table 2.2: NWFP- Summary results of districts by Rankings District Combined
rank
Infant
mortality
Enrolled
in
primary
school
Adult
literacy
15+
Use of
safe
water
Adequate
toilet
Average
income
per day
per capita
Urban
pop
Haripur 1 1 2 2 14 2 3 12
Abbotabad 2 6 1 1 12 4 4 7
Malakand 3 2 3 7 4 8 8 15
Kohat 4 7 6 3 10 5 1 2
Mansehra 5 5 4 5 17 14 7 19
Peshawar 6 4 13 6 3 3 12 1
Nowshehra 7 8 7 10 7 6 11 3
Mardan 8 12 5 11 6 13 9 5
Karak 9 3 14 4 11 19 15 17
Chitral 10 11 6 8 15 1 18 13
Hangu 11 10 16 14 16 9 5 4
Swabi 12 18 9 13 8 12 10 8
Bunner 13 9 20 22 19 18 2 22
Lower Dir 14 15 10 17 21 22 6 18
Swat 15 21 11 9 9 7 17 11
D I Khan 16 17 17 19 2 10 13 10
Charsadda 17 13 15 16 18 20 14 6
Bannu 18 16 19 12 1 16 20 16
Lakki
Marwat
19 14 21 15 5 15 22 14
Tank 20 20 18 18 13 17 21 9
Batgram 21 23 12 21 20 21 16 21
Upper Dir 22 19 22 23 23 23 19 20
Shangla 23 22 23 20 22 11 24 24
Kohistan 24 24 24 24 24 24 23 23
Source: District-based Multiple Indicators Cluster Survey (2001)

9
This apparent puzzle may be explained by a number of factors. Social and cultural
mores, particularly as they relate to demand for girls’ education or use of health services
for females, may play a role; lack of income or wealth may also depress demand for
education.2 Equally important is the fact that the figures listed above are but imperfect
measures of access. Firstly, the mere presence of a facility is not enough to guarantee
quality, or even that the facility is functional. Quality problems in education and health
facilities, according to a number of studies, are rampant in Pakistan, and the conditions in
NWFP are similar which can be ascertained only after careful study. Secondly, these
measures do not account for the exclusion of social groups, which are also likely to have
high concentration of poverty, from services and facilities. Both these problems can
significantly reduce the effectiveness of services for the poor and disadvantaged groups,
thereby affecting their potential to develop skills and enhance future economic
opportunities. Females are a largely disadvantaged group in the NWFP. There is a large
gender gap in the NWFP in terms of both the level and access to opportunity,
empowerment and security considered essential for reducing poverty.
Focusing on the Large Gender Gap
The gender gap can be monitored through the present level of indicators in NWFP for
females versus males. A selected number of indicators has been presented in the
following table. Ideally, the Female/Male ratio should be 100% and the Male-Female gap
should be zero. In general, the lower the Female/Male ratio or the larger the Male-Female
number, the wider is the gender gap. When the Female/Male and Male-Female indicators
obtain values of greater than 100% and negative, respectively, then the incidence among
female population is higher than male population. From the table below it can be
observed that the number of underweight female children is higher than the number of
underweight male children. This category applies to under-five children. Again, this is a
gender gap in favour of the male under-five population. All the indicators noted below
point to the fact that the female population has greater barriers to physical and mental
development than the male population. Thus, focusing on strategies to address this issue
becomes urgent in NWFP.
Table 2.2: NWFP Gender Gap in Key Indicators Indicator Female/Male Male - Female
Adult Literacy rate (15 years +) 36.7% 36.4%
Net primary school enrolment 72.7% 12%
Immunization (BCG scar)* 94.0% 4.2%
Children reaching grade 5 98.5% 1%
Underweight (-2SD) under 5 years of age 108.0% -3% (negative 3%)
Source: “NWFP, A District-based Multiple Indicators Cluser Survey, 2001”; GoNWFP, PDD, May
2002.*Data analyzed and presented from original data set by UNICEF; disaggregated data not present in
the MICS report.
Considering the district data from the MICS report, Kohistan district has the widest net
primary school enrolment gap (Female/Male = 48%; Male – Female = 11%) and
2 Regression analyses have shown household’s economic status to be an important determinant of school participation,
for entire Pakistan and individual provinces alike.
10
Abbotabad has the lowest gap (Female/Male = 96%; Male – Female = 3%). Considering
adult literacy rates, Kohistan district has the widest gap (Female/Male = 10.2%; Male –
Female = 21.4%) and Abbotabad has the lowest gap (Female/Male = 57.7%; Male –
Female = 33.1%).
When adult literacy rates are compared to net primary school enrolment, the improving
situation of gender gap can be observed. Therefore, it can be forecasted that the adult
literacy gap will be closed as time passes. When implementing the strategies addressed to
education and adult literacy, this fact will be taken into consideration.
At the same time, the large variation in the gender gap between Kohistan district and
Abbotabad indicates that further district level analysis on strategies should be undertaken
at the time of implementation. Obviously, in areas or districts where gender disparity
represented by Female/Male ration is 50% lower (a 50% ratio indicates there are twice as
many males than females in this category) accelerated strategies for closing the gap
should be followed. The adult literacy gender ratio of 10.2% quoted above indicates that
there are 10 times more literate men than women.
The Poverty Reduction Strategy therefore attempts to address the quality and governance
aspects, to improve service delivery of education and health with a special focus on
reducing the gender disparities.

11
CHAPTER 3. PRSP DIALOGUE
In preparing the Poverty Reduction Plan during 2000-2001 the government of NWFP
held extensive consultations with NGOs, donors and other stakeholders. However, the
NWFP Government did not discuss and/or disseminate the PRP program to the new
District Nazims, Councilors, and district officials. It was waiting for them to settle into
their new roles.
This process of consultation at the local level was finally initiated in December 2002
when SWOT (Strengths Weaknesses, Opportunities and Threats] analysis was initiated at
two levels. Templates and instructions were issued to all DCOs to involve the devolved
elected local Government and elected officials and other stake-holders in the consultative
process. Discussions were also initiated with all the heads of sections within the Planning
and Development Department of the Government of the NWFP and the Chief Planning
Officers of the key departments in order for them to initiate discussions at the sectoral
levels with all key stake-holders. The intention was to initiate dialogue with the new
district governments and all levels of civil society to ensure that the detailed sectoral
strategies and investment programs contained in the PRSP fully reflect the district
government priorities. This was extremely essential to engender ownership of the reform
objectives.
As part of this initiation program presentations on the determinants and dynamics of
poverty in NWFP and the key elements of the Poverty Reduction Plan were presented to
the Section Chiefs of the P&D Department and the Chief Planning officers of the line
ministries and to all the DCOs and elected Nazims and other officials of the local
Governments who were invited to Peshawar for discussion in mid January 2003.
The response was significant. All the participants welcomed the process and stressed the
need to define their own strategies of poverty reduction based on their own perceptions of
poverty. Based on this response there is even more reason for the consultative process to
be made an ongoing process for monitoring and evaluation and be given the highest
priority to ensure effective ownership and sustainability of the poverty reduction strategy.
Detailed guidance notes as well as an instrument based on the SWOT (strengths,
weaknesses, opportunities, threats) framework was also circulated to every DCO in the
province requesting that consultative workshops for stakeholders be organized in each
district. The objective was to bring stakeholders from all segments of civil society into
the PRSP formulation discussions in order to determine the strengths, weaknesses,
opportunities and threats facing the districts as well as to suggest key interventions to
increase opportunity, security and empowerment of the people. These latter three aspects
are based on international experience, considered to be essential for any effective poverty
reduction strategy.
The DCO led consultations with the elected officials and the representatives of civil
society were held in every district. And following the meeting held in Peshawar to which

12
all the DCOs in the Province as well as the District Nazims were invited it was decided to
conduct a series of larger stakeholder consultations in the selected districts to be
facilitated by the PRSP consultant and his team of experts. These consultative workshops
were held in five districts namely, Peshawar, Mardan, Swabi, Dir and Mansehra during
February 2003.
Earlier in January 2003, a meeting was also held in Peshawar with the Federal Secretary,
Economic Affairs Division coordinated by the Additional Chief Secretary Development.
The Federal Coordinator of the PRSP Program also attended. All the Provincial
Secretaries of the key line departments in the province attended. This meeting provided
the general direction and agreement on the salient features of the PRSP
The completed SWOT instruments from the consultations in all the Districts as well as
the results from the five extended workshops in the selected districts were analyzed and
integrated into the PRSP.
The main results of the assessment of the Strengths weaknesses opportunities and threats
from these consultations are summarized below:
The main strengths listed by the stakeholders during the consultative workshops
included:
Innovative and hardworking manpower
Rich Mineral resources
Abundant Hydel resources
Fertile land; and
Horticulture including fruits vegetables and rare medicinal herbs and livestock.
The main opportunities were seen in the areas of:
horticulture and vegetable production and value-added processing
mineral and natural resource exploitation and processing within the province
the use of the hydel resources as a source of power for small and medium scale
industry and for small scale power generation
dairy and livestock development
tourism and
the opportunities arising out of the Afghan reconstruction.
The main weaknesses that came up in the discussions included:
extreme poverty
Inadequate resources given size of poverty problem
high population growth
pressure of Afghan refugees
high population pressure on good agricultural land
high population pressure development and social sector resources
Great geographic and development diversity across regions both with and across
districts Poor exploitation of natural resources including wate

13
Low quality and coverage of infrastructure
Poor quality drinking water in a number of districts and urban areas
The threats were seen to come mainly from:
poor governance
poor understanding of the rights and responsibilities under the Devolution Plan
Inadequate functioning of the local government system
lack of effective district to province and province to center coordination
high refugee population
drought
These SWOTS formed the basis of the interventions suggested by the consultative
process. These are discussed at the end of the next section. It is expected that this process
of consultation will continue over time and that regular two-way flow of information
from the provincial P&D Department to the districts and from the districts back to the
P&D Departments will take place on a continuous basis. Such a two-way flow of
information is absolutely essential for the monitoring and evaluation of the overall
poverty reduction strategy.

14
CHAPTER 4. THE POVERTY REDUCTION SRATEGY (PRS)
Background
The Government started to address the multiple social and economic problems during
2000, with varying degrees of success. Recognizing that many of the problems were
interdependent and needed a more systematic approach, the Government of the NWFP
decided to develop a comprehensive reform program for the province. For this purpose, it
prepared a strategy document, the Provincial Reform Program (PRP) 2001-2004, which
was discussed extensively with various agencies, including the World Bank. The
proposed program was approved by the NWFP Cabinet in June 2001. Several of the PRP
reform measures were incorporated in the FY02 Budget and reflected in the Budget
White Paper and other documents. NWFP was the first province to embark on such a
comprehensive reform program. That on going PRP forms the core of the Provincial
PRSP. Moreover the Government of NWFP has committed to a structural adjustment
program to bolster this medium term plan. Elements of the Structural Adjustment
Program are presented in Annex II. This lists the actions taken so far as well as those
planned over the medium term 2003-2005 for each one of the key poverty reducing
interventions.
With the coming into power of an elected Government in 2002 it was imperative that that
the commitments made for the medium term i.e. 2003-2005 be ratified as quickly as
possible. No strategy can be effective without political commitment. On April 5, 2003 the
PRSP for the NWFP was presented before the Senior Minister and the Health Minister as
well as the Secretaries of the key line Ministries. What is presented below has the
approval of the Senior Minister and is based on the assumption that the political
consensus exists to carry forward the commitments made in the past two years. In all
strategic planning of an economic nature the crucial assumption is cetirus paribus i.e. all
other things being equal.
The overarching objective of the Poverty Reduction Strategy Paper for the NWFP is to
restore good governance and the respect for the rule of law, enhance the effectiveness of
public expenditures, re-establish the integrity of state institutions and their accountability
to the public. These objectives are in line with the goals of the I-PRSP for Pakistan [see
Annex III]. The PRSP for the NWFP has the following five main pillars with
strengthening governance to improve public service delivery as the cross cutting theme:
1. Governance reforms to achieve an efficient, accountable, and service oriented civil
service;
2. Reforms to improve service delivery in key sectors (especially basic health,
education and social services);
3. Fiscal and financial management reforms to improve governance in budget and
financial management, adopt a medium term budget framework (MTBF), enhance
15
effectiveness and accountability of expenditures, and strengthen resource
mobilization; and
4. Promoting Sustainable growth.
5. Addressing Vulnerability to Shocks
A prosperous and stable NWFP is geographically and economically critical to Pakistan’s
well being. In addition, there is a consensus among the policy makers and civil society
that a more literate and healthy population would enhance job opportunities within and
outside the province, and mitigate the risks for extremism. Recently, the Government of
Pakistan, together with the governments of NWFP and Balochistan, has initiated
preparation of a federally funded development program to address the under development
of the areas bordering Afghanistan. The majority of the populated border areas fall in
NWFP. These areas are amongst the poorest in NWFP, and the program is intended to
provide resources for physical infrastructure, social services, and income generating
activities. Moreover, the Federal and the NWFP government have also formulated a long-
term program to mainstream the tribal areas – politically, legally and constitutionally –
with the rest of the country.
A) Strengthening Accountability and Professionalism of State Institutions
Decades of neglect and decay took their toll on governance in the province, as in the rest
of the country. The result has been excessive staff, poor compensation (especially at
higher levels), declining quality of civil servants, over-centralization of decision-making,
complaints of widespread corruption and malfeasance, poor management systems, and
cumbersome and costly procedures. These are complex issues that would take a long time
to address. The Government of NWFP has therefore drawn up a phased and realistic
program to achieve its objectives in this area.
Devolution and Civil service Reforms
Objectives and Strategy. The objectives of the devolution and civil service reforms are
to increase the efficiency of government operations, make them more accountable to
users, effective in delivering public services, and raise the level of competence and
integrity of government officials. Government strategy to achieve these objectives is to
fully implement the devolution of power, decentralize functions and operations, reduce
staff at the provincial level, tighten the system of accountability, reorganize functions and
departments at the provincial level, improve recruitment and make promotions more
performance based, simplify procedures, and computerize business process.
Recent Reforms. The restructuring and rightsizing of provincial government, including
administrative and operational aspects of the Devolution, have been largely completed.
In regards to devolution, the required staff (around 200,000 out of total 280,000
provincial employees) has been assigned to district governments3; and district budgeting
3 Eventually most of these staff would become district government employees. For now they are provincial
employees, but their postings and performance evaluation is now down by district governments.

16
and most other non-policy functions have been transferred to the districts. The district
Rules of Business have been prepared, training of elected representatives and staff has
been instituted, local government contract rules have been notified, and district accounts
have been established. In regards to rightsizing, the Government of NWFP has
restructured 26 provincial departments, merging several departments, closing
autonomous bodies and several specialized agencies, thus streamlining and downsizing
the departmental structure and refocusing it according to new functions. Consequently on
the basis of identified redundancies, over 6,000 employees have been placed in a surplus
pool, many of whom have been assigned to districts.
Recruitment, promotion, and transfer policies have been revised and the key institution
managing them strengthened. The provincial Public Service Commission (PSC) has been
strengthened and made more autonomous, through appropriate changes in its legislation
and government’s administrative and Financial Rules. The PSC has been made fully
responsible for all recruitment of officials of officer grade. Institutional mechanisms have
been put in place to make recruitment and promotion merit- and performance-based. The
existing contract employment policy is being revised with a view to making all task- and
location-specific positions subject to contract employment. The Government is
continuing its freeze on new hiring, except for social sector delivery staff such as
teachers; and the compulsory retirement rules have been amended to facilitate retiring of
redundant or incompetent officials.
Far reaching Judicial Reforms have been initiated. The judicial and executive functions
have been legally separated. The judiciary has been made autonomous in matters of
recruitment of judicial officials and financial aspects, which is a significant step in
enhancing the independence of the judiciary.
Several institutional reforms and capacity building programs have been initiated. These
include: (i) the Essential Institutional Reform Operationalization Project (EIROP) funded
by UNDP, SDC and GTZ, was initiated in March 2001 to assist with human resource
(HR) and institutional reform and support capacity building and training at the district
level. The EIROP will be implemented over three years; (ii) with DFID support, a
training program for the new elected representatives and officials has been launched at
district and lower levels. In phase I, all union councilors were trained. A special program
of training women councilors is planned shortly. The government has started training of
district government functionaries in Financial Management, Budgeting, and Development
Planning. It has also launched a program of IT training; and (iii) cognizant of the huge
capacity building needs, especially to implement the PRP and the expanded social sector
programs, the government has initiated a review of unmet capacity needs. It has already
decided to establish the Education and Health Sector Reforms Units, the Budget Analysis
Unit, and the overall Economic Reforms Unit. In addition, the government has approved
a comprehensive three-year capacity building program to strengthen the managerial and
technical capacity of provincial and district officials.
Medium-Term Reforms. Over the medium term, the Government plans to continue to
implement the reforms under way and further intensify them. Among the planned actions

17
are: (i) implementing the expanded capacity building program; (ii) developing a HR
database using computerized payroll data and by conducting a civil servants census; (iii)
reviewing and adjusting the restructuring, downsizing, and personnel management
measures; (iv) strengthening district government staffing and staff training; (v)
completing district rules of business and codes; (vi) establishing courts for small causes
and family disputes; (vii) establishing public safety and accountability
commissions/offices at the provincial and district levels; (viii) appointing separate senior
officials to handle public complaints against officials; and (ix) establishing a Local
Government Commission to oversee performance of district governments. The ongoing
and planned reforms are expected to have a significant impact in terms of increasing the
efficiency, effectiveness, and integrity of the civil service, as well as making it more
responsive to people’s needs through devolution and administrative decentralization.
Anti-Corruption Initiatives
The government has moved aggressively on anti-corruption by sending a clear signal
that no one is above the law, and taking steps to reduce corruption in the future. Anti-
corruption rules have been simplified to make disciplinary actions easier to implement.
Better enforcement has resulted in the initiation of 2240 disciplinary cases since 1999
(compared to a similar number in the last decade), over half of which have been decided.
In addition, it has dismissed or suspended about 300 education department employees
(including teachers) for negligence and prolonged absence from duties.
B) Accelerating Human Development
Social Asset Creation:
Impoverished communities usually do not have access to basic social services. They need
the support of the government to be able to raise their children in a healthy and
productive environment. Today’s children are parents to the next generation, thus, if they
are not properly supported through social assets such as health facilities and primary
schools, they become transmitters of poverty. In a vicious cycle, malnourished girls grow
up to become malnourished mothers who give birth to underweight babies, parents
lacking access to crucial information are unable to optimally feed and care for their
children; and illiterate parents cannot support children in their learning process. Children
are often hardest hit by poverty. It causes lifelong damage to their minds and bodies.
They are therefore likely to pass poverty on to their children, perpetuation the poverty
cycle.
The provincial government strategy with respect to social asset creation for the poor
includes support to establishment of primary schools, primary health facilities, safe water
points, communal latrines and capacity building of established entities that work with the
communities, such as the Lady Health Workers (LHW). Special attention will be given to
the welfare and access of poor children within this strategy. Nutritional needs of the
population will be addressed within this strategy. One of the major strategies of the

18
government is to break this cycle of poverty through creating social assets that is
accessible to the poorest of the poor, the vulnerable groups, women and children.
Investments in children today will help lay a solid foundation for sustained and equitable
economic growth in the future. Attainment of sustained rapid economic growth is not
possible with high levels of illiteracy, malnutrition and morbidity. Therefore social asset
creation for the poor, economic and social reform go hand in hand in to ensure a strategy
that will alleviate poverty for the population successfully and in a sustainable manner.
A major thrust of the Government’s reform effort is to improve the delivery of human
development services to turn around the current situation and have a lasting impact on
productivity, equity, poverty, and social support system. These efforts are in tandem and
complementary to the financial and governance reforms that would have a positive
impact on improved delivery of various government services, through increased
resources, efficiency, and responsiveness of the system. The important reforms in the
delivery of social services and delivery of community infrastructure services are
discussed below.
Education
The education indicators in the province are still relatively low, the main reasons for
which are: inadequate financial resources; physical inaccessibility of many areas; poorly
trained and ill-paid teachers; general decay in educational standards in the country;
inadequate supply of instructional materials in schools; poor physical facilities in schools;
weak accountability, institutional capacity and management of the educational system;
and lack of community involvement in school affairs.
Objectives and Strategy. The Provincial Reform Program has made educational
improvement the foundation for achieving longer-term economic development and
poverty alleviation in the province. “Education is the first priority, second priority and
third priority of the government” according to the Government of NWFP. The
Government’s medium-term objectives in the sector are to:
(i) improve primary education (both enrollment and quality of
instruction);
(ii) reduce gender and rural-urban disparities; and
(iii) expand the capacity at the secondary school level.
These objectives will be achieved by increasing resource allocation to the sector,
allocating more resources to female education, upgrading the quality of instruction and
teacher training, improving the management structure, implementing devolution, and
increasing community and private sector involvement. In May 2002, the government
approved a comprehensive medium-term reform program, which builds upon and
strengthens the reform program developed in 2001 under the PRP and reflects higher
budgetary allocations included in the MTBF for FY03-05.

19
Recent Reforms. The highest priority is being given to improving quality and access by
taking the following measures:
Approving a comprehensive province-wide staff and facility rationalization plan which
would serve as a basis for needs-based recruitment, rationalization of facilities to reduce
inefficiencies, and redeployment to ensure every primary school meets the targeted
teacher student ratio of 1:30. As part of this rationalization plan, recruitment for 2,100
additional teachers has been approved for immediate deployment to schools without
adequate teachers; addressing teacher absenteeism by deploying teachers to their home
districts and facility-specific contract recruitment; introducing a results-based teacher
evaluation and reward system and initiating a province-wide periodic student assessment
system as part of the National Education Assessment System (NEAS), which would be
fully funded in the FY03 budget.
Strengthening of teacher training programs; The institutional and management reforms
comprising bifurcation of the provincial education department into lower and higher level
education; Creating separate teaching and management cadres, the latter is meant to
establish a professional school managerial cadre; Introducing computer literacy and
English-medium instruction on a pilot basis; Introducing textbook deregulation for
Classes 9-12, and developing a road map for expanding this initiative to the primary
sector, to allow for more efficient and competitive printing and publishing of textbooks.
Establishing clear criteria for the establishment/construction of primary schools and up
gradation of schools, in order to strengthen transparency of decision making and ensure
that decisions are in line with sector goals; and Establishing an Education Sector reform
Unit and staffing it to monitor and oversee progress in implementation of reforms.
Public-private partnerships and community involvement is being encouraged through:
Initiating a program to encourage private sector to use unoccupied government buildings
for establishing schools; restructuring the Frontier Education Foundation which supports
NGOs providing education, to make it autonomous and expand its activities to promote
public-private partnership with adequate linkages with the Departments of Education;
strengthening parent-teacher associations (PTAs) in almost all 20,000 primary schools;
and providing funds for instructional materials and minor repair (IM&R) to individual
schools through the PTAs.
The monitoring and supervisory mechanisms have been strengthened. Circle Teams have
been designated to carry out field visits every two weeks to monitor absenteeism and
availability of inputs at the facility level based on the new monitoring forms. The reports
are reviewed monthly at the district level, and will now be reviewed quarterly by the
Education Minister. The government views these steps as supplementing the
citizen/community oversight and accountability arrangements built into the devolution
plan. These are viewed as the only sustainable and effective way to monitor agency
performance. In addition, the Education Management Information System (EMIS) would
be fully funded in the regular budget, starting in FY03.

20
Steps have been taken to reduce gender disparity. The FY02 budget allocated 70% of the
sector’s development budget to girls’ schools, and innovative incentive schemes are
being developed to increase girls; enrollment. A major primary school facility
upgradation program is being initiated to ensure that essential missing physical facilities
(such as toilets, boundary walls, electricity) are provided to 100% of girls schools by end-
FY03.
The allocation for education has been increased significantly. Expenditures on education
have increased by 27% from Rs. 6.9 billion in FY 99 to Rs. 8.8 billion in FY01.
Expenditures have been reallocated toward primary and secondary education and
vocational training (including teacher training and away from tertiary and university
education. User charges from higher education, which have historically been very low,
were increased by around 20% in FY01.
Medium-Term Reforms. Over the medium term, the Government plans to take the
following actions:
• Increase allocations by over 73% from Rs. 8.5 billion in FY02 to Rs. 14.7 billion in
FY05, including increasing instructional materials and minor repair allocations
several folds;
• Complete the management reforms to implement the process of district-based
management, separation of teaching ad management staff, and training of staff;
• Complete the teacher redeployment, and facility rationalization based on the
approved staff and facility rationalization plan;
• Expand school capacity in partnership with the private sector and communities and
continue the strengthening of PTAs;
• Provide essential physical facilities in all primary schools, especially for girls, and
continue the policy of larger allocation of development funds for girls’ schools;
• Deployment of teachers in home districts and location-based new recruitment, and
in-service teacher training;
• Consolidate performance-based teacher evaluation and compensation, and the
province-wide student assessment system;
• Continue textbook de-regulation;
• Expand secondary school capacity, PTAs for secondary schools, and school
facilities for computer literacy;
• Establish primary schools in seriously deficient districts;
• Further increase in higher education user charges; and
• Continue to strengthen the monitoring and supervision system including the
commission of a regular third party user and facility survey in October 2002, and
annually thereafter, for independent monitoring of, among others, service delivery
indicators.
The impact of these wide-ranging reforms is expected to be substantial. By the end of
FY05, the overall primary school enrolment is expected to increase by 15%, with girls’

21
enrolment increasing by 30%.4 By the end of FY03, 100% of girls’ schools would have
basic physical facilities (such as toilets and boundary walls), and 100% of boys’ schools
will achieve the target by end of FY05. Serious gaps in school capacity in remote areas
would have been remedied. The quality of teachers, instruction, and student achievement
are also expected to be significantly higher by FY05.
Health
Underlying the low level of health indicators are inadequate and uneven availability of
primary health facilities, poorly staffed and stocked clinics, unplanned expansion of
facilities, inadequate allocations which are heavily skewed towards the tertiary health
care, and high incidence of preventable diseases.
Objectives and Strategy. The objective in the health sector is to significantly improve
health indicators in the province over the medium term. The Government’s strategy,
prepared in consultation with stakeholders, is to improve the management structure,
reorganized health facilities, with a multi-level referral system, focus on preventive and
primary health care, remove obvious gaps in facilities, increase budgetary allocations as
well as user charges, and increase reliance on the private sector with adequate regulation.
Recent Reforms. The Health Care and Hospital System Management Reforms have been
initiated. The Department of Health has been restructured in line with the Devolution
initiative with a substantive shift of staff and resources to the districts. A management
cadre has been created, and the separate male/female cadres of doctors have been
merged. A Health Sector Reform unit has been established to strengthen capacity for
planning and monitoring the reform process. Plans are being formulated, on a district
basis, to rationalize health service delivery and facilities aimed at developing a graded
and referral based system with appropriate staffing norms. A pilot is under
implementation in one district to rationalize facility and serve as the basis for wider
replication. Rationalization studies are underway in 13 other districts. All tertiary
hospitals have been given financial and administrative autonomy with the aim of
achieving financial self-sufficiency in three years, while plans are being developed to
protect access of the poor through safety nets. A hospital management system is being
developed to improve cost effectiveness and efficiency of public hospitals. A three-year
program has been approved to engage more female nurses to meet acute shortages at the
district and sub-district hospitals. And finally, facility-specific contracts have been
introduced to reduce absenteeism.
Communicable Disease Control and Maternal Health Programs have been strengthened.
A program to expand the coverage of immunization under the Global Alliance for
Vaccination Initiative (GAVI) has been approved. This expanded program includes
support for activities such as monitoring, staff development, and cold chain improvement
which are all expected to improve coverage of immunization. The Hepatitis B
vaccination has been initiated in three districts and province-wide coverage will being in
4 Traditionally, the government has tracked gross enrollment rates. With the introduction of MICS and
strengthening of EMIS, NWFP will start tracking net enrollment rates from FY04.

22
FY03. A provincial task force, chaired by the Governor, for polio elimination has been
overseeing an aggressive campaign against polio. Polio cases have been reduced from 57
in FY00 to 28 in FY01. An intensive campaign for TT immunization of pregnant women
in 15 high risk areas, with involvement of Lady Health Workers (LHWs), was initiated in
August 2001. A plan to recruit1800 additional LHWs has been approved, and their role
and that of paramedics is being expanded to include nutritional and reproductive health
education. Finally, the TB DOTS program has been revitalized in 5 districts covering 20
percent of the population.
Allocations for health sector have also been increased More emphasis has been given to
expenditures on primary health care and mother and child care where the expenditures
have increased by 8% compared to a 2% overall increase in health expenditures during
the MTBF period.
Medium-Term Reforms. As health sector reforms have been initiated in all the important
areas, the emphasis in the medium term will be on consolidation and strengthening. In
particular, the Government plans to focus on the following activities:
• Strengthening the Reform Unit, capacity and training of the district staff, and the
hospital management system;
• Reviewing the experience of the pilot project for a graded referral system and
replicate it in other districts;
• Expanding the use of LHWs and paramedics as the frontline health workers and
continue location-specific recruitment/deployment of health workers;
• Augmenting public health services in partnership with the private sector and local
communities;
• Implementing phased increases in user charges and putting in place an effective
safety net for the poor;
• Expanding the coverage of communicable disease control programs of
immunization, TB DOTS, and of reproductive health services;
• Increasing total expenditure by 120% to Rs. 4.3 billion in FY 05, with higher
allocation for primary care; and
• Monitoring the impact of reforms through periodic MICS and third party surveys.
Women Development
Progress in this area has been going on for many years. Women are increasingly
receiving education, participating in many professions and businesses, and playing an
active role in politics. However, as shown in the Gender Gap Analysis (Annex ll), the
Government realizes that it has to sharpen and strengthen its focus on this important
development issue to fully utilize its human resources.
Girls and women constitute a large portion of the population in NWFP. A comparison of
social indicators shows that girls and women lag behind boys and men in terms of

23
survival, development, protection and participation. Contrary to international trends,
there are fewer females than males in Pakistan. Less girls than boys get enrolled in
schools, as can be seen in the Gender Gap Analysis. Girls and women are also more at
risk of violence and exploitation. Families often take the decision of restricting mobility
of girls and women to protect them from external threats of violence and abuse, thus
depriving them of equal opportunities for development.
As a result of reduced opportunities, girls and women are unable to develop their full
potential thus limiting their ability to contribute fully to the development of the family
and the community. It also places a heavy responsibility on boys and men, who often
have to support large families of 8-10 persons on a single income. Translated at the
provincial level, the inadequate human development and protection of girls and women
deprives the province of huge economic and development potential. Without addressing
the issues of gender-based biases and discriminations against girls and women, poverty
reduction strategies would not have the desired impact in the province.
Government of Pakistan acceded to the Convention on Elimination of Discrimination
Against Women (CEDAW) in 1996, thus indicating its commitment to provide equal
opportunities for development and elimination of discriminations against girls and
women at all levels, including various government and social levels. The Government of
Pakistan has also prepared a National Plan of Action, which outlines plans for key areas
of development for girls and women, which include health, education, economic
empowerment, political participation and protection from violence and exploitation. The
plans addresses the issues of development of girls and women in different spheres of life.
It proposes selected strategic interventions aimed at providing equal and equitable human
development opportunities and protection from violence and abuse for girls and women.
Future Strategy:
The provincial government will implement numerous strategies in this regard, which
include: promoting the participation of women in decision making processes; policy
change to facilitate female participation; capacity building and skill development;
partnership with community, NGO and private sector; gender disparity reduction;
ensuring access to gender disaggregated data; and provision of improved access to social
services for the female population.
In line with this strategic approach, key interventions proposed include a focus on the
following:
Review and bring about required changes in legislative framework and policies to end
discriminations and gender biases with a focus on education, health, finance, asset
ownership, labour and protection from violence;
Promote participation of women in decision making processes at all levels including
in the political processes;
Build the capacity of women in decision making positions to enable them to fulfill
their responsibilities;

24
Raise awareness on equal rights of girls and women for survival, development,
protection and participation from policy to household level, with a focus on boys and
men;
Develop capacity of women for improved participation, financial and land
management as well as entrepreneurial skills;
Ensure equal access to services for girls and women including in the areas of health,
education, skills training and credit;
Ensuring that routine monitoring systems used for data generation, surveys and
evaluations will provide gender disaggregated quantitative and qualitative
information;
Ensure that the planning process does utilize gender disaggregated data to ameliorate
the situation of the female population;
Develop capacity of service providers for ending gender-biases in planning and
access to services and gender-based violence and exploitation;
Remove barriers of age, domicile, female discrimination as an affirmative action to
help reduce the gender gap in employment;
Document, monitor and address gender-based biases and violence against women.
Specifically, in each of the sectoral reform areas, especially in the crucial education
sector, concerted efforts are being made to reduce gender disparity. Also access to
maternal and family planning services is being increased. The Department of Women
Development has under implementation several schemes, partly with support from the
private sector and local communities, to promote skill development among women and
provide temporary shelter, a crisis center, and free legal assistance for women in distress.
The Government plans to expand these activities through public-private partnership,
community help, and NGOs’ assistance.
A Provincial Steering Committee, including civil society members, would oversee these
activities, and provide a vehicle to raise people’s awareness of the needs and rights of
women.
Children constitute majority of Pakistan’s population. The proportion of the population
aged less than 15 years is higher in NWFP than the national average. Government of
Pakistan is committed to welfare and development of this large cohort. Child rights are
recognized through the Convention on the Rights of the Child (CRC) to which Pakistan is
a signatory. Recently, in the UN Special Session on Children, 2002, Pakistan alongwith
the rest of the world, agreed to make policies and take actions for meeting goals and
objectives set at the Special Session. These commitments are contained in the outcome
document entitled “A World fit for Children”. As a follow up, Pakistan is preparing a
National Plan of Action [NPA] for Children. Similar planning initiatives are going on in
provinces and Provincial Plans of Action [PPA] for Children are under preparation. This
document is set to lead action for child rights and child welfare in the next 10 to 15 years.
It is recommended that the strategies under the Provincial Plan of Action (PPA) under
preparation be given priority in the overall poverty reduction strategy of the NWFP.
25
There are elaborate national and provincial plans to provide education and health to
children. However in crucial areas such protection from violence and child labour plans
are still being developed. Plan of Action for Children for NWFP would therefore serve to
fill these crucial gaps in the social sector policies relating to children in a holistic manner.
It is now accepted worldwide that there can be no sustainable development without
giving access to rights. Rights of the children are of special significance in this regard.
The government has shown commitment by announcing plans to of adequately funding
the Plan of Action for Children. While detailed indicators are included in the PPA, three
indicators on birth registration, juvenile justice and education of worst forms of child
labour are being included in the PRSP for creating sharp focus and linkages between the
policies of the government and its implementation methodology. The Plan of Action for
Children will provide the matrix for implementing the commitments contained in the
PRSP.
Water Supply and Sanitation5:
Only Sixty-three percent of NWFP population has access to safe drinking water, which
excludes open dug wells. This figure stands at 89 and 59 per cent for urban and rural
access, respectively. Thirty-nine per cent of the population in NWFP have access to
adequate sanitation. The urban – rural access is 75 and 33 per cent respectively. Lack of
access to safe water, inadequate sanitation and poor hygiene practices are some of the
underlying causes of malnutrition, disease and death in children. The lack of access to
safe sanitation is one of the major reasons for prevalence of sicknesses such as diarrhea in
children and adults. Ensuring access to safe water and adequate sanitation can have a
major impact on raising the long-term GDP levels of the province. The ranking of
provinces in with respect to adequate sanitation has been presented in table 2.1.
Under the devolution plan, rural water has been increasingly decentralized to the district
and sub-district level including the allocation of funds to the different social sectors.
Provincial governments are now releasing block allocations to districts. The funds
earmarked for the sector are included in overall provincial budgets (e.g the Public Health
and Engineering Departments, Local Government).
Within the existing fiscal space there is a need to ensure that budgets for rural water and
sanitation are earmarked within the block allocations to districts and included in the
Khushal Pakistan Programme. Rural water and sanitation projects can also be funded
from the special funds allocated to each MNAs and MPAs.
It will be imperative to allocate funds for rural areas for water and sanitation as
traditionally, the focus has been on large infrastructure urban projects with high
Operation & Management costs and little community involvement, affecting the
sustainability of these projects. Low cost solutions for rural water and sanitation have
proved effective and have been insitutionalised within the local government. With the
redefinition of the roles and redistribution of functions of the local government, resources
5 All data quoted in this subsection are from NWFP MICS 2001

26
and information on low cost technological options need to be provided at district and sub-
district levels.
Strategies for rural water and sanitation: The following strategies will be followed for
rural areas:
Policy shift focussing on low cost technology and sustainable models;
Capacity building of district and sub-district functionaries vis-à-vis their new roles
and responsibilities;
Replication of successful low cost interventions with community involvement.
The devolution has provided an opportunity to address key institutional constraints,
which have historically hindered the delivery of urban services, especially to the poor
[see Annex IV]. Using this opportunity, Government of NWFP has: consolidated various
service delivery agencies (Communications & Works and Public Health Engineering
Department) with fragmented and overlapping service provision mandates; transferred
functions and organizations to the local governments (including the Urban Development
Authorities); and instituted special arrangements for the main urban center, the Peshawar
City District. A regulatory body will be established for the urban water sector at the
provincial level. The Government of NWFP has nurtured an enabling environment for
participatory development and has spearheaded Community Driven Development
initiatives throughout the province. The World Bank’s Community Infrastructure Project
in NWFP has been a success story to the extent that a follow-on operation is being
planned. The Province is also the first in the country to start the development of an
integrated and participatory strategic plan at a city district level, which is likely to
provide a model for a comprehensive development framework for the newly formed
district governments. The Government intends to examine the need for any further
streamlining of agencies in this sector, adopting a uniform policy for community
participation and responsibility, and upgrading the management and technical capability
of the local government urban services institutions.
C) Improving Fiscal Sustainability and Restoring Financial Accountability.
Fiscal and Expenditure Reforms
Objectives and Strategy. To expand fiscal resources for meeting its growing development
and service needs, the GOVERNMENT OF NWFP has adopted a comprehensive
medium-term fiscal strategy. This includes:
• Increasing provincial revenues through further tax reform and accelerating user
charge increases and saving interest payments through better debt management;
• Divesting inessential activities;
• Implementing fiscal devolution;
• Improving budgetary process, financial management, procurement process and
transparency;
• Strengthening the audit oversight arrangements; and
27
• Formulating a medium term budget framework.
The key medium term pillar of fiscal adjustment is expenditure management and
increasing non-tax revenues and user charges, given the low immediate potential for
enhancing taxes.
Recent Reforms. The Government has started implementing the above strategy and has
already taken actions in key areas as discussed below:
Implementation of fiscal decentralization has begun at the provincial level. In anticipation
of the devolution of powers, the province prepared the initial district budgets for FY02.
Local governments are preparing their own budgets for FY03, and the needed staff has
been re-assigned to the districts. Starting in FY02, the province began allocating certain
development funds across districts based on clear criteria, including population and
indicators of social development and backwardness. NWFP is the first province to have
used a needs-based formula for budgetary transfers to the districts.
Revenue measures are being implemented to strengthen revenue mobilization. The tax
reforms include reducing and restructuring provincial taxes; imposing of income-based
agricultural income tax to complement the province’s land-based tax (unlike the other
provinces the land tax in NWFP is applied to all landholdings without exemptions);
outsourcing of collection of motor vehicle tax and harmonization of rates with other
provinces; and restructuring and expanding of the base of the Urban Property Tax from
18 to 27 rating areas. Moreover, enhancement and rationalization of user charges has
been initiated, especially for economic and tertiary-level social services. Irrigation water
rates (abiana) are being increased by 25% each year. Higher user charges for roads and
tertiary health and education services are also planned, beginning in FY03.
Expenditures have been reprioritized to improve composition and strengthen expenditure
management. The development program was rationalized. Over the last two years, the
number of ongoing projects has been reduced by two-thirds, from 1125 to 375 projects;
as a result the “throw-forward” of fiscal liabilities to complete ongoing projects was also
reduced by 62% from Rs. 24 billion to Rs. 9 billion. Throw-forward now is around 100%
of the annual development program compared to more than 300% a few years ago. The
share of development expenditure in total expenditures has increased from an average of
10-15% during FY98-01 to 25% in FY02. The Government Of NWFP has reduced the
wheat subsidy from Rs. 2.7 billion in FY99 to Rs. 1 billion in FY02. A number of public
enterprises and autonomous bodies have been closed, which would save around Rs. 70-
100 million annually.
Budget formulation and monitoring has improved. Unlike past practices, the government
is no longer permitting spending commitments to be made against net hydel profits above
the capped amount of Rs. 6 billion. It has also programmed expenditures assuming a
shortfall of around 5% in federal tax transfers to NWFP. The Government of NWFP has
also instituted several reforms in the preparation, processing, and execution of the budget

28
including: posting fiscal data on the web; economic classification of expenditures in
budget documents; introducing amid-term review; computerizing budget preparation;
establishing a new schedule for timely release of funds; and establishing a professionally
staffed Budget Analysis Unit, to start functioning in early FY 03.
Budget Outcome for FY02 is on track. During the first 9 months of FY02, provincial tax
collection was well on track to meet the budget targets mainly due to higher collection of
electricity duty; collections of other taxes are also consistent with the budget. Collection
of user charges add up to 65 percent of the budgeted amount despite lower collection of
‘abiana’ on account of drought. Federal tax transfers have been slightly lower than
anticipated due to lower collection at the federal level. However, transfer of hydel profits,
up until May, were only Rs. 1.7 billion out of the ‘capped’ Rs. 6 billion for the year.
Substantial federal grants for the Khushal Pakistan Program and subvention have offset
some of the shortfalls in total revenue receipts. On the expenditure side, partly reflecting
revenue shortfalls and transitional disruptions due to devolution, total expenditure is just
above 60 percent of the budgeted amount for the whole year. Expenditures have picked
up in the fourth quarter, now that procedural bottlenecks to transfer of funds to the
districts have been resolved.
As a result of fiscal restructuring, the share of current expenditures will fall from 74% of
total spending in FY02 to 69% in FY05, with a corresponding increase in development
expenditure. The expenditures on priority social sectors – mainly education and health –
will increase from 27% of total expenditures in FY02 to 35% in FY05.6 It is expected
that with the implementation of its fiscal strategy, the province would have a more
sustainable fiscal position, and, together with institutional reforms, an improved public
service delivery.
To complement efforts to generate their own resources, the Government of NWFP is
seeking financial assistance from the Bank, for support of its broad based development
efforts and restructuring of the provincial fiscal accounts. As a result of the projected
borrowings from the Bank, the Government of NWFP’s total outstanding debt will
increase from Rs. 73 billion in FY02 to Rs.95 billion FY05, but total debt service
(including principal) will decline from Rs. 8.6 billion to Rs. 7.8 billion over the same
period due to lower interest payments. As a proportion of the government’s receipts, total
debt service will decline from 23% in FY02 to 17% in FY05.
Medium-Term Reforms. The medium-term reforms in this area focus on efforts to
strengthen implementation of revenue and expenditure reforms consistent with the
MTBF, and include further improvement of revenue mobilization to achieve a sustainable
fiscal position, and enhanced funding for social services to meet medium term target
outcomes. In addition, the Government of NWFP aims to further strengthen budget
processing and monitoring, including computerization, increasing the coverage of fiscal
data posted on the web, and program and performance budgeting. The permanent
6 In education: from an annual average of Rs. 0.5 billion (FY98 – 02) of development expenditures to an
annual average of Rs.2.9 billion during FY03-05; and in health: from Rs.200 million annual average,
during FY98-02, to annual average of Rs. 0.9 billion during FY03-05.

29
Provincial Finance Commission would be established to institutionalize fiscal
decentralization and review on an ongoing basis fiscal performance of the districts. In
addition the government will be undertaking a study on tax potential which will be
completed during FY03, to provide the provincial government with the analysis and
recommendations on further tax measures for the FY04 budget. A medium term plan will
be developed, during FY03, for the modernization and strengthening of AIT collection
and processing. Also an agreement would be reached with the Federal Bureau of
Statistics, and funding provided, to collect reliable provincial economic data.
Financial Management and Accountability
Financial management and accountability issues are at the center of the NWFP
Government’s reform program. Improvement in fiscal management, quality of public
accounts, public accountability and procurement are among the key reform targets. The
Government of NWFP has taken the following actions to strengthen and improve
financial management.
The Fiscal Monitoring Committee (FMC) and the Departmental Account Committees
(DACs) are fully functioning. The Provincial FMC has been functioning adequately and
has done a good job. According to the provincial AG, for FY01, 100% of NWFP’s
provincial receipts and 100% of expenditures were reconciled, compared to only 50-60%
a few years ago. This was a good achievement compared with past experience and the
situation in other provinces. Reconciliation between the AG and the State Bank of
Pakistan (SBP) have improved substantially and the amounts in suspense are now
insignificant, with the re-introduction of next day reconciliation between the DAOs and
the SBP/National Bank of Pakistan. Unlike the past when DACs were infrequently held,
the DACs are now being held regularly as per the schedule provided by the AG’s office.
In FY01 and FY02, 100% of the DACs were held.
The accounting capacity is being strengthened as follows: (i) NWFP will appoint in early
FY03 a Provincial Controller in its Department of Finance to lead financial management
reforms. The Controller’s main task will be to implement financial management and
public financial accountability reforms. In addition, the Controller will be responsible for:
(a) accounting and financial reporting (jointly with the provincial AG); (b) developing
provincial capacity to handle accounting and payroll; (c) preparing program to strengthen
internal controls, internal audit, and financial policies and procedures; and (d) assisting
agencies respond to audit observations and systemic issues; and (ii) the position of the
District Accounting Officers – the linchpin in the accounting systems – are being
upgraded to professionally manage the accounts under the newly devolved fiscal
authority. The province has decided to upgrade, for all major districts, these DAO
positions to officer grade to attract qualified staff. They will induct younger and better
trained staff at this critical first tier accounting management position.
A Public Accounts Committee (PAC) has been formed. The functioning of the ad hoc
PAC in NWFP was delayed due to a High Court ruling against it. This judgment has
recently been rescinded, and the Committee formed in end-May 2002. The Governor has

30
requested the PAC to review past audit reports on last-in first-out basis and open all
Committee meetings to the public. It is expected that PAC will be made a fully
functioning agency with the province taking prompt action on its recommendations.
Fund Release Procedures for Development and Non-salary Funding for Priority Sectors
have been streamlined. For the development budget, 50% of releases are now made each
in July and January. In case of non-development expenditures, releases are being made as
follows: 10% in July, 40% in August, 40% in January, with remaining 10% kept as
contingency.
The Overall Legal and Regulatory Framework for Procurement is being improved
starting with the approval of a new Procurement Ordinance to simplify processes,
increase competition and transparency, and introduce a code of ethics.7 Thereafter, during
FY03, detailed rules and regulations would be notified, the existing Purchase Manual
revised, and standard bidding documents introduced.
The General Provident and Pension Funds have been established. In order to better
manage the government’s deferred liabilities, the Government of NWFP has established a
separate General Provident Fund and a Pension Fund outside the Provincial Consolidated
Fund. At present, the General Provident Fund has a total deposit of Rs. 3 billion, against
the present total deferred liability of Rs. 6 billion. The Pension Fund presently has
deposits of Rs. 1.6 billion against the current pension liability of Rs. 2.5 – 3 billion per
annum. The government has been increasing the capital of the Pension and Provident
Funds in the last two years and intends to continue this during FY03-05, depending upon
resource availability. The amounts placed in these Funds are invested in approved fixed
income securities and the interest income generated is ploughed back into the respective
Funds.
In addition to above measures, the Government of NWFP has recently approved a
Financial Management Reform Program. This program provides a broad framework, a
road map for its implementation and benchmarks. It was agreed with the Government of
NWFP that a detailed Provincial Financial Accountability Assessment (PFAA) would be
conducted jointly by the Bank and the Government of NWFP by December 2002. Based
on the findings of the PFAA, a more comprehensive short, medium, and long term
financial management reform action plan will be prepared and agreed between the Bank
and the Government of NWFP.
Supplementing the provincial efforts, the World Bank supported project for strengthening
accounting and financial reporting is also being implemented at the provincial level.
Under the project, the adoption of the New Accounting Model and computerization of
government accounting system will have a positive impact on the reliability and
timeliness of provincial accounts. By December 2003, all of the District Accounting
Officers (DAOs) will be computerized and linked to the provincial Accountant General’s
(AG’s) Office and the Finance Department.
7 The NWFP Governor approved enactment of the Ordinance on May 30, 2002.

31
D) Promoting Sustainable Growth
The unexploited strength of the NWFP economy lies, amongst other sources, in its
tremendous potential in its minerals, value-added agriculture, timber and non-timber
products, hydel resources and potential for tourism development. This PRSP recognizes
that accelerating growth is key to poverty reduction but also that the private sector has to
be the engine of this growth and that such growth should be based in the rural sector
where the majority of the poor reside and where the highest employment multipliers are
evidenced. The PRSP also strongly endorses the mainstreaming of gender in all growth
promotion activities in the Province as the most efficient means for poverty reduction.
The Rural Development Strategy proposed here relies on the acceleration of growth in
value-added agriculture and overall agriculture development accompanied by the
development of the non-farm sector to bring about poverty reduction. In this respect the
Government is envisaged to play only a supporting role to promote the private sector
through the provision of farm to market roads, easy and timely availability of institutional
credit and easy and timely availability of information and technology.
Within agriculture development the Government should ensuring farmers’ easy access to
necessary technical information and inputs so that they can exploiting the province’s
comparative advantage in terms of location to supply not only the large domestic markets
but also the middle east. An important step in this regard is the rationalizing of the
Agriculture Extension Department and the initiating of programs to enhance its technical
capacity to help farmers increase production and export. Other specific areas of focus
include assisting the development of the seed industry with public-private partnership;
expanding the vaccination coverage of livestock; reducing the role of the public sector
and improving the overall functioning of agriculture markets.
The largest poverty reduction comes from the development of the non-farm sector in
rural areas. This sector is generally extremely employment intensive and requires the
lowest amounts of capital per job created. It is therefore ideal in the resource constrained
conditions of NWFP. The Government will actively promote off-farm employment
opportunities by promoting agro-based industries and employment through processing
and other activities and services that rely on the linkages with the farm sector The dairy
and livestock sector offer enormous potential in this regard.
The Province has enormous mineral resources including marble and precious gemstones.
These need to be fully exploited for sustainable poverty reduction. It is important that the
minerals be processed within the province so as to create jobs locally. In this regard it is
important to allow easy entry of small-scale businesses by encouraging private
investment and improving the law and order situation.

32
The Province also has enormous tourism potential. This requires infrastructure
development through a developing a road network and the development of facilities such
as hotels, motels, rest houses, restaurants and gift shops. The Government can facilitate
by providing access to and beautification of local sites, better access to credit for kiosks
and food stalls and preparing and distribution of advertisements, brochures, and seminars
to attract tourists The local Governments have a large role to play in this respect. Again
the law and order situation is crucial for tourism development.
Specific steps to improve the business environment, enhance productivity of agriculture,
reduce the role of the public sector in commercial and industrial activities, and promote
public-private partnerships are needed. Reforms to improve the efficiency of the
province’s infrastructure, including irrigation facilities, road and urban infrastructure and
services, and environmental protection would also support the growth process. These
specific steps include:
Improving the Business Environment for Industry and Trade
The GOP has recently established a Cabinet Committee on Deregulation to review the
federal level regulatory constraints to the development of the private sector. The
Government of NWFP, in addition to assisting this GOP Committee, is implementing
several reforms. These are:
• A public-private sector Deregulation and Facilitation Review Committee has been
established to review provincial regulatory constraints, and its recommendations
would be implemented over the next two years;
• The Industrial Department has been reorganized, and its focus is being shifted to
promotion, facilitation, and enforcement of safety regulations;
• Divestiture/privatization of commercial activities is being implemented. The
government intends to start reducing its shareholding in the Bank of Khyber, the main
provincially-owned commercial enterprise, to reach below 50% by FY04 and
complete divesture by FY05. In addition, a program has been initiated to lease the
dozen or so off-grid micro hydel projects to the private sector in the local area;
• To exploit the province’s mineral, gemstone, and marble resources on economic
lines, the Mineral Department has been restructure, a Policy Committee appointed,
Concession Rules amended to allow entry of small-scale businesses, and a Mineral
Investment Facilitation Authority has been established; and
• A detailed province wide study to analyze the sources of and constraints to private
sector development, with particular emphasis on the role of SMEs should be
undertaken. This would be used to design a more focused economic growth and
poverty alleviation strategy to unleash the province’s full potential. This study should
identify the gains from the locational advantage of NWFP and the business
possibilities related to the reconstruction in Afghanistan.
Sectoral reforms to improve the effectiveness and quality of economic and infrastructure
services that are critical to growth include:

33
Agriculture. Although the arable land in the province is not extensive, agriculture
remains the mainstay of the province. An agriculture and rural sectoral strategy is being
developed, with some implementation already underway, emphasizing: (i) targeting
overall agricultural growth through sound policies, including reducing the role of the
public sector, withdrawing subsidies and allowing market pricing; (ii) alleviating poverty
in rural areas; (iii) ensuring farmers’ access to necessary technical information and inputs
to increase agricultural productivity and exploiting the province’s comparative advantage
in production and export of high value added crops and horticultural products by
rationalizing the extension department and initiating a program to enhance its technical
capacity; (iv) further developing the seed industry with public-private partnership; (v)
expanding vaccination coverage of livestock; and (vi) divesting all non-core activities.
The province is in the process of legally winding up three recently closed autonomous
bodies (the Frontier Cooperative Bank, the Agricultural Development Authority, and the
Fruit and Vegetable Board), and downsizing or restructuring other agencies to shift focus
to agricultural policy, research and development, and extension services.
Irrigation. Although NWFP is not a widely irrigated as Punjab, efficient irrigation of the
province’s fertile tract is crucial for its agricultural economy. Under the on-going
National Drainage Project, the government has initiated institutional reforms to
decentralize the management of the irrigation and drainage system, improve maintenance
of the system, enhance water availability at the tail end, and increase cost recovery. These
reforms involve: (i) transforming the Irrigation Department into an autonomous NWFP
irrigation and Drainage Authority, leaving only regulatory functions in the government
domain; (ii) establishing commercially oriented and autonomous Area Water Boards
(AWB) at the command level, with farmer representation; (iii) devolving O&M and cost
recovery responsibilities to formally organized Farmer Organizations at the
distributary/minor levels; and most importantly, (iv) fostering
beneficiary/community/private sector participation in all aspects of the operation and
management of the irrigation and drainage systems. These institutional reforms have been
initiated but implementation needs to be accelerated. In addition, to generate resources
for the water sector, the water charges (abiana) have been increased annually by 25% and
the government has taken right sizing and cost reducing measures, include a freeze on
new recruitment, sale of assets (earth moving machinery, tubewell rigs etc) and
privatization of government tubewells through community mobilization. Over the
medium term, the government plans to follow through with the above reforms and ensure
that the new institutions are made operational.
Roads. The province has a relatively good road network, except in a few remote, hilly
areas, but adequate maintenance is a major issue. The government has initiated several
measures to deal with the issues of inefficiency of the system, poor cost recovery,
inadequate funding, and the backlog of maintenance of province roads. The measures
include establishing an autonomous Highway Authority, under public-private oversight,
for managing all aspects of provincial highways. The Authority would be responsible for
managing the newly established Road Maintenance Fund which would be funded through
user charges, and would help improve service delivery. Maintenance and other road

34
construction activities will continue to be outsourced. In addition, a specific program is
being initiated to rehabilitate, during the next seven years, all the roads in very poor
conditions. The government has prepared a program of increasing user charges to self
finance the Maintenance Fund, as well as completing the backlog of maintenance work
within five years.
Putting it all together to Improve Income Opportunity. The district level consultations
generated a number of suggestions for improving the income opportunity of the poor.
These interventions focused on streamlining marketing through:
o improved information flow as well as improved grading, certification and
transportation of horticultural and vegetable products;
o encouragement of cooperatives for marketing and processing of horticultural and
vegetable crops, dairy and livestock production
o sustainable exploitation of forests and non-timber forest products through the
private sector
o ensuring easy access to credit and better marketing facilities for small cottage and
household industry including those for leather, Khaddar, cloth, caps, knives,
woodcarving and carpets.
o Tourism should be encouraged through better access to credit for kiosks, o Restaurants and hotels and through the dissemination and advertisement of
information about the same.
o Promotion of mineral and especially gem stone exploitation through inviting
private investment.
It is recommended that the elected district governments should act as efficient businesses
through better marketing for investment and improved access to credit in their districts.
District Governments should find ways to encourage businesses from outside to invest in
these districts as well as to find markets outside of these districts for the products to be
produced here.
In order to operationalize the strategy for improving the income opportunity of the poor
in NWFP detailed district-wide studies are needed to:
o Analyze the full resource potential of the province and identify the constraints
o Analyze and evaluate alternatives in each area recommended in the strategy to
come up with specific policies
o Provide incentives to address locational disadvantages – ensure a playing field
It is critical that access to information be improved. In this regard the ongoing E
Governance Reforms need to be strengthened. The recently launched DCIC program
should be expanded for provision of easy access to information on marketing, health,
education, etc. Efforts are already underway to strengthen the Bureau of Statistics. The
dissemination of information should be coordinated and intensified with links to
Government of NWFP E Portal. There is a great need to build capacity. The Capacity
Building Advisory Board has been announced. The EIROP program is ongoing. In the
new global scenario there is an urgent need to build technical capacity to provide

35
certification to meet WTO standards. And above all there needs to be an all out effort to
improve human skills to enhance Productivity
Improving personal security. The major interventions suggested for improving security
included community mobilization through CBO/CCOs. The provision of free legal
services by volunteers especially free services for under-privileged women. The need to
provide land consolidation as well as the need to end corruption and improve governance
were also recommended as key measures to improve security, lawlessness and . It was
recommended that lawlessness be eliminated and personal security be ensured. There was
also a recommendation to ensure food security for all. The general recommendation to
end corruption and improve governance was made in each and every consultative session.
Empowering the Vulnerable. The key recommendations to increase the empowerment
of the vulnerable included the continuance of the local governments system with greater
representation by women and the under-privileged. The representation of the under-
privileged in plan identification, monitoring and evaluation and training programs for
women in income generation as well as basic health and nutrition.
F) Addressing Vulnerability to Shocks
The interventions listed in the PRSP for Pakistan to address vulnerability to shocks are
also being implemented in the NWFP. These are:
Zakat rehabilitation grants
In the national IPRSP a key instrument for social rehabilitation and reducing vulnerability
to exogenous shocks is the revamped system of Zakat and Ushr. The Zakat and Ushr
Ordinance (1980) mandates that 2.5 per cent of the value of all declared, fixed financial
assets (i.e. savings accounts/certificates and financial assets for fixed term) for those
possessing nisaab (the specified limit) are to be automatically deducted at source at the
beginning of the month of Ramadan. The system of collection and disbursement of Zakat,
overseen by respective Zakat Committees, has been recently reorganized to improve their
efficacy. While the institutional framework for implementation, monitoring, and
evaluation of this social intervention is being strengthened, relief to beneficiaries in the
form of subsistence grants were raised last year from a monthly transfer of Rs. 300 to Rs.
500. Zakat has thus emerged as the government’s central program or social safety
instrument. However, its potential and scope in fighting poverty is yet to be fully
realized. Contrary to previous dedicated emphasis on grants and stipends, the revitalized
Zakat system will provide funds to Mustahiqeen (beneficiaries) not only to fulfill basic
needs but also to permanently rehabilitate them, by assisting them in the establishment of
small-scale commercial projects or other means of living suitable to their qualifications,
skills profile, and local conditions, thereby allowing them to achieve self reliance
Rehabilitation schemes have been prepared which are aimed at about 1.5 million new
beneficiaries, who will be provided Rs. 10,000 to Rs. 50,000 each for starting up small

36
businesses/trades. The funds will be allocated with Provincial, District, and Local Zakat
and Ushr Committees determining the needs of Mustahiqeen in their respective areas as
well as area-wise priorities for allocation of funds, Local Councils will administer the
rehabilitation packages. The Mustahiq candidate must submit a written application, on
the prescribed form, to the Local Zakat Committee, containing a proposal for grant
utilization, as well as indicating need. Local Committees may sanction grants of upto Rs.
10,000; and must forward applications with their own recommendations to District
Committees, for approval of Rehabilitation grants greater than Rs. 10,000 and up to Rs.
50,000. On approval of cases, the District Zakat and Ushr Committee may release the
grant to the concerned Local Zakat Committee for disbursement.
Mustahiq beneficiaries must provide written undertakings to the effect that funds
received will be utilized exclusively for the purposes for which they have been granted. A
consolidated monitoring and institutional framework is being developed for the
rehabilitation scheme to coordinate interaction between the Committees, and ensure
accountability of beneficiaries. The District Rehabilitation Monitoring Committees, and
their Tehsil and Local counterparts, will be responsible for the effective monitoring of the
Schemes at their respective levels. Committees at each level shall undertake field visits
and report on the functioning of the Schemes, with responsibility for reporting
irregularities to District Committees.
Under the national IPRSP the Funds allocated by the Central Zakat Council for the
Rehabilitation Schemes are to be in addition to the usual 4 percent allocated under this
category in the previous system. Disbursement of the existing 4 percent will, therefore,
continue in accordance with the Zakat Disbursement Procedures. Funds approved by the
Central Zakat Council are to be disbursed by provincial quota, approved by the Council
after which, Provincial Councils will remit funds to the district level. Accounts for all
transactions and flow of funds under the Rehabilitation Scheme are to be maintained by
the Local Zakat Committee and Provincial Zakat Council and audited by the Auditor
General of Pakistan.
The Food support program
The Food Support Program for the poorest sections of the population has also been
revitalized and funds for the program have been set aside. The program is designed to
mitigate the impact of increase in wheat prices. Its coverage extends to the poorest
households with monthly income of up to Rs. 2000. Cash support of Rs. 2000 is provided
to them through biannual installments. The program was implemented at the district level
through the help of district officials. A system of means testing at the local level has been
adopted for identification of beneficiaries by linking the program with the Zakat system
where records of Mustahiqeen are developed through extensive participation.
In addition to the food support program, Pakistan Bait ul Maal provided support to
destitute people for a number of purposes including medical support, fund for bonded
labor, students’ stipends, community education and dialysis support.

37
The Khushal Pakistan Program - (Poverty Alleviation Program)
Due to the transitory nature of poverty the Khushal Pakistan Program is a social
intervention aimed at generating economic activity through public works. A sum of
Rs.11.5 billion has been released under the Khushal Pakistan Program (Poverty
Alleviation Program) to the districts through provincial governments; while the schemes
under the program have been identified and selected at the district level through active
community participation. This program has created numerous employment opportunities
and is providing essential infrastructure in rural and low-income urban areas. The
program has focused on the construction of farm to market roads, water supply schemes,
irrigation spurs and repair and operationalization of schools. Under the IT component of
the program, rural based vocational training in computers is being promoted. The
Khushal Pakistan Program depends on the functioning of district governments under the
devolution program for further importance and local ownership.
The cost of the schemes selected under Khushal Pakistan Program has been kept between
Rs 0.05 million to Rs 5.00 million per scheme, in rural areas and Rs 0.05 million and Rs
8.00 million in urban areas. The following criteria have been followed while identifying
and analyzing projects for the program:
• The project should be capable of integration with earlier infrastructure, for instance
trunk sewers, roads etc.
• The management and implementation of the projects will be in partnership with the
communities. In case of rural roads local councils will take over the projects on
completion.
• In each district the local D istrict Coordination Officer ( DCO) will select 25 per
cent of the projects in marginalized areas. He will identify areas, in consultation with
local NGOs and civil society, where there is a lack of sufficient basic infrastructure
and majority of inhabitants belong to low-income groups.
• In cases where existing schemes require major expenditures for rehabilitation, work
may be undertaken under the program, provided that the total cost of such
rehabilitation work will not be more than 25 per cent of the allocation for a district.
• The projects will not be of a cost of less than Rs 1 million to prevent a thin spread of
funds except in the case of rehabilitation of drinking water supply.
• Khushal Pakistan program will be utilized for productive purposes and will not be
provided for administrative expenditures. Communities will continue to identify
projects and implement them under a participatory approach in the Khushal Pakistan
Programme.
Enhanced Role for NGOs and civil society
NGOs can play an important role in social service delivery, advocacy, and empowerment.

38
In recent years, the NGO sector has risen to meet the growing demand for social services.
Interventions have included empowerment through participatory development at the
grassroots level towards raising consciousness about rights and responsibilities, capacity
building, and poverty reduction. At the provincial and national level, NGO’s are also
contributors to policy formulation, planning, and research. NGOs feature strongly in the
Government’s policy to provide social development and assistance to the vulnerable. The
Government provides institutionalized support to NGOs through a range of government
ministries including the Ministry of Women Development, Social Welfare and Special
Education that is the focal point for NGOs. It also provides financial support through the
National Council for Social Welfare and the National Zakat Foundation and similar
bodies in Provincial Governments.
The NGO sector is constrained by limited resources, especially financial resources
commensurate with their commitments. To address issues relating to capacity and
acceptance of NGOs, a successful strategy adopted for the involvement of NGOs in
alleviating poverty would involve:
Developing a consortia or forum of NGOs working on a particular issue.
Pooling resources and using umbrella NGOs to help build capacity of the smaller
NGOs
ensuring better coordination and exchange of ideas, information and expertise (e.g
the UNICEF sponsored WESNET)
Other social protection mechanisms
Pakistan’s social security system bypasses a large section of the population, especially in
terms of provision of pensions and/or old-age benefits. Although, government employees
and their dependents are entitled to pension and medical support only a small fraction of
private employers provide such support through Employees Old-age Benefits Institution
(EOBI) and associated Provincial Social Security Institutions. The federal government
regulates and administers EOBI, which along with provincial institutions provides
invalidity support, pensions, and medical care.
Informal NWFP Specific Safety Net
This strategy proposes the setting up Poverty Reduction Associations of concerned well
to do citizens with logistical support from the District Governments to evolve and
implement schemes to improve the opportunity, security and empowerment of the
vulnerable at the grassroots level. These associations should also be charged with
ensuring that all such schemes are environmentally sustainable and biodiversity
conserving and provide adequate opportunities to the vulnerable especially women. In
addition these associations can serve as the focal mechanism for the supervision and
distribution of basic food items at cost price to the poor and vulnerable as well as the
provision of basic cooked food (dal and roti at designated tanoors) to the destitute in
each locality through informal collections from philanthropists in and around the area.

39
Overall Recommendations
In addition to the interventions outlined in the other sections this strategy therefore also
proposes the following additional measures:
• Training and support to enable the local Governments to think along modern lines to
enable them to functioning as sustainable entities with proactive planning for the
development and promotion of all available resources at the district level
• Providing training through the on-going EIROP project for the local Governments to
enable them to prepare business plans and advertise the business and tourism
possibilities their districts along modern lines.
• Strengthening the office of the District Planning Officer with equipment and training
from the on going EIROP project to act as a Business Development and Support
Units for all the citizens of the districts. This office would be charged with providing
essential links to the on-going national level support initiatives such as SMEDA,
Zarai Taraqiati Bank, Khushali Bank and other initiatives that can be used to develop
the small and medium industries and agriculture.
• Initiating district level studies to assess how best to develop and promote horticulture
and vegetable farming, food processing including fruit preservation, timber and non-
timber forest products exploitation and mineral and gems development on modern
business lines;

40
CHAPTER 5. THE MEDIUM TERM BUDGET FRAMEWORK
The most significant aspect of PRSP process in the NWFP is that a Medium-Term
Budgetary Framework (MTBF) had already been formulated. The province has prepared
an MTBF for FY03-05 to adopt a framework for improving the allocation of resources
and planning for priority development expenditures over the medium term. The
Provincial MTBF approved by the Cabinet of Government of NWFP has been predicated
on the following assumptions. First, the existing National Finance Commission formula
has been assumed for planning purposes. Second, the resources accruing from hydel
profits transfers to NWFP from WAPDA have been projected at the capped amount of
Rs. 6 billion per year. Lastly, provincial revenue buoyancy assumptions have been taken
at very conservative levels to avoid unrealistic projections.
The Government expects that, as a result of the revenue and expenditure reforms
underway and proposed under MTBF, additional fiscal space generated will be
approximately Rs. 2.6 billion/year, about 5-6 percent of total expenditures. Over the next
three years, the provincial efforts are conservatively expected to generate Rs. 7.8 billion
in additional spending capacity.
Table 5.1 Fiscal Space Created through the MTBF (Rs. Million) FY03 FY04 FY05
Increase in Revenues
Provincial Taxes 229 316 391
Non-Tax receipts 78 78 78
User Charges 436 576 706
Decline in Expenditure
Subsidies 1,450 1,450 1,450
Interest Payments 0 179 336
Total Fiscal Space Created 2,193 2,598 2,960
This fiscal space will be created through first increasing provincial “own revenue”
mobilization, as follows: (a) increasing non-tax revenues, of which user charges are
forecast to rise by over 75% by FY05; (b) increasing provincial tax revenues, which is
projected to grow by 15% in FY03 and 10% each during FY04 and FY05.8 The collection
of agriculture income tax (AIT) will be strengthened. This is conservatively estimated to
raise Rs. 60 million in the first year, and gradually increase thereafter. Implementation
difficulties are anticipated given the need for improved land surveys, limited collection
capacity, and the need for improvement in local tax administration. However, the reform
effort has a very important longer term role to play through closing a major loophole for
8 Despite the generally non-buoyant nature of provincial “own revenue” sources, the projected increases are
significant especially for FY03. However, the increase does not show up in the rounded off ratios (as % of
provincial GDP), because of their relatively small size. In any case the base for estimating the ratio,
provincial GDP, is not very reliable. The targets for FY04 and FY05 have been conservatively estimated
(taking into account recent tends, administrative capacity and simultaneous measures to increase national
taxes) and will be re-evaluated based on the results of the study of the provincial tax potential, which is
planned to be completed prior to formulation of FY04 budget.
41
tax evasion, reducing a major distortion that has been politically difficult to tackle, and
creating a vehicle for local taxation that has a significant potential. It is expected that over
a five to ten year period this could become a far more significant revenue source. Second,
withdrawal of the poorly targeted and ineffective wheat subsidy is expected to generate
about Rs. 1.5 billion (50% of own revenue) each year in savings. In future, only
allocations for management costs of strategic stocks will be made. Third, expensive debt
of around Rs. 6 billion will be retired over FY03-05. This will save the province about
Rs. 1.0 billion over three years and reduce the share of interest payments in total
expenditures from 17% at present to 10% in FY05. Details of the MTBF allocation to the
key sectors identified by this PRSP are presented in the Tables 5.2 and 5.3 below:

42
Table 5.2: NWFP: Summary of Medium-term Budget FY01 to FY05 (Rs. Million)
Projected
FY03 FY04 FY05
Federal Transfers 34,116 37,022 40,248
Federal tax assignments 21,700 24,087 26,937
Subvention grants 4,716 5,235 6,011
Hydel profits from WAPDA 6,000 6,000 6,000
Other grants 1,700 1,700 1,700
Provincial Resources 4,374 4,742 5,136
Provincial taxes 1,624 1,784 1,945
User charges 1,457 1,665 1,898
Non-tax and capital receipts 1,293 1,293 1,293
Total receipts 38,861 42,143 46,170
Current expenditure 32,980 34,347 35,908
of which: Social services 11,308 12,385 13,517
Interest payments 6,628 5,944 5,328
Subsidies 0 0 0
Development expenditures 11,754 13,987 16,299
of which: Social services 3,687 4,819 5,560
Total expenditures 44,734 48,333 52,207
Overall deficit -5,873 -6,191 -6,037
Financing 5,873 6,191 6,037
Foreign project assistance (net) 3,748 4,194 4,502
Other financing items -1,175 -1,303 -1,365
Cash development loans (CDL) -2,100 -2,100 -2,100
Proposed World Bank financing 5,400 5,400 5,000
Share in Total Expenditures
Current expenditure 73.7 71.1 68.8
Interest payments 14.8 12.3 10.2
Development expenditures 26.3 28.9 31.2
Total social sector 31.2 33.5 35.3
of which: Social services 24.3 25.9 28.1
: Health 6.7 7.4 7.1
In Percent of Provincial GDP
Federal tax assignments 5.4 5.4 5.6
Provincial taxes 0.4 0.4 0.4
Non-tax receipts 2 1.9 1.8
of which: Hydel profits 1.5 1.4 1.2
: User charges 0.4 0.4 0.4
Grants 1.7 1.6 1.7
Total receipts 9.6 9.5 9.5
Current expenditure 8.2 7.8 7.4
Development expenditures 2.9 3.2 3.4
Overall deficit -1.5 -1.4 -1.2
Total social sector expenditure 3.5 3.7 3.8

43
Table 5.3 Detailed Breakdown of Expenditures under the MTBF for NWFP
Rs in million
Percent of Total Expenditure
2003 2004 2005 2006 2003 2004 2005 2006
Community services 919 965 1,013 1,064 2.1 2.0 1.9 2.0
Social Services 11,308 12,385 13,517 14,704 25.3 25.6 25.9 27.2
Education 8,839 9,793 10,798 11,847 19.8 20.3 20.7 21.9
Health 2,387 2,507 2,632 2,764 5.3 5.2 5.0 5.1
Others 81 85 90 94 0.2 0.2 0.2 0.2
Economic Services 2,193 2,303 2,418 2,539 4.9 4.8 4.6 4.7
Agriculture 834 875 919 965 1.9 1.8 1.8 1.8
Irrigation 761 799 839 881 1.7 1.7 1.6 1.6
Rural Development 547 575 603 634 1.2 1.2 1.2 1.2
Others 51 54 57 60 0.1 0.1 0.1 0.1
Subsidies 0.0 0.0 0.0 0.0
Wheat 0.0 0.0 0.0 0.0
inventory mgmt costs 500 500 500 500 1.1 1.0 1.0 0.9
Other Current Exp 100 100 100 100 0.2 0.2 0.2 0.2
Current Exp 32,980.4 34,346.5 35,907.9 37,912.8 73.7 71.1 68.8 70.1
Development Exp 11,754.2 13,987.2 16,299.1 16,201.5 26.3 28.9 31.2 29.9
Social Services 2,649 3,789 4,978 4,227 5.9 7.8 9.5 7.8
Education 2,039 2,740 3,878 3,071 4.6 5.7 7.4 5.7
PRSP Education 1,400 2,000 3,000 2,000 3.1 4.1 5.7 3.7
Health 6,10 1,048 1,101 1,156 1.4 2.2 2.1 2.1
PRSP health 400 1,000 1,500 500 0.9 2.1 2.9 0.9
Economic Services 2,303 2,798 3,318 3,864 5.1 5.8 6.4 7.1
PRSP Agriculture 654 380 380 380 1.5 0.8 0.7 0.7
Community Service 1,798 1,888 1,982 2,081 4.0 3.9 3.8 3.8
PRSP community service 500 500 500 250 1.1 1.0 1.0 0.5
Total Expenditure 44,734.7 48,333.8 52,207 54,114.3 100.0 100.0 100.0 100.0

44
CHAPTER 6. MONITORING AND EVALUATION MECHANISMS IN THE NWFP PRSP
In addition to the Monitoring and Evaluation mechanism built into the National PRSP
process [see Annex III] the specific aspects of the key monitoring indicators and the
institutional mechanisms for their implementation in the NWFP are presented in table
6.1 below:
Table 6.1: Monitoring the NWFP PRSP Areas and Indicators End-Period Targets (FY05) Institutional Arrangements for
Monitoring
1. Overall
Provincial GDP growth rate
.
Poverty (Caloric)
4-5%
38% (down from 44% in FY99)
Planning and Development
Department Source for Poverty
Data; PIHS Survey every two
years.
2. Public Finance
Provincial Tax Revenue Growth
User Charges
Pro-poor I-PRSP expenditures
Development expenditure
Maintain timely comprehensive
and reconciled fiscal data using
the New Accounting Model.
15% annual growth in FY03;
10% p.a. in FY04 & 05.
75% increase over FY03-05.
From 29% of expenditures in
FY02 to 35% in FY05.
From 26% of total expenditures
in FY02 to 31% in FY05
100% computerization and
reconciliation of civil accounts.
Quarterly Fiscal Monitoring
Reports, Annual Budget
Statements of Department of
Finance, and Annual Budgets.
Department of
Finance/Accountant General
Office.
3. Social Sectors
Gross primary enrollment rate
Gross primary enrollment rate
female.
Reduction in primary school
dropout rates
Girls school provided essential
physical facilities
Full immunization % of children
less than 2 years.
% of population with access to
TB Control using DOTS.
Antenatal coverage of pregnant
women by health professionals.
Contraceptive Prevalence Rate.
85% (up from 70%)
84% (up from 54%)
35% (down from 45%)
100% by FY05.
80% (up from 54%)
100% (up from 20%)
45% (up from 34%)
35% (up from 21%)
PIHS, Annual EMIS, MICS,
Annual Monitoring Reports
prepared by the Education Sector
Reforms Unit, and Third Party
Survey.
-do
-do-
PIHS, Annual HMIS, MICS,
Annual Reports of the Health
Sector Reforms Unit and Third
Party Survey.
-do-
-do--
4. Infrastructure
population with access to safe
drinking water.
Population of roads classified in
poor condition.
65% (up from 58%)
50% (up from 80%)
PIHS, MICS
Annual reports of CWD, and
Independent surveys.

45
The baseline data is based on PIHS, EMIS and HIMS. In addition, for Education, the
PRSP for NWFP will target and track the net enrollment targets based on the MICS.
In the national IPRSP it is proposed that as part of the provincial consultations, nationally
consistent measurement methodology will be developed in order to prepare poverty lines,
which are consistent over time and space. For this purpose data collected by the Federal
Bureau of Statistics (FBS) through Pakistan Integrated Household Surveys (PIHS) will be
utilized. PIHS, is however, not designed for analysis at the district level, and this
shortcoming is proposed to be addressed through increased technical capacity at the
provincial level. The MICS with an extended expenditure and incomes module could
provide a feasible alternative. This will be explored in greater detail in the future. Also as
proposed in the national strategy, other sources of data will be identified and their
capacity for meeting district level data requirements strengthened, so that
intermediate/output indicators (success drivers) can be tracked.
In terms of evaluating progress on the final indicators in the national PRSP, it is
envisaged that the provinces will identify focal points within their respective Planning
and Development Departments. These monitoring units will track progress, in close
coordination with district governments, on intermediate and outcome indicators and
report periodic progress to the national PRSP monitoring and evaluation unit, the Centre
for Research on Poverty Reduction and Income Distribution (CRPRID), at the Planning
Commission. The Poverty Reduction Coordinator within the Planning and Development
Department of NWFP will perform this extremely important function.
The information thus collected will be analyzed at the CRPRID which is to be
responsible for the collection and evaluation of all information relating to inputs
(expenditures), output/ intermediate and outcome indicators from the provincial
monitoring units, FBS and other concerned departments. The CRPRID will be involved
in developing and institutionalizing the system for poverty monitoring at the national,
provincial, and district levels; and analyzing impact of poverty reduction policies on the
poor. It will also be responsible for producing analytical progress reports on the final
PRSP indicators on a periodic basis. To ensure the success of this system the process of
data reporting (of PRSP indicators) to CRPRID will have to be strengthened and
streamlined.
Evidently, instituting a comprehensive mechanism for preparation and monitoring of
PRSP will call for creation of significant capacities at various government levels and in
different departments. Four key areas where this need is particularly pressing are PRSP
preparation (dialogue with civil society, poverty assessment), monitoring (data collection,
impact assessment), statistics (covering all PRSP indicators) and special studies and
surveys (deeper and continuous analysis of poverty profile in selected areas). These needs
cut across all governments, federal, provincial and district.
The next steps required for the institutionalization of the Monitoring and Evaluation
System for the NWFP are summarized in Table 6.2 below. The actions required call for
repeating the MICS every three to four years with the next one in FY05. These steps also
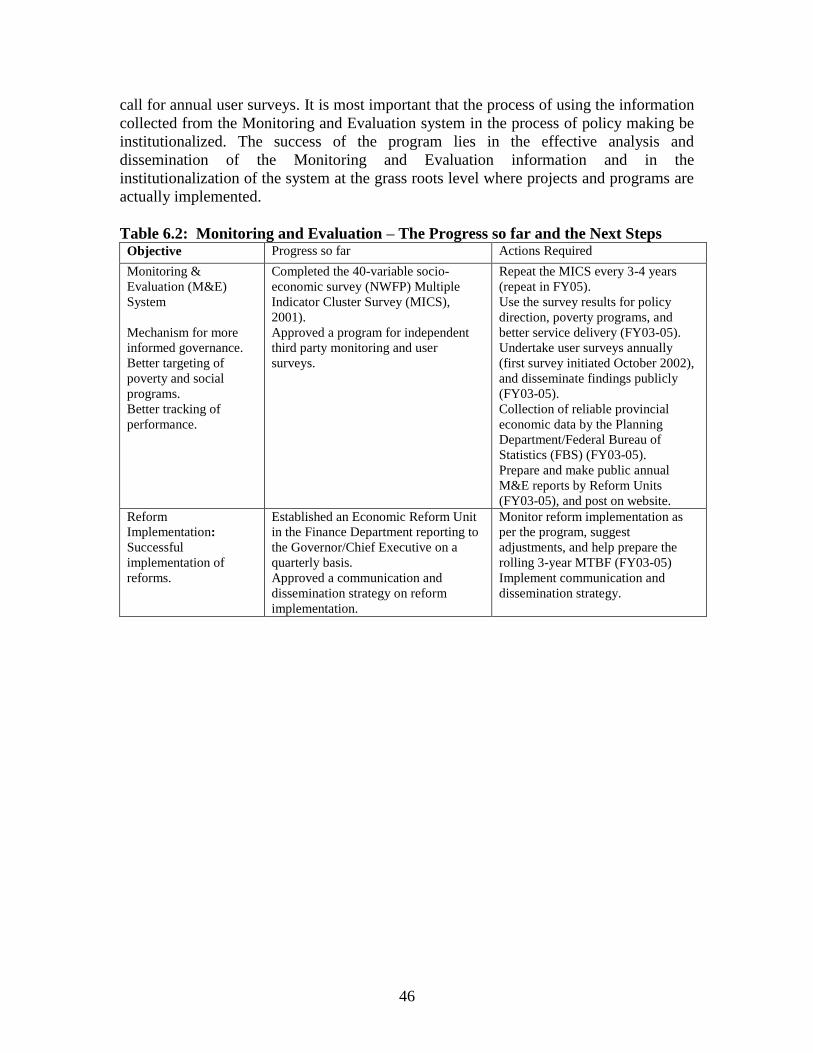
46
call for annual user surveys. It is most important that the process of using the information
collected from the Monitoring and Evaluation system in the process of policy making be
institutionalized. The success of the program lies in the effective analysis and
dissemination of the Monitoring and Evaluation information and in the
institutionalization of the system at the grass roots level where projects and programs are
actually implemented.
Table 6.2: Monitoring and Evaluation – The Progress so far and the Next Steps Objective Progress so far Actions Required
Monitoring &
Evaluation (M&E)
System
Mechanism for more
informed governance.
Better targeting of
poverty and social
programs.
Better tracking of
performance.
Completed the 40-variable socio-
economic survey (NWFP) Multiple
Indicator Cluster Survey (MICS),
2001).
Approved a program for independent
third party monitoring and user
surveys.
Repeat the MICS every 3-4 years
(repeat in FY05).
Use the survey results for policy
direction, poverty programs, and
better service delivery (FY03-05).
Undertake user surveys annually
(first survey initiated October 2002),
and disseminate findings publicly
(FY03-05).
Collection of reliable provincial
economic data by the Planning
Department/Federal Bureau of
Statistics (FBS) (FY03-05).
Prepare and make public annual
M&E reports by Reform Units
(FY03-05), and post on website.
Reform
Implementation:
Successful
implementation of
reforms.
Established an Economic Reform Unit
in the Finance Department reporting to
the Governor/Chief Executive on a
quarterly basis.
Approved a communication and
dissemination strategy on reform
implementation.
Monitor reform implementation as
per the program, suggest
adjustments, and help prepare the
rolling 3-year MTBF (FY03-05)
Implement communication and
dissemination strategy.

47
Annex I: Poverty Assessment of NWFP
Poverty in NWFP should be understood in the broader context of poverty in Pakistan.9 In
addition, understanding issues specific to poverty in the province also requires examining
the concentration of poverty across areas within NWFP. Such an understanding can help
to inform policymakers by identifying priority needs and target groups for intervention.
This section is thus restricted to disaggregating poverty at the regional (rural/urban) level
within NWFP, recognizing that the important task of analyzing district-level poverty and
exploring variations across districts must await the analysis of survey data that is
representative at the district level. The recently conducted Multi-Indicator Cluster
Survey (MICS) 2001, is the first attempt to get district-level representative estimates in
the NWFP. The preliminary results from MICS show that there is considerable variation
within the province in terms of poverty and social indicators. Districts of Kohistan,
Upper Dir, Bunner, Batagram, Shangla and Tank are among the poorest six districts in
NWFP, and ranking extremely low in terms of social indicators. A more detailed
assessment of within-province poverty and social development would be possible in the
future, once the MICS data is fully analyzed and the survey is repeated every 3-4 years as
planned.
Table 1: Poverty Trends by Province
Province FY93 FY94 FY97 FY99
Urban Areas 20.7 16.3 16.1 22.4
Punjab 22.0 18.1 1.16.9 25.5
Sindh 17.3 11.8 12.0 16.1
NWFP 25.3 26.9 27.2 29.2
Balochistan 31.8 16.8 23.0 24.3
Rural Areas 28.9 34.7 30.7 36.3
Punjab 26.5 33.9 28.3 36.0
Sindh 29.5 31.8 19.6 34.7
NWFP 37.0 40.0 43.4 44.9
Balochistan 28.1 37.9 42.5 22.5
Overall 26.6 29.3 26.3 32.2
Punjab 25.2 29.5 25.0 33.0
Sindh 24.1 22.6 15.7 26.6
NWFP 35.5 38.1 41.2 42.6
Balochistan 28.6 35.5 38.4 22.8
Source: ADB (2002). Poverty in Pakistan: Issues, Causes and Institutional Responses
The overall picture of consumption /income poverty in NWFP corresponds closely with
that of Pakistan as a whole—higher concentration of the poor in rural areas, lower
9 The source for all data, unless otherwise specified, is the Pakistan Integrated Household Survey (1998/99).
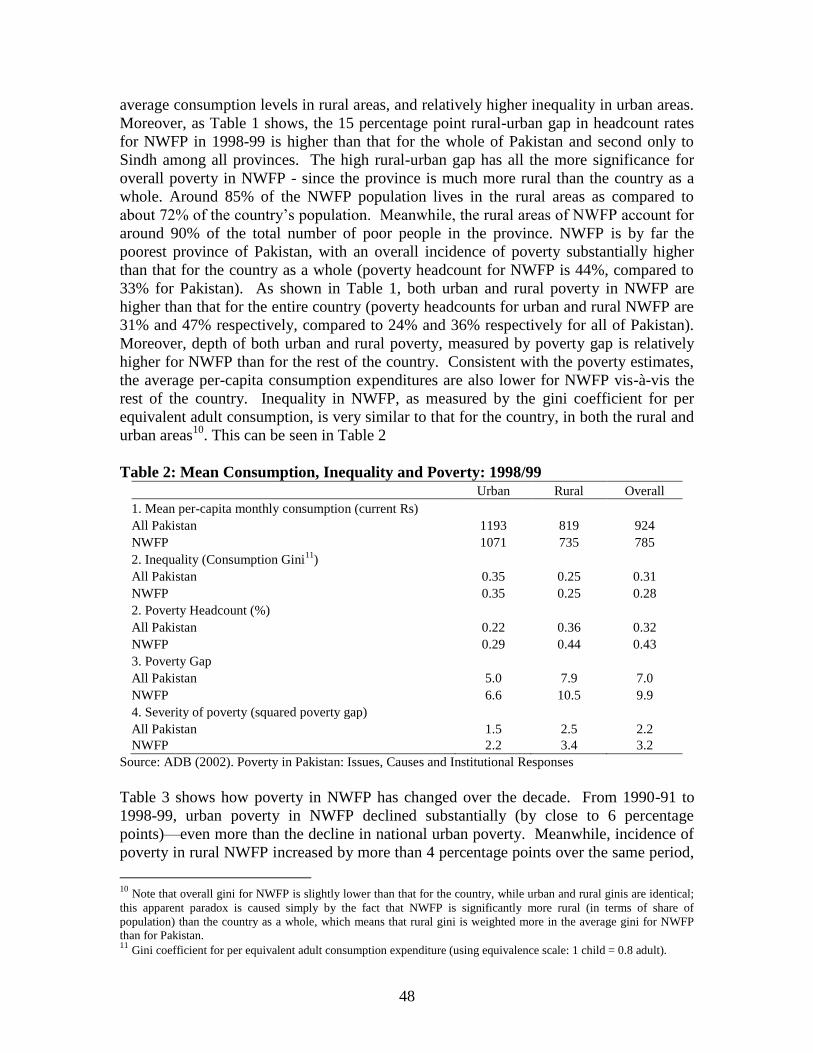
48
average consumption levels in rural areas, and relatively higher inequality in urban areas.
Moreover, as Table 1 shows, the 15 percentage point rural-urban gap in headcount rates
for NWFP in 1998-99 is higher than that for the whole of Pakistan and second only to
Sindh among all provinces. The high rural-urban gap has all the more significance for
overall poverty in NWFP - since the province is much more rural than the country as a
whole. Around 85% of the NWFP population lives in the rural areas as compared to
about 72% of the country’s population. Meanwhile, the rural areas of NWFP account for
around 90% of the total number of poor people in the province. NWFP is by far the
poorest province of Pakistan, with an overall incidence of poverty substantially higher
than that for the country as a whole (poverty headcount for NWFP is 44%, compared to
33% for Pakistan). As shown in Table 1, both urban and rural poverty in NWFP are
higher than that for the entire country (poverty headcounts for urban and rural NWFP are
31% and 47% respectively, compared to 24% and 36% respectively for all of Pakistan).
Moreover, depth of both urban and rural poverty, measured by poverty gap is relatively
higher for NWFP than for the rest of the country. Consistent with the poverty estimates,
the average per-capita consumption expenditures are also lower for NWFP vis-à-vis the
rest of the country. Inequality in NWFP, as measured by the gini coefficient for per
equivalent adult consumption, is very similar to that for the country, in both the rural and
urban areas10
. This can be seen in Table 2
Table 2: Mean Consumption, Inequality and Poverty: 1998/99
Urban Rural Overall
1. Mean per-capita monthly consumption (current Rs)
All Pakistan 1193 819 924
NWFP 1071 735 785
2. Inequality (Consumption Gini11
)
All Pakistan 0.35 0.25 0.31
NWFP 0.35 0.25 0.28
2. Poverty Headcount (%)
All Pakistan 0.22 0.36 0.32
NWFP 0.29 0.44 0.43
3. Poverty Gap
All Pakistan 5.0 7.9 7.0
NWFP 6.6 10.5 9.9
4. Severity of poverty (squared poverty gap)
All Pakistan 1.5 2.5 2.2
NWFP 2.2 3.4 3.2
Source: ADB (2002). Poverty in Pakistan: Issues, Causes and Institutional Responses
Table 3 shows how poverty in NWFP has changed over the decade. From 1990-91 to
1998-99, urban poverty in NWFP declined substantially (by close to 6 percentage
points)—even more than the decline in national urban poverty. Meanwhile, incidence of
poverty in rural NWFP increased by more than 4 percentage points over the same period,
10
Note that overall gini for NWFP is slightly lower than that for the country, while urban and rural ginis are identical;
this apparent paradox is caused simply by the fact that NWFP is significantly more rural (in terms of share of
population) than the country as a whole, which means that rural gini is weighted more in the average gini for NWFP
than for Pakistan. 11
Gini coefficient for per equivalent adult consumption expenditure (using equivalence scale: 1 child = 0.8 adult).

49
although rural poverty headcount for the country actually fell slightly over the same
period. Unlike Punjab, the largest and most populated province in Pakistan, where rural
and urban poverty alike have shown modest declines over the decade, poverty reduction
in the 1990s in NWFP appears to have occurred only in urban areas while rural areas
have become poorer on the average. However, it is also important to note that
notwithstanding the decline in urban poverty in NWFP during the decade of the 1990s,
urban areas in this province still remain the highest in the country by a large margin.
Table 3: Incidence of Poverty by Province and Region
1998-99 1990-91
Urban Rural Overall Urban Rural Overall
Punjab 26.5 34.7 32.4 29.4 38.5 35.9
Sindh 19.0 37.1 29.2 24.1 30.8 27.6
NWFP 29.2 44.9 42.6 37.0 40.6 40.0
Balochistan 28.4 24.0 24.6 26.7 20.9 22.0
Azad J & K 14.5 15.7 15.6 . . .
Northern Areas 22.6 37.9 36.5 . . .
FATA . 44.5 44.5 . . .
National 22.4 36.0 32.3 28.0 36.9 34.0
Inequality Measures:
The inequality situation in the NWFP in terms of income/consumption, literacy,
Table 4: Inequality Measures (Household Expenditure per Adult Equivalent)
1988 1999
Gini Coefficients
NWFP 0.31 0.36
Urban 0.35 0.43
Rural 0.30 0.33
Income Share of Lowest 20% Population
NWFP 9.5 8.7
Urban 8.9 6.6
Rural 9.7 9.3
Income of Highest 20% Population
NWFP 41.1 45.5
Urban 45.2 50.9
Rural 40.2 42.8
Ratio Highest to Lowest
NWFP 4.3 5.2
Urban 5.1 7.8
Rural 4.2 4.6
Source: SPDC (2001). Annual Review
education expenditures and housing is summarized in tables 4 to 7:

50
Table 5: Inequality In Literacy - [Highest to Lowest Ratio – Per Capita Income
Quintiles] Male Female Total
INEQUALITY IN LITERACY
NWFP 1.92 3.37 2.30
Urban 1.69 2.76 2.06
Rural 2.15 3.99 2.53
INEQUALITY IN PRIMARY ENROLMENT RATIO
NWFP 1.58 2.74 1.94
Urban 1.33 2.35 1.64
Rural 1.83 3.12 2.24
INEQUALITY INSECONDARY ENROLMENT RATIO
NWFP 1.98 4.23 2.42
Urban 1.95 2.49 2.14
Rural 2.02 5.98 2.70
Source: SPDC (2001). Annual Review
Table 6: Inequality In Per Pupil Expenditure On Primary And Secondary
Education [Highest to Lowest Ratio – Per Capita Income Quintiles] Ratio
Primary Education
NWFP 7.07
Urban 7.79
Rural 6.35
Secondary Education
NWFP 6.11
Urban 7.01
Rural 5.22
Source: SPDC (2001). Annual Review
Table 7: Inequality In Housing Services [Highest to Lowest Ratio Per Capita
Income Quintiles] Electricity Gas Telephone Piped Water House
connected to
underground
sewerage
NWFP 1.59 3.02 10.14 1.55 5.52
Urban 1.38 4.13 7.10 1.52 5.52
Rural 1.80 1.91 13.19 1.59 --
Source: SPDC (2001). Annual Review
Characteristics of the Poor
Understanding the nature of poverty requires looking beyond the limits of poverty as
defined by lack of consumption, and examining the characteristics of poor households to
identify the non-income dimensions of poverty. In this context, it is useful to draw
correlations between consumption/income poverty and various household characteristics.
Although such correlations will not be enough to establish a causal relationship, they do

51
help address the question of who the poor are, as well as provide rough indications about
why they are poor.
Table 8: Poverty Headcount by Household Size Categories: NWFP (1998-99)
Household Size Urban Rural Overall
1-2 0.0 2.7 2.3
3-5 8.4 20.8 18.9
6-7 18.3 37.2 34.0
8-10 44.0 49.9 49.1
11-15 40.1 60.0 56.9
>=16 39.4 61.6 58.6
Firstly, the poor are more likely to live in larger households (Table 8). Poverty
incidence is found to increase rapidly as household size increases: - from a headcount rate
of well below 20% for households of size 5 and below, to 34% for those of size 6 to 7,
and 57% for those of size 11 and above. While these simple calculations do not take into
account the well-known “scale factor” in consumption, which tends to underestimate the
per person consumption in large households vis-à-vis smaller ones, the differences in
poverty incidence in Table 8 are large enough to reflect a true negative correlation
between household size and poverty.12
Poverty is expected to be strongly associated with lack of asset ownership, an important
component of which is agricultural land in rural areas. The average size of agricultural
land owned by poor households is 0.25 hectares in rural NWFP, compared to 0.71
hectares for the non-poor. As might be expected, and following the pattern seen in
national figures, rural poverty headcount falls as the size of land holdings increases.
However, the decline in poverty incidence is marginal as landholdings increase up to 2
hectares—headcount falls from 48% among landless households to 44% among those
with 1 to 2 hectares of land—and then sharp, to 33% among those with 2 to 4 hectares,
and 12% among those with more than 4 hectares of land (Table 9). This suggests that
small and marginal landholders are almost equally poor as those who own no land, while
poverty among large landowners is significantly lower.
Table 9: Rural Poverty Headcount by Household Land Ownership (1998-99)
Land Ownership Category Poverty Headcount % of Population in Category
Rural Pakistan Rural NWFP Rural Pakistan Rural NWFP
No Land Owned 40.3 47.7 61.4 54.9
>0 – 1 hectare 33.8 44.9 18.4 35.6
>1 – 2 hectare 29.5 43.6 5.9 4.4
>2 – 4 hectare 22.4 33.3 7.0 3.7
> 4 hectare 12.8 11.5 7.3 1.5
12
The “scale factor” of the household is not taken into account, since consumption is computed on a per equivalent
adult basis. In other words, the possibility that larger households enjoy economies of scale in consumption would mean
that these may actually be less poor than the calculations here reveal. Adjusting for this kind of bias, however, is
difficult, since it will require detailed knowledge of consumption of individual household members – not available
from standard household expenditure surveys.
52
There are a few observations that can be made on comparing the pattern of landholdings
in NWFP vis-à-vis the rest of the country. Table 9 suggests that Poverty is expected to
be strongly associated with lack of asset ownership, an important component of which is
agricultural land in rural areas. The average size of agricultural land owned by poor
households is 0.25 hectares in rural NWFP, compared to 0.71 hectares for the non-poor.
As might be expected, and following the pattern seen in national figures, rural poverty
headcount falls as the size of land holdings increases. However, the decline in poverty
incidence is marginal as landholdings increase up to 2 hectares—headcount falls from
48% among landless households to 44% among those with 1 to 2 hectares of land—and
then sharp, to 33% among those with 2 to 4 hectares, and 12% among those with more
than 4 hectares of land (Table 9). This suggests that small and marginal landholders are
almost equally poor as those who own no land, while poverty among large landowners is
significantly lower. For the country as a whole, 61% of the rural population belongs to
households that own no land, while 7% has landholding of 4 hectares or more. The
corresponding numbers are 55% and 2% for rural NWFP, suggesting that land ownership
is less concentrated than for the rest of the country. Moreover, as Table 9 shows, a large
majority of landowners (36% of the rural population) in NWFP belong to the category of
small and marginal farmers, namely those who own between 0 and 1 hectare of land,
compared to the country on an average (18% of the rural population).
The relatively low land inequality in NWFP also comes through from looking at average
landholdings of the poor and the non-poor. The poor, on the average (median), own 0.25
hectares of land in rural NWFP, compared to 0.71 hectares for the non-poor, while the
corresponding figures for the country are 0.4 hectares and 1.4 hectares respectively.
Thus, lower inequality aside, both the poor and non-poor in NWFP own less land than the
same groups in the rest of the country on the average, a fact that is entirely consistent
with the previous observation that there are relatively few large landowners in NWFP.
The implications of low concentration of land ownership, and the prevalence of small
landholdings for agriculture productivity and poverty is important to consider,
particularly in the context of the high rate of rural poverty observed in NWFP. This is
however too complex a question and needs to be one of the subjects of a detailed analysis
of the rural economy of NWFP. Such an analysis should also seek to identify the key
constraints to rural incomes and productivity in the province – whether the issue of access
to land is of crucial importance, or whether other factors, like lack of access to factors
like infrastructure including irrigation and credit, play equally critical roles.
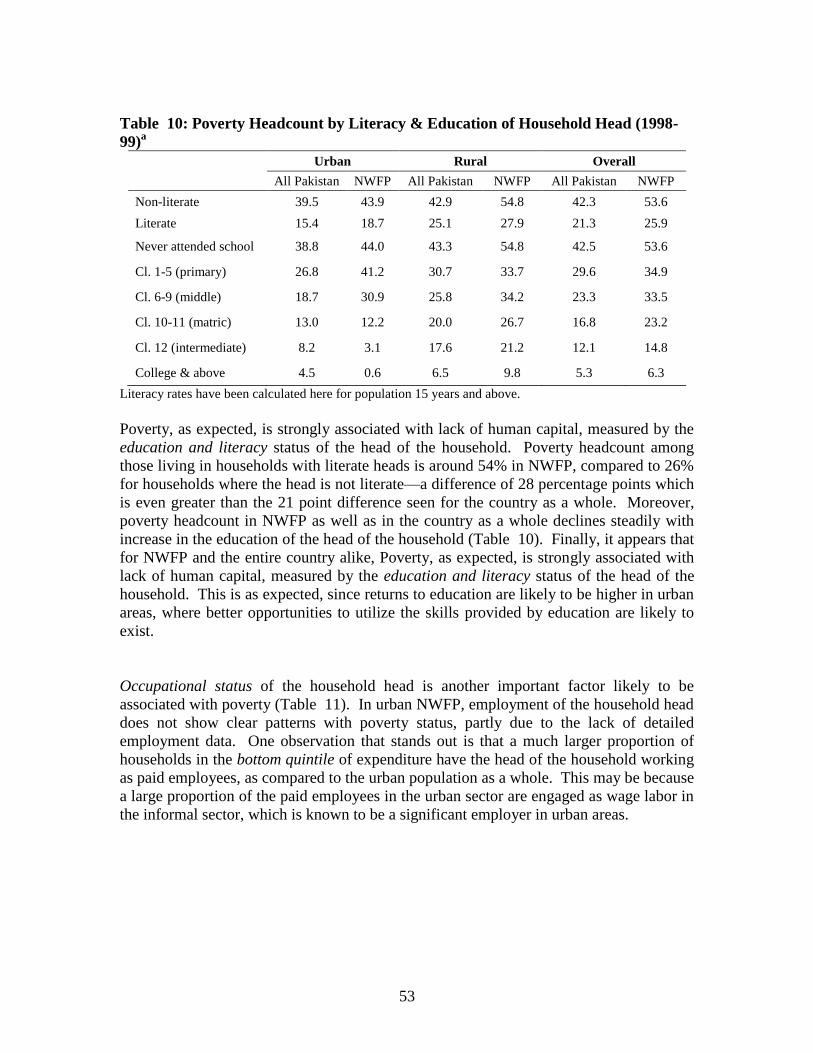
53
Table 10: Poverty Headcount by Literacy & Education of Household Head (1998-
99)a
Urban Rural Overall
All Pakistan NWFP All Pakistan NWFP All Pakistan NWFP
Non-literate 39.5 43.9 42.9 54.8 42.3 53.6
Literate 15.4 18.7 25.1 27.9 21.3 25.9
Never attended school 38.8 44.0 43.3 54.8 42.5 53.6
Cl. 1-5 (primary) 26.8 41.2 30.7 33.7 29.6 34.9
Cl. 6-9 (middle) 18.7 30.9 25.8 34.2 23.3 33.5
Cl. 10-11 (matric) 13.0 12.2 20.0 26.7 16.8 23.2
Cl. 12 (intermediate) 8.2 3.1 17.6 21.2 12.1 14.8
College & above 4.5 0.6 6.5 9.8 5.3 6.3
Literacy rates have been calculated here for population 15 years and above.
Poverty, as expected, is strongly associated with lack of human capital, measured by the
education and literacy status of the head of the household. Poverty headcount among
those living in households with literate heads is around 54% in NWFP, compared to 26%
for households where the head is not literate—a difference of 28 percentage points which
is even greater than the 21 point difference seen for the country as a whole. Moreover,
poverty headcount in NWFP as well as in the country as a whole declines steadily with
increase in the education of the head of the household (Table 10). Finally, it appears that
for NWFP and the entire country alike, Poverty, as expected, is strongly associated with
lack of human capital, measured by the education and literacy status of the head of the
household. This is as expected, since returns to education are likely to be higher in urban
areas, where better opportunities to utilize the skills provided by education are likely to
exist.
Occupational status of the household head is another important factor likely to be
associated with poverty (Table 11). In urban NWFP, employment of the household head
does not show clear patterns with poverty status, partly due to the lack of detailed
employment data. One observation that stands out is that a much larger proportion of
households in the bottom quintile of expenditure have the head of the household working
as paid employees, as compared to the urban population as a whole. This may be because
a large proportion of the paid employees in the urban sector are engaged as wage labor in
the informal sector, which is known to be a significant employer in urban areas.

54
Table 11: Distribution of Population by Expenditure and Occupation of Household
Head (NWFP) (%)
Consumption
Expenditure
Group
Not
working Employer
Own
account
worker/self-
employed
Unpaid
family
worker
Paid
employee
Owner
Cultivator
(<1 hec
land)
Owner
Cultivator
(1 to <2 hec
land)
Owner
Cultivator
(2 to <4 hec
land)
Owner
Cultivato
r (>4 hec
land)
Share-
cropper
RURAL
Bottom Quintile
1 20.1 0.3 16.9 0.7 27.3 24.8 0.7 1.4 0.0 7.9
Quintile 2 26.7 1.6 16.5 0.5 28.8 13.3 2.2 1.2 0.0 9.2
Quintile 3 18.7 1.7 15.0 0.7 31.2 18.2 5.1 1.5 0.4 7.6
Quintile 4 22.6 1.3 15.4 0.5 28.3 22.3 1.3 0.7 0.4 7.3
Top Quintile 5 35.6 1.7 15.8 0.6 22.0 12.8 2.0 1.1 1.2 7.2
Overall
population 24.7 1.3 15.9 0.6 27.5 18.3 2.3 1.2 0.4 7.9
Mean Monthly
p.c.
Consumption
(Rs.)
828 1067 720 661 699 669 688 703 1467 656
URBAN
Bottom Quintile
1 23.3 0.1 25.9 0.0 47.0 1.4 0.5 0.0 0.0 1.8
Quintile 2 19.7 0.0 25.9 0.7 39.1 11.5 1.2 0.0 0.0 1.9
Quintile 3 33.9 2.6 21.4 0.0 35.6 2.7 1.5 0.0 0.0 2.3
Quintile 4 30.6 1.5 30.4 0.0 30.0 2.5 0.0 0.4 0.0 4.7
Top Quintile 5 28.1 3.9 29.1 0.0 37.5 0.4 0.0 0.0 0.2 1.0
Overall
population 27.1 1.6 26.5 0.2 37.9 3.7 0.7 0.1 0.0 2.3
Mean Monthly
p.c.
Consumption
(Rs.)
1137 1267 1106 706 1028 724 672 1385 3168 868
In rural NWFP, the poor households are relatively more likely to be headed by
individuals working as a paid employee. A majority of paid employees are likely to be
wage in labor in farms, or as an owner-cultivator with less than 1 hectare of land. For
instance, while 25% of the bottom expenditure quintile lives in households whose head
belongs to the latter category, only 13% of the top quintile does so. Again, however, the
pattern of employment does not tell a clear story of relationship between employment and
incidence of poverty.
The poor in NWFP also suffer from lack of connectivity to a number of services, which
has direct implications for their human development. As Table 12 portrays, the poor
have relatively low access to safe drinking water and sanitation facilities: they are less
likely to use closed sources of drinking water and be connected to a drainage system. As
expected, the poor are also less likely to be connected to electricity.

55
Table 12: Access to Amenities, Including Sanitation, Drinking Water, Electricity,
etc. (1998/99) (% of Population with Access in Each Case)
Closed/Piped
Source for
Drinking Water13
Connected
to Any
Drainage
System14
Connected to
Electricity Literacy
Net
Enrollment
Rate
NWFP
Poor 50.1 28.3 72.1 22.7 38.0
Non-poor 64.7 40.2 81.7 40.7 58.9
Rural 53.6 27.3 74.5 30.2 45.8
Urban 85.4 80.1 94.6 50.2 66.5
Overall 58.3 35.1 77.5 33.4 48.6
All Pakistan
Rural 74.1 30.7 63.3 33.5 45.2
Urban 94.2 89.1 92.4 63.1 66.5
Overall 79.8 47.1 71.5 42.5 50.5
Availability of all these amenities is characterized by large rural-urban gaps in NWFP,
just like for the country as a whole (Table 12). Also, in terms of access to safe water and
connectivity to drainage, NWFP both urban and rural sectors alike, fare significantly
worse than the country as a whole. Only 58% of the population in NWFP uses piped or
closed sources for drinking water as opposed to 80% for the country and while 35% of
NWFP is connected to any form of drainage system, the same is true for 47% of Pakistan.
Low access to critical amenities in NWFP—combined with the fact that the poor suffer
from severe lack of connectivity to these facilities, and also that poverty in this province
is higher than the country average – would necessarily mean that the income poverty is
also associated with a high degree of health risk in the province. That said, as Table 12
shows, in terms of connectivity to electricity, NWFP does much better than the average
for the rest of the country in both urban and rural areas.
Non-Income Dimensions of Poverty: Human Development
Poverty is multi-dimensional, manifested not only in low levels of consumption, but also
that of human capital, exacerbated by the inability to undertake investments to improve
skills. Exploring the human dimensions of poverty would thus be critical in
understanding not only the nature and extent of deprivation in NWFP, but also the extent
to which such deprivations translate into lack of capability to enhance future economic
opportunities. As might be expected, the poor in NWFP are characterized by relatively
low levels of human development, as indicated by various education and health
13
Includes piped water, and outside, closed water sources. These sources of drinking water are potentially safer than
the alternative: “outside, open” source. However, access to potentially safer sources does not guarantee safety of the
drinking water from these sources. The proportion of population with using piped/outside open sources is thus merely
indicative of the proportion of the population with access to safe drinking water. 14
Includes underground, as well as open drain systems.

56
indicators. Table 13 shows that in urban and rural areas alike, poor households have
lower literacy rates among members (23% of all poor are literate, compared to 41% of the
non-poor), and lower net primary enrollment rates (38% among the poor, compared to
59% among the non-poor).
It is also important to note—from Table 13—that for NWFP, almost every education or
female health indicator is found to be lower than the corresponding country average. For
instance, female literacy rates in rural and urban NWFP are 11% and 35% respectively,
compared to the already low country averages of 17% and 52% respectively; pre-natal
consultation rates in rural and urban NWFP are 20% and 36% respectively, compared to
country averages of 22% and 60% respectively. As far as rural-urban gaps are
concerned, they exist for all indicators in NWFP, but tend to be smaller than those for the
country as a whole. This should however not be construed as a positive feature, since the
smaller gaps in NWFP are mostly caused by its urban areas lagging behind the rest of the
country, rather than by the rural areas doing better than the rest of the country.
Table 13: Selected Human Development Indicators (1998-99)
Male
Literacy
Rate
(%)a
Female
Literacy
Rate (%)a
Male Net
Primary
Enrollment
Rate (%)
Female Net
Primary
Enrollment
Rate (%)
Pre-natal
Consultation
Rate (% of
Pregnancies)
Ever Use
Contraception
(% of Married
Women of Age
15-49) b
Rural:
NWFP 51.5 11.4 57.9 32.8 19.6 13.9
Pakistan 51.0 16.8 53.6 36.4 22.0 14.3
Urban:
NWFP 65.5 35.2 73.4 59.3 36.0 27.2
Pakistan 73.2 52.3 68.5 64.6 60.1 34.1
Overall
NWFP 53.8 15.1 60.0 36.4 21.6 15.8
Pakistan 58.0 27.2 57.2 43.6 31 19.5
Literacy rates have been calculated here for population 15 years and above.
Comparing the education indicators of NWFP with the country averages, it is also
apparent that while adult literacy rates in the province (33% on the whole) are found to
lag far behind those for Pakistan (43%), the gap with the rest of the country is marginal
for enrollment rates (49% for NWFP, and 51% for Pakistan). This suggests that although
the spread of education in NWFP has historically been deficient, there is reason to be
optimistic about the future, as rising enrollment rates close the gap in educational
attainment between the province and the rest of the country. However, this optimism
must be tempered by the observed gender gaps: while male net primary enrollment rates
for NWFP are higher than the corresponding country averages for rural and urban areas
alike, female enrollments still lag behind those for Pakistan.
Gender gaps are significant for all relevant indicators in NWFP, as they are for the
country as a whole. Following the pattern seen in the country, gender gaps tend to be
wider in rural areas than in urban areas of NWFP. Moreover, gender gaps in NWFP are
found to be more severe than for the country as a whole. For instance, the gender gap in

57
literacy rates in rural and urban NWFP are equal to 40 and 30 percentage points
respectively, compared to corresponding gaps of 34 and 21 percentage points for the
country. The fact that a similar picture emerges for primary enrollment rates also
suggests that under present conditions in NWFP, gender gaps in educational attainment
are likely to persist, and even widen in the future.15
, unless corrective action is taken.
Further analyses have revealed that gender gaps in Pakistan, as well as for individual
provinces, tend to be similar for both poor and non-poor households. However, since
educational attainment among the poor is generally low in the first place, large gender
gaps necessarily translate into particularly low literacy and enrollment rates among poor
women, with adverse implications for future human development – since women’s
education is known to be especially critical for child health and education.
Looking across the spectrum of human development indicators, a consistent pattern that
emerges is one of rural and urban areas alike in NWFP comparing poorly with the
corresponding areas of the rest of the country on the average. The story of NWFP
lagging behind on most indicators of human development is entirely consistent with that
of income/consumption poverty, where both urban and rural areas of NWFP are found to
be poorer, on the average, than corresponding areas in the country taken as a whole.
Access to Schools and Health Facilities in Rural NWFP
Table 14: Access to Schools in Rural Areas (% of Rural Population) (1998-99)16
Punjab Sindh NWFP Balochista
n Azad J&K
Rural
Pakistan
Nearest Girls’ Primary School
In PSU or <=1 km distance17
90.2 45.6 91.1 41.3 100.0 78.7
Distance >1 & <6 km 7.2 22.0 5.7 6.1 0.0 9.7
Distance >=6 km 2.6 32.4 3.2 52.7 0.0 11.6
Nearest Boys’ Prim School
In PSU or <=1 km distance 95.0 94.8 99.6 90.5 100.0 95.4
Distance >1 & <6 km 4.0 4.8 0.4 3.5 0.0 3.4
Distance >=6 km 1.0 0.4 0.0 5.9 0.0 1.1
Among the number of factors that may constrain human development in rural NWFP,
access to facilities is potentially important, and also measurable from existing data
sources. As Table 14 shows, on availability of education facilities in rural areas,
15 The gender gap in net primary enrollment rates in rural and urban NWFP are equal to 25 and 14 percentage points
respectively, compared to corresponding gaps of 18 and 4 percentage points for the country 16 Access to schools here refers to the presence of any school (public/private/NGO/religious). The proportion of public
schools, however, in rural areas is high in the total number, so that the access figures in Table 9 do not change much if
only public schools are included. 17 PSU refers to Primary Sampling Unit of the survey, which in rural areas is the village.

58
Table 15: Access to Health Facilities in Rural Areas by Province (1998-99)
% of Rural Population with Health Facilities in
PSU/village % of Rural
Popl. with
Family
Planning
Facility within
3 km. of PSU
Hospital,
Dispensary
or Clinic18
Hospital,
Dispensary,
Clinic or Health
Worker
Any Health
Facility or
Worker19
Punjab 38.2 54.4 70.8 79.6
Sindh 36.9 56.5 62.5 65.3
NWFP 54.3 63.5 75.9 72.1
Balochistan 54.9 58.1 60.4 60.9
Azad J & K 55.9 68.1 71.3 81.7
Rural Pakistan 42.0 56.4 69.1 73.5
NWFP in fact fares rather well, not only relative to rural Pakistan, but also in absolute
terms. For instance, for more than 91% of the population of rural NWFP, the nearest
primary school for girls is 1 km or less distant from the village they live in, compared to
79% of the population of entire rural Pakistan. Moreover, almost the entire rural
population of NWFP lives in villages where the nearest primary school for boys is 1 km.
or less distant.
On access to rural health facilities, a similar story prevails for rural NWFP vis-à-vis the
rest of the country (Table 15). By any definition of health facility, rural NWFP enjoys
better availability than rural Pakistan on the average.20
Around 76% of the rural
population of NWFP lives in villages with some kind of health facility or health worker,
which is the highest among all provinces. Access to family planning services is however
slightly low for NWFP than for rural Pakistan as a whole.
Thus on the whole, rural NWFP compares well with the rural parts of the country as a
whole in terms of incidence or availability of health and education facilities. This is
encouraging by itself, and can be expected to lead to better education and health
indicators in the long run. At present however, the relatively high availability of facilities
does not appear to translate into commensurate outcomes in health and education where,
as seen above, NWFP tends to lag behind the rest of the country. While the higher
(relative to the country) rural male primary enrollment rate in NWFP is consistent with
the almost universal availability of male primary education, female primary enrollment in
NWFP lag behind rural Pakistan, in spite of far higher incidence of girls’ schools in the
province.
18 All public and private hospital, dispensaries and clinics (including BHUs, RHCs, Mother & Child Clinics, and
Family Welfare Clinics). 19 Includes private practitioners and nurses 20 Various definitions of health facilities include combinations of hospital, dispensary, clinic, health worker, private
practitioners, and nurses.

59
This apparent puzzle may be explained by a number of factors. Social and cultural
mores, particularly as they relate to demand for girls’ education or use of health services
for females, may play a role; lack of income or wealth may also depress demand for
education.21
Equally important is the fact that the figures listed above are but imperfect
measures of access. Firstly, the mere presence of a facility is not enough to guarantee
quality, or even that the facility is functional. Quality problems in education and health
facilities, according to a number of studies, are rampant in Pakistan, and the conditions in
NWFP are similar which can be ascertained only after careful study. Secondly, these
measures do not account for the exclusion of social groups, which are also likely to have
high concentration of poverty, from services and facilities. Both these problems can
significantly reduce the effectiveness of services for the poor and disadvantaged groups,
thereby affecting their potential to develop skills and enhance future economic
opportunities. Recapping the above, the PRP is attempting to address the quality and
governance aspects, to improve service delivery of education and health.
21 Regression analyses have shown household’s economic status to be an important determinant of school participation,
for entire Pakistan and individual provinces alike.

60
Annex II
Gender Disparities in NWFP
Education:
Literacy rate and educational statistics indicate the presence of wide gender disparity in
NWFP.
Table 1: Population that has ever attended school 1995-96 1996-97 1998-99 2001-02
Male Female Male Female Male Female Male Female
Urban Pakistan 80 57 78 57 79 60 78 61
NWFP 80 44 74 41 74 44 79 47
Rural Pakistan 63 25 61 25 59 23 60 25
NWFP 62 21 62 22 61 19 65 21
Overall Pakistan 69 35 66 35 66 34 66 36
NWFP 66 25 64 26 64 23 67 25
Source: PIHS (Various issues)
The above table reveals a huge gender disparity in the population that has ever attended
school. This gap is much higher in rural NWFP with a difference of 44 % between male
and female percentage as compared to urban areas where the difference is 32%. Over the
years, both rural and urban figures show somewhat similar trends with no considerable
difference in the gender gap.
Table 2: Population ever attended school by expenditure group and gender 2001-02 NWFP Urban areas Rural areas
Male Female Male Female
1st Quintile 62 24 54 12
2nd Quintile 71 32 59 18
3rd Quintile 75 41 66 20
4th Quintile 82 50 72 24
5th Quintile 91 67 84 41
Over all 79 47 65 21
Source: PIHS 2001-02
The table reveals an increasing trend in both male and female figures for population that
has ever attended school with an increase in income. However the difference between
male and female figures does not change by a considerable amount across income groups.
Whereas in urban areas this difference slightly decreases moving towards the higher
expenditure quintile, the opposite is true for rural areas where this difference increases
with an increase in the expenditure quintile.

61
Table 3: Literacy-population ten years and older by gender 1995-96 1996-97 1998-99 2001-02
Male Female Male Female Male Female Male Female
Urban Pakistan 66 49 65 50 73 56 72 56
NWFP 58 31 58 34 66 40 70 41
Rural Pakistan 45 16 44 17 52 20 51 21
NWFP 40 11 43 13 54 16 55 16
Overall Pakistan 52 26 51 28 59 31 58 32
NWFP 43 14 46 17 56 20 57 20
Source: PIHS (Various issues)
Literacy rate in both urban and rural regions of NWFP has increased however gender
disparity has persistently remained stagnant despite over all improvement in both male
and female literacy ratios. Except for male literacy in rural areas in 98-99 and 2001-02,
NWFP indicators have never surpassed the national figures.
Table 4: Literacy rate by expenditure group and gender 2001-02 NWFP Urban areas Rural areas Overall
Male Female Male Female Male Female
1st Quintile 47 19 43 7 44 8
2nd Quintile 59 24 48 13 50 14
3rd Quintile 66 34 55 15 56 17
4th Quintile 71 44 62 20 64 24
5th Quintile 87 63 78 36 81 44
Total 70 41 55 16 57 20
Source: PIHS 2001-02
Whereas both male and female literacy across regions increases with an increase in the
expenditure quintile, one witnesses little change in gender differences. The rural and
urban disparity is greater for female figures than the male ones.
Table 5: Gross enrolment rate by region and gender 1995-96 1996-97 1998-99 2001-02
Male Female Male Female Male Female Male Female
URBAN AREAS 95 90 95 91 95 92 94 87
NWFP 88 82 99 70 97 83 100 86
RURAL AREAS 81 54 74 53 75 50 80 52
NWFP 79 42 70 52 82 49 96 52
OVERALL 85 64 80 64 80 61 83 61
NWFP 80 49 74 55 84 54 97 56
Source: PIHS

62
Table 6: Gross enrolment rate by expenditure group and gender 2001-02 Urban areas Rural areas
Male Female Male Female
1st Quintile 89 46 87 38
2nd Quintile 89 77 87 48
3rd Quintile 90 88 98 60
4th Quintile 119 104 119 55
5th Quintile 117 101 105 78
Source: PIHS 2001-02
The gross enrollment ratio shows much higher levels of gender disparity in rural regions
than urban. The GER increases with an increase in the expenditure quintile for both male
and female population. In urban areas gender disparity slowly decreases with an increase
in the expenditure quintile, however rural areas do not show any particular pattern.
Highest gender disparity persists in the 4th
quintile in rural areas.
Health:
Table 7: Infant Mortality Rate Deaths/1000 births
1996-97 1998-99
Male Female Male Female
Urban Pakistan 82 85 77 68
NWFP 94 60 101 57
Rural Pakistan 108 117 99 91
NWFP 79 68 61 57
Overall Pakistan 101 108 93 85
NWFP 81 67 67 57
Source: PIHS (Various issues)
There has been a decline in both male and female infant mortality rate in NWFP between
96-97 and 98-99. Male infant mortality has been lower than national figures in rural areas
and higher in the urban areas. Female infant mortality in NWFP has been lower than male
infant mortality across regions. Female infant mortality in NWFP has been lower in both
urban and rural areas than the national figures.

63
Labor force participation:
Table 8: Percentage distribution of employed persons by employment status by
gender Overall Urban Rural
Male Female Male Female Male Female
Employer 1.15 0.00 1.76 0.00 1.04 0.00
Self employed 14.46 1.57 23.09 2.16 12.97 1.46
Unpaid family helper 14.38 8.59 11.21 0.70 14.93 9.95
Employee 34.32 4.59 48.53 8.56 31.87 3.90
Owner Cultivator 14.18 1.44 2.59 0.00 16.18 1.68
Share cropper 3.89 0.29 1.02 0.00 4.39 0.34
Contract cultivator 0.92 0.07 0.38 0.00 1.01 0.08
Source: HIES 1998-99
Generally female employment status in NWFP across all categories is lower than male
employment status. The table indicates that mostly male members in rural and urban
areas are employees, unpaid family helpers or self-employed. In rural areas a
considerable percentage of employed male population comprises of owner cultivators.
These figures are extremely low for the female population. In urban areas the female
population consists of either employees, self employed or unpaid family helpers whereas
in rural areas majority of the women are unpaid family helpers. Whereas 16.18 percent of
male employed persons in rural areas are owner cultivators, merely 1.68 percent of the
women have similar employment status.
Table 9: Percentage distribution of employed persons, average monthly income and
income share NWFP Urban NWFP Rural NWFP
% of
employe
d
persons
Av
income
contribu
ted
%
income
share
% of
employe
d
persons
Av
income
contribu
ted
%
income
share
% of
employ
ed
persons
Av
income
contribu
ted
%
income
share
Head of household
Total 43.13 2563 61.52 44.55 4321 63.17 42.89 2251 61.23
Male 41.42 2535 59.68 42.99 4270 61.25 41.15 2227 59.39
Female 1.71 28 1.84 1.56 52 1.91 1.74 24 1.83
Other than head of household
Total 56.87 2115 38.48 55.45 2993 36.83 57.11 1959 38.77
Male 41.28 1837 31.8 45.14 2465 31.30 40.62 1726 31.89
Female 15.59 278 6.68 10.31 529 5.53 16.49 233 6.89
Source: HIES 1998-99
Average income contribution by female heads of household is much less than their male
counterparts. There is wide regional disparity for both male and female heads. Similar
trends obtain for family earners other than the head of households. Female average
income contributions are extremely low, so much so that they are almost negligible as
compared to the total figures.

64
ANNEX IlI: POLICY MATRIX-NWFP STRUCTUREAL ADJUSTMENT PROGRAM FY2003-05 Reforms Area and Outcomes Actions Taken Medium Term Measures for FY 2003-05
Strengthening Accountability and Professionalism of State Institutions
Devolution
A decentralized administration responsive
to local needs and a devolved political
structure.
Increased competence and professionalism
of local government staff.
Staffing of Districts and Tehsil Governments
completed.
Rules of Business for District Councils
implemented.
Local Government Contract Rules notified.
Dist/Tehsil Provincial Accounts established.
Review and complete the implementation of district Rules of Business and
needed codes (FY03).
Establish a Local Government Commission (FY03).
Strengthen district government staffing and staff training (FY03-FY04).
Institute E-Government in all departments and districts (FY03-05).
Restructuring and down-sizing
Lean policy-oriented government at the
provincial level.
Efficient business processes. Better staffing
mix with smaller proportion of lower grade
staff.
Recruitment ban maintained, excepted for
social sectors as needed.
26 Departments/attached departments have
been restructured and more than 6000
sanctioned posts abolished at the Provincial
level.
Revision of the Provincial Rules of Business
to modernize business processes initiated.
Surplus Pool Policy established.
Complete annual review of the restructuring, downsizing, and account
reforms (FY03-FY05).
Complete staff rationalization between local and provincial governments
(FY03-FY05).
Notify and implement the revised Rules of Business (FY-03).
Complete the disposition of the provincial surplus pool (FY04).
Develop a program for reducing the proportion of lower grade staff relative
to officers (FY03).
Promoting merit and professionalism and
Improving Human Resource Management
Merit and performance-based personnel
recruitment and management.
Improved accountability, reduced
corruption and misconduct.
Flexible workforce.
Removal of ghost workers and tracking of
pension
The purview of NWFP Public Service
Commission (PSC) extended to contract-based
recruitment, has complete administrative
autonomy; budget flexibility increased.
District cadres for Health and Education
established.
A more transparent promotion system and
objective performance appraisal system for
senior grades introduced.
Stronger enforcement of Efficiency and
Discipline Rules and NWFP Removal from
Service Ordinance, against corrupt and
inefficient staff.
Compulsory retirement enforced for staff that:
have been superseded twice; had two penalties
imposed; had low performance grading, or are
known to be corrupt.
Comprehensive capacity building program for
provincial and district staff approved.
Reduce the time taken for recruitment of staff through PPSC to 4 months
(FY03).
Develop an action plan for creating district cadres for other sectors besides
Health and Education (FY03).
Amend 1973 Civil Servants Act or otherwise remove risk of regularization
of contract employees (FY03).
Pilot contract-based employment (FY03).
Significantly extend the average time in post of senior civil servants
(FY04).
Hold a civil service census (FY03004).
Build HR database by: (i) completing the computerization of all district and
departmental payrolls (FY03); (ii) linking databases to provide central HR
database to Finance (FY03); (iii) verifying against civil service census
(FY04); and (iv) using database to assess government pension liabilities
(FY04).
Implement capacity building program (FY03-05).

65
Judicial Reforms
Improved system of justice
Complete independence of the Judiciary
from the executive.
Increased access to justice.
Specialized performance of judicial and
prosecutorial functions.
Judicial Service Rules revised.
Chief Justice of High Court made the
appointing authority for lower level Judges.
The Judiciary separated from the Executive,
and provided financial and recruitment
autonomy.
Establish Family Courts to handle family laws and disputes. (FY03-04).
Establish separate courts for minor civil cases (FY03-04).
Establish a training program for the judicial staff (FY03).
Standardize recruitment and personnel management of judicial staff (FY03-
04).
Strengthen the Law Department (staffing and facilities) to enable it to
properly perform its expanded functions (FY03-04).
B. Accelerating Human Development
Education
Improved quality and access to education.
Increased overall gross school enrolment by
15%, and reduced drop-out rates by 10% by
FY05.
Improved learning environment.
Reduced gender disparity.
Improved delivery system.
Specialized school management.
Improved availability and quality of
textbooks.
Community involvement and support
ensuring student/teacher attendance,
maintenance of schools, and provision of
adequate instructional materials.
Better management capacity and efficiency
at the district level.
A standardized and objective student
assessment of educational quality.
Medium term institutional Reform Program
for education sector approved.
Program approved to bring the teacher,
student ratio to 1:40 through redeployment,
contract recruitment, and to start with hiring
of around 2,000 teachers in FY03.
To reduce gender disparity, 70% of the
education PSDP allocated for girls schools.
Program approved to provide missing basic
facilities to all girls primary schools by end-
FY03, and all schools by end-FY05.
Staff and facility rationalization exercise for
primary and secondary schools approved.
Frontier Education Foundation (FEF)
restructured.
School capacity expanded by using vacant
government buildings, operating evening
classes, using public-private partnerships,
encouraging (and regularizing) private and
community primary schools.
Introduced a regular mechanism for
monitoring and supervision of schools,
including teacher absenteeism, fully funded
EMIS, and a third party user survey.
Initiated separation of management and
teaching cadres.
District cadre of officials created.
Textbooks publication for grades 9-12
deregulated.
Approve PC-1s for implementing the reform program by July 2002, and
release initial funding by August 2002.
Provide MTBF programmed funding, including for IM&R and EMIS
(FY03-05).
Staff facility rationalization (FY03-05).
Maintain monitoring and supervision program (FY03-05).
Initiate third party user survey in October 2002.
Ensure that 1:40 teacher, student ratio is achieved through teacher
redeployment/new hiring (FY05).
Maintain the enlarged allocation (70%) for girls schools in the education
PSDP (FY03-05).
Provide adequate physical facilities in girls schools (FY03).
Carry out redeployment and needs-based contract recruitment by
September 2002.
Develop adequate linkages of the Frointier Educational Foundation with the
Education Department (FY03).
Expand capacity of secondary schools to encourage completion of primary
education for continuing education (FY03-05).
Complete separation of teaching and management cadres (FY03).
Complete district-based management and functional specialization (FY03-
04).
Expand deregulation and privatization of textbook publishing to cover
entire education sector (FY03-05).
Continue the results-based system of teacher evaluation (FY03-05).
Complete formation of PTAs in primary schools, strengthen their
functioning, and initiate secondary school PTA (FY03).
Expand English medium instruction based on experiences of pilot (FY03-
05).
Continue to improve and expand the student assessment system (FY03-05).
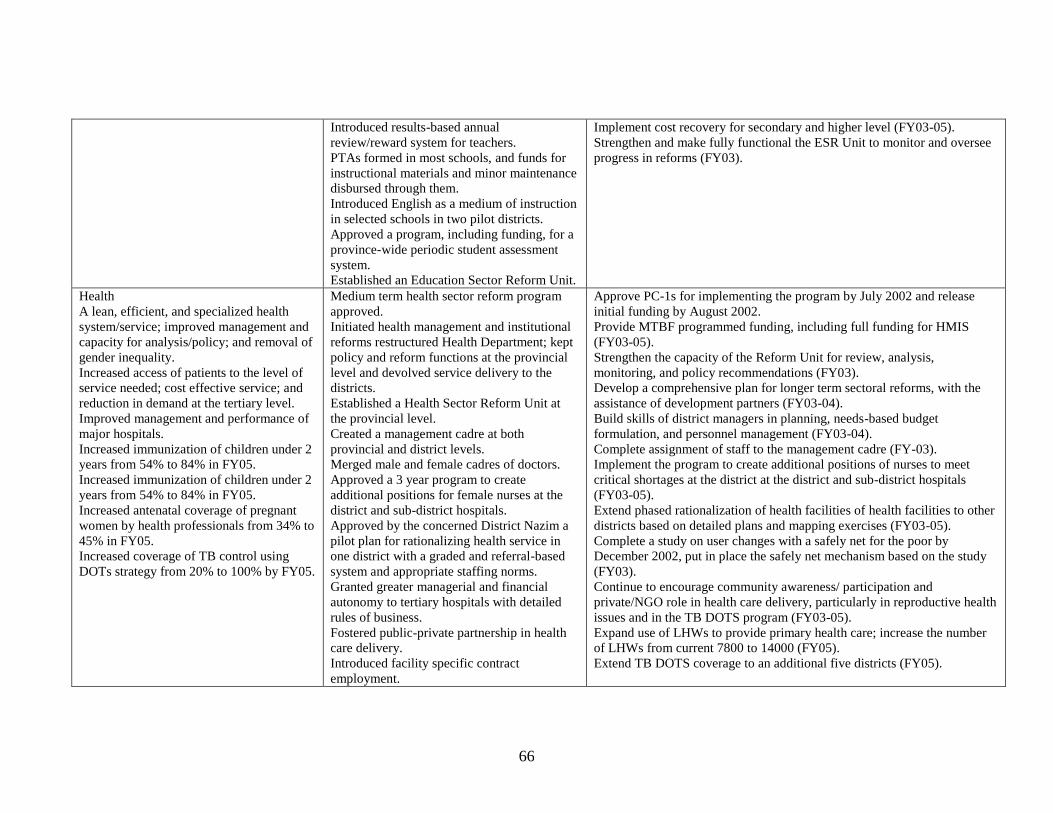
66
Introduced results-based annual
review/reward system for teachers.
PTAs formed in most schools, and funds for
instructional materials and minor maintenance
disbursed through them.
Introduced English as a medium of instruction
in selected schools in two pilot districts.
Approved a program, including funding, for a
province-wide periodic student assessment
system.
Established an Education Sector Reform Unit.
Implement cost recovery for secondary and higher level (FY03-05).
Strengthen and make fully functional the ESR Unit to monitor and oversee
progress in reforms (FY03).
Health
A lean, efficient, and specialized health
system/service; improved management and
capacity for analysis/policy; and removal of
gender inequality.
Increased access of patients to the level of
service needed; cost effective service; and
reduction in demand at the tertiary level.
Improved management and performance of
major hospitals.
Increased immunization of children under 2
years from 54% to 84% in FY05.
Increased immunization of children under 2
years from 54% to 84% in FY05.
Increased antenatal coverage of pregnant
women by health professionals from 34% to
45% in FY05.
Increased coverage of TB control using
DOTs strategy from 20% to 100% by FY05.
Medium term health sector reform program
approved.
Initiated health management and institutional
reforms restructured Health Department; kept
policy and reform functions at the provincial
level and devolved service delivery to the
districts.
Established a Health Sector Reform Unit at
the provincial level.
Created a management cadre at both
provincial and district levels.
Merged male and female cadres of doctors.
Approved a 3 year program to create
additional positions for female nurses at the
district and sub-district hospitals.
Approved by the concerned District Nazim a
pilot plan for rationalizing health service in
one district with a graded and referral-based
system and appropriate staffing norms.
Granted greater managerial and financial
autonomy to tertiary hospitals with detailed
rules of business.
Fostered public-private partnership in health
care delivery.
Introduced facility specific contract
employment.
Approve PC-1s for implementing the program by July 2002 and release
initial funding by August 2002.
Provide MTBF programmed funding, including full funding for HMIS
(FY03-05).
Strengthen the capacity of the Reform Unit for review, analysis,
monitoring, and policy recommendations (FY03).
Develop a comprehensive plan for longer term sectoral reforms, with the
assistance of development partners (FY03-04).
Build skills of district managers in planning, needs-based budget
formulation, and personnel management (FY03-04).
Complete assignment of staff to the management cadre (FY-03).
Implement the program to create additional positions of nurses to meet
critical shortages at the district at the district and sub-district hospitals
(FY03-05).
Extend phased rationalization of health facilities of health facilities to other
districts based on detailed plans and mapping exercises (FY03-05).
Complete a study on user changes with a safely net for the poor by
December 2002, put in place the safely net mechanism based on the study
(FY03).
Continue to encourage community awareness/ participation and
private/NGO role in health care delivery, particularly in reproductive health
issues and in the TB DOTS program (FY03-05).
Expand use of LHWs to provide primary health care; increase the number
of LHWs from current 7800 to 14000 (FY05).
Extend TB DOTS coverage to an additional five districts (FY05).

67
Developed and strengthened training
programs for Lady Health Workers (LHWs)
and community based paramedical workers,
including approval to hire 1800 additional
LHWs, and more female nursers.
Approved PC-1s for strengthening EPI (with
GAVI support), TB, and Malaria control
programs.
C. Improving Fiscal Sustainability and Restoring Financial Accountability
Fiscal Sustainability
A predictable and sustainable fiscal outlook
reduced debt burden;
increased fiscal space,
increased expenditure on priority service
delivery areas, and
increased fiscal discipline.
Approved the MTBF for FY 03-05.
Approval to establish a Budget Analysis Unit.
Pro-poor allocations/expenditures on track, as per agreed targets.
Implement FY03 Budget in accordance with MTBF.
Revise/extend MTBF annually for following three years.
Increase fiscal space for the province by: increasing own revenues,
systematically increasing user charges on various services, and containing
establishment budget.
Undertake comprehensive review of off-budget transactions and NWFP
contingent liabilities to strengthen medium term fiscal susteainability.
Tax and User Charges Reform
Increased fiscal space.
More efficient and equitable provincial
revenue system.
Increased cost recovery.
Greater Reliance on own revenues.
Introduced an income-based Agriculture
Income Tax (AIT).
Provincial taxes rationalized, reducing total
number from 22 to 9.
Restructured and enlarged the scope of the
urban immovable property tax (UIPT), with
rating areas increased from 18 to 27 and
valuation formula revised.
Outsourced and harmonized Motor Vehicle
Tax.
Enforced GST on Services.
Established a separate Excise and Taxation
(E&T) Department.
Increased irrigation water charges (Abiana) in
FY02 by 25%.
Approved study of AIT administration system
to be undertaken in FY03.
Achieve tax collections, including AIT, as per agreed targets.
Complete AIT study by December 2002, and initiate by April 2003
implementation to strengthen AIT collection.
Complete a study on taxation potential in the province. (FY03).
Increase own revenues, provincial, tax, non-tax revenues and user charges
by around 40% (FY05).
Revised Stamp Duty Schedule. (FY03).
Complete property tax survey (FY04).
Develop a water rate formula based on water volume supplied, starting with
new schemes (FY04).
Continue to implement phased increase in water rates to make at least
irrigation maintenance self-financed (FY05).
Expenditure Reforms
Improved expenditure prioritization; higher
priority allocations to social services.
Established a Road Maintenance Fund to
receive user charges and finance road
maintenance.
Restrict wheat procurement expenditures to maintenance of buffer stocks
(FY03).
Continue to adequately finance the agree program of social and other

68
Allocations based on performance and
projected needs.
Improved cost recovery.
Maintenance of public assets.
Better demand management.
Improved service delivery.
Increased the share of development,
education, and health expenditures in total
spending.
Significantly reduced the wheat subsidy.
Established a General Provident and a Pension
Fund to manage deferred liabilities.
Rationalized the development program by:
reducing the throw forward of projects by
65%, and number of projects by 213.
Freeze on new hiring, except for social
sectors, continued.
service (FY03-05).
Continue to improve service delivery and increase user charges for roads to
make the Fund self-financing by FY05.
Continue to increase/maintain the ratio of development expenditures.
Build up capital of Provident and Pension Funds (FY04-05).
Process Reforms
Greater budgetary discipline;
reduced red tape and multiple exercises,
improved expenditure analysis based on
economic functions.
Compressed the current three Department
expenditure submissions into one.
Substituted one mid-term Budget review
(excesses and surrenders) for the current two
reviews.
Reduced the red tape by computerizing budget
preparation.
Revised policy and procedure for timely
release funds.
Initiate preparation of program and performance budgeting in a few
Departments on a pilot basis (FY03).
Expand performance budgeting to all Departments by FY05.
Review and further simplify the budgeting process, including
computerization (FY03).
Refine the budgetary classification and make it an integral part of budget
documents (FY03-05).
Include economic classification of the Budget in the Annual Budget
Statement (FY04).
Fiscal Devolution
Complete devolution of fiscal functions in
line with political and administrative
devolution.
Appointed a Provincial Finance Committee.
KPP and SAP funds released according to
formula-based allocations in FY02.
Assigned adequate staff to districts for fiscal
management.
Establish standing Provincial Financial Commission (FY03).
Approve Provincial Finance Awards (FY03).
Separate District and Tehsil budgets (FY03).
Review fiscal performance of districts/tehsils each year and take steps to
improve processes, allocation basis, staffing, and training (FY03-05).
Allocate all development and non-salary funds according to formula based
allocations (FY03-05).
Public Financial Management and
Accountability
More reliable, comprehensive, and timely
information on provincial and district
government financial transactions.
Improved financial management at all levels
of government.
Increased credibility of provincial and local
government financial statements.
Improved internal controls, external audit,
Cabinet adopted a Financial Management and
Accountability Reform Program (FMARP)
that includes: (a) 100% reconciled provincial
and district “Public Financial Statements”
available to the public, (b) elimination of
unidentified expenditures and financing, (c)
strengthening of District Accounts Offices and
below (d) implementation of New Accounting
Model (NAM), with PIFRA systems, and (e)
computerization of payroll.
Appoint Provincial Financial Controller (September, 2002).
Complete PFAA and prepare a time bound detailed Action Plan (FY03-04).
Introduce NAM with the PIFRA computerized system, in all districts
(FY03-05).
Implement capacity development plan, including appointment recruitment,
and training of DAOs (FY03-05).
Phased improvement in reconciliation of Provident Fund accounts, and all
assets and liabilities to achieve 100% (FY05).
Publish financial statements (half yearly from FY04 and quarterly from
FY05) of district governments (FY04-05).

69
and legislative oversight.
More open and answerable government.
Public availability of financial information.
Decision taken to appoint Provincial Financial
Controller.
Provincial Public Accounts Committee (PAC)
established and decision taken to make it open
to public.
Decision to carry out a detailed Provincial
Financial Accountability Assessment (PFAA).
Upgraded the DAO position to grade 18, for
all major districts.
Establish an internal audit unit for each ministry department (FY03-05).
Amend/enact rules for timely submission of audit reports to provincial and
district PACs for timely review by them (FY03).
Track auditor’s and PAC recommendations for implementation using an
MIS (FY03-05).
The adhoc PAC commences sessions open to the public (FY03).
Annual implementation review of PAC and DAC directives (FY03-04).
Complete by December 2002 a review of the financial position including
any contingent liabilities of public enterprises. Abs, and similar bodies and
publish their annual accounts with FY04 budget (FY03-04).
Procurement
Improved public procurement.
Shortened procurement periods and reduced
irregularities and complaints.
Increase efficiency and transparency in
procurement.
New Procurement Ordinance legislating the
fundamental principles of good public
procurement, approved by Governor for
enactment.
Revise provincial procurement rules and manuals to standardize bidding
documents, establish an effective mechanism to redress complaints,
simplify the process, increase transparency and efficiency, and introduce a
code of conduct and ethics for public officials handing procurement
(FY03).
Initiate procurement training programs for government staff (FY03).
Autonomous Bodies (ABs/Public
Enterprises (PEs)
Complete disinvestments, better utilization
of public management capacity.
No public sector role in providing goods
and services; enhanced economic
efficiency, and reduced risk of fiscal drain.
Closed three Agricultural Abs (Agriculture
Development Authority, Fruit & Vegetable
Board, and Co-op Bank)
Decision taken for privatization of Bank of
Khyber.
Reduce share holding to less than 50% by FY04 and complete privatization
of Bank of Khyber (FY05), market conditions permitting.
Complete the legal closure of three Agricultural Abs (FY03).
Privatize small hydel projects (FY03-05).
Transparency and Public Access to Budget
Documents
Full transparency of fiscal position and
activities;
expanded inter-face of the government of
the government and the public.
Decision taken to make available the Budget
document through an authorized commercial
agent.
Annual Budget Statement on the Website.
Monthly Summary Fiscal Accounts on the
Website.
Continue/improve public access to Budget documents and their
transparency (FY03-05).
Improve coverage of fiscal accounts on the provincial website FY03-04).
D. Promoting Sustainable Growth
Private Sector Development
Streamlined and smaller public sector
agencies responsible only for promotion,
facilitation, necessary regulation,
information, and technical assistance.
A more liberalized, vibrant private sector
Established a Private Sector Deregulation
Committee composed of government,
business, and public representatives to review
the business and investment environment and
make recommendations.
Completed integration/merger of various
Complete a study on promoting private enterprise, including SMEs, in the
province (April 2003).
Implement steps to improve business environment, including developing a
private sector strategy (FY03-04).
Review the performance of public sector technical/vocational schools and
consider privatizing them (FY03-04).

70
for promotion of growth and employment
and reduction in poverty.
Increased investment,
production/commerce, and trade with
Afghanistan.
Increase productivity and growth in
agriculture sector.
agencies relating to mining to improve focus,
reduce establishment expenses, and expand
exploration, leasing, and mine safety
activities.
Established a Mineral Investment Facilitation
Authority.
Established a Gernstone Policy and Mineral
Promotion Committee.
Amended the Mining Concession Rules to
allow entry of small-scale entrepreneurs.
Converted the Sarhad Development Authority
into an investment Facilitation Authority for
investment promotion through a one-window
investment facility.
Decision taken to develop an agricultural
strategy to reduce rural poverty, enhance
productivity and value added of agriculture.
Continue to streamline and consolidate PSD activities and focus on
promotion, facilitation, and safety regulation (FY03-05).
Complete the ongoing divestiture of unsuccessful industrial estates, PEs
under SDA, and units under the Mineral Department and Small Industries
Board (FY05).
Complete and start implementing the agricultural strategy (FY03-05).
Road Service
Improved road service.
Lower maintenance cost of vehicles.
Better demand management.
Self-financing of road maintenance.
Established an autonomous Highway
Authority, with public-private oversight, for
planning and managing provincial highways;
managing the Road Maintenance Fund to
recover user charges; maintaining roads; and
improving service delivery.
Make the Authority fully responsible and accountable for building,
rehabilitation, and maintenance of provincial roads.
Increase user charges in a phased manner, keyed to road usage and capacity
to pay (FY03-05).
The maintenance program to cover at least 15-20% provincial road network
each year (FY03-05).
Make the Road Fund self-financing (FY05). E. Monitoring Poverty, Social Service and Reform Implementation
Monitoring & Evaluation (M&E)
Mechanisms
A more informed governance.
Better targeting of poverty and social
programs.
Better tracking of performance.
Completed the 40-variable socio-economic
survey (NWFP) Multiple Indicator Cluster
Survey (MICS), 2001).
Approved a program for independent third
party monitoring and user surveys.
Repeat the MICS every 3-4 years (FY05).
Use the survey results for policy direction, poverty programs, and better
service delivery (FY03-05).
Undertake user surveys annually (first survey initiated October 2002), and
disseminate findings publicly (FY03-05).
Collection of reliable provincial economic data by the Planning
Department/Federal Bureau of Statistics (FBS) (FY03-05).
Prepare and make public annual M&E reports by Reform Units (FY03-05),
and post on website.
Reform Implementation
Successful implementation of reforms.
Established an Economic Reform Unit in the
Finance Department reporting to the
Governor/Chief Executive on a quarterly
Monitor reform implementation as per the program, suggest any
adjustments, and help prepare the rolling 3-year MTBF (FY03-05)
Implement communication and dissemination strategy.
71
basis.
Approved a communication and dissemination
strategy on reform implementation.

72
Annex Iv: Pakistan’s Interim Poverty Reduction Strategy
Pakistan’s I-PRSP specifies five main goals of policy in the years ahead. These are:
1. engendering growth,
2. reforming governance,
3. creating income generating opportunities (specifically for the poor),
4. improving human development, and
5. reducing vulnerability to shocks (at the microeconomic level).
Faster growth is to be pursued through a combination of prudent macroeconomic
management, coupled with appropriate sectoral policies. The macroeconomic agenda
stresses the importance of increasing tax revenue in order to provide more fiscal space for
poverty reduction initiatives, while also overcoming Pakistan’s adverse debt dynamics.
Export growth is similarly recognized as vital to improving the external debt situation.
Key sectors addressed include agriculture, small and medium enterprises (SMEs), the
financial sector, infrastructure, energy, oil and gas, and telecom.
The I-PRSP argues that implementation of the government’s devolution strategy holds
the promises of a “gross-roots” transformation of Pakistan’s politics, and better citizen
oversight of government programs. It envisages providing income-generating
opportunities for the poor primarily through a housing program, the distribution of
government-owned land to the poor, and improved access to micro-credit. The human
development strategy presents an integrated framework to address the critical bottlenecks
in service delivery especially in health and education, and describes the ongoing
devolution plan as the major policy reform geared to this end.
As gender disparities remain substantial in all social indicators, targeted programs are
considered essential to reduce these gaps, e.g. through subsidies for girls education, and
through programs like the Lady Health Workers Program and Women’s Health Project.
Shocks are to be better dealt with by revamping the Zakat system, revitalizing the food
support program, and expanding the Khushal Pakistan Program.
The I-PRSP also envisages institutionalizing mechanisms to track poverty-related
expenditures and monitor intermediate variables as well as outcomes. The I-PRSP does
not discuss whether the program is consistent with achievement of the Millennium
Development Goals for the year 2015, although a casual impression is that it would
indeed put Pakistan on the road to achieving the goals. The government of Pakistan
intends to address this issue in the final PRSP that is to be prepared over the coming
months.
The key Budgetary expenditures proposed under the IPRSP are presented below:

73
Annexure Table: 1 IPRSP Budgetary Expenditures 2001-2004

74
Annexure Table 2: IPRSP Expenditures

75
Annexure Table 3: IPRSP Monitoring Targets

76
Annexure Table 3 (continued) IPRSP Monitoring targets

77
Annexure Table 3 (continued) IPRSP Targets

78
Annexure Table 3 (continued) IPRSP Targets

79
Annexure Table 3 (continued) IPRSP Targets

80
ANNEX V: Decentralization and Devolution in Pakistan
Pakistan’s devolution plan, finalized in August 2000, seeks to reform its over-centralized
government in order to improve decision-making, accountability and service delivery.
The devolution plan has four major objectives 1) “to empower the people at the grass
roots level, 2) to subordinate district administrative functionaries to elected
representatives, 3) to give financial autonomy to local government; 4) and to ensure
“speedy justice at the doorsteps of the people.” Special reference is made to those poor
harassed and intimidate by corrupt policy and local administrators. Accordingly, the plan
will provide for monitoring of the police by union members charges in judicial structure
police reforms, and separation of the judicial and administrative functions of local
authorities.
The plan envisages the creation of full-fledged district governments with legislative and
financial powers, serving below the federal and provincial levels. This structure will
have three-tiers, with direct population elections to the first level, the Union Councils
(Ucs). The other two: the Tehsil Councils (TCs) and the Zila (district) Councils (ZCs)
are to be indirectly elected by the UC members acting as an electoral college, Co-elected
Nazims and Naib Nazims will read the councils at each level and serve as members in the
superceding electoral colleges. A salient feature of the election to all local government
will be that political parties will not be allowed to promote their candidates, who will
instead have to run on individual ballots. A system of separate electorates for minorities
will endure, and one third of seats will be reserved for women. There will be a new
system of fiscal transfers to the Zila districts through provincial finance commissions.
Each district will be allocated funds on the basis of its size and its social and development
need. Local budget planning will be done by the Union Council and monitoring
mechanisms will reportedly be built into the system to guard against corruption.
The plan is being implemented in several phases, with much work remaining. The
question of how to mobilize local resources remains unresolved. Federal and Provincial
governments are reluctant to share existing resources, particularly given the strained
fiscal situation. At present, local government receives 10 to 15 percent from the
provinces, which themselves lack the funds for the delivery of the various services,
especially in the social sector. Other key elements of the plan – the fiscal framework,
administrative arrangements, civil service structure and management, and effective
accountability and participation mechanisms – have also yet to be finalized.
The devolution plan was finalized after considerable consultations with stakeholders,
including external donors. The inclusion of several established NGO representatives
active in both the central and provincial cabinets has added credibility to the undertaking.
Notwithstanding the continued influence of local elites, there is reportedly some evidence
that new voices have appeared at local level contesting elite capture of local government
and anti-poverty programs. These gamer support mainly among those elected on the
reserved seals for women and from peasants, workers NGO groups. It is not only

81
Pakistan’s experience however, that the mere building of new institutions is rarely
enough to make them work as intended.
However, two important issues regarding service deliver are not solved by devolution.
First, there are severe distributional inequities in the provisions of health and education,
most of which extend across districts. In addition, there are inequities across the rural-
urban divide. These problems therefore require attention at higher levels of government.
It is also important that the government focus on the issue of equity and enact measures
aimed at reducing problems of differential access for disadvantaged groups.
Second, there are significant demand side problems – difficulties in encouraging families
to take full advantage of the services that are made available in the health and education
sectors. This appears to be especially true in the context of parental resistance to the
education of their children, and in particular to girls education in rural area. Addressing
such demand-size issues may require interventions that seek to overcome social barriers
to girls education through incentives, monetary and otherwise, to parents. Such
interventions are likely to be beyond the resource capacity of local governments, and are
in any case likely to be politically more contentious in districts where this is a problem
than at higher levels of government. They will therefore likely require significant
resources and the continued, or even increased, involvement of higher-level governments.
The government’s medium term health strategy rightly takes such concerns into account.
It is concentrating on prevention and control programs, especially in the area of
reproductive health, child health, nutrient deficiencies and communicable and infectious
disease, where demand-side problems are most acute. Programs include adoption of
strategies against TB and malaria, measures for preventing the spread of Hepatitis B,
HIV, and AIDS through immunization and public health campaigns. Distributional
concerns are also paramount, since the strategy promotes targeted interventions that focus
on disadvantaged sections of society, especially in rural areas, through programs like
Lady Health Workers Programs and Women Health Project.
A community based focus for health policy is also in line with the observation that
community-specific characteristics, such as wealth and possibly the presence of quality
health facilities, strongly determine health outcomes in Pakistani children. This is
particularly the case for the noted chronic deficiencies in child anthropometrics – e.g.
height and weight – in rural communities – a symptom indicative of malnutrition and
other health problems. There is accordingly a clear need to target health interventions at
poorer communities.
Specific ways to solve the demand-side problem in the delivery of social services are still
under discussion. One intervention that has met with success is outright subsidies to
households, such as the Bangladesh Food-for-Education and Female Education
Scholarship programs, which link food transfers and scholarships to poor households to
primary school enrollment of their children, particularly girls.
Source: Interim PRSP (2001). Naseem (2001). “Government and NGO Programs in the Alleviation of
Poverty in Pakistan. A Political Economy Survey.”