Embed Size (px)
Citation preview
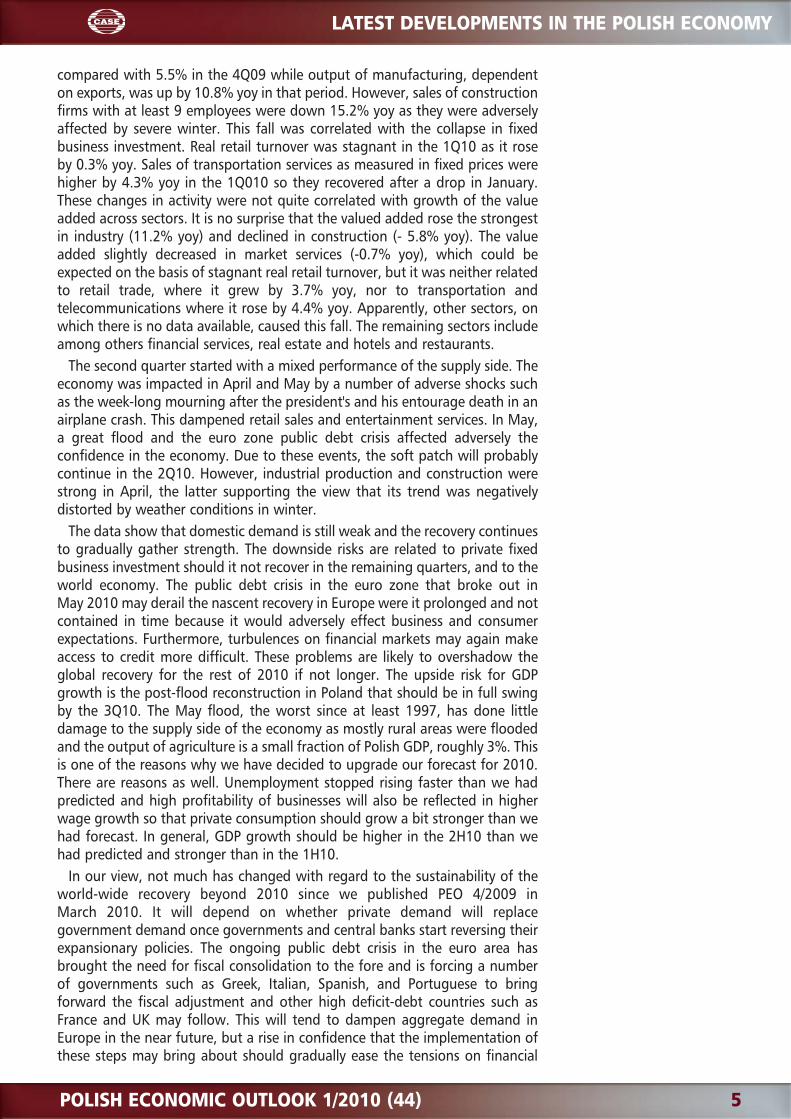
The economy is going through a soft patch.Unemployment increased due to this and seasonalfactors, but started rapidly falling in April.Macroeconomic balances mostly improved inthe 1Q10. A lot of slack in the economy helpedinflationary tensions ease in this period and the CPIinflation rate should remain within the central banktarget band for the next four quarters at least. Thefour quarter rolling current account deficit roseslightly in terms of GDP while the central governmentdeficit came lower than expected.
GDP grew by 3.0% yoy in the 1Q10, in line with ourforecast of 2.9% yoy and compared with 3.3% inthe 4Q09 and 1.8% in 2009. Growth was driven byconsumption, sizable inventory restocking and netexports in the 1Q10. The contribution of domesticdemand and net exports to economic growthreversed in magnitude relative to the 4Q09 andearlier quarters of 2009. However, the economy lostmomentum in the 1Q10 as seasonally adjusted GDPgrew 0.5% qoq, slower than 1.1% in the 4Q09. Thissoftness was related to a significant drop in the fixedbusiness investment that unexpectedly fell 12.4% yoyand seasonally adjusted 5.9% qoq, adversely affectedby severe winter that delayed construction. In ourview, this drop is a one-off event, but it will weigh onthe year-on-year statistics in the coming quarters.
Despite the sudden drop in the fixed businessinvestment the forecast of GDP growth for 2010 hasbeen revised upward as private consumption provedmore robust than assumed and unemploymentstarted falling earlier than we had predicted, whichleads to the upgrade of our forecast. The soft patchwill likely extend into in the 2Q10, but the 2H10should see accelerating growth buoyed by the publicfixed business investment, also related to thepost-flood reconstruction, and exports. We stillmaintain that in 2011, the economy is likely to growbetween 4% and 5%, depending on the world
economy developments. The euro depreciation versusthe dollar should add some stimulus provided thatthe euro area public debt problem will not lowerconfidence in the global recovery.
Inflation moderated to 3.3% yoy on average inthe 1Q10, down from 3.6% yoy in the 4Q09, anddeclined further down to 2.2% yoy in April reflectingdecelerating prices of food, electricity, consumerdurables and selected services. Countering this trendwere prices of fuel and tobacco which rose markedly inearly 2010. The downward trend in inflation should bearrested in the 3Q10, but the subsequent upwardtrend will be flat. Compared to the previous issue ofPEO, we slightly raised our forecasts of the CPI inflationand lowered those of the PPI inflation. Expectations ofhigher CPI growth are motivated by the upwardrevision of economic growth as well as a small upwardcorrection of the food price growth during theupcoming harvest season due to the impact of theflood. The zloty appreciation should offset increases incommodity prices, should they occur.
The central bank rates stayed flat throughMay 2010 and, based on our CPI inflation path, wedo not expect any changes until 2011 because theacceleration in growth toward the yearend is notgoing to eliminate the slack in the economy.
Conditions in the labor market stoppeddeteriorating in the 1Q10 despite a sub-par economicgrowth and the adverse seasonal factors, suggestingthat recovery is making inroads. The overallemployment dynamics in the sector of large firms thathad already stopped to worsen at the end ofthe 2009, started to significantly improve at thebeginning of 2010 on the back of rising employmentin manufacturing. However, the overall employmentfigures from Labor Force Survey (LFS) were bad andwe ascribe this fact to harsh winter, a one-off event.Therefore, our general employment forecast for 2010is rather optimistic. We expect that the LFS
EXECUTIVE SUMMARY
POLISH ECONOMIC OUTLOOK 1/2010 (44) 1
2 POLISH ECONOMIC OUTLOOK 1/2010 (44)
EXECUTIVE SUMMARY
employment in 2010 will most probably stay at thesame level as in 2009 while in 2011 it will rise by 1.2%.In the 1Q2010, unemployment increased to 12.9% soit was below our previous forecast, but it fell rapidly inApril, also in seasonally adjusted terms. The seasonallyadjusted figures confirm that the 1Q2010 can seea breakthrough in the labor market situation inPoland. We revise down our forecast of registeredunemployment that should stabilize at the 2009 levelat the end of 2010. In 2011, registered unemploymentwill continue to fall to around 10%-10.5% at the endof the year. Factoring in that the unexpectedly bad LFSfigures for the 1Q2010 resulted mainly from adverseweather conditions, we assess that the LFSunemployment will fall to as low as 9.6% inthe 2Q2010. It should stabilize throughout the restof 2010, reaching 9.7% at the end of the year.In 2011, it will fall to even 8.5%.
Real wage dynamics in the entire economy more orless stabilized in the 1Q10. Since conditions on thelabor market have started improving and GDP growthis likely to pick up, growth of average nominal wagewill gradually accelerate. Average nominal wagegrowth in the enterprise sector should stay around 3%yoy in the 2Q10 while in the entire 2010, it should staybelow 4%. The average nominal wage in the wholeeconomy should rise about 5% in 2010 that translatesin a 2.5% rise in purchasing power. Nominal and realwage growth is expected to accelerate in 2011 on theback of better performance of the economy.
The central government (CG) cash deficit came lowerthan projected by the government in the 1Q10 andthis tendency continued through April. Expenditureswere lower while revenues were higher thanprojected. The latter were supported by economicgrowth, however it was not strong enough to produce
Data CASE forecasts2009 2010 2010 2011Indicator
2007 2008 2008Q2 Q3 Q4 Q1 Q2 Q3 Q4 Q1
2010 2011
Nominal GDP, PLN bn 1176.7 1275.4 1344.0 327.0 331.9 371.4 327.4 344.8 349.2 389.2 349.7 1416.1 1510.0(% change, yoy)
GDP 6.8 5.1 1.8 1.1 1.8 3.3 3.0 3.1 3.7 4.2 4.2 3.5 4.0Private Consumption 4.9 5.7 2.3 1.6 2.3 1.7 2.2 3.2 3.1 3.7 3.4 3.1 3.7Fixed Investment 17.6 9.6 -0.8 -3.3 -1.4 1.1 -12.4 -3.0 4.9 5.6 16.5 1.0 10.0
(4Q, % of GDP) CA balance -4.7 -5.1 -1.6 -2.8 -2.1 -1.6 -1.9 -1.9 -1.4 -1.3 -1.3 -1.3 -2.5
(% change, yoy) Exports (NBP, EUR) 13.4 14.2 -17.1 -21.8 -19.5 1.5 19.0 23.7 19.5 15.1 12.0 19.2 11.0Imports (NBP,(EUR) 19.5 17.2 -25.4 -29.7 -27.0 -10.3 19.1 24.0 18.5 20.2 11.7 20.4 12.5
(% change, yoy) Industrial sales 10.7 3.6 -4.3 -6.7 -1.3 5.6 9.5 9.9 8.2 4.9 7.0 8.2 9.0Gross value added 6.7 5.1 1.9 1.0 2.0 3.3 2.8 3.2 3.5 4.1 4.3 3.4 4.1 CPI 2.5 4.2 3.5 3.7 3.5 3.3 3.0 2.2 2.4 2.8 2.7 2.6 2.5PPI 2.0 2.2 3.4 4.2 2.2 2.0 -1.6 -0.4 2.0 2.5 2.4 0.6 1.4Nominal Ave. Wage 7.9 10.1 5.5 4.4 4.9 4.7 4.1 3.2 3.6 4.2 3.6 3.5 4.6 Employment %, LFS 3.1 3.7 0.7 1.0 0.5 -0.5 -0.9 -0.4 0.0 0.0 0.5 -0.3 1.2
Registered unemploymentrate (%, eop)
11.2 9.5 11.9 10.6 10.9 11.9 12.9 11.5 11.3 11.9 12.4 11.9 10.3
PLN/EUR, ave 3.78 3.52 4.33 4.45 4.20 4.17 3.99 3.97 3.87 3.83 3.75 3.85 3.68 WIBOR 3M, %, ave 5.68 5.88 4.27 4.44 4.18 4.27 4.10 3.90 3.90 3.95 4.20 4.20 4.50Central bank key rate eop 5.00 5.00 3.50 3.50 3.50 3.50 3.50 3.50 3.50 3.50 3.75 3.50 4.00
(% change, yoy eop) Broad Money (M3) 13.4 18.6 8.1 14.4 9.6 8.1 5.5 7.0 8.5 9.5 9.0 9.5 12.0 Loans to HH 37.9 44.6 15.5 35.7 26.3 12.0 5.7 8.5 9.5 11.0 12.0 11.0 15.0 Loans to Firms 24.1 29.0 1.0 15.0 6.8 -3.3 -9.0 -6.0 -2.5 0.5 2.0 0.5 9.0
(% GDP) Fiscal Balance -1.9 -3.7 -7.1 n.a. n.a. -7.1 n.a. n.a. n.a. n.a. n.a. -5.8 -4.5Public Debt eop 45.0 47.2 51.0 n.a. n.a. 51.0 n.a. n.a. n.a. n.a. n.a. 52.5 54.8
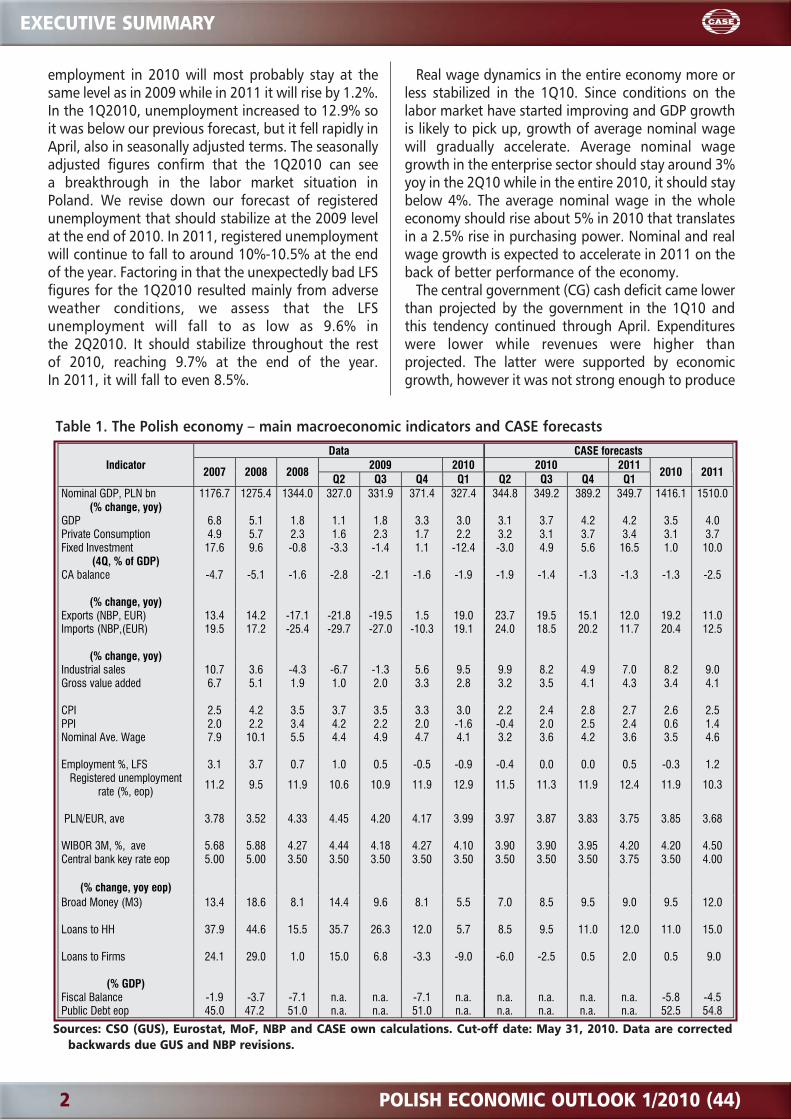
Table 1. The Polish economy – main macroeconomic indicators and CASE forecasts
Sources: CSO (GUS), Eurostat, MoF, NBP and CASE own calculations. Cut-off date: May 31, 2010. Data are correctedbackwards due GUS and NBP revisions.
POLISH ECONOMIC OUTLOOK 1/2010 (44) 3
LATEST DEVELOPMENTS IN THE POLISH ECONOMY
Economic growthAccording to the preliminary estimates of the CSO (GUS), GDP grew by 3.0%
yoy in the 1Q10, compared with 3.3% in the 4Q09 and 1.8% in 2009. This wasin line with our forecast of 2.9% yoy. However, the economy slowed in the firstquarter, adversely impacted by severe winter conditions that affected fixedbusiness investment on the demand side and construction, its counterpart, onthe supply side. Frozen corporate credit may be a factor as well.
The economy lost momentum in the 1Q10 as seasonally adjusted GDPgrew 0.5% qoq, slower than 1.1% in the 4Q09. Domestic demand expandedby 2.2% yoy and seasonally adjusted 0.4% qoq so its quarterly growth was inline with the GDP advance. This softness was related to a significant drop inthe fixed business investment that unexpectedly fell 12.4% yoy whereas wehad expected a drop of 1% yoy only. It decreased seasonally adjusted 5.9%qoq, the fourth consecutive quarterly drop and the largest as well since thebeginning of a downward trend. However, its impact on GDP growth wasoffset by a rise in gross capital formation that includes changes in inventories.The gross capital formation (gross investment in American lingo) grewby 2.4% yoy while it decreased seasonally adjusted 0.1% qoq only. This isa clear signal that major re-stocking took place, which saved GDP growth inthe 1Q10. The inventory accumulation is correlated with the improvingbusiness sentiment, rising new orders and anticipation of higher demand.Firms still underutilize capacities (according to the NBP, the index of capacityutilization was below the 10-year moving average in the 1Q10) so they focuson completing the projects rather than starting new ones. By the way, thiswas also the case in the 4Q09 so the trend has not changed. Since more firmsdeclared they would continue the completion of projects in the 1Q10 than inthe 4Q09, this factor cannot explain away the sudden collapse of the fixedbusiness investment in that period. Another negative factor was a difficultaccess to credit – firms reported that its availability slightly worsened inthe 1Q100, compared with the 4Q09. However, Polish firms tend to financeinvestment projects from retained profits so the downward trend in corporatecredit is not only a result of tightened standards, but the effect of weakinvestment activity as well. On the other hand, business sentiment improved
LATEST DEVELOPMENTS IN THE POLISH ECONOMY
a year-on-year growth in the tax revenue in thisperiod. We forecast that in 2010, the CG deficit will belower by 1% of GDP than forecast by the government.This will help reduce the general government ESA95shortfall relative to official projections as well. The riskof breaching a 55% threshold for the public debt isnegligent in 2010. Our forecast of the public debt ratioin 2010 is lowered and it is also a factor, why weexpect that this ratio should not cross the line in 2011,either. Other factors are the appreciation of the zloty,large proceeds from privatization and a large paymentfrom the NBP profits.
The current account deficit is a non-issue. It is predic-ted to slightly rise to 2-2.5% of GDP in 2010 due to thenegligent deficit in trade. Both export and import sho-uld continue to post strong upward trends in 2010. Ad-justed for the net capital surplus that captures most ofthe EU aid, the current account shortfall should notexceed 1-1.5%of GDP. These developments will furtherdecrease external financing needs of Poland so they willsupport the zloty exchange rate on top of the net capi-tal inflows, in particular of FDI. The zloty rate will be qu-ite volatile due to disruptions on the financial markets,but its upward trend will not be compromised.
4 POLISH ECONOMIC OUTLOOK 1/2010 (44)
LATEST DEVELOPMENTS IN THE POLISH ECONOMY
sharply in the 1Q10 so deteriorating expectations and uncertainty cannot beblamed for the decline in the fixed business investment. Taking into accountall these considerations, we think that harsh winter took its tally on it so theacceleration of the downward trend should be a one-off event. Publicinvestment in the infrastructure such as roads that lifted investment figures inprevious quarters is usually low in the first quarter of the year
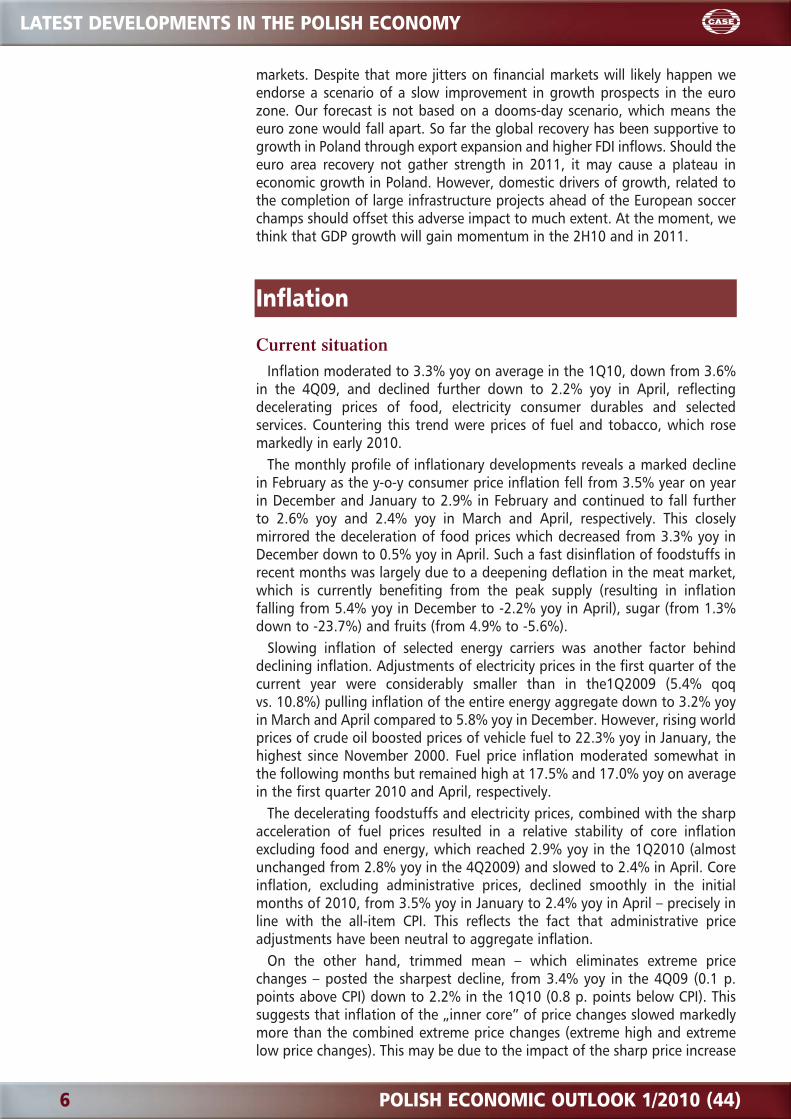
Private consumer expenditure grew by 2.2 yoy in the 1Q10, a bit strongerthan 1.9% we had predicted, and it advanced by seasonally adjusted 0.6%qoq, stronger than 0.3% qoq in the 4Q09. Despite rising unemployment andstagnating real wages it kept well. Disposable incomes were boosted by thecompensation of pensioners for inflation and wage growth in 2009 sopensions were up 4.2% yoy in the 1Q10 while the economy-wide average realwage rose by 1.1% yoy in real terms. Combined with an improving consumerconfidence and stabilizing unemployment at the end of the 1Q10, higherpensions supported consumption growth.
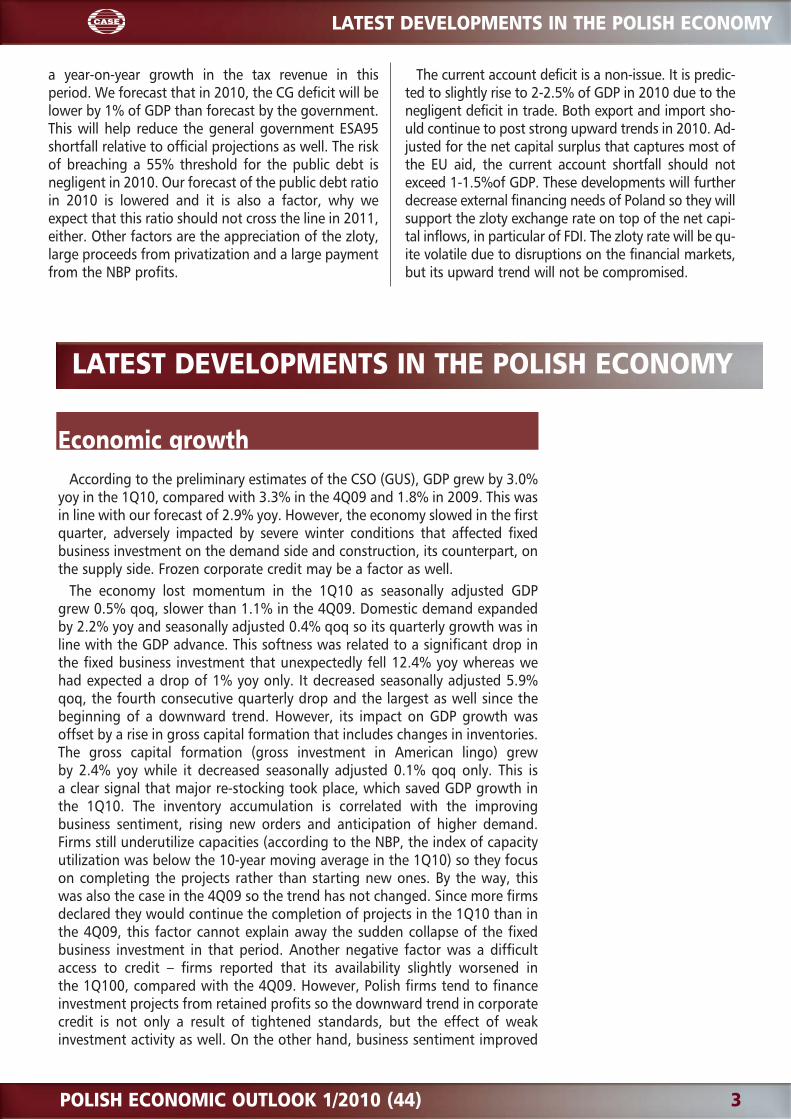
Figure 1. GDP Growth Factors, quarterly % yoy
Exports grew stronger than imports from a year ago and this was the firstquarter when both quantities expanded. Both quantities rose 9.8% and 7.9%yoy and seasonally adjusted 3.1% qoq and 5.5% qoq in the 1Q10, respectively.Year-on-year net exports continued to contribute positively to growth inthe 1Q10, though this contribution was much lower than in all quartersof 2009. Actually, the shares of domestic demand and net exports in economicgrowth reversed relative to the 4Q09 and earlier quarters of 2009, suggestingthat if growth were to accelerate, this acceleration should rely on domesticdemand. A rise in imports was substantially larger than that of exports inseasonally adjusted terms. This rise was most likely related to the inventoryrestocking when the zloty firmed after a number of quarters when stocks ofimported items were depleted in part due to diminished growth prospects andin part due to the zloty depreciation. One quarter does not set a trend, but itmay be a sign that a positive contribution of net export to GDP growth mayturn to negative in the course of the year should investment activity pick up.
The supply side data confirmed a pickup in manufacturing thanks to theupturn in the global economy. World trade has recovered from the worstpost-war collapse, which along with restocking resulted in high growth inindustrial output. Sales of industrial output increased by 9.5% yoy in the 1Q10,
-20,0
-15,0
-10,0
-5,0
0,0
5,0
10,0
15,0
20,0
25,0
1q03
3q03
1q04
3q04
1q05
3q05
1q06
3q06
1q07
3q07
1q08
3q08
1q09
3q09
1q10
3q10
1q11
GDP Private Consumption
Fix. Bus. Investment Exports
forecast
POLISH ECONOMIC OUTLOOK 1/2010 (44) 5
LATEST DEVELOPMENTS IN THE POLISH ECONOMY
compared with 5.5% in the 4Q09 while output of manufacturing, dependenton exports, was up by 10.8% yoy in that period. However, sales of constructionfirms with at least 9 employees were down 15.2% yoy as they were adverselyaffected by severe winter. This fall was correlated with the collapse in fixedbusiness investment. Real retail turnover was stagnant in the 1Q10 as it roseby 0.3% yoy. Sales of transportation services as measured in fixed prices werehigher by 4.3% yoy in the 1Q010 so they recovered after a drop in January.These changes in activity were not quite correlated with growth of the valueadded across sectors. It is no surprise that the valued added rose the strongestin industry (11.2% yoy) and declined in construction (- 5.8% yoy). The valueadded slightly decreased in market services (-0.7% yoy), which could beexpected on the basis of stagnant real retail turnover, but it was neither relatedto retail trade, where it grew by 3.7% yoy, nor to transportation andtelecommunications where it rose by 4.4% yoy. Apparently, other sectors, onwhich there is no data available, caused this fall. The remaining sectors includeamong others financial services, real estate and hotels and restaurants.
The second quarter started with a mixed performance of the supply side. Theeconomy was impacted in April and May by a number of adverse shocks suchas the week-long mourning after the president's and his entourage death in anairplane crash. This dampened retail sales and entertainment services. In May,a great flood and the euro zone public debt crisis affected adversely theconfidence in the economy. Due to these events, the soft patch will probablycontinue in the 2Q10. However, industrial production and construction werestrong in April, the latter supporting the view that its trend was negativelydistorted by weather conditions in winter.
The data show that domestic demand is still weak and the recovery continuesto gradually gather strength. The downside risks are related to private fixedbusiness investment should it not recover in the remaining quarters, and to theworld economy. The public debt crisis in the euro zone that broke out inMay 2010 may derail the nascent recovery in Europe were it prolonged and notcontained in time because it would adversely effect business and consumerexpectations. Furthermore, turbulences on financial markets may again makeaccess to credit more difficult. These problems are likely to overshadow theglobal recovery for the rest of 2010 if not longer. The upside risk for GDPgrowth is the post-flood reconstruction in Poland that should be in full swingby the 3Q10. The May flood, the worst since at least 1997, has done littledamage to the supply side of the economy as mostly rural areas were floodedand the output of agriculture is a small fraction of Polish GDP, roughly 3%. Thisis one of the reasons why we have decided to upgrade our forecast for 2010.There are reasons as well. Unemployment stopped rising faster than we hadpredicted and high profitability of businesses will also be reflected in higherwage growth so that private consumption should grow a bit stronger than wehad forecast. In general, GDP growth should be higher in the 2H10 than wehad predicted and stronger than in the 1H10.
In our view, not much has changed with regard to the sustainability of theworld-wide recovery beyond 2010 since we published PEO 4/2009 inMarch 2010. It will depend on whether private demand will replacegovernment demand once governments and central banks start reversing theirexpansionary policies. The ongoing public debt crisis in the euro area hasbrought the need for fiscal consolidation to the fore and is forcing a numberof governments such as Greek, Italian, Spanish, and Portuguese to bringforward the fiscal adjustment and other high deficit-debt countries such asFrance and UK may follow. This will tend to dampen aggregate demand inEurope in the near future, but a rise in confidence that the implementation ofthese steps may bring about should gradually ease the tensions on financial
6 POLISH ECONOMIC OUTLOOK 1/2010 (44)
LATEST DEVELOPMENTS IN THE POLISH ECONOMY
markets. Despite that more jitters on financial markets will likely happen weendorse a scenario of a slow improvement in growth prospects in the eurozone. Our forecast is not based on a dooms-day scenario, which means theeuro zone would fall apart. So far the global recovery has been supportive togrowth in Poland through export expansion and higher FDI inflows. Should theeuro area recovery not gather strength in 2011, it may cause a plateau ineconomic growth in Poland. However, domestic drivers of growth, related tothe completion of large infrastructure projects ahead of the European soccerchamps should offset this adverse impact to much extent. At the moment, wethink that GDP growth will gain momentum in the 2H10 and in 2011.
Inflation
Current situationInflation moderated to 3.3% yoy on average in the 1Q10, down from 3.6%
in the 4Q09, and declined further down to 2.2% yoy in April, reflectingdecelerating prices of food, electricity consumer durables and selectedservices. Countering this trend were prices of fuel and tobacco, which rosemarkedly in early 2010.
The monthly profile of inflationary developments reveals a marked declinein February as the y-o-y consumer price inflation fell from 3.5% year on yearin December and January to 2.9% in February and continued to fall furtherto 2.6% yoy and 2.4% yoy in March and April, respectively. This closelymirrored the deceleration of food prices which decreased from 3.3% yoy inDecember down to 0.5% yoy in April. Such a fast disinflation of foodstuffs inrecent months was largely due to a deepening deflation in the meat market,which is currently benefiting from the peak supply (resulting in inflationfalling from 5.4% yoy in December to -2.2% yoy in April), sugar (from 1.3%down to -23.7%) and fruits (from 4.9% to -5.6%).
Slowing inflation of selected energy carriers was another factor behinddeclining inflation. Adjustments of electricity prices in the first quarter of thecurrent year were considerably smaller than in the1Q2009 (5.4% qoqvs. 10.8%) pulling inflation of the entire energy aggregate down to 3.2% yoyin March and April compared to 5.8% yoy in December. However, rising worldprices of crude oil boosted prices of vehicle fuel to 22.3% yoy in January, thehighest since November 2000. Fuel price inflation moderated somewhat inthe following months but remained high at 17.5% and 17.0% yoy on averagein the first quarter 2010 and April, respectively.
The decelerating foodstuffs and electricity prices, combined with the sharpacceleration of fuel prices resulted in a relative stability of core inflationexcluding food and energy, which reached 2.9% yoy in the 1Q2010 (almostunchanged from 2.8% yoy in the 4Q2009) and slowed to 2.4% in April. Coreinflation, excluding administrative prices, declined smoothly in the initialmonths of 2010, from 3.5% yoy in January to 2.4% yoy in April – precisely inline with the all-item CPI. This reflects the fact that administrative priceadjustments have been neutral to aggregate inflation.
On the other hand, trimmed mean – which eliminates extreme pricechanges – posted the sharpest decline, from 3.4% yoy in the 4Q09 (0.1 p.points above CPI) down to 2.2% in the 1Q10 (0.8 p. points below CPI). Thissuggests that inflation of the „inner core” of price changes slowed markedlymore than the combined extreme price changes (extreme high and extremelow price changes). This may be due to the impact of the sharp price increase
POLISH ECONOMIC OUTLOOK 1/2010 (44) 7
LATEST DEVELOPMENTS IN THE POLISH ECONOMY
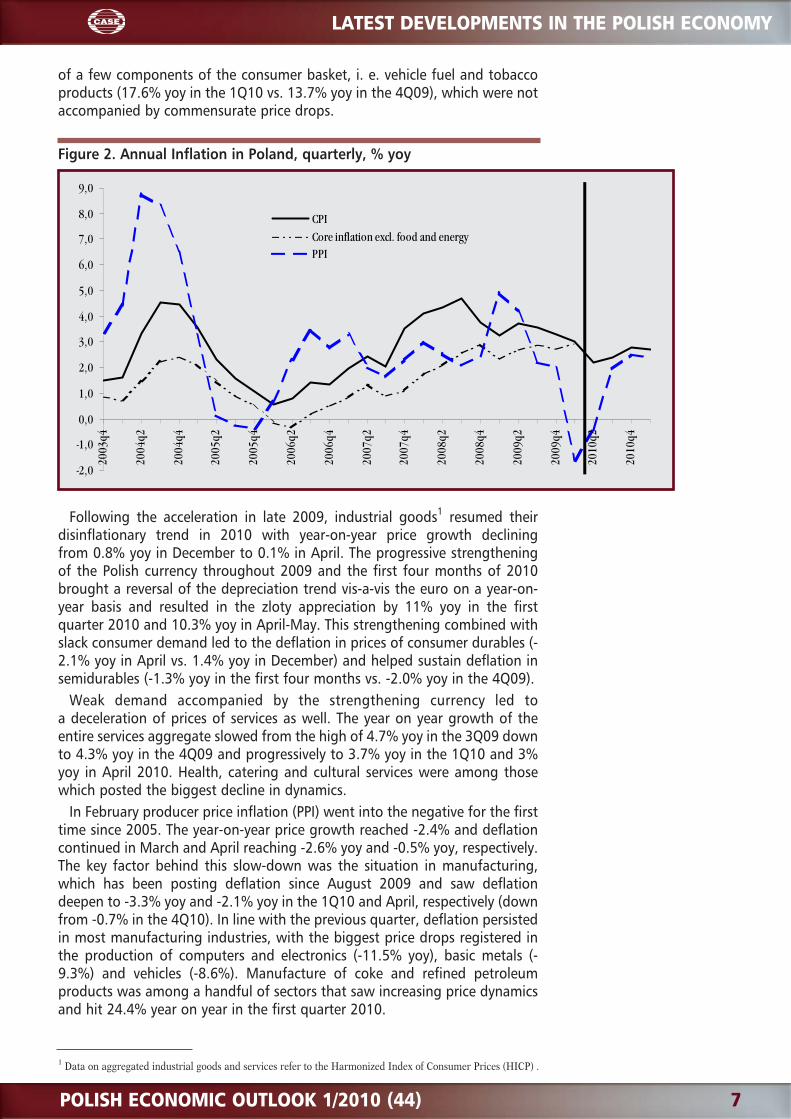
of a few components of the consumer basket, i. e. vehicle fuel and tobaccoproducts (17.6% yoy in the 1Q10 vs. 13.7% yoy in the 4Q09), which were notaccompanied by commensurate price drops.
Figure 2. Annual Inflation in Poland, quarterly, % yoy
Following the acceleration in late 2009, industrial goods1 resumed theirdisinflationary trend in 2010 with year-on-year price growth decliningfrom 0.8% yoy in December to 0.1% in April. The progressive strengtheningof the Polish currency throughout 2009 and the first four months of 2010brought a reversal of the depreciation trend vis-a-vis the euro on a year-on-year basis and resulted in the zloty appreciation by 11% yoy in the firstquarter 2010 and 10.3% yoy in April-May. This strengthening combined withslack consumer demand led to the deflation in prices of consumer durables (-2.1% yoy in April vs. 1.4% yoy in December) and helped sustain deflation insemidurables (-1.3% yoy in the first four months vs. -2.0% yoy in the 4Q09).
Weak demand accompanied by the strengthening currency led toa deceleration of prices of services as well. The year on year growth of theentire services aggregate slowed from the high of 4.7% yoy in the 3Q09 downto 4.3% yoy in the 4Q09 and progressively to 3.7% yoy in the 1Q10 and 3%yoy in April 2010. Health, catering and cultural services were among thosewhich posted the biggest decline in dynamics.
In February producer price inflation (PPI) went into the negative for the firsttime since 2005. The year-on-year price growth reached -2.4% and deflationcontinued in March and April reaching -2.6% yoy and -0.5% yoy, respectively.The key factor behind this slow-down was the situation in manufacturing,which has been posting deflation since August 2009 and saw deflationdeepen to -3.3% yoy and -2.1% yoy in the 1Q10 and April, respectively (downfrom -0.7% in the 4Q10). In line with the previous quarter, deflation persistedin most manufacturing industries, with the biggest price drops registered inthe production of computers and electronics (-11.5% yoy), basic metals (-9.3%) and vehicles (-8.6%). Manufacture of coke and refined petroleumproducts was among a handful of sectors that saw increasing price dynamicsand hit 24.4% year on year in the first quarter 2010.
-2,0
-1,0
0,0
1,0
2,0
3,0
4,0
5,0
6,0
7,0
8,0
9,0
2003
q4
2004
q2
2004
q4
2005
q2
2005
q4
2006
q2
2006
q4
2007
q2
2007
q4
2008
q2
2008
q4
2009
q2
2009
q4
2010
q2
2010
q4
CPI
Core inflation excl. food and energyPPI
1 Data on aggregated industrial goods and services refer to the Harmonized Index of Consumer Prices (HICP) .
8 POLISH ECONOMIC OUTLOOK 1/2010 (44)
LATEST DEVELOPMENTS IN THE POLISH ECONOMY
Price growth in mining&quarrying and the energy sector slowed down aswell. Despite progressively rising world prices of coal, copper and other rawmaterials, the annual inflation of mining and quarrying slowed to 15.7%and 15.2% in the first quarter and April, respectively, down from therecord-high 20% in the 4Q09. This was largely due to the high base in the firstthree months of 2009 when quarterly growth in the sector exceeded thatin 2010 four-fold. Likewise, smaller administrative adjustments of electricityand central heating prices in early 2010 compared to 2009 led to a steepdecline of annual inflation in the entire energy sector: from 11.8% yoy inthe 4Q09 down to 1.5% yoy and 1.3% yoy in the 1Q10 and April, respectively.
ForecastCompared to the previous PEO, we slightly raised our forecasts of the CPI
inflation (by 0.2-0.3 p.p. in 2010) and lowered those of the PPI inflation(by 0.2-0.3 p.p.). Expectations of higher CPI growth are motivated by theupward revisions of economic growth as well as a small upward correction ofthe food price growth during the upcoming harvest season.
While we expect demand pressures to be subdued throughout 2010,a slightly more optimistic GDP outlook is likely to provide additional stimulusto domestic demand. The Polish zloty is expected to continue appreciating inthe coming quarters with the Greek-crisis-induced weakening in May onlya temporary phenomenon. We believe that the quarterly profile ofappreciation will not change significantly compared to the previous PEOimplying the year-on-year appreciation gradually declining from 10.7% inthe 2Q10 to 6.1% in the 1Q11. This should continue to exert sizeabledownward pressures on prices of tradables which will gradually resume andreinforce its leading role in keeping inflation in Poland low. This role will bemagnified through the progressively increasing weight of non-energyindustrial goods in the overall consumer basket. Consumer durables -whichhistorically showed the deepest deflation in the consumer basket- saw theirshare in total expenditure expand to 7.3% in 2009, double the share in 2003and the highest ever registered.
The supply outlook of agricultural commodities and quality of the harvesthas been relatively positive up until March but deteriorated subsequentlyowing to adverse weather conditions in April and floods in May and June. It isstill too early to estimate the detrimental impact of these conditions, but it isvery likely that it will reduce prospective crops in several key markets. However,experts point to the fact that the floods alone are unlikely to impact prices onthe domestic level due to their regional character. On the other hand, coupledwith bad weather conditions persisting since the beginning of the vegetationperiod, they may reduce this year's crops and lead to smaller seasonal pricedecreases. Consequently, our expectations of food price inflation is somewhatless optimistic compared to the previous forecast round.
All these factors combined lead us to expect a mild acceleration ofconsumer prices in the following four quarters. We expect the year on yearchange in the CPI index to decline to 2.2% in the 2Q10 and rise subsequentlyto 2.4% in the 3Q10 and then slightly above the mid-point of the targetrange, to 2.8% and 2.7% in the 4Q10 and 1Q11, respectively.
Producer prices will rebound in the course of 2010 reflecting progressivelyrising commodity prices, including copper and coal – both of key importancefor the Polish industry. The gradual acceleration will be also driven by thesluggishly reviving global demand, including demand for imports in major
2 The weight from 2009 is used in HICP calculations throughout 2010.
POLISH ECONOMIC OUTLOOK 1/2010 (44) 9
LATEST DEVELOPMENTS IN THE POLISH ECONOMY
Polish export markets. The quarterly profile of the PPI inflation will directlyreflect this acceleration. Producer price inflation will pick up from -1.6% yoyin the 1Q10 to -0.4% yoy in the 2Q10 and then further to 2.0%, 2.5 and 2.4%in the 3Q10, 4Q10 and 1Q11, respectively.
Monetary Developments and Policy
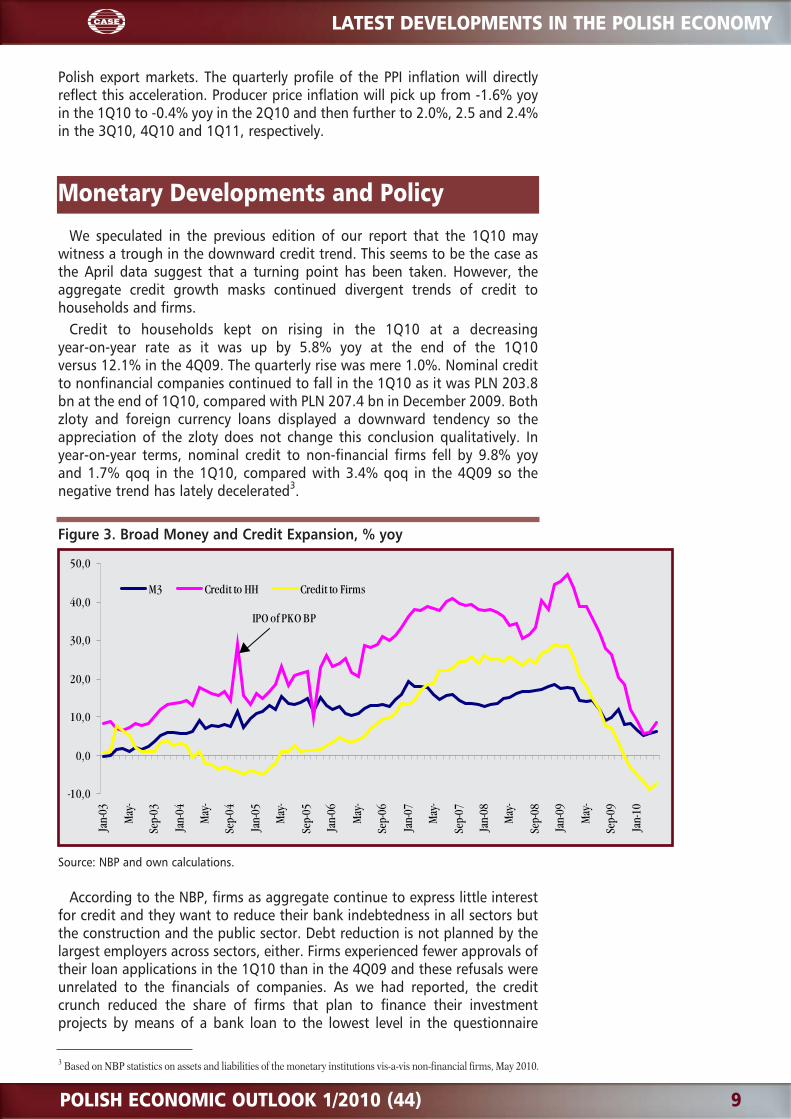
We speculated in the previous edition of our report that the 1Q10 maywitness a trough in the downward credit trend. This seems to be the case asthe April data suggest that a turning point has been taken. However, theaggregate credit growth masks continued divergent trends of credit tohouseholds and firms.
Credit to households kept on rising in the 1Q10 at a decreasingyear-on-year rate as it was up by 5.8% yoy at the end of the 1Q10versus 12.1% in the 4Q09. The quarterly rise was mere 1.0%. Nominal creditto nonfinancial companies continued to fall in the 1Q10 as it was PLN 203.8bn at the end of 1Q10, compared with PLN 207.4 bn in December 2009. Bothzloty and foreign currency loans displayed a downward tendency so theappreciation of the zloty does not change this conclusion qualitatively. Inyear-on-year terms, nominal credit to non-financial firms fell by 9.8% yoyand 1.7% qoq in the 1Q10, compared with 3.4% qoq in the 4Q09 so thenegative trend has lately decelerated3.
Figure 3. Broad Money and Credit Expansion, % yoy
Source: NBP and own calculations.
According to the NBP, firms as aggregate continue to express little interestfor credit and they want to reduce their bank indebtedness in all sectors butthe construction and the public sector. Debt reduction is not planned by thelargest employers across sectors, either. Firms experienced fewer approvals oftheir loan applications in the 1Q10 than in the 4Q09 and these refusals wereunrelated to the financials of companies. As we had reported, the creditcrunch reduced the share of firms that plan to finance their investmentprojects by means of a bank loan to the lowest level in the questionnaire
3 Based on NBP statistics on assets and liabilities of the monetary institutions vis-a-vis non-financial firms, May 2010.
-10,0
0,0
10,0
20,0
30,0
40,0
50,0
Jan-
03
May
-
Sep-
03
Jan-
04
May
-
Sep-
04
Jan-
05
May
-
Sep-
05
Jan-
06
May
-
Sep-
06
Jan-
07
May
-
Sep-
07
Jan-
08
May
-
Sep-
08
Jan-
09
May
-
Sep-
09
Jan-
10
M3 Credit to HH Credit to Firms
IPO of PKO BP
10 POLISH ECONOMIC OUTLOOK 1/2010 (44)
LATEST DEVELOPMENTS IN THE POLISH ECONOMY
history in the 4Q09. This ratio rose a little in the 1Q10, which suggests thatthe revival of investment credit will be slow.
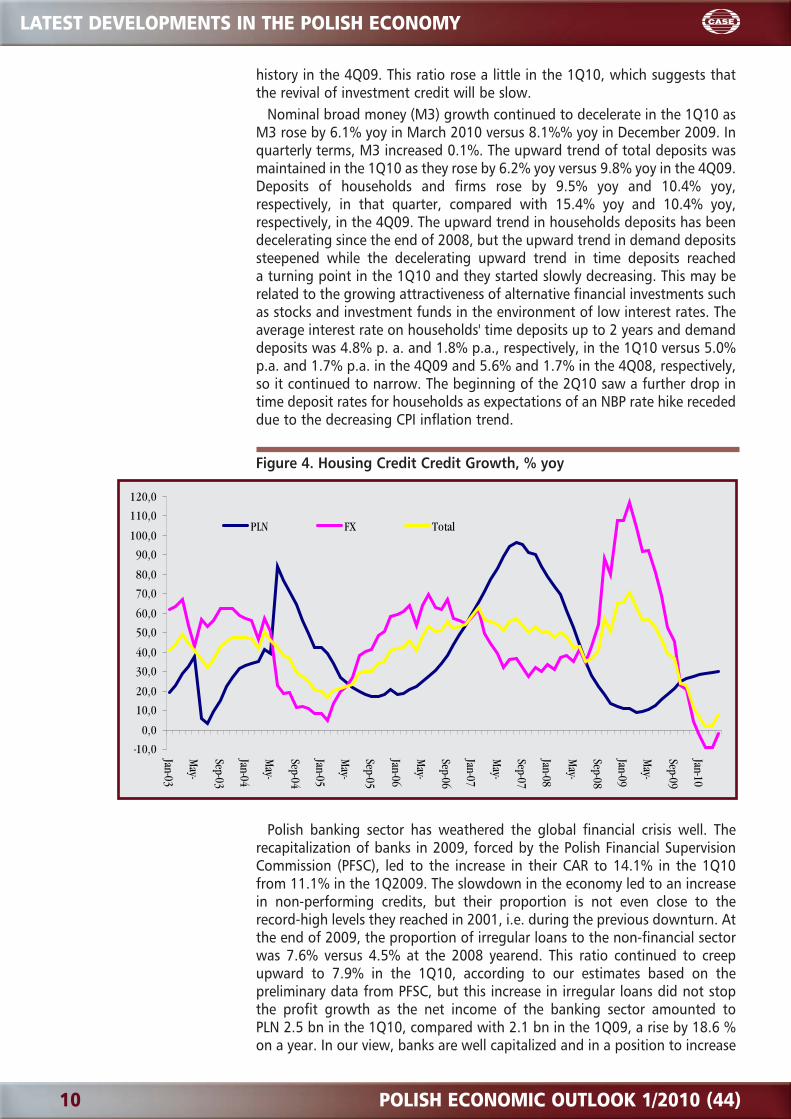
Nominal broad money (M3) growth continued to decelerate in the 1Q10 asM3 rose by 6.1% yoy in March 2010 versus 8.1%% yoy in December 2009. Inquarterly terms, M3 increased 0.1%. The upward trend of total deposits wasmaintained in the 1Q10 as they rose by 6.2% yoy versus 9.8% yoy in the 4Q09.Deposits of households and firms rose by 9.5% yoy and 10.4% yoy,respectively, in that quarter, compared with 15.4% yoy and 10.4% yoy,respectively, in the 4Q09. The upward trend in households deposits has beendecelerating since the end of 2008, but the upward trend in demand depositssteepened while the decelerating upward trend in time deposits reacheda turning point in the 1Q10 and they started slowly decreasing. This may berelated to the growing attractiveness of alternative financial investments suchas stocks and investment funds in the environment of low interest rates. Theaverage interest rate on households' time deposits up to 2 years and demanddeposits was 4.8% p. a. and 1.8% p.a., respectively, in the 1Q10 versus 5.0%p.a. and 1.7% p.a. in the 4Q09 and 5.6% and 1.7% in the 4Q08, respectively,so it continued to narrow. The beginning of the 2Q10 saw a further drop intime deposit rates for households as expectations of an NBP rate hike recededdue to the decreasing CPI inflation trend.
Figure 4. Housing Credit Credit Growth, % yoy
Polish banking sector has weathered the global financial crisis well. Therecapitalization of banks in 2009, forced by the Polish Financial SupervisionCommission (PFSC), led to the increase in their CAR to 14.1% in the 1Q10from 11.1% in the 1Q2009. The slowdown in the economy led to an increasein non-performing credits, but their proportion is not even close to therecord-high levels they reached in 2001, i.e. during the previous downturn. Atthe end of 2009, the proportion of irregular loans to the non-financial sectorwas 7.6% versus 4.5% at the 2008 yearend. This ratio continued to creepupward to 7.9% in the 1Q10, according to our estimates based on thepreliminary data from PFSC, but this increase in irregular loans did not stopthe profit growth as the net income of the banking sector amounted toPLN 2.5 bn in the 1Q10, compared with 2.1 bn in the 1Q09, a rise by 18.6 %on a year. In our view, banks are well capitalized and in a position to increase
-10,0
0,0
10,0
20,0
30,0
40,0
50,0
60,0
70,0
80,0
90,0
100,0
110,0
120,0
Jan-03
May-
Sep-03
Jan-04
May-
Sep-04
Jan-05
May-
Sep-05
Jan-06
May-
Sep-06
Jan-07
May-
Sep-07
Jan-08
May-
Sep-08
Jan-09
May-
Sep-09
Jan-10
PLN FX Total
POLISH ECONOMIC OUTLOOK 1/2010 (44) 11
LATEST DEVELOPMENTS IN THE POLISH ECONOMY
lending to the economy. However, the ripple effects of the Greek public debtcrisis may affect their lending adversely as some of their parent companiesmay have exposure to Greek assets so they may intend not to expand credituntil it becomes clear that they will not have to write these assets off. SincePolish banks are well-capitalized their capital ratios may be used towardcreating a safety valve for the consolidated financial institution like ithappened during the global crisis.
The central bank did not change its key interest rates in the 1Q10 and in thefirst two months of the 2Q10. The y-o-y CPI inflation declined by a fullpercentage point since the end of 2009 and fell to the mid-point of the NBPtarget in April 2010. This path was consistent with the NBP projection fromFebruary 2010. The core inflation indices also exhibited a downward trend,which in combination with underutilized capacities and the appreciating zlotycreated an environment for stable interest rates. Actually, monetaryconditions were tightened because of the zloty appreciation. Despite ourforecast that the CPI inflation rate should reach its y-o-y trough in the 2Q10and then start slowly increasing, we do not see any interest rate hikes in theremaining part of the year because there will still be slack in the economy andwage growth should remain below productivity gains while the zloty shouldappreciate once the elevated risk aversion due to the uncertainty, caused bythe euro zone public debt crisis, declines. The MPC has expressed the viewthat upside and downside risks to inflation are broadly balanced and wedo not think that this description will change unfavorably in the near future.A new inflation project from the NBP will cast more light in this respect, butit will be available at the end of June.
Fiscal Developments and Policy
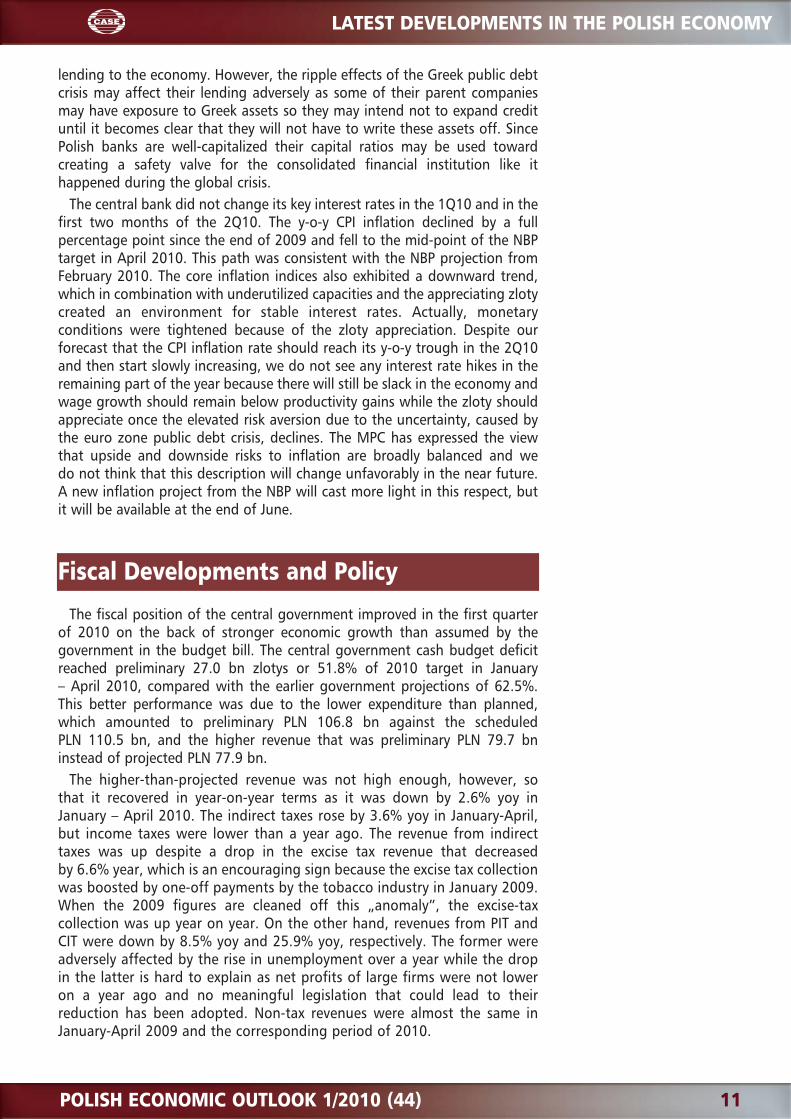
The fiscal position of the central government improved in the first quarterof 2010 on the back of stronger economic growth than assumed by thegovernment in the budget bill. The central government cash budget deficitreached preliminary 27.0 bn zlotys or 51.8% of 2010 target in January– April 2010, compared with the earlier government projections of 62.5%.This better performance was due to the lower expenditure than planned,which amounted to preliminary PLN 106.8 bn against the scheduledPLN 110.5 bn, and the higher revenue that was preliminary PLN 79.7 bninstead of projected PLN 77.9 bn.
The higher-than-projected revenue was not high enough, however, sothat it recovered in year-on-year terms as it was down by 2.6% yoy inJanuary – April 2010. The indirect taxes rose by 3.6% yoy in January-April,but income taxes were lower than a year ago. The revenue from indirecttaxes was up despite a drop in the excise tax revenue that decreasedby 6.6% year, which is an encouraging sign because the excise tax collectionwas boosted by one-off payments by the tobacco industry in January 2009.When the 2009 figures are cleaned off this „anomaly”, the excise-taxcollection was up year on year. On the other hand, revenues from PIT andCIT were down by 8.5% yoy and 25.9% yoy, respectively. The former wereadversely affected by the rise in unemployment over a year while the dropin the latter is hard to explain as net profits of large firms were not loweron a year ago and no meaningful legislation that could lead to theirreduction has been adopted. Non-tax revenues were almost the same inJanuary-April 2009 and the corresponding period of 2010.
12 POLISH ECONOMIC OUTLOOK 1/2010 (44)
LATEST DEVELOPMENTS IN THE POLISH ECONOMY
Figure 5. Central Government Budget Deficit, % annual projection
The expenditure was lower than planned in January-April 2010 due todelays in some spending so this underperformance should not beextrapolated to upcoming quarters. The reversal of the upwardunemployment trend could bring some relief to the Social Insurance Fund,but it is uncertain that the government would cut the subsidy to it in case thefund had enough funding from social taxes because the Fund has takencredits and its rising liquidity would allow it to repay them.
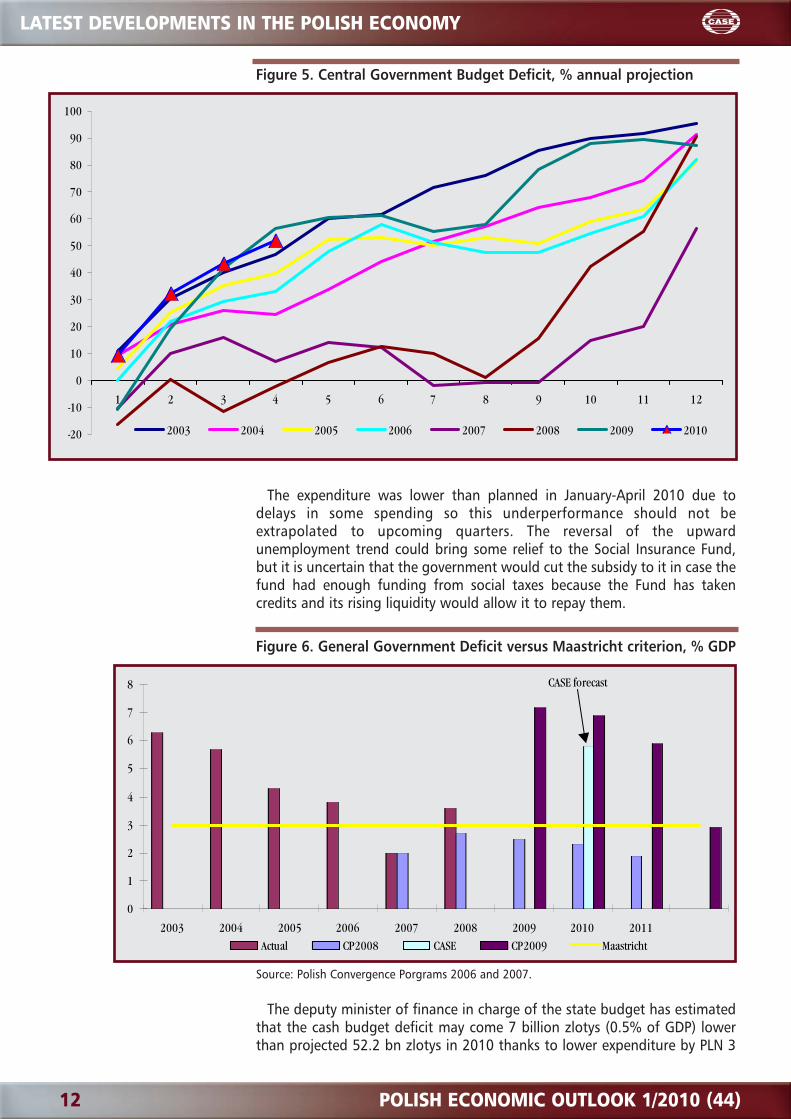
Figure 6. General Government Deficit versus Maastricht criterion, % GDP
Source: Polish Convergence Porgrams 2006 and 2007.
The deputy minister of finance in charge of the state budget has estimatedthat the cash budget deficit may come 7 billion zlotys (0.5% of GDP) lowerthan projected 52.2 bn zlotys in 2010 thanks to lower expenditure by PLN 3
-20
-10
0
10
20
30
40
50
60
70
80
90
100
1 2 3 4 5 6 7 8 9 10 11 12
2003 2004 2005 2006 2007 2008 2009 2010
0
1
2
3
4
5
6
7
8
2003 2004 2005 2006 2007 2008 2009 2010 2011
Actual CP2008 CASE CP2009 Maastricht
CASE forecast
POLISH ECONOMIC OUTLOOK 1/2010 (44) 13
LATEST DEVELOPMENTS IN THE POLISH ECONOMY
billion than assumed and a PLN 4 billion payment to the budget by the NBPfrom its net income. The state budget has assumed that there will be no sucha payment. This means she has not included a potential rise in tax revenueabove the government projection. We think that this is a conservativeassessment because she has not included a potential rise in tax revenue abovethe government projection. It is possible that the tax collection willoutperform the assumptions and the dividends from corporations, in whichthe state has its shares will also be higher as the net incomes of corporatesector should be on the rise in sync with economic growth.
The key uncertainty at present is how the great flood in May-June will affectthe budget expenditure. Preliminary estimates of damages are of the orderof 8 to 12 billion zlotys (2-3 billion euros) or up to 1% of GDP. The previousflood of such proportions happened in 1997 so it gives some clue in thisrespect. Neither the cash deficit was raised nor expenditure increased in theaftermath of the flood. The government approved a supplementary budgetthat provided a rescheduling of expenditure, i. e. changed the purpose ofprovisions, within the same limit so that it could be used for the post-floodreconstruction. In addition, it was granted loans from internationalinstitutions: EIB and Worldbank granted USD 300 mn each in cheap credits forthe reconstruction of infrastructure.
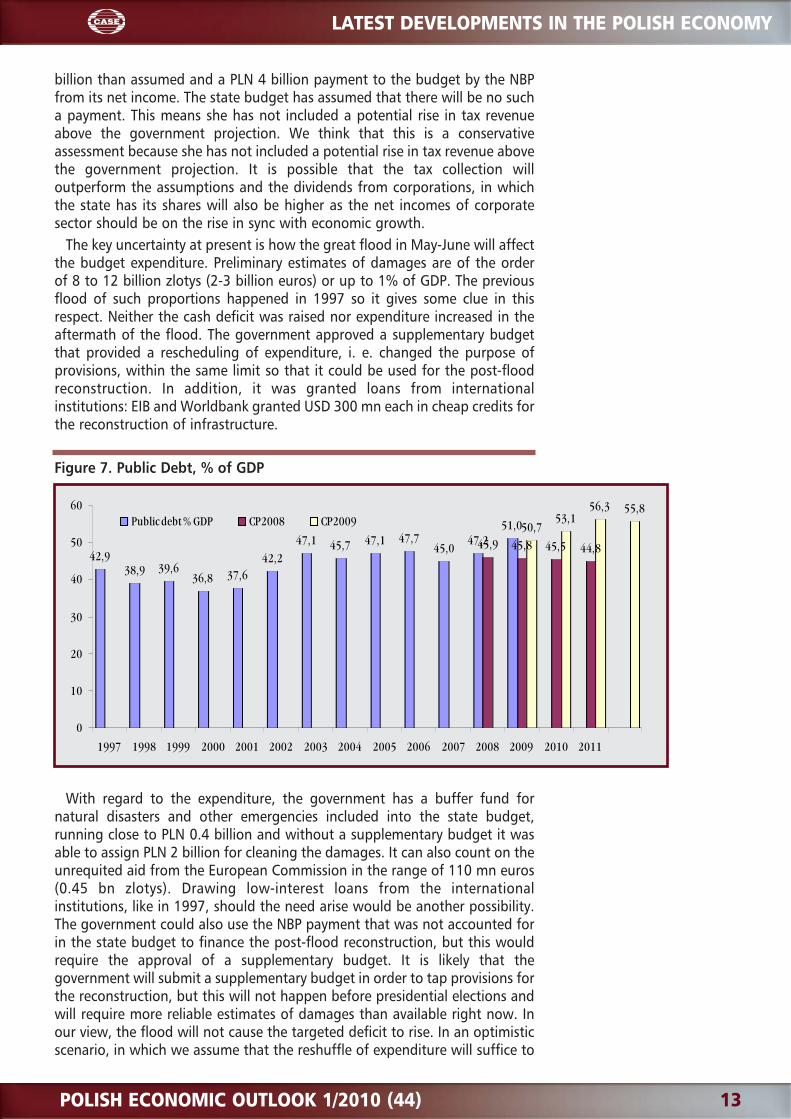
Figure 7. Public Debt, % of GDP
With regard to the expenditure, the government has a buffer fund fornatural disasters and other emergencies included into the state budget,running close to PLN 0.4 billion and without a supplementary budget it wasable to assign PLN 2 billion for cleaning the damages. It can also count on theunrequited aid from the European Commission in the range of 110 mn euros(0.45 bn zlotys). Drawing low-interest loans from the internationalinstitutions, like in 1997, should the need arise would be another possibility.The government could also use the NBP payment that was not accounted forin the state budget to finance the post-flood reconstruction, but this wouldrequire the approval of a supplementary budget. It is likely that thegovernment will submit a supplementary budget in order to tap provisions forthe reconstruction, but this will not happen before presidential elections andwill require more reliable estimates of damages than available right now. Inour view, the flood will not cause the targeted deficit to rise. In an optimisticscenario, in which we assume that the reshuffle of expenditure will suffice to
42,938,9 39,6
36,8 37,642,2
47,1 45,7 47,1 47,745,0
47,251,0
45,9 45,8 45,5 44,8
50,753,1
56,3 55,8
0
10
20
30
40
50
60
1997 1998 1999 2000 2001 2002 2003 2004 2005 2006 2007 2008 2009 2010 2011
Public debt % GDP CP2008 CP2009
14 POLISH ECONOMIC OUTLOOK 1/2010 (44)
LATEST DEVELOPMENTS IN THE POLISH ECONOMY
cover the post-flood cleaning, we estimate that the shortfall in 2010 maycome lower by 1 percentage point of GDP than the projected one. This shouldtranslate into a lower general government deficit by a slightly highermagnitude because local governments have their stakes in PIT and CIT.However, the emergency spending of these governments on the post-floodreconstruction may offset this gain so it is hard to say whether the generalgovernment budget would be reduced by the same proportion.
In 2009, the public debt reached 51% of GDP and it is projected by thegovernment to reach 53.1% of GDP in 2010. We do not think there aremeaningful risks that this scenario will not materialize. The ongoing publicdebt crisis in the euro area has led to increased risk aversion lately, which hascaused a depreciation of the zloty. If it persisted through the end of the yearthe public debt could rise above the projected proportion, but it is unlikely tobreach 55% of GDP. The depreciation would have to be substantial 10% fromthe level of PLN 4.00. We have been of the view for a long time that real riskof breaching this threshold concern in 2011. The government has predicted inits 2010 Convergence Program Update that public debt will peak at 56.3% ofGDP in 2011 to start slowly decreasing in 2012. Despite our skepticism thatwe expressed in PEO 4/2009 with regard to the deficit reduction path,outlined in the 2010 Convergence Program Update in compliance with theExcessive Deficit Procedure, we think that the public debt may notbreach 55% of GDP in 2011 provided the general government deficit weresizably lower than projected in 2010.
Labor Market
EmploymentIn the 1Q2010, employment in the enterprise sector, the companies
employing nine and more than 9 workers, fell by only 0.6% yoy,reaching 5,294,000 as compared to the y-o-y decrease of 2.2% registered inthe 4Q2009. On the quarterly basis, the number of employed persons increasedby 0.6%, compared with 0.2% in the 4Q2009. It means that the overallemployment dynamics that had already stopped to worsen at the end ofthe 2009, started to significantly improve at the beginning of 2010. The pace ofthis improvement is slightly higher than we expected in the previous PEO issue.
The section-specific trends from the 1Q2010 are also in general optimisticwith the notable exception of construction, which recorded a deep worseningof employment dynamics. In 1Q2010, the number of construction employeesfell by 0.2% yoy as compared with a 4.6% yoy increase in the 4Q2009. Thisnegative tendency, however, can be explained by exceptionally hard weatherconditions in Poland during winter. By the way, we expected this fall inconstruction employment dynamics in the previous PEO issue. We stick also toour earlier expectations that this negative trend will not continue in the futureand the labor situation in construction will start to improve already in 2Q2010.
Employment dynamics continued to improve significantly in manufacturing,where the y-o-y reduction of the number of employees in the 1Q2010amounted to only 3.6% as compared to 7.6% in 4Q2009. In q-o-q termsemployment increased in 1Q2010 by 0,4% as compared to 3,3% decrease inthe 4Q2009. Employment still increased in hotels and catering sections– by 3.6% in y-o-y terms, although the pace of employment growth there waslower by 0.9 percentage points than in the 4Q2009. We expect this negativetrend can continue also in the 2Q2010, we do not expect, however, that
POLISH ECONOMIC OUTLOOK 1/2010 (44) 15
LATEST DEVELOPMENTS IN THE POLISH ECONOMY
employment in hotels and catering can start to actually decrease. Thebeginning of a new tourist season in the 3Q2010 should help in this respect.Employment dynamics in the 1Q2010 also worsened in other consumerservices' sections, namely in trade and services, where employment fell in y-o-yterms by 1.1% yoy as compared to 0.2% yoy increase in the 4Q2009. Itsuggests that the employment cuts have finally spread from the industrial toservices sectors. We expect, however, that these negative trends should notlast long due to improving domestic demand and worsening of the situationin services sectors will be limited mainly to temporary problems withemployment dynamics.
The employment figures from Labor Force Survey are surprisingly bad forthe 1Q2010. Employment decreased in y-o-y terms by 0.9% as comparedto 0.7% in the 4Q2009. The number of employed persons declinedto 15,574,000.
It seems to be related mainly with extremely hard weather conditions andthere are numerous facts that seem to back such hypothesis. The jobs werelost mainly in industry, the part of which is construction in the LFS data,where the y-o-y employment reduction amounted to 5% and in agriculture,down by 4.6% yoy. On the other hand, employment in services in the 1Q2009was up by 2.2% from the 1Q2009. The number of jobs decreased also onlyamong males who dominate in construction (1.7 % of yoy reduction),whereas the number of employed females increased by 0.1%. More jobs werealso lost in rural areas (down by 1.8% yoy) than in urban ones (- 0.3% yoy) asplant vegetation was delayed. Therefore although the worse than expectedemployment situation according to LFS will influence our general employmentforecast for 2010 it will not change our general optimistic mood regardingthe expected labor market developments.
Employment in the enterprise sector in the 2Q2020 will not change in they-o-y terms, and it will be equivalent to the q-o-q decrease of 0.1%. We expectthat employment in the enterprise sector will start to increase in 2010 – theaverage employment in 2010 will be by 0.1% higher on the average thanin 2009. In 2011, employment in the enterprise sector should start growingby 2.3% yoy. Our forecast for the LFS employment is only slightly lessoptimistic. We still expect that the LFS employment in 2010 will mostprobably stay at exactly the same level as in 2009 while in 2011 it will re-startincreasing at the average pace of 1.2%.
WagesIn the 1Q2010, wage dynamics recorded a slight fall after a short term
stabilization. The average nominal wages in the enterprise sector increasedby 2.8% yoy whereas in the 4Q2009, the y-o-y growth rate was 3.8%. It meantthat real y-o-y average wage dynamics fell below zero, i. e. in the 1Q2010, realwages were by 0.2% lower than in 1Q2009. It was slightly below ourexpectations from the previous PEO issue when we expected the nominal wagegrowth of around 3% yoy. The question is, however, whether the return of thedeteriorating wage dynamics after the half-year long stabilization, recorded inlate 2009 is the longer term phenomenon or the one-off one only. One can tryto answer this question analyzing the wage dynamics in the biggest sections ofthe enterprise sectors.
Firstly, wage dynamics stabilized in manufacturing section (37% ofemployment in the enterprise sector), where wages increased yoy by 4.7% inthe 1Q2010 as compared to 4.4% in the 4Q2009 and 3.4% in the 3Q2009.Secondly, wage dynamics fell in the trade and repairs section (20% ofemployment in the enterprise sector) – from 2.3% in the 3Q2009 and 2.7% in
16 POLISH ECONOMIC OUTLOOK 1/2010 (44)
LATEST DEVELOPMENTS IN THE POLISH ECONOMY
the 4Q2009 to only 1.3% in the 1Q2010. The behavior of wage dynamics inother large sections was very diversified, from a dynamic improvement intransportation and communications, to stability in construction to deepdeterioration in business services.
This very diversified behavior of wage dynamics across sections of theenterprise sector and an improving climate in the Polish economy in the 1Q2010would suggest that the observed fall in the wage dynamics will be a one-offphenomenon so our forecast is based on this assumption.
We do not change significantly our wage forecast from the previous PEOissue. We still expect wage dynamics to creep upward in the nearest future withslight inclinations for growth. Average nominal wage growth in the 2Q2010should stay around 3% yoy and it will result in the real wage y-o-y dynamicsaround 0.5% yoy. During the entire 2010, the nominal wage growth on a y-o-ybasis should stay below 4%. The situation will most probably start to changein 2011 when we expect wages to grow slightly more dynamically – evenaround 5% yoy on average.
UnemploymentIn the 1Q2010, the number of registered unemployed persons
reached 2,076,700 and the unemployment rate was 12.9% so it was belowthe rate we had forecasted in the previous PEO issue. Unemploymentincreased by 18.1% yoy, and it means that the rate of unemployment growthslowed down considerably – in the 4Q2009, the number of unemployed wasby 28.4% higher than in the 4Q2008. Unemployment dynamics slowed downfor the first time since the beginning of 2008. In the q-o-q terms, the numberof unemployed persons increased by 9.7%, as compared to the q-o-qincrease by 19.3% in 1Q2009.
It all means that the situation on the labor market from the point of view ofunemployment is improving surprisingly fast. As of writing this text, wealready know that this positive trend also continued in April, when theunemployment rate fell to 12.3% and the number of unemploymentdecreased by 4.9% qoq as compared to a 2.2% qoq decrease in April 2009.
As usually, we have also cleaned the unemployment figures for the 1Q2009from a seasonal component4. In the 1Q2010, the seasonally adjusted numberof unemployed increased by 1.1% qoq while it increased by 4.5% qoq inthe 4Q2009. Actually, both seasonally adjusted numbers of unemployed inMarch and April 2010 already started to decrease in the m-o-m terms by 0.3%and 0.6%, respectively. The estimated seasonally adjusted unemployment rateat the end of the 1Q2010 reached 12.0%, which is an equivalent to the q-o-qincrease of 0.1 percentage points (0.4 percentage points in the 4Q2009). Theseasonally adjusted figures confirm that the 1Q2010 can becomea breakthrough for the labor market situation in Poland and can start a processof stabilization or even reduction of unemployment in Poland already in 2010.
More detailed information, coming from the Public Employment Service, arealso in general optimistic. Firstly, the growth rate of the inflow of newlyunemployed persons into registers also continued to decelerate. Inthe 1Q2010, this number was only by 0.1% higher than in the 1Q2009,whereas the y-o-y growth rate amounted to 16.0% in the 4Q2009 andto 22.8% in the 3Q2009. Secondly, the number of unemployed who foundnew jobs, increased in the y-o-y terms by 23.6% in the 1Q2010, as comparedto 12.9% in the 4Q2009. It is even more encouraging that the number of
4 De-seasoning performed using the DEMETRA 2.2 software and Tramo/Seats methodology.
POLISH ECONOMIC OUTLOOK 1/2010 (44) 17
LATEST DEVELOPMENTS IN THE POLISH ECONOMY
those who found unsubsidized jobs increased by 20.1% yoy as compared 10%yoy in the 4Q2009.
On the other hand, however, the more detailed analysis of PES data does notallow for an excessive optimism. A growing number of unemployed persons,finding unsubsidized jobs, alone would not be enough to lead to the observeddynamic increase of the total number of job finders among the unemployment.Job placements subsidized by the Public Employment Services, the number ofwhich increased in the 1Q2010 by 48.7% yoy, are also of growing importance.
The other important factor, determining the dynamic decrease of the numberof unemployed in the 1Q2010, was the growing number of unemployed leavingthe registers due to other reasons than finding new job, be it subsidized or not.In the 1Q2010, the number of such persons increased in the y-o-y termsby 17.7%, ie. by 57 000 persons. As much as 44% of this increase was relatedto training and apprenticeship programs The number of participants of thesetypes of programs increased in the y-o-y terms by 34.6% in the 1Q2010.
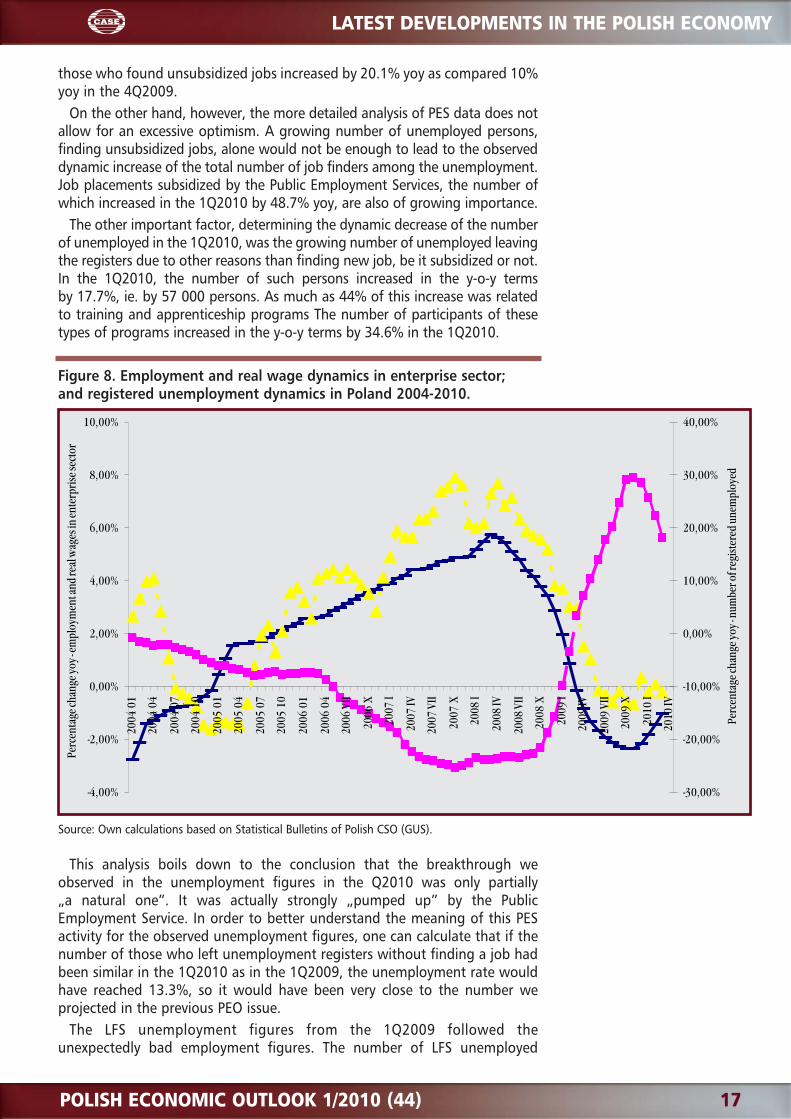
Figure 8. Employment and real wage dynamics in enterprise sector;and registered unemployment dynamics in Poland 2004-2010.
Source: Own calculations based on Statistical Bulletins of Polish CSO (GUS).
This analysis boils down to the conclusion that the breakthrough weobserved in the unemployment figures in the Q2010 was only partially„a natural one”. It was actually strongly „pumped up” by the PublicEmployment Service. In order to better understand the meaning of this PESactivity for the observed unemployment figures, one can calculate that if thenumber of those who left unemployment registers without finding a job hadbeen similar in the 1Q2010 as in the 1Q2009, the unemployment rate wouldhave reached 13.3%, so it would have been very close to the number weprojected in the previous PEO issue.
The LFS unemployment figures from the 1Q2009 followed theunexpectedly bad employment figures. The number of LFS unemployed
-4,00%
-2,00%
0,00%
2,00%
4,00%
6,00%
8,00%
10,00%
2004
01
2004
04
2004
07
2004
10
2005
01
2005
04
2005
07
2005
10
2006
01
2006
04
2006
VII
2006
X
2007
I
2007
IV
2007
VII
2007
X
2008
I
2008
IV
2008
VII
2008
X
2009
I
2009
IV
2009
VII
2009
X
2010
I
2010
IV
Perc
enta
ge ch
ange
yoy -
empl
oym
ent a
nd re
al w
ages
in en
terp
rise
sect
or
-30,00%
-20,00%
-10,00%
0,00%
10,00%
20,00%
30,00%
40,00%
Perc
enta
ge ch
ange
yoy -
num
ber o
f reg
iste
red
unem
ploy
ed
18 POLISH ECONOMIC OUTLOOK 1/2010 (44)
LATEST DEVELOPMENTS IN THE POLISH ECONOMY
increased in the 1Q2010 by 30.1% yoy, reaching 1,839,000. The LFSunemployment rate reached 10.6% and it was much more than we expectedin the previous PEO issue. However, as we have already commented weassess that this worsening of the labor market situation, staying incontradiction with optimistic developments observed in the PES data and inemployment data from the enterprise sector, is mostly related to badweather conditions that caused numerous job losses in construction andagriculture. Therefore, although it will shift our LFS unemployment forecastupwards it will not change the expected direction of trend.
We expect that the registered unemployment rate in 2010 will maintain thefalling trend that started at the beginning of the year, although not asdynamically as the figures from the first quarter could suggest. In the 2Q2010, itshould fall to around 11.5%, but the seasonal factors will start then to workagainst the falling trend and at the end of the year the registered unemploymentshould reach 11.9%. It means that we expect registered unemployment togenerally stabilize on the 2009 level in 2010, and it makes our forecast moreoptimistic than in the previous PEO issue. In 2011, registered unemployment willcontinue to fall, reaching around 10% – 10.5% at the end of the year. Believingthat the unexpectedly bad LFS figures for the 1Q2010 resulted mainly fromadverse weather conditions, we assess that the LFS unemployment will fall to aslow as 9.6% in the 2Q2010. It should stabilize throughout the rest of 2010,reaching 9.7% at the end of the year. In 2011, it will fall to even 8.5%.
External Trade and Balance of Payments
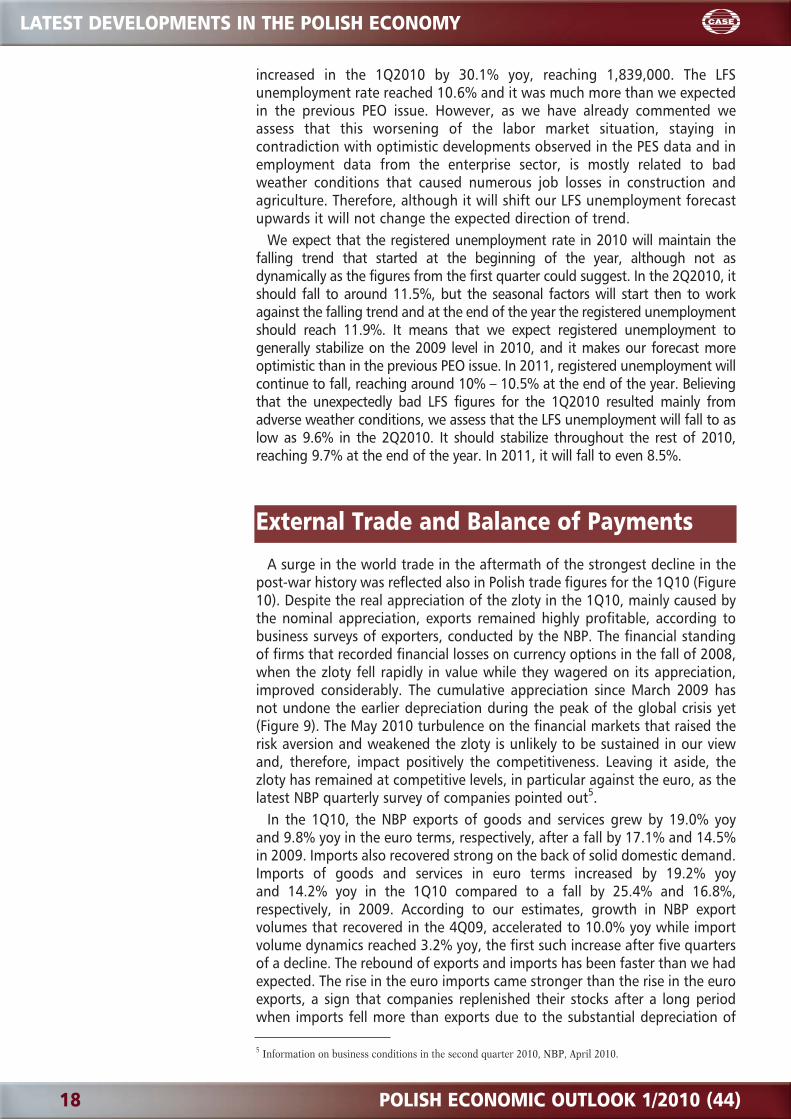
A surge in the world trade in the aftermath of the strongest decline in thepost-war history was reflected also in Polish trade figures for the 1Q10 (Figure10). Despite the real appreciation of the zloty in the 1Q10, mainly caused bythe nominal appreciation, exports remained highly profitable, according tobusiness surveys of exporters, conducted by the NBP. The financial standingof firms that recorded financial losses on currency options in the fall of 2008,when the zloty fell rapidly in value while they wagered on its appreciation,improved considerably. The cumulative appreciation since March 2009 hasnot undone the earlier depreciation during the peak of the global crisis yet(Figure 9). The May 2010 turbulence on the financial markets that raised therisk aversion and weakened the zloty is unlikely to be sustained in our viewand, therefore, impact positively the competitiveness. Leaving it aside, thezloty has remained at competitive levels, in particular against the euro, as thelatest NBP quarterly survey of companies pointed out5.
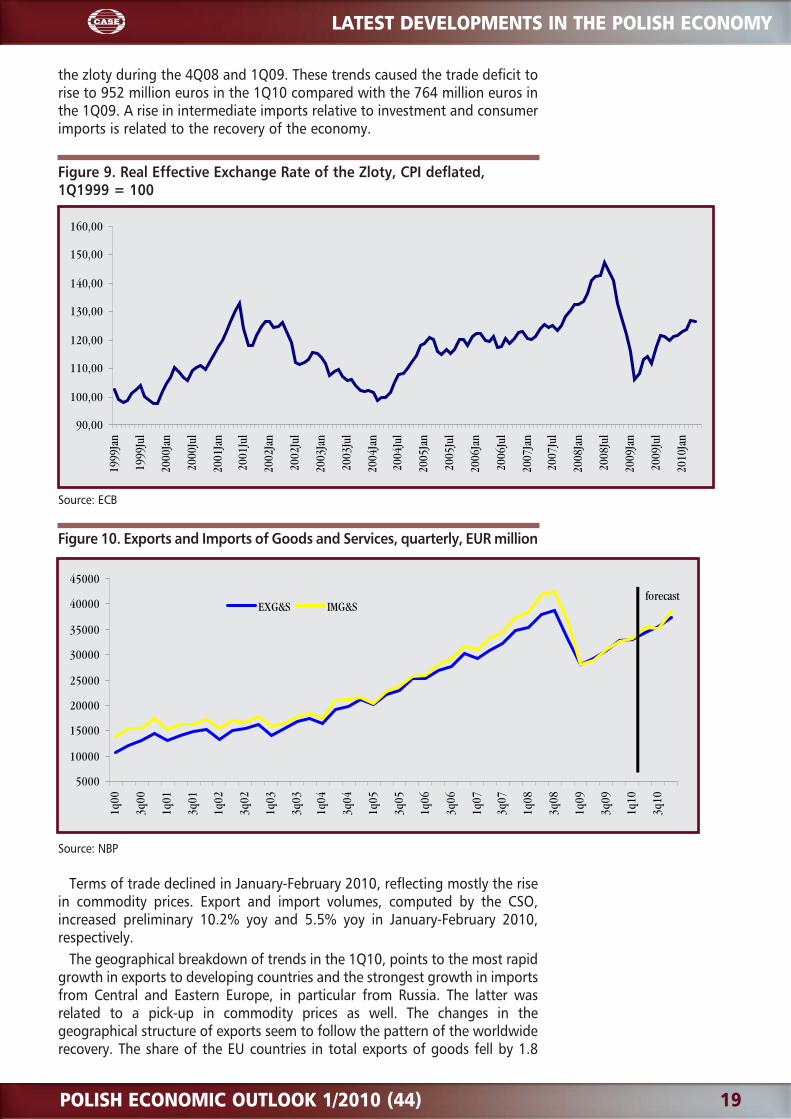
In the 1Q10, the NBP exports of goods and services grew by 19.0% yoyand 9.8% yoy in the euro terms, respectively, after a fall by 17.1% and 14.5%in 2009. Imports also recovered strong on the back of solid domestic demand.Imports of goods and services in euro terms increased by 19.2% yoyand 14.2% yoy in the 1Q10 compared to a fall by 25.4% and 16.8%,respectively, in 2009. According to our estimates, growth in NBP exportvolumes that recovered in the 4Q09, accelerated to 10.0% yoy while importvolume dynamics reached 3.2% yoy, the first such increase after five quartersof a decline. The rebound of exports and imports has been faster than we hadexpected. The rise in the euro imports came stronger than the rise in the euroexports, a sign that companies replenished their stocks after a long periodwhen imports fell more than exports due to the substantial depreciation of
5 Information on business conditions in the second quarter 2010, NBP, April 2010.
POLISH ECONOMIC OUTLOOK 1/2010 (44) 19
LATEST DEVELOPMENTS IN THE POLISH ECONOMY
the zloty during the 4Q08 and 1Q09. These trends caused the trade deficit torise to 952 million euros in the 1Q10 compared with the 764 million euros inthe 1Q09. A rise in intermediate imports relative to investment and consumerimports is related to the recovery of the economy.
Figure 9. Real Effective Exchange Rate of the Zloty, CPI deflated,1Q1999 = 100
Source: ECB
Figure 10. Exports and Imports of Goods and Services, quarterly, EUR million
Source: NBP
Terms of trade declined in January-February 2010, reflecting mostly the risein commodity prices. Export and import volumes, computed by the CSO,increased preliminary 10.2% yoy and 5.5% yoy in January-February 2010,respectively.
The geographical breakdown of trends in the 1Q10, points to the most rapidgrowth in exports to developing countries and the strongest growth in importsfrom Central and Eastern Europe, in particular from Russia. The latter wasrelated to a pick-up in commodity prices as well. The changes in thegeographical structure of exports seem to follow the pattern of the worldwiderecovery. The share of the EU countries in total exports of goods fell by 1.8
90,00
100,00
110,00
120,00
130,00
140,00
150,00
160,00
1999
Jan
1999
Jul
2000
Jan
2000
Jul
2001
Jan
2001
Jul
2002
Jan
2002
Jul
2003
Jan
2003
Jul
2004
Jan
2004
Jul
2005
Jan
2005
Jul
2006
Jan
2006
Jul
2007
Jan
2007
Jul
2008
Jan
2008
Jul
2009
Jan
2009
Jul
2010
Jan
5000
10000
15000
20000
25000
30000
35000
40000
45000
1q00
3q00
1q01
3q01
1q02
3q02
1q03
3q03
1q04
3q04
1q05
3q05
1q06
3q06
1q07
3q07
1q08
3q08
1q09
3q09
1q10
3q10
EXG&S IMG&Sforecast
20 POLISH ECONOMIC OUTLOOK 1/2010 (44)
LATEST DEVELOPMENTS IN THE POLISH ECONOMY
percentage points yoy to 79.2% in the 1Q10 while the share of developingcountries and other advanced economies, including the USA, increased by 0.9and 0.8 percentage points, respectively. It is premature to draw firmconclusion based on these shifts, but they suggest tentatively that Polishexporters are capable of capturing new markets. The breakdown of exports bySITC sections in 1Q10 reveals slower growth in exports of machines, equipmentand transportation means (by 3.3% yoy) than that of total exports (by 3.6%yoy) in zloty terms, which is consistent with the fact that investment activity isstill subdued in the advanced world and in Eastern Europe. The share ofexports of machines, equipment and transportation is over 42% in the totals.
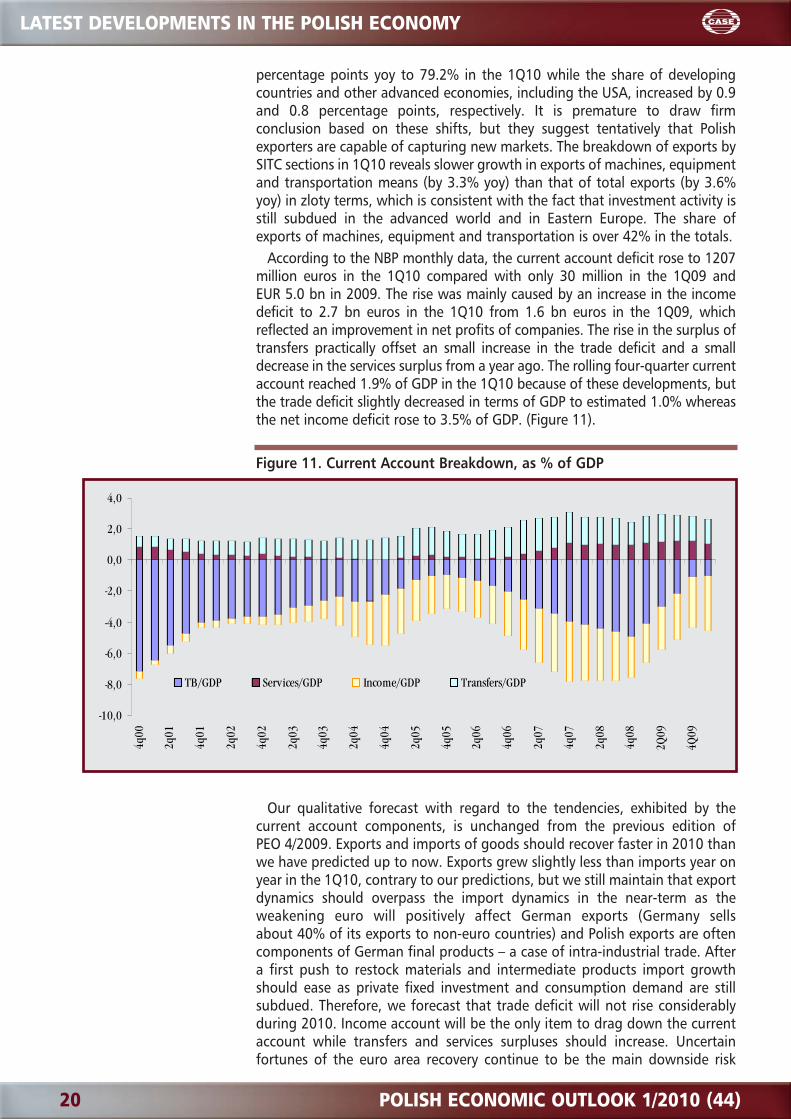
According to the NBP monthly data, the current account deficit rose to 1207million euros in the 1Q10 compared with only 30 million in the 1Q09 andEUR 5.0 bn in 2009. The rise was mainly caused by an increase in the incomedeficit to 2.7 bn euros in the 1Q10 from 1.6 bn euros in the 1Q09, whichreflected an improvement in net profits of companies. The rise in the surplus oftransfers practically offset an small increase in the trade deficit and a smalldecrease in the services surplus from a year ago. The rolling four-quarter currentaccount reached 1.9% of GDP in the 1Q10 because of these developments, butthe trade deficit slightly decreased in terms of GDP to estimated 1.0% whereasthe net income deficit rose to 3.5% of GDP. (Figure 11).
Figure 11. Current Account Breakdown, as % of GDP
Our qualitative forecast with regard to the tendencies, exhibited by thecurrent account components, is unchanged from the previous edition ofPEO 4/2009. Exports and imports of goods should recover faster in 2010 thanwe have predicted up to now. Exports grew slightly less than imports year onyear in the 1Q10, contrary to our predictions, but we still maintain that exportdynamics should overpass the import dynamics in the near-term as theweakening euro will positively affect German exports (Germany sellsabout 40% of its exports to non-euro countries) and Polish exports are oftencomponents of German final products – a case of intra-industrial trade. Aftera first push to restock materials and intermediate products import growthshould ease as private fixed investment and consumption demand are stillsubdued. Therefore, we forecast that trade deficit will not rise considerablyduring 2010. Income account will be the only item to drag down the currentaccount while transfers and services surpluses should increase. Uncertainfortunes of the euro area recovery continue to be the main downside risk
-10,0
-8,0
-6,0
-4,0
-2,0
0,0
2,0
4,0
4q00
2q01
4q01
2q02
4q02
2q03
4q03
2q04
4q04
2q05
4q05
2q06
4q06
2q07
4q07
2q08
4q08
2Q09
4Q09
TB/GDP Services/GDP Income/GDP Transfers/GDP
POLISH ECONOMIC OUTLOOK 1/2010 (44) 21
LATEST DEVELOPMENTS IN THE POLISH ECONOMY
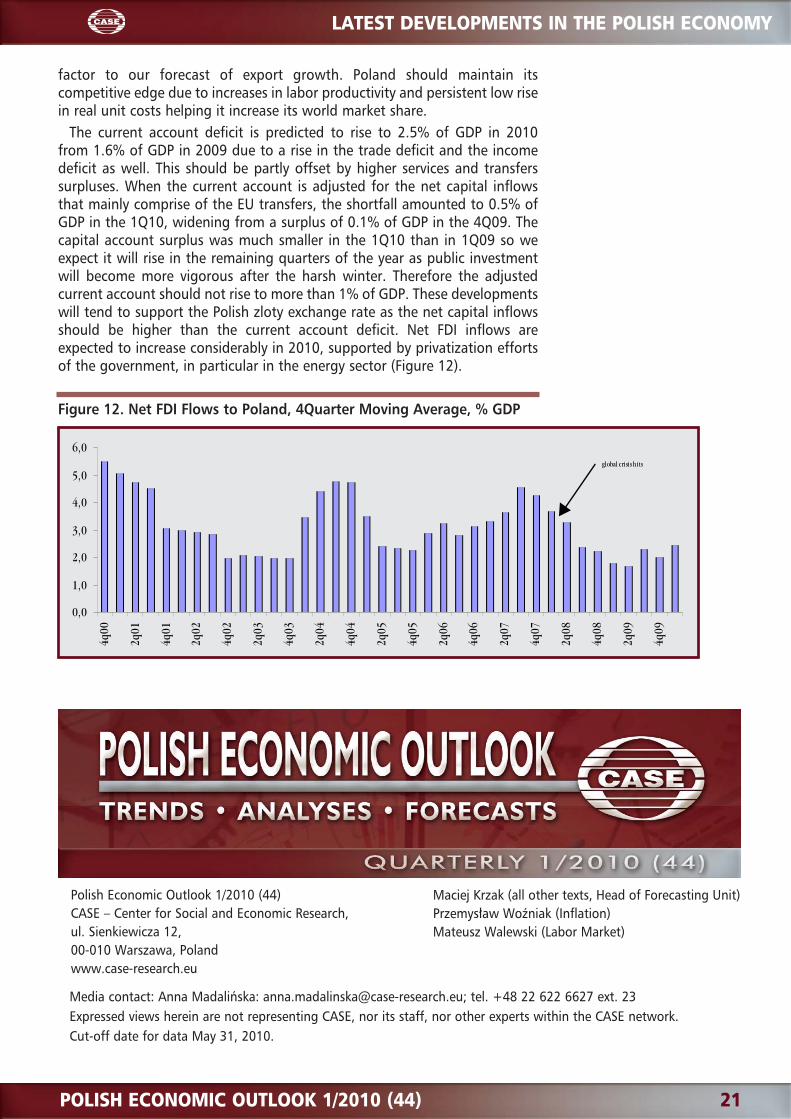
factor to our forecast of export growth. Poland should maintain itscompetitive edge due to increases in labor productivity and persistent low risein real unit costs helping it increase its world market share.
The current account deficit is predicted to rise to 2.5% of GDP in 2010from 1.6% of GDP in 2009 due to a rise in the trade deficit and the incomedeficit as well. This should be partly offset by higher services and transferssurpluses. When the current account is adjusted for the net capital inflowsthat mainly comprise of the EU transfers, the shortfall amounted to 0.5% ofGDP in the 1Q10, widening from a surplus of 0.1% of GDP in the 4Q09. Thecapital account surplus was much smaller in the 1Q10 than in 1Q09 so weexpect it will rise in the remaining quarters of the year as public investmentwill become more vigorous after the harsh winter. Therefore the adjustedcurrent account should not rise to more than 1% of GDP. These developmentswill tend to support the Polish zloty exchange rate as the net capital inflowsshould be higher than the current account deficit. Net FDI inflows areexpected to increase considerably in 2010, supported by privatization effortsof the government, in particular in the energy sector (Figure 12).
Figure 12. Net FDI Flows to Poland, 4Quarter Moving Average, % GDP
0,0
1,0
2,0
3,0
4,0
5,0
6,0
4q00
2q01
4q01
2q02
4q02
2q03
4q03
2q04
4q04
2q05
4q05
2q06
4q06
2q07
4q07
2q08
4q08
2q09
4q09
global crisis hits
Polish Economic Outlook 1/2010 (44)CASE – Center for Social and Economic Research, ul. Sienkiewicza 12, 00-010 Warszawa, Polandwww.case-research.eu
Media contact: Anna Madalińska: [email protected]; tel. +48 22 622 6627 ext. 23Expressed views herein are not representing CASE, nor its staff, nor other experts within the CASE network.Cut-off date for data May 31, 2010.
Maciej Krzak (all other texts, Head of Forecasting Unit)Przemysław Woźniak (Inflation)Mateusz Walewski (Labor Market)