Embed Size (px)
Citation preview

CHAPTER I
INTRODUCTION
Background of the Study
In the best-seller book of Art Williams entitled “Common Sense” (1993), he
pointed out that having background knowledge on financial literacy especially at an early
age is vital for it is most likely for a person who is financially literate to be successful in
managing his finances for the future. He also added that planning and investing is nothing
but a simple mathematical problem, all that a person need to become financially
independent eventually is to understand how money works.
Rooij, Lusardi, and Alssie (2007), found out that those who are exposed to
financial education in school or at a work place tend to save more. It means that the
earlier a person is educated with financial management, the more advanced with financial
background he may possess. Furthermore, Lusardi and Mitchell (2007) showed that those
who display low financial literacy are less likely to plan for the future and as a result,
gather much less wealth.
It was confirmed in the research work of Stango and Zinman (2007) that
individuals who incorrectly calculate interest rates out of stream of payments result to
borrowing more and acquiring lower amount of wealth. Agarwal et al. (2007) showed
that financial mistakes are prevalent among the young and elderly. When one lacks the
knowledge of financial management there is a greater chance to have difficulty in
managing his finances wisely in the near future. Therefore, the concept of financial
literacy goes far further than knowledge on financial matters, it also involves the way this
1

knowledge affects the behavior and attitudes of a person in making decisions (Leitao,
2012).
Economic system today is far more complex compared to the generation before,
where a simple awareness of how to sustain a savings account at banks was more than
sufficient. But at the present, consumers have to distinguish a wide array of financial
merchandises and services available in the contemporary financial market (Ramasawmy
et.al, 2013). Because of that, the need to improve financial literacy among individuals is
becoming increasingly significant. In fact countries such as the United State of America,
Japan, Canada, and United Kingdom introduced financial literacy subject in their
curriculum (http://en.wikipedia.org/wiki/Financial_literacy). In the Philippines, it is only
recently that the Department of Education and Hong Kong-based Prudential Corporation
Asia signed a memorandum of agreement to incorporate financial literacy on the Basic
Education Curriculum in 2012 (Horario, 2013).
Although Filipino’s rating in financial literacy has risen (Vallecera, 2013), it is
still relatively low. It has been found out that only 8% Filipinos who claim to be
specialist in financial management get more than 80% correct answers in financial
literacy quiz conducted by Sun Life of Canada (Dumlao, 2013).
Though there has been no evidence that a heightened financial literacy in an
individual can change his financial behavior such as saving, it is important to note that
saving will most likely make a person afford a good future. According to NEDA as cited
by Tiongzon (2011) on his article in the Philippine Daily Inquirer, savings rate in the
Philippines is one of the lowest around the world. The report place the savings rate
2

among Filipinos between 12 and 16 percent which is very far from 30 percent as
recommended by experts. This may be explained by the first world consumerism lifestyle
among Filipinos.
Statement of the Problem
This study was conceptualized in order gauge the level of awareness on financial
literacy among BSEd Social Studies majors.
Specifically, this study sought answers to the following questions:
1. What is the profile of BSEd Social Studies major students in terms of:
a. Age;
b. Gender;
c. Civil status;
d. Year level;
e. Place of residence (urban/rural);
f. Housing arrangement;
g. Benefactor; and
h. Average Weekly Allowance
2. How do the Social Science majors assess their knowledge in financial
literacy and their financial habits?
3. What is the financial attitude and behavior of the Social Studies majors?
4. Who influenced them in their financial management?
5. How do the Social Science majors fare in the basic financial literacy quiz?
3

Significance of the Study
This study may be meaningful and beneficial to the following:
To the students. It will help them realize how important it is to make wise
financial decisions and to be financially literate so that they will be able to improve their
present and long-term financial well-being.
To the teachers. It will be a great opportunity to reinforce their teaching
approach regarding topics about allocation of resources especially in economics related
subjects.
To curriculum-makers. This study will provide a database for the curriculum-
makers to design curriculum that will cater to the students’ need to be educated in terms
of financial management and related topics.
To future researchers. This study will serve as guide for future researchers to
conduct further researches that are related to financial literacy.
Scope and Delimitation of the Study
This study will look into the level of awareness of the BSEd students of Leyte
Normal University about financial literacy.
Due to financial and time constraints, this study is only limited to the BSEd
second year to fourth year Social Studies major of Leyte Normal University in the second
semester of school year 2013-2014.
4

Research Assumptions
This study will try the following assumptions:
1. Respondent’s age, gender, civil status, class standing, place of residence and
housing arrangement has nothing to do with the level of their financial literacy.
2. Majority of the Social Studies major students will have a high score in the
financial literacy quiz.
Theoretical Framework
The foundation of this study is anchored on Conventional Economic Approach
cited by Lusardi and Mitchell (2007).
Learning is evident when the behavior of the person has changed. Conventional
Economic Approach explains why a person’s chance to be financially independent in the
future is high if he is financially literate than those who are not. The approach implies
that a fully rational and well-informed individual consume less wealth for the future.
Conceptual Framework
This study was conceptualized in order to determine the level of awareness on
financial literacy among BSED Social Studies major students. Further, this study is
presented using the paradigm below.
5

Fig. 1. Paradigm showing the relationship between Independent, Intervening, and Dependent Variables
6
Independent Variable
(Background on Financial Literacy)
Intervening Variable
Part I: Demographic Profile
Part II: Self-assessment Regarding Financial Literacy
Part III: Financial Attitude and Behavior
Part IV: Influences Part V: Basic
Financial Literacy Quiz
Dependent Variable
(Level of Awareness on Financial
Literacy)

Definition of Terms
Basic Financial Literacy Quiz. These are the set of questions of cover topics
ranging from interest rates, interest compounding, inflation, time value of money, and
money illusions. (Lusardi et.al. 2007)
Benefactor. This term refers to a person that send the respondent to school.
Budgeting. This term refers to practical use of money for the future.
Compounding. The ability of a deposit to generate earnings, which are then
redeposit in order to generate their own earnings.
(www.investopedia.com/terms/i/compounding.asp)
Financial Literacy. It is the combination of awareness, knowledge, skills,
attitude and behavior necessary to make sound financial decisions and ultimately
achieved and individual’s financial well-being (OECD’s definition).
Financial Management. Means the efficient and effective way of managing
money of an individual.
Housing Arrangement. It describes where the respondents live in, whether on-
campus or off-campus.
Inflation Rate. The rate at which the general level of prices for goods and
services are rising, and subsequently, purchasing power is falling.
(www.investopedia.com/terms/i/inflation.asp)
Interest Rate. The amount of profit, expressed as a percentage of deposit.
7

Nominal Value of Money. The stated value of money in numerical term.
True Value. Is obtained by removing the effect of price level changes from the
nominal value of time (www.investopedia.com/terms/r/real-value.asp).
8

CHAPTER II
RELATED LITERATURE AND STUDIES
Navigating in today’s world financial system needs a person to be equipped with
adequate financial knowledge that will help him avoid financial disarray.
In the United Kingdom, the government is trying to enhance the financial
capabilities of its people especially those who have less income and people with learning
disabilities (www.ifie.org/index.php/resources-clearinghouse/49).
In Australia, they developed the National Financial Literacy Strategy to provide a
national direction to improve financial literacy among its citizens. They also established a
National Consumer and Financial Literacy Taskforce in 2004, which recommended the
establishment of the Financial Literacy Foundation in 2005. After three years, the
functions of the Foundation were transferred to the Australian Securities and Investments
Commission (ASIC). The Australian Government also runs a range of programs to
improve the financial literacy of its Indigenous population, particularly those living in
remote communities (Clitheroe, 2004).
Financial literacy between adults and among teens and young adults vary through
their behavioral patterns. In the United States, adults have low sense of accountability. It
was observed that 28% of adults failed to pay their bills on time. However, even 65% of
adults wanted to be more financially literate, only few undertake the steps to refine their
financial skills. Only 64% of adults are convinced that financial practice is more
significant than physical practice, yet behind this percentage, only 18% possesses, to
incorporate the former as a part of their routine. Like adults, teens and young adults are
also experiencing the same thing. Between 16-18 years old individuals, 77% of them
9

believe that they are “financially savvy” yet only 35% are able to do some bank
statement activities and only 31% of then knows how credit card interest and fees work.
According to Annamaria Lusardi in her speech before the U.S. Senate Committee
on Health, Education, Labor and Pension last April 24, 2013, one of the reasons why
American government or any government around the world should launch financial
literacy efforts among their schools has something to do with equality. Studies show that
in terms of gender, more men are financially literate than women. According to Charles
Schwab & Co., Inc as cited by Llewellyn (2012) more men than women knows how
credit card interest and fees work.
Financial education programs in the United States of America were implemented
over years. Some of its States designed approaches like financial counseling that
improves and advices financial decision-making among Americans (Agarwal, et.al.
2011). Assembly Bill 166 of California obliged the state to integrate financial literacy in
the existing curriculum. In anent to this, Assembly Bill 391 or Common Cents
Curriculum Act was enacted in 2013 which require developing a one-semester
instructional program entitled consumer economics for post-secondary education before
July 1, 2015 (http//:www.ncsl.org/research/financial-services-and-commerce/financial-
literacy-2013-legislation.asp).
In Singapore, their government had made financial literacy program for their
schools. Since financial education seems to be a large issue to most students, the
National Institute of Education or NIE handed over an educational training for teachers
through the Citi-NIE financial literacy hub for teachers being funded by a grant from Citi
Foundation. These training workshops for teachers enable them to be equipped in
10
engaging pedagogy and idea to incorporate financial literacy in their curriculum. It also
provides an understanding in regards to different factors that motivate students to acquire
financial literacy skills and knowledge. To support this school task force, mentoring is
given. Schools benefits from the hubs mentoring model where trainers are guided and
empowered a group of teachers called the tasked force to made plans on how to
implement financial education in their curriculum. Currently there is an ongoing research
into the effectiveness of the program implemented (www.singaporeqp.com)
In Romania, United Nations Development Project (UNDP) disclosed that of about
9 million of the Romanian Citizens aged 18-45 years old only 14% of them are totally
financial literate and 65% find it difficult to cover their daily needs. That is why UNDP
came up a project that aims to facilitate the financial education of Romanian citizens
which would contribute to Romania’s economic and social development. The impact
analysis of the project will be evaluated by pretest and posttest and also through an in-
depth questionnaire on financial literacy. The outcome of the project and the result of the
impact analysis will be provided to the government as a policy recommendation on a
financial awareness of the Romania’s citizens (www.undp.ro/projects.php?
project_id=72).
In Peru, the state has offered financial training with credit, microfinance
institutions as a way to better management for their loans repayments and avoid debt.
According to Chong, Karlan and Valdivia, (2010), one way to deliver financial literacy
and to minimize educational cost is by using of Information and Communication
Technologies or ICT’S such as radio and television and social networking sites as
mediums of financial education for Peruvian citizens.
11

In Bangladesh, financial literacy project was launched last May 20, 2013 to bring
large communities under banking services. Top official said that the concept of financial
literacy spread across the world following the global financial crisis to ensure financial
stability. Financial literacy program since then, has been designed by giving importance
on the needs of the people, who still remain unbanked, including school and college-
going students, women, poor rural and urban people, and aged citizens. The project also
aims at bringing under the financial services the people who thinks they do not need to
go to banks. Bangladesh Bank is working for making a web link under this project to
provide information about what people will have to do for getting the services
(www.dhakatribune.com).
In Philippines, according to the survey on financial literacy among Filipinos
conducted by Citi Bank, they found out that there is improvement in the Filipinos when it
comes in financial matters. Filipinos are now said to be more financially literate. They are
learning the basics in budgeting, planning and savings. Survey shows that nine out of 10
Filipinos create a budget on a monthly basis, 65% shows importance to stick with their
budget and 63% are on track on their retirement plans. This survey also found the
average financial literacy score across Asia has pushed past the 50 point marked at 53.2
%, it only shows a positive financial future for Filipinos. When it comes to savings, 44%
reported that they save a portion of their salary and 57% believe that they have enough
insurance for themselves and their families (Vallecera, 2013). Last February 7 and 8,
2012 a National Summit was held with a gathering of about 100 partner-educators,
representatives of various cooperatives under the umbrella of the National Confederation
12
of Cooperatives (NATCCO). Through Aflauton Program, member cooperatives will help
educate children in financial management (Samson, 2012).
It has been the state’s ideal goal to improve economic development among
Filipino people (see Article XII of the 1987 Constitution), that is the reason why senator
Juan Edgardo Angara filed the senate bill 201 also known as Financial Literacy Act of
2013 where it pushes the inclusion of entrepreneurial and financial literacy education as
an integral part of secondary education which will be a great help towards the financial
literacy of the students (Torres, 2013).
13

CHAPTER III
METHODOLOGY
This section contains a discussion of the research design, research locale, research
respondents, research instrument, data collection technique, data analysis, statistical
treatment and methods of scoring.
Research Design
The quantitative survey method of research was utilized in this study since this
study intends to determine the level of awareness on financial literacy among BSEd
Social Studies major students. It looked into the extent the self-assessment of the
respondents regarding financial habits, and attitudes and behavior. It also determined
where the students get influence as regards financial literacy.
Research Locale
This study was conducted within the premises of Leyte Normal University. It is
one of the universities in Eastern Visayas that is strategically located at P. Paterno Street,
Tacloban City. Whatever results gathered do not necessarily reflect the level of
awareness of the whole population of the LNU students.
Research Respondents
The respondents of the study were the population of BSEd Social Science majors
in Leyte Normal University, Tacloban City during the second semester of school year
2013-2014. The total population of Social Studies majors from 2nd year to 4th year is 89
students excluding the researchers.
14

Sampling Procedure
The researchers utilized purposive sampling procedure in conducting the study.
The main goal was to focus solely on BSEd Social Studies major students in order to
determine their level of awareness on financial literacy.
Research Instrument
As the primary tool for the data gathering, the investigation used a survey
questionnaire. Some questions were obtained from different research questionnaires
outside the country while some questions were modified by the researchers taking into
consideration the local realities. The survey results were tabulated, analyzed and the level
of awareness on financial literacy among the respondents gauged.
The survey questionnaire is composed of 45 items. The questionnaire is divided
into five parts namely: Part I: Demographic Profile, Part II: Self-assessment Regarding
Financial Literacy and Habits, Part III: Financial Attitude and Behavior, Part IV:
Influences, and Part V: Basic Financial Literacy Questions.
Part I: Demographic Profile
This part of the questionnaire was designed to capture the profile of each
respondent. It includes the class standing, gender, civil status, place of residence,
benefactor, and housing arrangement of the respondents.
Part II: Self-assessment Regarding Financial Literacy and Habits
This part of questionnaire measures the respondent’s self-awareness on financial
literacy. It includes their personal understanding on financial literacy. This part was also
determined if the respondent has attended any lectures or seminars on financial literacy, if
15

he has a budget and whether he is saving or not. The second and third item in this part of
the questionnaire was obtained from the Senior Honor Thesis of Llewellyn (2012).
Part III: Financial Attitude and Behavioral Statements
This part determines the respondent’s attitude and behavior in managing his
finances. This part of the questionnaire was acquired from Financial Literacy Survey
Report, 2012 of Janke and Trechter.
Part IV: Influences
This part determined how much did respondents learn about financial
management from the influencers such as; parents, friends, school, books, media, job, life
experiences, internet, informal seminars or class, and financial planners. It also included
how often the respondents are being influenced or how often the respondent discusses
financial matters with the influencers (enumerated above). This part of the questionnaire
was acquired from Financial Literacy Survey Report, 2012 of Janke and Trechter.
Part V: Basic Financial Literacy Questions
This part attempts to assess the basic financial literacy of the respondent that
cover topics ranging from interest compounding to the effects of inflation, discounting
and nominal versus true value of money. This part of the questionnaire was adopted from
the working paper of Van Rooij, et al. (2007).
Data Collection Technique
The questionnaires were administered personally by the researchers to the
respondents. They were asked to answer the questions honestly. The researchers
immediately retrieved the questionnaires. The results gathered were the basis for data
analysis.
16
Data Analysis/ Statistical treatment
The data which were collected from the various respondents were classified,
tabulated and subjected to statistical analysis in order to formulate objective
interpretation in terms of research findings, conclusions and recommendations. Specified
instruments were used to gather data and appropriate statistical tools were employed.
This was a fact-finding study with an adequate and accurate interpretation of the data. It
described the status of awareness on financial literacy among BSEd Social Science
majors in Leyte Normal University, Tacloban City during the second semester of school
year 2013-2014.
Relative Frequency (%) = n/N x 100
Where:
% = Relative Frequency of Percentage
n = Number of Responses/Question
N = Total Number of Respondents
The researchers also utilized the weighted mean formula in giving interpretation
to the gathered data in the Part II item 1, Part II item 6, Part III, Part IV item A, and Part
IV item B of the questionnaire.
Weighted Mean = ∑ fx / N
17

Where:
f = the frequency or the number of responses on each question or
indicator
x = each indicator or scale
N = the total number of respondents
∑ = the summation or total
METHODS OF SCORING
The following are the ranges to interpret the data gathered using the qualitative
description adopted in this study.
Part II item 1 of the questionnaire
Attainment of Objectives Qualitative Description
Range:
4.50 – 5.00 Very High
3.50 – 4.49 High
2.50 – 3.49 Moderate
1.50 – 2.49 Low
1.00 – 1.49 Very Low
18

Part II item 6 of the questionnaire
Attainment of Objectives Qualitative Description
Range:
3.50 – 4.00 Very Prepared
2.50 – 3.49 Prepared
1.50 – 2.49 Somewhat Prepared
1.00 – 1.49 Not Prepared
Part III of the questionnaire
Attainment of Objectives Qualitative Description
Range:
4.50 – 5.00 Very True of Me
3.50 – 4.49 True of Me
2.50 – 3.49 Sometimes Not True of Me
1.50 – 2.49 Not True of Me Most of the Time
1.00 – 1.49 Not at All True of Me
19

Part IV item A of the questionnaire
Attainment of Objectives Qualitative Description
Range:
4.50 – 5.00 A Lot
3.50 – 4.49 Enough
2.50 – 3.49 Not so Much
1.50 – 2.49 Little
1.00 – 1.49 None
Part IV item B of the questionnaire
Attainment of Objectives Qualitative Description
Range:
4.50 – 5.00 Weekly
3.50 – 4.49 Twice per Month
2.50 – 3.49 Every Few Months
1.50 – 2.49 Once per Year
1.00 – 1.49 Never
20

CHAPTER IV
PRESENTATION, ANALYSIS, AND INTERPRETATION OF DATA
The data gathered using the researcher-modified survey questionnaire are herein
presented, analyzed, and interpreted.
Table 1 shows the summarized tabular presentation of the respondents’ profile. It
can be gleaned that majority of the respondents, in fact 60 or 70.6% have reached legal
age. The row for gender signifies that most Social Studies specializers are female.
Though the researchers found that there is a difference between the mean score of males
and females in the basic financial literacy quiz, the difference is not statistically
significant which means that gender of individual has nothing to do with financial
literacy. Respondents were mostly single at 82 out of 85 or 96.5%. Responses from those
who live in the rural areas comprise of 40 respondents or 46.9% of the sample, while 34
or 40% of the respondents came from the urban areas. It is also worth noting that 11 or
almost 13% of the respondents either answered don’t know or didn’t respond at all to the
question related to their place of residence. Further, most of the respondents are either
living on the homes with their parents at 38 out of 85 or 44.7% or renting on boarding
houses at 35 out of 85 or 41.2%. Sixty-two (62) or 72.9% of the respondents are being
financed in school by their parents while 9 of them or 10.6% are scholars. Seven (7) or
(8.2%) of the respondents are being sent to school by their relatives while 2 or 2.4% of
them answered others. Lastly, almost half of the respondents at 42 out of 85 or 49.4%
have 101 to 500 pesos average weekly allowance while a significant number of
21
respondents at 30 or 35.3% who are enjoying their average weekly allowance that reaches
501 to 1000 pesos.
Table 1 Respondents’ Profile
Age17 18 19 20 21 24 27 28 No Response
f % f % f % f % f % f % f % f % f %
2nd Year 7 8.2 21 24.7 0 0 2 2.3 0 0 0 0 0 0 0 0 9 10.6
3rd Year 0 0 4 4.7 9 10.6 2 2.3 1 1.2 0 0 1 1.2 0 0 2 2.4
4th Year 0 0 1 1.2 2 2.3 8 9.5 7 8.2 1 1.2 0 0 1 1.2 7 8.2
Number of Respondents 7 8.2 26 30.6 11 12.9 12 14.1 8 9.4 1 1.2 1 1.2 1 1.2 18 21.2
GenderMale Female No Response
f % f % f %
2nd Year 7 8.2 31 36.5 1 1.2
3rd Year 7 8.2 12 14.2 0 0
4th Year 7 8.2 20 23.5 0 0
Number of Respondents 21 24.6 63 74.2 1 1.2
Civil StatusSingle Married No Response
f % f % f %
2nd Year 39 45.9 0 0 0 0
3rd Year 19 22.4 0 0 0 0
4th Year 24 28.2 1 1.2 2 2.3
Number of Respondents 82 96.5 1 1.2 2 2.3
CommunityRural Urban Don’t Know No Response
f % f % f % f %
2nd Year 18 21.2 17 20.0 2 2.4 2 2.4
3rd Year 8 9.3 7 8.2 0 0 4 4.7
4th Year 14 16.4 10 11.8 1 1.2 2 2.4
Number of Respondents 40 46.9 34 40.0 3 3.6 8 9.5
Housing ArrangementDormitory Off-campus Rent Off-campus Own Live w/ Family Others No Response
f % f % F % f % f % f %
2nd Year 2 2.4 19 22.3 2 2.4 16 18.7 0 0 0 0
3rd Year 0 0 6 7.1 0 0 9 10.6 1 1.2 3 3.4
4th Year 2 2.4 10 11.8 0 0 13 15.3 0 0 2 2.4
Number of Respondents 4 4.8 35 41.2 2 2.4 38 44.6 1 1.2 5 5.8
BenefactorParents Relatives Working Student Scholar Others No Response
f % f % F % f % f % f %
2nd Year 28 32.9 2 2.4 0 0 8 9.4 1 1.2 0 0
3rd Year 15 17.6 1 1.2 1 1.2 1 1.2 1 1.2 0 0
4th Year 19 22.4 4 4.7 1 1.2 0 0 0 0 3 3.4
Number of Respondents 62 72.9 7 8.3 2 2.4 9 10.6 2 2.4 3 3.4
Weekly Allowance0-100 101-500 501-1000 1001 - above No Response
f % f % F % f % f %
2nd Year 3 3.4 25 29.4 7 8.2 4 4.7 0 0
3rd Year 2 2.4 11 12.9 6 7.1 0 0 0 0
4th Year 2 2.4 6 7.1 17 20.0 1 1.2 1 1.2
Number of Respondents 7 8.2 42 49.4 30 35.3 5 5.9 1 1.2
Table 2
22

Respondents’ Self-Assessment on their Understanding on Financial Literacy
Self-assessment f %
Very High 10 11.8
High 27 31.8
Moderate 40 47.0
Low 4 4.7
Very low 0 0
Don’t Know 3 3.5
No Response 1 1.2
Total 85 100
Table 2 shows that 40 or 47% of the respondents assessed themselves to have
moderate understanding on financial literacy. Almost one-third of them at 27 or 32%
claimed that they highly understand what financial literacy is. Those who have very high
confidence on their knowledge on financial literacy stand at 10 or 12%.
Table 3
Distribution of Respondents’ Answer for the Question, “Did Anyone Ever Explain How to Manage Your Finances?”
Did Anyone Ever Explain How To Manage
Your Finances?F %
Yes 61 71.8
No 22 25.9
No Response 2 2.3
Total 85 100
Table 3 illustrates that most of the respondents answered yes in the question “did
anyone ever explain how to manage your finances?” It is also worthy to note that more
23

than a quarter of them at 22 or 26% answered no while 2 or 2.3% of them didn’t respond
to the question.
When asked if the respondents are setting a budget before spending, majority of
them said yes.
Table 4
Distribution of Respondents’ Answer to the Question “Do You Regularly Set a Budget Before Spending?”
Do you set a budget? F %
Yes
I set a unwritten budget but don’t stick to it
5 5.9
I set an unwritten budget and stick to it
33 38.8
I set a written budget but don’t stick to it
11 12.9
I have a written budget and I stick to it
21 24.7
No 14 16.5
No Response 1 1.2
Total 85 100
It can be glanced on Table 4 that 70 or 82.3% of the respondents answered that
they regularly set a budget before spending. Thirty-three (33) or 38.8% of those who
regularly set budget said that theirs were unwritten but they stick to it. A number of the
respondents at 21 or 24.7% said that theirs were written budget and they stick to it.
Sixteen (16) or 18.8% of the respondents said that they set budget but they fail to stick to
it.
24
Meanwhile, 14 or 16.47% of all the respondents are not setting a budget at all
while 1 or 1.2% of them refused to answer.
Table 5
Distribution of the Respondents’ Responses for the Question “Do You Save?”
Do You Save? F %
Yes 70 82.4
No 15 17.6
Total 85 100
Table 5 shows that majority at 70 or 82% of those who responded the survey is
saving money. It is also worth noting that some respondents at 15 or 18% are not saving.
Table 6
Distribution of Respondents’ Responses for the Question “Who is Handling Your Savings?”
Who handles their savings?
F %
Themselves 63 90.0
Friends 2 2.9
Parents 2 2.9
Bank 3 4.3
Total 70 100
It can be gleaned in Table 6 that only 3 or 4.28% of the respondents who said that
they save entrust their money in the bank while majority of them at 63 or 90% keep it
themselves. It is also interesting to note that 2 or 2.86% respondents entrust their money
to their friends while the same number make their parents as overseer of their cash.
25

Table 7
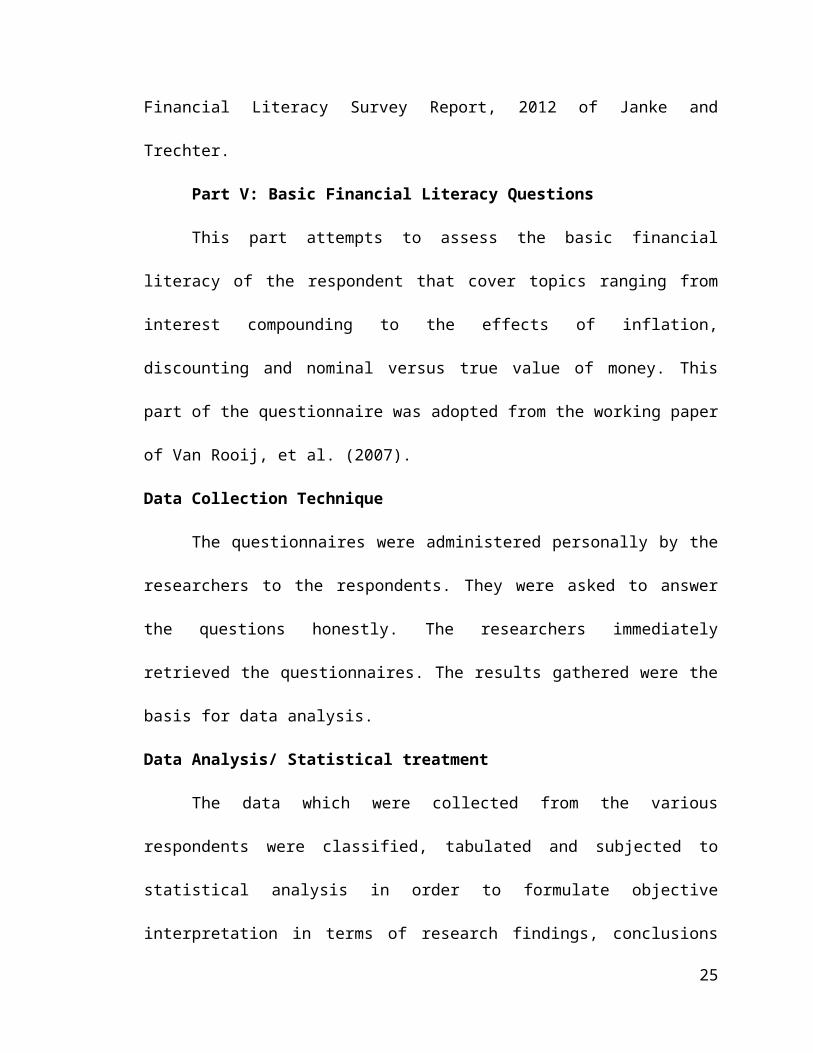
Distribution of the Respondents’ Answer in the Question “How Prepared Are You to Manage Your Own Finances Upon Graduation (On a 4-point Scale)?”
How Prepared Are You to Manage Your Own
Finances Upon Graduation?
f %
1 8 9.4
2 28 32.9
3 39 45.9
4 5 5.9
Don’t know 4 4.7
Refuse 1 1.2
Total 85 100
When asked how prepared the respondents were in managing their finances upon
graduation, more than half at 44 or 51.8% of them seemed to be confident. Twenty-eight
(28) or 32.9% said that they are somewhat prepared while 8 or 9.4% of them said that
they are not prepared. In simpler term, it means that the respondents in general are quite
self-assured when it comes to financial management.
Table 8
Financial Attitude and Behavior of the Respondents
Attitude and BehaviorWeighted
MeanBefore I buy something, I carefully consider whether I can afford it. 4.4
I tend to live for today and let tomorrow take care of itself. 2.3
26

I find it more satisfying to spend money than to save it for the long term. 2.3
I am prepared to risk my own money when saving or making investment. 3
I keep close personal watch on my financial affairs. 3.47
I set long term financial goals and strive to achieve them. 3.19
Money is there to be spent. 2.71
Table 8 shows the attitude and behavior of the respondents with regard to their
finances. In the scale of 1 to 5 (1=not all true of me, 2=not true of me most of the time,
3=sometimes not true of me, 4=true of me, and 5=very true of me), the respondents have
rated each item in the part III of the questionnaire in accordance whether the item
describe their attitude and behavior or not.
Forty-five (45) or 53% of the respondents answered 5 in item number 1.
Meanwhile, 29 or 34% of the respondents rated themselves 4. The mean rating that
respondents gave themselves for item number 1 is 4.4 which implies that it is true that
before they buy something, they carefully consider whether they can afford it or not.
For the second item, the mean rating of all the respondents is 2.3. With that rating,
it is safe to say that most of the time; they tend to be more concerned about their financial
future. This explains why 70 or 82 % of the respondents are setting budget before
spending and the same percentage of respondents save money for future.
In the third item, the respondents rated themselves 2.3 which implies that most of
the time, they save money for the long term. The mean rating for the responses of the
fourth item is 3 which imply that sometimes, it is not true of them that they risk their own
money when saving or making an investment. This clarifies the fact that of those who
said that they save, 63 or 90% of them keep the money themselves. In the fifth item, the
27

mean response is 3.47. It implies that sometimes, it is not true of them that they keep
personal watch over their finances. This may explain why 38 or 44.7% of those who
responded that they set budget before spending sets an unwritten budget. In the sixth
item, the mean score of the respondents is 3.19 which imply that sometimes it is not true
that they set long term financial goals and strive to achieve them. In the last item, the
mean score of the respondents is 2.71. With that score, it is safe to say that sometimes, it
is not true that the respondents think that money is there to be spent.
Table 9
Ratings Given by the Respondents to the Influencers
Influencers Weighted Mean
Parents 4.43
Friends 3.12
School 3.67
Books 3.01
Media 3.07
Job 2.41
Life Experiences 4.21
Internet 2.98
Informal Seminar/Class 2.81
Financial Planner (Professional) 2
Table 9 shows how the respondents rated the influence of each influencer. The
highest influencers with regard to financial management are the parents with the mean
score of 4.43 meaning they learned “enough” from them. Second is through life
experiences with the mean score of 4.21 meaning they learned “enough” from it. The
third is the school with the mean score of 3.67 meaning they learned also “enough” from
it. Influences of friends ranked fourth with mean score of 3.12 meaning they learned “not
28

so much” from them. Fifth place is through media with the mean score of 3.07 meaning
they learned “not so much from it. Books ranked sixth with the mean score of 3.01
meaning they learned “not so much from it. Although internet is considered the biggest
repository of knowledge, it only ranked seventh with the mean score of 2.98 meaning
they learned “not so much” followed by informal class/seminar with the mean score of
2.81 meaning they learned “not so much” from it. Ninth is through job with the mean
score of 2.41 meaning they learned “little” from it. The mean score given by the
respondents to the financial planner is 2 meaning they learned “none” which implies that
there are only few of the respondents who are subscribing to the services of the
professionals/financial planners.
Table 10
Distribution of the Respondents’ Answer on the Question: “How Often Were You Being Influenced by the Following Influencers?”
Influencers1 2 3 4 5
f % f % f % f % f %
Parents 2 2.4 3 3.516
18.8
15
17.6
47
55.3
Friends14
16.5
14
16.5
24
28.2
16
18.8
13
15.3
School11
12.9
7 8.236
42.4
8 9.413
15.3
29

Books18
21.1
18
21.1
26
30.6
8 9.4 6 7.1
Media15
17.6
10
11.8
26
30.6
12
14.1
12
14.1
Job26
30.6
13
15.3
14
16.5
8 9.4 7 8.2
Life Experiences 3 3.5 910.6
19
22.4
16
18.8
33
38.8
Internet13
15.3
7 8.222
25.9
12
14.1
21
24.7
Informal Seminar/Class21
24.7
17
2020
23.5
7 8.2 6 7.1
Financial Planner (Professional)27
28.2
16
18.8
17
20.0
6 7.1 3 3.5
It can be gleaned on Table 10 that respondents tend to talk about their finances to
their parents two times per month. Forty-seven (47) or 55.3% from the total respondents
rated 5 for parents meaning they are influenced “weekly.” Fifteen (15) or 17.6% from the
total respondents rated 4 for parents meaning they are influenced “twice per month.”
Sixteen (16) or 18.8% from the total respondents rated 3 for parents meaning they are
influenced “every few months.” Three (3) or 3.5% from the total respondents rated 2 for
parents meaning they are influenced “once per year.” Two (2) or 2.4% from the total
respondents rated 1 for parents meaning they are “never” influenced. Thirteen (13) or
15.3% from the total respondents rated 5 for friends meaning they are influenced
“weekly.” Sixteen (16) or 18.8% from the total respondents rated 4 for friends meaning
they are influenced “twice per month.” Twenty-four (24) or 28.8% from the total
respondents rated 3 for friends meaning they are influenced “every few months.”
Fourteen (14) or 16.5% from the total respondents rated 2 for friends meaning they are
influenced “once per year.” Also, fourteen (14) or 16.5% from the total respondents rated
1 for friends meaning they were “never” influenced. Thirteen (13) or 15.3% from the
total respondents rated 5 for school meaning they are influenced “weekly.” Eight (8) or
30

9.4% from the total respondents rated 4 for school meaning they are influenced “twice
per month.” Thirty-six (36) or 42.4% from the total respondents rated 3 for school
meaning they are influenced “every few months.” Seven (7) or 8.2% from the total
respondents rated 2 for school meaning they are influenced “once per year.” Eleven (11)
or 12.9% from the total respondents rated 1 for school meaning they are “never”
influenced. Six (6) or 7.1% from the total respondents rated 5 for books meaning they are
influenced “weekly.” Eight (8) or 9.4% from the total respondents rated 4 for books
meaning they are influenced “twice per month.” Twenty-six (26) or 30.6% from the total
respondents rated 3 for books meaning they are influenced “every few months.” Eighteen
(18) or 21.2% from the total respondents rated 2 for books meaning they are influenced
“once per year.” Also, eighteen (18) or 21.2% from the total respondents rated 1 for
books meaning they are “never” influenced. Twelve (12) or 14.1% from the total
respondents rated 5 for media meaning they are influenced “weekly.” Twelve (12) or
14.1% from the total respondents rated 4 for media meaning they are influenced “twice
per month.” Twenty-six (26) or 30.6% from the total respondents rated 3 for media
meaning they are influenced “every few months.” Ten (10) or 11.8% from the total
respondents rated 2 for media meaning they are influenced “once per year.” Also, 15 or
17.6% from the total respondents rated 1 for media meaning they are “never” influenced.
Seven (7) or 8.2% from the total respondents rated 5 for job meaning they are influenced
“weekly.” Eight (8) or 9.4% from the total respondents rated 4 for job meaning they are
influenced “twice per month.” Fourteen (14) or 16.5% from the total respondents rated 3
for job meaning they are influenced “every few months.” Thirteen (13) or 15.3% from the
total respondents rated 2 for job meaning they are influenced “once per year.” Also,
31

Twenty-six (26) or 30.6% from the total respondents rated 1 for job meaning they are
“never” influenced. Thirty-three (33) or 38.8% from the total respondents rated 5 for life
experiences meaning they are influenced “weekly.” Sixteen (16) or 18.8% from the total
respondents rated 4 for life experiences meaning they are influenced “twice per month.”
Nineteen (19) or 22.4% from the total respondents rated 3 for life experiences meaning
they are influenced “every few months.” Nine (9) or 10.6% from the total respondents
rated 2 for life experiences meaning they are influenced “once per year.” Also, three (3)
or 3.5% from the total respondents rated 1 for life experiences meaning they are “never”
influenced. Twenty-one (21) or 24.7% from the total respondents rated 5 for internet
meaning they are influenced “weekly.” Twelve (12) or 14.1% from the total respondents
rated 4 for internet meaning they are influenced “twice per month.” Twenty-two (22) or
25.9% from the total respondents rated 3 for internet meaning they are influenced “every
few months.” Seven (7) or 8.2% from the total respondents rated 2 for internet meaning
they are influenced “once per year.” Thirteen (13) or 15.3% from the total respondents
rated 1 for internet meaning they are “never” influenced. Six (6) or 7.1% from the total
respondents rated 5 for informal seminar/class meaning they are influenced “weekly.”
Seven (7) or 8.2% from the total respondents rated 4 informal seminar/class meaning they
are influenced “twice per month.” Twenty (20) or 23.5% from the total respondents rated
3 for informal seminar/class meaning they are influenced “every few months.” Seventeen
(17) or 20% from the total respondents rated 2 for informal seminar/class meaning they
are influenced “once per year.” Twenty-one (21) or 24.7% from the total respondents
rated 1 for informal seminar/class meaning they are “never” influenced. Three (3) or
3.5% from the total respondents rated 5 for financial planner (professional) meaning they
32

are influenced “weekly.” Six (6) or 7.1% from the total respondents rated 4 financial
planner (professional) meaning they are influenced “twice per month.” Fourteen (14) or
17% from the total respondents rated 3 for financial planner (professional) meaning they
are influenced “every few months.” Sixteen (16) or 18.8% from the total respondents
rated 2 for financial planner (professional) meaning they are influenced “once per year.”
Twenty-four (24) or 28.2% from the total respondents rated 1 for financial planner
(professional) meaning they are “never” influenced.
Table 11
Distribution of the Respondents’ Answer on the Question: “What Did You Learned About Finances in Your Home While Growing Up?”
Learned in Home f %
Work for what you receive 43 50.6Being honest in all dealings 45 52.9
Keeping Records 18 21.2Interest Rates 19 22.3
Giving to Charities 8 9.4Saving 64 75.3
Credit Cards 10 11.8Loans/Debt 20 23.5
Renter’s/Homeowner’s Insurance 5 5.9Life Insurance 16 18.8
Wills 17 20.0Credit 27 31.8Taxes 20 23.5
Investing 20 23.5Budgeting 56 65.9
In table 11, three quarters of the respondents responded that they learned about
saving when they were growing up while 56 or 66% of them said that they learned
budgeting in their houses. Work for what you receive ranked third with 40 or 56% of the
respondents who chose it. Fourth in the rank is being honest in all dealings with 45 or
53%. Twenty-seven (27) or 32% of the respondent answered that they learned about
credit when they were young. Meanwhile, twenty (20) or 24% of the respondents learned
about investing and the same percentage of respondents learned taxes and loans/debt.
33

Next is the interest rate with 19 or 22% of the respondents who checked it. Eighteen (18)
or 21% of the respondents reported that they learned about keeping records while they
were young. When asked about wills, only 17 or 20% of the respondents said that they
learned it while they were young. Sixteen (16) or 19% of the respondents said they were
thought about life insurance. Ten (10) or 12% of the respondents learned about credit
cards while they were growing up in their homes. Eight (8) or 9% of the respondents
responded that they were taught about giving to charities while the least common to them
is renters’/homeowner’s insurance with only 5 or 6% of the respondents said they were
taught about it by their parents.
Table 12
Distribution of the Respondents’ Answer on the Question: “Where Do You Expect to Increase Your Financial Knowledge?”
Influencer f %Others 11 12.9
Financial planner or counselor 17 20.0Life experiences 54 63.5
Job 22 25.9Media 21 24.7Book 24 28.8
School 38 44.7Friends 21 24.7Parents 59 69.4
Table 12 shows that most 59 or 69% of the respondents are expecting to increase
their financial knowledge through the help of their parents. Second in the rank is through
life experiences where 52 or 61% of the respondents said they are expecting to widen
their financial knowledge through it. Meanwhile, 38 or 45% of the respondents are
expectant to learn more about finances through school while 24 or 28% of them are
through books. Twenty-two (22) or 26% of them believed that their financial knowledge
will escalate through their job. Learning from media and friends are both in the sixth spot
34

where 21 or 25% of the respondents reported it as their answer. Seventeen (17) or 20% of
the respondents are expecting that they will enhance their financial knowledge through
financial planner or counselor. Eleven (11) or 13% of the respondent responded to the
question with the response of “others.”
Table 13
Distribution of the Respondents’ Answer on the Question: “How Will You Describe How Finances Were Handled Your Family?”
How finances are handled in their family? f %
My parents included me in some financial decisions
29 34.1
We didn’t talk much about finances but I learned from their examples
24 28.2
My parents explicitly taught me about finances 24 28.2
Within the family we openly discussed our finances
40 47.0
My parents usually argued about finances 24 28.2
It can be gleaned on Table 13 that 40 or 47% of the respondents said that within
their family, they openly discussed matters about finances. Twenty-nine (29) or 34% of
those who responded reported that their parents include them in some financial decisions.
Twenty-four (24) or 28% of the respondents stated that though they didn’t talk about
finances in their homes they learn money management through their parents’ examples.
The same number of respondents described that their parents explicitly taught them about
finances and those who recounted that their parents usually argue about money.
Table 14
Distribution of Respondents’ Responses for the Question “Compared to Your Parents, You are:”
35

Compared to their parents, respondents are:
f %
Much more likely to save 15 17.6
Somewhat more likely to save 27 31.8
About as likely to save/spend 28 32.9
Somewhat more likely to spend 10 11.8
Much more likely to spend 4 4.7
No Response 1 1.2
Total 85 100
It can be observed in Table 14 that comparing to their parents, 28 or 33% of the
respondents responded that they are about as likely to save/spend while 27 or 32% of all
the respondents stated that they are somewhat more likely to save. Fourteen (14) or 17%
said that compared to their parents, they are much more likely to save. Ten (10) or 12%
responded that they are somewhat more likely to spend. Four (4) or 5% of the
respondents assumed that they are much more likely to spend as compared to their
parents. One percent (1%) did not respond to the question.
Table 15
Scores Obtained by the Respondents from Basic Financial Literacy Quiz
Basic Financial Literacy Questions
2nd Year(39 Respondents)
3rd Year(19 Respondents)
4th Year(27 Respondents)
Total(85
Respondents)
N % N % N % N %
Interest Rates 15 38.46 17 89.47 13 48.15 45 52.94
Interest Compounding 6 15.38 4 21.05 4 14.81 14 16.47
36

Inflation 7 17.95 6 31.58 14 51.85 27 31.76
Time Value of Money 6 15.38 10 52.63 17 62.96 33 38.82
Money Illusions 15 38.46 14 73.68 17 62.96 46 54.12
Table 15 shows that 45 or 52.94% of the total number of respondents got the
correct answer on the interest rate question. Meanwhile, only 14 or 16.47% on the
interest compounding, 27 or 31.76% on the question related to inflation. Thirty-three
(33) or 38.82% of the total number of respondents were able to answer the question for
the Time Value of Money while on Money Illusion, 46 or 54.12% got the correct answer.
Table 16
Mean Percentage for Basic Financial Literacy Quiz per Year Level
Year Level Mean (in %)
2nd 25.13
3rd 53.68
4th 48.15
Table 16 shows that the highest mean percentage score among year levels are
those of the third year students with 46 or 53.68%. Next are the fourth year students with
forty-one (41) or 48.15%. While the lowest mean percentage score are those of the
second year students with twenty-one 21 or 25.13%. The table also shows that financial
illiteracy among the BSED Social Studies major student is so prevalent especially among
2nd year students. The researchers compared the mean score of the 2nd year and those of
37
the consolidated mean of 3rd and 4th year respondents and found that year-level based
difference in the survey data is statistically significant. It means that, part of the first
research assumption is nullified. In other words, being exposed to economic-related
courses affects the financial literacy of an individual.
Table 17
Mean Percentage for Basic Financial Literacy Quiz per Item
Basic Financial Literacy Questions Mean (in %)
Interest Rates 52.94
Interest Compounding 16.47
Inflation 31.76
Time Value of Money 38.82
Money Illusions 54.12
It can be gleaned in Table 17 that financial literacy levels among Social Studies
majors are low. Forty-five (45) or 52.94% of the respondents answered correctly the
question related to interest rates. The number of respondents who were able to answer the
interest compounding related question is only 14 or 16.47%. For the question related to
inflation, less than one third of the total number of respondents got the correct answer.
For the item related to time value of money, only 33 or 38.8% answered the item
correctly. Lastly, 46 or 54.12% of the respondents answered correctly the questions
related to money illusion.
38