Embed Size (px)
Citation preview

Design of a patient classification system
for inpatient rehabilitation in Switzerland
Jan Kool1, Marcel Dettling2, Simon Wieser3, Urs Brügger3
1 Institut für Physiotherapie, Departement Gesundheit, ZHAW, Winterthur
2 Institut für Datenanalyse und Prozessdesign, ZHAW, Winterthur
3 Winterthurer Institut für Gesundheitsökonomie, ZHAW, Winterthur
Contact: Simon Wieser, [email protected]

2
Background of study (1)
� Inpatient rehabilitation currently reimbursed with uniform daily tariff.
� The Health Insurance Act of 1994 mandates introduction of a
national tariff system which differentiates patients according to
intensity of care.
− Objective: Contain health care costs at constant quality of care.
� Incentives aiming at cost containment
− Lump-sum payment for standardized treatments (see SwissDRG)
− Increased cost transparency in an nationally uniform tariff system

3
Background of study (2)
� Goal: Develop a patient classification system (PCS) for neurological
rehabilitation that assigns patients to different cost groups based on
predicted intensity of care.
− Cost groups with different tariffs per day of stay, based on a
weekly assessment of patient characteristics.
− Determine the patient characteristics and the number of cost
groups to be included in the PCS.
� Study commissioned by
− Commission for Medical Tariffs (MTK) of the Swiss accident
insurers association
− Association of Swiss hospitals H+

4
Methods – Patient selection
� 7 clinics
� Data collection from November 2007 to June 2008.
� Unit of measurement is single patient week
− Monday to Sunday or shorter, if patient enters or leaves clinic in
reference week.
− Same patient can be selected repeatedly with an interval of at least
three weeks between two assessments
� Selection of patient weeks stratified by accident insurance (UVG)
and health insurance (KVG) coverage
� Information collected on patient characteristics and intensity of care

5
Data – Patient characteristics
� Criteria for selection of patient characteristics:
1. Potential relation with treatment costs
2. Validity and reliability of assessment
3. Possibility of an external assessment by clinic staff
� Patient characteristics include:
1. Personal and socio-economic characteristics
2. Type of insurance (accident / health insurance, private)
3. Clinical characteristics (main diagnosis etc.)
4. Independence in the activities of daily living (ADL) (FIM or EBI)
5. Health habits (alcohol consumption, smoking)
6. Multimorbidity (CIRS)
7. Intensity of pain (scale from 0 to 10)
6
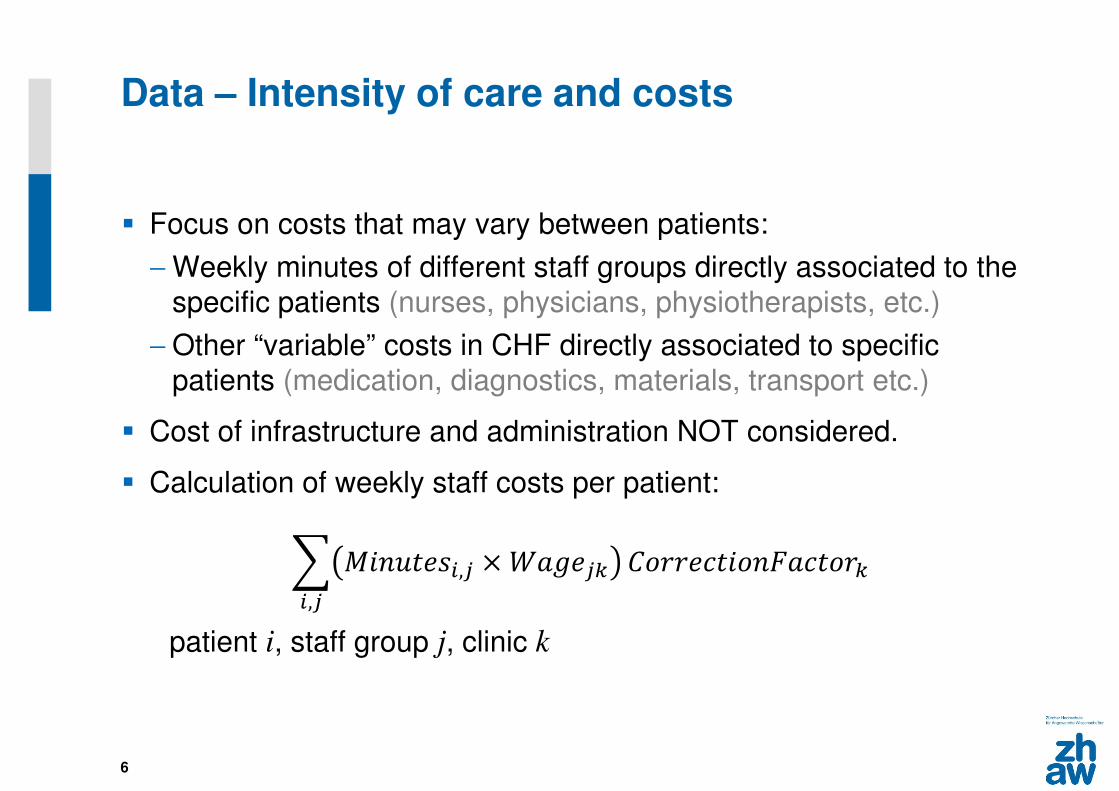
Data – Intensity of care and costs
� Focus on costs that may vary between patients:
− Weekly minutes of different staff groups directly associated to the
specific patients (nurses, physicians, physiotherapists, etc.)
− Other “variable” costs in CHF directly associated to specific
patients (medication, diagnostics, materials, transport etc.)
� Cost of infrastructure and administration NOT considered.
� Calculation of weekly staff costs per patient:
� �������,� × �����,�
�����������������
patient i, staff group j, clinic k

7
Statistical analysis (1)
1. Identify patient characteristics best suited to predict the daily costs
2. Assign patients to separate groups best approximating true costs
� Estimation:
− ln cost_day ="#$ +"#&ADL_Score +"#-Multimorbidity +⋯+ 4− Patient weeks separated into training (80%) and test group (20%)
− Step-by-step forward procedure repeated until the best model
determined according to the Akaike information criterion.
� Goodness-of-fit measures
− adjusted R2
− average absolute prediction error (MAPE).
− mean misclassification rate (MCR) (percentage of patients which
should have been assigned to another cost group)

8
Methods – Statistical analysis (2)
� Daily compensation assumed at baseline to corresponds to average
daily costs of the patient sample in the specific clinics.
− The models corrects for differences in costs across clinics which
are not explained by patient characteristics � “clinic effect”
� We first estimate the “best predicting model”, which may employ all
available variables.
� We then develop a “consensus model” containing only variables
deemed as appropriate by the commissioner.

9
Results (1)
� 691 patient weeks (264 UVG, 427 KVG)
� Average daily costs per patient: CHF 584.1
� Average daily 257.7 minutes directly associated to patients
� Share in daily costs:
− 42.3% nursing staff
− 34.2% therapist staff
− 12.6% physicians
− 10.9% for variable non staff costs

10
Distribution of costs per day
without transformation
cost_day
Fre
qu
en
cy
0
50
0
10
00
15
00
20
00
25
00
30
00
0
10
20
30
40
50
60
with log-transformation
ln(cost_day)
Fre
qu
en
cy
14
8
40
3
10
97
29
81
01
02
03
04
0

11
Results (2)
� No statistically significant difference between UVG and KVG patients.
� No influence of diagnosis
� Models minimizing MAPE:
best predicting
model
consensus
model
ADL score X X
time since diagnosis (months) X
clinic exit in week X X
additional private / semiprivate insurance X
inability to work (yes/no) X
CIRS score X X
body weight (kg) X
clinic entry in week X

12
Partial residual plots of log daily cost on ADL score and Multimorbidity score
Influence of explanatory variable (ADL, Multimorbidity, …) on explained variable
(log_cost), when the influence of all other variables in the model is considered.
ADL-score CIRS Multimorbidity-Score

13
Defining the cost groups and their boundaries
Procedure
1. Calculate predicted costs of each patient
2. Order patients by their predicted costs
3. Divide patients into groups such that each group contains an equal
number of patients
� Compensation corresponds to average costs per cost group.
� Boundaries of the cost groups are defined by the mean of the costs
of the lowest cost patient of the higher class and the highest cost
patient in the lower class.

14
Changes in MAPE and MCR as number of patient groups increases
2 4 6 8 10
40
45
50
55
60
number of patient cost groups
Mean A
PE
Mean Average Predicted Error (APE)
2 4 6 8 10
020
40
60
number of patient cost groups
Mean M
CR
Mean Misclassification Rate (MCR)

15
“Grouper” determining weekly cost group
total score = 6.76- 2.21 (ADL/100)+ 1.12 (CIRS/100)+ 0.083 (IF entry week) + 0.135 (IF exit week)
cost group 25.87≤ total score ≤ 6.11
tariff 1.22
cost group 1total score < 5.87
tariff 1.00
cost group 36.11 ≤ total score < 6.49
tariff 1.81
cost group 4total score ≥ 6.49
tariff 2.72
Compared to a system of a uniform daily tariff, MAPE is reduced from 63% to 38%, while the MCR equals 37%.

16
Discussion (1)
� Simple PCS that can be used as a basis for a tariff system.
� Clinical assessments used (FIM, EBI, CIRS) are often already
employed in the clinics and are useful for patient.
� PCS sets incentives for an appropriate provision of services to
patients with daily costs above or below average.
− With uniform daily tariff, patients requiring a high treatment effort
may not be treated with the necessary intensity or not to be
admitted to the clinic at all.
− With uniform daily tariff, clinics may lengthen stays of patients
requiring a comparably modest treatment effort in order to cross-
subsidize more costly patients.

17
Discussion (2)
� PCS does NOT include an incentive to shorten the length of
stay, such as SwissDRG lump-sum payment.
− But health insurer may limit the length or entirely reject
inpatient rehabilitation, as it has to authorized by health
insurer.
� Limitations:
− Adverse incentive for up-coding (as with DRGs)
− Costs that do not vary with intensity of care not yet
considered.

18
Thank you for your attention!

19
Extra slide – calculation of correction factor
� If a clinic reports a smaller share of total work time dedicated to patients compared to the average clinic, this work time needs to be given a larger weight.
� Average daily staff minutes associated to care of sample patients are multiplied with total number of patient days in clinic in Q4 2008 � total staff minutes directly associated to patients in Q4 2008
� ����������5����� = 67689:;<=:>=68??@:;6A=:BC-$$D67689:;<=:>=68??@:;6A=E<AF69G8==7F86AE67H86A:6=:BC-$$D
� Example: A value of 2 for the nursing staff of a given clinic means that 50% of the total work time of the nursing staff is directly associated with the provision of services to the specific patients