Embed Size (px)
Citation preview
21 March 2016 1
Overview of A.M. Best’s
Stochastic Based BCAR
for U.S. P/C Insurers
Thomas Mount, ACAS, MAAA, CERA, CCM
Vice President, A.M. Best
Agenda
• Overview of BCAR
• Summary of Changes
• Treatment of Risks in BCAR
• Observations/Analyst Views
• Applying BCAR Output in Rating Process
Stochastic Based BCAR for US PC Insurers 21 March 2016 2
Overview
• Best’s Capital Adequacy Ratio (BCAR) is a
comprehensive quantitative tool that evaluates many of the
risks to the balance sheet simultaneously and generates an
overall estimate of the required level of capital to support
those risks and compares it with available capital
• BCAR is a key tool in the assessment of balance sheet
strength
• Not the sole determinant of Balance Sheet Strength
• Not the sole determinant of the rating
21 March 2016 3Stochastic Based BCAR for US PC Insurers
Summary of Changes
• Do not intend to change underlying view of the risks
• Do not intend to change the main risk categories of
the models
• Goals are to:
– Generate risk factors using stochastic simulations
from probability curves & ESG
– Incorporate company specific detailed data from
SRQ & statutory financial statements
21 March 2016 4Stochastic Based BCAR for US PC Insurers
Summary of Changes
• More sophisticated and faster software available
now
– Simulations / probability curves
– Correlations / diversification
– Company specific detail
– Economic scenario generators (ESGs)
• A computer model that randomly simulates thousands of possible
values for a variety of economic and financial variables over a
series of selected timeframes
• An ESG does not predict a path the economy will follow but
instead produces a collection of possible paths including some
that have not yet been observed
21 March 2016 5Stochastic Based BCAR for US PC Insurers
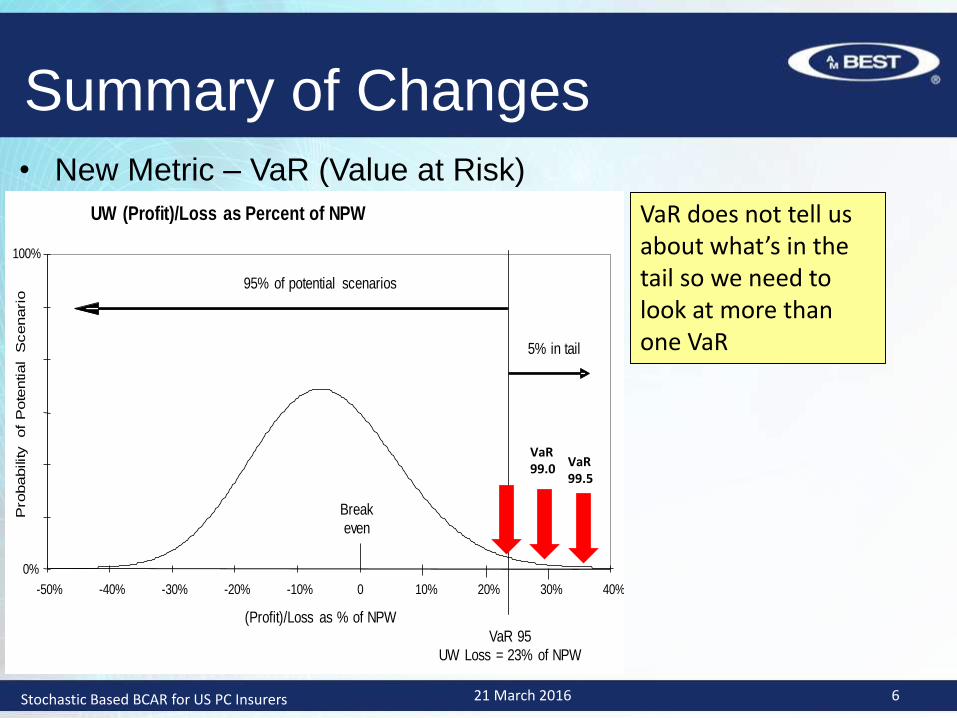
• New Metric – VaR (Value at Risk)
Summary of Changes
UW (Profit)/Loss as Percent of NPW
0%
100%
-50% -40% -30% -20% -10% 0 10% 20% 30% 40%
(Profit)/Loss as % of NPW
5% in tail
Break
even
VaR 95
UW Loss = 23% of NPW
Pro
bability of
Pote
ntial
Scenari
o
95% of potential scenarios
VaR does not tell us about what’s in the tail so we need to look at more than one VaR
VaR99.0
VaR 99.5
21 March 2016 6Stochastic Based BCAR for US PC Insurers
Summary of Changes
• 5 scores calculated and published – instead of 1
• 95%, 99%, 99.5%, 99.8%, and 99.9% confidence
levels
• New Calculation of BCAR
– Formula change
– Difference between Available Capital and
Required Capital, as a ratio to Available Capital
– Better alignment with risk appetite/tolerance
statements
21 March 2016 7Stochastic Based BCAR for US PC Insurers
Summary of Changes
• Bond Defaults (PC&LH)
• Publicly Traded Common Stocks (PC&LH)
• Other Asset Classes (PC&LH)
• Interest Rate Risk (PC&LH)
• Credit Risk – Reinsurance Recoverables (PC&LH)
• Premium Risk (PC)
• Reserve Risk (PC)
21 March 2016 8Stochastic Based BCAR for US PC Insurers
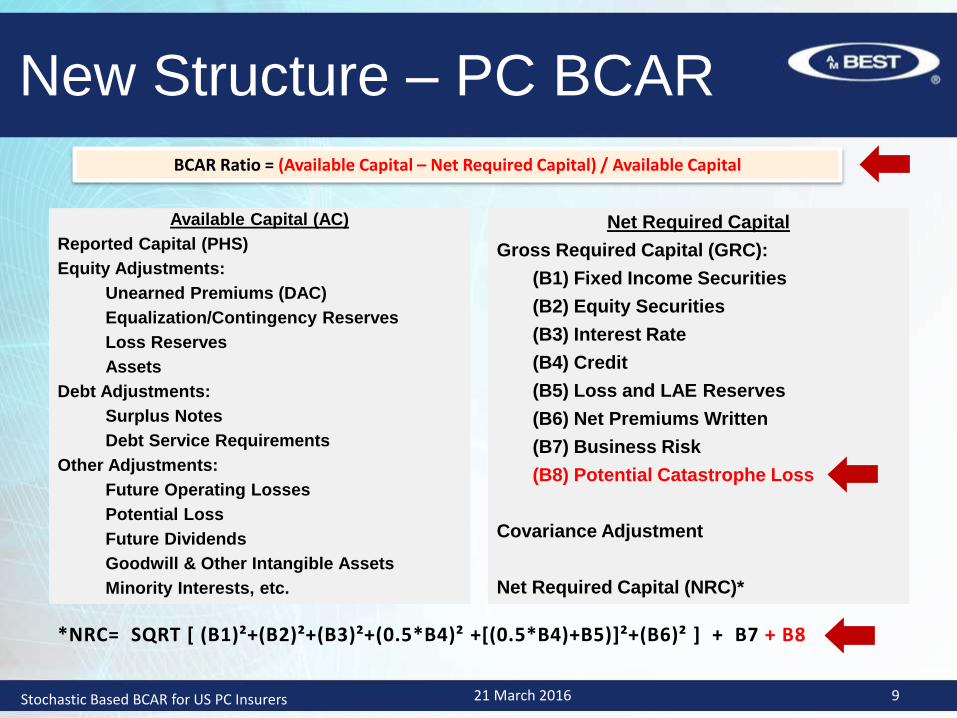
New Structure – PC BCAR
Available Capital (AC)
Reported Capital (PHS)
Equity Adjustments:
Unearned Premiums (DAC)
Equalization/Contingency Reserves
Loss Reserves
Assets
Debt Adjustments:
Surplus Notes
Debt Service Requirements
Other Adjustments:
Future Operating Losses
Potential Loss
Future Dividends
Goodwill & Other Intangible Assets
Minority Interests, etc.
Net Required Capital
Gross Required Capital (GRC):
(B1) Fixed Income Securities
(B2) Equity Securities
(B3) Interest Rate
(B4) Credit
(B5) Loss and LAE Reserves
(B6) Net Premiums Written
(B7) Business Risk
(B8) Potential Catastrophe Loss
Covariance Adjustment
Net Required Capital (NRC)*
BCAR Ratio = (Available Capital – Net Required Capital) / Available Capital
*NRC= SQRT [ (B1)²+(B2)²+(B3)²+(0.5*B4)² +[(0.5*B4)+B5)]²+(B6)² ] + B7 + B8
21 March 2016 9Stochastic Based BCAR for US PC Insurers
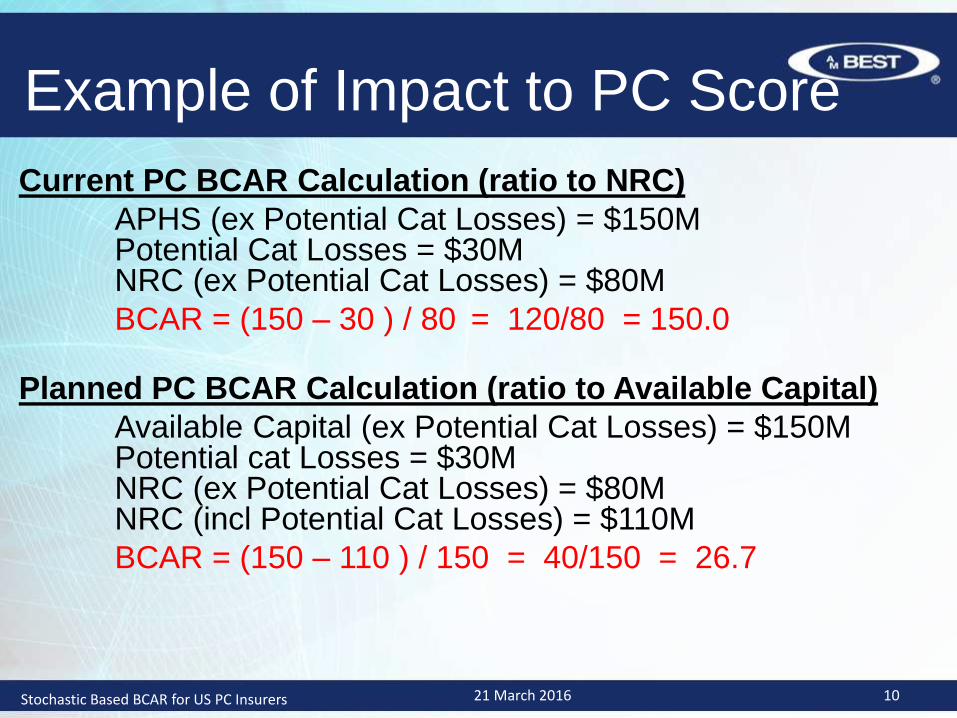
Example of Impact to PC Score
Current PC BCAR Calculation (ratio to NRC)
APHS (ex Potential Cat Losses) = $150MPotential Cat Losses = $30MNRC (ex Potential Cat Losses) = $80M
BCAR = (150 – 30 ) / 80 = 120/80 = 150.0
Planned PC BCAR Calculation (ratio to Available Capital)
Available Capital (ex Potential Cat Losses) = $150MPotential cat Losses = $30MNRC (ex Potential Cat Losses) = $80MNRC (incl Potential Cat Losses) = $110M
BCAR = (150 – 110 ) / 150 = 40/150 = 26.7
21 March 2016 10Stochastic Based BCAR for US PC Insurers
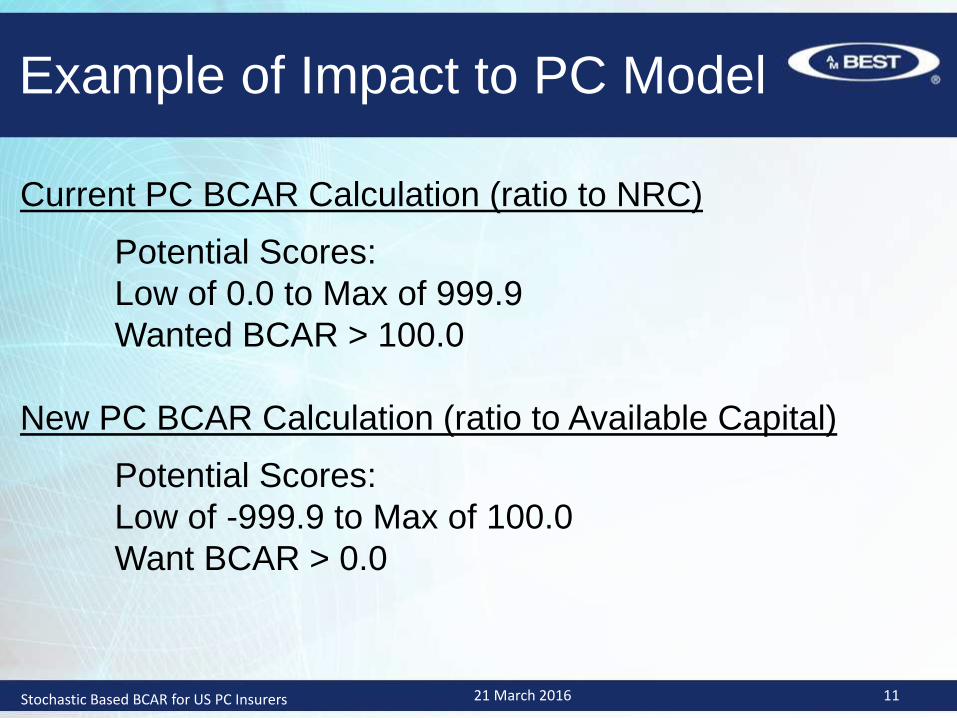
Example of Impact to PC Model
Current PC BCAR Calculation (ratio to NRC)
Potential Scores:
Low of 0.0 to Max of 999.9
Wanted BCAR > 100.0
New PC BCAR Calculation (ratio to Available Capital)
Potential Scores:
Low of -999.9 to Max of 100.0
Want BCAR > 0.0
Stochastic Based BCAR for US PC Insurers 21 March 2016 11
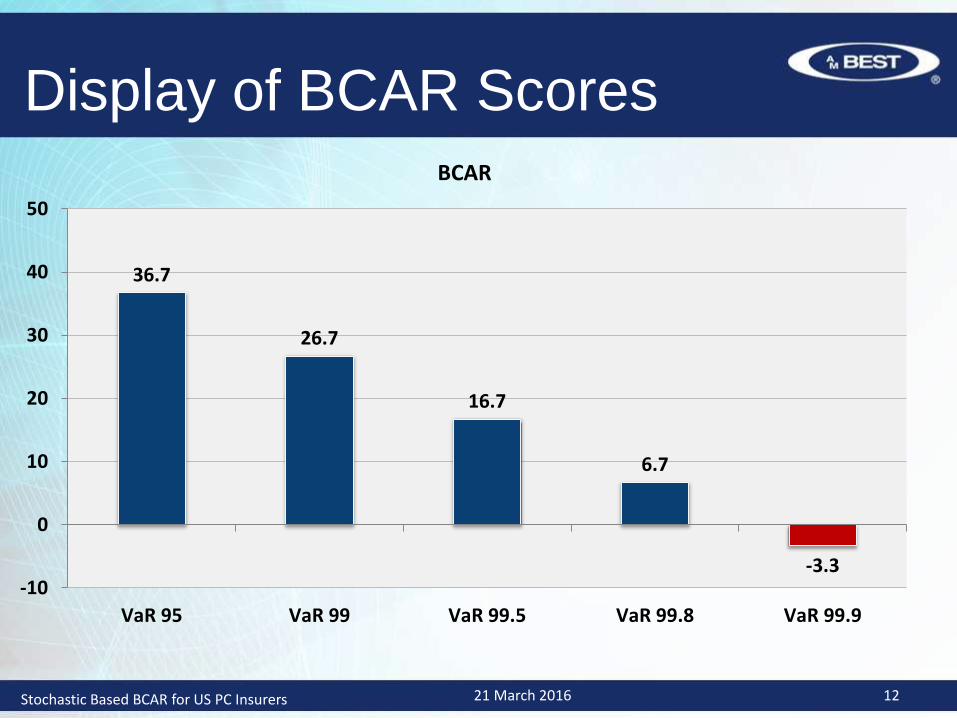
Display of BCAR Scores
36.7
26.7
16.7
6.7
-3.3-10
0
10
20
30
40
50
VaR 95 VaR 99 VaR 99.5 VaR 99.8 VaR 99.9
BCAR
21 March 2016 12Stochastic Based BCAR for US PC Insurers
Investment Risk (PC & LH)
• Fixed Income Securities – Default Risk
– Bonds
– Mortgage Loans
– Preferred Stocks
• Equities – Market Value Volatility
– Publicly Traded Common Stocks
– Real Estate
– Schedule BA assets
• Affiliated and Private investments receive 100% risk charge
21 March 2016 13Stochastic Based BCAR for US PC Insurers

Investment Risk (PC & LH)
• Bonds – Default Risk
– Based on ESG
– Update bond default risk factors
• Reflect maturity of company’s bond portfolio (SRQ)
• Reflect asset quality of company’s bond portfolio (SRQ)
• Only defaults occurring in first 10 years are considered
• Offset default with recovery on defaults (vary by rating)
• Net defaulted amounts are present valued
21 March 2016 14Stochastic Based BCAR for US PC Insurers
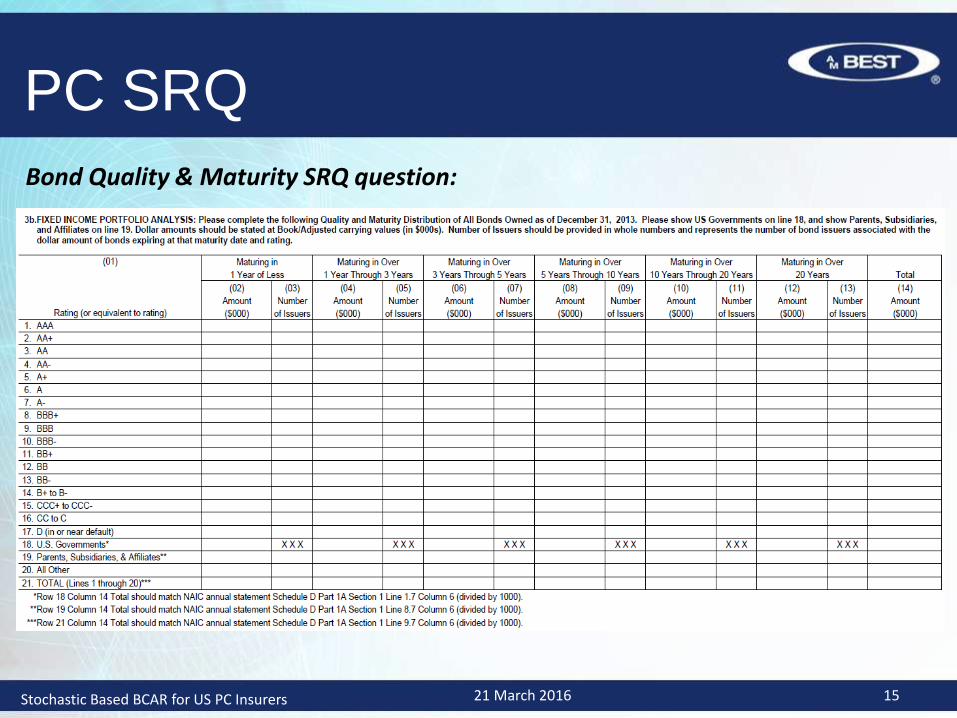
Bond Quality & Maturity SRQ question:
PC SRQ
Stochastic Based BCAR for US PC Insurers 21 March 2016 15
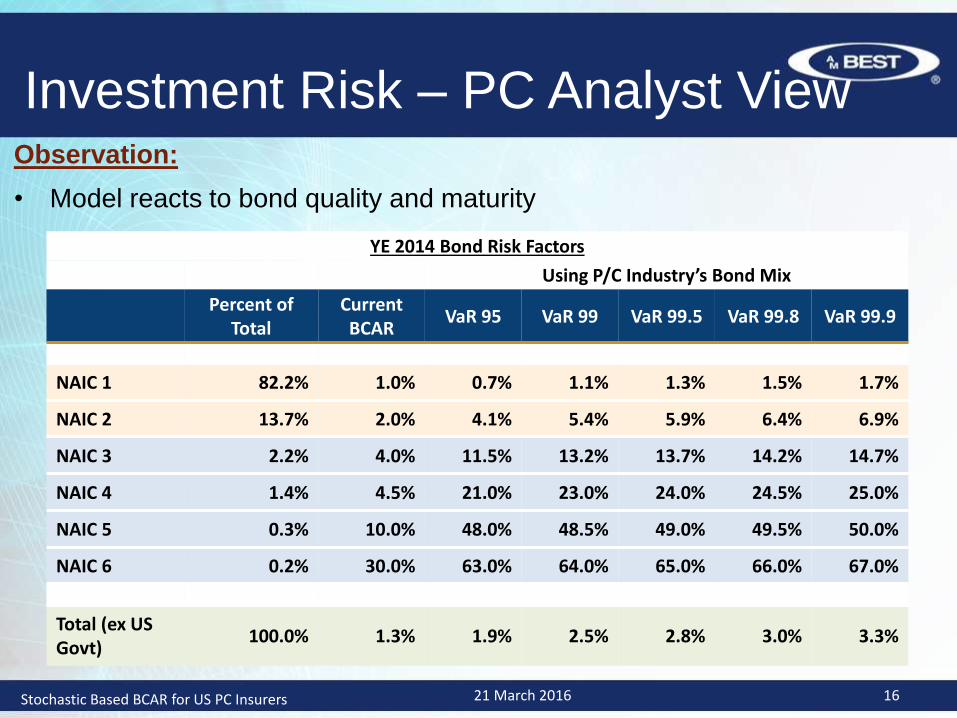
Investment Risk – PC Analyst ViewObservation:
• Model reacts to bond quality and maturity
YE 2014 Bond Risk Factors
Using P/C Industry’s Bond Mix
Percent of Total
Current BCAR
VaR 95 VaR 99 VaR 99.5 VaR 99.8 VaR 99.9
NAIC 1 82.2% 1.0% 0.7% 1.1% 1.3% 1.5% 1.7%
NAIC 2 13.7% 2.0% 4.1% 5.4% 5.9% 6.4% 6.9%
NAIC 3 2.2% 4.0% 11.5% 13.2% 13.7% 14.2% 14.7%
NAIC 4 1.4% 4.5% 21.0% 23.0% 24.0% 24.5% 25.0%
NAIC 5 0.3% 10.0% 48.0% 48.5% 49.0% 49.5% 50.0%
NAIC 6 0.2% 30.0% 63.0% 64.0% 65.0% 66.0% 67.0%
Total (ex US Govt)
100.0% 1.3% 1.9% 2.5% 2.8% 3.0% 3.3%
21 March 2016 16Stochastic Based BCAR for US PC Insurers
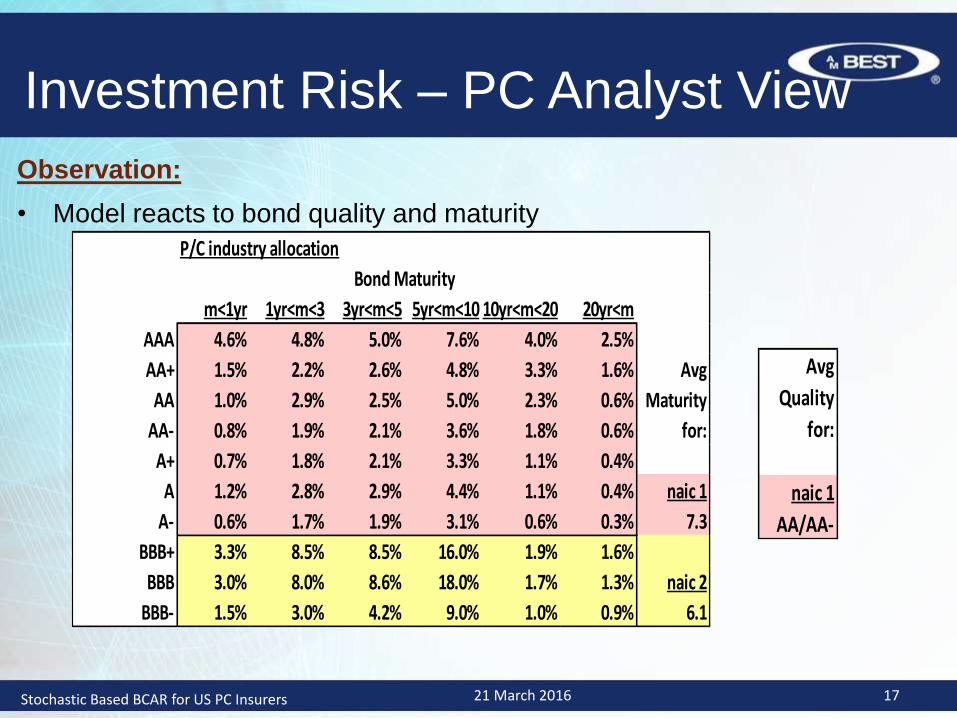
Investment Risk – PC Analyst View
Avg
Quality
for:
naic 1
AA/AA-
Observation:
• Model reacts to bond quality and maturity
P/C industry allocation
m<1yr 1yr<m<3 3yr<m<5 5yr<m<10 10yr<m<20 20yr<m
AAA 4.6% 4.8% 5.0% 7.6% 4.0% 2.5%
AA+ 1.5% 2.2% 2.6% 4.8% 3.3% 1.6% Avg
AA 1.0% 2.9% 2.5% 5.0% 2.3% 0.6% Maturity
AA- 0.8% 1.9% 2.1% 3.6% 1.8% 0.6% for:
A+ 0.7% 1.8% 2.1% 3.3% 1.1% 0.4%
A 1.2% 2.8% 2.9% 4.4% 1.1% 0.4% naic 1
A- 0.6% 1.7% 1.9% 3.1% 0.6% 0.3% 7.3
BBB+ 3.3% 8.5% 8.5% 16.0% 1.9% 1.6%
BBB 3.0% 8.0% 8.6% 18.0% 1.7% 1.3% naic 2
BBB- 1.5% 3.0% 4.2% 9.0% 1.0% 0.9% 6.1
Bond Maturity
21 March 2016 17Stochastic Based BCAR for US PC Insurers
Investment Risk (PC & LH)
• Mortgage Loans – Default Risk
– Based on NAIC RBC study of commercial mortgage loans
• RBC study produced factors at VaR 92 level for various classes
– Update Mortgage Loans risk factors
• Reviewed NAIC RBC factors for CM1 thru CM5
• Not a material asset class for PC
• 98% of commercial mortgages held by Life insurers were CM3 or better
• Selected baseline risk factor based on CM3 and used real estate tail to
get to factors for higher confidence levels
• Companies can share greater details of portfolio for potential reduction in
factors
21 March 2016 18Stochastic Based BCAR for US PC Insurers
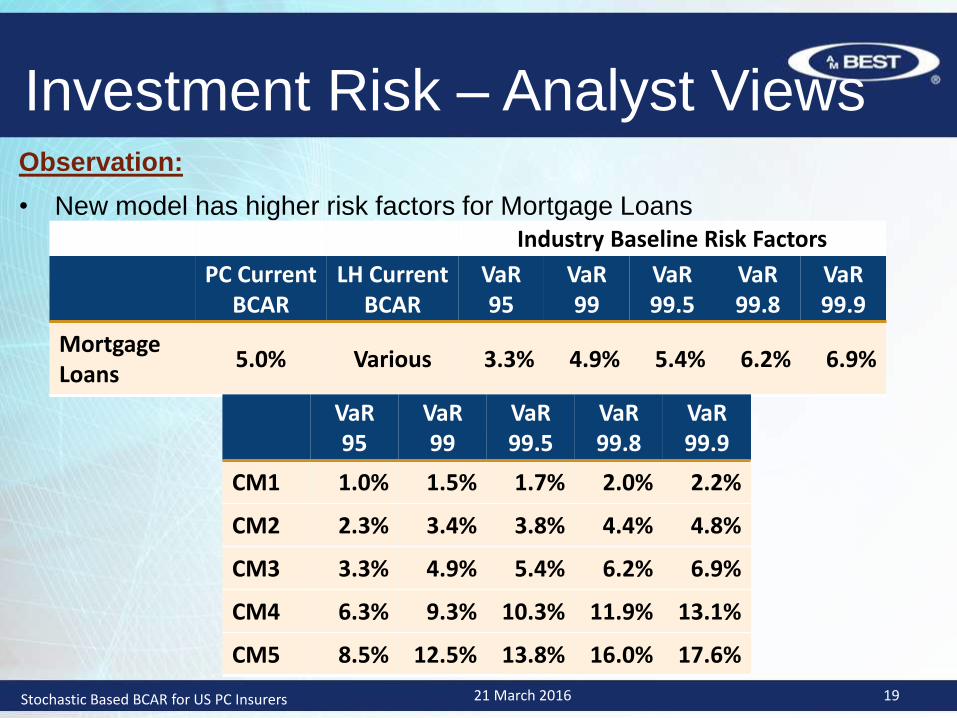
Investment Risk – Analyst ViewsObservation:
• New model has higher risk factors for Mortgage Loans
Industry Baseline Risk Factors
PC CurrentBCAR
LH Current BCAR
VaR 95
VaR 99
VaR 99.5
VaR 99.8
VaR 99.9
Mortgage Loans
5.0% Various 3.3% 4.9% 5.4% 6.2% 6.9%
VaR 95
VaR 99
VaR 99.5
VaR 99.8
VaR 99.9
CM1 1.0% 1.5% 1.7% 2.0% 2.2%
CM2 2.3% 3.4% 3.8% 4.4% 4.8%
CM3 3.3% 4.9% 5.4% 6.2% 6.9%
CM4 6.3% 9.3% 10.3% 11.9% 13.1%
CM5 8.5% 12.5% 13.8% 16.0% 17.6%
21 March 2016 19Stochastic Based BCAR for US PC Insurers
Investment Risk (PC & LH)
• Preferred Stocks – Default Risk
– Based on bond defaults from ESG
– Update preferred stock default risk factors
• Assumes debt like features
• Assumes ability and willingness to hold to maturity
• Uses industry bond distribution risk factors
– Use common stock risk factors when
• Actively trading preferred stocks
• Unable to hold to maturity (exposure to shock events)
• Materiality
21 March 2016 20Stochastic Based BCAR for US PC Insurers
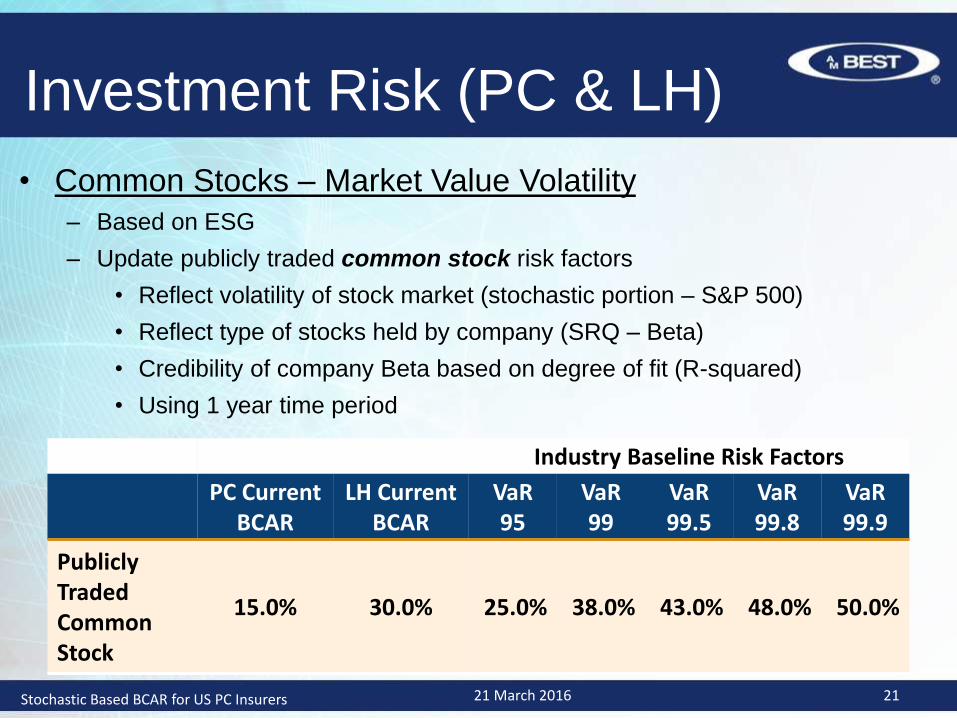
Investment Risk (PC & LH)
• Common Stocks – Market Value Volatility
– Based on ESG
– Update publicly traded common stock risk factors
• Reflect volatility of stock market (stochastic portion – S&P 500)
• Reflect type of stocks held by company (SRQ – Beta)
• Credibility of company Beta based on degree of fit (R-squared)
• Using 1 year time period
Industry Baseline Risk Factors
PC CurrentBCAR
LH Current BCAR
VaR 95
VaR 99
VaR 99.5
VaR 99.8
VaR 99.9
Publicly TradedCommon Stock
15.0% 30.0% 25.0% 38.0% 43.0% 48.0% 50.0%
21 March 2016 21Stochastic Based BCAR for US PC Insurers
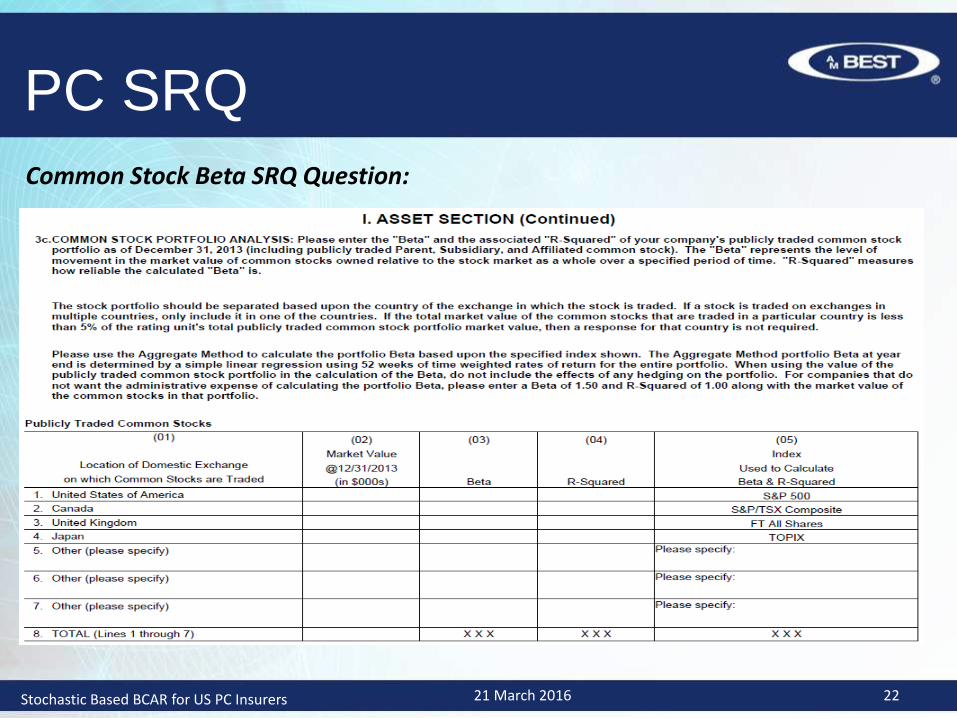
Common Stock Beta SRQ Question:
PC SRQ
Stochastic Based BCAR for US PC Insurers 21 March 2016 22
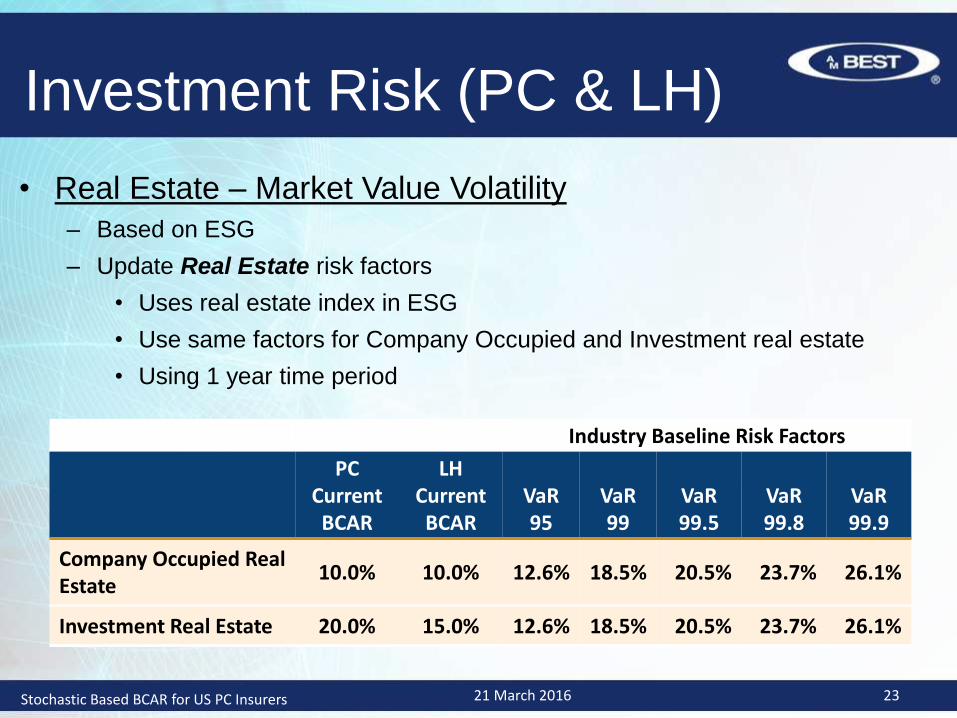
Investment Risk (PC & LH)
• Real Estate – Market Value Volatility
– Based on ESG
– Update Real Estate risk factors
• Uses real estate index in ESG
• Use same factors for Company Occupied and Investment real estate
• Using 1 year time period
Industry Baseline Risk Factors
PC CurrentBCAR
LH Current BCAR
VaR 95
VaR 99
VaR 99.5
VaR 99.8
VaR 99.9
Company Occupied Real Estate
10.0% 10.0% 12.6% 18.5% 20.5% 23.7% 26.1%
Investment Real Estate 20.0% 15.0% 12.6% 18.5% 20.5% 23.7% 26.1%
21 March 2016 23Stochastic Based BCAR for US PC Insurers

Investment Risk (PC & LH)• Schedule BA Assets – Market Value Volatility
– Based on ESG
– Update Other Invested Assets risk factors
• Reviewed volatility in over 30 different hedge fund indices in ESG
• Selected baseline risk factors = 1.10 times S&P 500 factors
• Companies can share greater details of portfolio for potential reduction in
factors
• Using 1 year time period
Industry Baseline Risk Factors
PC CurrentBCAR
LH Current BCAR
VaR 95
VaR 99
VaR 99.5
VaR 99.8
VaR 99.9
Other Invested Assets (Unaffiliated)
20.0% Various 27.5% 41.8% 47.3% 52.8% 55.0%
21 March 2016 24Stochastic Based BCAR for US PC Insurers
Interest Rate Risk (PC)
• Interest Rate Risk
– Risk of having to sell fixed income assets when market
values are lower
– Exposure to a rise in interest rates over next one year
– Liquidity risk during the upcoming year
– Risk is driven by sudden shock event
• PC - Usually natural catastrophe, or man-made, could be
economic
21 March 2016 25Stochastic Based BCAR for US PC Insurers
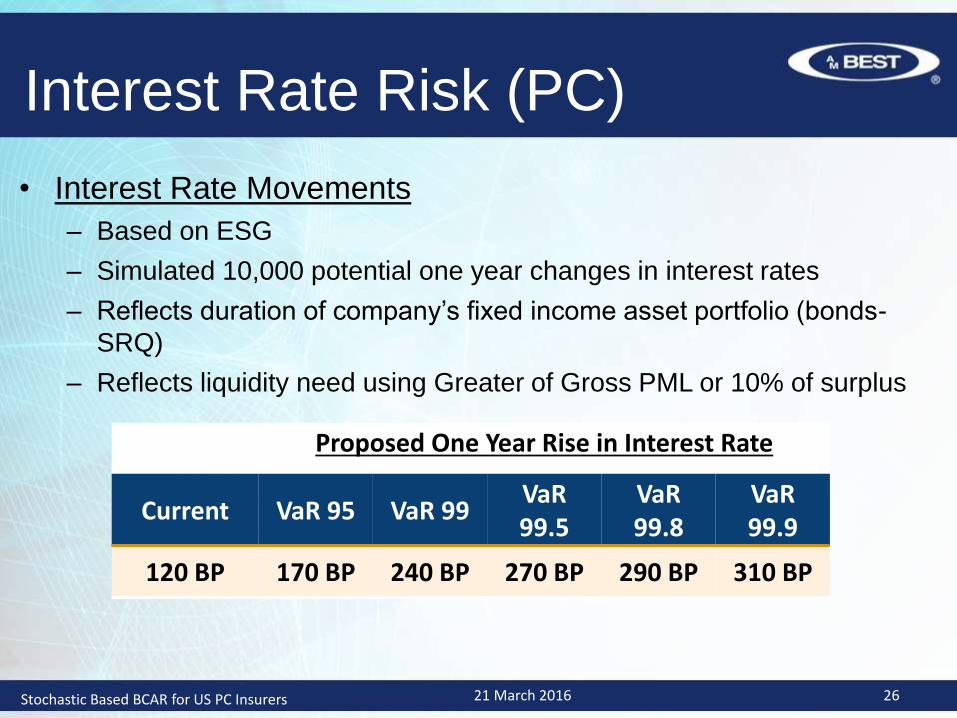
Interest Rate Risk (PC)
• Interest Rate Movements
– Based on ESG
– Simulated 10,000 potential one year changes in interest rates
– Reflects duration of company’s fixed income asset portfolio (bonds-
SRQ)
– Reflects liquidity need using Greater of Gross PML or 10% of surplus
Proposed One Year Rise in Interest Rate
Current VaR 95 VaR 99VaR 99.5
VaR 99.8
VaR 99.9
120 BP 170 BP 240 BP 270 BP 290 BP 310 BP
21 March 2016 26Stochastic Based BCAR for US PC Insurers

Credit Risk (PC & LH)
• Credit Risk
– Risk of default on:
• Reinsurance recoverables (recov on pd & unpd, ceded UPR)
– Reinsurance Recoverable Charge:
• Credit risk charge (ability to pay)
– Reinsurer AMB issuer credit rating
– Duration of recoverables
– Uses stochastic simulation software and impairment table
• Credit Risk Charges reduced for:
– Recovery on default (50%)
– Funds Held (100%)
– Acceptable LOCs & Trusts (up to 90%)
– Discounted to present value
– Dispute Risk calculation remains
21 March 2016 27Stochastic Based BCAR for US PC Insurers
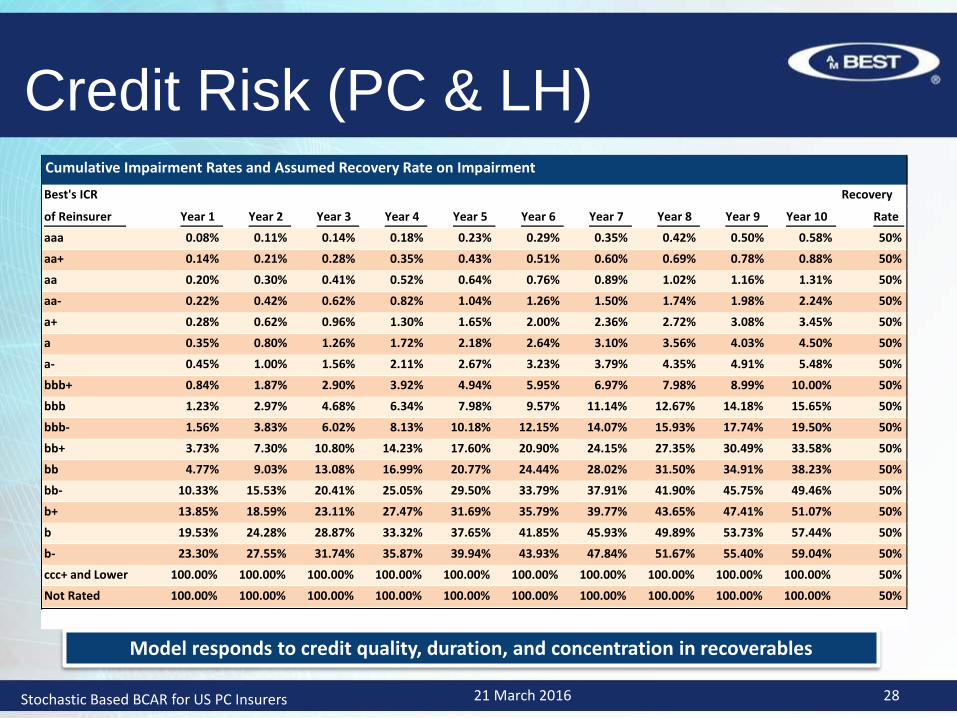
Credit Risk (PC & LH)Cumulative Impairment Rates and Assumed Recovery Rate on Impairment
Best's ICR Recovery
of Reinsurer Year 1 Year 2 Year 3 Year 4 Year 5 Year 6 Year 7 Year 8 Year 9 Year 10 Rate
aaa 0.08% 0.11% 0.14% 0.18% 0.23% 0.29% 0.35% 0.42% 0.50% 0.58% 50%
aa+ 0.14% 0.21% 0.28% 0.35% 0.43% 0.51% 0.60% 0.69% 0.78% 0.88% 50%
aa 0.20% 0.30% 0.41% 0.52% 0.64% 0.76% 0.89% 1.02% 1.16% 1.31% 50%
aa- 0.22% 0.42% 0.62% 0.82% 1.04% 1.26% 1.50% 1.74% 1.98% 2.24% 50%
a+ 0.28% 0.62% 0.96% 1.30% 1.65% 2.00% 2.36% 2.72% 3.08% 3.45% 50%
a 0.35% 0.80% 1.26% 1.72% 2.18% 2.64% 3.10% 3.56% 4.03% 4.50% 50%
a- 0.45% 1.00% 1.56% 2.11% 2.67% 3.23% 3.79% 4.35% 4.91% 5.48% 50%
bbb+ 0.84% 1.87% 2.90% 3.92% 4.94% 5.95% 6.97% 7.98% 8.99% 10.00% 50%
bbb 1.23% 2.97% 4.68% 6.34% 7.98% 9.57% 11.14% 12.67% 14.18% 15.65% 50%
bbb- 1.56% 3.83% 6.02% 8.13% 10.18% 12.15% 14.07% 15.93% 17.74% 19.50% 50%
bb+ 3.73% 7.30% 10.80% 14.23% 17.60% 20.90% 24.15% 27.35% 30.49% 33.58% 50%
bb 4.77% 9.03% 13.08% 16.99% 20.77% 24.44% 28.02% 31.50% 34.91% 38.23% 50%
bb- 10.33% 15.53% 20.41% 25.05% 29.50% 33.79% 37.91% 41.90% 45.75% 49.46% 50%
b+ 13.85% 18.59% 23.11% 27.47% 31.69% 35.79% 39.77% 43.65% 47.41% 51.07% 50%
b 19.53% 24.28% 28.87% 33.32% 37.65% 41.85% 45.93% 49.89% 53.73% 57.44% 50%
b- 23.30% 27.55% 31.74% 35.87% 39.94% 43.93% 47.84% 51.67% 55.40% 59.04% 50%
ccc+ and Lower 100.00% 100.00% 100.00% 100.00% 100.00% 100.00% 100.00% 100.00% 100.00% 100.00% 50%
Not Rated 100.00% 100.00% 100.00% 100.00% 100.00% 100.00% 100.00% 100.00% 100.00% 100.00% 50%
Model responds to credit quality, duration, and concentration in recoverables
21 March 2016 28Stochastic Based BCAR for US PC Insurers
Reserve Risk (PC)
• Risk of unanticipated adverse development on net loss
& loss-adjustment expense (LAE) reserves
• Reserve Risk Factors
– Uses stochastic simulation software
• probability distributions
• correlation matrix
• Further adjustment to required capital for Excessive
Growth
21 March 2016 29Stochastic Based BCAR for US PC Insurers
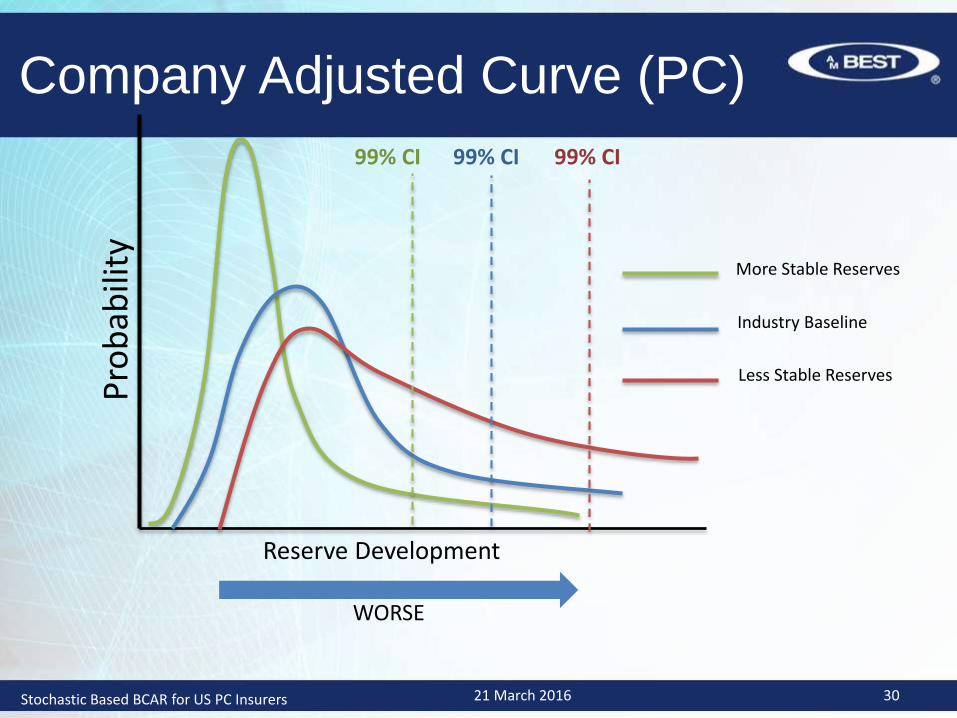
Less Stable Reserves
Industry Baseline
More Stable Reserves
WORSE
99% CI
Pro
bab
ility
Reserve Development
99% CI 99% CI
Company Adjusted Curve (PC)
21 March 2016 30Stochastic Based BCAR for US PC Insurers
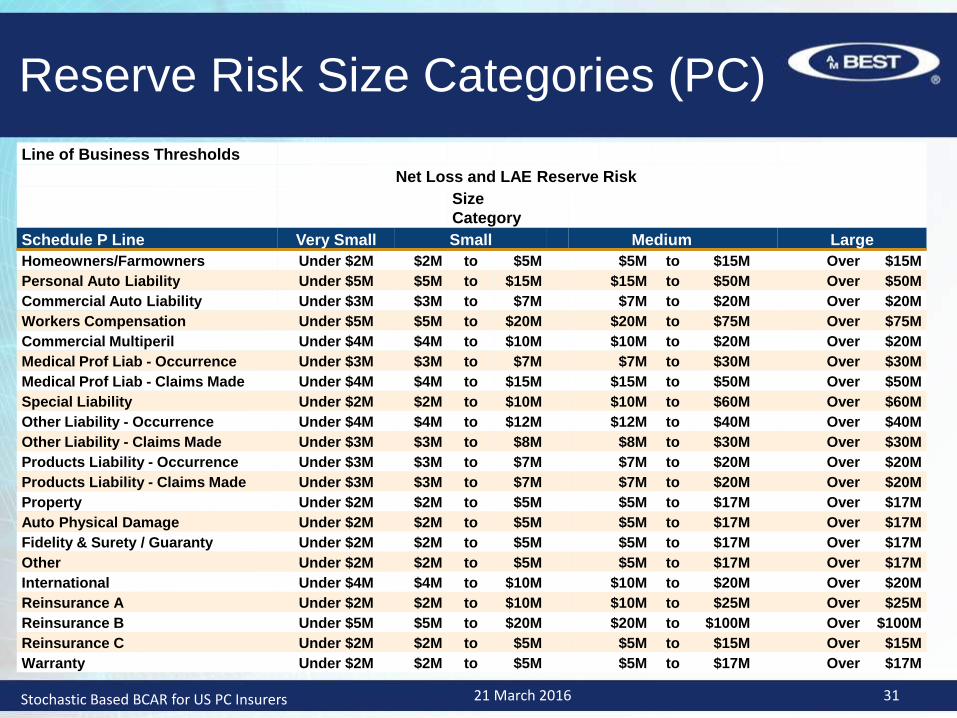
Reserve Risk Size Categories (PC)
Line of Business Thresholds
Net Loss and LAE Reserve Risk
Size
Category
Schedule P Line Very Small Small Medium Large
Homeowners/Farmowners Under $2M $2M to $5M $5M to $15M Over $15M
Personal Auto Liability Under $5M $5M to $15M $15M to $50M Over $50M
Commercial Auto Liability Under $3M $3M to $7M $7M to $20M Over $20M
Workers Compensation Under $5M $5M to $20M $20M to $75M Over $75M
Commercial Multiperil Under $4M $4M to $10M $10M to $20M Over $20M
Medical Prof Liab - Occurrence Under $3M $3M to $7M $7M to $30M Over $30M
Medical Prof Liab - Claims Made Under $4M $4M to $15M $15M to $50M Over $50M
Special Liability Under $2M $2M to $10M $10M to $60M Over $60M
Other Liability - Occurrence Under $4M $4M to $12M $12M to $40M Over $40M
Other Liability - Claims Made Under $3M $3M to $8M $8M to $30M Over $30M
Products Liability - Occurrence Under $3M $3M to $7M $7M to $20M Over $20M
Products Liability - Claims Made Under $3M $3M to $7M $7M to $20M Over $20M
Property Under $2M $2M to $5M $5M to $17M Over $17M
Auto Physical Damage Under $2M $2M to $5M $5M to $17M Over $17M
Fidelity & Surety / Guaranty Under $2M $2M to $5M $5M to $17M Over $17M
Other Under $2M $2M to $5M $5M to $17M Over $17M
International Under $4M $4M to $10M $10M to $20M Over $20M
Reinsurance A Under $2M $2M to $10M $10M to $25M Over $25M
Reinsurance B Under $5M $5M to $20M $20M to $100M Over $100M
Reinsurance C Under $2M $2M to $5M $5M to $15M Over $15M
Warranty Under $2M $2M to $5M $5M to $17M Over $17M
21 March 2016 31Stochastic Based BCAR for US PC Insurers
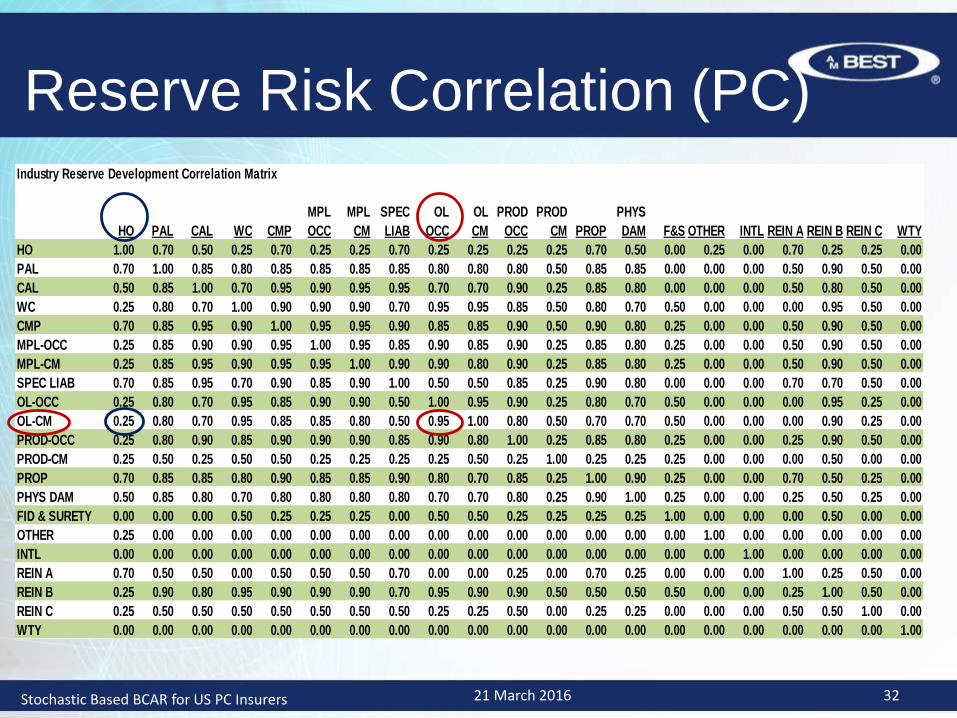
Reserve Risk Correlation (PC)Industry Reserve Development Correlation Matrix
MPL MPL SPEC OL OL PROD PROD PHYS
HO PAL CAL WC CMP OCC CM LIAB OCC CM OCC CM PROP DAM F&S OTHER INTL REIN A REIN B REIN C WTY
HO 1.00 0.70 0.50 0.25 0.70 0.25 0.25 0.70 0.25 0.25 0.25 0.25 0.70 0.50 0.00 0.25 0.00 0.70 0.25 0.25 0.00
PAL 0.70 1.00 0.85 0.80 0.85 0.85 0.85 0.85 0.80 0.80 0.80 0.50 0.85 0.85 0.00 0.00 0.00 0.50 0.90 0.50 0.00
CAL 0.50 0.85 1.00 0.70 0.95 0.90 0.95 0.95 0.70 0.70 0.90 0.25 0.85 0.80 0.00 0.00 0.00 0.50 0.80 0.50 0.00
WC 0.25 0.80 0.70 1.00 0.90 0.90 0.90 0.70 0.95 0.95 0.85 0.50 0.80 0.70 0.50 0.00 0.00 0.00 0.95 0.50 0.00
CMP 0.70 0.85 0.95 0.90 1.00 0.95 0.95 0.90 0.85 0.85 0.90 0.50 0.90 0.80 0.25 0.00 0.00 0.50 0.90 0.50 0.00
MPL-OCC 0.25 0.85 0.90 0.90 0.95 1.00 0.95 0.85 0.90 0.85 0.90 0.25 0.85 0.80 0.25 0.00 0.00 0.50 0.90 0.50 0.00
MPL-CM 0.25 0.85 0.95 0.90 0.95 0.95 1.00 0.90 0.90 0.80 0.90 0.25 0.85 0.80 0.25 0.00 0.00 0.50 0.90 0.50 0.00
SPEC LIAB 0.70 0.85 0.95 0.70 0.90 0.85 0.90 1.00 0.50 0.50 0.85 0.25 0.90 0.80 0.00 0.00 0.00 0.70 0.70 0.50 0.00
OL-OCC 0.25 0.80 0.70 0.95 0.85 0.90 0.90 0.50 1.00 0.95 0.90 0.25 0.80 0.70 0.50 0.00 0.00 0.00 0.95 0.25 0.00
OL-CM 0.25 0.80 0.70 0.95 0.85 0.85 0.80 0.50 0.95 1.00 0.80 0.50 0.70 0.70 0.50 0.00 0.00 0.00 0.90 0.25 0.00
PROD-OCC 0.25 0.80 0.90 0.85 0.90 0.90 0.90 0.85 0.90 0.80 1.00 0.25 0.85 0.80 0.25 0.00 0.00 0.25 0.90 0.50 0.00
PROD-CM 0.25 0.50 0.25 0.50 0.50 0.25 0.25 0.25 0.25 0.50 0.25 1.00 0.25 0.25 0.25 0.00 0.00 0.00 0.50 0.00 0.00
PROP 0.70 0.85 0.85 0.80 0.90 0.85 0.85 0.90 0.80 0.70 0.85 0.25 1.00 0.90 0.25 0.00 0.00 0.70 0.50 0.25 0.00
PHYS DAM 0.50 0.85 0.80 0.70 0.80 0.80 0.80 0.80 0.70 0.70 0.80 0.25 0.90 1.00 0.25 0.00 0.00 0.25 0.50 0.25 0.00
FID & SURETY 0.00 0.00 0.00 0.50 0.25 0.25 0.25 0.00 0.50 0.50 0.25 0.25 0.25 0.25 1.00 0.00 0.00 0.00 0.50 0.00 0.00
OTHER 0.25 0.00 0.00 0.00 0.00 0.00 0.00 0.00 0.00 0.00 0.00 0.00 0.00 0.00 0.00 1.00 0.00 0.00 0.00 0.00 0.00
INTL 0.00 0.00 0.00 0.00 0.00 0.00 0.00 0.00 0.00 0.00 0.00 0.00 0.00 0.00 0.00 0.00 1.00 0.00 0.00 0.00 0.00
REIN A 0.70 0.50 0.50 0.00 0.50 0.50 0.50 0.70 0.00 0.00 0.25 0.00 0.70 0.25 0.00 0.00 0.00 1.00 0.25 0.50 0.00
REIN B 0.25 0.90 0.80 0.95 0.90 0.90 0.90 0.70 0.95 0.90 0.90 0.50 0.50 0.50 0.50 0.00 0.00 0.25 1.00 0.50 0.00
REIN C 0.25 0.50 0.50 0.50 0.50 0.50 0.50 0.50 0.25 0.25 0.50 0.00 0.25 0.25 0.00 0.00 0.00 0.50 0.50 1.00 0.00
WTY 0.00 0.00 0.00 0.00 0.00 0.00 0.00 0.00 0.00 0.00 0.00 0.00 0.00 0.00 0.00 0.00 0.00 0.00 0.00 0.00 1.00
21 March 2016 32Stochastic Based BCAR for US PC Insurers
Premium Risk (PC)
• Risk that pricing of business written next year will be
inadequate
– Potential for Underwriting Loss on one more year’s worth of business
– This is the one-year look forward in terms of adding additional
exposure
– Current year’s NWP used as proxy for next year
• Premium Risk Factors
– Uses stochastic simulation software
• probability distributions
• correlation matrix
• Further adjustment to required capital for Excessive Growth
21 March 2016 33Stochastic Based BCAR for US PC Insurers
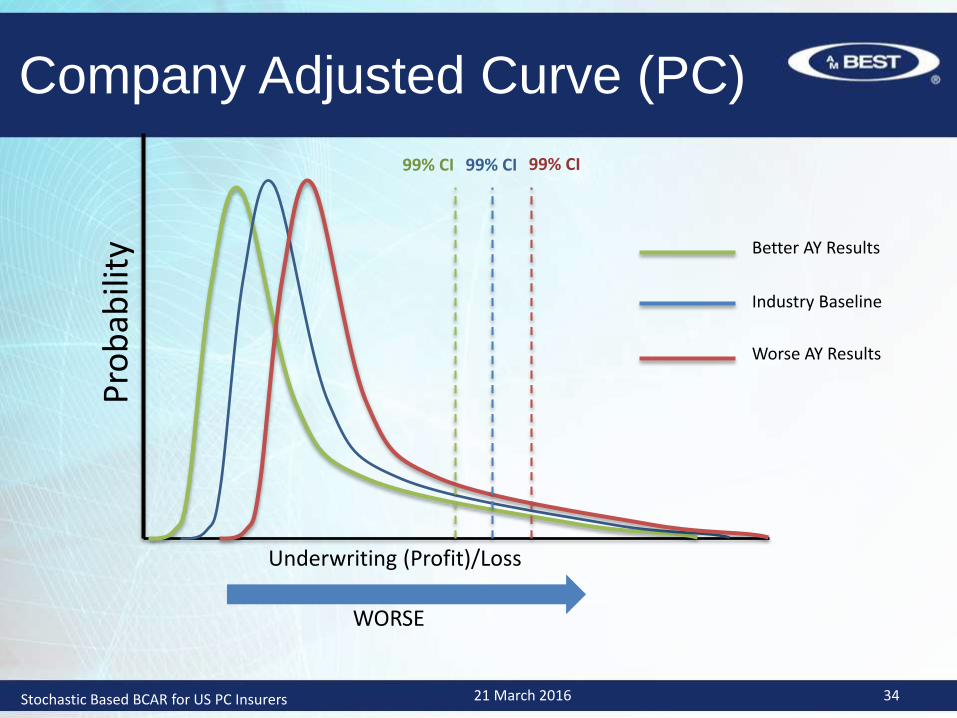
WORSE
Better AY Results
Industry Baseline
Worse AY Results
99% CI
Pro
bab
ility
Underwriting (Profit)/Loss
99% CI 99% CI
Company Adjusted Curve (PC)
21 March 2016 34Stochastic Based BCAR for US PC Insurers
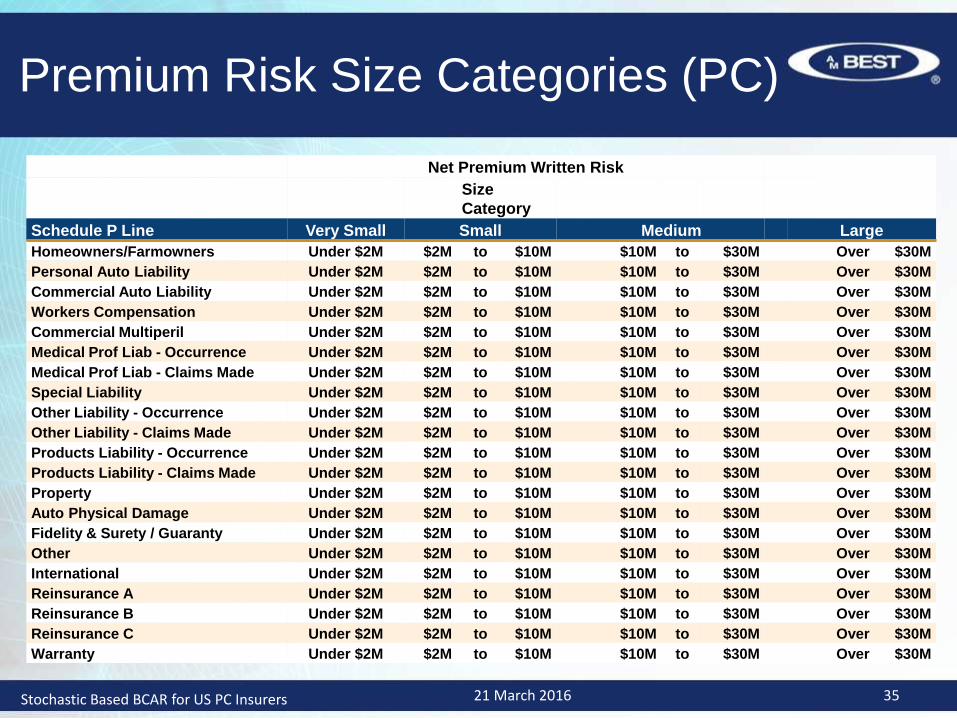
Premium Risk Size Categories (PC)
Net Premium Written Risk
Size
Category
Schedule P Line Very Small Small Medium Large
Homeowners/Farmowners Under $2M $2M to $10M $10M to $30M Over $30M
Personal Auto Liability Under $2M $2M to $10M $10M to $30M Over $30M
Commercial Auto Liability Under $2M $2M to $10M $10M to $30M Over $30M
Workers Compensation Under $2M $2M to $10M $10M to $30M Over $30M
Commercial Multiperil Under $2M $2M to $10M $10M to $30M Over $30M
Medical Prof Liab - Occurrence Under $2M $2M to $10M $10M to $30M Over $30M
Medical Prof Liab - Claims Made Under $2M $2M to $10M $10M to $30M Over $30M
Special Liability Under $2M $2M to $10M $10M to $30M Over $30M
Other Liability - Occurrence Under $2M $2M to $10M $10M to $30M Over $30M
Other Liability - Claims Made Under $2M $2M to $10M $10M to $30M Over $30M
Products Liability - Occurrence Under $2M $2M to $10M $10M to $30M Over $30M
Products Liability - Claims Made Under $2M $2M to $10M $10M to $30M Over $30M
Property Under $2M $2M to $10M $10M to $30M Over $30M
Auto Physical Damage Under $2M $2M to $10M $10M to $30M Over $30M
Fidelity & Surety / Guaranty Under $2M $2M to $10M $10M to $30M Over $30M
Other Under $2M $2M to $10M $10M to $30M Over $30M
International Under $2M $2M to $10M $10M to $30M Over $30M
Reinsurance A Under $2M $2M to $10M $10M to $30M Over $30M
Reinsurance B Under $2M $2M to $10M $10M to $30M Over $30M
Reinsurance C Under $2M $2M to $10M $10M to $30M Over $30M
Warranty Under $2M $2M to $10M $10M to $30M Over $30M
21 March 2016 35Stochastic Based BCAR for US PC Insurers
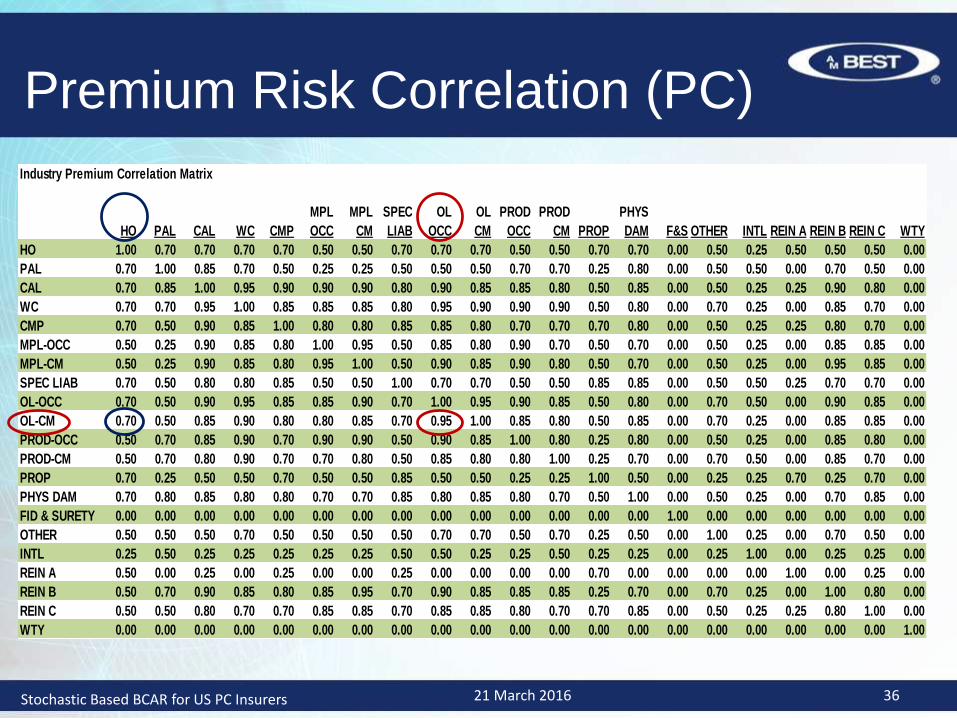
Premium Risk Correlation (PC)
Industry Premium Correlation Matrix
MPL MPL SPEC OL OL PROD PROD PHYS
HO PAL CAL WC CMP OCC CM LIAB OCC CM OCC CM PROP DAM F&S OTHER INTL REIN A REIN B REIN C WTY
HO 1.00 0.70 0.70 0.70 0.70 0.50 0.50 0.70 0.70 0.70 0.50 0.50 0.70 0.70 0.00 0.50 0.25 0.50 0.50 0.50 0.00
PAL 0.70 1.00 0.85 0.70 0.50 0.25 0.25 0.50 0.50 0.50 0.70 0.70 0.25 0.80 0.00 0.50 0.50 0.00 0.70 0.50 0.00
CAL 0.70 0.85 1.00 0.95 0.90 0.90 0.90 0.80 0.90 0.85 0.85 0.80 0.50 0.85 0.00 0.50 0.25 0.25 0.90 0.80 0.00
WC 0.70 0.70 0.95 1.00 0.85 0.85 0.85 0.80 0.95 0.90 0.90 0.90 0.50 0.80 0.00 0.70 0.25 0.00 0.85 0.70 0.00
CMP 0.70 0.50 0.90 0.85 1.00 0.80 0.80 0.85 0.85 0.80 0.70 0.70 0.70 0.80 0.00 0.50 0.25 0.25 0.80 0.70 0.00
MPL-OCC 0.50 0.25 0.90 0.85 0.80 1.00 0.95 0.50 0.85 0.80 0.90 0.70 0.50 0.70 0.00 0.50 0.25 0.00 0.85 0.85 0.00
MPL-CM 0.50 0.25 0.90 0.85 0.80 0.95 1.00 0.50 0.90 0.85 0.90 0.80 0.50 0.70 0.00 0.50 0.25 0.00 0.95 0.85 0.00
SPEC LIAB 0.70 0.50 0.80 0.80 0.85 0.50 0.50 1.00 0.70 0.70 0.50 0.50 0.85 0.85 0.00 0.50 0.50 0.25 0.70 0.70 0.00
OL-OCC 0.70 0.50 0.90 0.95 0.85 0.85 0.90 0.70 1.00 0.95 0.90 0.85 0.50 0.80 0.00 0.70 0.50 0.00 0.90 0.85 0.00
OL-CM 0.70 0.50 0.85 0.90 0.80 0.80 0.85 0.70 0.95 1.00 0.85 0.80 0.50 0.85 0.00 0.70 0.25 0.00 0.85 0.85 0.00
PROD-OCC 0.50 0.70 0.85 0.90 0.70 0.90 0.90 0.50 0.90 0.85 1.00 0.80 0.25 0.80 0.00 0.50 0.25 0.00 0.85 0.80 0.00
PROD-CM 0.50 0.70 0.80 0.90 0.70 0.70 0.80 0.50 0.85 0.80 0.80 1.00 0.25 0.70 0.00 0.70 0.50 0.00 0.85 0.70 0.00
PROP 0.70 0.25 0.50 0.50 0.70 0.50 0.50 0.85 0.50 0.50 0.25 0.25 1.00 0.50 0.00 0.25 0.25 0.70 0.25 0.70 0.00
PHYS DAM 0.70 0.80 0.85 0.80 0.80 0.70 0.70 0.85 0.80 0.85 0.80 0.70 0.50 1.00 0.00 0.50 0.25 0.00 0.70 0.85 0.00
FID & SURETY 0.00 0.00 0.00 0.00 0.00 0.00 0.00 0.00 0.00 0.00 0.00 0.00 0.00 0.00 1.00 0.00 0.00 0.00 0.00 0.00 0.00
OTHER 0.50 0.50 0.50 0.70 0.50 0.50 0.50 0.50 0.70 0.70 0.50 0.70 0.25 0.50 0.00 1.00 0.25 0.00 0.70 0.50 0.00
INTL 0.25 0.50 0.25 0.25 0.25 0.25 0.25 0.50 0.50 0.25 0.25 0.50 0.25 0.25 0.00 0.25 1.00 0.00 0.25 0.25 0.00
REIN A 0.50 0.00 0.25 0.00 0.25 0.00 0.00 0.25 0.00 0.00 0.00 0.00 0.70 0.00 0.00 0.00 0.00 1.00 0.00 0.25 0.00
REIN B 0.50 0.70 0.90 0.85 0.80 0.85 0.95 0.70 0.90 0.85 0.85 0.85 0.25 0.70 0.00 0.70 0.25 0.00 1.00 0.80 0.00
REIN C 0.50 0.50 0.80 0.70 0.70 0.85 0.85 0.70 0.85 0.85 0.80 0.70 0.70 0.85 0.00 0.50 0.25 0.25 0.80 1.00 0.00
WTY 0.00 0.00 0.00 0.00 0.00 0.00 0.00 0.00 0.00 0.00 0.00 0.00 0.00 0.00 0.00 0.00 0.00 0.00 0.00 0.00 1.00
21 March 2016 36Stochastic Based BCAR for US PC Insurers

Business Risk (PC & LH)
• Risks not reflected in balance sheet that may affect surplus
– Contingent Liabilities
– Non-controlled assets
– Unfunded Pension & other post employment/ retirement benefits
– Separate Account Assets
– Etc.
• Risk factors determined by analyst
• Use same required capital at all VaRs
21 March 2016 37Stochastic Based BCAR for US PC Insurers
Potential Catastrophe Loss (PC)
• Natural Catastrophe
– Update natural catastrophe approach –
• Per Occurrence
• Total all perils
• Measured at various VaR levels
• Risk added to Net Required Capital
• Will continue stress test approach
• Reinstatement premium and Tax adjustments remain
• Terrorism and other stress tests remain
21 March 2016 38Stochastic Based BCAR for US PC Insurers
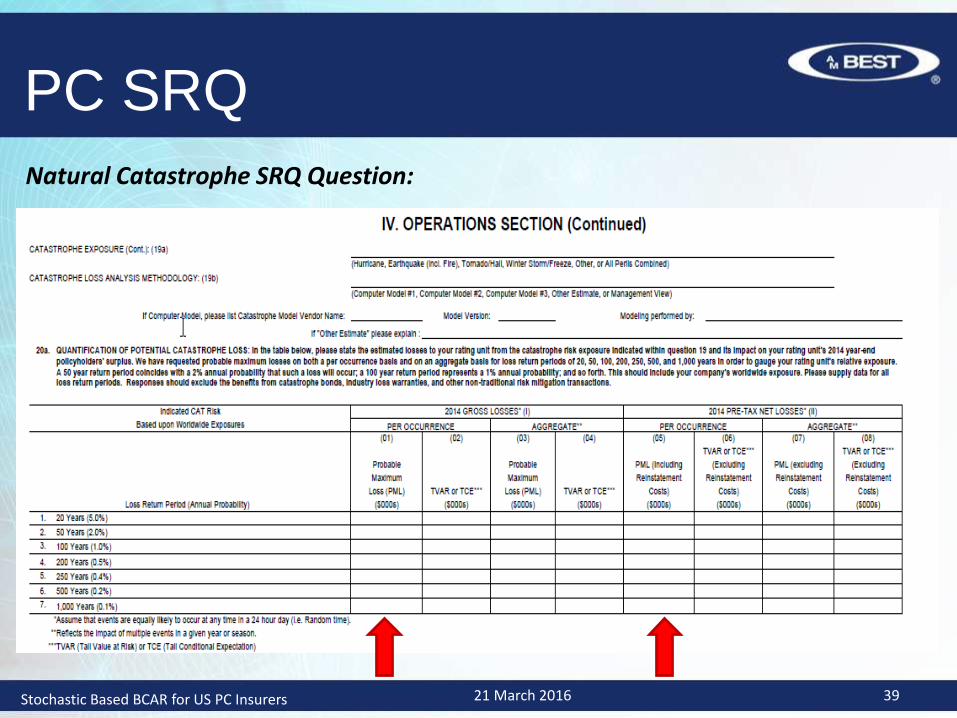
Natural Catastrophe SRQ Question:
PC SRQ
Stochastic Based BCAR for US PC Insurers 21 March 2016 39
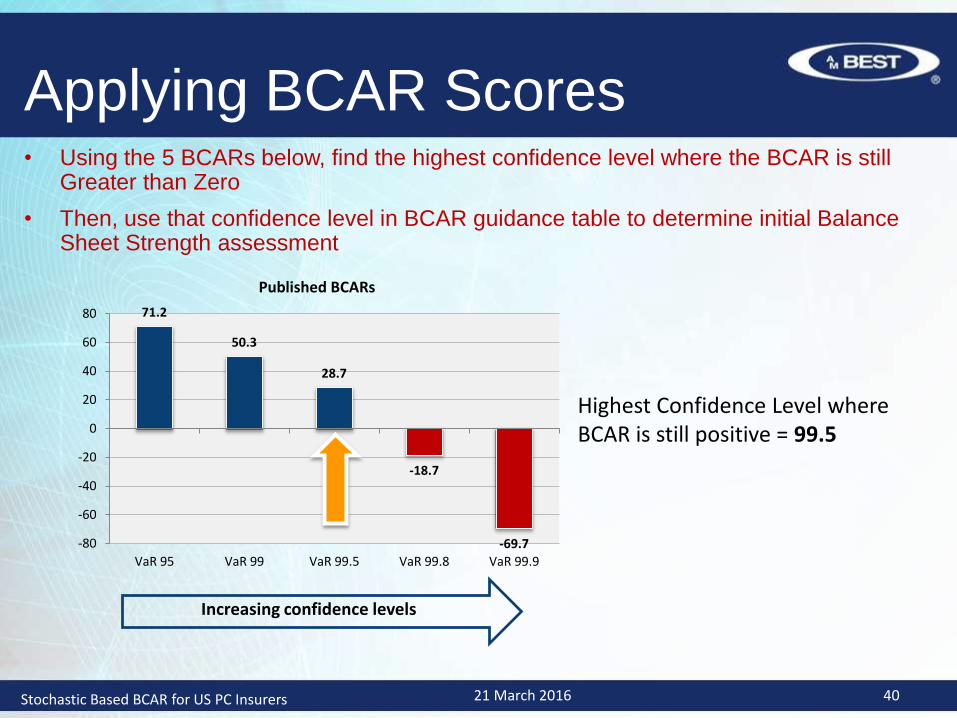
• Using the 5 BCARs below, find the highest confidence level where the BCAR is still Greater than Zero
• Then, use that confidence level in BCAR guidance table to determine initial Balance Sheet Strength assessment
71.2
50.3
28.7
-18.7
-69.7-80
-60
-40
-20
0
20
40
60
80
VaR 95 VaR 99 VaR 99.5 VaR 99.8 VaR 99.9
Published BCARs
Applying BCAR Scores
Increasing confidence levels
Highest Confidence Level where BCAR is still positive = 99.5
21 March 2016 40Stochastic Based BCAR for US PC Insurers
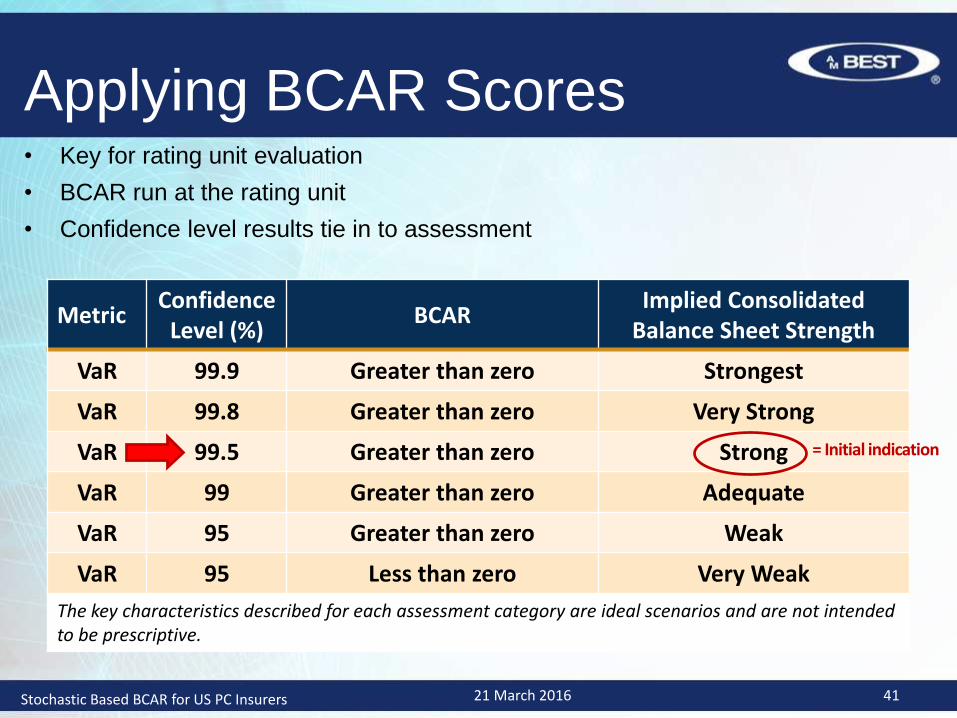
• Key for rating unit evaluation
• BCAR run at the rating unit
• Confidence level results tie in to assessment
MetricConfidence
Level (%)BCAR
Implied ConsolidatedBalance Sheet Strength
VaR 99.9 Greater than zero Strongest
VaR 99.8 Greater than zero Very Strong
VaR 99.5 Greater than zero Strong
VaR 99 Greater than zero Adequate
VaR 95 Greater than zero Weak
VaR 95 Less than zero Very Weak
The key characteristics described for each assessment category are ideal scenarios and are not intended to be prescriptive.
Applying BCAR Scores
= Initial indication
21 March 2016 41Stochastic Based BCAR for US PC Insurers

Country Risk
Balance Sheet
Strength
Baseline(e.g., bbb+)
Operating Performance
(+2/-3)
Business Profile
(+/-2)
Enterprise Risk
Management
(+1/-4)
Comprehensive Adjustment
(+/-1)
Rating Enhancement
Published IssuerCredit Rating
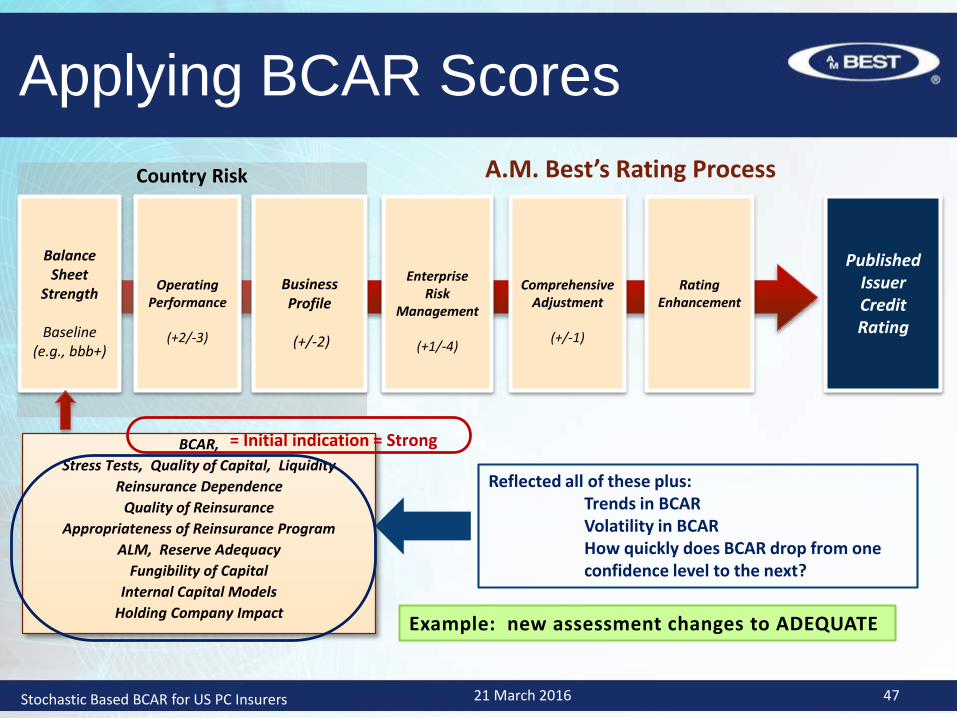
A.M. Best’s Rating Process
BCAR,
Stress Tests, Quality of Capital, Liquidity
Reinsurance Dependence
Quality of Reinsurance
Appropriateness of Reinsurance Program
ALM, Reserve Adequacy
Fungibility of Capital
Internal Capital Models
Holding Company Impact
Applying BCAR Scores
= Initial indication = Strong
Still Need to reflect all of these plus:Trends in BCARVolatility in BCARHow quickly does BCAR drop from one confidence level to the next?
21 March 2016 42Stochastic Based BCAR for US PC Insurers
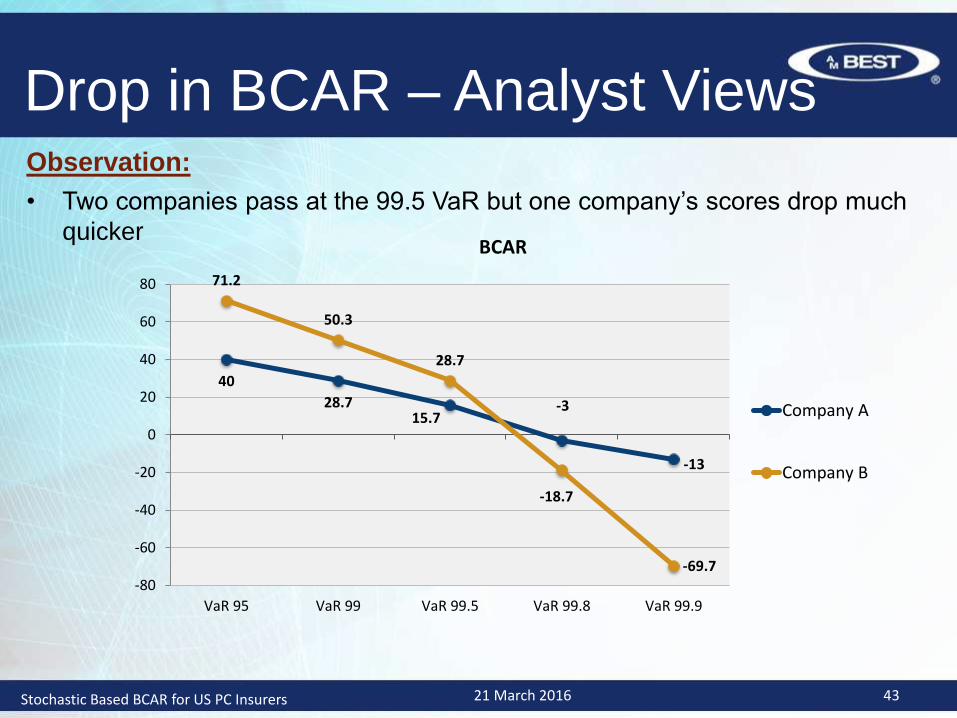
Drop in BCAR – Analyst ViewsObservation:
• Two companies pass at the 99.5 VaR but one company’s scores drop much
quicker
40
28.715.7
-3
-13
71.2
50.3
28.7
-18.7
-69.7-80
-60
-40
-20
0
20
40
60
80
VaR 95 VaR 99 VaR 99.5 VaR 99.8 VaR 99.9
BCAR
Company A
Company B
21 March 2016 43Stochastic Based BCAR for US PC Insurers
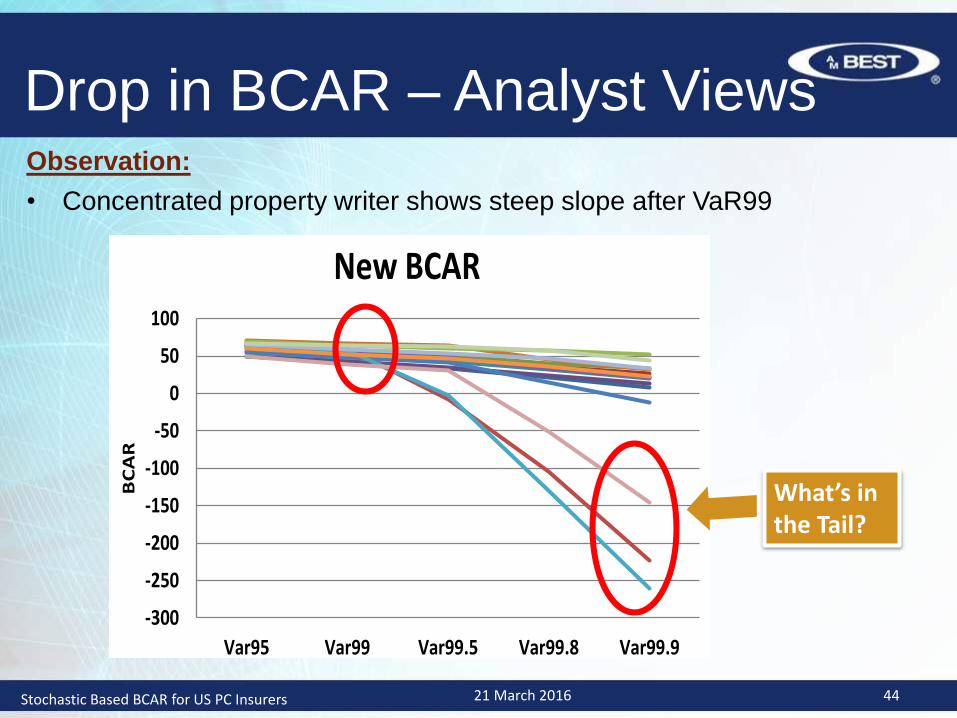
Drop in BCAR – Analyst ViewsObservation:
• Concentrated property writer shows steep slope after VaR99
-300
-250
-200
-150
-100
-50
0
50
100
Var95 Var99 Var99.5 Var99.8 Var99.9
BC
AR
New BCAR
What’s in the Tail?
21 March 2016 44Stochastic Based BCAR for US PC Insurers
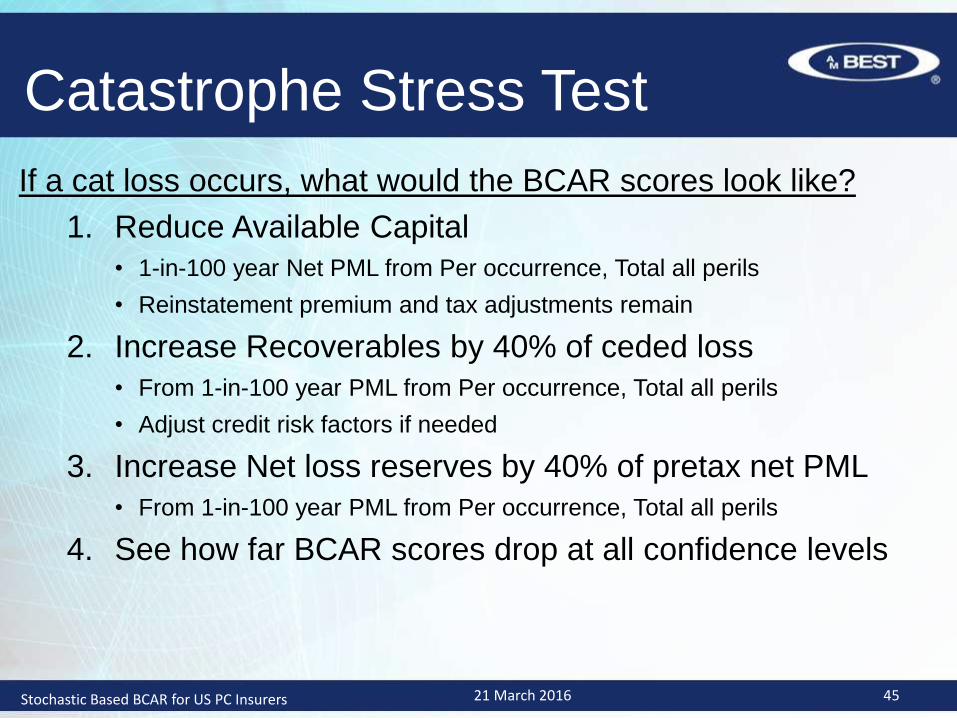
Catastrophe Stress Test
If a cat loss occurs, what would the BCAR scores look like?
1. Reduce Available Capital
• 1-in-100 year Net PML from Per occurrence, Total all perils
• Reinstatement premium and tax adjustments remain
2. Increase Recoverables by 40% of ceded loss
• From 1-in-100 year PML from Per occurrence, Total all perils
• Adjust credit risk factors if needed
3. Increase Net loss reserves by 40% of pretax net PML
• From 1-in-100 year PML from Per occurrence, Total all perils
4. See how far BCAR scores drop at all confidence levels
21 March 2016 45Stochastic Based BCAR for US PC Insurers
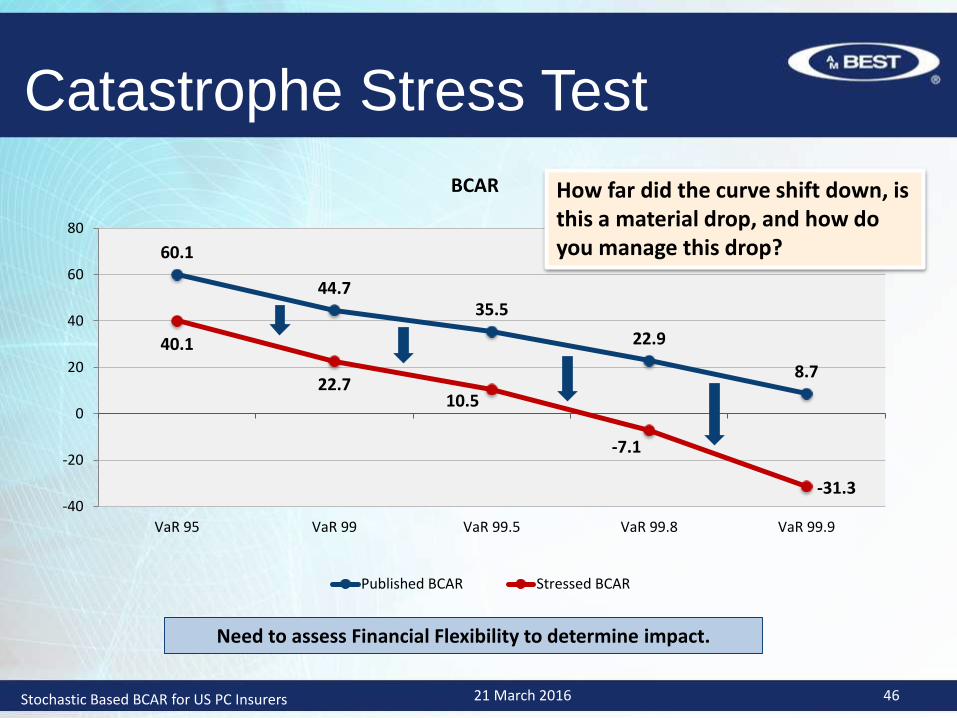
60.1
44.735.5
22.9
8.7
40.1
22.710.5
-7.1
-31.3-40
-20
0
20
40
60
80
VaR 95 VaR 99 VaR 99.5 VaR 99.8 VaR 99.9
BCAR
Published BCAR Stressed BCAR
Catastrophe Stress Test
Need to assess Financial Flexibility to determine impact.
How far did the curve shift down, is this a material drop, and how do you manage this drop?
21 March 2016 46Stochastic Based BCAR for US PC Insurers
Country Risk
Balance Sheet
Strength
Baseline(e.g., bbb+)
Operating Performance
(+2/-3)
Business Profile
(+/-2)
Enterprise Risk
Management
(+1/-4)
Comprehensive Adjustment
(+/-1)
Rating Enhancement
Published IssuerCredit Rating
A.M. Best’s Rating Process
BCAR,
Stress Tests, Quality of Capital, Liquidity
Reinsurance Dependence
Quality of Reinsurance
Appropriateness of Reinsurance Program
ALM, Reserve Adequacy
Fungibility of Capital
Internal Capital Models
Holding Company Impact
Applying BCAR Scores
= Initial indication = Strong
Reflected all of these plus:Trends in BCARVolatility in BCARHow quickly does BCAR drop from one confidence level to the next?
Example: new assessment changes to ADEQUATE
21 March 2016 47Stochastic Based BCAR for US PC Insurers
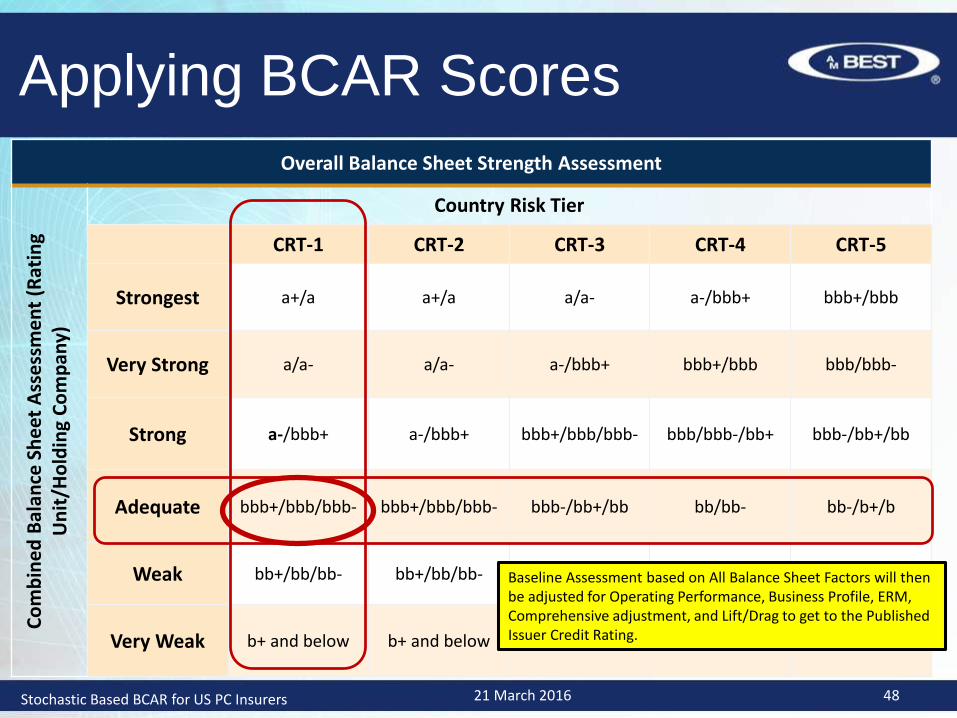
Overall Balance Sheet Strength Assessment
Co
mb
ine
d B
alan
ce S
he
et A
sse
ssm
en
t (R
atin
g U
nit
/Ho
ldin
g C
om
pan
y)
Country Risk Tier
CRT-1 CRT-2 CRT-3 CRT-4 CRT-5
Strongest a+/a a+/a a/a- a-/bbb+ bbb+/bbb
Very Strong a/a- a/a- a-/bbb+ bbb+/bbb bbb/bbb-
Strong a-/bbb+ a-/bbb+ bbb+/bbb/bbb- bbb/bbb-/bb+ bbb-/bb+/bb
Adequate bbb+/bbb/bbb- bbb+/bbb/bbb- bbb-/bb+/bb bb/bb- bb-/b+/b
Weak bb+/bb/bb- bb+/bb/bb- bb-/b+/b b+/b/b- b/b-/ccc+
Very Weak b+ and below b+ and below b- and below ccc+ and below ccc and below
Applying BCAR Scores
Baseline Assessment based on All Balance Sheet Factors will then be adjusted for Operating Performance, Business Profile, ERM, Comprehensive adjustment, and Lift/Drag to get to the Published Issuer Credit Rating.
21 March 2016 48Stochastic Based BCAR for US PC Insurers
Appendix
21 March 2016 50Stochastic Based BCAR for US PC Insurers
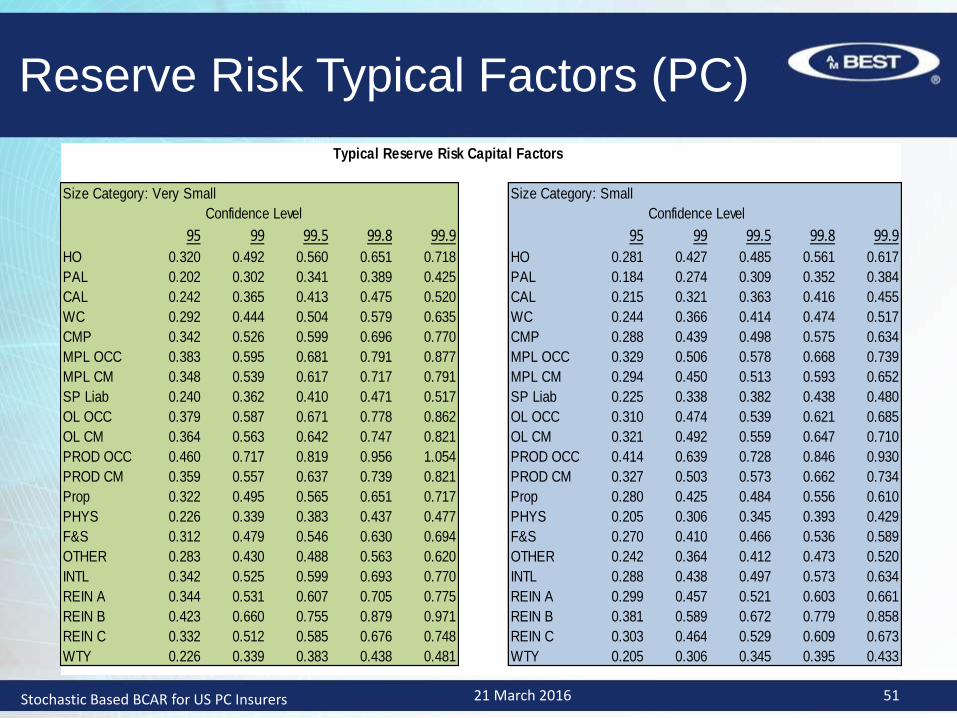
Reserve Risk Typical Factors (PC)
Typical Reserve Risk Capital Factors
Size Category: Very Small Size Category: Small
Confidence Level Confidence Level
95 99 99.5 99.8 99.9 95 99 99.5 99.8 99.9HO 0.320 0.492 0.560 0.651 0.718 HO 0.281 0.427 0.485 0.561 0.617
PAL 0.202 0.302 0.341 0.389 0.425 PAL 0.184 0.274 0.309 0.352 0.384
CAL 0.242 0.365 0.413 0.475 0.520 CAL 0.215 0.321 0.363 0.416 0.455
WC 0.292 0.444 0.504 0.579 0.635 WC 0.244 0.366 0.414 0.474 0.517
CMP 0.342 0.526 0.599 0.696 0.770 CMP 0.288 0.439 0.498 0.575 0.634
MPL OCC 0.383 0.595 0.681 0.791 0.877 MPL OCC 0.329 0.506 0.578 0.668 0.739
MPL CM 0.348 0.539 0.617 0.717 0.791 MPL CM 0.294 0.450 0.513 0.593 0.652
SP Liab 0.240 0.362 0.410 0.471 0.517 SP Liab 0.225 0.338 0.382 0.438 0.480
OL OCC 0.379 0.587 0.671 0.778 0.862 OL OCC 0.310 0.474 0.539 0.621 0.685
OL CM 0.364 0.563 0.642 0.747 0.821 OL CM 0.321 0.492 0.559 0.647 0.710
PROD OCC 0.460 0.717 0.819 0.956 1.054 PROD OCC 0.414 0.639 0.728 0.846 0.930
PROD CM 0.359 0.557 0.637 0.739 0.821 PROD CM 0.327 0.503 0.573 0.662 0.734
Prop 0.322 0.495 0.565 0.651 0.717 Prop 0.280 0.425 0.484 0.556 0.610
PHYS 0.226 0.339 0.383 0.437 0.477 PHYS 0.205 0.306 0.345 0.393 0.429
F&S 0.312 0.479 0.546 0.630 0.694 F&S 0.270 0.410 0.466 0.536 0.589
OTHER 0.283 0.430 0.488 0.563 0.620 OTHER 0.242 0.364 0.412 0.473 0.520
INTL 0.342 0.525 0.599 0.693 0.770 INTL 0.288 0.438 0.497 0.573 0.634
REIN A 0.344 0.531 0.607 0.705 0.775 REIN A 0.299 0.457 0.521 0.603 0.661
REIN B 0.423 0.660 0.755 0.879 0.971 REIN B 0.381 0.589 0.672 0.779 0.858
REIN C 0.332 0.512 0.585 0.676 0.748 REIN C 0.303 0.464 0.529 0.609 0.673
WTY 0.226 0.339 0.383 0.438 0.481 WTY 0.205 0.306 0.345 0.395 0.433
21 March 2016 51Stochastic Based BCAR for US PC Insurers
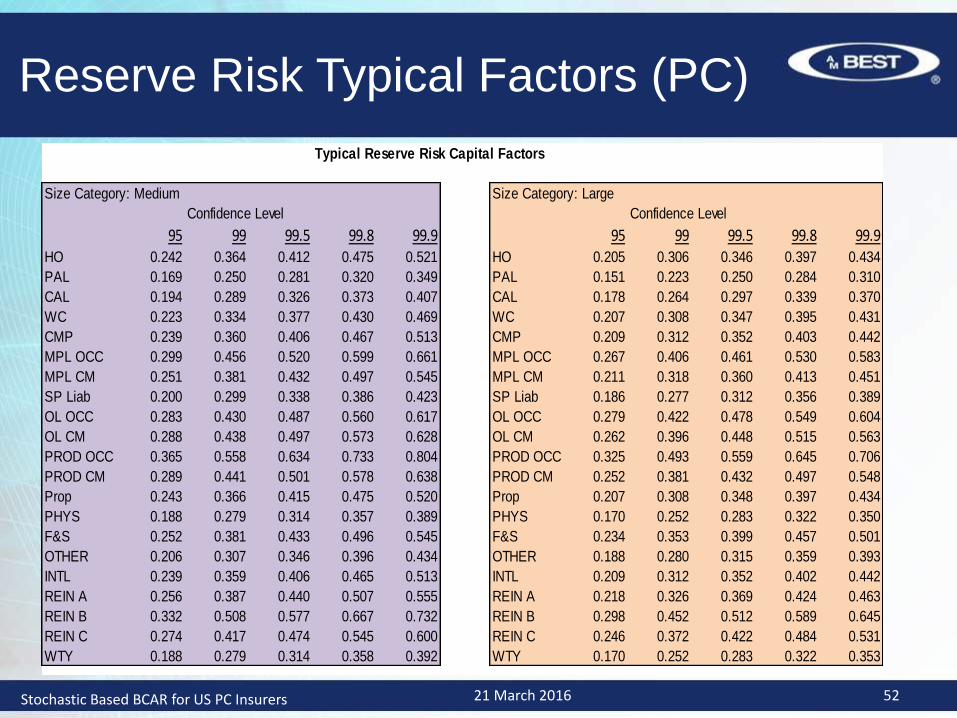
Reserve Risk Typical Factors (PC)
Typical Reserve Risk Capital Factors
Size Category: Medium Size Category: Large
Confidence Level Confidence Level
95 99 99.5 99.8 99.9 95 99 99.5 99.8 99.9HO 0.242 0.364 0.412 0.475 0.521 HO 0.205 0.306 0.346 0.397 0.434
PAL 0.169 0.250 0.281 0.320 0.349 PAL 0.151 0.223 0.250 0.284 0.310
CAL 0.194 0.289 0.326 0.373 0.407 CAL 0.178 0.264 0.297 0.339 0.370
WC 0.223 0.334 0.377 0.430 0.469 WC 0.207 0.308 0.347 0.395 0.431
CMP 0.239 0.360 0.406 0.467 0.513 CMP 0.209 0.312 0.352 0.403 0.442
MPL OCC 0.299 0.456 0.520 0.599 0.661 MPL OCC 0.267 0.406 0.461 0.530 0.583
MPL CM 0.251 0.381 0.432 0.497 0.545 MPL CM 0.211 0.318 0.360 0.413 0.451
SP Liab 0.200 0.299 0.338 0.386 0.423 SP Liab 0.186 0.277 0.312 0.356 0.389
OL OCC 0.283 0.430 0.487 0.560 0.617 OL OCC 0.279 0.422 0.478 0.549 0.604
OL CM 0.288 0.438 0.497 0.573 0.628 OL CM 0.262 0.396 0.448 0.515 0.563
PROD OCC 0.365 0.558 0.634 0.733 0.804 PROD OCC 0.325 0.493 0.559 0.645 0.706
PROD CM 0.289 0.441 0.501 0.578 0.638 PROD CM 0.252 0.381 0.432 0.497 0.548
Prop 0.243 0.366 0.415 0.475 0.520 Prop 0.207 0.308 0.348 0.397 0.434
PHYS 0.188 0.279 0.314 0.357 0.389 PHYS 0.170 0.252 0.283 0.322 0.350
F&S 0.252 0.381 0.433 0.496 0.545 F&S 0.234 0.353 0.399 0.457 0.501
OTHER 0.206 0.307 0.346 0.396 0.434 OTHER 0.188 0.280 0.315 0.359 0.393
INTL 0.239 0.359 0.406 0.465 0.513 INTL 0.209 0.312 0.352 0.402 0.442
REIN A 0.256 0.387 0.440 0.507 0.555 REIN A 0.218 0.326 0.369 0.424 0.463
REIN B 0.332 0.508 0.577 0.667 0.732 REIN B 0.298 0.452 0.512 0.589 0.645
REIN C 0.274 0.417 0.474 0.545 0.600 REIN C 0.246 0.372 0.422 0.484 0.531
WTY 0.188 0.279 0.314 0.358 0.392 WTY 0.170 0.252 0.283 0.322 0.353
21 March 2016 52Stochastic Based BCAR for US PC Insurers
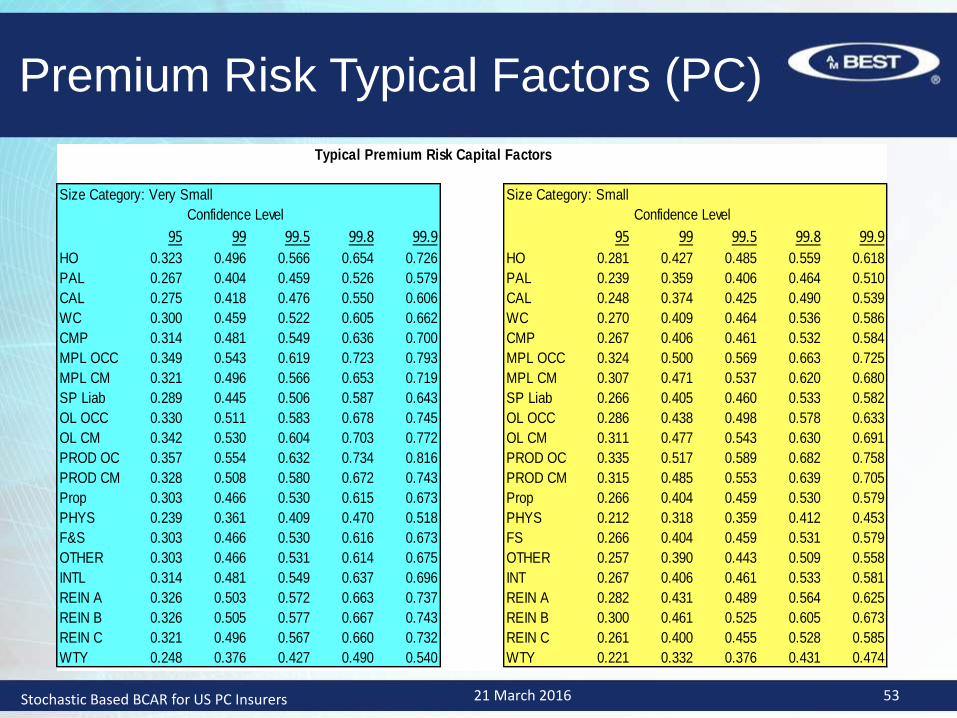
Premium Risk Typical Factors (PC)
Typical Premium Risk Capital Factors
Size Category: Very Small Size Category: Small
Confidence Level Confidence Level
95 99 99.5 99.8 99.9 95 99 99.5 99.8 99.9HO 0.323 0.496 0.566 0.654 0.726 HO 0.281 0.427 0.485 0.559 0.618
PAL 0.267 0.404 0.459 0.526 0.579 PAL 0.239 0.359 0.406 0.464 0.510
CAL 0.275 0.418 0.476 0.550 0.606 CAL 0.248 0.374 0.425 0.490 0.539
WC 0.300 0.459 0.522 0.605 0.662 WC 0.270 0.409 0.464 0.536 0.586
CMP 0.314 0.481 0.549 0.636 0.700 CMP 0.267 0.406 0.461 0.532 0.584
MPL OCC 0.349 0.543 0.619 0.723 0.793 MPL OCC 0.324 0.500 0.569 0.663 0.725
MPL CM 0.321 0.496 0.566 0.653 0.719 MPL CM 0.307 0.471 0.537 0.620 0.680
SP Liab 0.289 0.445 0.506 0.587 0.643 SP Liab 0.266 0.405 0.460 0.533 0.582
OL OCC 0.330 0.511 0.583 0.678 0.745 OL OCC 0.286 0.438 0.498 0.578 0.633
OL CM 0.342 0.530 0.604 0.703 0.772 OL CM 0.311 0.477 0.543 0.630 0.691
PROD OCC 0.357 0.554 0.632 0.734 0.816 PROD OCC 0.335 0.517 0.589 0.682 0.758
PROD CM 0.328 0.508 0.580 0.672 0.743 PROD CM 0.315 0.485 0.553 0.639 0.705
Prop 0.303 0.466 0.530 0.615 0.673 Prop 0.266 0.404 0.459 0.530 0.579
PHYS 0.239 0.361 0.409 0.470 0.518 PHYS 0.212 0.318 0.359 0.412 0.453
F&S 0.303 0.466 0.530 0.616 0.673 FS 0.266 0.404 0.459 0.531 0.579
OTHER 0.303 0.466 0.531 0.614 0.675 OTHER 0.257 0.390 0.443 0.509 0.558
INTL 0.314 0.481 0.549 0.637 0.696 INT 0.267 0.406 0.461 0.533 0.581
REIN A 0.326 0.503 0.572 0.663 0.737 REIN A 0.282 0.431 0.489 0.564 0.625
REIN B 0.326 0.505 0.577 0.667 0.743 REIN B 0.300 0.461 0.525 0.605 0.673
REIN C 0.321 0.496 0.567 0.660 0.732 REIN C 0.261 0.400 0.455 0.528 0.585
WTY 0.248 0.376 0.427 0.490 0.540 WTY 0.221 0.332 0.376 0.431 0.474
21 March 2016 53Stochastic Based BCAR for US PC Insurers
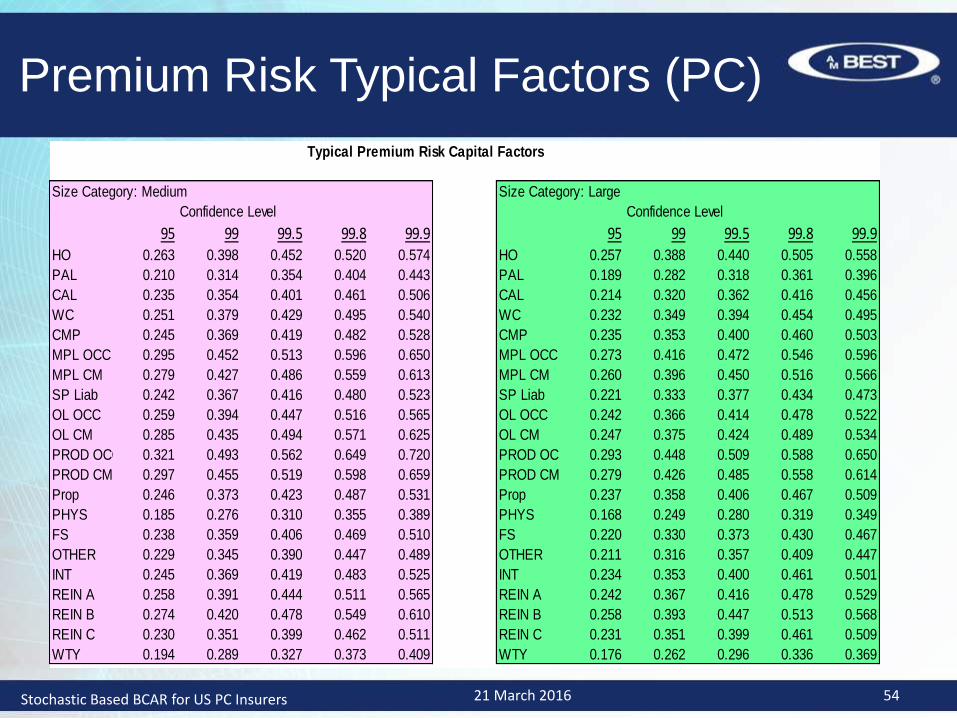
Premium Risk Typical Factors (PC)
Typical Premium Risk Capital Factors
Size Category: Medium Size Category: Large
Confidence Level Confidence Level
95 99 99.5 99.8 99.9 95 99 99.5 99.8 99.9HO 0.263 0.398 0.452 0.520 0.574 HO 0.257 0.388 0.440 0.505 0.558
PAL 0.210 0.314 0.354 0.404 0.443 PAL 0.189 0.282 0.318 0.361 0.396
CAL 0.235 0.354 0.401 0.461 0.506 CAL 0.214 0.320 0.362 0.416 0.456
WC 0.251 0.379 0.429 0.495 0.540 WC 0.232 0.349 0.394 0.454 0.495
CMP 0.245 0.369 0.419 0.482 0.528 CMP 0.235 0.353 0.400 0.460 0.503
MPL OCC 0.295 0.452 0.513 0.596 0.650 MPL OCC 0.273 0.416 0.472 0.546 0.596
MPL CM 0.279 0.427 0.486 0.559 0.613 MPL CM 0.260 0.396 0.450 0.516 0.566
SP Liab 0.242 0.367 0.416 0.480 0.523 SP Liab 0.221 0.333 0.377 0.434 0.473
OL OCC 0.259 0.394 0.447 0.516 0.565 OL OCC 0.242 0.366 0.414 0.478 0.522
OL CM 0.285 0.435 0.494 0.571 0.625 OL CM 0.247 0.375 0.424 0.489 0.534
PROD OCC 0.321 0.493 0.562 0.649 0.720 PROD OCC 0.293 0.448 0.509 0.588 0.650
PROD CM 0.297 0.455 0.519 0.598 0.659 PROD CM 0.279 0.426 0.485 0.558 0.614
Prop 0.246 0.373 0.423 0.487 0.531 Prop 0.237 0.358 0.406 0.467 0.509
PHYS 0.185 0.276 0.310 0.355 0.389 PHYS 0.168 0.249 0.280 0.319 0.349
FS 0.238 0.359 0.406 0.469 0.510 FS 0.220 0.330 0.373 0.430 0.467
OTHER 0.229 0.345 0.390 0.447 0.489 OTHER 0.211 0.316 0.357 0.409 0.447
INT 0.245 0.369 0.419 0.483 0.525 INT 0.234 0.353 0.400 0.461 0.501
REIN A 0.258 0.391 0.444 0.511 0.565 REIN A 0.242 0.367 0.416 0.478 0.529
REIN B 0.274 0.420 0.478 0.549 0.610 REIN B 0.258 0.393 0.447 0.513 0.568
REIN C 0.230 0.351 0.399 0.462 0.511 REIN C 0.231 0.351 0.399 0.461 0.509
WTY 0.194 0.289 0.327 0.373 0.409 WTY 0.176 0.262 0.296 0.336 0.369
21 March 2016 54Stochastic Based BCAR for US PC Insurers
Disclaimer
55
© AM Best Company (AMB) and/or its licensors and affiliates. All rights reserved. ALL INFORMATION CONTAINED HEREIN IS
PROTECTED BY COPYRIGHT LAW AND NONE OF SUCH INFORMATION MAY BE COPIED OR OTHERWISE
REPRODUCED, REPACKAGED, FURTHER TRANSMITTED, TRANSFERRED, DISSEMINATED, REDISTRIBUTED OR
RESOLD, OR STORED FOR SUBSEQUENT USE FOR ANY SUCH PURPOSE, IN WHOLE OR IN PART, IN ANY FORM OR
MANNER OR BY ANY MEANS WHATSOEVER, BY ANY PERSON WITHOUT AMB’s PRIOR WRITTEN CONSENT. All
information contained herein is obtained by AMB from sources believed by it to be accurate and reliable. Because of the possibility
of human or mechanical error as well as other factors, however, all information contained herein is provided “AS IS” without
warranty of any kind. Under no circumstances shall AMB have any liability to any person or entity for (a) any loss or damage in
whole or in part caused by, resulting from, or relating to, any error (negligent or otherwise) or other circumstance or contingency
within or outside the control of AMB or any of its directors, officers, employees or agents in connection with the procurement,
collection, compilation, analysis, interpretation, communication, publication or delivery of any such information, or (b) any direct,
indirect, special, consequential, compensatory or incidental damages whatsoever (including without limitation, lost profits), even if
AMB is advised in advance of the possibility of such damages, resulting from the use of or inability to use, any such information.
The credit ratings, financial reporting analysis, projections, and other observations, if any, constituting part of the information
contained herein are, and must be construed solely as, statements of opinion and not statements of fact or recommendations to
purchase, sell or hold any securities, insurance policies, contracts or any other financial obligations, nor does it address the
suitability of any particular financial obligation for a specific purpose or purchaser. Credit risk is the risk that an entity may not meet
its contractual, financial obligations as they come due. Credit ratings do not address any other risk, including but not limited to,
liquidity risk, market value risk or price volatility of rated securities. NO WARRANTY, EXPRESS OR IMPLIED, AS TO THE
ACCURACY, TIMELINESS, COMPLETENESS, MERCHANTABILITY OR FITNESS FOR ANY PARTICULAR PURPOSE OF ANY
SUCH RATING OR OTHER OPINION OR INFORMATION IS GIVEN OR MADE BY AMB IN ANY FORM OR MANNER
WHATSOEVER. Each credit rating or other opinion must be weighed solely as one factor in any investment or purchasing decision
made by or on behalf of any user of the information contained herein, and each such user must accordingly make its own study
and evaluation of each security or other financial obligation and of each issuer and guarantor of, and each provider of credit
support for, each security or other financial obligation that it may consider purchasing, holding or selling.
Stochastic Based BCAR for US PC Insurers 21 March 2016

![USTFCCCA InfoZone -- All-Time Bests Lists NCAA … · as of 6/11/2018 2:58:43 PM NCAA DI Outdoor Championships USTFCCCA InfoZone -- All-Time Bests Lists event finishes in [ ] ex](https://img.pdfslide.us/doc/110x75/5b80f9b97f8b9a2b678b4cb3/ustfccca-infozone-all-time-bests-lists-ncaa-as-of-6112018-25843-pm-ncaa.jpg)