Embed Size (px)
Citation preview

North Central Illinois Regional Analysis Project
Brian Harger, Research AssociateCenter for Governmental Studies
Northern Illinois UniversityDeKalb, Illinois
North Central Illinois Council of Governments Economic SummitOttawa, IllinoisJune 3, 2015
Part INorth Central Illinois
Industry Cluster Analysis

OverviewNorth Central Illinois Regional Analysis
• The objective was to analyze demographic, business trends and workforce characteristics of North Central Illinois, and identify industry clusters with the potential to drive future economic growth.
• Clusters are concentrations of competing, complementary, and/or interdependent firms and industries which conduct business with each other and/or have common needs for talent, technology, and infrastructure.
• Identified five high potential industry clusters.• Agribusiness, Food Processing and Technology• Energy (Conventional and Renewable)• Machinery Manufacturing• Mining• Transportation and Logistics
• The recommendations may be used to develop strategies and marketing for the region; benefit existing, expanding, and new industries; as well as enhance the workforce.
1
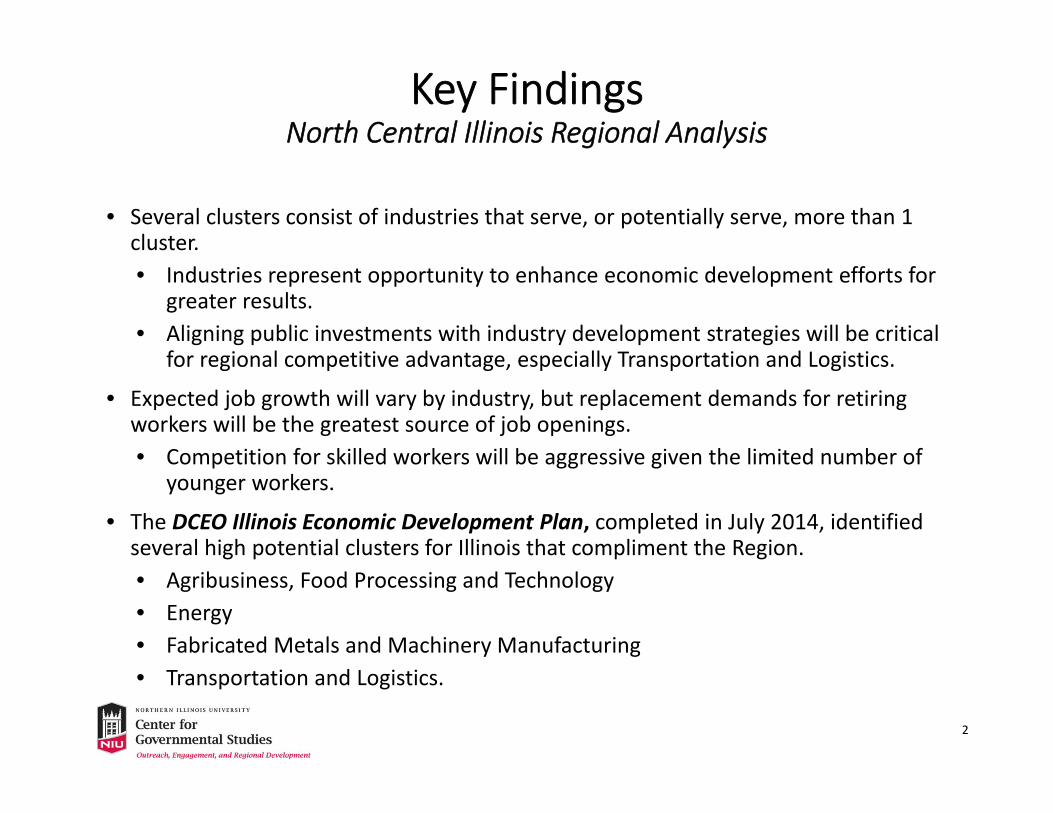
Key FindingsNorth Central Illinois Regional Analysis
• Several clusters consist of industries that serve, or potentially serve, more than 1 cluster.• Industries represent opportunity to enhance economic development efforts for
greater results.• Aligning public investments with industry development strategies will be critical
for regional competitive advantage, especially Transportation and Logistics.
• Expected job growth will vary by industry, but replacement demands for retiring workers will be the greatest source of job openings.• Competition for skilled workers will be aggressive given the limited number of
younger workers.
• The DCEO Illinois Economic Development Plan, completed in July 2014, identified several high potential clusters for Illinois that compliment the Region.• Agribusiness, Food Processing and Technology• Energy• Fabricated Metals and Machinery Manufacturing• Transportation and Logistics.
2

Targeted Industry ClustersCluster Employment and Wage Characteristics
3
DESCRIPTION EMPLOYMENT (2012)
EMPLOYMENT LQ (2012)
% CHANGE (2009-2012)
ANNUALAVG. WAGE
(2012)
WAGELQ (2012)
% CHANGE (2009-2012)
Agribusiness, Food Processing & Technology 3,884 2.2 1.9 $44,629 3.1 110.4
Energy (Conventional & Renewable) 4,730 1.4 -1.4 $67,487 1.4 166.9
Machinery Manufacturing 653 5.7 32.2 $73,023 7.4 180.6Mining 1,053 2.3 -2.5 $81,243 3.4 200.9Transportation & Logistics 4,095 1.7 13.1 $45,482 1.9 112.5
Sources: U.S. Bureau of Labor Statistics, Quarterly Census of Employment and Wages (QCEW) and the Purdue Center for Regional Development (cluster definitions). (2014).
Consideration was also given to supply chain relationships, industry targets identified in the North Central Illinois CEDS, as well as the current business development plans of local governments and economic development agencies.
The selected clusters have a significant presence in North Central Illinois. This presence was determined based on several factors including an assessment of:
Demographic Trends Workforce AttributesEconomic and Industry Trends Supply‐Chain synergiesPhysical Assets (Infrastructure) Support System (education, job training, etc.)Vitality of Business Climate

Targeted Industry ClustersSupply‐Chain Synergies
• Supply chain relationships offer one approach for economic developers to target key industries within each cluster that have potential for new business development or expansion.
• Those key industries are identified as ‘gaps’ between the commodities demanded by the industry cluster to produce their products or services and those supplied from within the region.
• These gaps are analyzed in terms of regional strengths and potential areas for targeting and support and are placed into a supply chain analysis to identify stages of the supply chain with the strongest regional presence.
INDUSTRY REGIONALGAP*
REGIONAL INPUTS*
GROSS INPUTS*
% PURCHASED OUTSIDE REGION
Total Commodity Demand -$403.1 $78.3 $481.4 83.7%
Iron and Steel and Ferroalloy Products -$43.8 $1.3 $45.1 97.1%
Other Engine Equipment -$34.0 $0.5 $34.5 98.4%
Valves and Fittings Other Than Plumbing -$23.5 $0.5 $24.0 98.1%
*Figures are in millions of dollars.Source: IMPLAN, 2014.
4

Targeted Industry ClustersSupply‐Chain Synergies
• In addition to targeting supply chain opportunities within the cluster, there are also opportunities to develop or expand industries that serve more than one targeted cluster.
• For example, the Machinery Manufacturing cluster shares five industry sectors in its supply chain with the other targeted clusters.
• Focusing economic development efforts on these industries could help to strengthen all of them.
MACHINERY MANUFACTURING CLUSTER, SUPPLY CHAIN SYNERGIES
INDUSTRY SECTOR CLUSTER REGIONALEMPLOYMENT
EMPLOYMENTLQ
FARM MACHINERY AND EQUIPMENT MANUFACTURING Agribusiness, Food Processing & Technology, Machinery Mfg. 274 6.9
LAWN AND GARDEN EQUIPMENT MANUFACTURING Agribusiness, Food Processing & Technology, Machinery Mfg. 4 0.3
OTHER INDUSTRIAL MACHINERY MANUFACTURING Agribusiness, Food Processing & Technology, Machinery Mfg. 75 1.6
HEATING EQUIPMENT MANUFACTURING (EXCEPT WARM AIR FURNACES)
Energy, Machinery Mfg. 56 5.5
TURBINE AND TURBINE GENERATOR SET UNITS MANUFACTURING
Energy, Machinery Mfg. 12 0.7
Source: IMPLAN, 2014.
5

ConnectionsIndustry Clusters and Employment Opportunities
• Occupational employment characteristics both influence, and are influenced by, the industrial make‐up of the regional economy, population trends, and educational attainment.
• The skills, aptitudes, and competence of the workforce govern to a large extent the type of industry which can be developed or attracted to a region.
• The North Central Illinois Region maintains a long standing specialization in manufacturing which is reflected in the composition of the workforce.
• Installation, Maintenance, and Repair; Transportation and Material Moving; and Production occupations accounted for 19.2% of total occupational employment, or more than 49,000 jobs, in 2010.
• Although the categories of Installation, Maintenance, and Repair; Transportation and Material Moving; and Production occupations are expected to fall to 18.8% of total employment by 2020, these occupations will continue to play an important role in the economic development of the Region.
• The manufacturing and transportation sectors rely heavily on these occupational skills and, despite anticipated declines in the aggregate number of jobs in the manufacturing sector over the next decade, the demand for replacement workers will more than offset those declines.
6

Average Annual Job OpeningsNorth Central Illinois Region, 2010‐2020
OCCUPATIONAL CLASSIFICATIONAVERAGE ANNUAL JOB OPENINGS DUE TO: ANNUAL
AVERAGE GROWTHGROWTH REPLACEMENT TOTAL
Total, All Occupations 2,809 8,105 10,914 0.6%
Management 116 593 709 0.2%
Business & Financial Operations 143 263 406 1.1%
Computer & Mathematical 49 89 138 1.1%
Architecture & Engineering 38 107 145 0.5%
Sales & Related 148 1,120 1,268 0.2%
Office & Administrative Support 271 1,026 1,297 0.3%
Construction & Extraction 40 282 322 -0.1%
Installation, Maintenance & Repair 84 283 367 0.6%
Production 87 551 638 -0.1%
Transportation & Material Moving 260 633 893 0.9%
Source: Illinois Department of Employment Security, Labor Market Information Unit. (2014).Note: The “Region” cited in this table consists of Workforce Investment Areas #4 (Bureau, Carroll, JoDaviess, LaSalle,Lee, Ogle, Putnam and Whiteside Counties), #11 (Grundy, Kankakee and Livingston Counties), and #15 (Marshall, Peoria, Stark and Woodford Counties).
7

Part IINorth Central Illinois
Labor Availability Report

Key FindingsNorth Central Illinois EDD Labor Availability Report
• The North Central Illinois region had… • a household population of approximately 170,100; • a civilian labor force of approximately 87,100; • and a pool of approximately 9,400 unemployed persons who are actively seeking work.
• Survey indicated that a new/expanding employer can attract employees from an additional pool of 16,300 underemployed workers.
• Together with the unemployed, actively seeking work individuals, the North Central Illinois region has approximately 25,700 available workers for new or existing employers.
8
Total Available Workers
Number of Underemployed Workers 16,300
Number of Unemployed, Actively Seeking Work Individuals 9,400
Total Number of Workers Available for Employers 25,700

Characteristics of the UnderemployedNorth Central Illinois EDD Labor Availability Report
• The 16,300 underemployed workers might also be termed “upgraders”. They desire to move into an upgraded job and appear to possess the skills, education,
and experience to do so.
• The gender split is roughly equal (52% Male/48% Female).
• Average age of underemployed respondents is 42 years; the largest share (34%) are between 45 and 54 years old.
• Approximately 38% of underemployed hold a college or vocational/technical degree. An additional 26% have some college but no degree.
• The average commute distance of the underemployed workers is 17 miles, but would be willing to commute nearly twice that distance for a better job.
• Approximately 60% have been in their current job 5 years or less.
9

Experience of the UnderemployedNorth Central Illinois EDD Labor Availability Report
Type of Training Course Number of Workers*
Percent of Total
Average Years of Experience
Customer Service 10,900 67% 12
Office Operations 9,800 60% 11
Manufacturing/Assembly/Fabrication 8,600 53% 13
Warehouse/Distribution/Transportation 8,300 51% 8
Sales 7,500 46% 9
Maintenance/Installation/Repair 6,500 40% 14
Information Technology 5,700 35% 11
Telecommunications 4,700 29% 8
Medical/Healthcare 3,600 22% 11
Call Center 3,400 21% 4
10
Note: Individuals polled normally have experience and skills in multiple categories; therefore, the category number of workers will not total to the number of underemployed, nor will the percentages equal 100. Figures are rounded.

Skills of the UnderemployedNorth Central Illinois EDD Labor Availability Report
Type of Training Course Number of Workers*
Percent of Total
Office Operations 10,300 63%
Warehouse/Logistics 10,100 62%
Manufacturing/Assembly/Fabrication 8,800 54%
Technician/Quality Assurance 7,200 44%
Information Technology 6,700 41%
Telecommunications 6,200 38%
Maintenance/Installation/Repair 6,000 37%
Electronics/Engineering 4,700 29%
Medial/Healthcare 4,100 25%
11
Note: Individuals polled normally have experience and skills in multiple categories; therefore, the category number of workers will not total to the number of underemployed, nor will the percentages equal 100. Figures are rounded.

Characteristics of the UnemployedNorth Central Illinois EDD Labor Availability Report
• Approximately 9,400 unemployedworkers were actively seeking work.
• The gender distribution is approximately 2:1 (66% Male/34% Female).
• Average age of unemployed respondents is 41 years; the largest share (41%) are between 45 and 54 years old.
• Approximately 38% of the unemployed hold a college or vocational/technical degree. An additional 20% have some college but no degree.
• While 51% have been out of work a year or less, 28% have been unemployed more than 24 months.
• The most frequently reason cited for being out of work was layoffs or job elimination.
12

Experience of the UnemployedNorth Central Illinois EDD Labor Availability Report
Type of Job or Industry Number of Workers*
Percent of Total
Manufacturing/Assembly/Fabrication 6,700 71%
Sales 6,600 70%
Office Operations 5,200 55%
Warehouse/Distribution/Transportation 4,900 52%
Maintenance/Installation/Repair 4,300 46%
Customer Service 4,000 43%
Medical/Health Sciences 2,500 27%
Telecommunications 2,400 25%
Call Center 2,200 23%
Information Technology 1,500 16%
13
*Individuals polled normally have experience and skills in multiple categories; therefore, the category number of workers will not total to the number of underemployed, nor will the percentages equal 100. Figures are rounded.

Skills of the UnemployedNorth Central Illinois EDD Labor Availability Report
Type of Training Course Number of Workers*
Percent of Total
Office Operations 6,700 71%
Manufacturing/Assembly/Fabrication 6,400 68%
Warehouse/Logistics 4,700 50%
Medical/Health Sciences 3,700 39%
Maintenance/Installation/Repair 3,400 36%
Information Technology 3,400 36%
Telecommunications 3,200 34%
Electronics/Engineering 3,200 34%
Technician/Quality Assurance 2,200 23%
14
* Individuals polled normally have experience and skills in multiple categories; therefore, the category number of workers will not total to the number of underemployed, nor will the percentages equal 100. Figures are rounded.

Employers’ Views of the WorkforceNorth Central Illinois EDD Labor Availability Report
15
11
5
6
10
5
22
20
32
11
16
42
61
70
56
78
53
42
6
5
6
11
21
11
0% 20% 40% 60% 80% 100%
Mathematics
Computer Skills
Writing
Reading
Local CommunityColleges/TechnicalTraining Programs
Local Public Schools
Employer’s Rating of Education System and Worker Competencies
Poor Fair Good Excellent

Employers’ Views of the WorkforceNorth Central Illinois EDD Labor Availability Report
16
5
5
5
5
5
5
13
5
30
10
20
25
5
11
69
95
65
85
60
65
80
63
13
5
15
5
10
21
0% 20% 40% 60% 80% 100%
Overall Rating
Trainability
Job Readiness
Entry Level Skills
Teamwork
Attitude
Reliability
Productivity
Employer’s Rating of Worker Attributes
Poor Fair Good Excellent

Employers’ Views of the WorkforceNorth Central Illinois EDD Labor Availability Report
17
5
12
31
15
32
41
38
39
58
41
25
45
5
6
6
5
0% 20% 40% 60% 80% 100%
Unskilled
Professional
Technical
Skilled
Employer’s Rating of Worker Availability by Occupational Class
Poor Fair Good Excellent
69% Rated Fair/Poor!
53% Rated Fair/Poor!
54% Rated Fair/Poor!

Employers’ Views of the WorkforceNorth Central Illinois EDD Labor Availability Report
18
30
20
35
26
60
25
63
20
10
11
0% 20% 40% 60% 80% 100%
Quality of Life
Transportation System
Business Climate
Employer’s Rating of Regional Attributes
Poor Fair Good Excellent
65% Rated Fair/Poor!
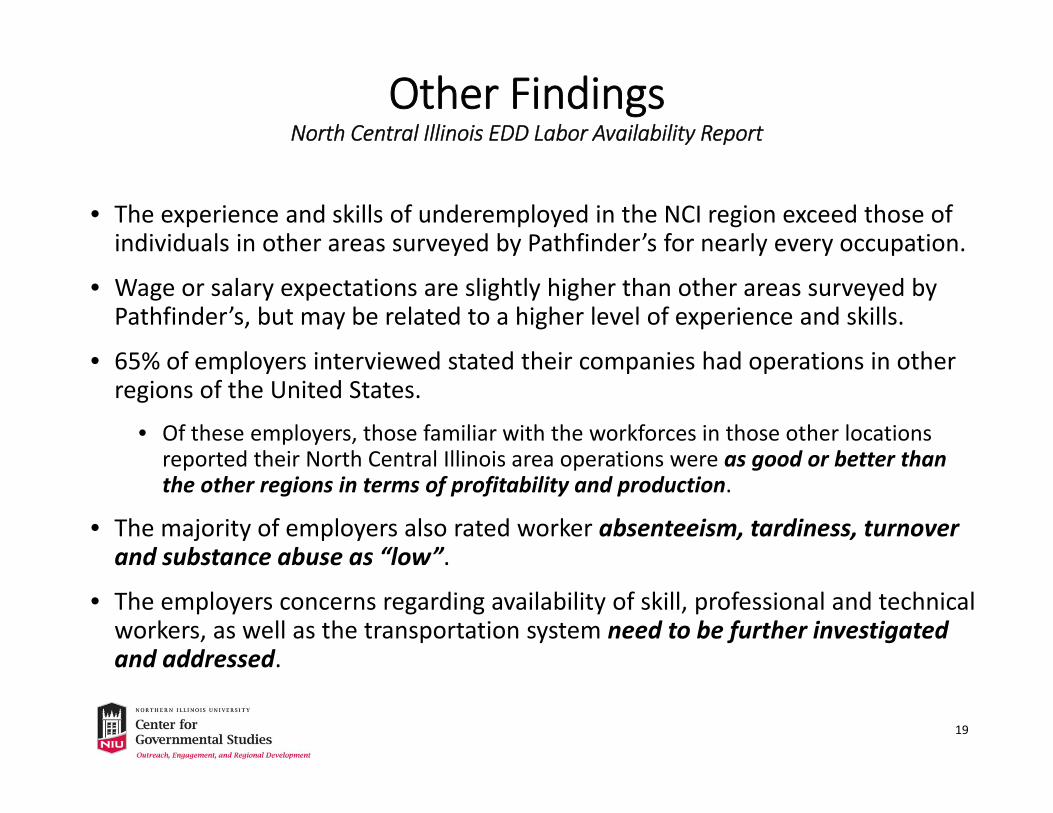
Other FindingsNorth Central Illinois EDD Labor Availability Report
19
• The experience and skills of underemployed in the NCI region exceed those of individuals in other areas surveyed by Pathfinder’s for nearly every occupation.
• Wage or salary expectations are slightly higher than other areas surveyed by Pathfinder’s, but may be related to a higher level of experience and skills.
• 65% of employers interviewed stated their companies had operations in other regions of the United States.
• Of these employers, those familiar with the workforces in those other locations reported their North Central Illinois area operations were as good or better than the other regions in terms of profitability and production.
• The majority of employers also rated worker absenteeism, tardiness, turnover and substance abuse as “low”.
• The employers concerns regarding availability of skill, professional and technical workers, as well as the transportation system need to be further investigated and addressed.

For Further Information, Contact:
Center for Governmental StudiesNorthern Illinois University
DeKalb, Illinois 60115www.cgs.niu.edu
Brian HargerResearch [email protected]