Embed Size (px)
Citation preview
T H E T H I R D A N N U A L N E R I L A B O U R M A R K E T C O N F E R E N C E
M A Y 1 S T 2 0 1 5
Jason Loughrey Agricultural Economics and Farm Survey Department
Rural Economy and Development Teagasc
Athenry, Co. Galway Email: [email protected]
Household Income Volatility and Economic Security Indices
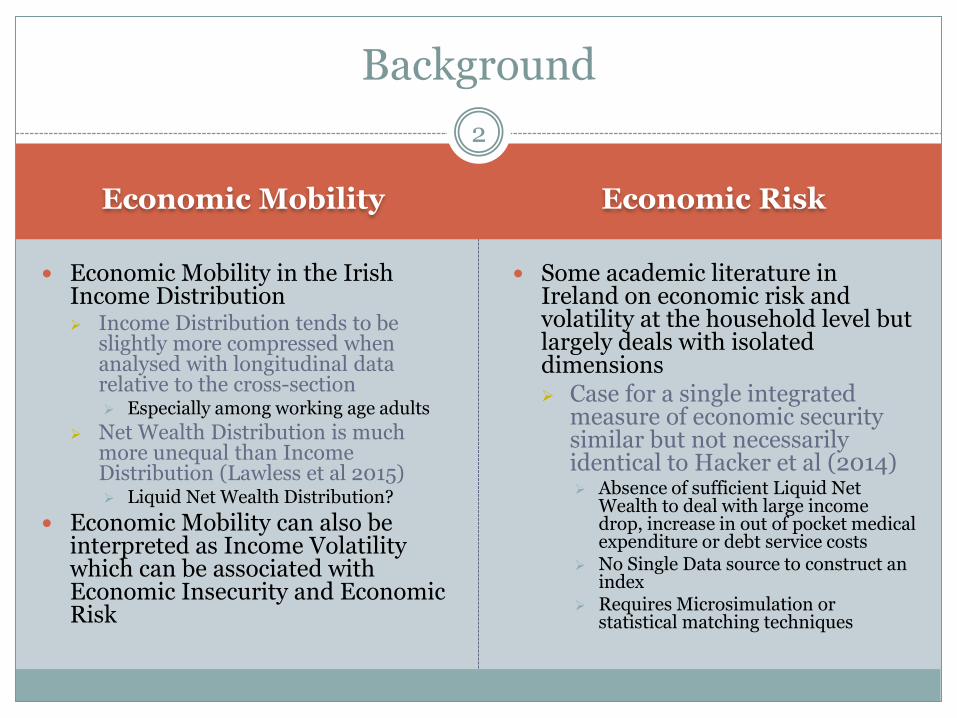
Economic Mobility Economic Risk
Economic Mobility in the Irish Income Distribution Income Distribution tends to be
slightly more compressed when analysed with longitudinal data relative to the cross-section Especially among working age adults
Net Wealth Distribution is much more unequal than Income Distribution (Lawless et al 2015) Liquid Net Wealth Distribution?
Economic Mobility can also be interpreted as Income Volatility which can be associated with Economic Insecurity and Economic Risk
Some academic literature in Ireland on economic risk and volatility at the household level but largely deals with isolated dimensions Case for a single integrated
measure of economic security similar but not necessarily identical to Hacker et al (2014) Absence of sufficient Liquid Net
Wealth to deal with large income drop, increase in out of pocket medical expenditure or debt service costs
No Single Data source to construct an index
Requires Microsimulation or statistical matching techniques
2
Background
Why are these topics important?
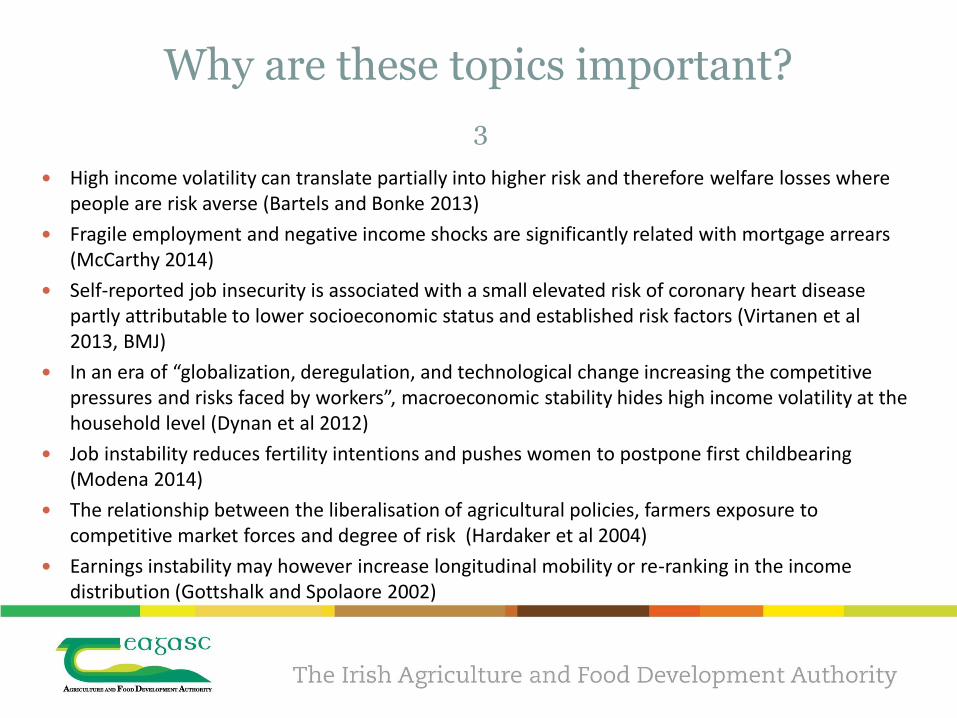
High income volatility can translate partially into higher risk and therefore welfare losses where people are risk averse (Bartels and Bonke 2013)
Fragile employment and negative income shocks are significantly related with mortgage arrears (McCarthy 2014)
Self-reported job insecurity is associated with a small elevated risk of coronary heart disease partly attributable to lower socioeconomic status and established risk factors (Virtanen et al 2013, BMJ)
In an era of “globalization, deregulation, and technological change increasing the competitive pressures and risks faced by workers”, macroeconomic stability hides high income volatility at the household level (Dynan et al 2012)
Job instability reduces fertility intentions and pushes women to postpone first childbearing (Modena 2014)
The relationship between the liberalisation of agricultural policies, farmers exposure to competitive market forces and degree of risk (Hardaker et al 2004)
Earnings instability may however increase longitudinal mobility or re-ranking in the income distribution (Gottshalk and Spolaore 2002)
3
Permanent Shocks
“Because permanent shocks, such as those experienced by many displaced workers, are even more consequential than transitory ones, it makes good sense to include them in the measurement of earnings volatility” Shin and Solon (2012)
4

METHODOLOGY
5
The Arc Percentage Change
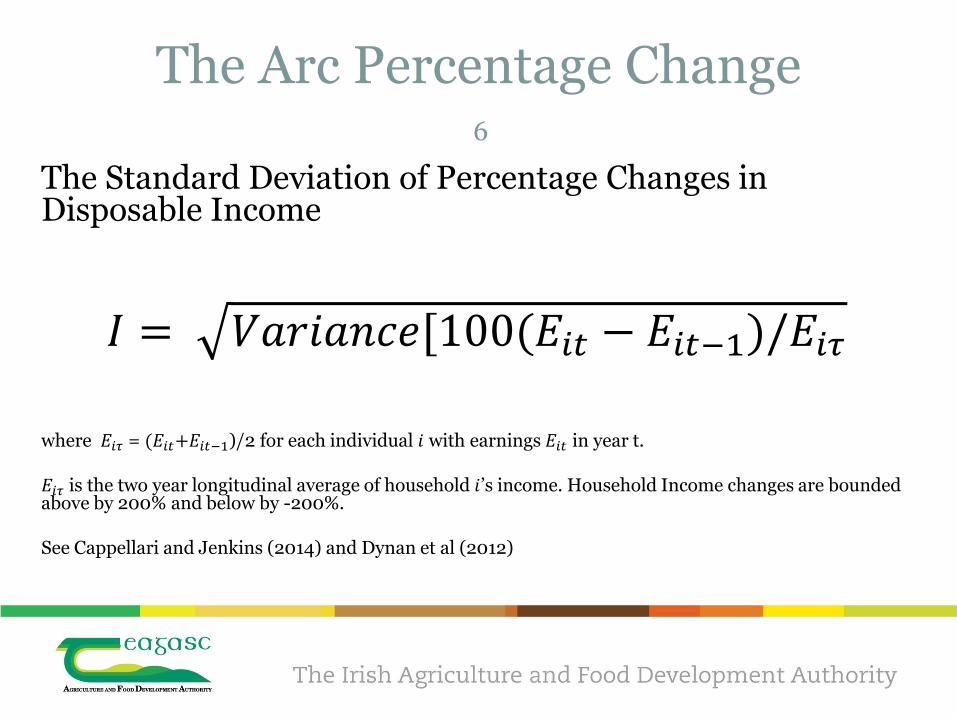
The Standard Deviation of Percentage Changes in Disposable Income
𝐼 = 𝑉𝑎𝑟𝑖𝑎𝑛𝑐𝑒[100(𝐸𝑖𝑡 − 𝐸𝑖𝑡−1)/𝐸𝑖𝜏 where 𝐸𝑖𝜏 = (𝐸𝑖𝑡+𝐸𝑖𝑡−1)/2 for each individual 𝑖 with earnings 𝐸𝑖𝑡 in year t. 𝐸𝑖𝜏 is the two year longitudinal average of household 𝑖’s income. Household Income changes are bounded above by 200% and below by -200%. See Cappellari and Jenkins (2014) and Dynan et al (2012)
6
DATA
7
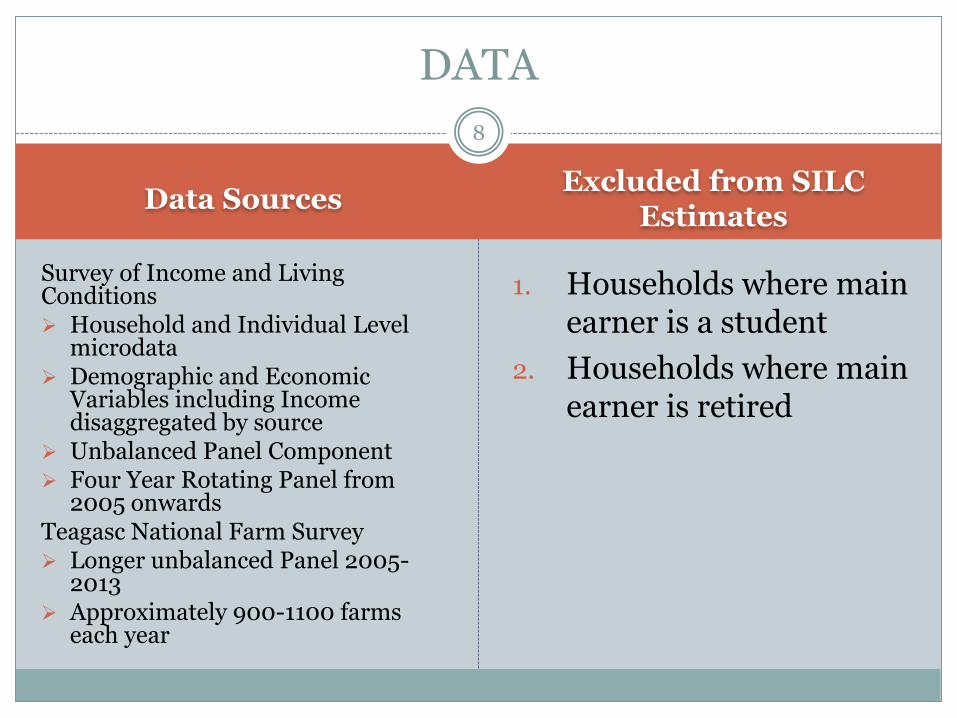
Data Sources Excluded from SILC
Estimates
Survey of Income and Living Conditions Household and Individual Level
microdata Demographic and Economic
Variables including Income disaggregated by source
Unbalanced Panel Component Four Year Rotating Panel from
2005 onwards Teagasc National Farm Survey Longer unbalanced Panel 2005-
2013 Approximately 900-1100 farms
each year
1. Households where main earner is a student
2. Households where main earner is retired
DATA
8
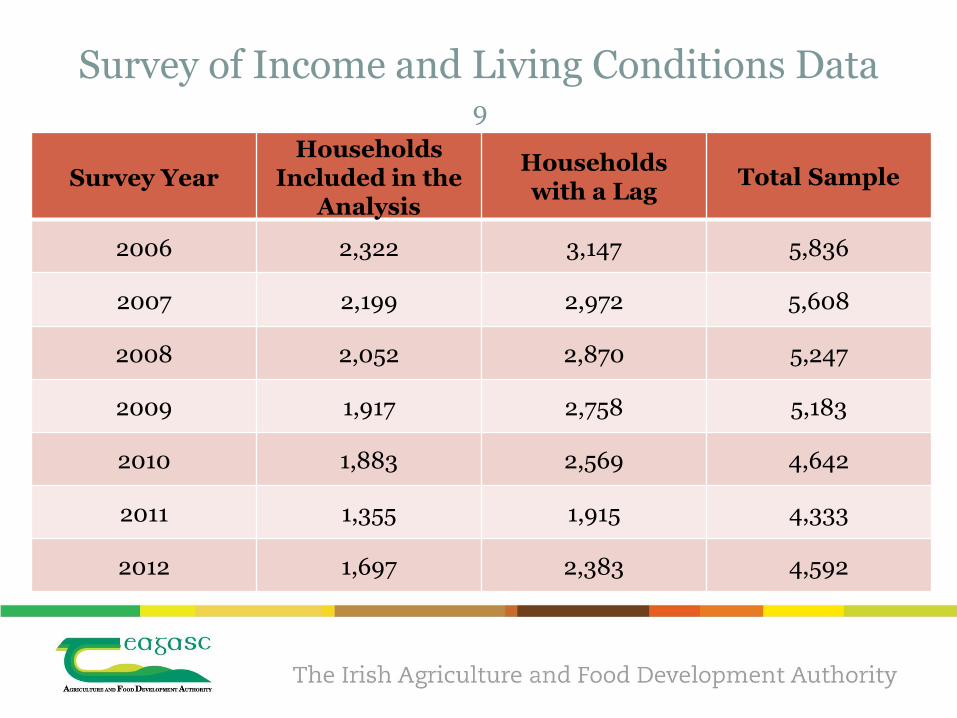
Survey of Income and Living Conditions Data
Survey Year Households
Included in the Analysis
Households with a Lag
Total Sample
2006 2,322 3,147 5,836
2007 2,199 2,972 5,608
2008 2,052 2,870 5,247
2009 1,917 2,758 5,183
2010 1,883 2,569 4,642
2011 1,355 1,915 4,333
2012 1,697 2,383 4,592
9

RESULTS
10
Volatility
0
10
20
30
40
50
60
70
80
90
100
2006 2007 2008 2009 2010 2011 2012
Pe
rc
en
tag
e
Year
Volatility
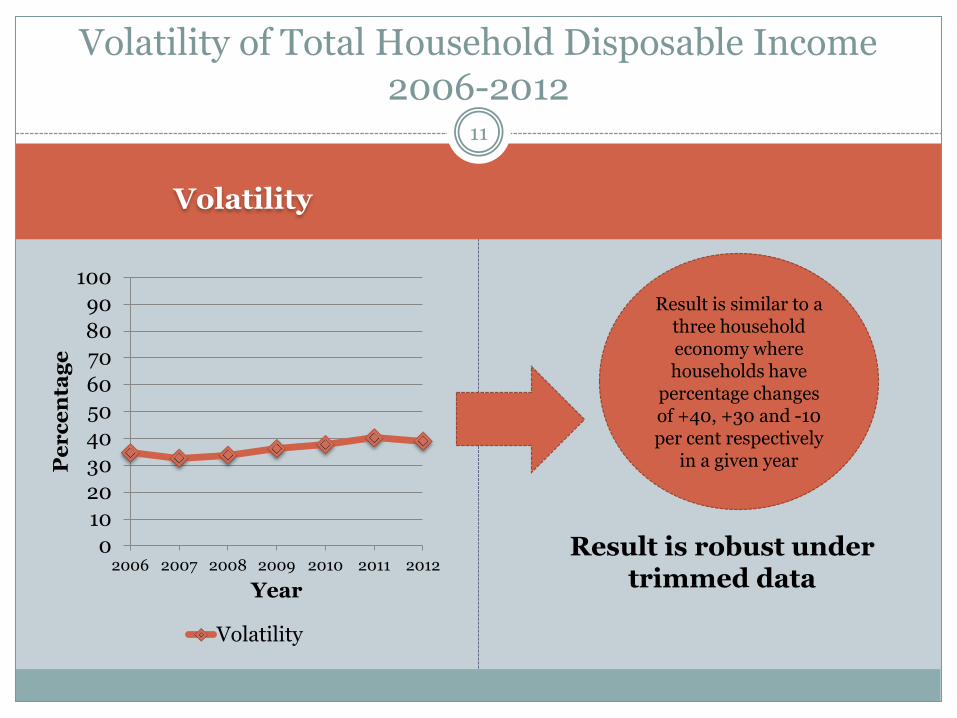
Volatility of Total Household Disposable Income 2006-2012
Result is similar to a three household economy where households have
percentage changes of +40, +30 and -10 per cent respectively
in a given year
11
Result is robust under trimmed data
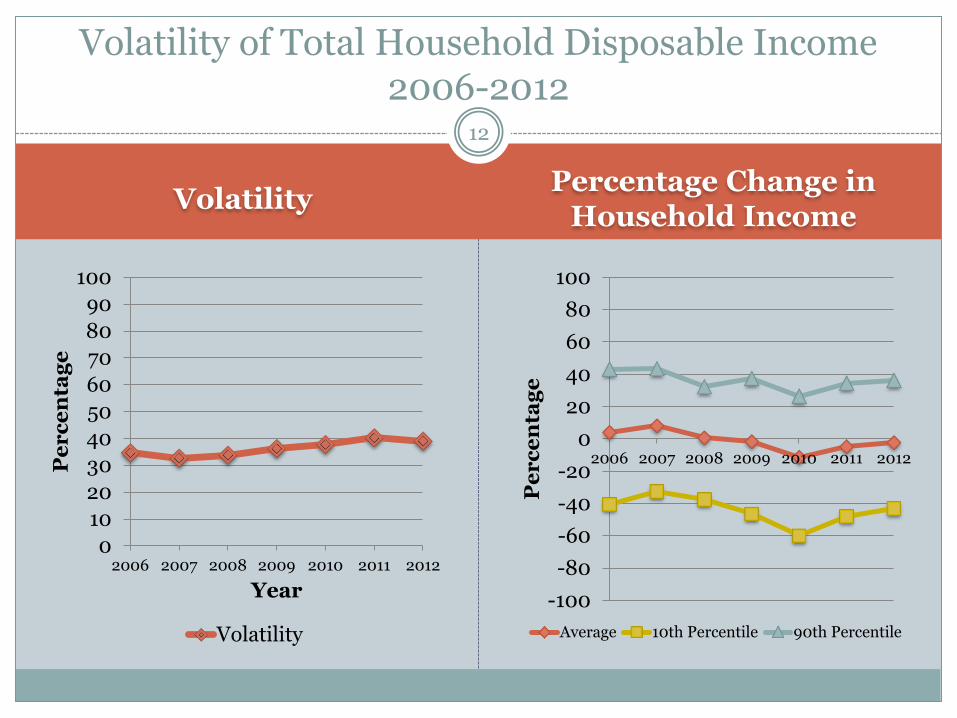
Volatility Percentage Change in
Household Income
0
10
20
30
40
50
60
70
80
90
100
2006 2007 2008 2009 2010 2011 2012
Pe
rc
en
tag
e
Year
Volatility
-100
-80
-60
-40
-20
0
20
40
60
80
100
2006 2007 2008 2009 2010 2011 2012
Pe
rc
en
tag
e
Average 10th Percentile 90th Percentile
Volatility of Total Household Disposable Income 2006-2012
12
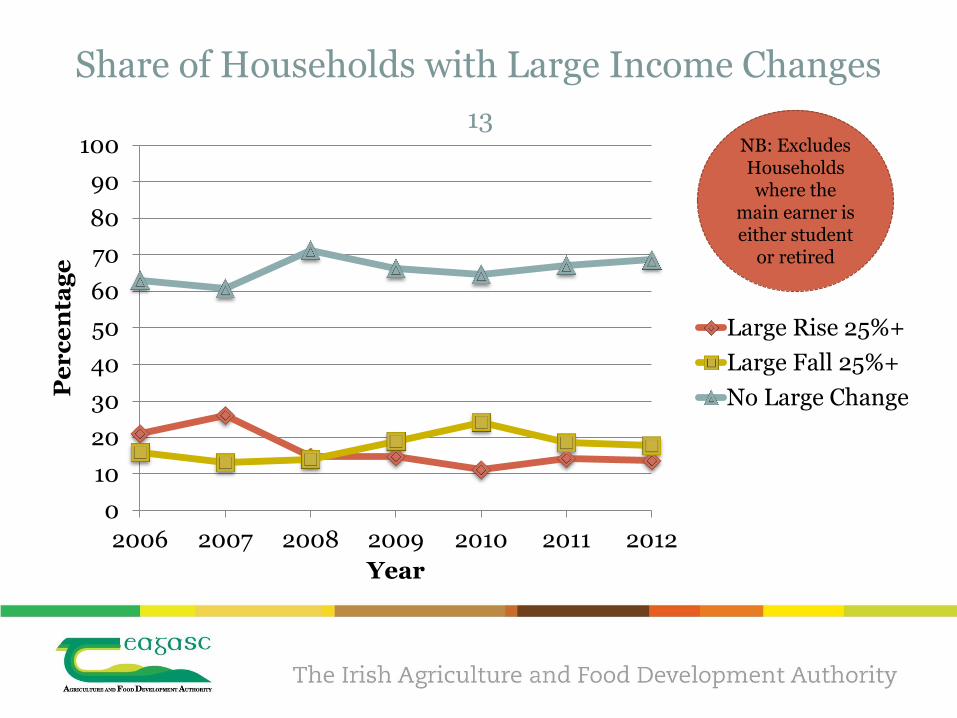
Share of Households with Large Income Changes
0
10
20
30
40
50
60
70
80
90
100
2006 2007 2008 2009 2010 2011 2012
Pe
rc
en
tag
e
Year
Large Rise 25%+
Large Fall 25%+
No Large Change
NB: Excludes Households where the
main earner is either student
or retired
13
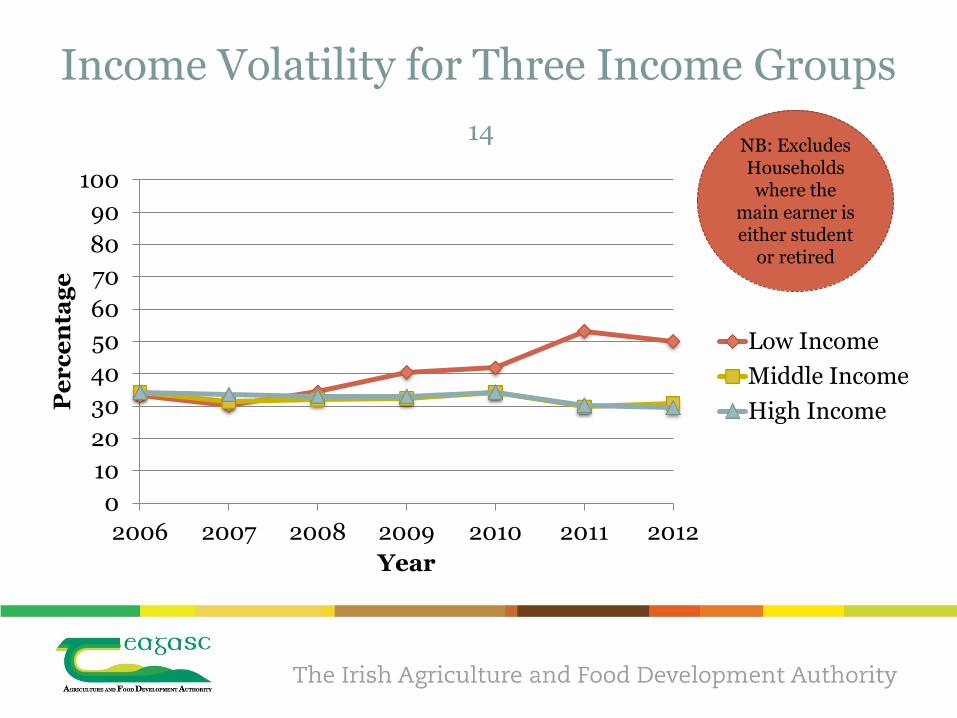
Income Volatility for Three Income Groups
0
10
20
30
40
50
60
70
80
90
100
2006 2007 2008 2009 2010 2011 2012
Pe
rc
en
tag
e
Year
Low Income
Middle Income
High Income
14 NB: Excludes Households where the
main earner is either student
or retired
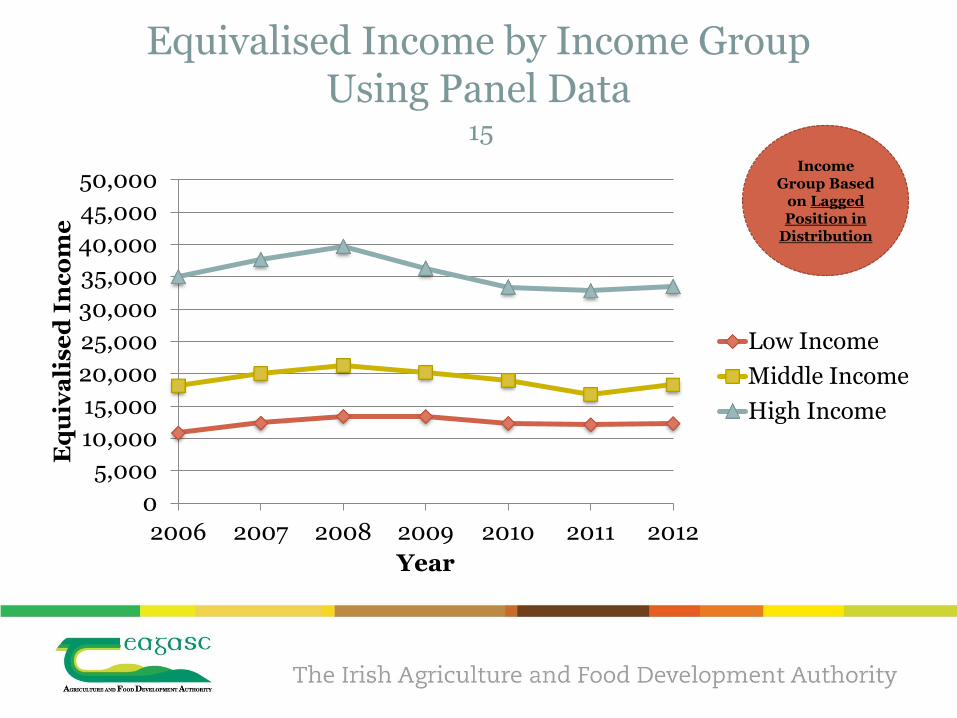
Equivalised Income by Income Group Using Panel Data
15
0
5,000
10,000
15,000
20,000
25,000
30,000
35,000
40,000
45,000
50,000
2006 2007 2008 2009 2010 2011 2012
Eq
uiv
ali
se
d I
nc
om
e
Year
Low Income
Middle Income
High Income
Income Group Based
on Lagged Position in
Distribution
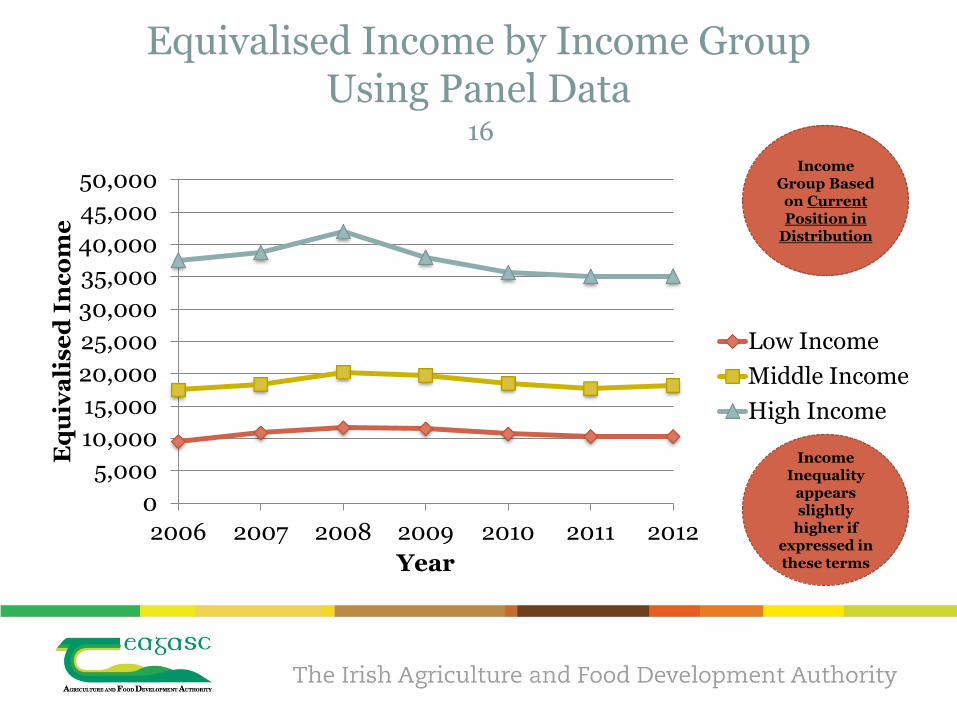
Equivalised Income by Income Group Using Panel Data
16
0
5,000
10,000
15,000
20,000
25,000
30,000
35,000
40,000
45,000
50,000
2006 2007 2008 2009 2010 2011 2012
Eq
uiv
ali
se
d I
nc
om
e
Year
Low Income
Middle Income
High Income
Income Group Based on Current Position in
Distribution
Income Inequality
appears slightly
higher if expressed in these terms
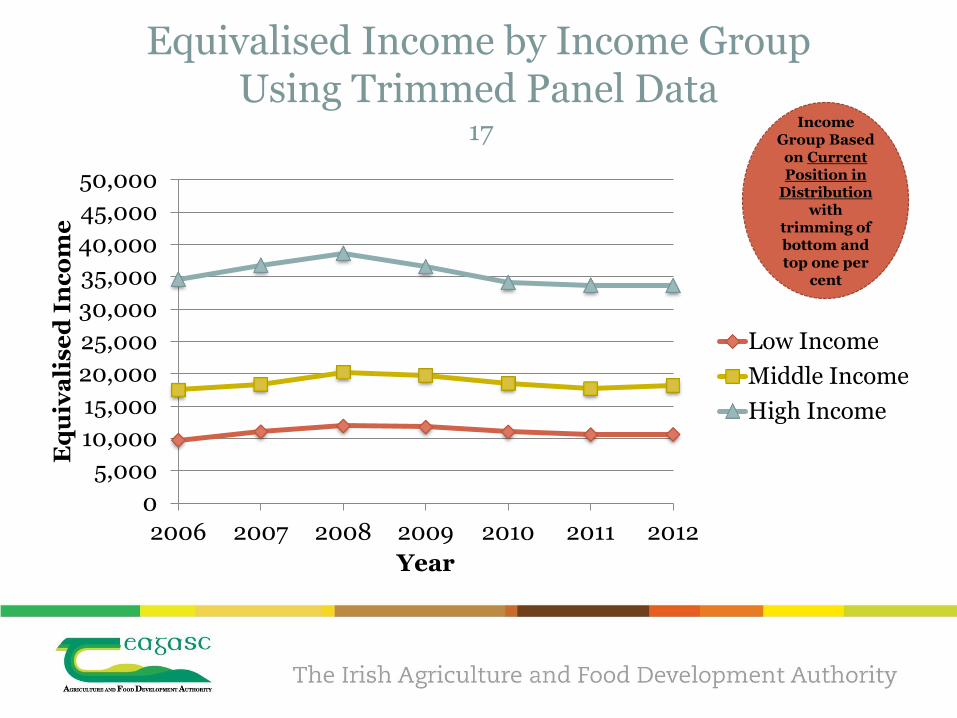
Equivalised Income by Income Group Using Trimmed Panel Data
17
0
5,000
10,000
15,000
20,000
25,000
30,000
35,000
40,000
45,000
50,000
2006 2007 2008 2009 2010 2011 2012
Eq
uiv
ali
se
d I
nc
om
e
Year
Low Income
Middle Income
High Income
Income Group Based on Current Position in
Distribution with
trimming of bottom and top one per
cent
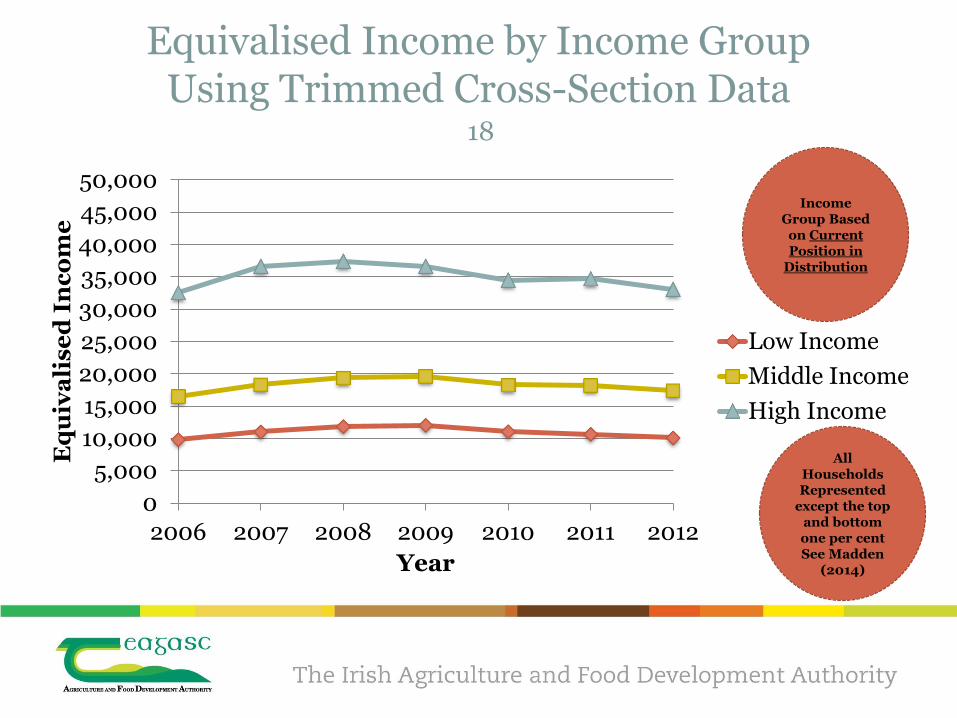
Equivalised Income by Income Group Using Trimmed Cross-Section Data
18
0
5,000
10,000
15,000
20,000
25,000
30,000
35,000
40,000
45,000
50,000
2006 2007 2008 2009 2010 2011 2012
Eq
uiv
ali
se
d I
nc
om
e
Year
Low Income
Middle Income
High Income
Income Group Based
on Current Position in
Distribution
All Households Represented
except the top and bottom one per cent See Madden
(2014)
Some Observations 19
Income Volatility clearly highest among the bottom one-third of the income distribution during the recession
Longitudinal Data gives a slightly more dispersed income distribution than the Cross-Sectional Data
Despite this, the distribution is more compressed if expressed according to lagged position in the distribution
Researchers rely upon the Cross-Sectional Data for estimating Gini Coefficients etc.
Low Income,
High Volatility,
Why?
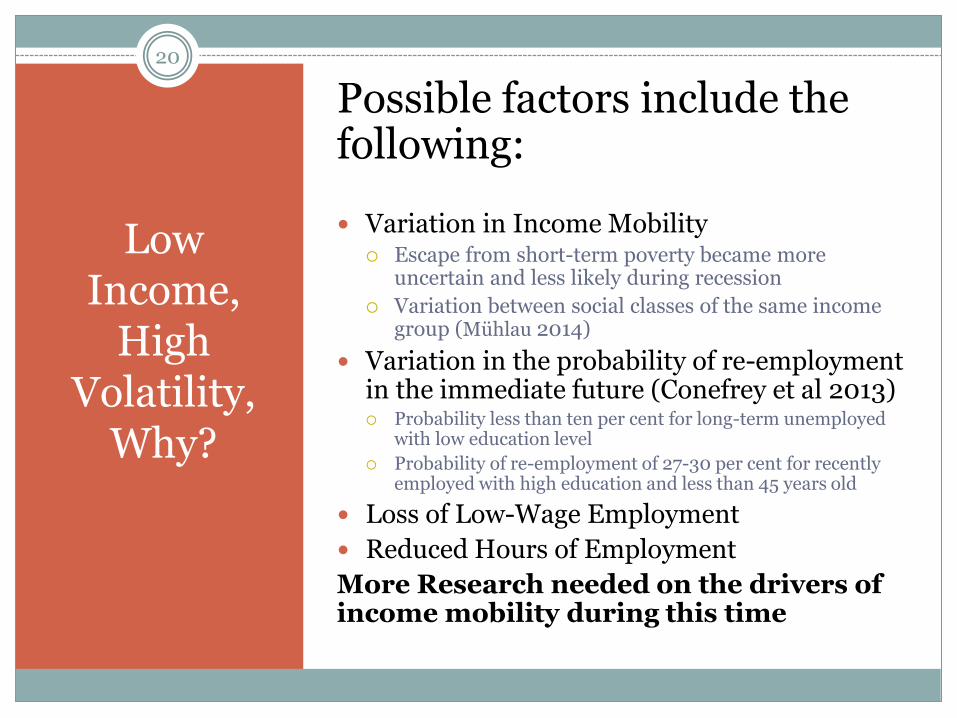
Possible factors include the following:
Variation in Income Mobility Escape from short-term poverty became more
uncertain and less likely during recession
Variation between social classes of the same income group (Mühlau 2014)
Variation in the probability of re-employment in the immediate future (Conefrey et al 2013) Probability less than ten per cent for long-term unemployed
with low education level
Probability of re-employment of 27-30 per cent for recently employed with high education and less than 45 years old
Loss of Low-Wage Employment
Reduced Hours of Employment
More Research needed on the drivers of income mobility during this time
20
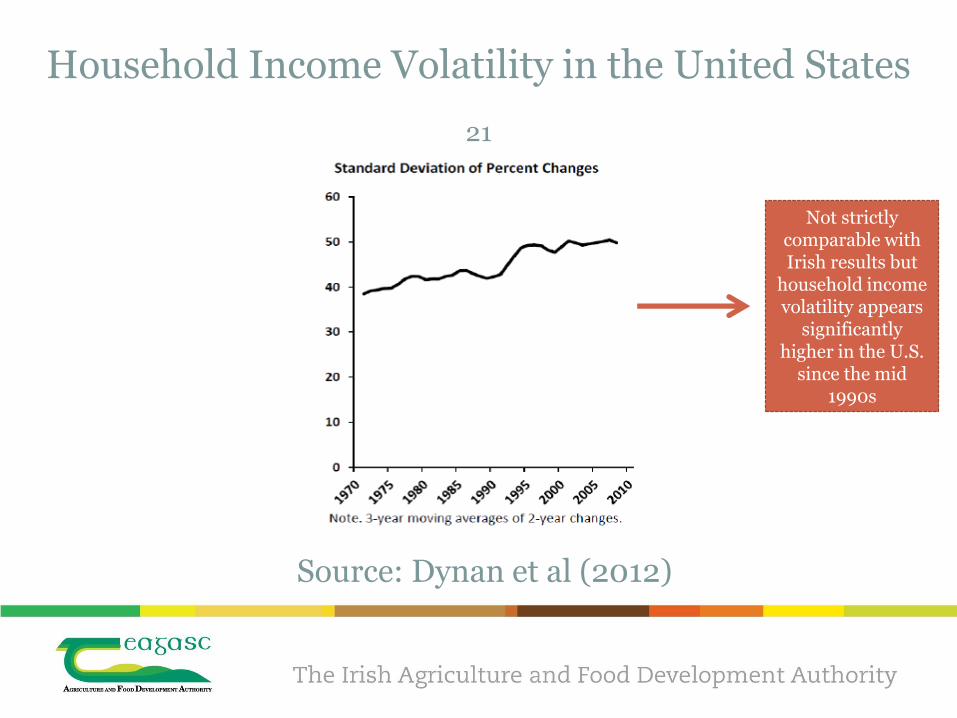
Household Income Volatility in the United States
Not strictly comparable with Irish results but
household income volatility appears
significantly higher in the U.S.
since the mid 1990s
Source: Dynan et al (2012)
21

EVIDENCE FROM THE FARM
22
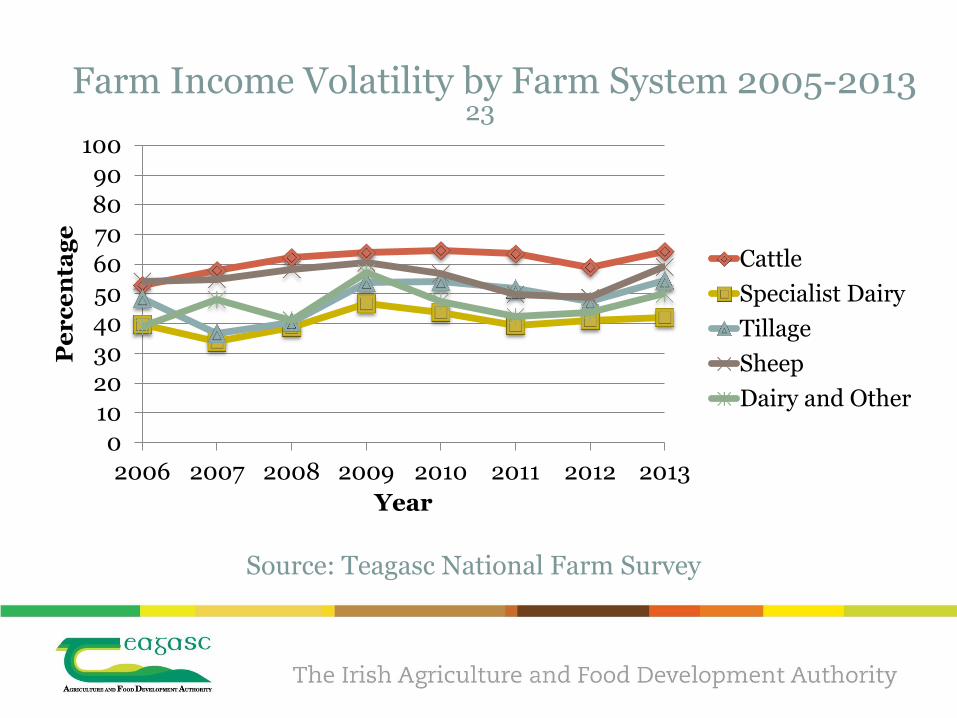
Source: Teagasc National Farm Survey
0
10
20
30
40
50
60
70
80
90
100
2006 2007 2008 2009 2010 2011 2012 2013
Pe
rc
en
tag
e
Year
Cattle
Specialist Dairy
Tillage
Sheep
Dairy and Other
23 Farm Income Volatility by Farm System 2005-2013
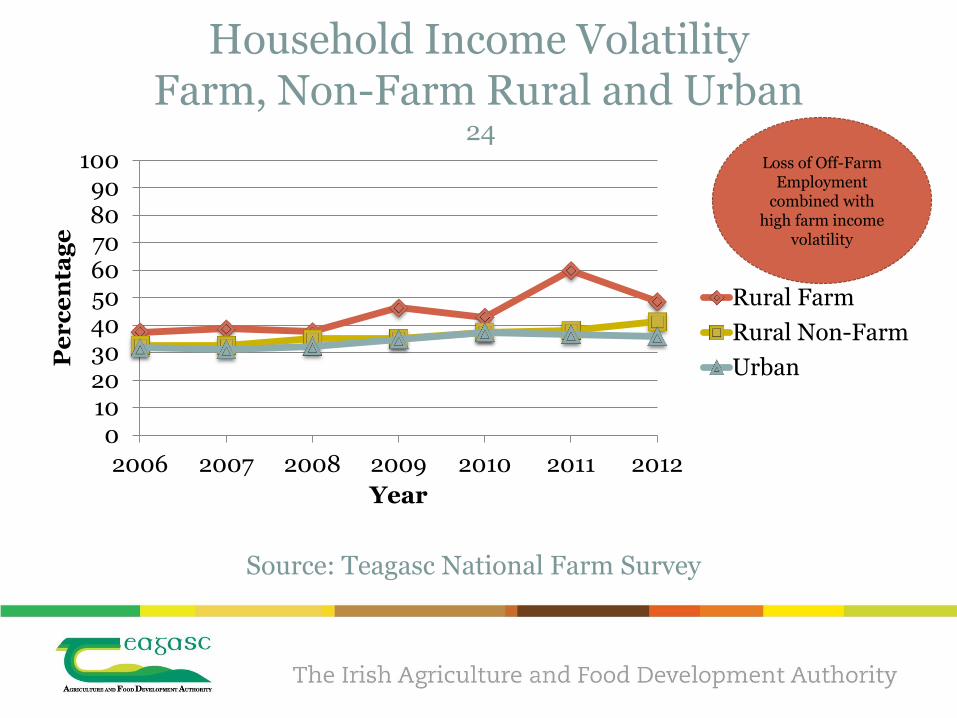
Household Income Volatility Farm, Non-Farm Rural and Urban
0102030405060708090
100
2006 2007 2008 2009 2010 2011 2012
Pe
rc
en
tag
e
Year
Rural Farm
Rural Non-Farm
Urban
24 Loss of Off-Farm
Employment combined with
high farm income volatility
Source: Teagasc National Farm Survey
BUILDING AN ECONOMIC SECURITY
INDEX
25
THE ECONOMIC SECURITY INDEX: A NEW MEASURE FOR RESEARCH AND POLICY ANALYSIS
Review of Income and Wealth, May 2014
Jacob S. Hacker and Gregory A. Huber Yale University
Austin Nichols Urban Institute
Philipp Rehm Ohio State University
Mark Schlesinger Yale University
Rob Valletta San Francisco Federal Reserve Bank
Stuart Craig Yale University
26
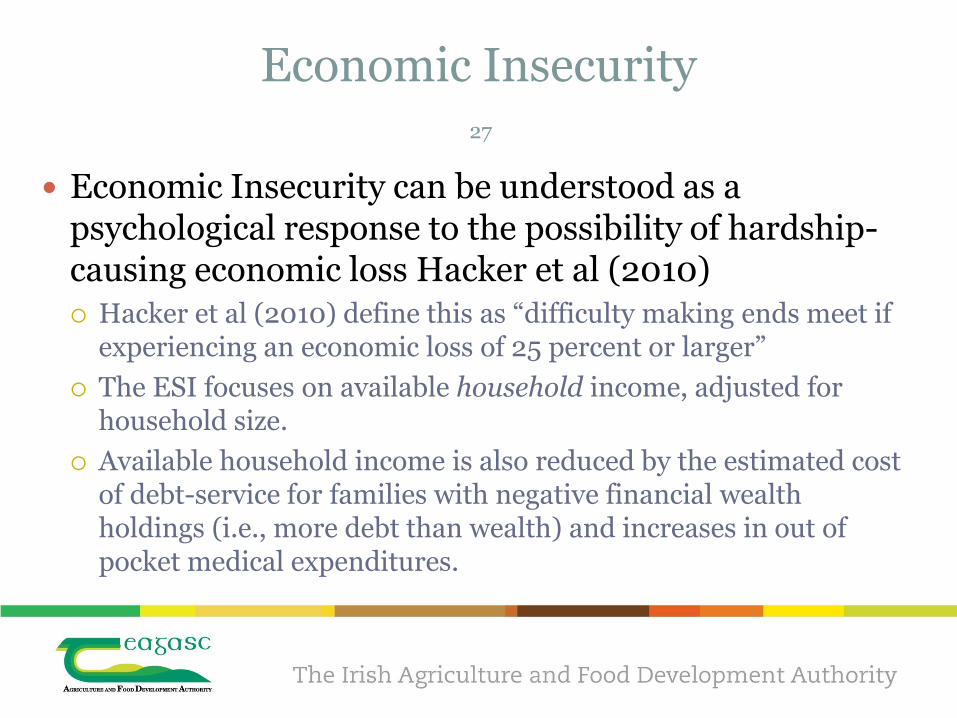
Economic Insecurity
Economic Insecurity can be understood as a psychological response to the possibility of hardship-causing economic loss Hacker et al (2010) Hacker et al (2010) define this as “difficulty making ends meet if
experiencing an economic loss of 25 percent or larger”
The ESI focuses on available household income, adjusted for household size.
Available household income is also reduced by the estimated cost of debt-service for families with negative financial wealth holdings (i.e., more debt than wealth) and increases in out of pocket medical expenditures.
27
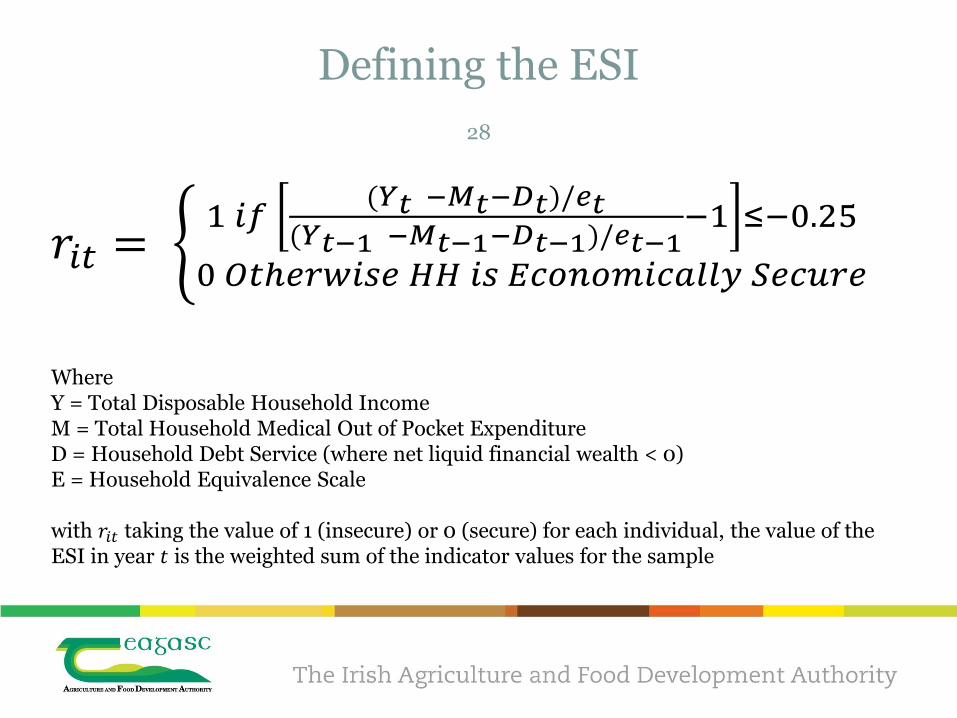
Defining the ESI
𝑟𝑖𝑡 = 1 𝑖𝑓
(𝑌𝑡 −𝑀𝑡−𝐷𝑡)/𝑒𝑡(𝑌𝑡−1 −𝑀𝑡−1−𝐷𝑡−1)/𝑒𝑡−1
−1 ≤−0.25
0 𝑂𝑡ℎ𝑒𝑟𝑤𝑖𝑠𝑒 𝐻𝐻 𝑖𝑠 𝐸𝑐𝑜𝑛𝑜𝑚𝑖𝑐𝑎𝑙𝑙𝑦 𝑆𝑒𝑐𝑢𝑟𝑒
Where Y = Total Disposable Household Income M = Total Household Medical Out of Pocket Expenditure D = Household Debt Service (where net liquid financial wealth < 0) E = Household Equivalence Scale with 𝑟𝑖𝑡 taking the value of 1 (insecure) or 0 (secure) for each individual, the value of the ESI in year 𝑡 is the weighted sum of the indicator values for the sample
28
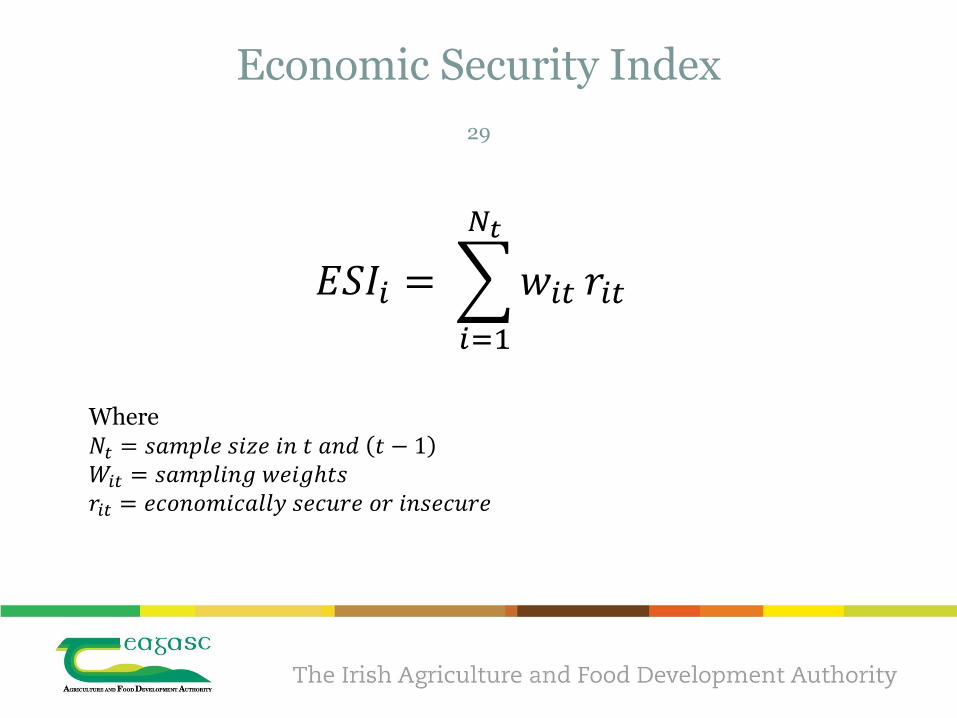
Economic Security Index
𝐸𝑆𝐼𝑖 = 𝑤𝑖𝑡
𝑁𝑡
𝑖=1
𝑟𝑖𝑡
Where 𝑁𝑡 = 𝑠𝑎𝑚𝑝𝑙𝑒 𝑠𝑖𝑧𝑒 𝑖𝑛 𝑡 𝑎𝑛𝑑 𝑡 − 1 𝑊𝑖𝑡 = 𝑠𝑎𝑚𝑝𝑙𝑖𝑛𝑔 𝑤𝑒𝑖𝑔ℎ𝑡𝑠 𝑟𝑖𝑡 = 𝑒𝑐𝑜𝑛𝑜𝑚𝑖𝑐𝑎𝑙𝑙𝑦 𝑠𝑒𝑐𝑢𝑟𝑒 𝑜𝑟 𝑖𝑛𝑠𝑒𝑐𝑢𝑟𝑒
29
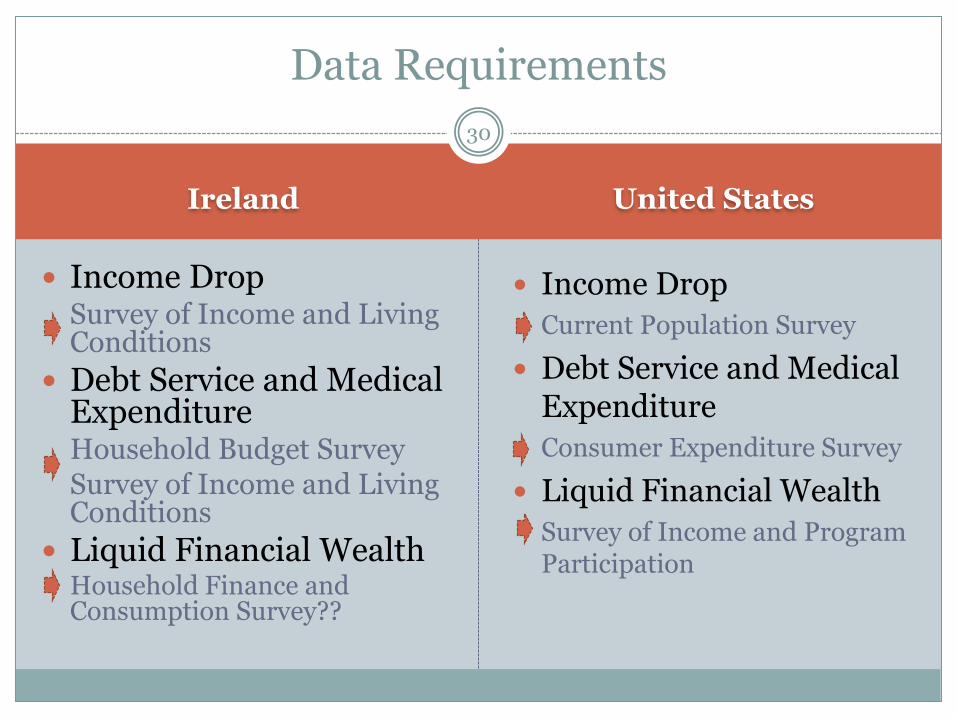
Ireland United States
Income Drop Survey of Income and Living Conditions
Debt Service and Medical Expenditure Household Budget Survey Survey of Income and Living Conditions
Liquid Financial Wealth Household Finance and Consumption Survey??
Income Drop
Current Population Survey
Debt Service and Medical Expenditure
Consumer Expenditure Survey
Liquid Financial Wealth
Survey of Income and Program Participation
Data Requirements
30
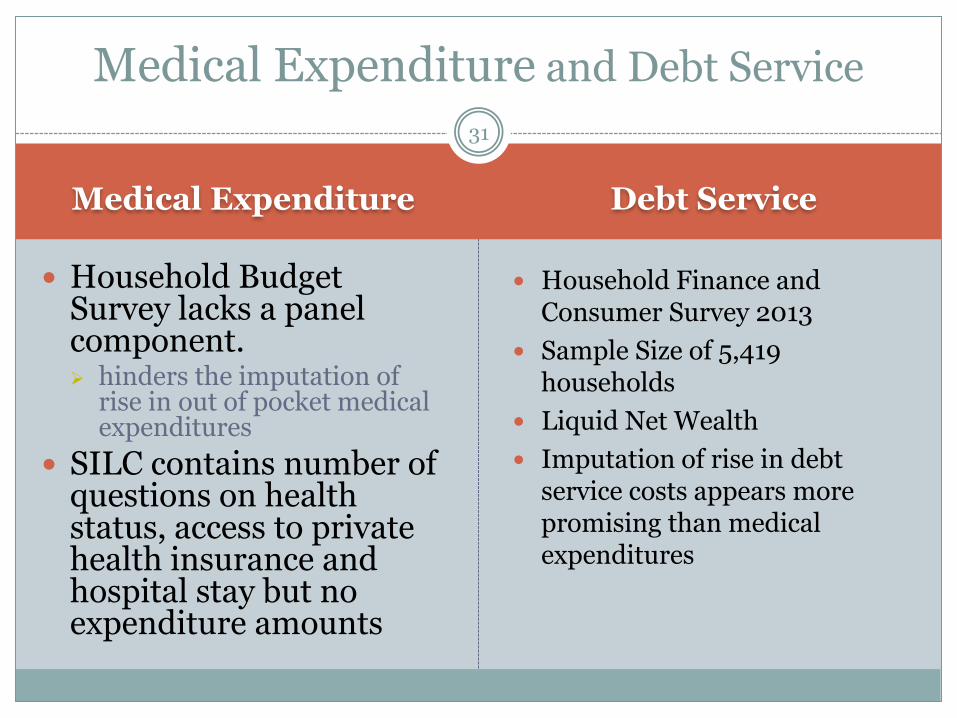
Medical Expenditure Debt Service
Household Budget Survey lacks a panel component. hinders the imputation of
rise in out of pocket medical expenditures
SILC contains number of questions on health status, access to private health insurance and hospital stay but no expenditure amounts
Household Finance and Consumer Survey 2013
Sample Size of 5,419 households
Liquid Net Wealth
Imputation of rise in debt service costs appears more promising than medical expenditures
31
Medical Expenditure and Debt Service
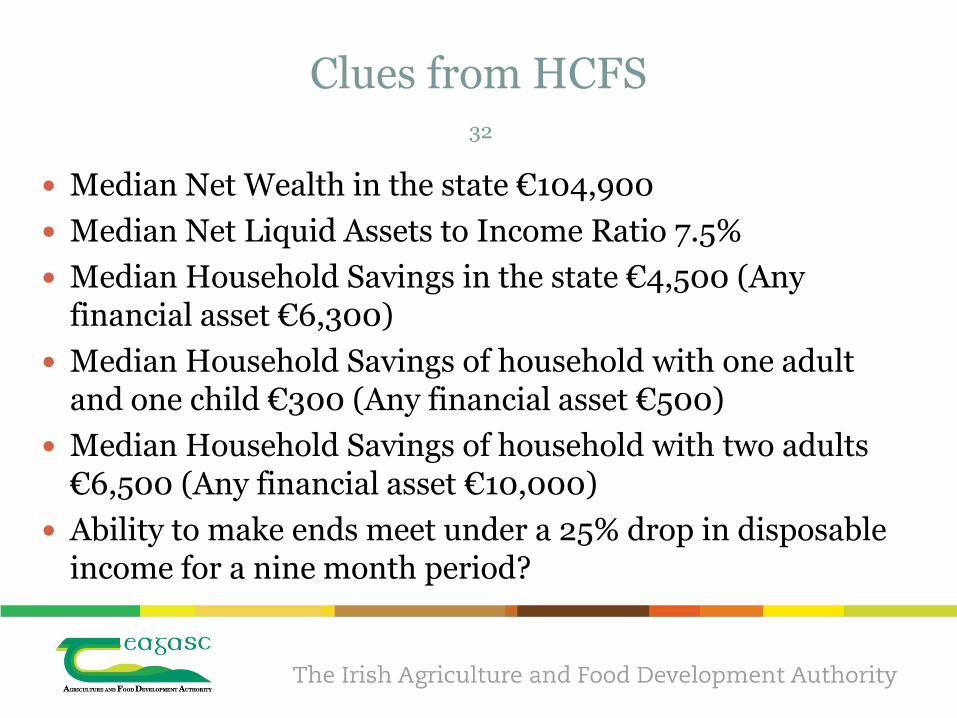
Clues from HCFS 32
Median Net Wealth in the state €104,900
Median Net Liquid Assets to Income Ratio 7.5%
Median Household Savings in the state €4,500 (Any financial asset €6,300)
Median Household Savings of household with one adult and one child €300 (Any financial asset €500)
Median Household Savings of household with two adults €6,500 (Any financial asset €10,000)
Ability to make ends meet under a 25% drop in disposable income for a nine month period?
Concluding Remarks
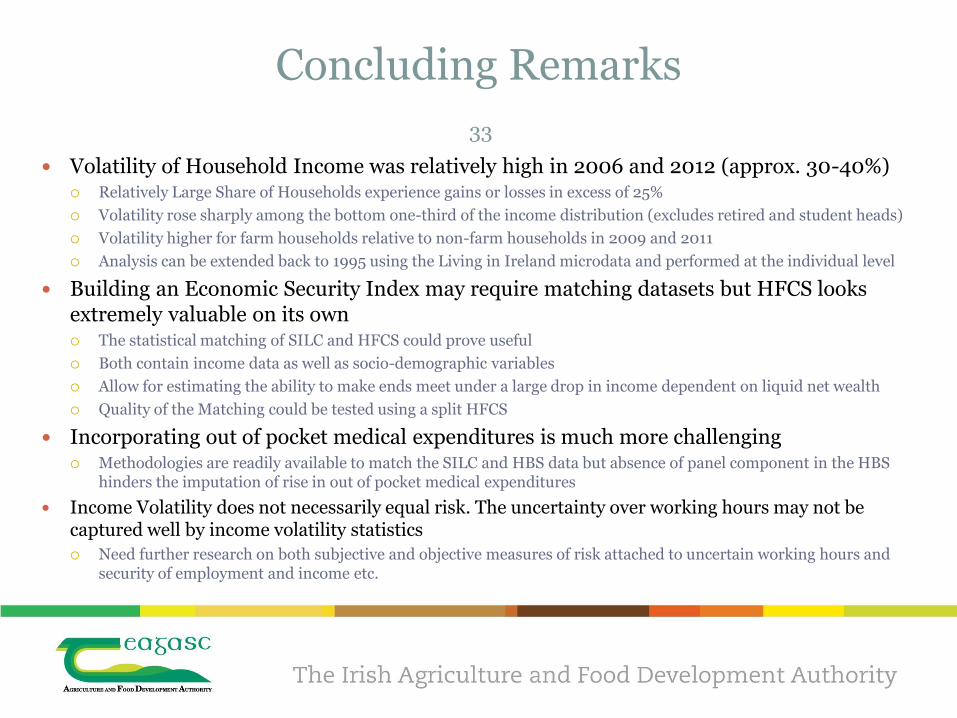
Volatility of Household Income was relatively high in 2006 and 2012 (approx. 30-40%) Relatively Large Share of Households experience gains or losses in excess of 25%
Volatility rose sharply among the bottom one-third of the income distribution (excludes retired and student heads)
Volatility higher for farm households relative to non-farm households in 2009 and 2011
Analysis can be extended back to 1995 using the Living in Ireland microdata and performed at the individual level
Building an Economic Security Index may require matching datasets but HFCS looks extremely valuable on its own The statistical matching of SILC and HFCS could prove useful
Both contain income data as well as socio-demographic variables
Allow for estimating the ability to make ends meet under a large drop in income dependent on liquid net wealth
Quality of the Matching could be tested using a split HFCS
Incorporating out of pocket medical expenditures is much more challenging Methodologies are readily available to match the SILC and HBS data but absence of panel component in the HBS
hinders the imputation of rise in out of pocket medical expenditures
Income Volatility does not necessarily equal risk. The uncertainty over working hours may not be captured well by income volatility statistics
Need further research on both subjective and objective measures of risk attached to uncertain working hours and security of employment and income etc.
33

THA NK YOU FOR LISTENING
COMMENTS A ND QUESTIONS A RE VERY WELCOME
34
References
Cappellari, L., & Jenkins, S. P. (2014). Earnings and labour market volatility in Britain, with a transatlantic comparison. Labour Economics, 30, 201-211.
Conefrey, T., McCarthy, Y., & Sherman, M. (2013). Re-employment Probabilities for Unemployed Workers in Ireland (No. 06/EL/13). Central Bank of Ireland.
Dynan, K., Elmendorf, D., & Sichel, D. (2012). The evolution of household income volatility. The BE Journal of Economic Analysis & Policy, 12(2).
Gottschalk, P., & Spolaore, E. (2002). On the evaluation of economic mobility. The Review of Economic Studies, 69(1), 191-208.
Hardaker, J. B., Huirne, R. B., Anderson, J. R., & Lien, G. (2004). Coping with risk in agriculture (No. Ed. 2). CABI publishing.
Lawless, M., Lydon, R., & McIndoe-Calder, T. (2015). The Financial Position of Irish Households. Quarterly Bulletin Articles, 66-89.
Modena, F., Rondinelli, C., & Sabatini, F. (2014). Economic insecurity and fertility intentions: the case of Italy. Review of Income and Wealth, 60(S1), S233-S255.
Mühlau, P. (2014). Middle Class Squeeze? Social Class and Perceived Financial Hardship in Ireland, 2002-2012. The Economic and Social Review, 45(4, Winter), 485-509.
35
Appendix
36
Disposable income The components of disposable household income are gross household income less: Employer’s social insurance contributions Regular inter‐household cash transfer paid Tax on income and social insurance contributions Tax deducted at source from individual private pension plans
Gross income The components of gross household income are: Direct Income: Employee income Gross employee cash or near cash income Gross non‐cash employee income Employer’s social insurance contributions Gross cash benefits or losses from self‐employment Other direct income: Value of goods produced for own consumption Pension from individual private plans Income from rental of property or land Regular inter‐household cash transfers received Interests, dividends, profit from capital investments in unincorporated business Income received by people aged under 16
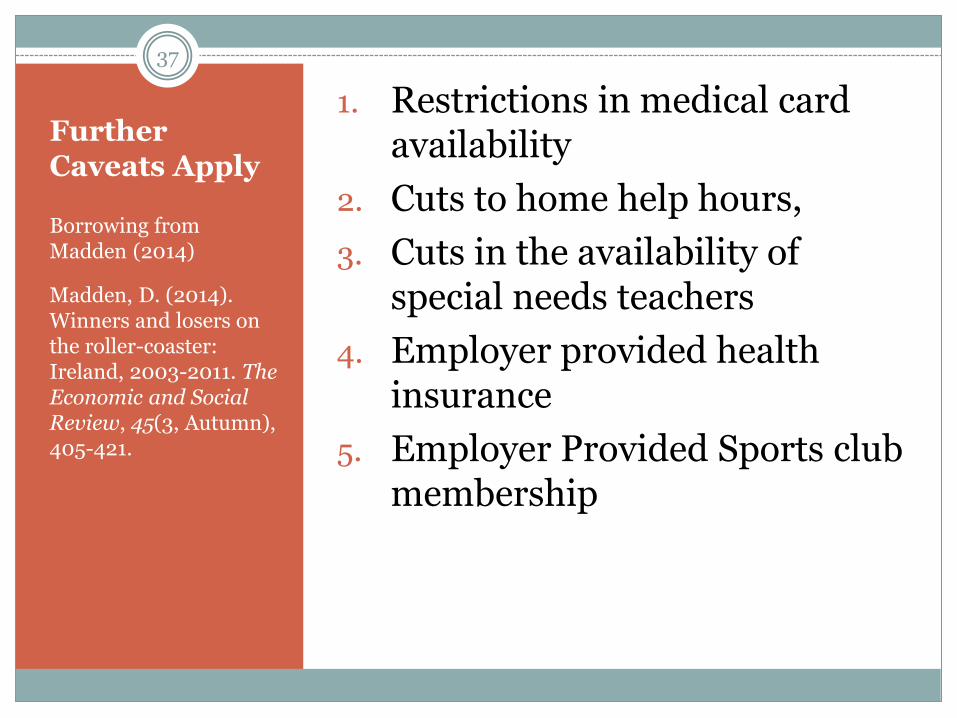
Further Caveats Apply
Borrowing from Madden (2014)
Madden, D. (2014). Winners and losers on the roller-coaster: Ireland, 2003-2011. The Economic and Social Review, 45(3, Autumn), 405-421.
1. Restrictions in medical card availability
2. Cuts to home help hours,
3. Cuts in the availability of special needs teachers
4. Employer provided health insurance
5. Employer Provided Sports club membership
37