Embed Size (px)
Citation preview
Bank Watch
May 2015
www.mercercapital.com
Community Bank Focus: How
to Combat the Margin Blues? 1
Mississippi Merging 4
Resources for Depository Institutions 6
Public Market Indicators 7
M&A Market Indicators 8
Regional Public
Bank Peer Reports 9
About Mercer Capital 10

© 2015 Mercer Capital // Data provided by SNL Financial 1
Bank Watch
May 2015
Community Bank Focus How to Combat the Margin Blues?
Following the Great Recession, significant attention has been focused on bank earnings and earning
power. While community bank returns on equity (ROE) have improved since the depths of the recession,
they are still below pre-recession levels. One factor squeezing revenue is falling net interest margins (i.e.,
the difference between rates earned on loans and securities, and rates paid to depositors). Community
banks are more margin dependent than their larger brethren and have been impacted to a greater extent
from this declining NIM trend. As detailed in Figure 1 below, NIMs for community banks (defined to be
those with assets between $100 million and $5 billion) have steadily declined and were at their lowest
point in the last ten years in early 2015.
While there are a number of factors that impact NIMs, the primary culprit for the declining trend is the
interest rate environment. As the Federal Reserve’s zero-interest rate policy (“ZIRP”) grinds on, earning
2.75%
3.00%
3.25%
3.50%
3.75%
4.00%
4.25%
0.00%
1.00%
2.00%
3.00%
4.00%
5.00%
6.00%
2005 2006 2007 2008 2009 2010 2011 2012 2013 2014 3/2015 YTD
Med
ian
Net
Inte
rest
Mar
gin
Aver
age
10YR
UST
Average 10YR UST Median Net Interest Margin
Source: Mercer Capital Research and SNL Fin'l LC * 3/2015 represents annualized YTD figure
Figure 1: Net Interest Income Trends

© 2015 Mercer Capital // Data provided by SNL Financial 2
Mercer Capital’s Bank Watch May 2015
asset yields continue to reprice lower while deposit costs reached a floor several quarters ago.
Loan growth has also been challenging for many banks for a variety of reasons, which has
stoked competitive pressures and negatively impacted lending margins. While competitive
pressures can come in many forms, several data-points indicate intense loan competition
giving way to easing terms. For example, the April 2015 Senior Loan Officer Opinion Survey on
Bank Lending Practices noted continued easing on terms in a number of loan segments.1 This
appears to be supported further by reported community bank loan yields, which have slid close
to 200 basis points (in all loan segments analyzed) since 2008 as shown in Figure 2.
Aside from paying tribute to the late B.B. King and playing “Everyday, everyday I have the
blues”, what can community bankers do in order to combat the margin blues? While not all-
encompassing, below we have listed a few strategic options to consider:
» Increase Leverage. One strategic consideration to maintain ROE in light
of declining NIMs may be to increase leverage subject to regulatory limits.
Some potential ways to deploy available capital include growing loans
organically, M&A, stock buybacks, and/or shareholder dividends. For those
below $1 billion in assets, recent legislation has relaxed holding company
capital requirements by exempting them from the consolidated regulatory
capital ratios.2 For those that are capable, small bank holding companies
may choose to upstream excess capital to the holding company from bank
dividends or lever the holding company to fund special dividends and/or
buybacks. This higher leverage strategy may be viewed as too aggressive
by some shareholders and investors though.
» Consider M&A. An investor at a recent community bank conference noted
that he would rather see banks sell than head down lending’s slippery slope.3
This is not surprising to hear because competitive lending pressures usually
seed tomorrow’s problem assets. M&A represents a classic solution to revenue
headwinds in a mature industry whereby less profitable smaller companies
sell to the larger ones creating economies of scale and enhanced profitability.
Some signs of this can be seen in recent periods as deal activity has picked up.
Beyond expense synergies, acquirers may see temporary NIM relief resulting
from accretion income on the acquired assets, which are marked to fair value
at acquisition. For those community banks below $1 billion in assets, the
combination of the relaxed capital requirements for their holding companies
and more options for holding company debt may attract some to consider M&A
as a strategic option.
» Acquire/Partner with Non-Financials. Another strategic option may be to
expand into non-traditional bank business lines that are less capital intensive
and offer prospects for non-interest income growth such as acquisitions or
partnerships with insurance, wealth management, specialty finance, and/or
financial technology companies. We have spoken on acquiring non-financials
in different venues and there is some evidence of increased activity in the
sector. For example, a recent article noted a growing trend in acquisitions of
insurance brokers or agencies by banks and thrifts, with deal volume on pace
to significantly exceed 2014.4 Another interesting example of this strategy
being deployed includes the recent partnership announced between Lending
Club and BancAlliance that allows over 200 community banks to access the
peer-to-peer lending space.
0.00%
1.00%
2.00%
3.00%
4.00%
5.00%
6.00%
7.00%
8.00%
9.00%
2008 2009 2010 2011 2012 2013 2014 3/2015 YTD
Med
ian
Loan
Yie
ld
Comm'l & Ind'l Real Estate Consumer * 3/2015 represents annualized YTD figure Source: Mercer Capital Research and SNL Fin'l LC
Figure 2: Loan Yield Trends
© 2015 Mercer Capital // Data provided by SNL Financial 3
Mercer Capital’s Bank Watch May 2015
» Improve Efficiency by Leveraging Financial Technology. While compliance
and regulatory costs continue to rise as NIMs decline, the industry faces intense
pressure to improve efficiency. Technology is an opportunity to do so as both
commercial and consumer customers become more comfortable with mobile
and online banking. Thus, many banks may view the margin blues as a catalyst
to consolidate and/or modernize their branch network and/or invest in improved
technology offerings to reduce longer-term operating costs and still meet or
exceed customer expectations.5
» Maintain the Status Quo. Experience may lead bankers to wait on the Fed
to act and usher a return to “normal” yields and “normal” NIMs. Banks with
a healthy amount of variable rate loans and non-interest bearing deposits
will see an immediate bump in revenue if short-term rates rise, while most
traditional banks eventually will see a reversal in NIM trends. But as has been
enumerated in past Bank Watch articles, rates have been expected to rise for
a “considerable time”, and yet continue to remain at historic lows.6 Further, the
potential negative impact of rising rates on credit quality is difficult to foretell.
Yet, even this status quo strategy may present some opportunities for those
bankers to employ certain of the other strategies mentioned previously in
small doses.
Mercer Capital has a long history of working with banks and helping to solve complex problems
ranging from valuation issues to considering different strategic options. If you would like to
discuss your bank’s unique situation in confidence and ways that your bank may consider
addressing the margin blues, feel free to give us a call or email.
Jay D. Wilson, Jr., CFA, ASA, CBA
901.322.9725
Atticus L. Frank
1 See the summary of The April 2015 Senior Loan Officer Opinion Survey on Bank Lending Practices prepared by John Driscoll of the Board of Governors of the Federal Reserve System http://www.cbinsight.com/press-release/senior-loan-officer-opinion-survey-on-bank-lending-practices-2.
2 For additional information, see http://www.bankdirector.com/issues/regulation/congress-makes-capital-requirements-easier-for-small-banks/.
3 See Katie Darden’s article on SNL Financial entitled “Bank investor sees M&A as path away from lending ‘slippery slope’” article (subscription required).
4 See article on SNL Financial entitled “Some banks expanding insurance brokerage presence”.5 For those interested in additional information on Financial Technology trends, check out our latest FinTech Industry
newsletter at http://mercercapital.com/assets/Mercer-Capital-FinTech-2015-Q1.pdf.6 See the article “Waiting on Margin Relief” at http://mercercapital.com/article/waiting-margin-relief/.
© 2015 Mercer Capital // Data provided by SNL Financial 4
Mercer Capital’s Bank Watch May 2015
Mississippi MergingJeff K. Davis, CFA, Managing Director of Mercer Capital’s Financial Institutions Group, is a
regular editorial contributor to SNL Financial. This contribution was originally published April
28, 2015, at SNL Financial. It is reprinted here with permission. The views expressed are Jeff’s
and do not necessarily represent the views of SNL or Mercer Capital.
A year ago I penned a post about Hancock Holding Co. and the role I believe inflated Street
expectations played in what has been a woeful share performance for a well-run bank since the
merger with Whitney Holding Corp. was announced. When the transaction was announced on
December 22, 2010, the slide deck included pro forma GAAP operating EPS of $2.59 for 2012
and $3.10 for 2013. Hancock’s earnings have not been remotely close to that level on a reported,
operating or core basis. In fairness to the company, the numbers were based upon the Street’s
optimistic stand-alone estimates for Hancock and Whitney and the projected expense savings.
This has not been a great year either with the shares down 5.8% through April 24; however, the
shares may be bottoming now that the Street seems to have figured out the limited life impact of
purchase accounting accretion — a non-cash item that would not be counted in any other industry.
Hancock reported Q1’15 operating EPS of 55 cents, core EPS of 49 cents (operating EPS less
purchase accounting adjustments) and GAAP EPS of 49 cents. Management indicated in the
release that the issue will be rendered moot because core and operating results will be “essentially
the same in the second half of 2015.”
CFO Mike Achary noted that Hancock’s current modeling indicates 2016 core net income, which
excludes purchase accounting accretion, is tracking toward 25% over 2014 core net income of $1.90
per share (vs. $2.10 per share as reported). As of April 24 the 2016 consensus was $2.49 per share
compared to $2.38 per share as implied by the comment. That is close enough, but stocks with rising
EPS estimates or low multiple stocks with a catalyst are typically shares with better than average
upside potential. In any event, it seems what has been nearly five years of a wide gap between the
Street’s forward expectations and reported EPS that could have been papered over by Fed rate
hikes given a very asset sensitive balance sheet is coming to an end.
Instead of the accretion calculus, what got my attention during the call was management’s comments
about its preference to use capital for M&A over buybacks beyond that which is absorbed by organic
loan growth and the dividend. If the current earnings run rate is about $2.00 per share then it is hard
to argue the shares are a great bargain at 14x for repurchases. Conversely, I agree with Achary that
smallish deals in which the target has $1 billion to $3 billion of assets may be a good use of capital to
leverage the infrastructure and boost earnings — provided Hancock does not overpay — because
execution risk should be modest for small deals.
One does not have to use too much imagination regarding what banks fit that bill in and around a
franchise that is concentrated along the I-10 corridor in Mississippi, Louisiana, Florida, Alabama and
Texas. There are not that many banks in the $1 billion to $3 billion range. During the past year I have
heard increased talk among Mississippi bankers about a possible deal with Trustmark Corp. Investor
support for another quasi-MOE involving Hancock (its market cap as of April 24 was $2.4 billion vs.
$1.6 billion for Trustmark) probably would be nil.
Although its year-end asset base of $5.8 billion is outside the targeted range, I wonder about
Tupelo, Miss.-based Renasant Corp. The company has outperformed its Mississippi peers since
the financial crisis occurred by producing good returns, executing a series of accretive acquisitions
and having avoided cutting the dividend or raising common equity to rebuild capital (a 2010 raise
occurred in conjunction with the acquisition of a failed bank). Renasant’s shares have produced a
five-year total return of 114% through April 24 compared to 7% for Trustmark, 17% for BancorpSouth
Inc. and negative 21% for Hancock. Louisiana-based IBERIABANK Corp.’s five-year total return was
12%, while the respective total returns for SNL’s Small Cap and Mid Cap U.S. Bank indices were
What We’re Reading
John Driscoll of the Board of Governors of the Federal Reserve System provides an interesting
summary of the April 2015 Senior Loan Officer Opinion Survey on Bank Lending Practices.
http://mer.cr/1EXuTqO
Katie Darden discusses the trend whereby banks have been acquiring insurance agencies in
“Some Banks Expanding Insurance Brokerage Presence” on SNL Financial (subscription required).
http://mer.cr/1GjxUGv

© 2015 Mercer Capital // Data provided by SNL Financial 5
Mercer Capital’s Bank Watch May 2015
49% and 32%. The market’s bloodless verdict is that Renasant clobbered its regional competition.
Aside from avoiding unmanageable credit issues, Renasant’s outperformance is partially attributable
to its highly EPS accretive acquisition of First M&F Corp. that helped push its shares up 54% in 2013.
Whether Renasant’s pending acquisition for Georgia-based Heritage Financial Group Inc. will be
as successful remains to be seen. It is a market extension transaction rather than what was largely
an in-market deal for First M&F. The investor slide deck notes that “double digit EPS accretion (is)
projected in 2016” and “tangible book value dilution is expected to be earned back in less than two
years.” The 2015 and 2016 consensus estimates for Renasant are $2.10 per share and $2.43 per
share, compared to $1.88 per share reported in 2014.
It may seem odd that I bring up Renasant because it is outwardly an unlikely candidate to merge
with Trustmark, Hancock, IBERIABANK or any other bank given the outperformance of its shares,
improving profitability and good strategic position. The first bullet in a recent presentation says as
much: “focus on highly-accretive acquisition opportunities.”
However, there are reasons to view a merger as possible too. Like every other bank, the company
faces earnings pressure. The net interest margin was 4.12% in 2014 according to SNL. Declining
accretion from past acquisitions and intense pressure on loan yields ensure, I think, the NIM in time
will drift much lower even though some of the company’s lending markets such as Mississippi may
provide better pricing vis-à-vis such markets as Nashville. Trustmark’s NIM was 3.86% in Q4’14 as
reported and 3.54% excluding purchase accounting adjustments.
Also, if Renasant CEO Robin McGraw, who is 68, does not have a successor that the board fully
supports then merging with Trustmark, Hancock, IBERIABANK or another bank could address
the issue. Finally, Renasant has an attractive footprint that offers both overlap where cost saves
could be sizable and, depending upon the partner, market extensions into Alabama, Nashville, east
Tennessee, Georgia and Florida.
If Renasant were to partner with another bank, it would be from a position of strength unlike the
weakened Whitney that was pushed into seeking a combination with Hancock by IBERIABANK.
Maybe a transaction would be too much for institutional investors who have suffered as Hancock
owners. Renasant is still a small cap company by market cap conventions, but its pro forma market
cap of about $1.2 billion inclusive of Heritage is material in relation to Trustmark ($1.6 billion),
Hancock ($2.2 billion) and IBERIABANK ($2.4 billion).
Farfetched or not, Mississippi is comparable to Alabama a decade ago when a combination of rich
acquisition pricing, the ability to obtain synergies, succession issues, and desirable footprints led to
the acquisition of AmSouth Bancorp., Alabama National Bancorp., Compass Bancshares Inc., and
SouthTrust Corp. No doubt the management of Colonial BancGroup Inc. wishes they were part of
that list too. Beyond having what I believe is a correct thesis that loan yields and NIMs are headed
much lower than the Street envisions, I may have Mississippi backwards. Maybe it is Renasant that
will be the lead in consolidating the state.
Jeff K. Davis, CFA
615.345.0350

© 2015 Mercer Capital // Data provided by SNL Financial 6
Mercer Capital’s Bank Watch May 2015
The Financial Institutions Group of Mercer Capital works with hundreds of depository institutions and other financial institutions annually providing a broad range of specialized resources for the financial services industry.
An Overview of the Leveraged Lending Market and Bank Participation in the Market
There has been a flurry of media reports this year that regulators—especially the OCC—are intensifying scrutiny of leveraged lending. In this webinar we took a look at one of the fastest growing markets that has emerged post crisis.
View webinar on SNL Financial’s site at http://mer.cr/VRc9JV
Understanding Deal Considerations
Key issues that we see when banks combine as it relates to valuing and evaluating a combination are reviewed. This is particularly critical when the consideration consists of shares issued by a buyer (or senior merger partner) whose shares are either privately held or are thinly traded.
View replay at http://mer.cr/bnkweb2
Basel III Capital Rules Finally Final: What Does It Mean for Community Banks?
Finalized at last, the regulations provide direction for bank capital management decisions. This webinar, co-sponsored by Mercer Capital and Jones Day, reviews the final rules and assesses their impact on community banks.
View replay at http://mer.cr/capital-rules-webinar
An Introduction toBusiness Development Companies In the hunt for yield, investors are increasingly setting their sights on business development companies (BDCs), which offer public equity investors access to portfolios of private equity investments. This webinar explored the features that have contributed to the growth in BDCs, underlying asset classes to which BDCs offer investors exposure, and highlighted the key performance metrics for evaluating BDCs. Our panel discussed relevant regulatory developments affecting BDCs, reviewed the portfolio valuation procedures and assumptions that influence quarterly profits, and explored the relative performance of key market benchmarks.
View webinar on SNL Financial’s site at http://mer.cr/ZnauO7 Complimentary Download of Slides at http://mer.cr/1tuwzaI
Webinars Available for Replay
Newest Webinar
Sponsored by SNL Financial
Presenters from Mercer Capital and
Sutherland Asbill & Brennan
Mercer Capital’sResources for Depository Institutions

© 2015 Mercer Capital // Data provided by SNL Financial 7
Median Valuation Multiples
Mercer Capital’s Bank Group Index Overview Return Stratification of U.S. Banks
by Asset Size
Median Total Return Median Valuation Multiples as of April 30, 2015
Indices Month-to-Date Year-to-Date Last 12 MonthsPrice/
LTM EPSPrice / 2015
(E) EPSPrice / 2016 (E)
EPSPrice /
Book ValuePrice / Tangible
Book ValueDividend
Yield
Atlantic Coast Index -1.95% -0.62% 10.94% 15.33 15.63 13.01 102.3% 112.5% 2.1%
Midwest Index 0.60% 0.19% 10.67% 13.86 13.84 12.75 109.6% 121.6% 2.4%
Northeast Index -0.64% -0.98% 7.53% 14.68 14.55 12.51 113.6% 130.6% 3.0%
Southeast Index -1.55% -0.04% 17.99% 12.41 14.03 13.05 104.2% 113.6% 1.7%
West Index -1.91% -1.02% 9.35% 15.42 15.02 13.10 117.2% 127.9% 2.5%
Community Bank Index -1.15% -0.61% 10.31% 14.68 14.75 12.94 110.3% 121.2% 2.4%
SNL Bank Index 2.23% -0.60% 11.92%
Assets $250 - $500M
Assets $500M -
$1B
Assets $1 - $5B
Assets $5 - $10B
Assets > $10B
Month-to-Date 1.93% 0.51% -1.13% -0.02% 2.44% Year-to-Date 4.65% 2.86% -1.34% 0.35% -0.63% Last 12 Months 9.29% 9.57% 7.84% 12.02% 12.07%
-10%
0%
10%
20%
As
of A
pril
30, 2
015
80 !
85 !
90 !
95 !
100 !
105 !
110 !
115 !
120 !
Apr
il 30
, 201
4 =
100!
MCM Index - Community Banks! SNL Bank! S&P 500!
Mercer Capital’s Public Market Indicators May 2015
© 2015 Mercer Capital // Data provided by SNL Financial 8
2004 2005 2006 2007 2008 2009 2010 2011 2012 2013 2014 LTM U.S. 18.3% 19.9% 19.9% 18.7% 12.0% 6.9% 6.3% 5.4% 4.3% 5.5% 7.5% 7.8%
0%
5%
10%
15%
20%
25%
Cor
e D
epos
it P
rem
ium
s
2004 2005 2006 2007 2008 2009 2010 2011 2012 2013 2014 LTM U.S. 246% 243% 243% 228% 196% 145% 141% 132% 130% 134% 155% 157%
0%
50%
100%
150%
200%
250%
300%
350%
Pric
e / T
angi
ble
Boo
k Va
lue
2004 2005 2006 2007 2008 2009 2010 2011 2012 2013 2014 LTM U.S. 22.3 22.0 22.0 22.1 19.9 19.3 21.7 21.9 17.0 16.5 17.5 18.6
0
5
10
15
20
25
30
Pric
e / L
ast 1
2 M
onth
s E
arni
ngs
Regions
Price / LTM
Earnings
Price / Tang.
BV
Price / Core Dep Premium
No. of
Deals
Median Deal
Value
Target’s Median Assets
Target’s Median
LTM ROAE (%)
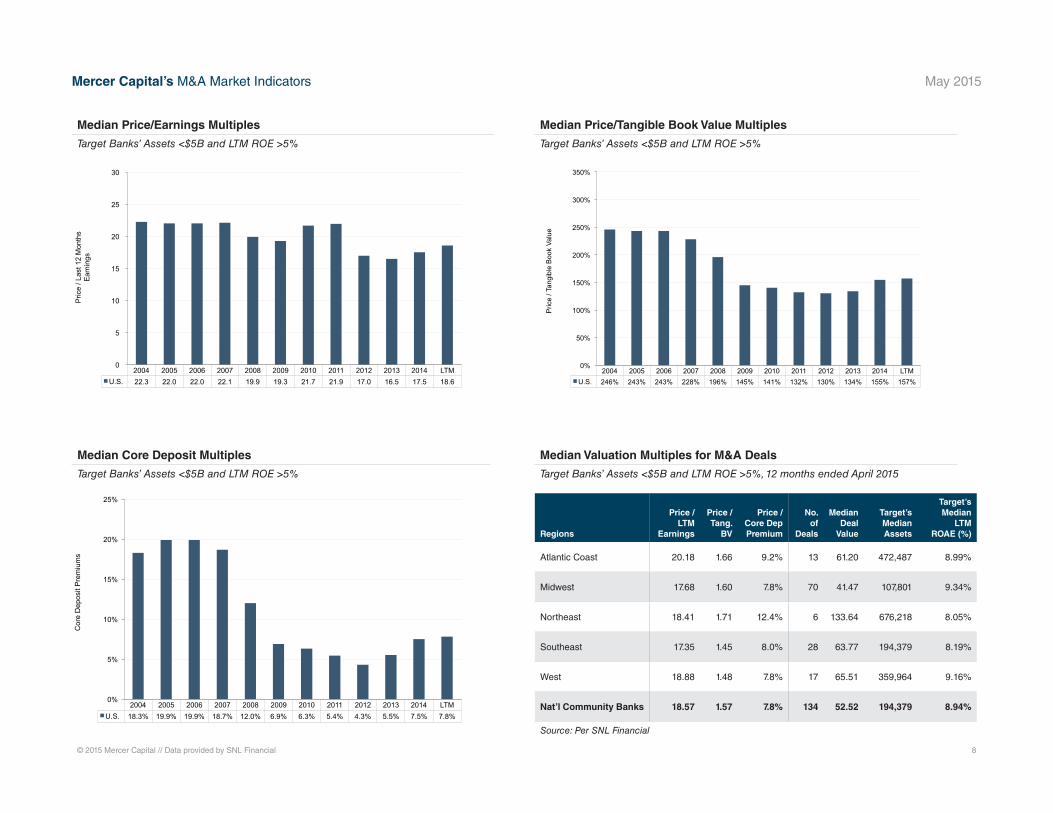
Atlantic Coast 20.18 1.66 9.2% 13 61.20 472,487 8.99%
Midwest 17.68 1.60 7.8% 70 41.47 107,801 9.34%
Northeast 18.41 1.71 12.4% 6 133.64 676,218 8.05%
Southeast 17.35 1.45 8.0% 28 63.77 194,379 8.19%
West 18.88 1.48 7.8% 17 65.51 359,964 9.16%
Nat’l Community Banks 18.57 1.57 7.8% 134 52.52 194,379 8.94%
Source: Per SNL Financial
Median Valuation Multiples for M&A Deals
Target Banks’ Assets <$5B and LTM ROE >5%, 12 months ended April 2015
Median Core Deposit Multiples
Target Banks’ Assets <$5B and LTM ROE >5%
Median Price/Tangible Book Value Multiples
Target Banks’ Assets <$5B and LTM ROE >5%
Median Price/Earnings Multiples
Target Banks’ Assets <$5B and LTM ROE >5%
Mercer Capital’s M&A Market Indicators May 2015

Updated weekly, Mercer Capital’s Regional Public Bank Peer Reports offer a closer look at the market pricing and performance of publicly traded banks in the states of five U.S. regions. Click on the map to view the reports from the representative region.
© 2015 Mercer Capital // Data provided by SNL Financial 9
Atlantic Coast Midwest Northeast
Southeast West
Mercer Capital’s Regional Public Bank Peer Reports
Mercer Capital’s Bank Watch May 2015
Mercer Capital assists banks, thrifts, and credit unions with significant corporate valuation requirements, transactional advisory services, and other strategic decisions.
Mercer Capital pairs analytical rigor with industry knowledge to deliver unique insight into issues facing banks. These insights
underpin the valuation analyses that are at the heart of Mercer Capital’s services to depository institutions.
Mercer Capital is a thought-leader among valuation firms in the banking industry. In addition to scores of articles and books, The
ESOP Handbook for Banks (2011), Acquiring a Failed Bank (2010), The Bank Director’s Valuation Handbook (2009), and Valuing
Financial Institutions (1992), Mercer Capital professionals speak at industry and educational conferences.
The Financial Institutions Group of Mercer Capital publishes Bank Watch, a monthly e-mail newsletter covering five U.S. regions.
In addition, Jeff Davis, Managing Director, is a regular contributor to SNL Financial.
For more information about Mercer Capital, visit www.mercercapital.com.
Mercer CapitalFinancial Institutions Services
Jeff K. Davis, [email protected]
Andrew K. Gibbs, CFA, CPA/ABV [email protected]
Jay D. Wilson, Jr., CFA, ASA, CBA [email protected]
Mercer Capital5100 Poplar Avenue, Suite 2600Memphis, Tennessee 38137901.685.2120 (P)
www.mercercapital.com
Contact Us
Copyright © 2015 Mercer Capital Management, Inc. All rights reserved. It is illegal under Federal law to reproduce this publication or any portion of its contents without the publisher’s permission. Media quotations with source attribution are encouraged.
Reporters requesting additional information or editorial comment should contact Barbara Walters Price at 901.685.2120. Mercer Capital’s Industry Focus is published quarterly and does not constitute legal or financial consulting advice. It is offered as an
information service to our clients and friends. Those interested in specific guidance for legal or accounting matters should seek competent professional advice. Inquiries to discuss specific valuation matters are welcomed. To add your name to our mailing list
to receive this complimentary publication, visit our web site at www.mercercapital.com.