Embed Size (px)
Citation preview

Contact details: 00962 7 9767 7418 – [email protected]
FINANCIAL ANALYSIS FOR JORDANIAN PUBLIC SHAREHOLDING COMPANIES
Measuring the Liquidity of Hikma Pharmaceuticals PLC
Quantitative Analysis from 2009 until 2013
Tariq Al-Basha – Financial Analyst
3/13/2015
The purpose and scope of this quantitative analysis is to introduce the subject matter and provide a general idea and information on the said area. All the material included in this document is based on data/information gathered from various sources and is based on certain assumptions. Although, due care and diligence has been taken to compile this document, the contained information may vary due to any change in any of the concerned factors, and the actual results may differ substantially from the presented information.

Measuring the Liquidity of Hikma Pharmaceuticals PLC
Page 2 of 12
Contents Executive Summary ................................................................................................................... 4
Current Ratio .......................................................................................................................... 5
Working Capital (WC) ............................................................................................................. 6
Acid-test or Quick or Liquid Ratio ........................................................................................... 7
Acid-test Ratio ........................................................................................................................ 8
Cash Ratio ............................................................................................................................. 9
Cash Conversion Cycle (CCC) "Cash or Operating Cycle” ....................................................10
Appendix ...................................................................................................................................11
Appendix 1: Summary of Liquidity Ratios ..............................................................................11
Appendix 2: Figures from Balance Sheet & Income Statement ..............................................11
About the Author .......................................................................................................................12

Measuring the Liquidity of Hikma Pharmaceuticals PLC
Page 3 of 12
﴿قالوا سبحانك ل علم لنا إلا ما علامتنا إناك أنت العليم الحكيم﴾
صدق هللا العظيم
23آية –سورة البقرة

Measuring the Liquidity of Hikma Pharmaceuticals PLC
Page 4 of 12
Executive Summary
The purpose of this quantitative analysis is to measure Hikma Pharmaceuticals PLC’s ability to
pay off its short-term debt obligations. Therefore, this quantitative analysis has chosen six
liquidity ratios which are:
1. Current Ratio
2. Working Capital ratio
3. Acid-test or Quick or Liquid Ratio
4. Acid-test Ratio
5. Cash Ratio
6. Cash Conversion Cycle (CCC) "Cash or Operating Cycle"
By and large, Hikma Pharmaceuticals PLC was able to cover, according to the abovementioned
ratios, its short-term debt obligations during the targeted 5 years (2009 – 2013). However, there
was a noticeable decline in the first five ratios, while there was an increase in its cash
conversion cycle. This is could be reason behind the drop in its current ratio, working capital
ratio, acid-test (Quick Ratio) and cash ratio as there might be a change in Hikma
Pharmaceuticals PLC’s credit policy in those targeted five years (2009 – 2013).
It is worth noting that the currency used in this quantitative analysis is the United States Dollar
(USD or $).

Measuring the Liquidity of Hikma Pharmaceuticals PLC
Page 5 of 12
Current Ratio Table 1: Current Ratio for Hikma Pharmaceuticals PLC between 2009 & 2013
Entry 2013 2012 2011 2010 2009
Current Assets 897,000,000 782,000,000 659,885,000 494,115,000 456,598,000
Current Liabilities 586,000,000 467,000,000 390,583,000 268,623,000 204,442,000
Current Ratio 1.53 1.67 1.69 1.84 2.23
Figure 1: Current Ratio for Hikma Pharmaceuticals PLC between 2009 & 2013
It can be seen from Table 1 and Figure 1 that Hikma Pharmaceuticals PLC’s short term assets:
Were readily available to pay off 2.23 times its short-term liabilities in 2009.
Were readily available to pay off 1.84 times its short-term liabilities in 2010.
Were readily available to pay off 1.69 times its short-term liabilities in 2011.
Were readily available to pay off 1.67 times its short-term liabilities in 2012.
Were readily available to pay off 1.53 times its short-term liabilities in 2013.
Therefore, a current ratio of greater than 1 provides additional cushion for Hikma
Pharmaceuticals PLC against unforeseeable contingencies that may arise in the short term.
Thus, Hikma Pharmaceuticals PLC maintained a current ratio of at least 1.53 between 2009 and
2013 in order to ensure that the value of its current assets cover at least the amount of its short
term obligations.
-
0.50
1.00
1.50
2.00
2.50
2013 2012 2011 2010 2009
Current Ratio
Current Ratio
Measuring the Liquidity of Hikma Pharmaceuticals PLC
Page 6 of 12
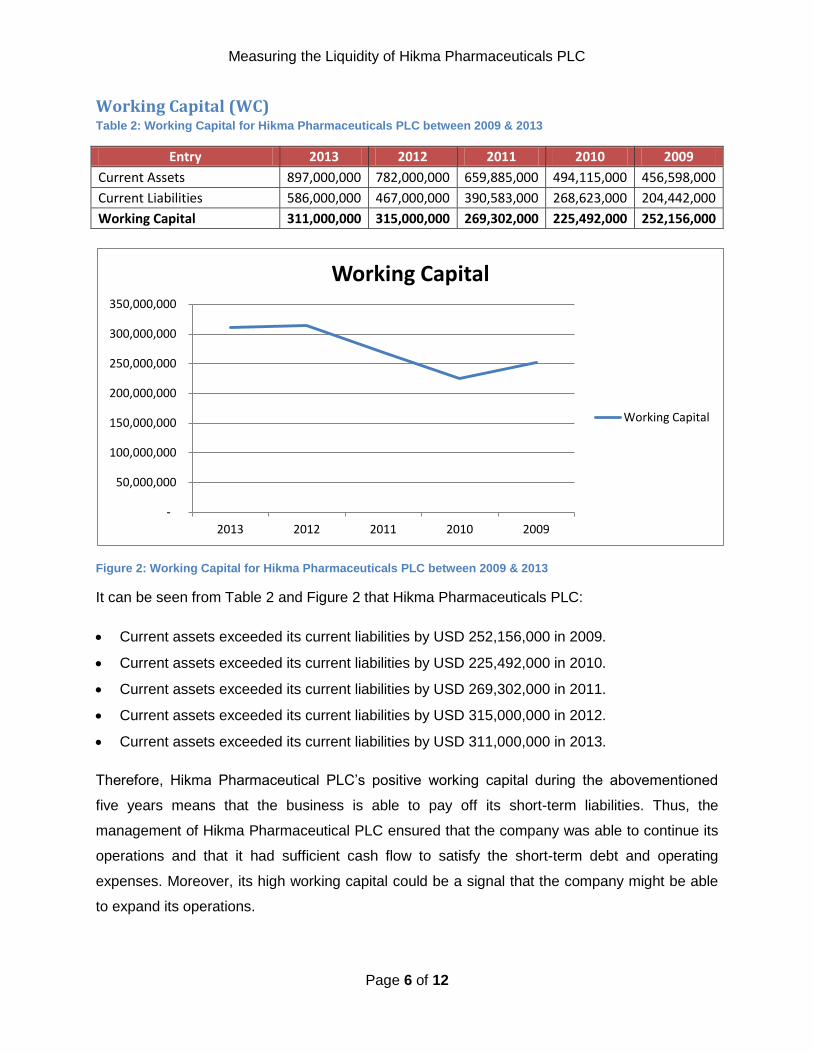
Working Capital (WC) Table 2: Working Capital for Hikma Pharmaceuticals PLC between 2009 & 2013
Entry 2013 2012 2011 2010 2009
Current Assets 897,000,000 782,000,000 659,885,000 494,115,000 456,598,000
Current Liabilities 586,000,000 467,000,000 390,583,000 268,623,000 204,442,000
Working Capital 311,000,000 315,000,000 269,302,000 225,492,000 252,156,000
Figure 2: Working Capital for Hikma Pharmaceuticals PLC between 2009 & 2013
It can be seen from Table 2 and Figure 2 that Hikma Pharmaceuticals PLC:
Current assets exceeded its current liabilities by USD 252,156,000 in 2009.
Current assets exceeded its current liabilities by USD 225,492,000 in 2010.
Current assets exceeded its current liabilities by USD 269,302,000 in 2011.
Current assets exceeded its current liabilities by USD 315,000,000 in 2012.
Current assets exceeded its current liabilities by USD 311,000,000 in 2013.
Therefore, Hikma Pharmaceutical PLC’s positive working capital during the abovementioned
five years means that the business is able to pay off its short-term liabilities. Thus, the
management of Hikma Pharmaceutical PLC ensured that the company was able to continue its
operations and that it had sufficient cash flow to satisfy the short-term debt and operating
expenses. Moreover, its high working capital could be a signal that the company might be able
to expand its operations.
-
50,000,000
100,000,000
150,000,000
200,000,000
250,000,000
300,000,000
350,000,000
2013 2012 2011 2010 2009
Working Capital
Working Capital

Measuring the Liquidity of Hikma Pharmaceuticals PLC
Page 7 of 12
Acid-test or Quick or Liquid Ratio Table 3: Acid-test or Quick or Liquid Ratio for Hikma Pharmaceuticals PLC between 2009 & 2013
Entry 2013 2012 2011 2010 2009
Cash & Cash equivalent 168,000,000 177,000,000 94,715,000 62,718,000 65,633,000
Marketable Securities
Short-term Investments
Accounts Receivable 439,000,000 328,000,000 315,856,000 237,185,000 226,841,000
Current Liabilities 586,000,000 467,000,000 390,583,000 268,623,000 204,442,000
Acid-test or Quick or Liquid Ratio 1.04 1.08 1.05 1.12 1.43
Figure 3: Acid-test or Quick or Liquid Ratio for Hikma Pharmaceuticals PLC between 2009 & 2013
It can be seen from Table 3 and Figure 3 that:
For every dollar of Hikma Pharmaceuticals PLC’s current liabilities, the company had $1.43
of very liquid assets to cover those immediate obligations in 2009.
For every dollar of Hikma Pharmaceuticals PLC’s current liabilities, the company had $1.12
of very liquid assets to cover those immediate obligations in 2010.
For every dollar of Hikma Pharmaceuticals PLC’s current liabilities, the company had $1.05
of very liquid assets to cover those immediate obligations in 2011.
For every dollar of Hikma Pharmaceuticals PLC’s current liabilities, the company had $1.08
of very liquid assets to cover those immediate obligations in 2012.
For every dollar of Hikma Pharmaceuticals PLC’s current liabilities, the company had $1.04
of very liquid assets to cover those immediate obligations in 2013.
However, Hikma Pharmaceuticals PLC’s quick ratio was lower during the abovementioned five
years than the current ratio which means its current assets are highly dependent on inventory.
Nevertheless, inventory is not as rapidly convertible to cash and is often sold on credit.
-
0.20
0.40
0.60
0.80
1.00
1.20
1.40
1.60
2013 2012 2011 2010 2009
Acid-test or Quick or Liquid Ratio
Acid-test or Quick or Liquid Ratio

Measuring the Liquidity of Hikma Pharmaceuticals PLC
Page 8 of 12
Acid-test Ratio Table 4: Acid-test Ratio for Hikma Pharmaceuticals PLC between 2009 & 2013
Entry 2013 2012 2011 2010 2009
Inventory 276,000,000 272,000,000 239,260,000 182,192,000 160,509,000
Pre-paid Expenses
Current Assets 897,000,000 782,000,000 659,885,000 494,115,000 456,598,000
Current Liabilities 586,000,000 467,000,000 390,583,000 268,623,000 204,442,000
Acid-test Ratio 1.06 1.09 1.08 1.16 1.45
Figure 4: Acid-test Ratio for Hikma Pharmaceuticals PLC between 2009 & 2013
It can be seen from Table 4 and Figure 4 that Hikma Pharmaceuticals PLC:
Acid-test Ratio 1.45 which means that could pay off all of its current liabilities with quick
assets and still had some quick assets left over in 2009.
Acid-test Ratio 1.16 which means that could pay off all of its current liabilities with quick
assets and still had some quick assets left over in 2010.
Acid-test Ratio 1.08 which means that could pay off all of its current liabilities with quick
assets and still had some quick assets left over in 2011.
Acid-test Ratio 1.09 which means that could pay off all of its current liabilities with quick
assets and still had some quick assets left over in 2012.
Acid-test Ratio 1.06 which means that could pay off all of its current liabilities with quick
assets and still had some quick assets left over in 2013.
-
0.20
0.40
0.60
0.80
1.00
1.20
1.40
1.60
2013 2012 2011 2010 2009
Acid-test Ratio
Acid-test Ratio

Measuring the Liquidity of Hikma Pharmaceuticals PLC
Page 9 of 12
Cash Ratio Table 5: Cash Ratio for Hikma Pharmaceuticals PLC between 2009 & 2013
Entry 2013 2012 2011 2010 2009
Cash & Cash equivalent 168,000,000 177,000,000 94,715,000 62,718,000 65,633,000
Invested Funds
Current Liabilities 586,000,000 467,000,000 390,583,000 268,623,000 204,442,000
Cash Ratio 0.29 0.38 0.24 0.23 0.32
Figure 5: Cash Ratio for Hikma Pharmaceuticals PLC between 2009 & 2013
It can be seen from Table 5 and Figure 5 that Hikma Pharmaceuticals PLC:
Had enough cash and equivalents to pay off 32 percent of its current liabilities in 2009.
Had enough cash and equivalents to pay off 23 percent of its current liabilities in 2010.
Had enough cash and equivalents to pay off 24 percent of its current liabilities in 2011.
Had enough cash and equivalents to pay off 38 percent of its current liabilities in 2012.
Had enough cash and equivalents to pay off 29 percent of its current liabilities in 2013.
However, the cash ratio is seldom used in financial reporting or by analysts in the fundamental
analysis of a company. It is not realistic for a company to purposefully maintain high levels of
cash assets to cover current liabilities. The reason being that it is often seen as poor asset
utilization for a company to hold large amounts of cash on its balance sheet, as this money
could be returned to shareholders or used elsewhere to generate higher returns.
-
0.05
0.10
0.15
0.20
0.25
0.30
0.35
0.40
2013 2012 2011 2010 2009
Cash Ratio
Cash Ratio

Measuring the Liquidity of Hikma Pharmaceuticals PLC
Page 10 of 12
Cash Conversion Cycle (CCC) "Cash or Operating Cycle” Table 6: Cash Conversion Cycle (CCC) "Cash or Operating Cycle" for Hikma Pharmaceuticals PLC between 2010 & 2013
Entry 2013 2012 2011 2010
Days Inventory Outstanding 166.41 154.22 147.16 167.41
Days Sales Outstanding 183.22 233.14 255.29 236.98
Days Payables Outstanding 58.29 60.25 59.37 58.72
Cash Conversion Cycle (CCC) "Cash or Operating Cycle" 291.33 327.12 343.08 345.68
Figure 6: Cash Conversion Cycle (CCC) "Cash or Operating Cycle" for Hikma Pharmaceuticals PLC between 2010 & 2013
It can be seen from Table 6 and Figure 6 that Hikma Pharmaceuticals PLC:
Cash conversion cycle is 345.68 days. This means it took Hikma Pharmaceuticals PLC
345.68 days from paying for its inventory to receive the cash from its sale in 2010.
Cash conversion cycle is 343.08 days. This means it took Hikma Pharmaceuticals PLC
343.08 days from paying for its inventory to receive the cash from its sale in 2011.
Cash conversion cycle is 327.12 days. This means it took Hikma Pharmaceuticals PLC
327.12 days from paying for its inventory to receive the cash from its sale in 2012.
Cash conversion cycle is 291.33 days. This means it took Hikma Pharmaceuticals PLC
291.33 days from paying for its inventory to receive the cash from its sale in 2013.
-
50.00
100.00
150.00
200.00
250.00
300.00
350.00
400.00
2013 2012 2011 2010
Days Inventory Outstanding
Days Sales Outstanding
Days Payables Outstanding
Cash Conversion Cycle (CCC) "Cash or Operating Cycle"

Measuring the Liquidity of Hikma Pharmaceuticals PLC
Page 11 of 12
Appendix
Appendix 1: Summary of Liquidity Ratios
Table 7: Liquidity Ratios of Hikma Pharmaceuticals PLC between 2009 & 2013
Liquidity Measurement Ratios 2013 2012 2011 2010 2009
Current Ratio 1.53 1.67 1.69 1.84 2.23
Working Capital 311,000,000 315,000,000 269,302,000 225,492,000 252,156,000
Acid-test or Quick or Liquid Ratio 1.04 1.08 1.05 1.12 1.43
Acid-test Ratio 1.06 1.09 1.08 1.16 1.45
Cash Ratio 0.29 0.38 0.24 0.23 0.32
Days Inventory Outstanding 166.41 154.22 147.16 167.41
Days Sales Outstanding 183.22 233.14 255.29 236.98
Days Payables Outstanding 58.29 60.25 59.37 58.72
Cash Conversion Cycle (CCC) "Cash or Operating Cycle"
291.33 327.12 343.08 345.68
Appendix 2: Figures from Balance Sheet & Income Statement
Entry 2013 2012 2011 2010 2009
Balance Sheet
Cash & Cash equivalent 168,000,000 177,000,000 94,715,000 62,718,000 65,633,000
Inventory 276,000,000 272,000,000 239,260,000 182,192,000 160,509,000
Accounts Receivable 439,000,000 328,000,000 315,856,000 237,185,000 226,841,000
Current Assets 897,000,000 782,000,000 659,885,000 494,115,000 456,598,000
Current Liabilities 586,000,000 467,000,000 390,583,000 268,623,000 204,442,000
Trade & Other Payables 241,000,000 195,000,000 171,098,000 127,555,000 107,618,000
Income Statement
Revenue 1,365,000,000 1,109,000,000 918,025,000 730,936,000 636,884,000
Cost of Sales 601,000,000 605,000,000 522,676,000 373,592,000 332,459,000
Net Sales 764,000,000 504,000,000 395,349,000 357,344,000 304,425,000

Measuring the Liquidity of Hikma Pharmaceuticals PLC
Page 12 of 12
About the Author
Awarded First Class Honours in Bachelor of Arts
(Honours) Business Management from the
University of Greenwich on July 2012, London –
UK.
Worked as a Project Finance Officer for 1 year &
9 months with a multi-industry group of
companies.
Key Skills:
1. Budgeting & Forecasting
2. Financial Analysis, Modeling & Studies
3. Feasibility & Research Studies
4. Others