Embed Size (px)
Citation preview

MANAGING STORMWATER IN THE HUDSON VALLEY: A COST-BENEFIT ANALYSIS OF PERMEABLE PAVEMENT
October 15, 2014
Libby Murphy, MBA/MSClimate Outreach SpecialistHudson River Estuary Program, NYS DEC

ROAD MAP
• Motivation
• Background
• Methods
• Results
• Discussion & policy recommendations
• Next Steps

Stormwater management is key to maintaining water quality & human health
Hudson River estuary – 150 sewer systems, 13
Combined Sewer Systems (CSS)
– 695 CSS outfalls– 29 billions gallons discharge– Separate systems also lead
to discharge
Exacerbated by climate change and urbanization

Stormwater managed historically using gray infrastructure

Emerging stormwater management alternative: green infrastructure

Permeable pavement: An example of green infrastructure

Who is adopting permeable pavement in the Hudson Valley?

What is the lifecycle value of permeable pavement?

I created a robust cost-benefit analysis tool to estimate the value of porous pavement for the Hudson Valley

What are the primary costs and benefits of permeable pavement?
CostsInstallationOperating and maintenance
BenefitsAvoided gray infrastructureReduced runoffPollutant removalReduced deicing

Assumptions
• Project size: one acre or 34,560 square feet
• Type: Pervious asphalt parking lot with 100-150 spaces
• Benefits realized: All (new development, CSS municipality)
• Install cost: $5 per square foot
• Life expectancy: 30 years
• Discount rate: 3%

Cost #1: Installation
Upfront investment
$0.50 to $5 per square foot
Sources: Booth, 1999; Houle et al., 2013; UNHSC, 2012
Installation CostsUnit cost (dollars per square feet) 5Project installation cost (dollars) 217,800

Cost #2: Operating + MaintenanceAnnual cost
Vacuuming and inspection
$1.14 mil per square foot and $25 per acre
Sources: Houle et al., 2013; UNHSC, 2012
Operating & Maintenance CostsUnit vacuuming cost (dollars per square feet) 0.0114Project vacuuming cost (dollars per year) 497Vacuuming frequency (times per year) 2Inspection (dollars per year) 25Total annual O&M cost (dollars per year) 1,018

Benefit #1: Avoided grayInfrastructure
Upfront avoided cost
$2.71 per square foot
Source: CNT, 2009
Avoided Costs
Unit cost of stormwater treatment (dollars per square feet) 2.71
Avoided gray infrastructure (dollars) 118,048

Benefit #2: Reduced runoff
Annual avoided cost
$0.743 mil per square foot
NRCS rainfall-runoff model, sewage rates
Sources: CNT, 2010; Battiata et al., 2008; Hunt, 2012;
USDA NRCS, 2004; Roseen et al., 2012; UNHSC, 2012
Runoff reductionWastewater or sewage treatment fee (dollars per gallon) 0.007429
Average annual precipitation (inches per year) 47.50
Avoided annual runoff volume (gallons) 867,064
Annual runoff benefit (dollars per year) 6,441
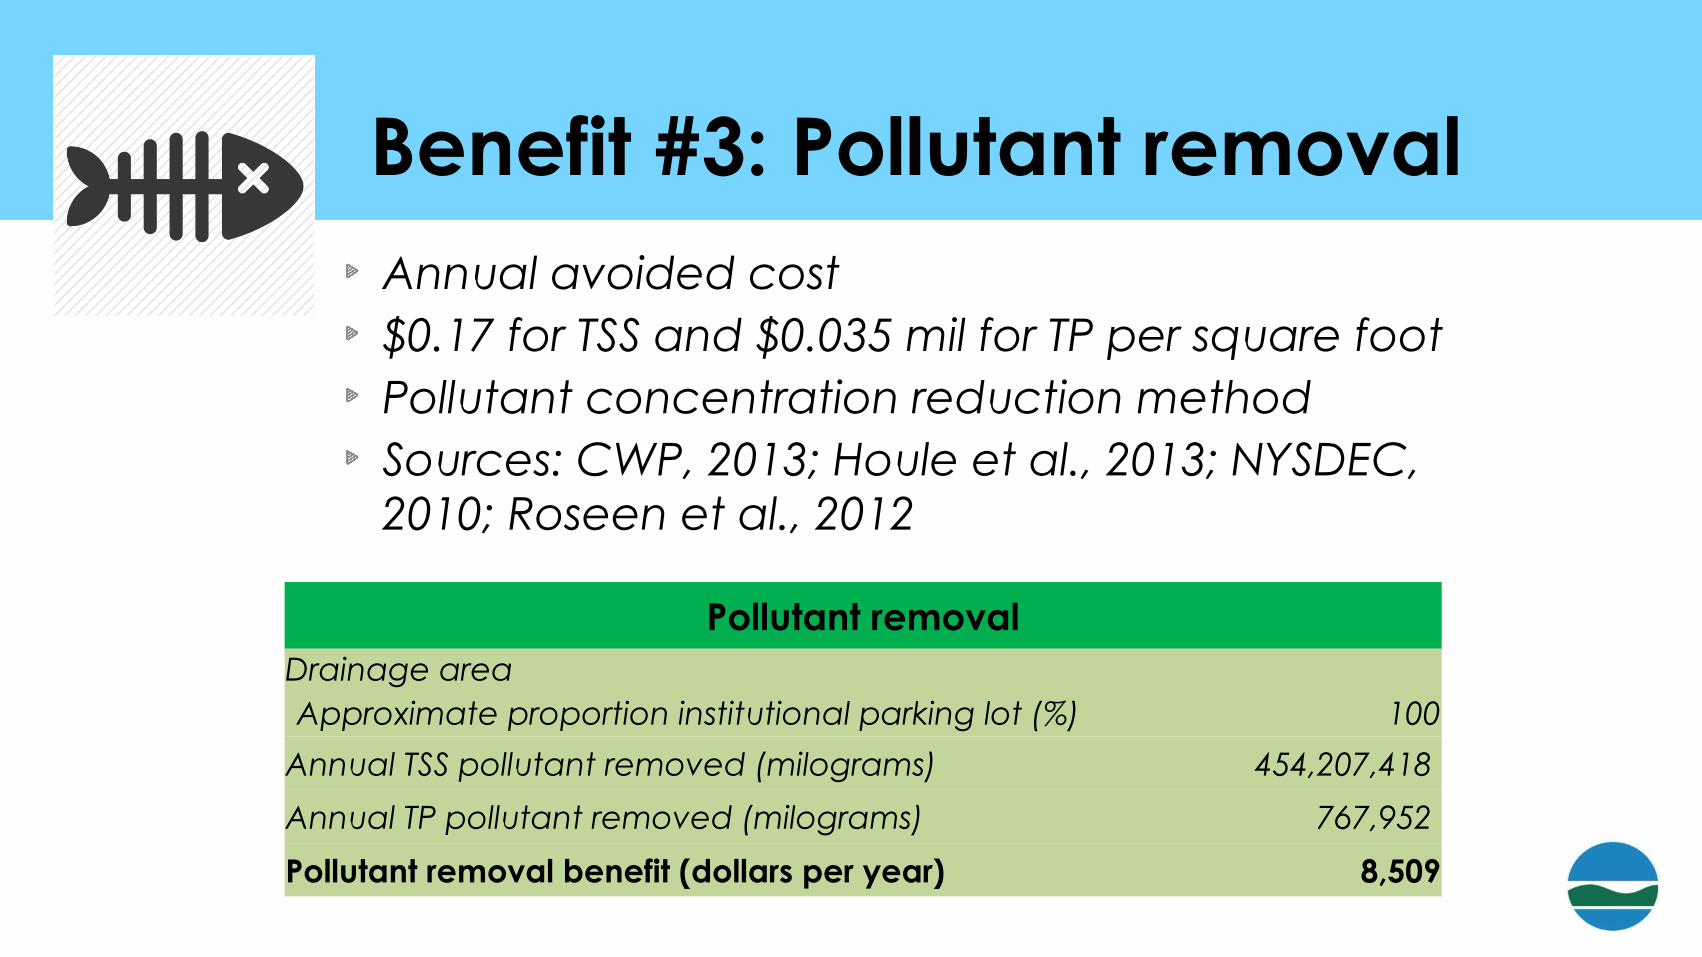
Benefit #3: Pollutant removalAnnual avoided cost$0.17 for TSS and $0.035 mil for TP per square footPollutant concentration reduction methodSources: CWP, 2013; Houle et al., 2013; NYSDEC, 2010; Roseen et al., 2012
Pollutant removalDrainage areaApproximate proportion institutional parking lot (%) 100
Annual TSS pollutant removed (milograms) 454,207,418
Annual TP pollutant removed (milograms) 767,952
Pollutant removal benefit (dollars per year) 8,509

Benefit #4: Reduced deicing
Upfront investment
$0.33 mil per square foot
75% reduction recommended
Sources: DOT, 2013; Houle, 2008; Houle et al.,
2013; Shafer & Kevern, 2013; UNHSC, 2012 Deicing reduction
Typically road salt application (tons per acre) 3Unit cost of road salt (dollars per ton) 51Proportion reduction for permeable (%) 75Deicing benefit (dollars per year) 115
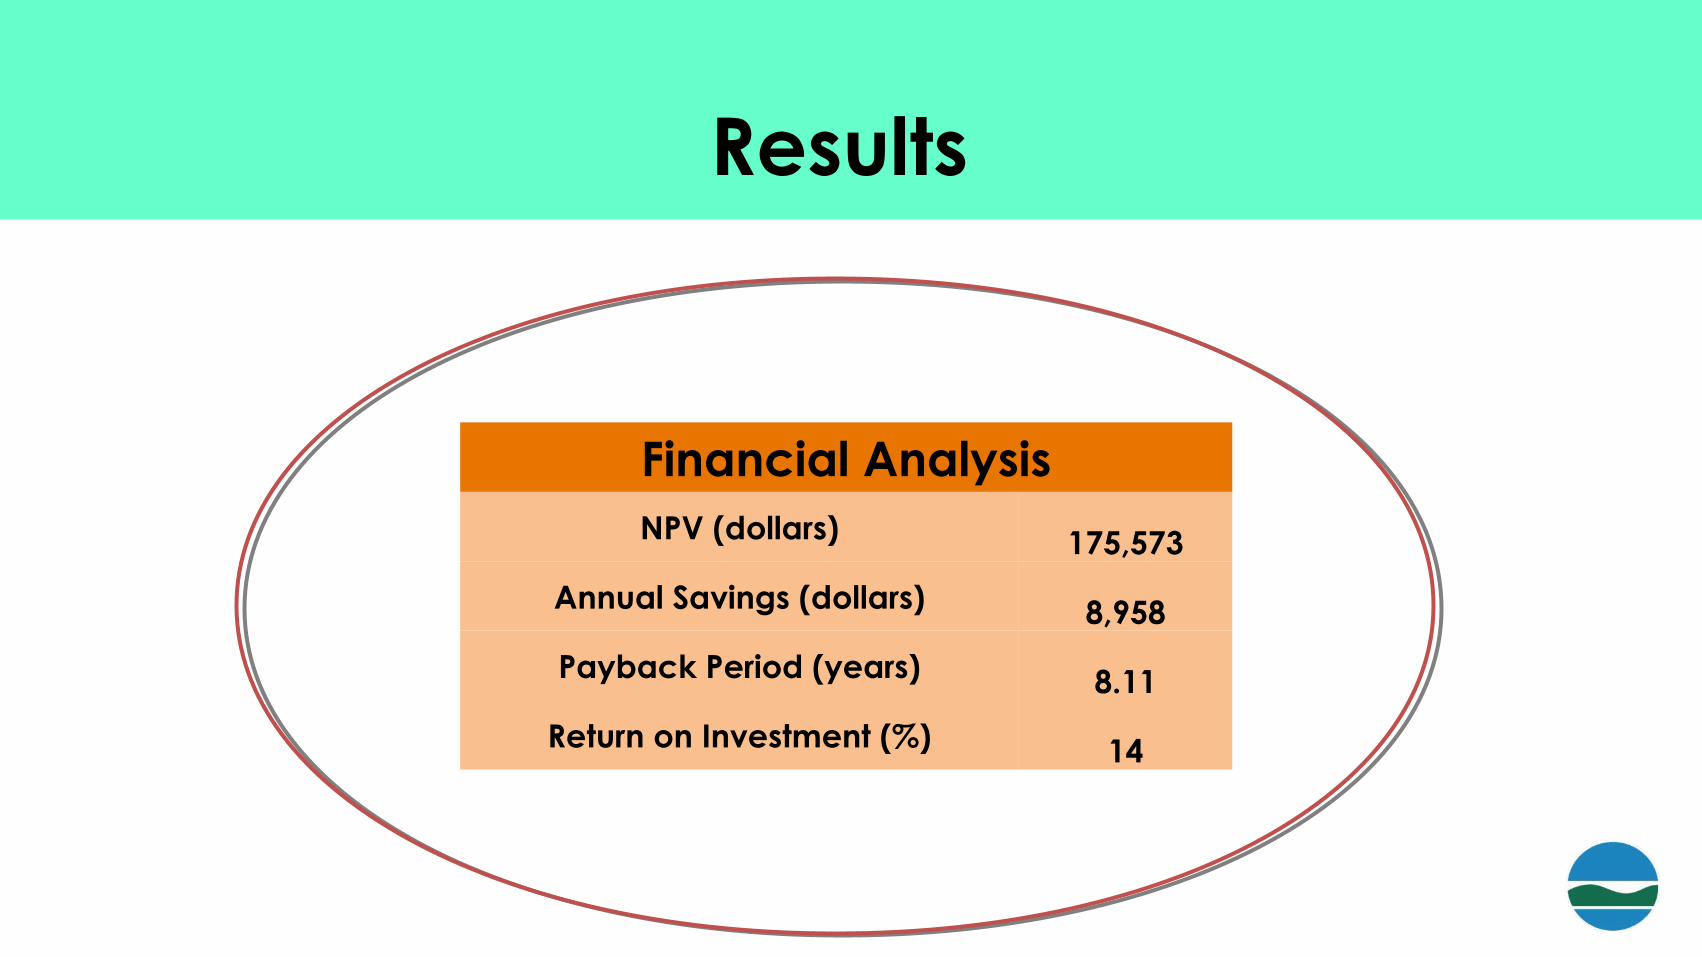
Results
Financial AnalysisNPV (dollars) 175,573
Annual Savings (dollars) 8,958
Payback Period (years) 8.11
Return on Investment (%) 14

Discussion
• Compare to existing studies
• Model is more robust but there are still weaknesses
– Installation costs, repair, gray infra, climate change, etc.
• Permeable pavement could have a significant impact on
municipal annual budget
• If NPV really is significantly positive, why are there roadblocks?
Financial AnalysisNPV (dollars) 175,573
Annual Savings (dollars) 8,958
Payback Period (years) 8.11
Return on Investment (%) 14

Why are more municipalities not adopting permeable pavement?
• Traditional pavement technology well known
• Installation costs are higher for permeable
• Permeable technology requires experienced engineers and installers
• Lenders may be reticent to fund because of uncertainty around lifecycle costs and benefits
Policy recommendations
• Lenders need to decouple risk
and funding roles by
outsourcing their risk-taking to a
third party insurer
• Need better education and
institutionalization through
outreach, funding, and
successful demo projects

Next steps
• Incorporate climate change projections for NYS
• Improve model
• Transform into user-friendly online tool
• Apply to real life projects
• U. Albany campus center

MANAGING STORMWATER IN THE HUDSON VALLEY: A COST-BENEFIT ANALYSIS OF PERMEABLE PAVEMENT
Questions?
Libby Murphy, MBA/[email protected]

Equations
• Installationwhere A is the area of the project, and c is
the unit installation cost of permeable pavement.
• O&Mwhere A is the area of the project, cv is the
unit cost of vacuuming, f is the annual vacuuming frequency, and ci is the annual cost of inspection.
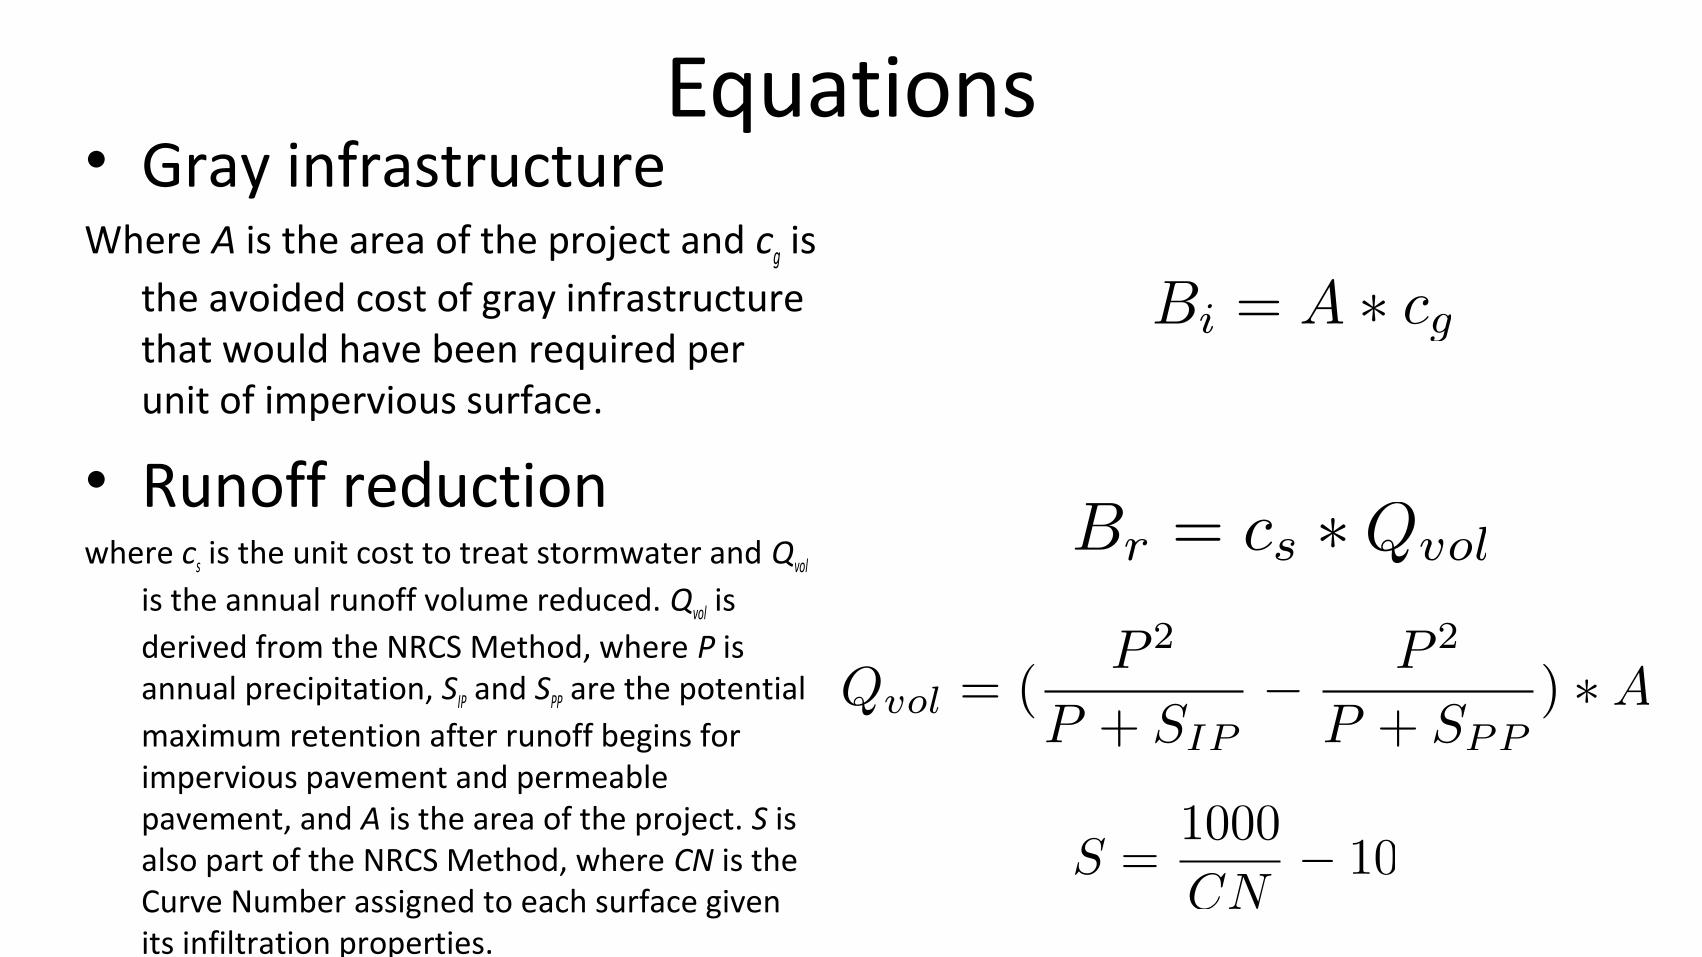
Equations• Gray infrastructureWhere A is the area of the project and cg is
the avoided cost of gray infrastructure that would have been required per unit of impervious surface.
• Runoff reductionwhere cs is the unit cost to treat stormwater and Qvol
is the annual runoff volume reduced. Qvol is derived from the NRCS Method, where P is annual precipitation, SIP and SPP are the potential maximum retention after runoff begins for impervious pavement and permeable pavement, and A is the area of the project. S is also part of the NRCS Method, where CN is the Curve Number assigned to each surface given its infiltration properties.

Equations
• Pollutant removalwhere Pin is the unit pollutant loading based on
land use in drainage area, Pred is the proportion of pollutant concentration reduction provided by permeable pavement, W is the water volume treated, and cp is the unit cost to remove pollutant.
• Reduced deicingwhere A is the area of the project, r is the
reduction in road salt application, t is the standard rate of road salt application for impervious pavement, and cs is the unit cost of road salt.

NPV Equation
Where Ci is the initial investment in the form of installation cost of permeable pavement, Cm is the annual cost of operating and maintenance, i is the discount rate, Bi is the initial benefit of avoided gray infrastructure, Br is the annual benefit of runoff reduction, Bp is the annual benefit of pollutant removal, and Bs is the annual benefit of reduced road salt application.

DataTable 4. Municipal sewage fee rates for the mid-Hudson Valley area.
Municipality County Sewage treatment fee (dollars per gallon)
1 Rosendale Ulster 0.004500 2 New York New York 0.007607 3 Fishkill Dutchess 0.012995 4 Kingston Ulster 0.006007 5 Newburgh Orange 0.010195 6 Poughkeepsie Dutchess 0.002674 7 Saugerties Ulster 0.005357 8 Woodstock Ulster 0.010100
Simple average sewage fee 0.007429

DataTable 5. Annual average precipitation from five sites in the Hudson Valley, NY, 1983-2013.
Source: Northeast Climate Center.
Station location County Precipitation (inches)
1 Alcove Albany 52.7 2 Hudson Columbia 41.6 3 Yorktown Heights Westchester 54.1 4 Mohonk Lake Ulster 42.0 5 Walden Orange 47.1
Simple average for five sites 47.5

Data
Table 6. Representative
pollutant loading by
landuse type.
Source: Hunt et al., 2012
TSS (mg/L) TP (mg/L) TN (mg/L)
Institutional Parking lot 654.81 1.48 5.45
Open/landscaped 100.30 1.67 8.48 Roof 102.20 0.57 4.09
Commercial Parking lot 219.53 0.61 5.45
Roof 27 0.15 1.08 Open/landscaped 100.30 1.67 8.48
Residential Driveway 654.81 1.48 5.45
Roof 27 0.15 1.08 Lawn 100.30 1.67 8.48
Transportation Sidewalks 113.55 1.78 4.31
Low density 113.55 1.63 13.89 Medium density 93 0.52 1.40
Industrial
Parking lot 173 0.39 1.44 Roof 27 0.15 1.08 Open/landscaped 26.50 0.44 2.24
Other Woods 427.71 0.95 5.56
Maintained grass 75.70 2.23 11.58 Pasture 317.94 5.90 13.66 Open water 102.20 0.57 4.09