Embed Size (px)
Citation preview
Macroeconomic Theory and Stabilization Policy Prof. Dr. Surajit Sinha
Department of Humanities and Social Sciences Indian Institute of Technology, Kanpur
Lecture – 13 Now, with investment function when we have the highest function, you realize that now
there are two variables in the module. Y is one of the variables, another is r, we do not
know r. So, that is why we have an IS LM model that I would discuss, because there are
two equations required to solve two unknowns. So, in the IS curve the way it is drawn is
against an on an r Y plane. So, you do you have Y, I am coming out of the Keynesian
cross model. Now, your Y on the X axis and r on the Y axis and you realize that this IS
function is nothing but the goods market clearing condition supply is equal to demand.
So, supply is equal to demand, means supply of output is equal to demand for output. So,
supply of goods and services is equal to demand for goods and services, you can attain
the equilibrium condition for various combinations of r and Y that is where I talked
about. Suppose, Y is in excess then you can have two adjustments possible, one is y
should reduce come down, another one would be that if Y is in excess demand should go
up because Y is supply. Your supply is here, demand is here, either supply should come
down or demand should go up. For demand to go up you can reduce rate of interest, it is
an inverse relation with I.
So, reduced rate of interest in respond will go up and demand will go up because
investment is part of demand. This kind of a discussion we had in the previous class.
Now, I go to the another contribution of Keynes which is where again, some
complications will come that is the money market business. So, I am going to introduce
the money market the first time. This is discussed under this function or chapter you will
find on LM. Now, what is this LM function?

(Refer Slide Time: 02:28)
So, what I am going to do is the following way, I am going to introduce the money
market. Let us write money market, this is the money market. Let us write this, I would
go around, I would talk about money market not the way the text books usually talk
about the LM function. They right away talk about supply of money and demand for
money. I am not going to talk about supply of money and demand for money right away,
all right? I need to talk about something more. Let us see whether it makes sense to you
or not.
What you have in an economy is the financial market, you will hear about this word
financial system, financial market a lot. You do not hear about money market usually. So,
what you have in an economy is a financial system or financial market. So, this is not
one market, financial market you can call that financial market. It is just not one market,
financial market is part of a much wider market and you can talk about various things.
So, what I would do is these are the, this is this. This is one way of talking about it,
another one I can talk about the assets market another one is to talk about the assets
market.
Now, assets is a much wider group, it is like wealth which can have financial assets. It
can have non financial assets, alright? Now, what I would do is since I am going to talk
about money market, this is my focus. What I would do is that within the assets market.

Let us think about money as one of the assets cash, you can think about money as cash
that I would define money, later think about money as cash.
So, cash is one kind of an asset, you know why it is an asset valuable a wealth because
with that you can buy so many things and there can be a host of non money assets. Now,
the non money assets partly can be financial assets like shares, bonds, mutual funds,
certificates, whatever. Then you can also have non financial assets there, non money.
Other assets non money assets can be of two types, non money assets can be either
financial assets or it can be a non financial asset like for instance I have a stock here
about properties in connection with investment. That is an asset I can hold properties my
wealth, many people do buy land, buy flats, houses with the hope that they will make a
return on it like the prices would go up or value would go up or whatever.
So, when I resale it I make some money on it. I mean money in the sense I mean capital
gains, but remember there are capital losses also possible. I usually talk about capital
gains, but capital loss is also possible. So, what I am trying to say is that in the assets
market, essentially what I would do? I would talk about money as one form of asset and
put all non money in one group, alright? All non money in one group, why I am doing it
because my focus will be on money market.
So, I do not want to complicate the picture much. So, non money can be financial assets
and there are other assets like real assets properties, land P B, PIB then also bring in you
know antiques may be same things that can be part of my wealth, I have a Picasa. So,
painting I hold my wealth by buying paintings, whose money would value appreciates
and then you sell them later if I need money.
So, people can think about holding their wealth, keeping their wealth in various forms,
we need not go into that. Now, what I am going to do is that think about the entire assets
market in terms of demand and supply. This is what I am doing right from the beginning,
goods market demand and supply because I keep my life simple. So, I can talk about the
equilibrium condition.
So, here also I think about a demand and supply for the entire assets market within which
I can think about demand and supply. In the money market I can think about demand and
supply. In the non money market sum total of the supply here and supply there will be
the total supply of assets. Sum total of the demand here in the money market and the

demand in the non money market can be my total demand for assets, do you agree with
me or not? So, what I am trying to say is the following.
(Refer Slide Time: 08:05)
I am going to conceptualize, I am going to conceptualize supply of assets or let us say
[FL] supply of assets is equal to demand for assets as implied overall equilibrium.
Overall equilibrium in the assets market supply of assets demand for assets, alright?
Now, remember that the supply of assets will be equal to money supply which you have
seen as M and if I take a real value, it will be M over P plus some non money assets.
Some non money assets call that I have this notation here, non money assets call that
NM, alright? Non money assets and if I take a real value you can divide this by P, non
money assets supply of assets, alright?
Similarly, demand for assets will be equal to demand for money. You can call that M D
demand for money and demand for money, real demand for money M D plus demand for
assets. So, it will be non money assets, call that N M non money assets dema N M D,
alright?
Student: Sir will they be in real terms?
Yeah, you can take them in real terms, very good point. You can take them in real terms,
depends upon notations. You use you are right in money supply, you write M over P, we
can write divided by P. Now, these are identical relationships, I mean supply of money

plus non supply, non money supply of non money would be equal to the total supply of
assets.
There are identities, they are always equal, these are not equilibrium conditions and
demand for money plus demand for non money assets will be equal to the total demand
for assets. So, these are identical relationships, A plus B will always be C, alright? There
is no equilibrium condition here. So, these are like identities, remember that the next
thing that I would do is what I need to do is the following.
(Refer Slide Time: 11:40)
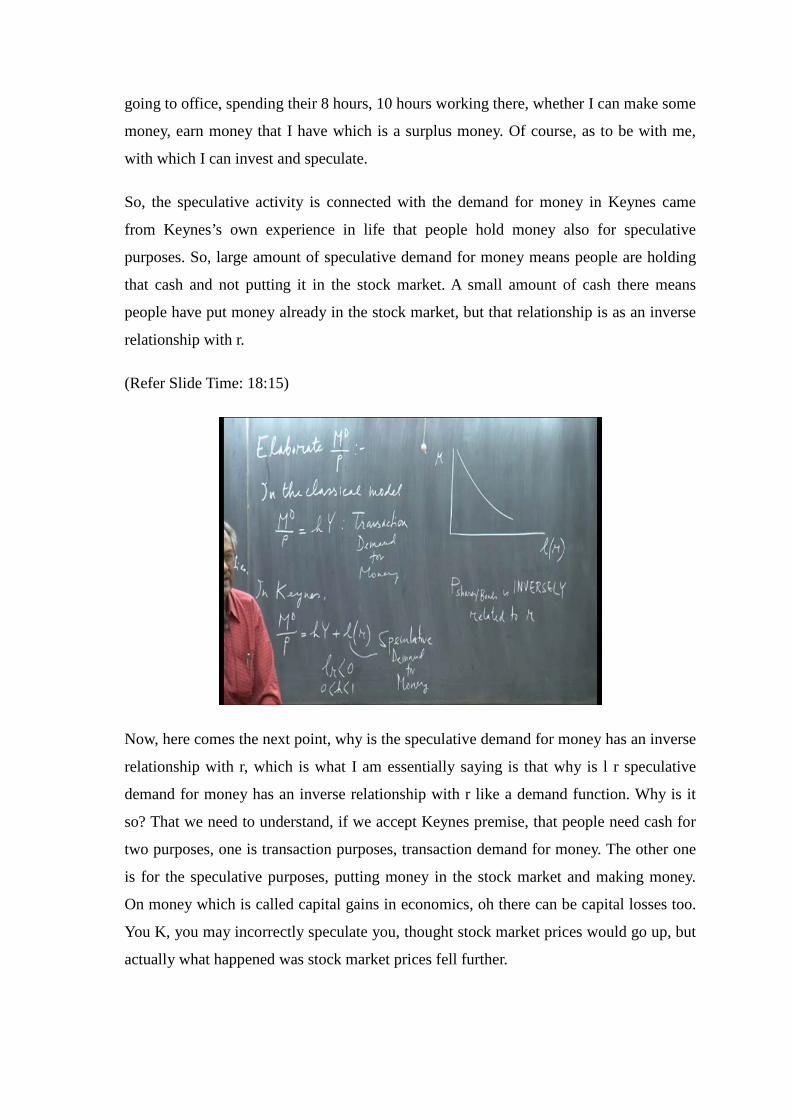
I am going to elaborate, I am going to elaborate demand for money which I have written
M D over P. My focus will be on this because here comes the contribution of Keynes and
that is why we have an LM function which did not exist in the earlier functions. So, I
need to focus on, now elaborate demand for money here, where Keynes contribution
comes. You remember that in the classical model, classical model demand for was only h
Y where I said this is transaction demand for money. This is transaction demand for
money, but in Keynes this is a famous contribution. That is why many things changed
and you would realize that soon in Keynes we have demand for money is equal to H Y
plus a small l r, where this is known as speculative demand for money, where r is a
function.
Speculative demand for money, where r is a function of I l r and interestingly enough like
investment function this l r is negative and you know h lies between 0 and 1, you know
that. You know h lies between 0 and 1, this stuff l r negative has a very interesting
interpretation, what is speculative demand for money which Keynes thought is part of
demand function for money. What is it Keynes said the following things, he was talking
about the western countries, western economies not so much India. In India it is
becoming now, it was not.
Really, what he was saying is that people demand money for transaction purposes which
we know, that we have understood that from the Cambridge version was there demand
for money is a classical model. We have seen that because in order to mediate, in order to
have these transactions go through the various goods we buy the bills, we pay, we need
cash, we need money, we demand money to make these payments, etcetera to live
essentially. But what is this speculative demand for money, why do we need this money,
demand for money the speculative demand for money. We need Keynes said this is not to
transact goods.
It is entirely for speculative purposes. What is speculation? Speculative purposes means
guess purposes, I guess, I try to forecast what is going to happen to something say
inflation, may be output growth rate employment in India anything else.
So, this money is kept for speculative purposes, but there is one very specific objective
for which individuals hold speculative balances or cash. Balance means cash they hold,
speculative demand they hold. Speculative money is that people who have extra money
beyond their transaction needs. They speculate by investing in the stock market and
Keynes made a lot of money, earned a lot of money from the stock market. People say
that the stock market is kind of at the heart of where the core of a modern capitalist
economy stock market would give you the pulse. What is happening elsewhere in the
economy? If you can study the stock market well, which is the share market, how prices
are going up and down. Then you would also know what is happened in to the economy.
Now, this is the macro economist’s worry, but from a individuals point of view when you
are talking about the demand for money and this is aggregate demand for money, means
all individuals taken together. Then from the individual’s point of view the stock market
is of interest for primarily one reason. Whether I can buy the shares or as a matter of fact
it can be extended to non money assets, something at a lower price now and sell them off
at a higher price later and make capital gain, very simple motive. Quick money without
going to office, spending their 8 hours, 10 hours working there, whether I can make some
money, earn money that I have which is a surplus money. Of course, as to be with me,
with which I can invest and speculate.
So, the speculative activity is connected with the demand for money in Keynes came
from Keynes’s own experience in life that people hold money also for speculative
purposes. So, large amount of speculative demand for money means people are holding
that cash and not putting it in the stock market. A small amount of cash there means
people have put money already in the stock market, but that relationship is as an inverse
relationship with r.
(Refer Slide Time: 18:15)
Now, here comes the next point, why is the speculative demand for money has an inverse
relationship with r, which is what I am essentially saying is that why is l r speculative
demand for money has an inverse relationship with r like a demand function. Why is it
so? That we need to understand, if we accept Keynes premise, that people need cash for
two purposes, one is transaction purposes, transaction demand for money. The other one
is for the speculative purposes, putting money in the stock market and making money.
On money which is called capital gains in economics, oh there can be capital losses too.
You K, you may incorrectly speculate you, thought stock market prices would go up, but
actually what happened was stock market prices fell further.

Now, if you go and sell off your stocks, stocks means shares and bonds, you lose money
because you bought them at a higher price. So, there the objective of the individuals
becomes cost minimization or loss minimization. How can I minimize my loss as
opposed, to maximize my profit the model changes into loss minimization, you
understand that?
Now, the question that I have to explain which I have been struggling since I started
teaching macro economics is why l r is a inverse relationship. There are papers on that,
you need not read papers that the PhD level or the PG level. I ask students to read those
papers, there are some original classic papers, even written by Nobel laureates
themselves before they got the Nobel prize for. Probably because of those papers they
got the Nobel Prize.
So, there are classic papers, but I do not want you to read them now. At the PG level or
senior under graduate level if I teach some more economics course, I may ask them to
read that. Now, why is it to me there are one or two kind of simple explanations. I can
read Keynes and find out what he is saying, but Keynes book is very difficult to read and
it becomes more and more difficult when you try to read all that. What basically happens
is if people are speculating, when will they buy their shares when the return from the
bank is low. I do not put money in the bank, if interest rate is low I do not put money in
the bank. Then I keep a large balance for stake speculative purposes, I would be hoping
to invest that in the stock market.
One common avenue for householders to park their savings to park their savings, put
their savings. Then the simplest one which I have seen my parents doing it, you may
have seen you parents also doing it to open a bank account and put the cash there. But
the interest if it is very low with zero inflation, r is also nominal. Interest rate zero
inflation is the static model.
So, with zero inflation in this model r is also nominal rate using Irving Fisher’s equation.
Now, what will happen the temptation to put money in the bank will go away. I will be
holding right cash [FL] and if the interest rate is why keep secularly balances, keep them
in the bank earn a good return, but there is a complementary thing, explanation is also
there in terms of the stock market. This is going to blow your mind away, I am going to
write in colored chalks. I am, I shall give you references to read up on that algebraically.

It can be shown that the price of shares say or bonds the financial assets, particularly
price of shares and bonds is inversely, inversely, inversely spelling is alright s e l y,
alright? Inversely related to r, is inversely related to r. Now, what can be this
algebraically, it can be shown. So, when r is down, people own lot of speculative
balances. There is another reason because the price of shares and bonds is very high.
So, you do not buy them when they are very high, you want to sell them when they are
very high so that you can make capital gain. So, you hold right this speculative balances.
Now, when r is up, if this is true then price of shares and bonds are low. So, you can put
money in the bank, one avenue another one is you can put money in the stock market.
So, you do not hold speculative balances, there is not much cash speculative cash in your
pocket. They have gone somewhere parked somewhere [FL] for a good return, you
understand what I am saying, but that hinges upon this inverse relationship.
Now, you can open up text book like Dornbusch and Fischer starts on Manqué, open the
investment chapter, go to the they there is a appendix. Through the investment chapter
find out if this inverse relationship is proved or not, often they do have that. It depends, it
requires a concept of present discounted value of an asset, that is the return that able to
get from an asset, say I buy a bond. What happens with the bond? Bond promises you to
pay a 10 percent interest.
So, every year you will get 10 percent income on the value of the bond, whatever the
bond paper which is written 1 lakh bond, 2 lakh bond, 10000 bond, whatever. Every year
you get the interest payment, but there can be a secondary market that can develop. I do
not want to hold the bond any more, I want to sell it. At what price would you buy? It
depends how many years already lapsed and bond has a fixed maturity.
So, how many years left? How many years I will earn and I will calculate the present
discounted value of the that income that I will get in the next 7 years, and depending
upon that I will say this is the price. I can pay for the bond because [FL], after three years
you are selling it. So, present discounted value method is used which I can show you
later. I do not want to waste time here which can be used to obtain this inverse
relationship between prices of shares and bonds market price at which it sells.
This price usually relates to the secondary market price which we call stock market price.
I told you stock markets, Bombay sensex values, they come on TV every evening after

the day. They are not primary shares, they are not new share prices. They are all old
shares which are being bought and sold, bought and sold in the secondary market [FL]
within the day. That what Bombay sensex number is it is an index number taking 100
strips of money, 100 shares of companies, 100 companies of 30 strips. They are various
index values, there some consists of small number of shares, some consists of large
number of shares.
So, stock market value is essentially a secondary market price P of shares and bonds.
Particularly, shares bond, bond, bond market also can have a secondary market, not the
new bond or the new shares Reliance or Tata is selling today. No, not that price that is
called IPO, initial public offer primary shares. These sensex values stock exchange Dow
Jones in the United States, FTSE in England, etcetera. These are all secondary market,
buying and selling, because of this stock speculative demand I am talking about why I
am saying this is this speculative demand for cash. Is it clear a little bit what I am
saying? Alright?
So, people hold speculative balances means large L value, large h Y value means they are
holding a lot of cash for specific purposes. Here, it is for transaction purpose, here it is
for speculative purposes. They are holding cash alright and but this problem here, here it
is easy. The larger the income the larger I spent. So, I hold the larger amount of cash for
spending purposes. It is very simple, but here that inverse relationship is much more
complex, a couple of things are there I tried to explain. One intuitive reason is the rate of
return is low. The rate of return from banks are low.
So, I do not put money in banks, I think of alternative avenues to put the money in
second. There is a complementary thing coming in here, prices of shares and bonds in the
secondary market inversely related to r. So, if r is low, prices are high. Why would I buy
something when the price is high? I wait till prices come down, then I buy. I buy
objective would be to sell it off at high price, clear 2, 3 things. So, you have a speculative
demand for money now.
Student: Sir?
Yes, yeah, yeah.

Student: Sir the money kept in banks, why is that money not a speculative demand for
money?
We will write a paper on the true speculative demand for money. Considering those
factors I do not think, we usually do that, but partly your question is correct. There is
some accounts which are savings accounts, where the interest rates is very low. It is like
holding cash at home, it is said in the morning when the bank opens you have to go and
withdraw the money. It is nearly cash, this is called the liquidity of cash. There are some
bank accounts which are not so liquid, so can be cannot be part of speculative demand
for money because when you put the money there it is not so easy to take it out.
Speculative demand for money or transaction demand for money has to be extremely
liquid, liquid in the sense if you can use if you want to use them you can use them. Today
the instant teller or automatic teller machines have made savings accounts even more
liquid, because at the middle of the night if I need cash, suddenly I have some friends, I
want to go out and have some restaurant food, I rent a taxi [FL].
Savings accounts have become so liquid that you can go with your card and with your
cash. Those type of very liquid cash can be part of speculative balances or transaction
balances, not the in liquid ones like fixed deposits, alright? Or bonds you do not get the
cash immediately. Shares, if you put in money you cannot just go and tell [FL], you have
to go through a broker. There are some rules, fill out some forms sell off the shares,
finally get the money, am i clear? Yeah.
Student: Is it also a fact that speculative demand consists of only those where in
investment is not fixed for sure.
Yea, very speculative means very uncertain. Yes, absolutely right. Broad speculative
means you are gambling and in a gamble there can be a win or a loss, alright? He is
correct. There it has and it will have a probability distribution of the return function. It is
not a deterministic return like bank interest rate, absolutely right. It will have a
probability distribution, means it is chances of getting the return or not high.
So, modern papers trying to explain that which are not very old papers. In fact had
distribution functions or returns associated with the risks. So, what they have is a return
risk trade off, higher the risk you take, higher the expected return, but also the possibility
of greater amount of loss. That is why higher the risk. So, those issues come.
Now, what I need to do is having saying this about the demand for money function. Now,
what I am saying is that overall equilibrium in the assets market is SD. So, suppose now
I borrowed this relationship and I said always, this always holds equilibrium, always this
equilibrium always holds.
(Refer Slide Time: 32:22)
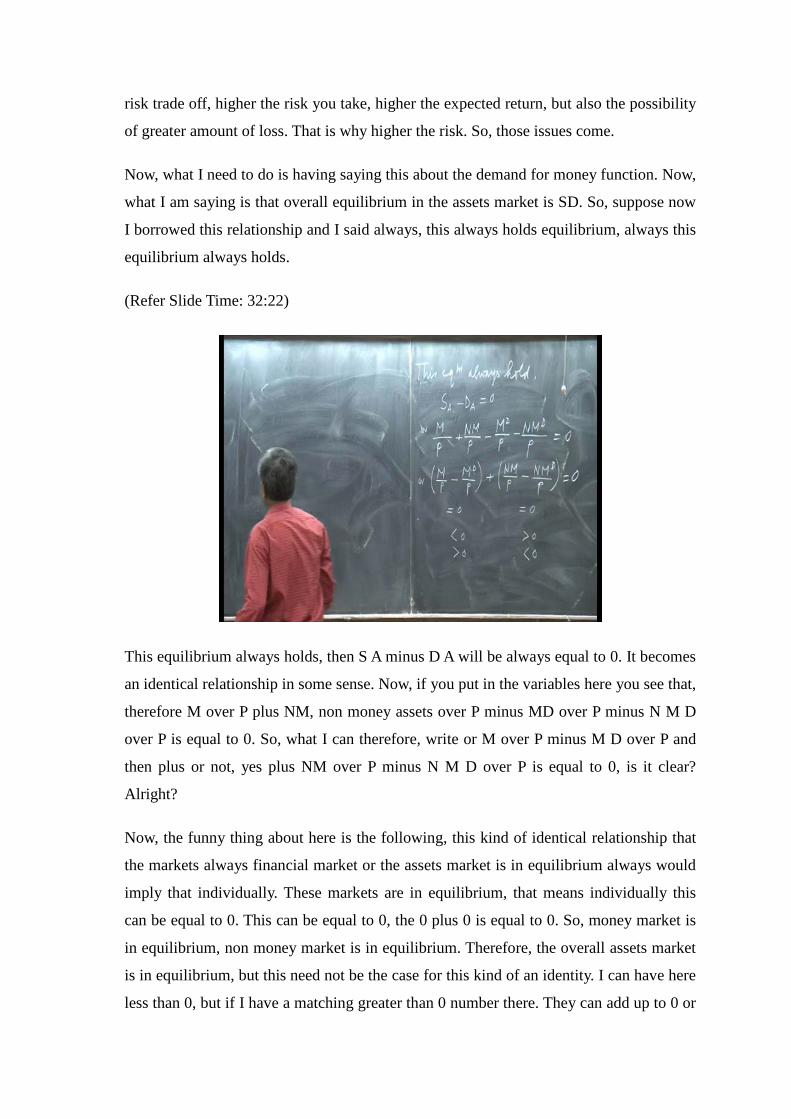
This equilibrium always holds, then S A minus D A will be always equal to 0. It becomes
an identical relationship in some sense. Now, if you put in the variables here you see that,
therefore M over P plus NM, non money assets over P minus MD over P minus N M D
over P is equal to 0. So, what I can therefore, write or M over P minus M D over P and
then plus or not, yes plus NM over P minus N M D over P is equal to 0, is it clear?
Alright?
Now, the funny thing about here is the following, this kind of identical relationship that
the markets always financial market or the assets market is in equilibrium always would
imply that individually. These markets are in equilibrium, that means individually this
can be equal to 0. This can be equal to 0, the 0 plus 0 is equal to 0. So, money market is
in equilibrium, non money market is in equilibrium. Therefore, the overall assets market
is in equilibrium, but this need not be the case for this kind of an identity. I can have here
less than 0, but if I have a matching greater than 0 number there. They can add up to 0 or

I can have a greater than 0 number here and a less than 0 number here. They can add up
to 0.
So, overall assets market can be in equilibrium, with money market not being in
equilibrium and therefore the non money market not being in equilibrium. Although, the
overall assets market is in equilibrium, but I am imposing this overall assets market
equilibrium to bear. You have to bear with me irrespective assumption, I am saying that
this equilibrium always holds.
So, what you have is a, if you have a excess supply in the money market, that is it is the
positive number. Supply of money is greater than demand for money excess supply that
can have a matching excess demand here. The sum total can be 0 or you can have an
excess demand in the money market, alright? When you have excess demand in the
money market then the excess, there should an excess supply in the non money market
so that the sum total is equal to O. Now, if you agree with this then one more thing I need
to do, one or two more things.
(Refer Slide Time: 36:22)
Let us draw the money market. Now, I am going to focus on the money market. Let us
draw the money market. If you draw the money market, then a diagram like this will
suffice. You have demand for money and you have supply of money and you can have
the rate of interest on this axis. Now, what you have demand, if you remember MD over
P. What is MD over P? M D over P is h Y plus l r. Suppose, I assume an Y value, suppose
I assume an Y value. So, for an Y value my h Y line is here, say Y naught some income
in the economy, some Y value. Then I add the l r value.
So, the l r value is added, so this is my M D over P function, l r is added. Now, I need the
supply of money where supply of money is usually we assume that also to be some
constant, say M S naught over some price, also given supply of money you can if you
wish. So, suppose the supply of money is also given. So, the supply of money is say this
is M S over some real supply of money, M S over P naught.
Now, one can say there is a money market equilibrium when supply is equal to demand.
So, you have a point where you have a rate of interest, call that r naught. Now, imagine a
situation where suppose the supply of money is here, but the demand for money is here
less. This is the demand for money, what will happen? Ideally the rate of interest should
come down so that you have supply is equal to demand.
Suppose, the demand for money is somewhere here, some disequilibrium value in this
case the rate of interest should come down so that you move along the speculative
demand function given h Y naught to equilibrium. Rate of interest should come down, if
the rate of interest is too low in the economy then you have a situation where the demand
for money is more than the supply of money. Demand is here, supply is here on the X
axis. So, ideally rate of interest should go up and then clear the money market. In this
case from here the rate of interest should climb from here, the rate of interest should fall
here, rate of interest should climb and reach money market equilibrium [FL].
So, when rate of interest is coming down given that inverse relationship, the price in the
non money asset here is also a supply, given number of shares and bonds, etcetera. If you
wish you can put a, you can put initial values, can put initial values. If suppose, this is a
demand for non money assets. If rate of interest is going to come down and clear the
money market as in that case. That means you have excess supply of money.
So, demand for money should go up excess supply [FL]. If this is the case, if you have
excess supply of money, in this case rate of interest should come down so that demand
for money increases. Given the negative function, inverse function of speculative
demand for money, this component rate of interest should come down, alright?

So, what I am saying M, if M S naught is greater than M D over P naught then this would
imply the rate of interest should fall, but given the inverse relationship the price in the
non money asset should go up. But this also would imply the price of non money assets,
call that N M would go up.
So, your price goes up given the demand function, demand would fall, that means what
kind of thing you had here excess demand. We have a case where this situation existed,
hence price of non money should go up, when on a demand function price goes up
demand falls. So, when you have excess demand here it is a negative number, you have a
positive number here, overall market is always equilibrium. There is also internal
correction mechanism that I am trying to talk about so that ultimately you reach this
equal to 0 and that equal to 0.
Although, you begin with greater than 0 and less than 0 here or less than 0 here, greater
than 0 there, but a correction mechanism in terms of rate of interest if it exists. If we
assume that to exist and its inverse relationship with price of non money which also go
up and down like a see saw. If this goes down, that goes up. If this goes down that other
one goes up alright can immediately correct. The imbalances in two markets and restore
equilibrium, not only overall equilibrium which is always there, but also individual 0
values through correction.
If you agree with this which is frankly complex, then I can conclude in the way. I can
look into, I can look forward to a macro model where only money market is
incorporated, but not the non money markets. But I can tell you by looking at the money
market what is happening at the non money market, like the share market or the bond
market. I can connect and the connection is what is what we used to call the Warras
identity. I connected it this used to be called as the Warras identity, you do not have to
know that Warras identity, there is an identical relationship.
So, individual components can be in this equilibrium, overall relationship still holds.
Individual components can be in equilibrium, still the overall relationship will of course,
hold and any disequilibrium. Here, if I look at it I know what kind of a dis-equilibrium
exists in the other one and also I know what kind of connection that will take place in the
economy.

One is if you have excess demand in the money market, prices should go up we say
excess demand [FL] price will go up. Here, the price of money is like rate of interest. If
you have excess demand, price will go up. If there is excess supply, price will come
down. Similarly, in the non money market if there is excess demand, price there will go
up. If there is excess supply, price will go down. Do you know this excess demand,
excess supply functions with the demand supply, demand supply diagram, do you know
that just I will tell you and we can have a break.
(Refer Slide Time: 44:15)
It is very simple. In any demand supply model if you have a demand curve, if you have a
supply curve and you have price here and quantity. If you have a price below
equilibrium, there is excess demand and supply is here. So, Q S is here, Q D is there,
when excess demand is there people are saying give me goods, give me goods. I need
more, we want to buy more sellers see [FL]. So, I can reap the profit by increasing
prices.
So, typically in this case price will go up. Similarly, if there is excess supply in the
money market, supply is here, demand is here, producers come to the market and see
[FL]. They start lowering the price to attract customers. So, price starts falling from here
and that eliminates excess supply, same thing happening, supply of money greater than
demand for money, there is excess supply.
So, price should go down and if you have excess demand, excess positive demand then
price should go up. This is a very normal assumption we make, in economics market
corrects itself and this is the free market assumption. Of course, if you have restricted
assumption, government rule is there P cannot change, r cannot change, price of non
money assets cannot change, government rules are there. Then you do not have free
market, you will if there is a disequilibrium dis-equilibrium will persist [FL], but if it is
free market there, where prices can change depending upon the situation, alright?
So, normally people say if there is inflation that means there is a supply shortage because
excess demand [FL]. So, prices are going up demand is more than supply, if there is a
deflation there must be excess supply, prices are going down, producers cannot sell what
they want to sell. They lower the price and attract you and me [fl]. Tomorrow if you can
become an entrepreneur, become a AC manufacturer, alright? Lower the price from the
market price, produce a good AC, you would become a very rich man. Your name would
be there on TV as a new entrepreneur. I have seen new entrepreneur’s names on TV in
discussions, alright?
Now, what I am trying to say suddenly the demand for AC will go down and supply
basically will go up because there are so many companies producing AC today. I wanted
to take stock of AC manufacturers, you would not believe me I called the shop and I also
spoke to somebody. There were names of companies I have never heard who produces
AC and they sell in the market, Panasonic, Hitachi, LG, Voltas carrier. I have seen heard
on being on campus like this, but there are names coming up, alright?
So, now there will be excess supply. So, what will to prices of AC will go down, excess
supply [FL]. In excess demand price will up, same thing I am using in the money market.
In the money market if there is excess supply, in the money market prices will come
down and what is the price. In the money market interest rate, Y axis we measure price.
Similarly, I have drawn a diagram in the non money market, if you have excess supply
price will go down, some price of non money assets say shares, etcetera. If there is
excess demand, prices will go up. Imagine a demand function downward sloping and a
supply function fixed.
So, this diagram here will be something like this, non money assets. This is N M naught
over P and there is a demand for non money assets which I wrote N M D over P and here
is price of non money assets and you have non money here N M, same thing.
So, the money market and the non money markets can be connected and we can have the
entire story. So, if we focus on one market we know what is happening in the another,
one from these kind of relationships. The next complicated thing he did was in the
money demand function, where he introduced speculative demand for money. As soon as
you do that you open a box, which was either too closed and when you open that box you
have my goodness, money, why money? Why people own money or transaction [FL]
speculative, my goodness you are connecting with the stock market [FL].
Now, what in the stock market does matter to people? Well in India, does not matter
much. We do not go much in the stock market investment, some of us are doing it, but in
western countries they always invest in the stock market. They go for a lot of speculative
investments, it is called speculative investment where the risks associated, because today
you have to invest money. Tomorrow prices shrink, prices fall, you lose money because
you cannot sell them at the higher price. You bought them at the higher price, now you
are trying to sell them at a lower price, you make a capital loss.
So, open all these elements which were not there. So, I had to go through this, so what I
am trying to tell you imaging that the country has an assets market. In the assets there
can be various kinds of assets or wealth, people would hold with surplus money. They
have say savings, they have beyond their transaction needs, alright? They can hold
simplest, they can buy ornaments, jewelry, gold. They can put in the bank which they do,
the poor people they do not buy ornaments, they put whatever little money in a bank
account. The more sophisticated organized people would go into the stock market, they
invest in the stock market to make more money.
They make, they become more greedy, they want to make more money on it. They are
more energetic, they are more speculative they are more risk takers. They have so much,
if they lose something it does not matter to them. So, they go into risk taking activities,
put in the money in the stock market bonds are much safer, because bonds always
promise what is the interest payment. That they will give you and what is the life of the
bond share market [FL], high share price, low share price [FL], capital gain. Another one
is the dividend income. If the company makes profit then only you get dividend income,
that too depends upon of type of shares you buy. All shares do not have the equal
dividend income preference, shares have a high dividend income, Alright?
So, even if the equity share holders, common share holders do not make any dividend,
preference share holders will get an income. But if the company makes a lot of income
then the preference share holder still would get that fixed income, but the other
shareholders will get a lot of income.
So, you have a choice whether you buy the common shares or preference shares. So,
shares are also of not of same types, bonds are safer people say because bonds have a
fixed life. Usually bonds are issued by governments or government organizations. They
are secured, they are backed by government. So, it is safer to do that, but remember
private companies also issue bonds, private companies also issue bonds.
So, it becomes complicated and more complicated, the macro model is becoming more
complicated, but we have to live with it. All I have done with this background story.
Now, when I go in the IS LM model, I will not have the stock market in the front. They
will be in the background, I will have only the goods market and the money market in
the front. So, life would not be that complicated, but right now it is quite complicated.
Next thing a couple of question came during the break.
Student: Sir what is money supply? How does money supply change?
In these two equations you see the N M naught, I have assumed to be a constant and M
naught, forget about M D naught. I should ignore that demand for money, let it be a
variable, a supply of money, suppose that is constant, alright? So, supply of money and
supply of non money at any point of time. In this kind of a static framework let us
assume that to be constant, that is fixed.
Now, the question is what is money? Non money you understand say that the shares
bonds etcetera, gold property whatever is available in the market. Suppose, you take the
non money, suppose you take the money, what is money? In simplest term, money is
money in circulation with the people not even in circulation money with cash with
people.

So, the money that you have in your pocket companies treasury [FL] individuals pocket,
[FL] that is cash and the simplest definition of money called M 1 in India. Also adds the
demand deposits, what are the demand deposits. The money which is put in bank, but can
be demanded any time, you want which are our for instance savings accounts. In savings
accounts money is kept there, it is safe you can demand it any time. You want today,
even you can go to a machine and withdraw even telling the bank. Earlier we had to go
the way, I withdraw money, write a check or fill in the slip which is available in the bank
and withdraw cash from my account. These are savings accounts as opposed to fixed
deposit accounts where they are constant, alright? Clear?
So, these are the things, you have non money assets and money. Money to be constant,
but you can go to higher definition of money. For instance, M 2, M 3, M 4 there are
numbers where it gets much more complicated. It is not the liquidity which is which
matters so much, it is number of items you include them.
So, in M 3 for instance you have all fixed deposit money also included, but is it really
money. The way I am talking about money, no that money you cannot use for transaction
purposes. In a fixed deposit account, if you put money it will be very difficult to
withdraw the money, alright? It will become very difficult to withdraw the money
overnight, it takes time and you lose a lot of interest income.
So, in the context of the macro model, the simplest definition of money would be M 1
which is money with the public cash, with people plus demand deposit account money in
banks. Let me tell you about one thing here which is not very important. There is another
concept of demand for money, which we usually ignore. One is transactional demand for
money, one is speculative demand for money and another one very little work has been
done, but people do talk about. That is precautionary demand for money, precautionary
demand for money where precautionary demand for money is the basically say the
person what it says is the money that people keep for precautionary purposes.
Suppose, there is an extra need for cash, may be used for transaction purposes, not
speculative at all. Suppose, somebody falls ill at home, I will need some cash for the
hospital bill. So, I keep some cash aside in case of there, is in case there is an emergency.
In case there is an unexpected something.

So, that demand for money also exists in the literature called precaution demand for
money, but in these macro models usually we do not bring in precaution demand for
money. One can say precaution demand for money can be just added to the transaction
demand for money, it is all underneath that its transaction demand has two parts. One is
what I need now for transaction purposes and one portion is what I would require in
future for transaction purposes, alright? Clear? So, that is the precaution demand for
money we have.
Now, ignoring precaution demand for money, now let me get into the IS LM model,
again back to my original ground where I wish to be I am going to ignore all this, but I
will keep this diagram. Now, precaution demand for money I need not bring, but I hope
this diagram is clear. Now, notice one thing.
(Refer Slide Time: 58:09)
If I draw a function like IS on the r Y plane, but what do I get from the money market?
What kind of relationship, suppose y increases, suppose y increases what will happen to
this line h Y 1, h is a constant. So, h Y 1 would shift through the right, so h Y 1 line will
shift to the right. Then the l r line will be added and I have the new demand for money,
so the l r line would be added. New demand for money, supply of money is constant.
So, the money market reaches equilibrium at the higher interest rate r 1. So, higher Y 1 is
associated with the higher r 1 for money market equilibrium, clear? So, we can have a
line here which will show a function like this, where r increases and Y increases to keep
the money market in equilibrium. L is the notation they used to use for demand for
money and M is the notation they used to use for supply of money, alright? This is drawn
for a given amount of supply of money M naught over P naught.
This is drawn for a given amount of supply of money M naught over P naught, look M
naught over P naught is constant money supply [FL] [fl] M S over P naught is nothing
but M naught over P naught. This is m naught over P naught, this is constant. Now, if Y
falls, this line would shift backwards.
So, the intersecting point with the supply of money have a lower interest rate. So, Y and r
are moving in the same direction for money market equilibrium. This L M function
basically says that every point on the L M is every point on the L M is an equilibrium
point. In the sense, that is M naught over P naught is equal to M D. How did I write M D
naught over P naught, supply of money is equal to demand for money.
So, there is money market equilibrium at every point of the L M, all right? Okay? There
is money market equilibrium on every point on L M. Now, you take a point like a for
money market equilibrium, what do we need? We can correct the disequilibrium which
exist because it is off the L M. There is a disequilibrium, we can correct the
disequilibrium either by lowering the rate of interest or by increasing output or a
combination may be or a combination. What does it mean? What kind of disequilibrium
you have, where rate of interest need to come down. We know there is an inverse
relationship of circulated demand with rate of interest.
So, by lowering rate of interest I am going to increase speculative demand for money,
that means I am trying to increase demand for money. That means we have an excess
supply situation. So, there is a point at a where we have excess supply in the money
market, in a money market excess supply in a money market. Similarly, if you have a
point B for equilibrium, what we need is rate of interest go up and output to fall. That is
we need to reduce demand output fall, means transaction demand from money would
fall, rate of interest increase, means speculative demand from money would fall. The
demand from money would fall.
So, we have an excess demand at B, we have excess demand for money. So, we have
excess demand for money, all right? Then we reach equilibrium, okay? Is the diagram all
right? This is called L M function, L means liquidity, L demands for money, M means
supply of money. In simple notations L M means supply is equal to demand money
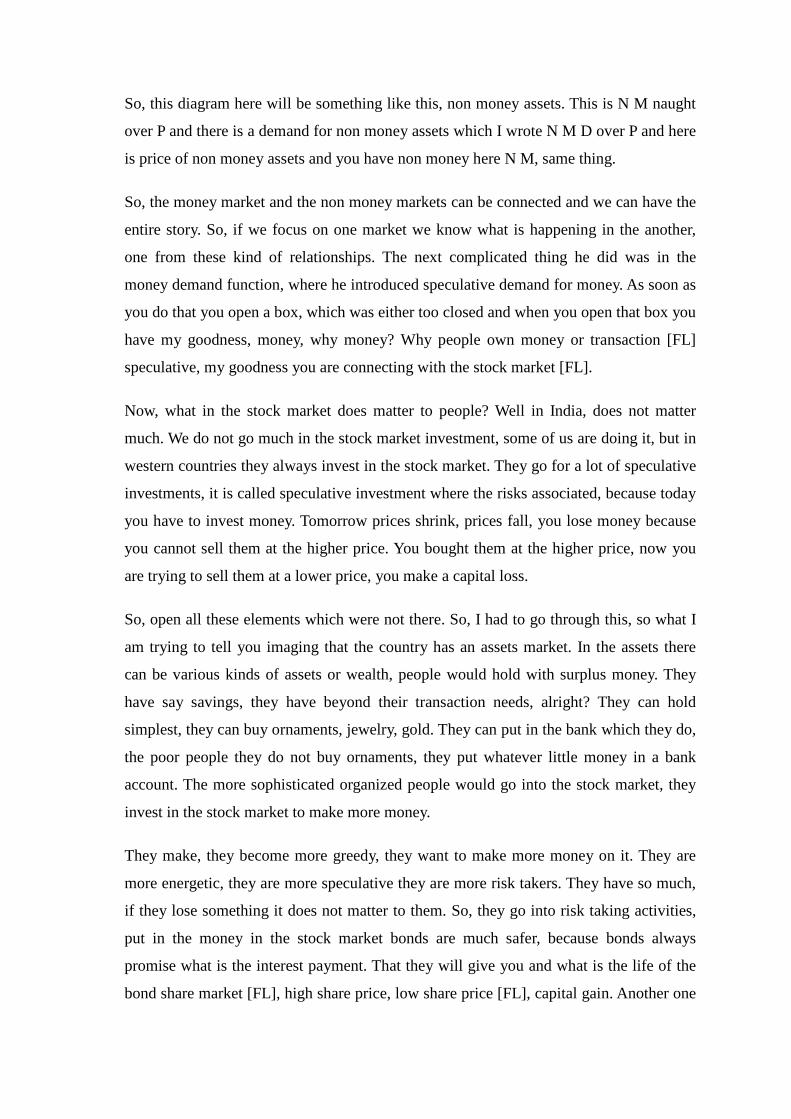
market equilibrium condition we get. What would be the slope of the L M function?
(Refer Slide Time: 01:03:49)
The L M function is m not over P naught. The supply of money is equal to h Y plus l r,
where h lies between 0 and 1, l r is negative. What will be the slope of the function d r d
Y, how much is d r d Y? How much is d r d Y? How much is d r d y? Very good, minus h
over l r which is greater than 0. What would happen if money supply increases? P is
constant, M naught increases, what will happen to the line? The slope will not get
affected, there is no M component here, but if money supply increases what would
happen to the line? Look at the diagram. There come to the diagram, here if money
supply increases to the right what do happens take any one demand function, rate of
interest falls [FL].
So, when L M curve shifts, the rate of interest should be falling for a given level of Y. Y
is fixed money, supply increases rate of interest in the market falls. That means this line
for a given value of Y will have a lower interest rate. So, the L M curve is sifting to the
right, if money supply increases than the L M curve will shift like this. If money supply
increases what is saying same amount of Y, there will be a lower interest rate for a
money market equilibrium, which means we are lying to the bottom below beneath the
old L M, when money supply increases.

If money supply decreases you can see that it will shift upwards without any change in
slope is a parallel shift. It will be a parallel shift if money supply increases and decreases
there will be a parallel shifts. If money supply increases, it is a rightward shift, if money
supply decreases it will be a leftward shift. You clear that money market disequilibrium,
clear? Y is always measure as output and income, same thing why they presence both
output and real income, beg your pardon. Point B excess demand from money we need to
reduce excess demand. If there is excess demand, it has to go for equilibrium.
So, either interest rate will go up in which case certainly demand will decrease or if Y
decreases less income is in the economy, people will have a smaller transaction demand
for money. Demand for money has two components, come here demand for money is
this right hand side. It has two components, either this factor will come down by
increasing r or this factor can come down. Excess demand by decreasing Y h is constant.
So, the movements of the variables in terms r, it will be upwards in terms of Y, it will be
this wards. Now, there can be a trajectory in between, if both the variables are changing
one is upwards, one is leftwards and a combination will be in between somewhere. The
line may go individually, r will go up and Y will go this way, but combination in the
economy may travel.
Suppose, the economy is at D, the economy may travel in between somewhere is a some
combination of our Y, change just how the economy travels like a comet traveling in a
sky. There is a pull from Venus, there is a pull from the Sun. If one of those pulls are not
there it will have one trajectory. If both the pulls are there, gravitational pulls then it
takes a combination of the pulls and it has a particular path. This is what I am saying,
clear?
So, this kind of an adjustment go on, remember below L M curve you have excess
demand for money, above L M curve you have excess supply of money. If money supply
increases, real money supply same thing will happen such as M naught is constant, but P
declines. What could happen M over P increases, means real money supply increases.
Again L M will shift to the right, just the way when M increases it shifts to the right with
P constant.

Similarly, M constant but P falling which shift the line to the right, the same thing will
happen because it depends upon the ratio value M over P. So, either M can change or P
can change [FL], clear? Everybody clear? Now, comes the moral therefore.
(Refer Slide Time: 01:09:19)
So, the IS LM more we have both the functions. Now, IS LM model therefore the IS
equation represents the goods market which is something like this. The LM function
represents, the money market is a fixed price model. Remember M naught over P naught
is equal to h Y plus l r. Now, this IS LM, therefore is a simultaneous equation model like
a demand supply model. The demand curve there and the supply curve there together a
simultaneous two equations simultaneous equations system would solves for two
unknowns X and Y. What are the X and Y? Here, one is output Y, other one is interest
rate r.
So, what you recently saying here is that given all the assumptions that you have is that
we have two equation model. I have an IS equation, I have a L M equation and they
intersect to determine the equilibrium value of r, call that r star and the equilibrium value
of Y, call that Y star r star and Y star two equilibrium values. Two equation to unknown I
can get before I go into multiply, I have an two equation model. This is the most
important model that you are studying, right?
Now, there would not be any more important addition, except labor market coming in for
the kinship complete model. My job is coming to an end in some sense, because I am

giving you the most important part of the macro economics course right now. Now, you
can see here that essentially it can have a zone 1, a zone 2, a zone 3 and a zone 4, it can
essentially have four zones or disequilibrium [FL]. Now, I want to do an exercise in
terms of how much you have understood.
(Refer Slide Time: 01:12:06)
Say, I take zone 1, zone 1 [FL] goods market [FL] [FL], what kind of disequilibrium is
there in goods market zone. One what you require in zone is the rate of interest to come
down or output to fall to reach equilibrium. Suppose, you are here in zone 1, so it should
be a movement in this direction Y. In this direction and r in this direction in zone 1 for
the goods market, which means you are lowering output or rate of interest going down,
means increasing investment, you have excess supply.
So, in goods market you have excess supply, in zone 1 Y is greater than D. So, the money
market below money market, we just told you, you have rate of interest should go up and
you have an excess demand. So, for the money market you have you have M over P M
naught over P naught less than the demand for money. I am unfortunately, I have used m
D, but any way let us use M D. It should be, it should have been L, the notation should
been have 1 any way M D over P. The notation should have been l it because it is an L M
curve, L represents the demand for money M D over P is usually the notation you will
find in books, you can use if you wish.
So, money market now if goods markets correction requires rate of interest going down,
money market correction does not require that money market correction requires rate of
interest should go up, but both the market requires Y to fall. So, it becomes a confusion,
one market requires rate of interest to come down, one market requires rate of interest to
go up. So, it becomes a confusion. All right now here comes an additional thing which I
did not tell you, but now I am going to tell you.
Since, we have two markets, we can specify given economic behavior that is absorbed
usually as to out of this two variables Y and r. That we are looking for their equilibrium
values which variable response primarily to up specific market. If in the goods market
supply is more than demand companies get an unintended inventory positive change.
So, they would reduce output, so one would expect that the goods market disequilibrium
would immediately affect or will eventually effect the supply of output. So, Y change is
the variable that one would adjust in the money market. There is excess demand for
money, if there is excess demand for money and supply is less, then banks will see the
they have less money in their accounts. They can rise their interest rate and attract more
money into bank account because there is excess demand for money supply, less they
have less supply of money to give out to loans, they can increase interest rate.
So, if there is excess demand for money, the rate of interest can be a variable that can
adjust to money market disequilibrium. If there is excess demand for money, the rate of
interest can adjust to money market disequilibrium. It is more common sense if there is
excess demand for money, that means the speculative demand for money is lot high
given an output level and transaction demand. Suppose, then what you are saying that the
speculative balance is high. Therefore, what you expect, you want the speculative
balance to go down.
So, the people can put the money in back into banks or in the stock market. So, the price
of stock should come down and bank deposit should go up for banks convenience. So,
rate of interest can be conveniently increase, banks can start increase rate of interest to
attract more money in the fixed deposit account, saving accounts, etcetera.
So, rate of interest is the variable that will adjust to money market disequilibrium. If that
is true then at a position here below L M when you have demand for money more than
supply of money. We would expect the rate of interest to climb upwards and when you

have more output supplied then what the demand for output is we would expect
companies to reduce output. So, the rate of in rate of output decline is in this direction.
The question is do we reach IS curve? We will reach LM first, I can see. We will reach
here if we go this path IS much later, alright?
Now, come to zone 2. In zone 2 what you have in zone 2, you have a goods market
problem in terms of its above IS curve. So, output should fall, you still have output
greater than demand supply greater than demand, but in the money market what you
have supply of money is now above LM. So, supply of money is now greater than
demand for money, supply of money is greater than demand for money in zone 2 you
above LM. If supply of money is more here, the rate of interest would be falling and
output would be shrinking again, because supply of goods is more than demand for
goods.
So, here you would have rate of interest falling and the output level moving in that
direction. In zone 3 what you have the goods market will be in zone 3, you are below IS.
So, output should fall, so supply of output, no output should increase supply of output is
now less than demand. So, output should increase and the money market you have a
situation which is above LM which is supply of money is greater than demand for
money, supply of money is greater than demand for money.
So, supply of output less than demand means output should increase. So, in a zone like
this output will be increasing and rate of interest should be falling to reach equilibrium.
Check this out, this is called a phase diagram, check it out.
Now, in zone 4 finally you have again [FL]. So, Y is less than D, but you are below LM.
So, you have reversed the situation M naught over P naught is now less than supply of
money is less than demand for money, M D over P naught, supply of money is less than
demand for money. So, output is less than D means output should increase, company
should increase output and you are below L M which is supply less than demand. The
first case, rate of interest should go up. So, here rate of interest should go up.
So, what you see in this zone 1, 2, 3 and 4 the movement of the two variables on the
basis of the assumption that output is responding to goods market disequilibrium and rate
of interest is responding to money market disequilibrium. You will see that you will have
various combinations of movements in r and Y is this part, clear? For equilibrium to be
stable, suppose you are in a disequilibrium situation where you reach equilibrium, where
is the equilibrium? Equilibrium is right here in the middle.
So, the question is whether you reach equilibrium and you are in any of this unstable or
disequilibrium regions? I should not say unstable disequilibrium regions, if you are any
in any of these disequilibrium regions, question is do you reach equilibrium?
Theoretically speaking given these movements, well you see suppose I start at zone 1,
what happens I get a trajectory like that. Then I go to zone 2, I get a trajectory, 2
variables moving like that combination of that. Then I go to zone 3, I get a trajectory like
that. Then I get trajectory like question is in this circular fashion, do I reach equilibrium?
There is a possibility I will reach equilibrium.
The two movements are throwing the economy from one region to another region over a
period of time moving like this. Although, it is a static model, there is a possibility I will
reach equilibrium, alright? There is a possibility that I will reach equilibrium. So, I gone
from zone 1 where output reduction was there to rate of interest increase to zone 2,
output reduction is still continuing, but rate of interest is now falling to zone 3 output.
Now, increasing not reducing to rate of in reduction still continuing, interest rate
reductions to zone 4, output is still increasing, rate of rate of interest is increasing. So,
you may question about this. Well, theoretically it looks like a nice phase diagram and
there is a possibility of equilibrium. The model is stable, but the problem is does output
increase and decrease like that like it increases for a while and decreases after a while
and then shifts to increasing and then shifts to decreasing. Well, people say output
adjustments are very slow.
So, usually output adjustment that I have shown will be coming very slowly and people
also say that economists that rate of interest adjustments are very quick, much more
flexible. It can go up 1 percentage point, 6 months later it can go down to 2 percentage
point, you know it can keep on doing it rate of interest adjustments, but output does not
do that, companies would have hell if they have to go through like this.
So, the equilibrium path or the path to equilibrium is not necessarily that oscillatory, the
way I have drawn it, but the for the purpose of elaborating the model. The possible
features I have done it, but the actual equilibrium path may not be oscillatory. Actual

equilibrium may very well be that if we are in a zone, from there if the stable I have a
linear and non-linear line close by passing through the equilibrium point.
So, I hit that line and then gradually climb down like a ladder or if there is a ladder here
too, I climb up the ladder from this zone. The equilibrium path is like line, jagged line
nearing the equilibrium point passing through the equilibrium point close to where I am.
So, I somehow manage to climb up to the ladder or crawl to the ladder and then along the
ladder I smoothly go down or go up to the equilibrium point. It is not oscillatory like this
people say that, alright?
So, it requires a lot more mathematical analysis, lot more data collection as to how the
economy behaves. Our point is not going to possibilities, our point is to go into a few
exercises which are theoretical exercises. This is a theory course, macroeconomic theory
with some applications. Perhaps whether we can use this to understand when our finance
minister speaks about the economy or there is a discussion on TV or there is a famous
economist who visits campus giving a lecture.
You listen to him how, what kind of a macroeconomic issues are involved in the world.
Today may be Europe, who knows European economy. Why is it trouble then you start
thinking [FL], we learned that IS LM model and that model. This model does any of
these model explain what these saying, if it starts explaining then you feel good and
confident. You can ask him questions, sir why did you say that because the model I have
in mind does not explain. What he is saying then you add to your knowledge.
So, my objective here is to make you acquainted with some important tools to what you
will be doing something else, but one day it might be handy may be to some of you. So,
the point I am trying to raise here is that the adjustments that I said, that the inventory
adjustments and the money market disequilibrium through rate of interest and the in the
goods market need not be like this. Who knows what the path is, but our issue
theoretically speaking is this equilibrium stable.
So, now algebraically my next, tomorrow what I will show you is algebraically I would
like to prove that the IS LM model which is written here. Only simple two equations,
does it contain enough properties to be mathematically stable. So, the question is sir you
will ask me what are the stability conditions, mathematical stability conditions, our two
equations simultaneous equations model. It will be general, it will not be just IS LM, I

will say well the stability conditions will be based on certain behavioral assumptions I
will make. So, tomorrow I will do that which I started today diagrammatically.
Tomorrow I will conclude this part and then I will go into the algebra, the multiplies and
the complications.


![Rasterization - University of Southern Californiarun.usc.edu/cs420-s14/lec13-rasterization/13-rasterization.pdfRasterization Scan Conversion Antialiasing [Ch 7.8-7.11, 8.9-8.12] 2](https://img.pdfslide.us/doc/110x75/5ad6e3997f8b9a9d5c8b6952/rasterization-university-of-southern-scan-conversion-antialiasing-ch-78-711.jpg)