Embed Size (px)
Citation preview
JPMorgan Chase & Co. / 2007 Annual Report 27
Card ServicesWith 155 million cards in circulation and more than $157 billion inmanaged loans, Card Services (“CS”) is one of the nation’s largestcredit card issuers. Customers used Chase cards to meet more than$354 billion worth of their spending needs in 2007.
With hundreds of partnerships, Chase has a market leadership positionin building loyalty programs with many of the world’s most respectedbrands. The Chase-branded product line was strengthened in 2007 withenhancements to the popular Chase Freedom Program, which has gen-erated more than one million new customers since its launch in 2006.
Chase Paymentech Solutions, LLC, a joint venture between JPMorganChase and First Data Corporation, is a processor of MasterCard andVisa payments, which handled more than 19 billion transactions in2007.
Commercial BankingCommercial Banking (“CB”) serves more than 30,000 clients nationally,including corporations, municipalities, financial institutions and not-for-profit entities with annual revenue generally ranging from $10 millionto $2 billion. Commercial Banking delivers extensive industry knowledge,local expertise and a dedicated service model. In partnership with theFirm’s other businesses, it provides comprehensive solutions includinglending, treasury services, investment banking and asset managementto meet its clients’ domestic and international financial needs.
Treasury & Securities Services Treasury & Securities Services (“TSS”) is a global leader in transaction,investment and information services. TSS is one of the world’s largestcash management providers and a leading global custodian. TreasuryServices (“TS”) provides cash management, trade, wholesale card andliquidity products and services to small and mid-sized companies,multinational corporations, financial institutions and government enti-ties. TS partners with the Commercial Banking, Retail FinancialServices and Asset Management businesses to serve clients firmwide.As a result, certain TS revenue is included in other segments’ results.Worldwide Securities Services (“WSS”) holds, values, clears and serv-ices securities, cash and alternative investments for investors and bro-ker-dealers, and manages depositary receipt programs globally.
Asset ManagementWith assets under supervision of $1.6 trillion, Asset Management(“AM”) is a global leader in investment and wealth management. AMclients include institutions, retail investors and high-net-worth individu-als in every major market throughout the world. AM offers globalinvestment management in equities, fixed income, real estate, hedgefunds, private equity and liquidity, including both money market instru-ments and bank deposits. AM also provides trust and estate and bank-ing services to high-net-worth clients, and retirement services for cor-porations and individuals. The majority of AM’s client assets are inactively managed portfolios.
INTRODUCTION
JPMorgan Chase & Co., a financial holding company incorporatedunder Delaware law in 1968, is a leading global financial services firmand one of the largest banking institutions in the United States ofAmerica (“U.S.”), with $1.6 trillion in assets, $123.2 billion in stock-holders’ equity and operations worldwide. The Firm is a leader ininvestment banking, financial services for consumers and businesses,financial transaction processing and asset management. Under theJPMorgan and Chase brands, the Firm serves millions of customers inthe U.S. and many of the world’s most prominent corporate, institu-tional and government clients.
JPMorgan Chase’s principal bank subsidiaries are JPMorgan ChaseBank, National Association (“JPMorgan Chase Bank, N.A.”), anational banking association with branches in 17 states; and ChaseBank USA, National Association (“Chase Bank USA, N.A.”), anational bank that is the Firm’s credit card issuing bank. JPMorganChase’s principal nonbank subsidiary is J.P. Morgan Securities Inc.,the Firm’s U.S. primary investment banking firm.
JPMorgan Chase’s activities are organized, for management reportingpurposes, into six business segments, as well as Corporate. The Firm’swholesale businesses comprise the Investment Bank, CommercialBanking, Treasury & Securities Services and Asset Management seg-ments. The Firm’s consumer businesses comprise the Retail FinancialServices and Card Services segments. A description of the Firm’s busi-ness segments, and the products and services they provide to theirrespective client bases, follows.
Investment Bank JPMorgan is one of the world’s leading investment banks, with deepclient relationships and broad product capabilities. The InvestmentBank’s clients are corporations, financial institutions, governments andinstitutional investors. The Firm offers a full range of investment bank-ing products and services in all major capital markets, including advis-ing on corporate strategy and structure, capital raising in equity anddebt markets, sophisticated risk management, market-making in cashsecurities and derivative instruments and research. The InvestmentBank (“IB”) also commits the Firm’s own capital to proprietary invest-ing and trading activities.
Retail Financial Services Retail Financial Services (“RFS”), which includes the RegionalBanking, Mortgage Banking and Auto Finance reporting segments,serves consumers and businesses through bank branches, ATMs,online banking and telephone banking. Customers can use morethan 3,100 bank branches (fourth-largest nationally), 9,100 ATMs(third-largest nationally) and 290 mortgage offices. More than13,700 branch salespeople assist customers with checking and sav-ings accounts, mortgages, home equity and business loans andinvestments across the 17-state footprint from New York to Arizona.Consumers also can obtain loans through more than 14,500 autodealerships and 5,200 schools and universities nationwide.
This section of the Annual Report provides management’s discussionand analysis (“MD&A”) of the financial condition and results ofoperations of JPMorgan Chase. See the Glossary of terms on pages181–183 of definitions of terms used throughout this Annual Report.The MD&A included in this Annual Report contains statements thatare forward-looking within the meaning of the Private SecuritiesLitigation Reform Act of 1995. Such statements are based upon thecurrent beliefs and expectations of JPMorgan Chase’s management
and are subject to significant risks and uncertainties. These risks anduncertainties could cause JPMorgan Chase’s results to differ materiallyfrom those set forth in such forward-looking statements. Certain ofsuch risks and uncertainties are described herein (see Forward-lookingstatements on page 101 of this Annual Report) and in the JPMorganChase Annual Report on Form 10-K for the year ended December 31,2007 (“2007 Form 10-K”), in Part I, Item 1A: Risk factors, to whichreference is hereby made.
MANAGEMENT’S DISCUSSION AND ANALYSISJPMorgan Chase & Co.
28 JPMorgan Chase & Co. / 2007 Annual Report
MANAGEMENT’S DISCUSSION AND ANALYSISJPMorgan Chase & Co.
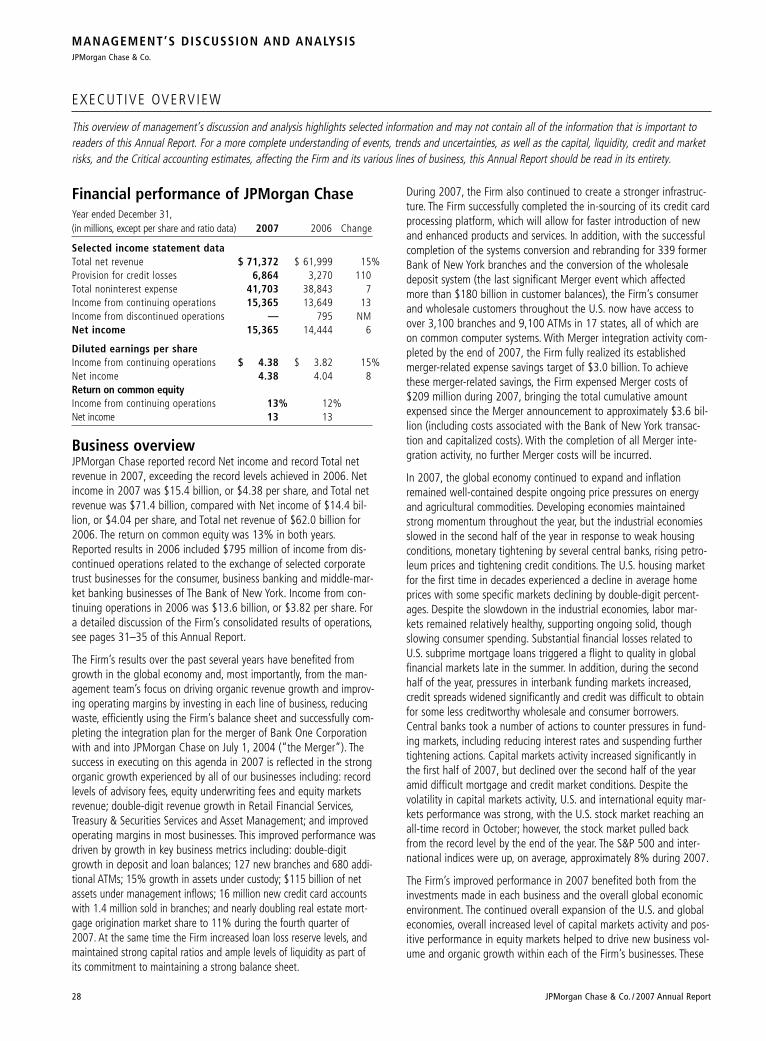
Business overviewJPMorgan Chase reported record Net income and record Total netrevenue in 2007, exceeding the record levels achieved in 2006. Netincome in 2007 was $15.4 billion, or $4.38 per share, and Total netrevenue was $71.4 billion, compared with Net income of $14.4 bil-lion, or $4.04 per share, and Total net revenue of $62.0 billion for2006. The return on common equity was 13% in both years.Reported results in 2006 included $795 million of income from dis-continued operations related to the exchange of selected corporatetrust businesses for the consumer, business banking and middle-mar-ket banking businesses of The Bank of New York. Income from con-tinuing operations in 2006 was $13.6 billion, or $3.82 per share. Fora detailed discussion of the Firm’s consolidated results of operations,see pages 31–35 of this Annual Report.
The Firm’s results over the past several years have benefited fromgrowth in the global economy and, most importantly, from the man-agement team’s focus on driving organic revenue growth and improv-ing operating margins by investing in each line of business, reducingwaste, efficiently using the Firm’s balance sheet and successfully com-pleting the integration plan for the merger of Bank One Corporationwith and into JPMorgan Chase on July 1, 2004 (“the Merger”). Thesuccess in executing on this agenda in 2007 is reflected in the strongorganic growth experienced by all of our businesses including: recordlevels of advisory fees, equity underwriting fees and equity marketsrevenue; double-digit revenue growth in Retail Financial Services,Treasury & Securities Services and Asset Management; and improvedoperating margins in most businesses. This improved performance wasdriven by growth in key business metrics including: double-digitgrowth in deposit and loan balances; 127 new branches and 680 addi-tional ATMs; 15% growth in assets under custody; $115 billion of netassets under management inflows; 16 million new credit card accountswith 1.4 million sold in branches; and nearly doubling real estate mort-gage origination market share to 11% during the fourth quarter of2007. At the same time the Firm increased loan loss reserve levels, andmaintained strong capital ratios and ample levels of liquidity as part ofits commitment to maintaining a strong balance sheet.
During 2007, the Firm also continued to create a stronger infrastruc-ture. The Firm successfully completed the in-sourcing of its credit cardprocessing platform, which will allow for faster introduction of newand enhanced products and services. In addition, with the successfulcompletion of the systems conversion and rebranding for 339 formerBank of New York branches and the conversion of the wholesaledeposit system (the last significant Merger event which affectedmore than $180 billion in customer balances), the Firm’s consumerand wholesale customers throughout the U.S. now have access toover 3,100 branches and 9,100 ATMs in 17 states, all of which areon common computer systems. With Merger integration activity com-pleted by the end of 2007, the Firm fully realized its establishedmerger-related expense savings target of $3.0 billion. To achievethese merger-related savings, the Firm expensed Merger costs of$209 million during 2007, bringing the total cumulative amountexpensed since the Merger announcement to approximately $3.6 bil-lion (including costs associated with the Bank of New York transac-tion and capitalized costs). With the completion of all Merger inte-gration activity, no further Merger costs will be incurred.
In 2007, the global economy continued to expand and inflationremained well-contained despite ongoing price pressures on energyand agricultural commodities. Developing economies maintainedstrong momentum throughout the year, but the industrial economiesslowed in the second half of the year in response to weak housingconditions, monetary tightening by several central banks, rising petro-leum prices and tightening credit conditions. The U.S. housing marketfor the first time in decades experienced a decline in average homeprices with some specific markets declining by double-digit percent-ages. Despite the slowdown in the industrial economies, labor mar-kets remained relatively healthy, supporting ongoing solid, thoughslowing consumer spending. Substantial financial losses related toU.S. subprime mortgage loans triggered a flight to quality in globalfinancial markets late in the summer. In addition, during the secondhalf of the year, pressures in interbank funding markets increased,credit spreads widened significantly and credit was difficult to obtainfor some less creditworthy wholesale and consumer borrowers.Central banks took a number of actions to counter pressures in fund-ing markets, including reducing interest rates and suspending furthertightening actions. Capital markets activity increased significantly inthe first half of 2007, but declined over the second half of the yearamid difficult mortgage and credit market conditions. Despite thevolatility in capital markets activity, U.S. and international equity mar-kets performance was strong, with the U.S. stock market reaching anall-time record in October; however, the stock market pulled backfrom the record level by the end of the year. The S&P 500 and inter-national indices were up, on average, approximately 8% during 2007.
The Firm’s improved performance in 2007 benefited both from theinvestments made in each business and the overall global economicenvironment. The continued overall expansion of the U.S. and globaleconomies, overall increased level of capital markets activity and pos-itive performance in equity markets helped to drive new business vol-ume and organic growth within each of the Firm’s businesses. These
EXECUT IVE OVERVIEW
This overview of management’s discussion and analysis highlights selected information and may not contain all of the information that is important toreaders of this Annual Report. For a more complete understanding of events, trends and uncertainties, as well as the capital, liquidity, credit and marketrisks, and the Critical accounting estimates, affecting the Firm and its various lines of business, this Annual Report should be read in its entirety.
Financial performance of JPMorgan ChaseYear ended December 31,(in millions, except per share and ratio data) 2007 2006 Change
Selected income statement dataTotal net revenue $ 71,372 $ 61,999 15%Provision for credit losses 6,864 3,270 110Total noninterest expense 41,703 38,843 7Income from continuing operations 15,365 13,649 13Income from discontinued operations — 795 NMNet income 15,365 14,444 6
Diluted earnings per shareIncome from continuing operations $ 4.38 $ 3.82 15%Net income 4.38 4.04 8Return on common equityIncome from continuing operations 13% 12%Net income 13 13
JPMorgan Chase & Co. / 2007 Annual Report 29
benefits were tempered by the capital markets environment in thesecond half of the year and the continued weakness in the U.S.housing market. The Investment Bank’s lower results were significantlyaffected by the uncertain and extremely volatile capital markets envi-ronment, which resulted in significant markdowns on leveraged lend-ing, subprime positions and securitized products. Retail FinancialServices reported lower earnings, reflecting an increase in theProvision for credit losses and higher net charge-offs for the homeequity and subprime mortgage loan portfolios related to the weakhousing market. Card Services earnings also decreased driven by anincreased Provision for credit losses, reflecting a higher level of netcharge-offs. The other lines of business each posted improved resultsversus 2006. Asset Management, Treasury & Securities Services andCommercial Banking reported record revenue and earnings in 2007,and Private Equity posted very strong results.
The discussion that follows highlights the performance of each busi-ness segment compared with the prior year, and discusses results on a managed basis unless otherwise noted. For more informationabout managed basis, see Explanation and reconciliation of theFirm’s use of non-GAAP financial measures on pages 36–37 of thisAnnual Report.
Investment Bank net income decreased from the prior year, drivenby lower Total net revenue and a higher Provision for credit losses. Thedecline in Total net revenue was driven by lower Fixed Income Marketsrevenue due to markdowns on subprime positions, including subprimecollateralized debt obligations (“CDOs”); markdowns on leveragelending funded loans and unfunded commitments; markdowns insecuritized products on nonsubprime mortgages and weak credit trading performance. Partially offsetting the decline in revenue werestrong investment banking fees, driven by record advisory and recordequity underwriting fees; record Equity Markets revenue, which bene-fited from strong client activity and record trading results; and recordrevenue in currencies and strong revenue in rates. The Provision forcredit losses rose due to an increase in the Allowance for credit losses,primarily resulting from portfolio activity, which included the effect ofthe weakening credit environment, and portfolio growth.
Retail Financial Services net income declined compared with theprior year. Growth in Total net revenue was more than offset by a sig-nificant increase in the Provision for credit losses and higher Totalnoninterest expense. The increase in Total net revenue was due tohigher net mortgage servicing revenue; higher deposit-related fees;the absence of prior-year losses related to mortgage loans transferredto held-for-sale; wider spreads on loans; and higher deposit balances.Revenue also benefited from the Bank of New York transaction andthe classification of certain mortgage loan origination costs asexpense due to the adoption of SFAS 159. The increase in theProvision for credit losses was due primarily to an increase in theAllowance for loan losses related to home equity loans and subprimemortgage loans, as weak housing prices throughout the year resultedin an increase in estimated losses for both categories of loans.Total noninterest expense increased due to the Bank of New Yorktransaction, the classification of certain loan origination costs asexpense due to the adoption of SFAS 159 (“Fair Value Option”),investments in the retail distribution network and higher mortgageproduction and servicing expense. These increases were offset partiallyby the sale of the insurance business.
Card Services net income declined compared with the prior yeardue to an increase in the Provision for credit losses, partially offset byTotal net managed revenue growth and a reduction in Total noninter-est expense. The growth in Total net managed revenue reflected ahigher level of fees, growth in average loan balances and increasednet interchange income. These benefits were offset partially by nar-rower loan spreads, the discontinuation of certain billing practices(including the elimination of certain over-limit fees and the two-cyclebilling method for calculating finance charges) and the effect of higherrevenue reversals associated with higher charge-offs. The Managedprovision for credit losses increased primarily due to a higher level ofnet charge-offs (the prior year benefited from the change in bank-ruptcy legislation in the fourth quarter of 2005) and an increase inthe allowance for loan losses driven by higher estimated net charge-offs in the portfolio. Total noninterest expense declined from 2006,primarily due to lower marketing expense and lower fraud-relatedexpense, partially offset by higher volume-related expense.
Commercial Banking posted record net income as record Total netrevenue was offset partially by a higher Provision for credit losses.Total net revenue reflected growth in liability balances and loans,increased deposit-related fees and higher investment banking rev-enue. These benefits were offset partially by a continued shift to nar-rower-spread liability products and spread compression in the loanand liability portfolios. The Provision for credit losses increased fromthe prior year, reflecting portfolio activity, including slightly lowercredit quality, as well as growth in loan balances. Total noninterestexpense decreased slightly, as lower compensation expense was off-set by higher volume-related expense related to the Bank of NewYork transaction.
Treasury & Securities Services generated record net income driv-en by record Total net revenue, partially offset by higher Total nonin-terest expense. Total net revenue benefited from increased productusage by new and existing clients, market appreciation, wider spreadsin securities lending, growth in electronic volumes and higher liabilitybalances. These benefits were offset partially by spread compressionand a shift to narrower-spread liability products. Total noninterestexpense increased due primarily to higher expense related to businessand volume growth, as well as investment in new product platforms.
Asset Management produced record net income, which benefitedfrom record Total net revenue, partially offset by higher Total nonin-terest expense. Total net revenue grew as a result of increased assetsunder management, higher performance and placement fees, andhigher deposit and loan balances. Total noninterest expense was up,largely due to higher performance-based compensation expense andinvestments in all business segments.
Corporate net income increased from the prior year due primarilyto increased Total net revenue. Total net revenue growth was drivenby significantly higher Private Equity gains compared with the prioryear, reflecting a higher level of gains and the change in classifica-tion of carried interest to compensation expense. Revenue also bene-fited from a higher level of security gains and an improved net inter-est spread. Total noninterest expense increased due primarily tohigher net litigation expense driven by credit card-related litigationand higher compensation expense.
Income from discontinued operations was $795 million in 2006,which included a one-time gain of $622 million from the sale ofselected corporate trust businesses. Discontinued operations (includedin the Corporate segment results) included the income statementactivity of selected corporate trust businesses sold to The Bank ofNew York in October 2006.
The Firm’s Managed provision for credit losses was $9.2 billion com-pared with $5.5 billion in the prior year, reflecting increases in boththe wholesale and consumer provisions. The total consumer Managedprovision for credit losses was $8.3 billion, compared with $5.2 bil-lion in the prior year. The higher provision primarily reflected increas-es in the Allowance for credit losses largely related to home equity,credit card and subprime mortgage loans and higher net charge-offs.Consumer managed net charge-offs were $6.8 billion in 2007, com-pared with $5.3 billion in 2006, resulting in managed net charge-offrates of 1.97% and 1.60%, respectively. The wholesale Provision forcredit losses was $934 million, compared with $321 million in theprior year. The increase was due primarily to a higher Allowance forcredit losses, resulting primarily from portfolio activity, including theeffect of the weakening credit environment, and portfolio growth.Wholesale net charge-offs were $72 million in 2007 (net charge-offrate of 0.04%), compared with net recoveries of $22 million in 2006(net recovery rate of 0.01%). In total, the Firm increased itsAllowance for credit losses in 2007 by $2.3 billion, bringing the bal-ance of the allowance to $10.1 billion at December 31, 2007.
The Firm had, at year end, Total stockholders’ equity of $123.2 bil-lion and a Tier 1 capital ratio of 8.4%. The Firm purchased $8.2 bil-lion, or 168 million shares, of its common stock during the year.
2008 Business outlookThe following forward-looking statements are based upon the cur-rent beliefs and expectations of JPMorgan Chase’s management andare subject to significant risks and uncertainties. These risks anduncertainties could cause JPMorgan Chase’s results to differ materi-ally from those set forth in such forward-looking statements.
JPMorgan Chase’s outlook for 2008 should be viewed against thebackdrop of the global and U.S. economies (which currently areextremely volatile), financial markets activity (including interest ratemovements), the geopolitical environment, the competitive environmentand client activity levels. Each of these linked factors will affect the per-formance of the Firm’s lines of business. The Firm currently anticipatesa lower level of growth globally and in the U.S. during 2008 andincreased credit costs in all businesses. The slower the growth is, or theweaker the economic conditions are, compared with current forecasts,the more the Firm’s financial results could be adversely affected.
The consumer Provision for credit losses could increase substantially asa result of a higher level of losses in Retail Financial Services’ $94.8billion home equity loan portfolio and growth and increased losses inthe $15.5 billion retained subprime mortgage loan portfolio. Giventhe potential stress on the consumer from continued downward pres-sure on housing prices and the elevated inventory of unsold housesnationally, management remains extremely cautious with respect tothe home equity and subprime mortgage portfolios. Economic data
released in early 2008, including continued declines in housing pricesand increasing unemployment, indicate that losses will likely continueto rise in the home equity portfolio. In addition, the consumer provi-sion could increase due to a higher level of net charge-offs in CardServices. Based on management’s current economic outlook, homeequity losses for the first quarter of 2008 could be approximately$450 million and net charge-offs could potentially double from thislevel by the fourth quarter of 2008, and the net charge-off rate forCard Services could potentially increase to approximately 4.50% ofmanaged loans in the first half of 2008 and to approximately 5.00%by the end of 2008. Net charge-offs for home equity and card servicescould be higher than management’s current expectations dependingon such factors as changes in housing prices, unemployment levelsand consumer behavior. The wholesale Provision for credit losses mayalso increase over time as a result of loan growth, portfolio activityand changes in underlying credit conditions.
The Investment Bank enters 2008 with the capital markets still beingaffected by the disruption in the credit and mortgage markets, as wellas by overall lower levels of liquidity and wider credit spreads, all ofwhich could potentially lead to reduced levels of client activity, diffi-culty in syndicating leveraged loans, lower investment banking feesand lower trading revenue. While some leveraged finance loans weresold during the fourth quarter of 2007, the Firm held $26.4 billion ofleveraged loans and unfunded commitments as held-for-sale as ofDecember 31, 2007. Markdowns in excess of 6% have been taken onthe leveraged lending positions as of year-end 2007. These positionsare difficult to hedge effectively and as market conditions have con-tinued to deteriorate in the first quarter of 2008, it is likely there willbe further markdowns on this asset class. In January 2008, the Firmdecided, based on its view of potential relative returns, to retain forinvestment $4.9 billion of the leveraged lending portfolio that hadbeen previously held-for-sale. The Investment Bank also held, at yearend, an aggregate $2.7 billion of subprime CDOs and other subprime-related exposures which could also be negatively affected by marketconditions during 2008. While these positions are substantiallyhedged (none of the hedges include insurance from monoline insur-ance companies), there can be no assurance that the Firm will notincur additional losses on these positions, as these markets are illiq-uid and further writedowns may be necessary. Other exposures as ofDecember 31, 2007 that have higher levels of risk given the currentmarket environment include CDO warehouse and trading positions of$5.5 billion (over 90% corporate loans and bonds); CommercialMortgage-Backed Securities (“CMBS”) exposure of $15.5 billion; and$6.4 billion of Alt-A mortgage positions.
A weaker economy and lower equity markets in 2008 would alsoadversely affect business volumes, assets under custody and assetsunder management in Asset Management and Treasury & SecuritiesServices. Management continues to believe that the net loss inTreasury and Other Corporate on a combined basis will be approxi-mately $50 million to $100 million per quarter over time. Privateequity results, which are dependent upon the capital markets, couldcontinue to be volatile and may be significantly lower in 2008 than in2007. For the first quarter of 2008, private equity gains are expectedto be minimal.
MANAGEMENT’S DISCUSSION AND ANALYSISJPMorgan Chase & Co.
30 JPMorgan Chase & Co. / 2007 Annual Report
JPMorgan Chase & Co. / 2007 Annual Report 31
The following section provides a comparative discussion of JPMorganChase’s Consolidated results of operations on a reported basis forthe three-year period ended December 31, 2007. Factors that relateprimarily to a single business segment are discussed in more detailwithin that business segment than they are in this consolidated sec-tion. For a discussion of the Critical accounting estimates used bythe Firm that affect the Consolidated results of operations, see pages96–98 of this Annual Report.
RevenueYear ended December 31, (in millions) 2007 2006 2005
Investment banking fees $ 6,635 $ 5,520 $ 4,088Principal transactions 9,015 10,778 8,072Lending & deposit-related fees 3,938 3,468 3,389Asset management, administration
and commissions 14,356 11,855 9,988Securities gains (losses) 164 (543) (1,336)Mortgage fees and related income 2,118 591 1,054Credit card income 6,911 6,913 6,754Other income 1,829 2,175 2,684
Noninterest revenue 44,966 40,757 34,693Net interest income 26,406 21,242 19,555
Total net revenue $71,372 $ 61,999 $ 54,248
2007 compared with 2006 Total net revenue of $71.4 billion was up $9.4 billion, or 15%, fromthe prior year. Higher Net interest income, very strong private equitygains, record Asset management, administration and commissionsrevenue, higher Mortgage fees and related income and recordInvestment banking fees contributed to the revenue growth. Theseincreases were offset partially by lower trading revenue.
Investment banking fees grew in 2007 to a level higher than the pre-vious record set in 2006. Record advisory and equity underwritingfees drove the results, partially offset by lower debt underwritingfees. For a further discussion of Investment banking fees, which areprimarily recorded in IB, see the IB segment results on pages 40–42of this Annual Report.
Principal transactions revenue consists of trading revenue and privateequity gains. Trading revenue declined significantly from the 2006level, primarily due to markdowns in IB of $1.4 billion (net of hedges)on subprime positions, including subprime CDOs, and $1.3 billion (net of fees) on leveraged lending funded loans and unfunded commitments. Also in IB, markdowns in securitized products on nonsubprime mortgages and weak credit trading performance morethan offset record revenue in currencies and strong revenue in bothrates and equities. Equities benefited from strong client activity andrecord trading results across all products. IB’s Credit Portfolio resultsincreased compared with the prior year, primarily driven by higher revenue from risk management activities. The increase in private equity
gains from 2006 reflected a significantly higher level of gains, theclassification of certain private equity carried interest as Compensationexpense and a fair value adjustment in the first quarter of 2007 onnonpublic private equity investments resulting from the adoption ofSFAS 157 (“Fair Value Measurements”). For a further discussion ofPrincipal transactions revenue, see the IB and Corporate segmentresults on pages 40–42 and 59–60, respectively, and Note 6 on page122 of this Annual Report.
Lending & deposit-related fees rose from the 2006 level, driven pri-marily by higher deposit-related fees and the Bank of New Yorktransaction. For a further discussion of Lending & deposit-relatedfees, which are mostly recorded in RFS, TSS and CB, see the RFS segment results on pages 43–48, the TSS segment results on pages 54–55, and the CB segment results on pages 52–53 of this Annual Report.
Asset management, administration and commissions revenuereached a level higher than the previous record set in 2006.Increased assets under management and higher performance andplacement fees in AM drove the record results. The 18% growth inassets under management from year-end 2006 came from net assetinflows and market appreciation across all segments: Institutional,Retail, Private Bank and Private Client Services. TSS also contributedto the rise in Asset management, administration and commissionsrevenue, driven by increased product usage by new and existingclients and market appreciation on assets under custody. Finally,commissions revenue increased, due mainly to higher brokeragetransaction volume (primarily included within Fixed Income andEquity Markets revenue of IB), which more than offset the sale of theinsurance business by RFS in the third quarter of 2006 and a chargein the first quarter of 2007 resulting from accelerated surrenders ofcustomer annuities. For additional information on these fees andcommissions, see the segment discussions for IB on pages 40–42,RFS on pages 43–48, TSS on pages 54–55, and AM on pages56–58, of this Annual Report.
The favorable variance resulting from Securities gains in 2007 compared with Securities losses in 2006 was primarily driven byimprovements in the results of repositioning of the Treasury invest-ment securities portfolio. Also contributing to the positive variancewas a $234 million gain from the sale of MasterCard shares. For a fur-ther discussion of Securities gains (losses), which are mostly recordedin the Firm’s Treasury business, see the Corporate segment discussionon pages 59–60 of this Annual Report.
CONSOL IDATED RESULTS OF OPERAT IONS
MANAGEMENT’S DISCUSSION AND ANALYSISJPMorgan Chase & Co.
32 JPMorgan Chase & Co. / 2007 Annual Report
2006 compared with 2005Total net revenue for 2006 was $62.0 billion, up $7.8 billion, or14%, from the prior year. The increase was due to higher Principaltransactions revenue, primarily from strong trading results, higherAsset management, administration and commission revenue andgrowth in Investment banking fees. Also contributing to the increasewas higher Net interest income and lower securities portfolio losses.These improvements were offset partially by a decline in Otherincome partly as a result of the gain recognized in 2005 on the saleof BrownCo, the on-line deep discount brokerage business, andlower Mortgage fees and related income.
The increase in Investment banking fees was driven by strong growthin debt and equity underwriting, as well as advisory fees. For furtherdiscussion of Investment banking fees, which are primarily recorded inIB, see the IB segment results on pages 40–42 of this Annual Report.
Revenue from Principal transactions activities increased comparedwith the prior year, partly driven by strong trading revenue results dueto improved performance in IB Equity and Fixed income markets, par-tially offset by lower private equity gains. For a further discussion ofPrincipal transactions revenue, see the IB and Corporate segmentresults on pages 40–42 and 59–60, respectively, and Note 6 on page122 of this Annual Report.
Lending & deposit-related fees rose slightly in comparison with theprior year as a result of higher fee income on deposit-related feesand, in part, from the Bank of New York transaction. For a furtherdiscussion of Lending & deposit-related fees, which are mostlyrecorded in RFS, TSS and CB, see the RFS segment results on pages43–48, the TSS segment results on pages 54–55, and the CB seg-ment results on pages 52–53 of this Annual Report.
The increase in Asset management, administration and commissionsrevenue in 2006 was driven by growth in assets under managementin AM, which exceeded $1 trillion at the end of 2006, higher equity-related commissions in IB and higher performance and placementfees. The growth in assets under management reflected new assetinflows in the Institutional and Retail segments. TSS also contributedto the rise in Asset management, administration and commissionsrevenue, driven by increased product usage by new and existingclients and market appreciation on assets under custody. In addition,commissions in the IB rose as a result of strength across regions,partly offset by the sale of the insurance business and BrownCo. Foradditional information on these fees and commissions, see the seg-ment discussions for IB on pages 40–42, RFS on pages 43–48, TSSon pages 54–55, and AM on pages 56–58, of this Annual Report.
The favorable variance in Securities gains (losses) was due primarily tolower Securities losses in Treasury in 2006 from portfolio repositioning
Mortgage fees and related income increased from the prior year asmortgage servicing rights (“MSRs”) asset valuation adjustments andgrowth in third-party mortgage loans serviced drove an increase in netmortgage servicing revenue. Production revenue also grew, as anincrease in mortgage loan originations and the classification of certainloan origination costs as expense (loan origination costs previouslynetted against revenue commenced being recorded as an expense inthe first quarter of 2007 due to the adoption of SFAS 159) more thanoffset markdowns on the mortgage warehouse and pipeline. For a dis-cussion of Mortgage fees and related income, which is recorded pri-marily in RFS’s Mortgage Banking business, see the Mortgage Bankingdiscussion on pages 46–47 of this Annual Report.
Credit card income remained relatively unchanged from the 2006level, as lower servicing fees earned in connection with securitizationactivities, which were affected unfavorably by higher net credit lossesand narrower loan margins, were offset by increases in net inter-change income earned on the Firm’s credit and debit cards. For fur-ther discussion of Credit card income, see CS’s segment results onpages 49–51 of this Annual Report.
Other income declined compared with the prior year, driven by lowergains from loan sales and workouts, and the absence of a $103 mil-lion gain in the second quarter of 2006 related to the sale ofMasterCard shares in its initial public offering. (The 2007 gain on thesale of MasterCard shares was recorded in Securities gains (losses)as the shares were transferred to the available-for-sale (“AFS”) port-folio subsequent to the IPO.) Increased income from automobileoperating leases and higher gains on the sale of leveraged leasesand education loans partially offset the decline.
Net interest income rose from the prior year, primarily due to the fol-lowing: higher trading-related Net interest income, due to a shift ofInterest expense to Principal transactions revenue (related to certainIB structured notes to which fair value accounting was elected inconnection with the adoption of SFAS 159); growth in liability anddeposit balances in the wholesale and consumer businesses; a higherlevel of credit card loans; the impact of the Bank of New York trans-action; and an improvement in Treasury’s net interest spread. Thesebenefits were offset partly by a shift to narrower-spread deposit andliability products. The Firm’s total average interest-earning assets for2007 were $1.1 trillion, up 12% from the prior year. The increasewas primarily driven by higher Trading assets – debt instruments,Loans, and AFS securities, partially offset by a decline in Interests inpurchased receivables as a result of the restructuring and deconsoli-dation during the second quarter of 2006 of certain multi-seller con-duits that the Firm administered. The net interest yield on theseassets, on a fully taxable equivalent basis, was 2.39%, an increase of23 basis points from the prior year, due in part to the adoption ofSFAS 159.
JPMorgan Chase & Co. / 2007 Annual Report 33
activities in connection with the management of the Firm’s assets andliabilities. For a further discussion of Securities gains (losses), whichare mostly recorded in the Firm’s Treasury business, see the Corporatesegment discussion on pages 59–60 of this Annual Report.
Mortgage fees and related income declined in comparison with theprior year, reflecting a reduction in net mortgage servicing revenueand higher losses on mortgage loans transferred to held-for-sale.These declines were offset partly by growth in production revenue asa result of a higher volume of loan sales and wider gain on sale mar-gins. For a discussion of Mortgage fees and related income, which isrecorded primarily in RFS’s Mortgage Banking business, see theMortgage Banking discussion on pages 46–47 of this Annual Report.
Credit card income increased from the prior year, primarily from high-er customer charge volume that favorably affected interchangeincome and servicing fees earned in connection with securitizationactivities, which benefited from lower credit losses incurred on securi-tized credit card loans. These increases were offset partially byincreases in volume-driven payments to partners, expense related toreward programs, and interest paid to investors in securitized loans.Credit card income also was affected negatively by the deconsolida-tion of Paymentech in the fourth quarter of 2005.
The decrease in Other income compared with the prior year was dueto a $1.3 billion pretax gain recognized in 2005 on the sale ofBrownCo and lower gains from loan workouts. Partially offsettingthese two items were higher automobile operating lease revenue; anincrease in equity investment income, in particular, from ChasePaymentech Solutions, LLC; and a pretax gain of $103 million on thesale of MasterCard shares in its initial public offering.
Net interest income rose compared with the prior year due largely toimprovement in Treasury’s net interest spread and increases in whole-sale liability balances, wholesale and consumer loans, AFS securitiesand consumer deposits. Increases in consumer and wholesale loansand deposits included the impact of the Bank of New York transac-tion. These increases were offset partially by narrower spreads onboth trading-related assets and loans, a shift to narrower-spreaddeposits products, RFS’s sale of the insurance business and theabsence of BrownCo in AM. The Firm’s total average interest-earningassets in 2006 were $995.5 billion, up 11% from the prior year, pri-marily as a result of an increase in loans and other liquid earningassets, partially offset by a decline in Interests in purchased receiv-ables as a result of the restructuring and deconsolidation during thesecond quarter of 2006 of certain multi-seller conduits that the Firmadministered. The net yield on interest-earning assets, on a fully tax-able-equivalent basis, was 2.16%, a decrease of four basis pointsfrom the prior year.
Provision for credit losses Year ended December 31,(in millions) 2007 2006 2005
Provision for credit losses $ 6,864 $3,270 $ 3,483
2007 compared with 2006 The Provision for credit losses in 2007 rose $3.6 billion from theprior year due to increases in both the consumer and wholesale pro-visions. The increase in the consumer provision from the prior yearwas largely due to an increase in estimated losses related to homeequity, credit card and subprime mortgage loans. Credit card netcharge-offs in 2006 benefited following the change in bankruptcylegislation in the fourth quarter of 2005. The increase in the whole-sale provision from the prior year primarily reflected an increase inthe Allowance for credit losses due to portfolio activity, which includedthe effect of the weakening credit environment and portfolio growth.For a more detailed discussion of the loan portfolio and the Allowancefor loan losses, see the segment discussions for RFS on pages 43–48,CS on pages 49–51, IB on pages 40–42, CB on pages 52–53 andCredit risk management on pages 73–89 of this Annual Report.
2006 compared with 2005The Provision for credit losses in 2006 declined $213 million from theprior year due to a $1.3 billion decrease in the consumer Provision forcredit losses, partly offset by a $1.1 billion increase in the wholesaleProvision for credit losses. The decrease in the consumer provision wasdriven by CS, reflecting lower bankruptcy-related losses, partly offsetby higher contractual net charge-offs. The 2005 consumer provisionalso reflected a $350 million special provision related to HurricaneKatrina, a portion of which was released in 2006. The increase in thewholesale provision was due primarily to portfolio activity, partly offsetby a decrease in nonperforming loans. The benefit in 2005 was due tostrong credit quality, reflected in significant reductions in criticizedexposure and nonperforming loans. Credit quality in the wholesaleportfolio was stable.
Noninterest expenseYear ended December 31,(in millions) 2007 2006 2005
Compensation expense $ 22,689 $ 21,191 $18,065Occupancy expense 2,608 2,335 2,269Technology, communications and
equipment expense 3,779 3,653 3,602Professional & outside services 5,140 4,450 4,662Marketing 2,070 2,209 1,917Other expense 3,814 3,272 6,199Amortization of intangibles 1,394 1,428 1,490Merger costs(a) 209 305 722
Total noninterest expense $ 41,703 $ 38,843 $38,926
(a) On July 1, 2004, Bank One Corporation merged with and into JPMorgan Chase.
MANAGEMENT’S DISCUSSION AND ANALYSISJPMorgan Chase & Co.
34 JPMorgan Chase & Co. / 2007 Annual Report
2007 compared with 2006 Total noninterest expense for 2007 was $41.7 billion, up $2.9 bil-lion, or 7%, from the prior year. The increase was driven by higherCompensation expense, as well as investments across the businesssegments and acquisitions.
The increase in Compensation expense from 2006 was primarily theresult of investments and acquisitions in the businesses, includingadditional headcount from the Bank of New York transaction; theclassification of certain private equity carried interest from Principaltransactions revenue; the classification of certain loan originationcosts (loan origination costs previously netted against revenue com-menced being recorded as an expense in the first quarter of 2007 dueto the adoption of SFAS 159); and higher performance-based incen-tives. Partially offsetting these increases were business divestituresand continuing business efficiencies.
The increase in Occupancy expense from 2006 was driven by ongo-ing investments in the businesses; in particular, the retail distributionnetwork and the Bank of New York transaction.
Technology, communications and equipment expense increased com-pared with 2006, due primarily to higher depreciation expense onowned automobiles subject to operating leases in the Auto Financebusiness in RFS and technology investments to support businessgrowth. Continuing business efficiencies partially offset these increases.
Professional & outside services rose from the prior year, primarilyreflecting higher brokerage expense and credit card processing costsresulting from growth in transaction volume. Investments in thebusinesses and acquisitions also contributed to the increasedexpense.
Marketing expense declined compared with 2006 due largely tolower credit card marketing expense.
The increase in Other expense from the 2006 level was driven byincreased net legal-related costs reflecting a lower level of insurancerecoveries and higher expense, which included the cost of credit card-related litigation. Also contributing to the increase were businessgrowth and investments in the businesses, offset partially by the saleof the insurance business at the beginning of the third quarter of2006, lower credit card fraud-related losses and continuing businessefficiencies.
For a discussion of Amortization of intangibles and Merger costs,refer to Note 18 and Note 11 on pages 154–157 and 134, respec-tively, of this Annual Report.
2006 compared with 2005Total noninterest expense for 2006 was $38.8 billion, down slightly fromthe prior year. The decrease was due to material litigation-related insur-ance recoveries of $512 million in 2006 compared with a net charge of$2.6 billion (includes $208 million of material litigation-related insur-ance recoveries) in 2005, primarily associated with the settlement of theEnron Corp. and its subsidiaries (“Enron”) and WorldCom class actionlitigations and for certain other material legal proceedings. Also con-
tributing to the decrease were lower Merger costs, the deconsolidation ofPaymentech, the sale of the insurance business, and merger-related sav-ings and operating efficiencies. These items were offset mostly by higherperformance-based compensation and incremental expense of $712 mil-lion related to the adoption of SFAS 123R, the impact of acquisitions andinvestments in the businesses, and higher marketing expenditures.
The increase in Compensation expense from the prior year was primarilya result of higher performance-based incentives, incremental expenserelated to SFAS 123R of $712 million for 2006, and additional head-count in connection with growth in business volume, acquisitions, andinvestments in the businesses. These increases were offset partially bymerger-related savings and other expense efficiencies throughout theFirm. For a detailed discussion of the adoption of SFAS 123R andemployee stock-based incentives, see Note 10 on pages 131–133 of thisAnnual Report.
The increase in Occupancy expense from the prior year was due toongoing investments in the retail distribution network, which includedthe incremental expense from The Bank of New York branches, partiallyoffset by merger-related savings and other operating efficiencies.
The slight increase in Technology, communications and equipmentexpense for 2006 was due primarily to higher depreciation expense onowned automobiles subject to operating leases and higher technologyinvestments to support business growth, partially offset by merger-relat-ed savings and continuing business efficiencies.
Professional & outside services decreased from the prior year due tomerger-related savings and continuing business efficiencies, lower legalfees associated with several legal matters settled in 2005 and thePaymentech deconsolidation. The decrease was offset partly by acquisi-tions and investments in the businesses.
Marketing expense was higher compared with the prior year, reflectingthe costs of credit card campaigns.
Other expense was lower due to significant litigation-related charges of$2.8 billion in the prior year, associated with the settlement of theEnron and WorldCom class action litigations and certain other materiallegal proceedings. In addition, the Firm recognized insurance recoveriesof $512 million and $208 million, in 2006 and 2005, respectively, per-taining to certain material litigation matters. For further discussion of liti-gation, refer to Note 29 on pages 167–168 of this Annual Report. Alsocontributing to the decline from the prior year were charges of $93 mil-lion in connection with the termination of a client contract in TSS in2005; and in RFS, the sale of the insurance business in the third quarterof 2006. These items were offset partially by higher charges related toother litigation, and the impact of growth in business volume, acquisi-tions and investments in the businesses.
For a discussion of Amortization of intangibles and Merger costs, refer toNote 18 and Note 11 on pages 154–157 and 134, respectively, of thisAnnual Report.
JPMorgan Chase & Co. / 2007 Annual Report 35
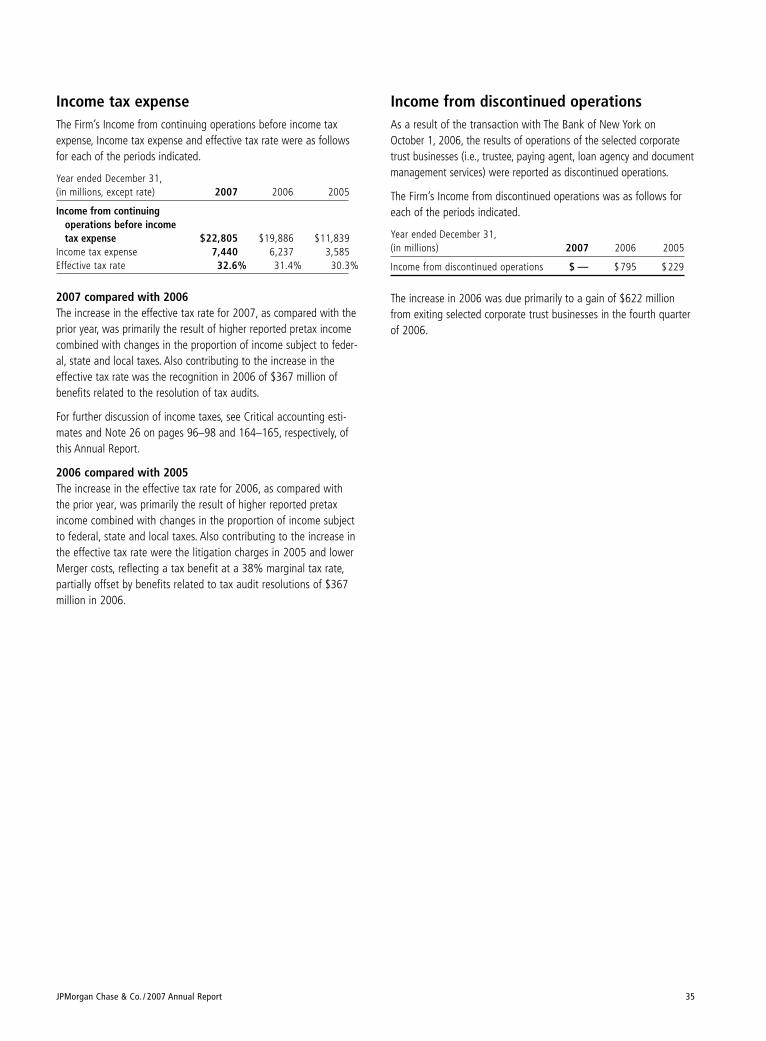
Income from discontinued operations As a result of the transaction with The Bank of New York on October 1, 2006, the results of operations of the selected corporatetrust businesses (i.e., trustee, paying agent, loan agency and documentmanagement services) were reported as discontinued operations.
The Firm’s Income from discontinued operations was as follows foreach of the periods indicated.
Year ended December 31,(in millions) 2007 2006 2005
Income from discontinued operations $ — $ 795 $ 229
The increase in 2006 was due primarily to a gain of $622 millionfrom exiting selected corporate trust businesses in the fourth quarterof 2006.
Income tax expenseThe Firm’s Income from continuing operations before income taxexpense, Income tax expense and effective tax rate were as followsfor each of the periods indicated.
Year ended December 31,(in millions, except rate) 2007 2006 2005
Income from continuing operations before income tax expense $22,805 $19,886 $11,839
Income tax expense 7,440 6,237 3,585Effective tax rate 32.6% 31.4% 30.3%
2007 compared with 2006 The increase in the effective tax rate for 2007, as compared with theprior year, was primarily the result of higher reported pretax incomecombined with changes in the proportion of income subject to feder-al, state and local taxes. Also contributing to the increase in theeffective tax rate was the recognition in 2006 of $367 million ofbenefits related to the resolution of tax audits.
For further discussion of income taxes, see Critical accounting esti-mates and Note 26 on pages 96–98 and 164–165, respectively, ofthis Annual Report.
2006 compared with 2005The increase in the effective tax rate for 2006, as compared withthe prior year, was primarily the result of higher reported pretaxincome combined with changes in the proportion of income subjectto federal, state and local taxes. Also contributing to the increase inthe effective tax rate were the litigation charges in 2005 and lowerMerger costs, reflecting a tax benefit at a 38% marginal tax rate,partially offset by benefits related to tax audit resolutions of $367million in 2006.
(Table continues on next page)
2007 2006
Year ended December 31, Fully Fully(in millions, except Reported tax-equivalent Managed Reported tax-equivalent Managedper share and ratio data) results Credit card(b) adjustments basis results Credit card(b) adjustments basis
RevenueInvestment banking fees $ 6,635 $ — $ — $ 6,635 $ 5,520 $ — $ — $ 5,520Principal transactions 9,015 — — 9,015 10,778 — — 10,778Lending & deposit-related fees 3,938 — — 3,938 3,468 — — 3,468Asset management, administration
and commissions 14,356 — — 14,356 11,855 — — 11,855Securities gains (losses) 164 — — 164 (543) — — (543)Mortgage fees and related income 2,118 — — 2,118 591 — — 591Credit card income 6,911 (3,255) — 3,656 6,913 (3,509) — 3,404Other income 1,829 — 683 2,512 2,175 — 676 2,851
Noninterest revenue 44,966 (3,255) 683 42,394 40,757 (3,509) 676 37,924Net interest income 26,406 5,635 377 32,418 21,242 5,719 228 27,189
Total net revenue 71,372 2,380 1,060 74,812 61,999 2,210 904 65,113Provision for credit losses 6,864 2,380 — 9,244 3,270 2,210 — 5,480Noninterest expense 41,703 — — 41,703 38,843 — — 38,843
Income from continuing operations before income tax expense 22,805 — 1,060 23,865 19,886 — 904 20,790
Income tax expense 7,440 — 1,060 8,500 6,237 — 904 7,141
Income from continuing operations 15,365 — — 15,365 13,649 — — 13,649Income from discontinued operations — — — — 795 — — 795
Net income $ 15,365 $ — $ — $ 15,365 $ 14,444 $ — $ — $ 14,444
Income from continuing operations – diluted earnings
per share $ 4.38 $ — $ — $ 4.38 $ 3.82 $ — $ — $ 3.82
Return on common equity(a) 13% —% —% 13% 12% —% —% 12%Return on common equity less goodwill(a) 21 — — 21 20 — — 20Return on assets(a) 1.06 NM NM 1.01 1.04 NM NM 1.00Overhead ratio 58 NM NM 56 63 NM NM 60Loans–Period-end $ 519,374 $72,701 $ — $ 592,075 $ 483,127 $ 66,950 $ — $ 550,077Total assets – average 1,455,044 66,780 — 1,521,824 1,313,794 65,266 — 1,379,060
(a) Based on Income from continuing operations.(b) The impact of credit card securitizations affects CS. See the segment discussion for CS on pages 49–51 of this Annual Report for further information.
MANAGEMENT’S DISCUSSION AND ANALYSISJPMorgan Chase & Co.
36 JPMorgan Chase & Co. / 2007 Annual Report
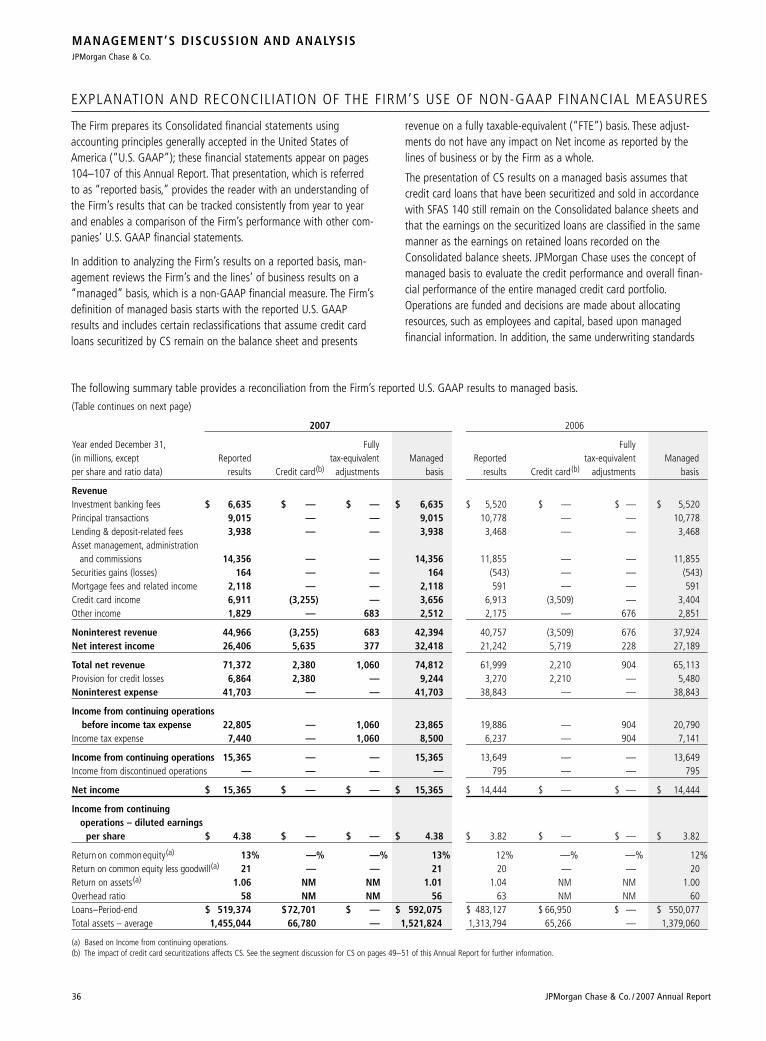
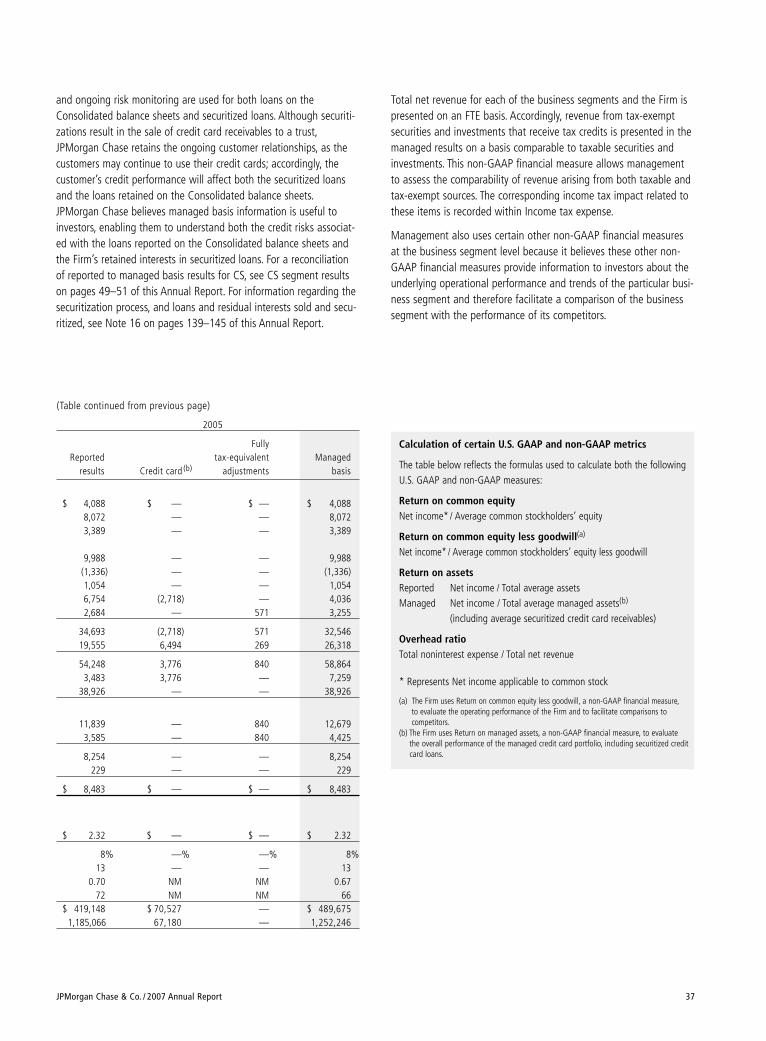
The following summary table provides a reconciliation from the Firm’s reported U.S. GAAP results to managed basis.
The Firm prepares its Consolidated financial statements usingaccounting principles generally accepted in the United States ofAmerica (“U.S. GAAP”); these financial statements appear on pages104–107 of this Annual Report. That presentation, which is referredto as “reported basis,” provides the reader with an understanding ofthe Firm’s results that can be tracked consistently from year to yearand enables a comparison of the Firm’s performance with other com-panies’ U.S. GAAP financial statements.
In addition to analyzing the Firm’s results on a reported basis, man-agement reviews the Firm’s and the lines’ of business results on a“managed” basis, which is a non-GAAP financial measure. The Firm’sdefinition of managed basis starts with the reported U.S. GAAPresults and includes certain reclassifications that assume credit cardloans securitized by CS remain on the balance sheet and presents
revenue on a fully taxable-equivalent (“FTE”) basis. These adjust-ments do not have any impact on Net income as reported by thelines of business or by the Firm as a whole.
The presentation of CS results on a managed basis assumes thatcredit card loans that have been securitized and sold in accordancewith SFAS 140 still remain on the Consolidated balance sheets andthat the earnings on the securitized loans are classified in the samemanner as the earnings on retained loans recorded on theConsolidated balance sheets. JPMorgan Chase uses the concept ofmanaged basis to evaluate the credit performance and overall finan-cial performance of the entire managed credit card portfolio.Operations are funded and decisions are made about allocatingresources, such as employees and capital, based upon managedfinancial information. In addition, the same underwriting standards
EXPLANATION AND RECONCILIATION OF THE FIRM’S USE OF NON-GAAP FINANCIAL M EASURES
JPMorgan Chase & Co. / 2007 Annual Report 37
Calculation of certain U.S. GAAP and non-GAAP metrics
The table below reflects the formulas used to calculate both the followingU.S. GAAP and non-GAAP measures:
Return on common equityNet income* / Average common stockholders’ equity
Return on common equity less goodwill(a)
Net income* / Average common stockholders’ equity less goodwill
Return on assetsReported Net income / Total average assetsManaged Net income / Total average managed assets(b)
(including average securitized credit card receivables)
Overhead ratioTotal noninterest expense / Total net revenue
* Represents Net income applicable to common stock
(a) The Firm uses Return on common equity less goodwill, a non-GAAP financial measure,to evaluate the operating performance of the Firm and to facilitate comparisons to competitors.
(b) The Firm uses Return on managed assets, a non-GAAP financial measure, to evaluate the overall performance of the managed credit card portfolio, including securitized creditcard loans.
and ongoing risk monitoring are used for both loans on theConsolidated balance sheets and securitized loans. Although securiti-zations result in the sale of credit card receivables to a trust,JPMorgan Chase retains the ongoing customer relationships, as thecustomers may continue to use their credit cards; accordingly, thecustomer’s credit performance will affect both the securitized loansand the loans retained on the Consolidated balance sheets.JPMorgan Chase believes managed basis information is useful toinvestors, enabling them to understand both the credit risks associat-ed with the loans reported on the Consolidated balance sheets andthe Firm’s retained interests in securitized loans. For a reconciliationof reported to managed basis results for CS, see CS segment resultson pages 49–51 of this Annual Report. For information regarding thesecuritization process, and loans and residual interests sold and secu-ritized, see Note 16 on pages 139–145 of this Annual Report.
Total net revenue for each of the business segments and the Firm ispresented on an FTE basis. Accordingly, revenue from tax-exemptsecurities and investments that receive tax credits is presented in themanaged results on a basis comparable to taxable securities andinvestments. This non-GAAP financial measure allows managementto assess the comparability of revenue arising from both taxable andtax-exempt sources. The corresponding income tax impact related tothese items is recorded within Income tax expense.
Management also uses certain other non-GAAP financial measuresat the business segment level because it believes these other non-GAAP financial measures provide information to investors about theunderlying operational performance and trends of the particular busi-ness segment and therefore facilitate a comparison of the businesssegment with the performance of its competitors.
(Table continued from previous page)
2005
FullyReported tax-equivalent Managed
results Credit card (b) adjustments basis
$ 4,088 $ — $ — $ 4,0888,072 — — 8,0723,389 — — 3,389
9,988 — — 9,988(1,336) — — (1,336)1,054 — — 1,0546,754 (2,718) — 4,0362,684 — 571 3,255
34,693 (2,718) 571 32,54619,555 6,494 269 26,318
54,248 3,776 840 58,8643,483 3,776 — 7,259
38,926 — — 38,926
11,839 — 840 12,6793,585 — 840 4,425
8,254 — — 8,254229 — — 229
$ 8,483 $ — $ — $ 8,483
$ 2.32 $ — $ — $ 2.32
8% —% —% 8%13 — — 13
0.70 NM NM 0.6772 NM NM 66
$ 419,148 $ 70,527 — $ 489,6751,185,066 67,180 — 1,252,246
MANAGEMENT’S DISCUSSION AND ANALYSISJPMorgan Chase & Co.
38 JPMorgan Chase & Co. / 2007 Annual Report
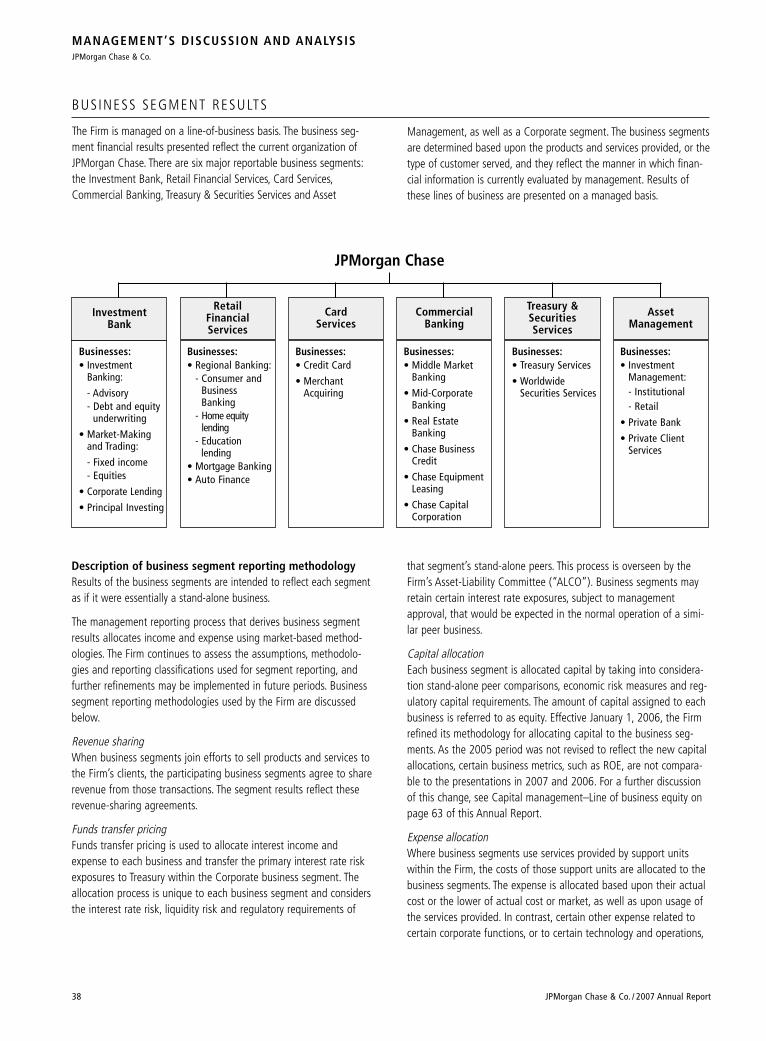
BUSINESS SEGMENT RESULTS
The Firm is managed on a line-of-business basis. The business seg-ment financial results presented reflect the current organization ofJPMorgan Chase. There are six major reportable business segments:the Investment Bank, Retail Financial Services, Card Services,Commercial Banking, Treasury & Securities Services and Asset
Management, as well as a Corporate segment. The business segmentsare determined based upon the products and services provided, or thetype of customer served, and they reflect the manner in which finan-cial information is currently evaluated by management. Results ofthese lines of business are presented on a managed basis.
AssetManagement
Businesses:• Treasury Services
• WorldwideSecurities Services
JPMorgan Chase
Businesses:• Middle Market
Banking
• Mid-CorporateBanking
• Real EstateBanking
• Chase BusinessCredit
• Chase EquipmentLeasing
• Chase CapitalCorporation
CommercialBanking
Businesses:• Investment
Banking:
- Advisory- Debt and equity
underwriting
• Market-Makingand Trading:
- Fixed income - Equities
• Corporate Lending
• Principal Investing
InvestmentBank
RetailFinancialServices
CardServices
Businesses:• Investment
Management:- Institutional- Retail
• Private Bank
• Private ClientServices
Businesses:• Credit Card
• MerchantAcquiring
Businesses:• Regional Banking:
- Consumer andBusinessBanking
- Home equity lending
- Education lending
• Mortgage Banking• Auto Finance
Treasury &SecuritiesServices
Description of business segment reporting methodology Results of the business segments are intended to reflect each segmentas if it were essentially a stand-alone business.
The management reporting process that derives business segmentresults allocates income and expense using market-based method-ologies. The Firm continues to assess the assumptions, methodolo-gies and reporting classifications used for segment reporting, andfurther refinements may be implemented in future periods. Businesssegment reporting methodologies used by the Firm are discussedbelow.
Revenue sharingWhen business segments join efforts to sell products and services tothe Firm’s clients, the participating business segments agree to sharerevenue from those transactions. The segment results reflect theserevenue-sharing agreements.
Funds transfer pricingFunds transfer pricing is used to allocate interest income andexpense to each business and transfer the primary interest rate riskexposures to Treasury within the Corporate business segment. Theallocation process is unique to each business segment and considersthe interest rate risk, liquidity risk and regulatory requirements of
that segment’s stand-alone peers. This process is overseen by theFirm’s Asset-Liability Committee (“ALCO”). Business segments mayretain certain interest rate exposures, subject to managementapproval, that would be expected in the normal operation of a simi-lar peer business.
Capital allocationEach business segment is allocated capital by taking into considera-tion stand-alone peer comparisons, economic risk measures and reg-ulatory capital requirements. The amount of capital assigned to eachbusiness is referred to as equity. Effective January 1, 2006, the Firmrefined its methodology for allocating capital to the business seg-ments. As the 2005 period was not revised to reflect the new capitalallocations, certain business metrics, such as ROE, are not compara-ble to the presentations in 2007 and 2006. For a further discussionof this change, see Capital management–Line of business equity onpage 63 of this Annual Report.
Expense allocationWhere business segments use services provided by support unitswithin the Firm, the costs of those support units are allocated to thebusiness segments. The expense is allocated based upon their actualcost or the lower of actual cost or market, as well as upon usage ofthe services provided. In contrast, certain other expense related tocertain corporate functions, or to certain technology and operations,
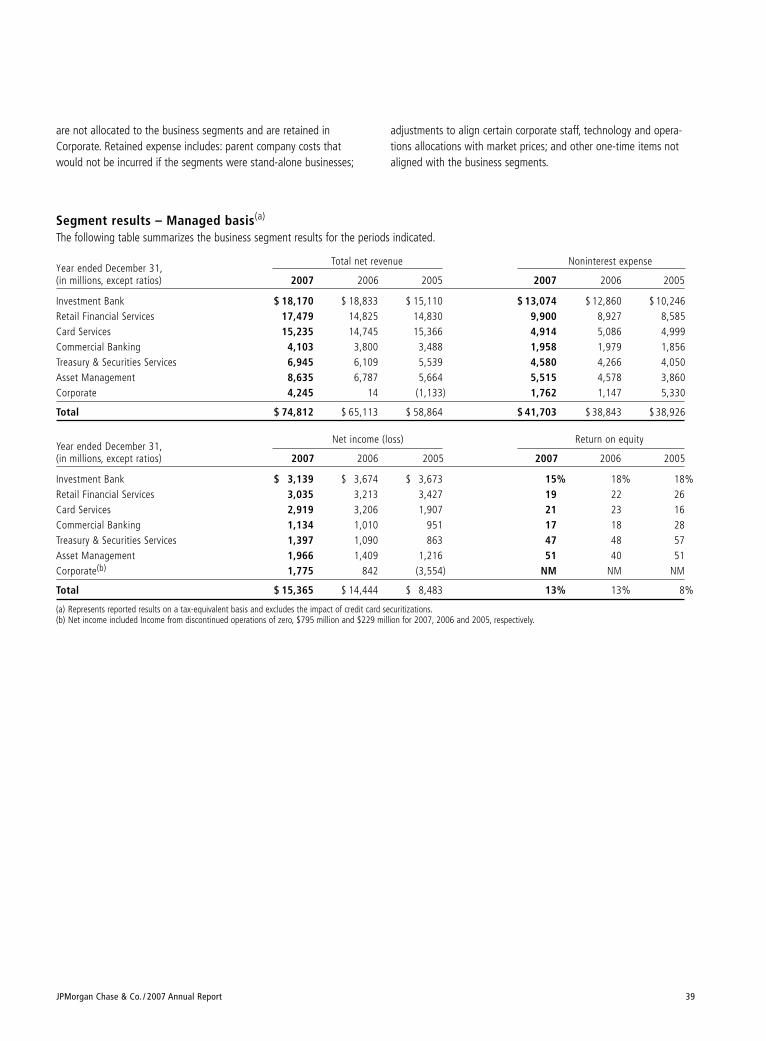
Segment results – Managed basis(a)
The following table summarizes the business segment results for the periods indicated.
Year ended December 31,Total net revenue Noninterest expense
(in millions, except ratios) 2007 2006 2005 2007 2006 2005
Investment Bank $ 18,170 $ 18,833 $ 15,110 $ 13,074 $ 12,860 $ 10,246Retail Financial Services 17,479 14,825 14,830 9,900 8,927 8,585Card Services 15,235 14,745 15,366 4,914 5,086 4,999Commercial Banking 4,103 3,800 3,488 1,958 1,979 1,856Treasury & Securities Services 6,945 6,109 5,539 4,580 4,266 4,050Asset Management 8,635 6,787 5,664 5,515 4,578 3,860Corporate 4,245 14 (1,133) 1,762 1,147 5,330
Total $ 74,812 $ 65,113 $ 58,864 $ 41,703 $ 38,843 $ 38,926
Year ended December 31,Net income (loss) Return on equity
(in millions, except ratios) 2007 2006 2005 2007 2006 2005
Investment Bank $ 3,139 $ 3,674 $ 3,673 15% 18% 18%Retail Financial Services 3,035 3,213 3,427 19 22 26Card Services 2,919 3,206 1,907 21 23 16Commercial Banking 1,134 1,010 951 17 18 28Treasury & Securities Services 1,397 1,090 863 47 48 57Asset Management 1,966 1,409 1,216 51 40 51Corporate(b) 1,775 842 (3,554) NM NM NM
Total $ 15,365 $ 14,444 $ 8,483 13% 13% 8%
(a) Represents reported results on a tax-equivalent basis and excludes the impact of credit card securitizations.(b) Net income included Income from discontinued operations of zero, $795 million and $229 million for 2007, 2006 and 2005, respectively.
JPMorgan Chase & Co. / 2007 Annual Report 39
are not allocated to the business segments and are retained inCorporate. Retained expense includes: parent company costs thatwould not be incurred if the segments were stand-alone businesses;
adjustments to align certain corporate staff, technology and opera-tions allocations with market prices; and other one-time items notaligned with the business segments.
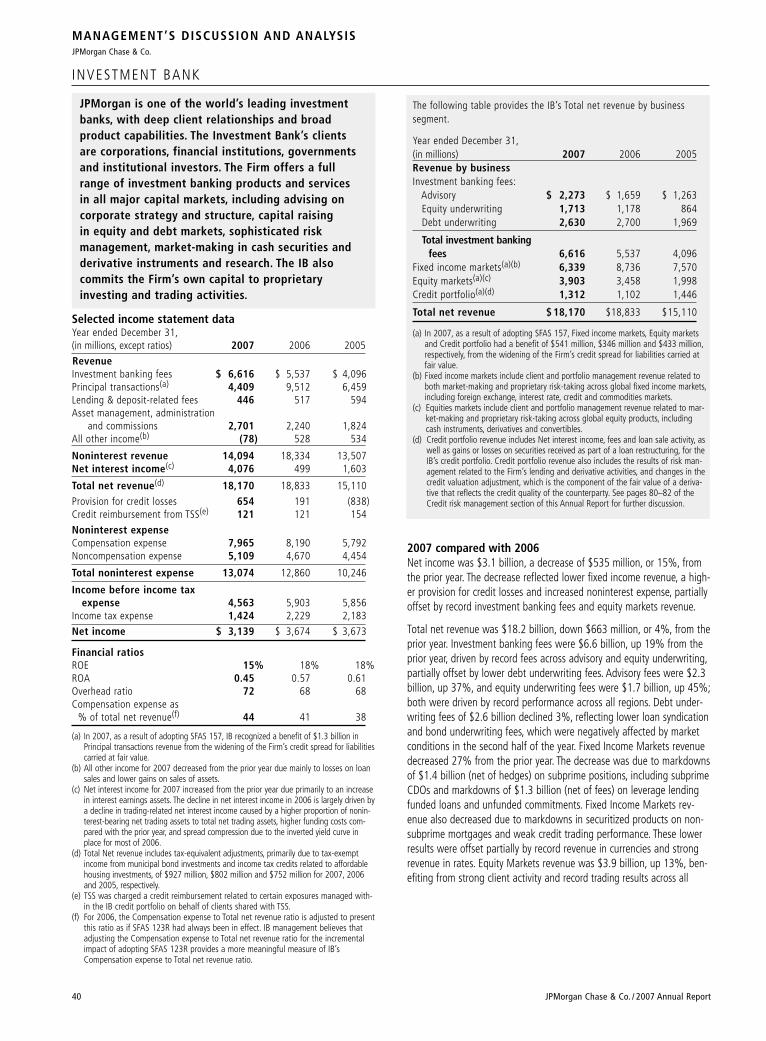
The following table provides the IB’s Total net revenue by business segment.
Year ended December 31,(in millions) 2007 2006 2005Revenue by businessInvestment banking fees:
Advisory $ 2,273 $ 1,659 $ 1,263Equity underwriting 1,713 1,178 864Debt underwriting 2,630 2,700 1,969
Total investment banking fees 6,616 5,537 4,096
Fixed income markets(a)(b) 6,339 8,736 7,570Equity markets(a)(c) 3,903 3,458 1,998Credit portfolio(a)(d) 1,312 1,102 1,446
Total net revenue $ 18,170 $18,833 $15,110
(a) In 2007, as a result of adopting SFAS 157, Fixed income markets, Equity marketsand Credit portfolio had a benefit of $541 million, $346 million and $433 million,respectively, from the widening of the Firm’s credit spread for liabilities carried atfair value.
(b) Fixed income markets include client and portfolio management revenue related toboth market-making and proprietary risk-taking across global fixed income markets,including foreign exchange, interest rate, credit and commodities markets.
(c) Equities markets include client and portfolio management revenue related to mar-ket-making and proprietary risk-taking across global equity products, includingcash instruments, derivatives and convertibles.
(d) Credit portfolio revenue includes Net interest income, fees and loan sale activity, aswell as gains or losses on securities received as part of a loan restructuring, for theIB’s credit portfolio. Credit portfolio revenue also includes the results of risk man-agement related to the Firm’s lending and derivative activities, and changes in thecredit valuation adjustment, which is the component of the fair value of a deriva-tive that reflects the credit quality of the counterparty. See pages 80–82 of theCredit risk management section of this Annual Report for further discussion.
40 JPMorgan Chase & Co. / 2007 Annual Report
2007 compared with 2006 Net income was $3.1 billion, a decrease of $535 million, or 15%, fromthe prior year. The decrease reflected lower fixed income revenue, a high-er provision for credit losses and increased noninterest expense, partiallyoffset by record investment banking fees and equity markets revenue.
Total net revenue was $18.2 billion, down $663 million, or 4%, from theprior year. Investment banking fees were $6.6 billion, up 19% from theprior year, driven by record fees across advisory and equity underwriting,partially offset by lower debt underwriting fees. Advisory fees were $2.3billion, up 37%, and equity underwriting fees were $1.7 billion, up 45%;both were driven by record performance across all regions. Debt under-writing fees of $2.6 billion declined 3%, reflecting lower loan syndicationand bond underwriting fees, which were negatively affected by marketconditions in the second half of the year. Fixed Income Markets revenuedecreased 27% from the prior year. The decrease was due to markdownsof $1.4 billion (net of hedges) on subprime positions, including subprimeCDOs and markdowns of $1.3 billion (net of fees) on leverage lendingfunded loans and unfunded commitments. Fixed Income Markets rev-enue also decreased due to markdowns in securitized products on non-subprime mortgages and weak credit trading performance. These lowerresults were offset partially by record revenue in currencies and strongrevenue in rates. Equity Markets revenue was $3.9 billion, up 13%, ben-efiting from strong client activity and record trading results across all
MANAGEMENT’S DISCUSSION AND ANALYSISJPMorgan Chase & Co.
INVESTMENT BANK
JPMorgan is one of the world’s leading investmentbanks, with deep client relationships and broad product capabilities. The Investment Bank’s clients are corporations, financial institutions, governmentsand institutional investors. The Firm offers a fullrange of investment banking products and services in all major capital markets, including advising oncorporate strategy and structure, capital raising in equity and debt markets, sophisticated risk management, market-making in cash securities andderivative instruments and research. The IB also commits the Firm’s own capital to proprietary investing and trading activities.
Selected income statement data Year ended December 31,(in millions, except ratios) 2007 2006 2005
RevenueInvestment banking fees $ 6,616 $ 5,537 $ 4,096Principal transactions(a) 4,409 9,512 6,459Lending & deposit-related fees 446 517 594Asset management, administration
and commissions 2,701 2,240 1,824All other income(b) (78) 528 534
Noninterest revenue 14,094 18,334 13,507Net interest income(c) 4,076 499 1,603
Total net revenue(d) 18,170 18,833 15,110
Provision for credit losses 654 191 (838)Credit reimbursement from TSS(e) 121 121 154
Noninterest expenseCompensation expense 7,965 8,190 5,792Noncompensation expense 5,109 4,670 4,454
Total noninterest expense 13,074 12,860 10,246
Income before income tax expense 4,563 5,903 5,856
Income tax expense 1,424 2,229 2,183
Net income $ 3,139 $ 3,674 $ 3,673
Financial ratiosROE 15% 18% 18%ROA 0.45 0.57 0.61Overhead ratio 72 68 68Compensation expense as
% of total net revenue(f) 44 41 38
(a) In 2007, as a result of adopting SFAS 157, IB recognized a benefit of $1.3 billion inPrincipal transactions revenue from the widening of the Firm’s credit spread for liabilitiescarried at fair value.
(b) All other income for 2007 decreased from the prior year due mainly to losses on loansales and lower gains on sales of assets.
(c) Net interest income for 2007 increased from the prior year due primarily to an increasein interest earnings assets. The decline in net interest income in 2006 is largely driven bya decline in trading-related net interest income caused by a higher proportion of nonin-terest-bearing net trading assets to total net trading assets, higher funding costs com-pared with the prior year, and spread compression due to the inverted yield curve inplace for most of 2006.
(d) Total Net revenue includes tax-equivalent adjustments, primarily due to tax-exemptincome from municipal bond investments and income tax credits related to affordablehousing investments, of $927 million, $802 million and $752 million for 2007, 2006and 2005, respectively.
(e) TSS was charged a credit reimbursement related to certain exposures managed with-in the IB credit portfolio on behalf of clients shared with TSS.
(f) For 2006, the Compensation expense to Total net revenue ratio is adjusted to presentthis ratio as if SFAS 123R had always been in effect. IB management believes thatadjusting the Compensation expense to Total net revenue ratio for the incrementalimpact of adopting SFAS 123R provides a more meaningful measure of IB’sCompensation expense to Total net revenue ratio.
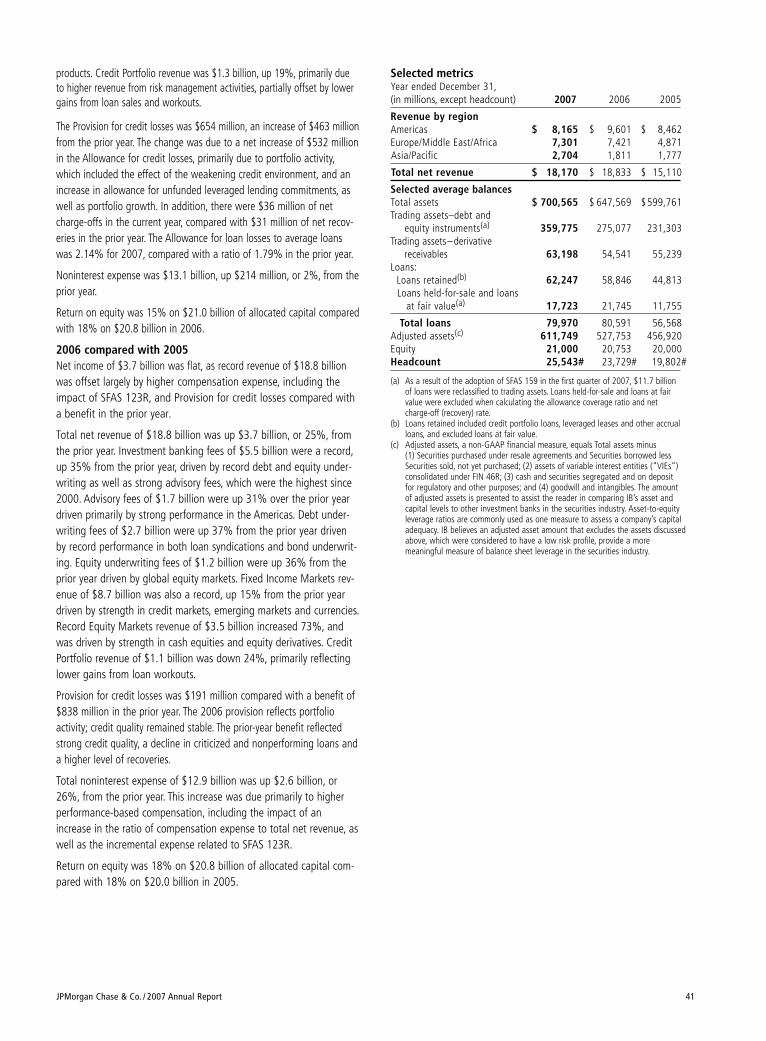
products. Credit Portfolio revenue was $1.3 billion, up 19%, primarily dueto higher revenue from risk management activities, partially offset by lowergains from loan sales and workouts.
The Provision for credit losses was $654 million, an increase of $463 millionfrom the prior year. The change was due to a net increase of $532 millionin the Allowance for credit losses, primarily due to portfolio activity,which included the effect of the weakening credit environment, and anincrease in allowance for unfunded leveraged lending commitments, aswell as portfolio growth. In addition, there were $36 million of netcharge-offs in the current year, compared with $31 million of net recov-eries in the prior year. The Allowance for loan losses to average loanswas 2.14% for 2007, compared with a ratio of 1.79% in the prior year.
Noninterest expense was $13.1 billion, up $214 million, or 2%, from theprior year.
Return on equity was 15% on $21.0 billion of allocated capital comparedwith 18% on $20.8 billion in 2006.
2006 compared with 2005Net income of $3.7 billion was flat, as record revenue of $18.8 billionwas offset largely by higher compensation expense, including theimpact of SFAS 123R, and Provision for credit losses compared witha benefit in the prior year.
Total net revenue of $18.8 billion was up $3.7 billion, or 25%, fromthe prior year. Investment banking fees of $5.5 billion were a record,up 35% from the prior year, driven by record debt and equity under-writing as well as strong advisory fees, which were the highest since2000. Advisory fees of $1.7 billion were up 31% over the prior yeardriven primarily by strong performance in the Americas. Debt under-writing fees of $2.7 billion were up 37% from the prior year drivenby record performance in both loan syndications and bond underwrit-ing. Equity underwriting fees of $1.2 billion were up 36% from theprior year driven by global equity markets. Fixed Income Markets rev-enue of $8.7 billion was also a record, up 15% from the prior yeardriven by strength in credit markets, emerging markets and currencies.Record Equity Markets revenue of $3.5 billion increased 73%, andwas driven by strength in cash equities and equity derivatives. CreditPortfolio revenue of $1.1 billion was down 24%, primarily reflectinglower gains from loan workouts.
Provision for credit losses was $191 million compared with a benefit of$838 million in the prior year. The 2006 provision reflects portfolioactivity; credit quality remained stable. The prior-year benefit reflectedstrong credit quality, a decline in criticized and nonperforming loans anda higher level of recoveries.
Total noninterest expense of $12.9 billion was up $2.6 billion, or26%, from the prior year. This increase was due primarily to higherperformance-based compensation, including the impact of anincrease in the ratio of compensation expense to total net revenue, aswell as the incremental expense related to SFAS 123R.
Return on equity was 18% on $20.8 billion of allocated capital com-pared with 18% on $20.0 billion in 2005.
JPMorgan Chase & Co. / 2007 Annual Report 41
Selected metricsYear ended December 31,(in millions, except headcount) 2007 2006 2005
Revenue by regionAmericas $ 8,165 $ 9,601 $ 8,462Europe/Middle East/Africa 7,301 7,421 4,871Asia/Pacific 2,704 1,811 1,777
Total net revenue $ 18,170 $ 18,833 $ 15,110
Selected average balancesTotal assets $ 700,565 $ 647,569 $599,761Trading assets–debt and
equity instruments(a) 359,775 275,077 231,303Trading assets–derivative
receivables 63,198 54,541 55,239Loans:
Loans retained(b) 62,247 58,846 44,813Loans held-for-sale and loans
at fair value(a) 17,723 21,745 11,755
Total loans 79,970 80,591 56,568Adjusted assets(c) 611,749 527,753 456,920Equity 21,000 20,753 20,000Headcount 25,543# 23,729# 19,802#
(a) As a result of the adoption of SFAS 159 in the first quarter of 2007, $11.7 billion of loans were reclassified to trading assets. Loans held-for-sale and loans at fair value were excluded when calculating the allowance coverage ratio and net charge-off (recovery) rate.
(b) Loans retained included credit portfolio loans, leveraged leases and other accrualloans, and excluded loans at fair value.
(c) Adjusted assets, a non-GAAP financial measure, equals Total assets minus (1) Securities purchased under resale agreements and Securities borrowed lessSecurities sold, not yet purchased; (2) assets of variable interest entities (“VIEs”)consolidated under FIN 46R; (3) cash and securities segregated and on deposit for regulatory and other purposes; and (4) goodwill and intangibles. The amount of adjusted assets is presented to assist the reader in comparing IB’s asset and capital levels to other investment banks in the securities industry. Asset-to-equityleverage ratios are commonly used as one measure to assess a company’s capitaladequacy. IB believes an adjusted asset amount that excludes the assets discussedabove, which were considered to have a low risk profile, provide a more meaningful measure of balance sheet leverage in the securities industry.
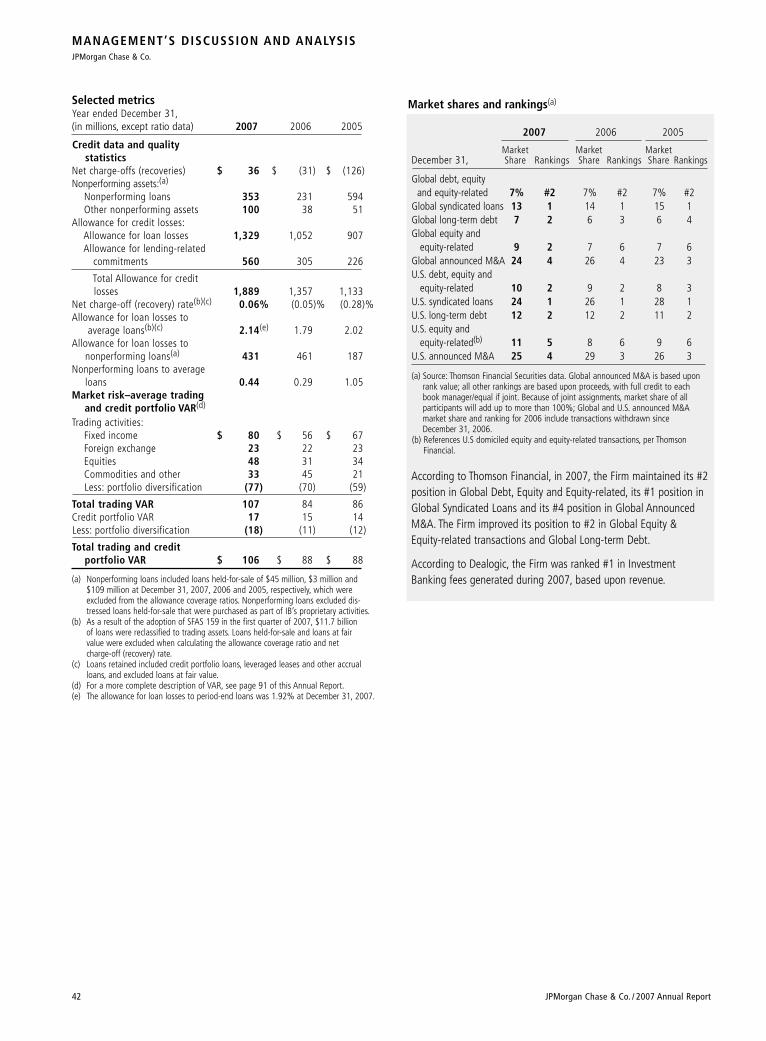
Market shares and rankings(a)
2007 2006 2005
Market Market MarketDecember 31, Share Rankings Share Rankings Share Rankings
Global debt, equity and equity-related 7% #2 7% #2 7% #2
Global syndicated loans 13 1 14 1 15 1Global long-term debt 7 2 6 3 6 4Global equity and
equity-related 9 2 7 6 7 6Global announced M&A 24 4 26 4 23 3U.S. debt, equity and
equity-related 10 2 9 2 8 3U.S. syndicated loans 24 1 26 1 28 1U.S. long-term debt 12 2 12 2 11 2U.S. equity and
equity-related(b) 11 5 8 6 9 6U.S. announced M&A 25 4 29 3 26 3
(a) Source: Thomson Financial Securities data. Global announced M&A is based uponrank value; all other rankings are based upon proceeds, with full credit to each book manager/equal if joint. Because of joint assignments, market share of all participants will add up to more than 100%; Global and U.S. announced M&A market share and ranking for 2006 include transactions withdrawn since December 31, 2006.
(b) References U.S domiciled equity and equity-related transactions, per ThomsonFinancial.
According to Thomson Financial, in 2007, the Firm maintained its #2position in Global Debt, Equity and Equity-related, its #1 position inGlobal Syndicated Loans and its #4 position in Global AnnouncedM&A. The Firm improved its position to #2 in Global Equity &Equity-related transactions and Global Long-term Debt.
According to Dealogic, the Firm was ranked #1 in InvestmentBanking fees generated during 2007, based upon revenue.
MANAGEMENT’S DISCUSSION AND ANALYSISJPMorgan Chase & Co.
42 JPMorgan Chase & Co. / 2007 Annual Report
Selected metricsYear ended December 31,(in millions, except ratio data) 2007 2006 2005
Credit data and quality statistics
Net charge-offs (recoveries) $ 36 $ (31) $ (126)Nonperforming assets:(a)
Nonperforming loans 353 231 594Other nonperforming assets 100 38 51
Allowance for credit losses:Allowance for loan losses 1,329 1,052 907Allowance for lending-related
commitments 560 305 226
Total Allowance for credit losses 1,889 1,357 1,133
Net charge-off (recovery) rate(b)(c) 0.06% (0.05)% (0.28)%Allowance for loan losses to
average loans(b)(c) 2.14(e) 1.79 2.02Allowance for loan losses to
nonperforming loans(a) 431 461 187Nonperforming loans to average
loans 0.44 0.29 1.05Market risk–average trading
and credit portfolio VAR(d)
Trading activities:Fixed income $ 80 $ 56 $ 67Foreign exchange 23 22 23Equities 48 31 34Commodities and other 33 45 21Less: portfolio diversification (77) (70) (59)
Total trading VAR 107 84 86Credit portfolio VAR 17 15 14Less: portfolio diversification (18) (11) (12)
Total trading and credit portfolio VAR $ 106 $ 88 $ 88
(a) Nonperforming loans included loans held-for-sale of $45 million, $3 million and $109 million at December 31, 2007, 2006 and 2005, respectively, which wereexcluded from the allowance coverage ratios. Nonperforming loans excluded dis-tressed loans held-for-sale that were purchased as part of IB’s proprietary activities.
(b) As a result of the adoption of SFAS 159 in the first quarter of 2007, $11.7 billion of loans were reclassified to trading assets. Loans held-for-sale and loans at fair value were excluded when calculating the allowance coverage ratio and net charge-off (recovery) rate.
(c) Loans retained included credit portfolio loans, leveraged leases and other accrualloans, and excluded loans at fair value.
(d) For a more complete description of VAR, see page 91 of this Annual Report.(e) The allowance for loan losses to period-end loans was 1.92% at December 31, 2007.
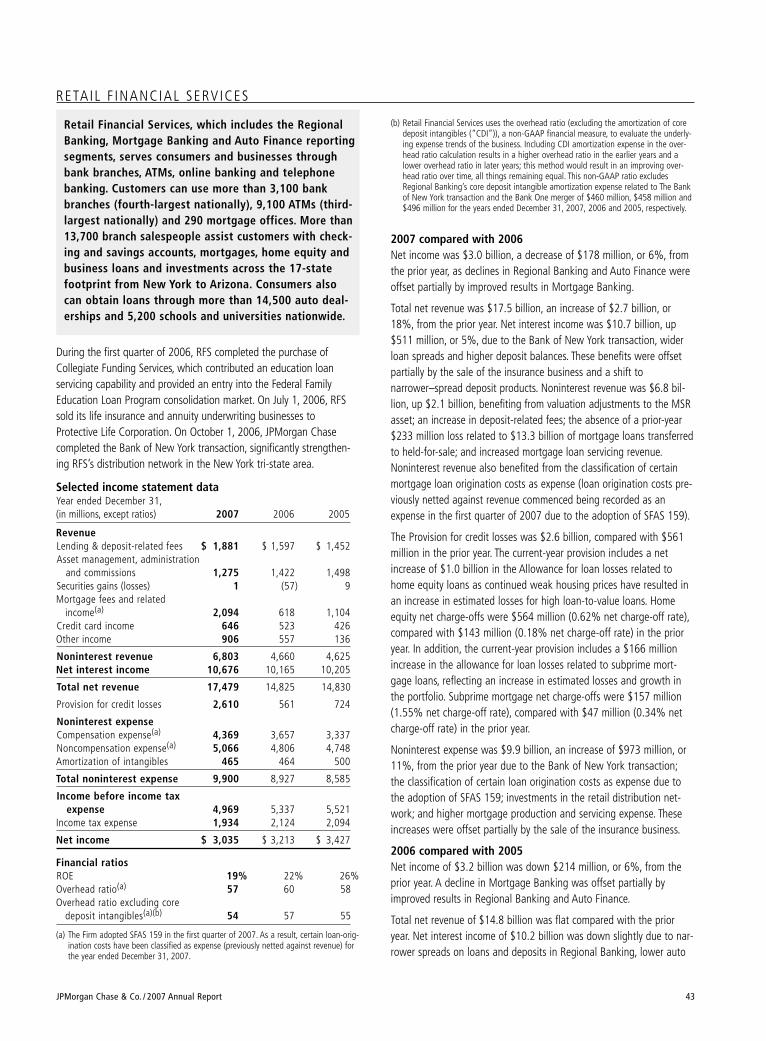
RETAIL F INANCIAL SERVICES
Retail Financial Services, which includes the RegionalBanking, Mortgage Banking and Auto Finance reportingsegments, serves consumers and businesses throughbank branches, ATMs, online banking and telephonebanking. Customers can use more than 3,100 bankbranches (fourth-largest nationally), 9,100 ATMs (third-largest nationally) and 290 mortgage offices. More than13,700 branch salespeople assist customers with check-ing and savings accounts, mortgages, home equity andbusiness loans and investments across the 17-statefootprint from New York to Arizona. Consumers alsocan obtain loans through more than 14,500 auto deal-erships and 5,200 schools and universities nationwide.
During the first quarter of 2006, RFS completed the purchase ofCollegiate Funding Services, which contributed an education loanservicing capability and provided an entry into the Federal FamilyEducation Loan Program consolidation market. On July 1, 2006, RFSsold its life insurance and annuity underwriting businesses toProtective Life Corporation. On October 1, 2006, JPMorgan Chasecompleted the Bank of New York transaction, significantly strengthen-ing RFS’s distribution network in the New York tri-state area.
Selected income statement data Year ended December 31,(in millions, except ratios) 2007 2006 2005
RevenueLending & deposit-related fees $ 1,881 $ 1,597 $ 1,452Asset management, administration
and commissions 1,275 1,422 1,498Securities gains (losses) 1 (57) 9Mortgage fees and related
income(a) 2,094 618 1,104Credit card income 646 523 426Other income 906 557 136
Noninterest revenue 6,803 4,660 4,625Net interest income 10,676 10,165 10,205
Total net revenue 17,479 14,825 14,830
Provision for credit losses 2,610 561 724
Noninterest expenseCompensation expense(a) 4,369 3,657 3,337Noncompensation expense(a) 5,066 4,806 4,748Amortization of intangibles 465 464 500
Total noninterest expense 9,900 8,927 8,585
Income before income taxexpense 4,969 5,337 5,521
Income tax expense 1,934 2,124 2,094
Net income $ 3,035 $ 3,213 $ 3,427
Financial ratiosROE 19% 22% 26%Overhead ratio(a) 57 60 58Overhead ratio excluding core
deposit intangibles(a)(b) 54 57 55
(a) The Firm adopted SFAS 159 in the first quarter of 2007. As a result, certain loan-orig-ination costs have been classified as expense (previously netted against revenue) forthe year ended December 31, 2007.
JPMorgan Chase & Co. / 2007 Annual Report 43
(b) Retail Financial Services uses the overhead ratio (excluding the amortization of coredeposit intangibles (“CDI”)), a non-GAAP financial measure, to evaluate the underly-ing expense trends of the business. Including CDI amortization expense in the over-head ratio calculation results in a higher overhead ratio in the earlier years and alower overhead ratio in later years; this method would result in an improving over-head ratio over time, all things remaining equal. This non-GAAP ratio excludesRegional Banking’s core deposit intangible amortization expense related to The Bankof New York transaction and the Bank One merger of $460 million, $458 million and$496 million for the years ended December 31, 2007, 2006 and 2005, respectively.
2007 compared with 2006Net income was $3.0 billion, a decrease of $178 million, or 6%, fromthe prior year, as declines in Regional Banking and Auto Finance wereoffset partially by improved results in Mortgage Banking.
Total net revenue was $17.5 billion, an increase of $2.7 billion, or18%, from the prior year. Net interest income was $10.7 billion, up$511 million, or 5%, due to the Bank of New York transaction, widerloan spreads and higher deposit balances. These benefits were offsetpartially by the sale of the insurance business and a shift tonarrower–spread deposit products. Noninterest revenue was $6.8 bil-lion, up $2.1 billion, benefiting from valuation adjustments to the MSRasset; an increase in deposit-related fees; the absence of a prior-year$233 million loss related to $13.3 billion of mortgage loans transferredto held-for-sale; and increased mortgage loan servicing revenue.Noninterest revenue also benefited from the classification of certainmortgage loan origination costs as expense (loan origination costs pre-viously netted against revenue commenced being recorded as anexpense in the first quarter of 2007 due to the adoption of SFAS 159).
The Provision for credit losses was $2.6 billion, compared with $561million in the prior year. The current-year provision includes a netincrease of $1.0 billion in the Allowance for loan losses related tohome equity loans as continued weak housing prices have resulted inan increase in estimated losses for high loan-to-value loans. Homeequity net charge-offs were $564 million (0.62% net charge-off rate),compared with $143 million (0.18% net charge-off rate) in the prioryear. In addition, the current-year provision includes a $166 millionincrease in the allowance for loan losses related to subprime mort-gage loans, reflecting an increase in estimated losses and growth inthe portfolio. Subprime mortgage net charge-offs were $157 million(1.55% net charge-off rate), compared with $47 million (0.34% netcharge-off rate) in the prior year.
Noninterest expense was $9.9 billion, an increase of $973 million, or11%, from the prior year due to the Bank of New York transaction;the classification of certain loan origination costs as expense due tothe adoption of SFAS 159; investments in the retail distribution net-work; and higher mortgage production and servicing expense. Theseincreases were offset partially by the sale of the insurance business.
2006 compared with 2005Net income of $3.2 billion was down $214 million, or 6%, from theprior year. A decline in Mortgage Banking was offset partially byimproved results in Regional Banking and Auto Finance.
Total net revenue of $14.8 billion was flat compared with the prioryear. Net interest income of $10.2 billion was down slightly due to nar-rower spreads on loans and deposits in Regional Banking, lower auto
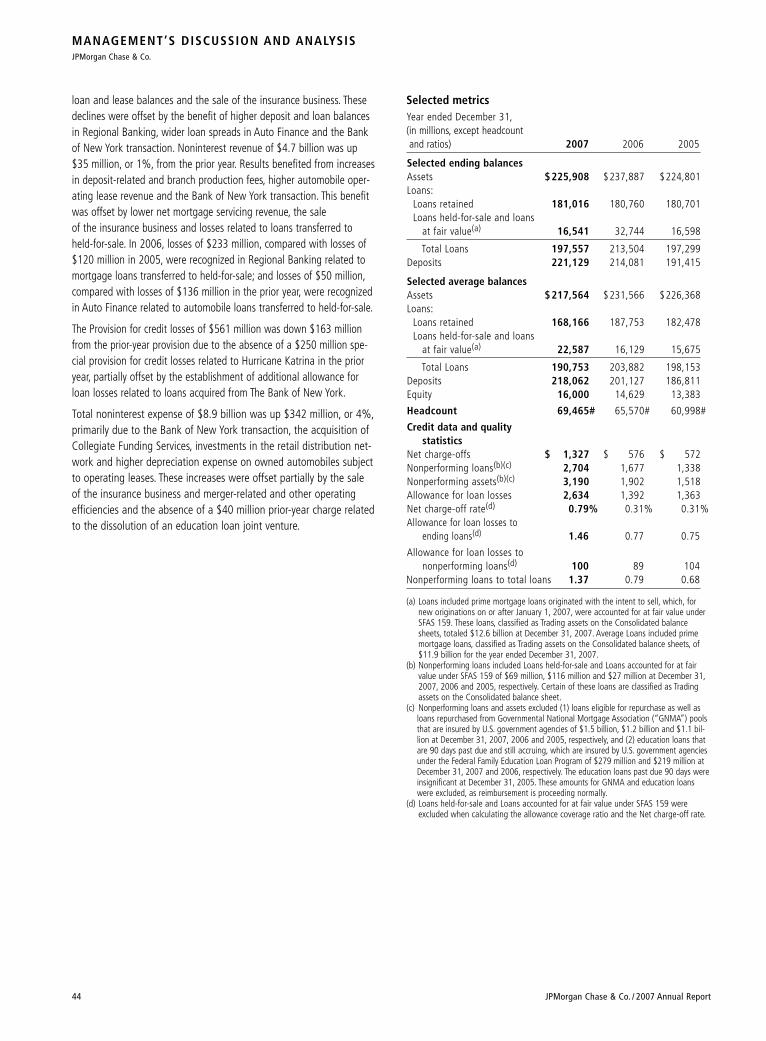
MANAGEMENT’S DISCUSSION AND ANALYSISJPMorgan Chase & Co.
44 JPMorgan Chase & Co. / 2007 Annual Report
loan and lease balances and the sale of the insurance business. Thesedeclines were offset by the benefit of higher deposit and loan balancesin Regional Banking, wider loan spreads in Auto Finance and the Bankof New York transaction. Noninterest revenue of $4.7 billion was up$35 million, or 1%, from the prior year. Results benefited from increasesin deposit-related and branch production fees, higher automobile oper-ating lease revenue and the Bank of New York transaction. This benefitwas offset by lower net mortgage servicing revenue, the sale of the insurance business and losses related to loans transferred toheld-for-sale. In 2006, losses of $233 million, compared with losses of$120 million in 2005, were recognized in Regional Banking related tomortgage loans transferred to held-for-sale; and losses of $50 million,compared with losses of $136 million in the prior year, were recognizedin Auto Finance related to automobile loans transferred to held-for-sale.
The Provision for credit losses of $561 million was down $163 millionfrom the prior-year provision due to the absence of a $250 million spe-cial provision for credit losses related to Hurricane Katrina in the prioryear, partially offset by the establishment of additional allowance forloan losses related to loans acquired from The Bank of New York.
Total noninterest expense of $8.9 billion was up $342 million, or 4%,primarily due to the Bank of New York transaction, the acquisition ofCollegiate Funding Services, investments in the retail distribution net-work and higher depreciation expense on owned automobiles subjectto operating leases. These increases were offset partially by the saleof the insurance business and merger-related and other operatingefficiencies and the absence of a $40 million prior-year charge relatedto the dissolution of an education loan joint venture.
Selected metricsYear ended December 31,(in millions, except headcount and ratios) 2007 2006 2005
Selected ending balancesAssets $225,908 $237,887 $224,801Loans:
Loans retained 181,016 180,760 180,701Loans held-for-sale and loans
at fair value(a) 16,541 32,744 16,598
Total Loans 197,557 213,504 197,299Deposits 221,129 214,081 191,415
Selected average balancesAssets $217,564 $231,566 $226,368Loans:
Loans retained 168,166 187,753 182,478Loans held-for-sale and loans
at fair value(a) 22,587 16,129 15,675
Total Loans 190,753 203,882 198,153Deposits 218,062 201,127 186,811Equity 16,000 14,629 13,383
Headcount 69,465# 65,570# 60,998#
Credit data and quality statistics
Net charge-offs $ 1,327 $ 576 $ 572Nonperforming loans(b)(c) 2,704 1,677 1,338Nonperforming assets(b)(c) 3,190 1,902 1,518Allowance for loan losses 2,634 1,392 1,363Net charge-off rate(d) 0.79% 0.31% 0.31%Allowance for loan losses to
ending loans(d) 1.46 0.77 0.75
Allowance for loan losses to nonperforming loans(d) 100 89 104
Nonperforming loans to total loans 1.37 0.79 0.68
(a) Loans included prime mortgage loans originated with the intent to sell, which, fornew originations on or after January 1, 2007, were accounted for at fair value underSFAS 159. These loans, classified as Trading assets on the Consolidated balancesheets, totaled $12.6 billion at December 31, 2007. Average Loans included primemortgage loans, classified as Trading assets on the Consolidated balance sheets, of$11.9 billion for the year ended December 31, 2007.
(b) Nonperforming loans included Loans held-for-sale and Loans accounted for at fairvalue under SFAS 159 of $69 million, $116 million and $27 million at December 31,2007, 2006 and 2005, respectively. Certain of these loans are classified as Tradingassets on the Consolidated balance sheet.
(c) Nonperforming loans and assets excluded (1) loans eligible for repurchase as well asloans repurchased from Governmental National Mortgage Association (“GNMA”) poolsthat are insured by U.S. government agencies of $1.5 billion, $1.2 billion and $1.1 bil-lion at December 31, 2007, 2006 and 2005, respectively, and (2) education loans thatare 90 days past due and still accruing, which are insured by U.S. government agenciesunder the Federal Family Education Loan Program of $279 million and $219 million atDecember 31, 2007 and 2006, respectively. The education loans past due 90 days wereinsignificant at December 31, 2005. These amounts for GNMA and education loanswere excluded, as reimbursement is proceeding normally.
(d) Loans held-for-sale and Loans accounted for at fair value under SFAS 159 wereexcluded when calculating the allowance coverage ratio and the Net charge-off rate.
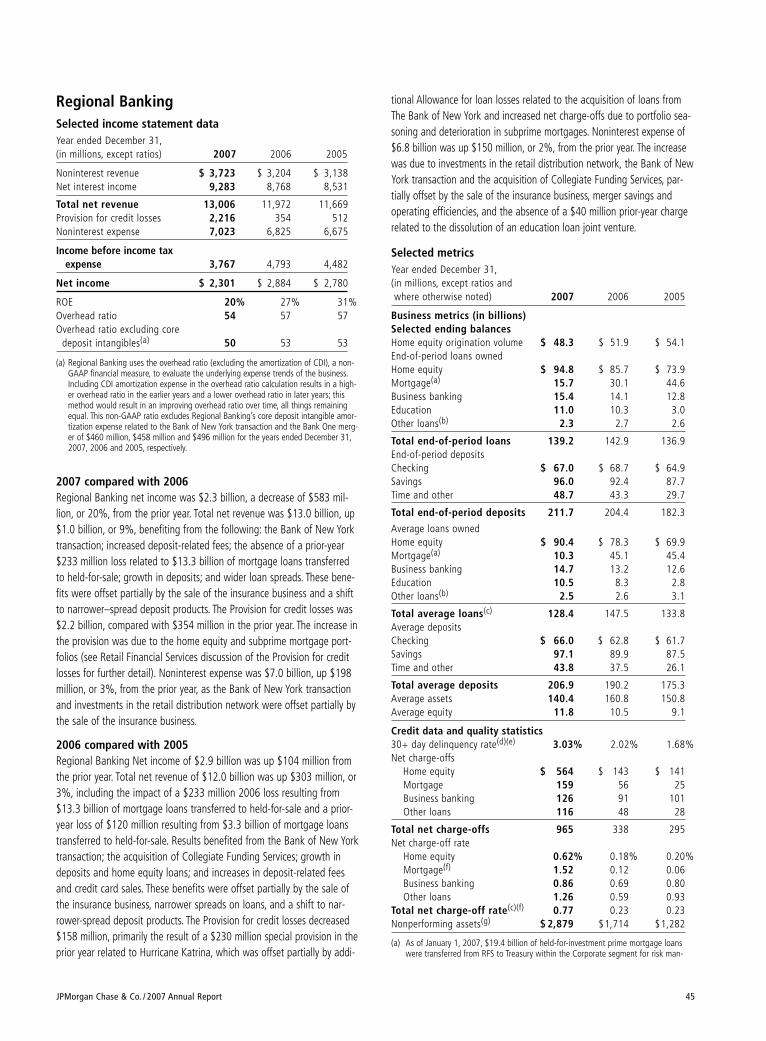
JPMorgan Chase & Co. / 2007 Annual Report 45
tional Allowance for loan losses related to the acquisition of loans fromThe Bank of New York and increased net charge-offs due to portfolio sea-soning and deterioration in subprime mortgages. Noninterest expense of$6.8 billion was up $150 million, or 2%, from the prior year. The increasewas due to investments in the retail distribution network, the Bank of NewYork transaction and the acquisition of Collegiate Funding Services, par-tially offset by the sale of the insurance business, merger savings andoperating efficiencies, and the absence of a $40 million prior-year chargerelated to the dissolution of an education loan joint venture.
Selected metrics Year ended December 31,(in millions, except ratios and where otherwise noted) 2007 2006 2005
Business metrics (in billions)Selected ending balancesHome equity origination volume $ 48.3 $ 51.9 $ 54.1End-of-period loans ownedHome equity $ 94.8 $ 85.7 $ 73.9Mortgage(a) 15.7 30.1 44.6Business banking 15.4 14.1 12.8Education 11.0 10.3 3.0Other loans(b) 2.3 2.7 2.6
Total end-of-period loans 139.2 142.9 136.9End-of-period depositsChecking $ 67.0 $ 68.7 $ 64.9Savings 96.0 92.4 87.7Time and other 48.7 43.3 29.7
Total end-of-period deposits 211.7 204.4 182.3
Average loans ownedHome equity $ 90.4 $ 78.3 $ 69.9Mortgage(a) 10.3 45.1 45.4Business banking 14.7 13.2 12.6Education 10.5 8.3 2.8Other loans(b) 2.5 2.6 3.1
Total average loans(c) 128.4 147.5 133.8Average depositsChecking $ 66.0 $ 62.8 $ 61.7Savings 97.1 89.9 87.5Time and other 43.8 37.5 26.1
Total average deposits 206.9 190.2 175.3Average assets 140.4 160.8 150.8Average equity 11.8 10.5 9.1
Credit data and quality statistics30+ day delinquency rate(d)(e) 3.03% 2.02% 1.68%Net charge-offs
Home equity $ 564 $ 143 $ 141Mortgage 159 56 25Business banking 126 91 101Other loans 116 48 28
Total net charge-offs 965 338 295Net charge-off rate
Home equity 0.62% 0.18% 0.20%Mortgage(f) 1.52 0.12 0.06Business banking 0.86 0.69 0.80Other loans 1.26 0.59 0.93
Total net charge-off rate(c)(f) 0.77 0.23 0.23Nonperforming assets(g) $ 2,879 $1,714 $1,282
(a) As of January 1, 2007, $19.4 billion of held-for-investment prime mortgage loanswere transferred from RFS to Treasury within the Corporate segment for risk man-
Regional BankingSelected income statement data Year ended December 31,(in millions, except ratios) 2007 2006 2005
Noninterest revenue $ 3,723 $ 3,204 $ 3,138Net interest income 9,283 8,768 8,531
Total net revenue 13,006 11,972 11,669Provision for credit losses 2,216 354 512Noninterest expense 7,023 6,825 6,675
Income before income tax expense 3,767 4,793 4,482
Net income $ 2,301 $ 2,884 $ 2,780
ROE 20% 27% 31%Overhead ratio 54 57 57Overhead ratio excluding core
deposit intangibles(a) 50 53 53
(a) Regional Banking uses the overhead ratio (excluding the amortization of CDI), a non-GAAP financial measure, to evaluate the underlying expense trends of the business.Including CDI amortization expense in the overhead ratio calculation results in a high-er overhead ratio in the earlier years and a lower overhead ratio in later years; thismethod would result in an improving overhead ratio over time, all things remainingequal. This non-GAAP ratio excludes Regional Banking’s core deposit intangible amor-tization expense related to the Bank of New York transaction and the Bank One merg-er of $460 million, $458 million and $496 million for the years ended December 31,2007, 2006 and 2005, respectively.
2007 compared with 2006Regional Banking net income was $2.3 billion, a decrease of $583 mil-lion, or 20%, from the prior year. Total net revenue was $13.0 billion, up$1.0 billion, or 9%, benefiting from the following: the Bank of New Yorktransaction; increased deposit-related fees; the absence of a prior-year$233 million loss related to $13.3 billion of mortgage loans transferredto held-for-sale; growth in deposits; and wider loan spreads. These bene-fits were offset partially by the sale of the insurance business and a shiftto narrower–spread deposit products. The Provision for credit losses was$2.2 billion, compared with $354 million in the prior year. The increase inthe provision was due to the home equity and subprime mortgage port-folios (see Retail Financial Services discussion of the Provision for creditlosses for further detail). Noninterest expense was $7.0 billion, up $198million, or 3%, from the prior year, as the Bank of New York transactionand investments in the retail distribution network were offset partially bythe sale of the insurance business.
2006 compared with 2005Regional Banking Net income of $2.9 billion was up $104 million fromthe prior year. Total net revenue of $12.0 billion was up $303 million, or3%, including the impact of a $233 million 2006 loss resulting from$13.3 billion of mortgage loans transferred to held-for-sale and a prior-year loss of $120 million resulting from $3.3 billion of mortgage loanstransferred to held-for-sale. Results benefited from the Bank of New Yorktransaction; the acquisition of Collegiate Funding Services; growth indeposits and home equity loans; and increases in deposit-related feesand credit card sales. These benefits were offset partially by the sale ofthe insurance business, narrower spreads on loans, and a shift to nar-rower-spread deposit products. The Provision for credit losses decreased$158 million, primarily the result of a $230 million special provision in theprior year related to Hurricane Katrina, which was offset partially by addi-
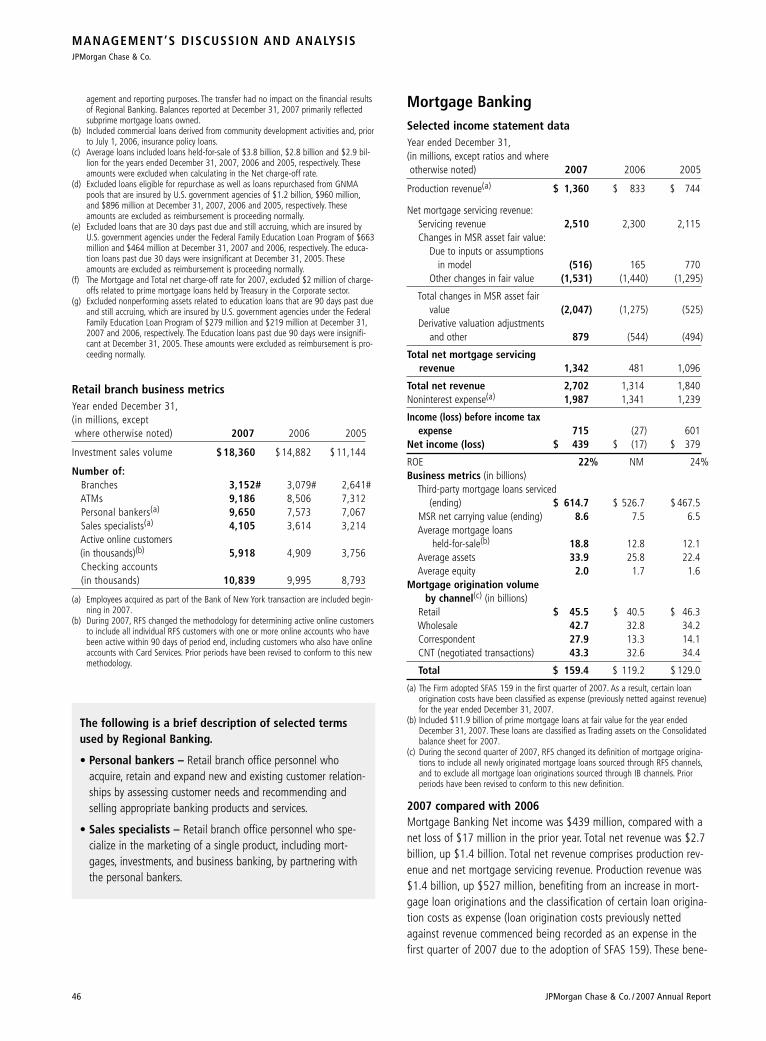
MANAGEMENT’S DISCUSSION AND ANALYSISJPMorgan Chase & Co.
46 JPMorgan Chase & Co. / 2007 Annual Report
agement and reporting purposes. The transfer had no impact on the financial resultsof Regional Banking. Balances reported at December 31, 2007 primarily reflectedsubprime mortgage loans owned.
(b) Included commercial loans derived from community development activities and, priorto July 1, 2006, insurance policy loans.
(c) Average loans included loans held-for-sale of $3.8 billion, $2.8 billion and $2.9 bil-lion for the years ended December 31, 2007, 2006 and 2005, respectively. Theseamounts were excluded when calculating in the Net charge-off rate.
(d) Excluded loans eligible for repurchase as well as loans repurchased from GNMApools that are insured by U.S. government agencies of $1.2 billion, $960 million,and $896 million at December 31, 2007, 2006 and 2005, respectively. Theseamounts are excluded as reimbursement is proceeding normally.
(e) Excluded loans that are 30 days past due and still accruing, which are insured byU.S. government agencies under the Federal Family Education Loan Program of $663million and $464 million at December 31, 2007 and 2006, respectively. The educa-tion loans past due 30 days were insignificant at December 31, 2005. Theseamounts are excluded as reimbursement is proceeding normally.
(f) The Mortgage and Total net charge-off rate for 2007, excluded $2 million of charge-offs related to prime mortgage loans held by Treasury in the Corporate sector.
(g) Excluded nonperforming assets related to education loans that are 90 days past dueand still accruing, which are insured by U.S. government agencies under the FederalFamily Education Loan Program of $279 million and $219 million at December 31,2007 and 2006, respectively. The Education loans past due 90 days were insignifi-cant at December 31, 2005. These amounts were excluded as reimbursement is pro-ceeding normally.
Retail branch business metricsYear ended December 31,(in millions, except where otherwise noted) 2007 2006 2005
Investment sales volume $ 18,360 $ 14,882 $ 11,144
Number of:Branches 3,152# 3,079# 2,641#ATMs 9,186 8,506 7,312Personal bankers(a) 9,650 7,573 7,067Sales specialists(a) 4,105 3,614 3,214Active online customers (in thousands)(b) 5,918 4,909 3,756Checking accounts (in thousands) 10,839 9,995 8,793
(a) Employees acquired as part of the Bank of New York transaction are included begin-ning in 2007.
(b) During 2007, RFS changed the methodology for determining active online customersto include all individual RFS customers with one or more online accounts who havebeen active within 90 days of period end, including customers who also have onlineaccounts with Card Services. Prior periods have been revised to conform to this newmethodology.
Mortgage Banking Selected income statement dataYear ended December 31,(in millions, except ratios and where otherwise noted) 2007 2006 2005
Production revenue(a) $ 1,360 $ 833 $ 744
Net mortgage servicing revenue:Servicing revenue 2,510 2,300 2,115Changes in MSR asset fair value:
Due to inputs or assumptionsin model (516) 165 770
Other changes in fair value (1,531) (1,440) (1,295)
Total changes in MSR asset fair value (2,047) (1,275) (525)
Derivative valuation adjustments and other 879 (544) (494)
Total net mortgage servicing revenue 1,342 481 1,096
Total net revenue 2,702 1,314 1,840Noninterest expense(a) 1,987 1,341 1,239
Income (loss) before income tax expense 715 (27) 601
Net income (loss) $ 439 $ (17) $ 379
ROE 22% NM 24%Business metrics (in billions)
Third-party mortgage loans serviced(ending) $ 614.7 $ 526.7 $ 467.5
MSR net carrying value (ending) 8.6 7.5 6.5Average mortgage loans
held-for-sale(b) 18.8 12.8 12.1Average assets 33.9 25.8 22.4Average equity 2.0 1.7 1.6
Mortgage origination volumeby channel(c) (in billions)
Retail $ 45.5 $ 40.5 $ 46.3Wholesale 42.7 32.8 34.2Correspondent 27.9 13.3 14.1CNT (negotiated transactions) 43.3 32.6 34.4
Total $ 159.4 $ 119.2 $ 129.0
(a) The Firm adopted SFAS 159 in the first quarter of 2007. As a result, certain loan origination costs have been classified as expense (previously netted against revenue)for the year ended December 31, 2007.
(b) Included $11.9 billion of prime mortgage loans at fair value for the year endedDecember 31, 2007. These loans are classified as Trading assets on the Consolidatedbalance sheet for 2007.
(c) During the second quarter of 2007, RFS changed its definition of mortgage origina-tions to include all newly originated mortgage loans sourced through RFS channels,and to exclude all mortgage loan originations sourced through IB channels. Priorperiods have been revised to conform to this new definition.
2007 compared with 2006Mortgage Banking Net income was $439 million, compared with anet loss of $17 million in the prior year. Total net revenue was $2.7billion, up $1.4 billion. Total net revenue comprises production rev-enue and net mortgage servicing revenue. Production revenue was$1.4 billion, up $527 million, benefiting from an increase in mort-gage loan originations and the classification of certain loan origina-tion costs as expense (loan origination costs previously nettedagainst revenue commenced being recorded as an expense in thefirst quarter of 2007 due to the adoption of SFAS 159). These bene-
The following is a brief description of selected termsused by Regional Banking.
• Personal bankers – Retail branch office personnel whoacquire, retain and expand new and existing customer relation-ships by assessing customer needs and recommending andselling appropriate banking products and services.
• Sales specialists – Retail branch office personnel who spe-cialize in the marketing of a single product, including mort-gages, investments, and business banking, by partnering withthe personal bankers.
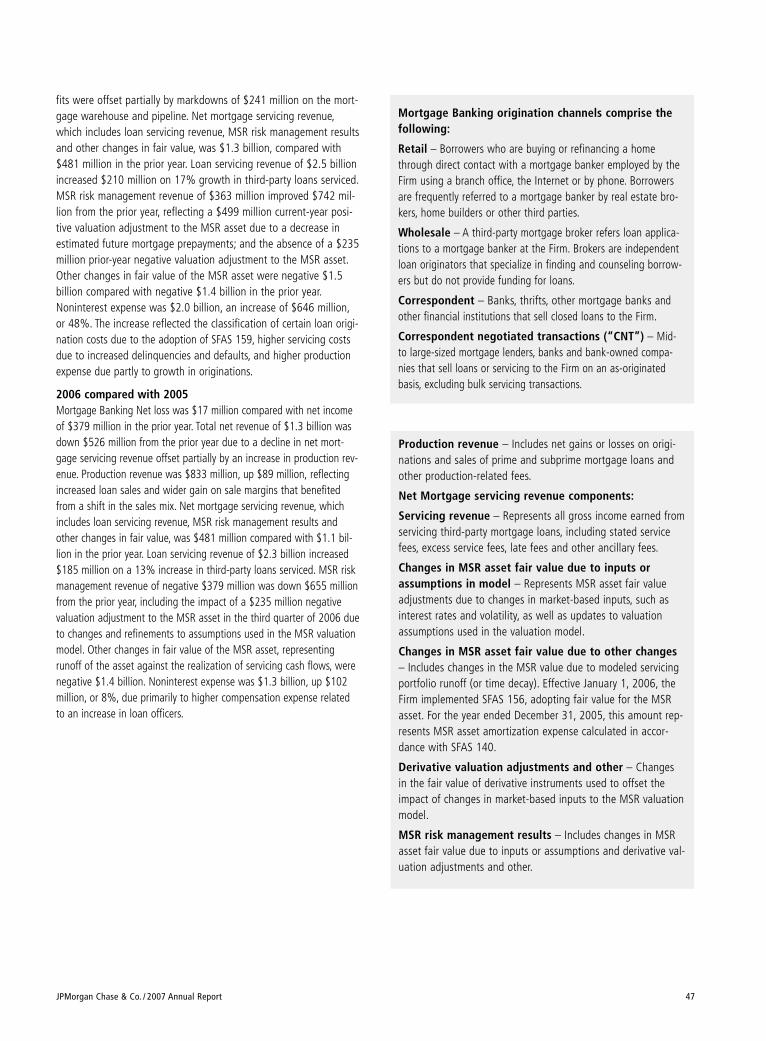
JPMorgan Chase & Co. / 2007 Annual Report 47
fits were offset partially by markdowns of $241 million on the mort-gage warehouse and pipeline. Net mortgage servicing revenue,which includes loan servicing revenue, MSR risk management resultsand other changes in fair value, was $1.3 billion, compared with$481 million in the prior year. Loan servicing revenue of $2.5 billionincreased $210 million on 17% growth in third-party loans serviced.MSR risk management revenue of $363 million improved $742 mil-lion from the prior year, reflecting a $499 million current-year posi-tive valuation adjustment to the MSR asset due to a decrease inestimated future mortgage prepayments; and the absence of a $235million prior-year negative valuation adjustment to the MSR asset.Other changes in fair value of the MSR asset were negative $1.5billion compared with negative $1.4 billion in the prior year.Noninterest expense was $2.0 billion, an increase of $646 million,or 48%. The increase reflected the classification of certain loan origi-nation costs due to the adoption of SFAS 159, higher servicing costsdue to increased delinquencies and defaults, and higher productionexpense due partly to growth in originations.
2006 compared with 2005Mortgage Banking Net loss was $17 million compared with net incomeof $379 million in the prior year. Total net revenue of $1.3 billion wasdown $526 million from the prior year due to a decline in net mort-gage servicing revenue offset partially by an increase in production rev-enue. Production revenue was $833 million, up $89 million, reflectingincreased loan sales and wider gain on sale margins that benefitedfrom a shift in the sales mix. Net mortgage servicing revenue, whichincludes loan servicing revenue, MSR risk management results andother changes in fair value, was $481 million compared with $1.1 bil-lion in the prior year. Loan servicing revenue of $2.3 billion increased$185 million on a 13% increase in third-party loans serviced. MSR riskmanagement revenue of negative $379 million was down $655 millionfrom the prior year, including the impact of a $235 million negativevaluation adjustment to the MSR asset in the third quarter of 2006 dueto changes and refinements to assumptions used in the MSR valuationmodel. Other changes in fair value of the MSR asset, representingrunoff of the asset against the realization of servicing cash flows, werenegative $1.4 billion. Noninterest expense was $1.3 billion, up $102million, or 8%, due primarily to higher compensation expense relatedto an increase in loan officers.
Mortgage Banking origination channels comprise thefollowing:
Retail – Borrowers who are buying or refinancing a homethrough direct contact with a mortgage banker employed by theFirm using a branch office, the Internet or by phone. Borrowersare frequently referred to a mortgage banker by real estate bro-kers, home builders or other third parties.
Wholesale – A third-party mortgage broker refers loan applica-tions to a mortgage banker at the Firm. Brokers are independentloan originators that specialize in finding and counseling borrow-ers but do not provide funding for loans.
Correspondent – Banks, thrifts, other mortgage banks andother financial institutions that sell closed loans to the Firm.
Correspondent negotiated transactions (“CNT”) – Mid-to large-sized mortgage lenders, banks and bank-owned compa-nies that sell loans or servicing to the Firm on an as-originatedbasis, excluding bulk servicing transactions.
Production revenue – Includes net gains or losses on origi-nations and sales of prime and subprime mortgage loans andother production-related fees.
Net Mortgage servicing revenue components:
Servicing revenue – Represents all gross income earned fromservicing third-party mortgage loans, including stated servicefees, excess service fees, late fees and other ancillary fees.
Changes in MSR asset fair value due to inputs orassumptions in model – Represents MSR asset fair valueadjustments due to changes in market-based inputs, such asinterest rates and volatility, as well as updates to valuationassumptions used in the valuation model.
Changes in MSR asset fair value due to other changes– Includes changes in the MSR value due to modeled servicingportfolio runoff (or time decay). Effective January 1, 2006, theFirm implemented SFAS 156, adopting fair value for the MSRasset. For the year ended December 31, 2005, this amount rep-resents MSR asset amortization expense calculated in accor-dance with SFAS 140.
Derivative valuation adjustments and other – Changes in the fair value of derivative instruments used to offset theimpact of changes in market-based inputs to the MSR valuationmodel.
MSR risk management results – Includes changes in MSRasset fair value due to inputs or assumptions and derivative val-uation adjustments and other.
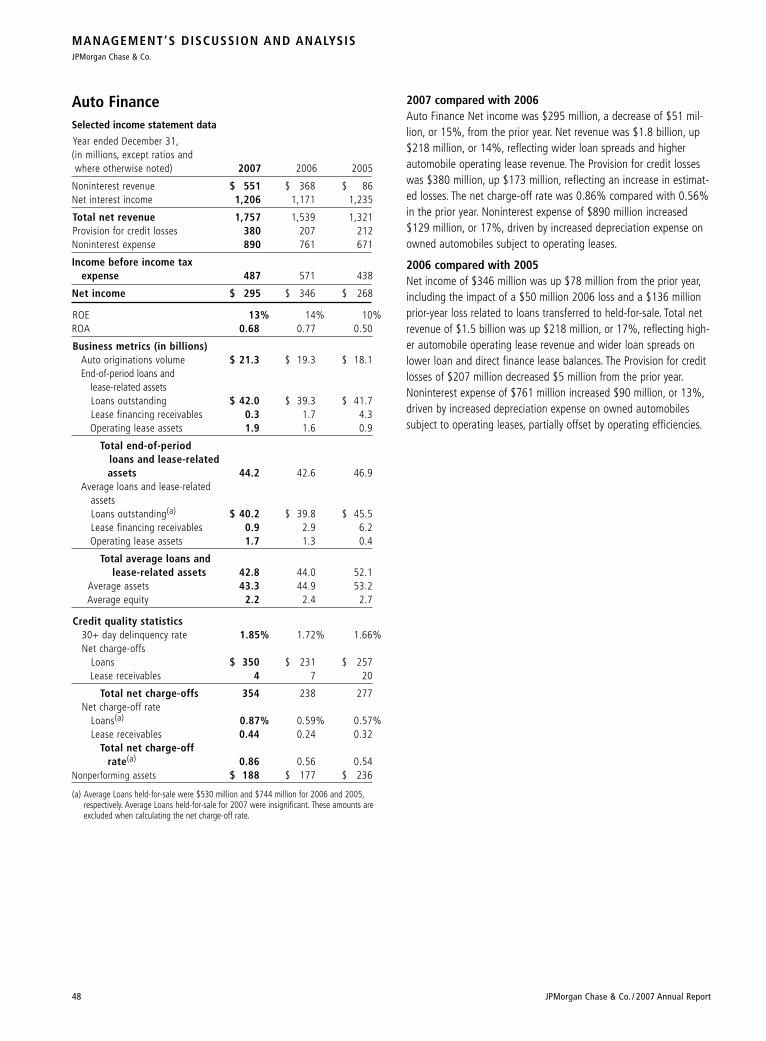
MANAGEMENT’S DISCUSSION AND ANALYSISJPMorgan Chase & Co.
48 JPMorgan Chase & Co. / 2007 Annual Report
2007 compared with 2006Auto Finance Net income was $295 million, a decrease of $51 mil-lion, or 15%, from the prior year. Net revenue was $1.8 billion, up$218 million, or 14%, reflecting wider loan spreads and higherautomobile operating lease revenue. The Provision for credit losseswas $380 million, up $173 million, reflecting an increase in estimat-ed losses. The net charge-off rate was 0.86% compared with 0.56%in the prior year. Noninterest expense of $890 million increased$129 million, or 17%, driven by increased depreciation expense onowned automobiles subject to operating leases.
2006 compared with 2005Net income of $346 million was up $78 million from the prior year,including the impact of a $50 million 2006 loss and a $136 millionprior-year loss related to loans transferred to held-for-sale. Total netrevenue of $1.5 billion was up $218 million, or 17%, reflecting high-er automobile operating lease revenue and wider loan spreads onlower loan and direct finance lease balances. The Provision for creditlosses of $207 million decreased $5 million from the prior year.Noninterest expense of $761 million increased $90 million, or 13%,driven by increased depreciation expense on owned automobilessubject to operating leases, partially offset by operating efficiencies.
Auto FinanceSelected income statement data
Year ended December 31,(in millions, except ratios andwhere otherwise noted) 2007 2006 2005
Noninterest revenue $ 551 $ 368 $ 86Net interest income 1,206 1,171 1,235
Total net revenue 1,757 1,539 1,321Provision for credit losses 380 207 212Noninterest expense 890 761 671
Income before income tax expense 487 571 438
Net income $ 295 $ 346 $ 268
ROE 13% 14% 10%ROA 0.68 0.77 0.50
Business metrics (in billions)Auto originations volume $ 21.3 $ 19.3 $ 18.1End-of-period loans and
lease-related assetsLoans outstanding $ 42.0 $ 39.3 $ 41.7Lease financing receivables 0.3 1.7 4.3Operating lease assets 1.9 1.6 0.9
Total end-of-period loans and lease-related assets 44.2 42.6 46.9
Average loans and lease-related assetsLoans outstanding(a) $ 40.2 $ 39.8 $ 45.5Lease financing receivables 0.9 2.9 6.2Operating lease assets 1.7 1.3 0.4
Total average loans and lease-related assets 42.8 44.0 52.1
Average assets 43.3 44.9 53.2Average equity 2.2 2.4 2.7
Credit quality statistics30+ day delinquency rate 1.85% 1.72% 1.66%Net charge-offs
Loans $ 350 $ 231 $ 257Lease receivables 4 7 20
Total net charge-offs 354 238 277Net charge-off rate
Loans(a) 0.87% 0.59% 0.57%Lease receivables 0.44 0.24 0.32
Total net charge-off rate(a) 0.86 0.56 0.54
Nonperforming assets $ 188 $ 177 $ 236
(a) Average Loans held-for-sale were $530 million and $744 million for 2006 and 2005,respectively. Average Loans held-for-sale for 2007 were insignificant. These amounts areexcluded when calculating the net charge-off rate.
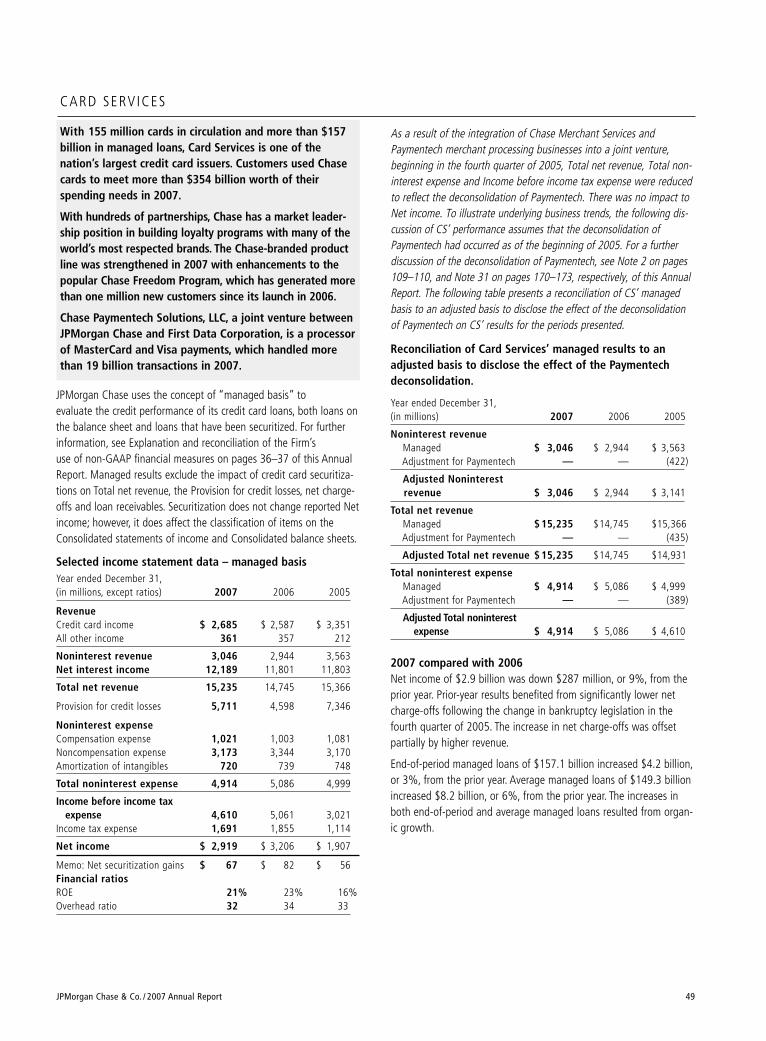
CARD SERVICES
With 155 million cards in circulation and more than $157billion in managed loans, Card Services is one of thenation’s largest credit card issuers. Customers used Chasecards to meet more than $354 billion worth of theirspending needs in 2007.
With hundreds of partnerships, Chase has a market leader-ship position in building loyalty programs with many of theworld’s most respected brands. The Chase-branded productline was strengthened in 2007 with enhancements to thepopular Chase Freedom Program, which has generated morethan one million new customers since its launch in 2006.
Chase Paymentech Solutions, LLC, a joint venture betweenJPMorgan Chase and First Data Corporation, is a processorof MasterCard and Visa payments, which handled morethan 19 billion transactions in 2007.
JPMorgan Chase uses the concept of “managed basis” to evaluate the credit performance of its credit card loans, both loans onthe balance sheet and loans that have been securitized. For furtherinformation, see Explanation and reconciliation of the Firm’s use of non-GAAP financial measures on pages 36–37 of this AnnualReport. Managed results exclude the impact of credit card securitiza-tions on Total net revenue, the Provision for credit losses, net charge-offs and loan receivables. Securitization does not change reported Netincome; however, it does affect the classification of items on theConsolidated statements of income and Consolidated balance sheets.
Selected income statement data – managed basisYear ended December 31,(in millions, except ratios) 2007 2006 2005
RevenueCredit card income $ 2,685 $ 2,587 $ 3,351All other income 361 357 212
Noninterest revenue 3,046 2,944 3,563Net interest income 12,189 11,801 11,803
Total net revenue 15,235 14,745 15,366
Provision for credit losses 5,711 4,598 7,346
Noninterest expenseCompensation expense 1,021 1,003 1,081Noncompensation expense 3,173 3,344 3,170Amortization of intangibles 720 739 748
Total noninterest expense 4,914 5,086 4,999
Income before income tax expense 4,610 5,061 3,021
Income tax expense 1,691 1,855 1,114
Net income $ 2,919 $ 3,206 $ 1,907
Memo: Net securitization gains $ 67 $ 82 $ 56Financial ratiosROE 21% 23% 16%Overhead ratio 32 34 33
JPMorgan Chase & Co. / 2007 Annual Report 49
As a result of the integration of Chase Merchant Services andPaymentech merchant processing businesses into a joint venture,beginning in the fourth quarter of 2005, Total net revenue, Total non-interest expense and Income before income tax expense were reducedto reflect the deconsolidation of Paymentech. There was no impact toNet income. To illustrate underlying business trends, the following dis-cussion of CS’ performance assumes that the deconsolidation ofPaymentech had occurred as of the beginning of 2005. For a furtherdiscussion of the deconsolidation of Paymentech, see Note 2 on pages109–110, and Note 31 on pages 170–173, respectively, of this AnnualReport. The following table presents a reconciliation of CS’ managedbasis to an adjusted basis to disclose the effect of the deconsolidationof Paymentech on CS’ results for the periods presented.
Reconciliation of Card Services’ managed results to anadjusted basis to disclose the effect of the Paymentechdeconsolidation.
Year ended December 31,(in millions) 2007 2006 2005
Noninterest revenueManaged $ 3,046 $ 2,944 $ 3,563Adjustment for Paymentech — — (422)
Adjusted Noninterest revenue $ 3,046 $ 2,944 $ 3,141
Total net revenueManaged $ 15,235 $14,745 $15,366Adjustment for Paymentech — — (435)
Adjusted Total net revenue $ 15,235 $14,745 $14,931
Total noninterest expenseManaged $ 4,914 $ 5,086 $ 4,999Adjustment for Paymentech — — (389)
Adjusted Total noninterest expense $ 4,914 $ 5,086 $ 4,610
2007 compared with 2006 Net income of $2.9 billion was down $287 million, or 9%, from theprior year. Prior-year results benefited from significantly lower netcharge-offs following the change in bankruptcy legislation in thefourth quarter of 2005. The increase in net charge-offs was offsetpartially by higher revenue.
End-of-period managed loans of $157.1 billion increased $4.2 billion,or 3%, from the prior year. Average managed loans of $149.3 billionincreased $8.2 billion, or 6%, from the prior year. The increases inboth end-of-period and average managed loans resulted from organ-ic growth.
MANAGEMENT’S DISCUSSION AND ANALYSISJPMorgan Chase & Co.
50 JPMorgan Chase & Co. / 2007 Annual Report
Managed Total net revenue was $15.2 billion, an increase of $490 million,or 3%, from the prior year. Net interest income was $12.2 billion, up $388million, or 3%, from the prior year. The increase in Net interest income wasdriven by a higher level of fees and higher average loan balances. Thesebenefits were offset partially by narrower loan spreads, the discontinuationof certain billing practices (including the elimination of certain over-limit feesand the two-cycle billing method for calculating finance charges beginningin the second quarter of 2007) and the effect of higher revenue reversalsassociated with higher charge-offs. Noninterest revenue was $3.0 billion, anincrease of $102 million, or 3%, from the prior year. The increase reflects ahigher level of fee-based revenue and increased net interchange income,which benefited from higher charge volume. Charge volume growth of 4%reflected a 9% increase in sales volume, offset primarily by a lower level ofbalance transfers, the result of more targeted marketing efforts.
The managed Provision for credit losses was $5.7 billion, an increase of$1.1 billion, or 24%, from the prior year. The increase was primarily dueto a higher level of net charge-offs (the prior year benefited from thechange in bankruptcy legislation in the fourth quarter of 2005) and anincrease in the Allowance for loan losses driven by higher estimated netcharge-offs in the portfolio. The managed net charge-off rate was 3.68%,up from 3.33% in the prior year. The 30-day managed delinquency ratewas 3.48%, up from 3.13% in the prior year.
Noninterest expense was $4.9 billion, a decrease of $172 million, or3%, compared with the prior year, primarily due to lower marketingexpense and lower fraud-related expense, partially offset by highervolume-related expense.
2006 compared with 2005Net income of $3.2 billion was up $1.3 billion, or 68%, from the prioryear. Results were driven by a lower Provision for credit losses due tosignificantly lower bankruptcy filings.
End-of-period managed loans of $152.8 billion increased $10.6 billion, or7%, from the prior year. Average managed loans of $141.1 billionincreased $4.7 billion, or 3%, from the prior year. Compared with theprior year, both average managed and end-of-period managed loans con-tinued to be affected negatively by higher customer payment rates.Management believes that contributing to the higher payment rates arethe new minimum payment rules and a higher proportion of customers inrewards-based programs.
2006 benefited from organic growth and reflected acquisitions oftwo loan portfolios. The first portfolio was the Sears Canada creditcard business, which closed in the fourth quarter of 2005. The SearsCanada portfolio’s average managed loan balances were $2.1 billionin 2006 and $291 million in the prior year. The second purchase wasthe Kohl’s Corporation (“Kohl’s”) private label portfolio, which closedin the second quarter of 2006. The Kohl’s portfolio average and peri-od-end managed loan balances for 2006 were $1.2 billion and $2.5billion, respectively.
Managed Total net revenue of $14.7 billion was down $186 million, or1%, from the prior year. Net interest income of $11.8 billion was flatto the prior year. Net interest income benefited from an increase inaverage managed loan balances and lower revenue reversals associ-ated with lower charge-offs. These increases were offset by attritionof mature, higher spread balances as a result of higher payment ratesand higher cost of funds on balance growth in promotional, introduc-tory and transactor loan balances, which increased due to continuedinvestment in marketing. Noninterest revenue of $2.9 billion wasdown $197 million, or 6%. Interchange income increased, benefitingfrom 12% higher charge volume, but was more than offset by highervolume-driven payments to partners, including Kohl’s, and increasedrewards expense (both of which are netted against interchangeincome).
The managed Provision for credit losses was $4.6 billion, down $2.7billion, or 37%, from the prior year. This benefit was due to a signifi-cant decrease in net charge-offs of $2.4 billion, reflecting the contin-ued low level of bankruptcy losses, partially offset by an increase incontractual net charge-offs. The provision also benefited from arelease in the Allowance for loan losses in 2006 of unused reservesrelated to Hurricane Katrina, compared with an increase in theAllowance for loan losses in the prior year. The managed net charge-off rate decreased to 3.33%, from 5.21% in the prior year. The 30-day managed delinquency rate was 3.13%, up from 2.79% in theprior year.
Noninterest expense of $5.1 billion was up $476 million, or 10%,from the prior year due largely to higher marketing spending andacquisitions offset partially by merger savings.
The following is a brief description of selected business metrics within Card Services.
• Charge volume – Represents the dollar amount of cardmember purchases, balance transfers and cash advance activity.
• Net accounts opened – Includes originations, purchases and sales.
• Merchant acquiring business – Represents an entity that processes bank card transactions for merchants. JPMorgan Chase is a partner in ChasePaymentech Solutions, LLC, a merchant acquiring business.
- Bank card volume – Represents the dollar amount of transactions processed for merchants.
- Total transactions – Represents the number of transactions and authorizations processed for merchants.
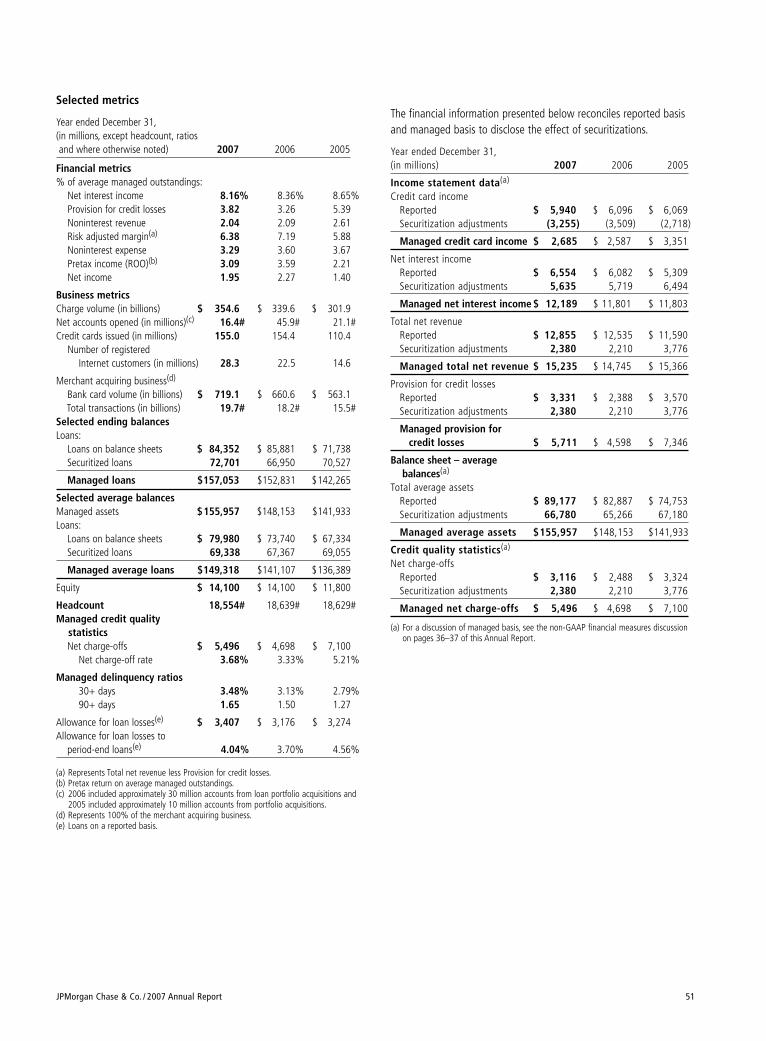
JPMorgan Chase & Co. / 2007 Annual Report 51
Selected metrics
Year ended December 31,(in millions, except headcount, ratiosand where otherwise noted) 2007 2006 2005
Financial metrics% of average managed outstandings:
Net interest income 8.16% 8.36% 8.65%Provision for credit losses 3.82 3.26 5.39Noninterest revenue 2.04 2.09 2.61Risk adjusted margin(a) 6.38 7.19 5.88Noninterest expense 3.29 3.60 3.67Pretax income (ROO)(b) 3.09 3.59 2.21Net income 1.95 2.27 1.40
Business metricsCharge volume (in billions) $ 354.6 $ 339.6 $ 301.9Net accounts opened (in millions)(c) 16.4# 45.9# 21.1#Credit cards issued (in millions) 155.0 154.4 110.4
Number of registered Internet customers (in millions) 28.3 22.5 14.6
Merchant acquiring business(d)
Bank card volume (in billions) $ 719.1 $ 660.6 $ 563.1Total transactions (in billions) 19.7# 18.2# 15.5#
Selected ending balancesLoans:
Loans on balance sheets $ 84,352 $ 85,881 $ 71,738Securitized loans 72,701 66,950 70,527
Managed loans $157,053 $152,831 $142,265
Selected average balancesManaged assets $155,957 $148,153 $141,933Loans:
Loans on balance sheets $ 79,980 $ 73,740 $ 67,334Securitized loans 69,338 67,367 69,055
Managed average loans $149,318 $141,107 $136,389
Equity $ 14,100 $ 14,100 $ 11,800
Headcount 18,554# 18,639# 18,629#Managed credit quality
statisticsNet charge-offs $ 5,496 $ 4,698 $ 7,100
Net charge-off rate 3.68% 3.33% 5.21%
Managed delinquency ratios 30+ days 3.48% 3.13% 2.79%90+ days 1.65 1.50 1.27
Allowance for loan losses(e) $ 3,407 $ 3,176 $ 3,274Allowance for loan losses to
period-end loans(e) 4.04% 3.70% 4.56%
(a) Represents Total net revenue less Provision for credit losses.(b) Pretax return on average managed outstandings.(c) 2006 included approximately 30 million accounts from loan portfolio acquisitions and
2005 included approximately 10 million accounts from portfolio acquisitions.(d) Represents 100% of the merchant acquiring business.(e) Loans on a reported basis.
The financial information presented below reconciles reported basisand managed basis to disclose the effect of securitizations.
Year ended December 31,(in millions) 2007 2006 2005
Income statement data(a)
Credit card incomeReported $ 5,940 $ 6,096 $ 6,069Securitization adjustments (3,255) (3,509) (2,718)
Managed credit card income $ 2,685 $ 2,587 $ 3,351
Net interest incomeReported $ 6,554 $ 6,082 $ 5,309Securitization adjustments 5,635 5,719 6,494
Managed net interest income $ 12,189 $ 11,801 $ 11,803
Total net revenueReported $ 12,855 $ 12,535 $ 11,590Securitization adjustments 2,380 2,210 3,776
Managed total net revenue $ 15,235 $ 14,745 $ 15,366
Provision for credit lossesReported $ 3,331 $ 2,388 $ 3,570Securitization adjustments 2,380 2,210 3,776
Managed provision for credit losses $ 5,711 $ 4,598 $ 7,346
Balance sheet – average balances(a)
Total average assetsReported $ 89,177 $ 82,887 $ 74,753Securitization adjustments 66,780 65,266 67,180
Managed average assets $155,957 $148,153 $141,933
Credit quality statistics(a)
Net charge-offsReported $ 3,116 $ 2,488 $ 3,324Securitization adjustments 2,380 2,210 3,776
Managed net charge-offs $ 5,496 $ 4,698 $ 7,100
(a) For a discussion of managed basis, see the non-GAAP financial measures discussionon pages 36–37 of this Annual Report.
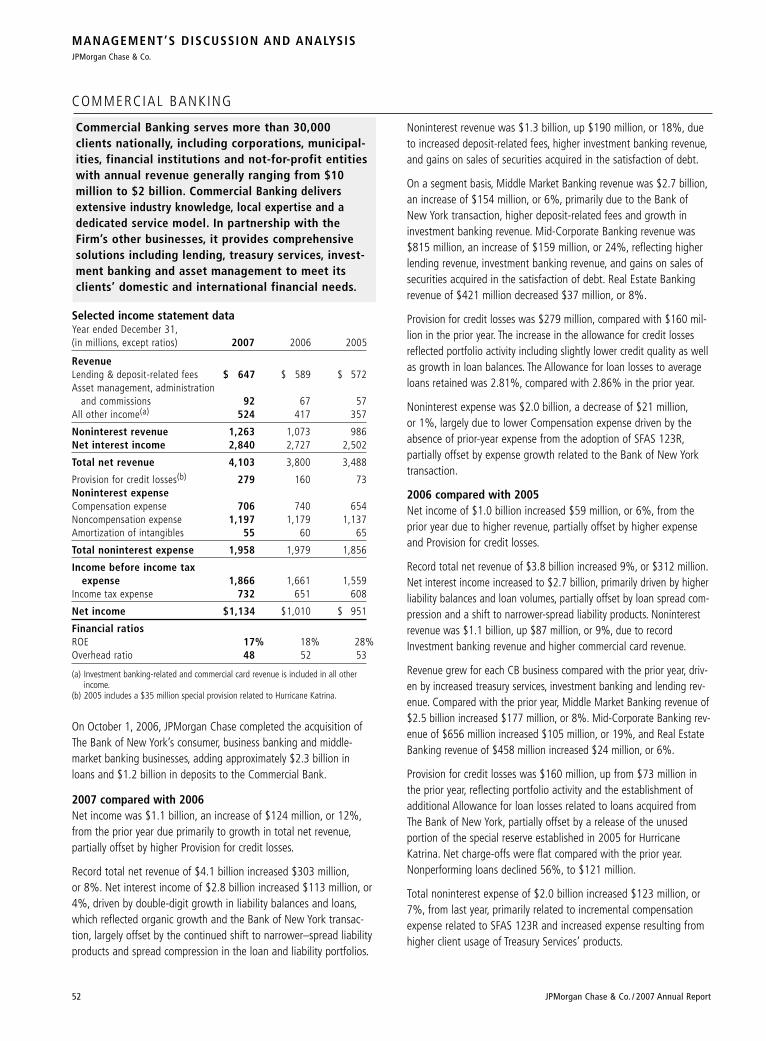
COMMERCIAL BANKING
Commercial Banking serves more than 30,000clients nationally, including corporations, municipal-ities, financial institutions and not-for-profit entitieswith annual revenue generally ranging from $10million to $2 billion. Commercial Banking deliversextensive industry knowledge, local expertise and adedicated service model. In partnership with theFirm’s other businesses, it provides comprehensivesolutions including lending, treasury services, invest-ment banking and asset management to meet itsclients’ domestic and international financial needs.
Selected income statement data Year ended December 31,(in millions, except ratios) 2007 2006 2005
RevenueLending & deposit-related fees $ 647 $ 589 $ 572Asset management, administration
and commissions 92 67 57All other income(a) 524 417 357
Noninterest revenue 1,263 1,073 986Net interest income 2,840 2,727 2,502
Total net revenue 4,103 3,800 3,488
Provision for credit losses(b) 279 160 73Noninterest expenseCompensation expense 706 740 654Noncompensation expense 1,197 1,179 1,137Amortization of intangibles 55 60 65
Total noninterest expense 1,958 1,979 1,856
Income before income tax expense 1,866 1,661 1,559
Income tax expense 732 651 608
Net income $1,134 $1,010 $ 951
Financial ratiosROE 17% 18% 28%Overhead ratio 48 52 53
(a) Investment banking-related and commercial card revenue is included in all otherincome.
(b) 2005 includes a $35 million special provision related to Hurricane Katrina.
On October 1, 2006, JPMorgan Chase completed the acquisition ofThe Bank of New York’s consumer, business banking and middle-market banking businesses, adding approximately $2.3 billion inloans and $1.2 billion in deposits to the Commercial Bank.
2007 compared with 2006 Net income was $1.1 billion, an increase of $124 million, or 12%,from the prior year due primarily to growth in total net revenue,partially offset by higher Provision for credit losses.
Record total net revenue of $4.1 billion increased $303 million,or 8%. Net interest income of $2.8 billion increased $113 million, or4%, driven by double-digit growth in liability balances and loans,which reflected organic growth and the Bank of New York transac-tion, largely offset by the continued shift to narrower–spread liabilityproducts and spread compression in the loan and liability portfolios.
MANAGEMENT’S DISCUSSION AND ANALYSISJPMorgan Chase & Co.
52 JPMorgan Chase & Co. / 2007 Annual Report
Noninterest revenue was $1.3 billion, up $190 million, or 18%, dueto increased deposit-related fees, higher investment banking revenue,and gains on sales of securities acquired in the satisfaction of debt.
On a segment basis, Middle Market Banking revenue was $2.7 billion,an increase of $154 million, or 6%, primarily due to the Bank ofNew York transaction, higher deposit-related fees and growth ininvestment banking revenue. Mid-Corporate Banking revenue was$815 million, an increase of $159 million, or 24%, reflecting higherlending revenue, investment banking revenue, and gains on sales ofsecurities acquired in the satisfaction of debt. Real Estate Bankingrevenue of $421 million decreased $37 million, or 8%.
Provision for credit losses was $279 million, compared with $160 mil-lion in the prior year. The increase in the allowance for credit lossesreflected portfolio activity including slightly lower credit quality as wellas growth in loan balances. The Allowance for loan losses to averageloans retained was 2.81%, compared with 2.86% in the prior year.
Noninterest expense was $2.0 billion, a decrease of $21 million,or 1%, largely due to lower Compensation expense driven by theabsence of prior-year expense from the adoption of SFAS 123R,partially offset by expense growth related to the Bank of New Yorktransaction.
2006 compared with 2005Net income of $1.0 billion increased $59 million, or 6%, from theprior year due to higher revenue, partially offset by higher expenseand Provision for credit losses.
Record total net revenue of $3.8 billion increased 9%, or $312 million.Net interest income increased to $2.7 billion, primarily driven by higherliability balances and loan volumes, partially offset by loan spread com-pression and a shift to narrower-spread liability products. Noninterestrevenue was $1.1 billion, up $87 million, or 9%, due to recordInvestment banking revenue and higher commercial card revenue.
Revenue grew for each CB business compared with the prior year, driv-en by increased treasury services, investment banking and lending rev-enue. Compared with the prior year, Middle Market Banking revenue of$2.5 billion increased $177 million, or 8%. Mid-Corporate Banking rev-enue of $656 million increased $105 million, or 19%, and Real EstateBanking revenue of $458 million increased $24 million, or 6%.
Provision for credit losses was $160 million, up from $73 million inthe prior year, reflecting portfolio activity and the establishment ofadditional Allowance for loan losses related to loans acquired fromThe Bank of New York, partially offset by a release of the unused portion of the special reserve established in 2005 for HurricaneKatrina. Net charge-offs were flat compared with the prior year.Nonperforming loans declined 56%, to $121 million.
Total noninterest expense of $2.0 billion increased $123 million, or7%, from last year, primarily related to incremental compensationexpense related to SFAS 123R and increased expense resulting fromhigher client usage of Treasury Services’ products.
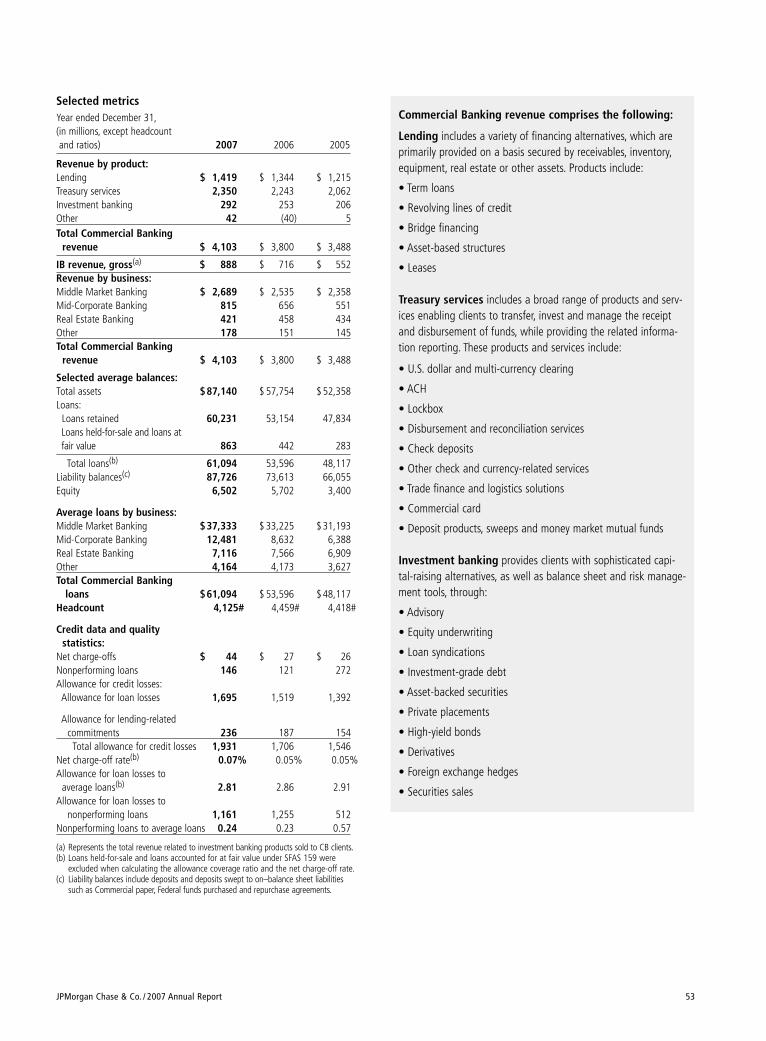
JPMorgan Chase & Co. / 2007 Annual Report 53
Selected metricsYear ended December 31,(in millions, except headcount and ratios) 2007 2006 2005
Revenue by product:Lending $ 1,419 $ 1,344 $ 1,215Treasury services 2,350 2,243 2,062Investment banking 292 253 206Other 42 (40) 5Total Commercial Banking
revenue $ 4,103 $ 3,800 $ 3,488
IB revenue, gross(a) $ 888 $ 716 $ 552Revenue by business:Middle Market Banking $ 2,689 $ 2,535 $ 2,358Mid-Corporate Banking 815 656 551Real Estate Banking 421 458 434Other 178 151 145Total Commercial Banking
revenue $ 4,103 $ 3,800 $ 3,488
Selected average balances:Total assets $87,140 $ 57,754 $ 52,358Loans:
Loans retained 60,231 53,154 47,834Loans held-for-sale and loans at fair value 863 442 283
Total loans(b) 61,094 53,596 48,117Liability balances(c) 87,726 73,613 66,055Equity 6,502 5,702 3,400
Average loans by business:Middle Market Banking $37,333 $ 33,225 $ 31,193Mid-Corporate Banking 12,481 8,632 6,388Real Estate Banking 7,116 7,566 6,909Other 4,164 4,173 3,627Total Commercial Banking
loans $61,094 $ 53,596 $ 48,117Headcount 4,125# 4,459# 4,418#
Credit data and quality statistics:
Net charge-offs $ 44 $ 27 $ 26Nonperforming loans 146 121 272Allowance for credit losses:Allowance for loan losses 1,695 1,519 1,392
Allowance for lending-related commitments 236 187 154Total allowance for credit losses 1,931 1,706 1,546
Net charge-off rate(b) 0.07% 0.05% 0.05%Allowance for loan losses to
average loans(b) 2.81 2.86 2.91Allowance for loan losses to
nonperforming loans 1,161 1,255 512Nonperforming loans to average loans 0.24 0.23 0.57
(a) Represents the total revenue related to investment banking products sold to CB clients.(b) Loans held-for-sale and loans accounted for at fair value under SFAS 159 were
excluded when calculating the allowance coverage ratio and the net charge-off rate.(c) Liability balances include deposits and deposits swept to on–balance sheet liabilities
such as Commercial paper, Federal funds purchased and repurchase agreements.
Commercial Banking revenue comprises the following:
Lending includes a variety of financing alternatives, which areprimarily provided on a basis secured by receivables, inventory,equipment, real estate or other assets. Products include:
• Term loans
• Revolving lines of credit
• Bridge financing
• Asset-based structures
• Leases
Treasury services includes a broad range of products and serv-ices enabling clients to transfer, invest and manage the receiptand disbursement of funds, while providing the related informa-tion reporting. These products and services include:
• U.S. dollar and multi-currency clearing
• ACH
• Lockbox
• Disbursement and reconciliation services
• Check deposits
• Other check and currency-related services
• Trade finance and logistics solutions
• Commercial card
• Deposit products, sweeps and money market mutual funds
Investment banking provides clients with sophisticated capi-tal-raising alternatives, as well as balance sheet and risk manage-ment tools, through:
• Advisory
• Equity underwriting
• Loan syndications
• Investment-grade debt
• Asset-backed securities
• Private placements
• High-yield bonds
• Derivatives
• Foreign exchange hedges
• Securities sales
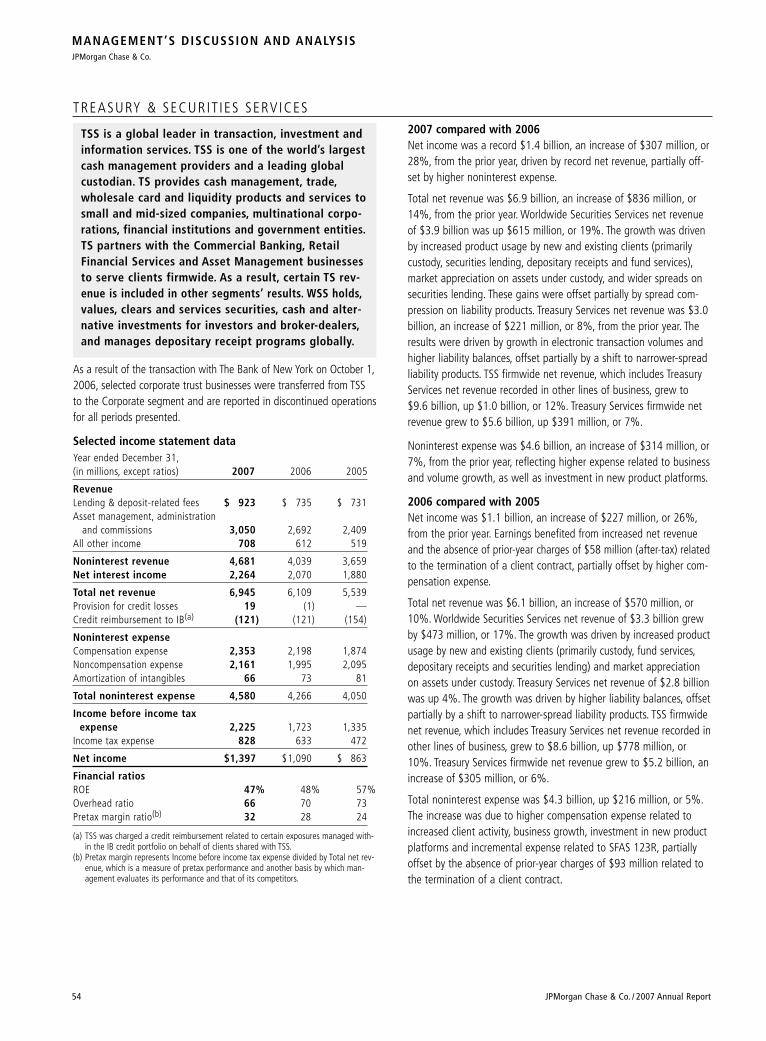
TREASURY & SECURIT IES SERVICES
TSS is a global leader in transaction, investment andinformation services. TSS is one of the world’s largestcash management providers and a leading globalcustodian. TS provides cash management, trade,wholesale card and liquidity products and services tosmall and mid-sized companies, multinational corpo-rations, financial institutions and government entities.TS partners with the Commercial Banking, RetailFinancial Services and Asset Management businessesto serve clients firmwide. As a result, certain TS rev-enue is included in other segments’ results. WSS holds,values, clears and services securities, cash and alter-native investments for investors and broker-dealers,and manages depositary receipt programs globally.
As a result of the transaction with The Bank of New York on October 1,2006, selected corporate trust businesses were transferred from TSSto the Corporate segment and are reported in discontinued operationsfor all periods presented.
Selected income statement data Year ended December 31,(in millions, except ratios) 2007 2006 2005
RevenueLending & deposit-related fees $ 923 $ 735 $ 731Asset management, administration
and commissions 3,050 2,692 2,409All other income 708 612 519
Noninterest revenue 4,681 4,039 3,659Net interest income 2,264 2,070 1,880
Total net revenue 6,945 6,109 5,539Provision for credit losses 19 (1) —Credit reimbursement to IB(a) (121) (121) (154)
Noninterest expenseCompensation expense 2,353 2,198 1,874Noncompensation expense 2,161 1,995 2,095Amortization of intangibles 66 73 81
Total noninterest expense 4,580 4,266 4,050
Income before income tax expense 2,225 1,723 1,335
Income tax expense 828 633 472
Net income $1,397 $1,090 $ 863
Financial ratiosROE 47% 48% 57%Overhead ratio 66 70 73Pretax margin ratio(b) 32 28 24
(a) TSS was charged a credit reimbursement related to certain exposures managed with-in the IB credit portfolio on behalf of clients shared with TSS.
(b) Pretax margin represents Income before income tax expense divided by Total net rev-enue, which is a measure of pretax performance and another basis by which man-agement evaluates its performance and that of its competitors.
MANAGEMENT’S DISCUSSION AND ANALYSISJPMorgan Chase & Co.
54 JPMorgan Chase & Co. / 2007 Annual Report
2007 compared with 2006Net income was a record $1.4 billion, an increase of $307 million, or28%, from the prior year, driven by record net revenue, partially off-set by higher noninterest expense.
Total net revenue was $6.9 billion, an increase of $836 million, or14%, from the prior year. Worldwide Securities Services net revenueof $3.9 billion was up $615 million, or 19%. The growth was drivenby increased product usage by new and existing clients (primarilycustody, securities lending, depositary receipts and fund services),market appreciation on assets under custody, and wider spreads onsecurities lending. These gains were offset partially by spread com-pression on liability products. Treasury Services net revenue was $3.0billion, an increase of $221 million, or 8%, from the prior year. Theresults were driven by growth in electronic transaction volumes andhigher liability balances, offset partially by a shift to narrower-spreadliability products. TSS firmwide net revenue, which includes TreasuryServices net revenue recorded in other lines of business, grew to$9.6 billion, up $1.0 billion, or 12%. Treasury Services firmwide netrevenue grew to $5.6 billion, up $391 million, or 7%.
Noninterest expense was $4.6 billion, an increase of $314 million, or7%, from the prior year, reflecting higher expense related to businessand volume growth, as well as investment in new product platforms.
2006 compared with 2005Net income was $1.1 billion, an increase of $227 million, or 26%,from the prior year. Earnings benefited from increased net revenueand the absence of prior-year charges of $58 million (after-tax) relatedto the termination of a client contract, partially offset by higher com-pensation expense.
Total net revenue was $6.1 billion, an increase of $570 million, or10%. Worldwide Securities Services net revenue of $3.3 billion grewby $473 million, or 17%. The growth was driven by increased productusage by new and existing clients (primarily custody, fund services,depositary receipts and securities lending) and market appreciationon assets under custody. Treasury Services net revenue of $2.8 billionwas up 4%. The growth was driven by higher liability balances, offsetpartially by a shift to narrower-spread liability products. TSS firmwidenet revenue, which includes Treasury Services net revenue recorded inother lines of business, grew to $8.6 billion, up $778 million, or10%. Treasury Services firmwide net revenue grew to $5.2 billion, anincrease of $305 million, or 6%.
Total noninterest expense was $4.3 billion, up $216 million, or 5%.The increase was due to higher compensation expense related toincreased client activity, business growth, investment in new productplatforms and incremental expense related to SFAS 123R, partiallyoffset by the absence of prior-year charges of $93 million related tothe termination of a client contract.
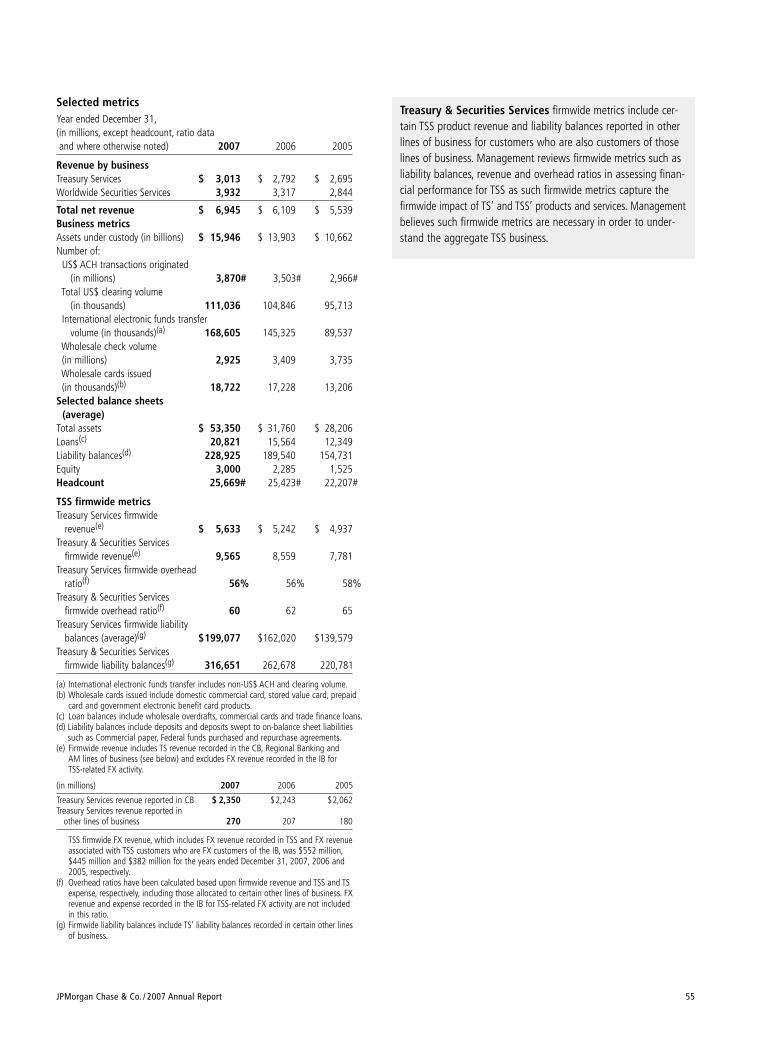
JPMorgan Chase & Co. / 2007 Annual Report 55
Selected metrics Year ended December 31,(in millions, except headcount, ratio data and where otherwise noted) 2007 2006 2005
Revenue by businessTreasury Services $ 3,013 $ 2,792 $ 2,695Worldwide Securities Services 3,932 3,317 2,844
Total net revenue $ 6,945 $ 6,109 $ 5,539Business metricsAssets under custody (in billions) $ 15,946 $ 13,903 $ 10,662Number of:
US$ ACH transactions originated (in millions) 3,870# 3,503# 2,966#
Total US$ clearing volume (in thousands) 111,036 104,846 95,713
International electronic funds transfer volume (in thousands)(a) 168,605 145,325 89,537
Wholesale check volume (in millions) 2,925 3,409 3,735Wholesale cards issued (in thousands)(b) 18,722 17,228 13,206
Selected balance sheets (average)
Total assets $ 53,350 $ 31,760 $ 28,206Loans(c) 20,821 15,564 12,349Liability balances(d) 228,925 189,540 154,731Equity 3,000 2,285 1,525Headcount 25,669# 25,423# 22,207#
TSS firmwide metricsTreasury Services firmwide
revenue(e) $ 5,633 $ 5,242 $ 4,937Treasury & Securities Services
firmwide revenue(e) 9,565 8,559 7,781Treasury Services firmwide overhead
ratio(f) 56% 56% 58%Treasury & Securities Services
firmwide overhead ratio(f) 60 62 65Treasury Services firmwide liability
balances (average)(g) $199,077 $162,020 $139,579Treasury & Securities Services
firmwide liability balances(g) 316,651 262,678 220,781
(a) International electronic funds transfer includes non-US$ ACH and clearing volume.(b) Wholesale cards issued include domestic commercial card, stored value card, prepaid
card and government electronic benefit card products.(c) Loan balances include wholesale overdrafts, commercial cards and trade finance loans.(d) Liability balances include deposits and deposits swept to on-balance sheet liabilities
such as Commercial paper, Federal funds purchased and repurchase agreements.(e) Firmwide revenue includes TS revenue recorded in the CB, Regional Banking and
AM lines of business (see below) and excludes FX revenue recorded in the IB for TSS-related FX activity.
(in millions) 2007 2006 2005
Treasury Services revenue reported in CB $ 2,350 $2,243 $2,062Treasury Services revenue reported in
other lines of business 270 207 180
TSS firmwide FX revenue, which includes FX revenue recorded in TSS and FX revenueassociated with TSS customers who are FX customers of the IB, was $552 million,$445 million and $382 million for the years ended December 31, 2007, 2006 and2005, respectively.
(f) Overhead ratios have been calculated based upon firmwide revenue and TSS and TSexpense, respectively, including those allocated to certain other lines of business. FXrevenue and expense recorded in the IB for TSS-related FX activity are not included in this ratio.
(g) Firmwide liability balances include TS’ liability balances recorded in certain other lines of business.
Treasury & Securities Services firmwide metrics include cer-tain TSS product revenue and liability balances reported in otherlines of business for customers who are also customers of thoselines of business. Management reviews firmwide metrics such asliability balances, revenue and overhead ratios in assessing finan-cial performance for TSS as such firmwide metrics capture thefirmwide impact of TS’ and TSS’ products and services. Managementbelieves such firmwide metrics are necessary in order to under-stand the aggregate TSS business.
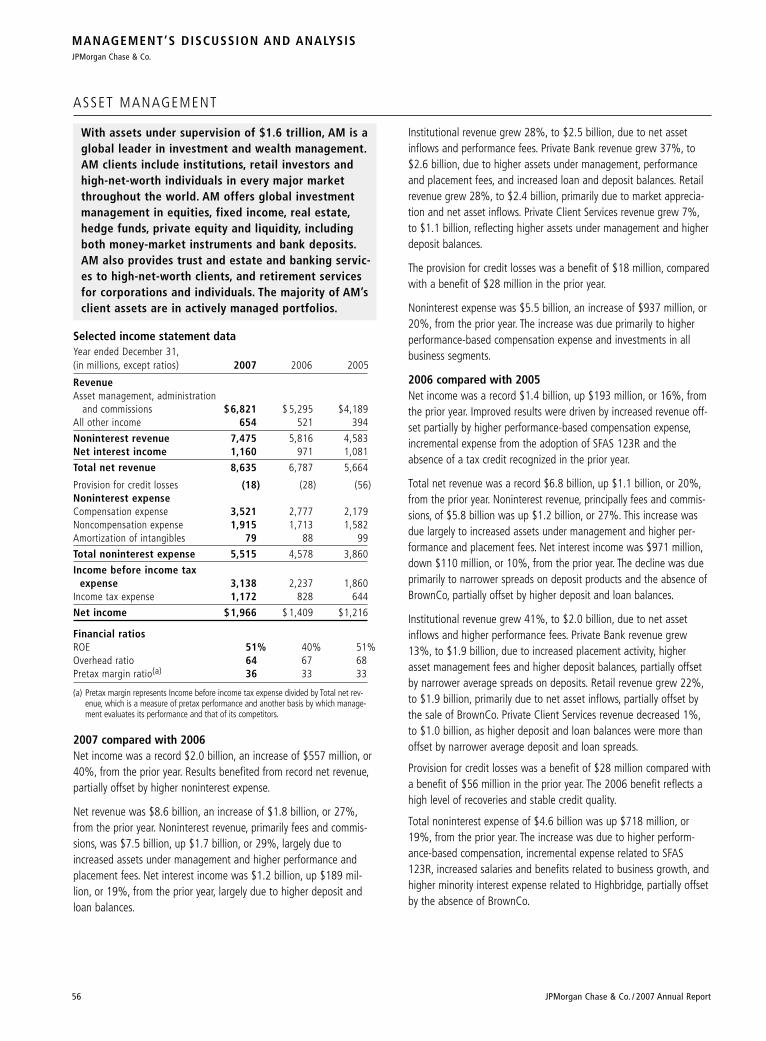
ASSET MANAGEMENT
With assets under supervision of $1.6 trillion, AM is aglobal leader in investment and wealth management.AM clients include institutions, retail investors andhigh-net-worth individuals in every major marketthroughout the world. AM offers global investmentmanagement in equities, fixed income, real estate,hedge funds, private equity and liquidity, includingboth money-market instruments and bank deposits.AM also provides trust and estate and banking servic-es to high-net-worth clients, and retirement servicesfor corporations and individuals. The majority of AM’sclient assets are in actively managed portfolios.
Selected income statement dataYear ended December 31,(in millions, except ratios) 2007 2006 2005
RevenueAsset management, administration
and commissions $6,821 $ 5,295 $4,189All other income 654 521 394
Noninterest revenue 7,475 5,816 4,583Net interest income 1,160 971 1,081
Total net revenue 8,635 6,787 5,664
Provision for credit losses (18) (28) (56)Noninterest expenseCompensation expense 3,521 2,777 2,179Noncompensation expense 1,915 1,713 1,582Amortization of intangibles 79 88 99
Total noninterest expense 5,515 4,578 3,860
Income before income tax expense 3,138 2,237 1,860
Income tax expense 1,172 828 644
Net income $1,966 $ 1,409 $1,216
Financial ratiosROE 51% 40% 51%Overhead ratio 64 67 68Pretax margin ratio(a) 36 33 33
(a) Pretax margin represents Income before income tax expense divided by Total net rev-enue, which is a measure of pretax performance and another basis by which manage-ment evaluates its performance and that of its competitors.
2007 compared with 2006 Net income was a record $2.0 billion, an increase of $557 million, or40%, from the prior year. Results benefited from record net revenue,partially offset by higher noninterest expense.
Net revenue was $8.6 billion, an increase of $1.8 billion, or 27%,from the prior year. Noninterest revenue, primarily fees and commis-sions, was $7.5 billion, up $1.7 billion, or 29%, largely due toincreased assets under management and higher performance andplacement fees. Net interest income was $1.2 billion, up $189 mil-lion, or 19%, from the prior year, largely due to higher deposit andloan balances.
MANAGEMENT’S DISCUSSION AND ANALYSISJPMorgan Chase & Co.
56 JPMorgan Chase & Co. / 2007 Annual Report
Institutional revenue grew 28%, to $2.5 billion, due to net assetinflows and performance fees. Private Bank revenue grew 37%, to$2.6 billion, due to higher assets under management, performanceand placement fees, and increased loan and deposit balances. Retailrevenue grew 28%, to $2.4 billion, primarily due to market apprecia-tion and net asset inflows. Private Client Services revenue grew 7%,to $1.1 billion, reflecting higher assets under management and higherdeposit balances.
The provision for credit losses was a benefit of $18 million, comparedwith a benefit of $28 million in the prior year.
Noninterest expense was $5.5 billion, an increase of $937 million, or20%, from the prior year. The increase was due primarily to higherperformance-based compensation expense and investments in allbusiness segments.
2006 compared with 2005Net income was a record $1.4 billion, up $193 million, or 16%, fromthe prior year. Improved results were driven by increased revenue off-set partially by higher performance-based compensation expense,incremental expense from the adoption of SFAS 123R and theabsence of a tax credit recognized in the prior year.
Total net revenue was a record $6.8 billion, up $1.1 billion, or 20%,from the prior year. Noninterest revenue, principally fees and commis-sions, of $5.8 billion was up $1.2 billion, or 27%. This increase wasdue largely to increased assets under management and higher per-formance and placement fees. Net interest income was $971 million,down $110 million, or 10%, from the prior year. The decline was dueprimarily to narrower spreads on deposit products and the absence ofBrownCo, partially offset by higher deposit and loan balances.
Institutional revenue grew 41%, to $2.0 billion, due to net assetinflows and higher performance fees. Private Bank revenue grew13%, to $1.9 billion, due to increased placement activity, higherasset management fees and higher deposit balances, partially offsetby narrower average spreads on deposits. Retail revenue grew 22%,to $1.9 billion, primarily due to net asset inflows, partially offset bythe sale of BrownCo. Private Client Services revenue decreased 1%,to $1.0 billion, as higher deposit and loan balances were more thanoffset by narrower average deposit and loan spreads.
Provision for credit losses was a benefit of $28 million compared witha benefit of $56 million in the prior year. The 2006 benefit reflects ahigh level of recoveries and stable credit quality.
Total noninterest expense of $4.6 billion was up $718 million, or19%, from the prior year. The increase was due to higher perform-ance-based compensation, incremental expense related to SFAS123R, increased salaries and benefits related to business growth, andhigher minority interest expense related to Highbridge, partially offsetby the absence of BrownCo.
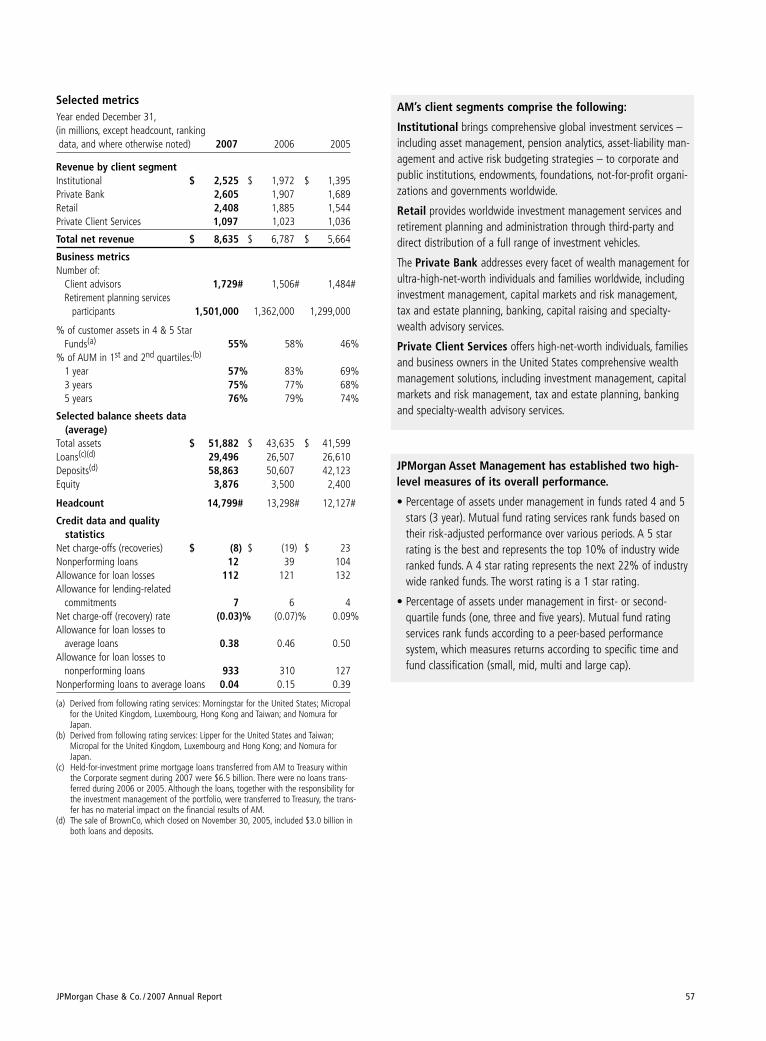
JPMorgan Chase & Co. / 2007 Annual Report 57
Selected metrics Year ended December 31,(in millions, except headcount, ranking data, and where otherwise noted) 2007 2006 2005
Revenue by client segmentInstitutional $ 2,525 $ 1,972 $ 1,395Private Bank 2,605 1,907 1,689Retail 2,408 1,885 1,544Private Client Services 1,097 1,023 1,036
Total net revenue $ 8,635 $ 6,787 $ 5,664
Business metricsNumber of:
Client advisors 1,729# 1,506# 1,484#Retirement planning services
participants 1,501,000 1,362,000 1,299,000
% of customer assets in 4 & 5 Star Funds(a) 55% 58% 46%
% of AUM in 1st and 2nd quartiles:(b)
1 year 57% 83% 69%3 years 75% 77% 68%5 years 76% 79% 74%
Selected balance sheets data (average)
Total assets $ 51,882 $ 43,635 $ 41,599Loans(c)(d) 29,496 26,507 26,610Deposits(d) 58,863 50,607 42,123Equity 3,876 3,500 2,400
Headcount 14,799# 13,298# 12,127#
Credit data and quality statistics
Net charge-offs (recoveries) $ (8) $ (19) $ 23Nonperforming loans 12 39 104Allowance for loan losses 112 121 132Allowance for lending-related
commitments 7 6 4Net charge-off (recovery) rate (0.03)% (0.07)% 0.09%Allowance for loan losses to
average loans 0.38 0.46 0.50Allowance for loan losses to
nonperforming loans 933 310 127Nonperforming loans to average loans 0.04 0.15 0.39
(a) Derived from following rating services: Morningstar for the United States; Micropalfor the United Kingdom, Luxembourg, Hong Kong and Taiwan; and Nomura forJapan.
(b) Derived from following rating services: Lipper for the United States and Taiwan;Micropal for the United Kingdom, Luxembourg and Hong Kong; and Nomura forJapan.
(c) Held-for-investment prime mortgage loans transferred from AM to Treasury withinthe Corporate segment during 2007 were $6.5 billion. There were no loans trans-ferred during 2006 or 2005. Although the loans, together with the responsibility forthe investment management of the portfolio, were transferred to Treasury, the trans-fer has no material impact on the financial results of AM.
(d) The sale of BrownCo, which closed on November 30, 2005, included $3.0 billion inboth loans and deposits.
AM’s client segments comprise the following:
Institutional brings comprehensive global investment services –including asset management, pension analytics, asset-liability man-agement and active risk budgeting strategies – to corporate andpublic institutions, endowments, foundations, not-for-profit organi-zations and governments worldwide.
Retail provides worldwide investment management services andretirement planning and administration through third-party anddirect distribution of a full range of investment vehicles.
The Private Bank addresses every facet of wealth management forultra-high-net-worth individuals and families worldwide, includinginvestment management, capital markets and risk management,tax and estate planning, banking, capital raising and specialty-wealth advisory services.
Private Client Services offers high-net-worth individuals, familiesand business owners in the United States comprehensive wealthmanagement solutions, including investment management, capitalmarkets and risk management, tax and estate planning, bankingand specialty-wealth advisory services.
JPMorgan Asset Management has established two high-level measures of its overall performance.
• Percentage of assets under management in funds rated 4 and 5stars (3 year). Mutual fund rating services rank funds based ontheir risk-adjusted performance over various periods. A 5 starrating is the best and represents the top 10% of industry wideranked funds. A 4 star rating represents the next 22% of industrywide ranked funds. The worst rating is a 1 star rating.
• Percentage of assets under management in first- or second-quartile funds (one, three and five years). Mutual fund ratingservices rank funds according to a peer-based performance system, which measures returns according to specific time andfund classification (small, mid, multi and large cap).
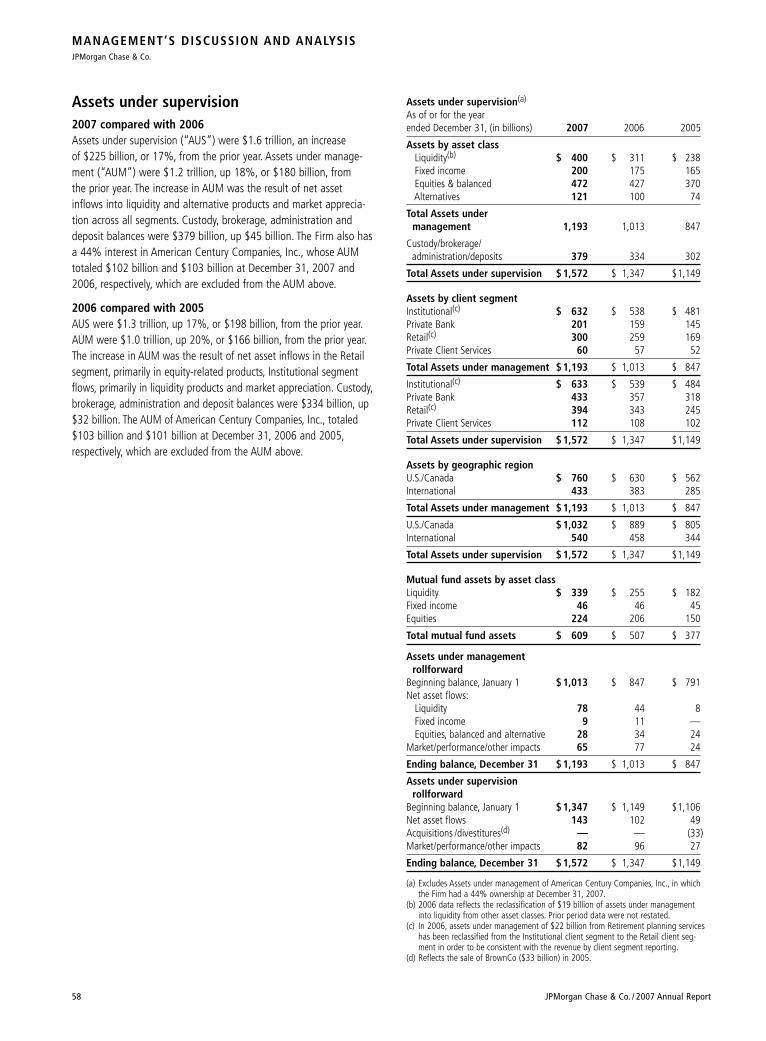
MANAGEMENT’S DISCUSSION AND ANALYSISJPMorgan Chase & Co.
58 JPMorgan Chase & Co. / 2007 Annual Report
Assets under supervision(a)
As of or for the year ended December 31, (in billions) 2007 2006 2005
Assets by asset classLiquidity(b) $ 400 $ 311 $ 238Fixed income 200 175 165Equities & balanced 472 427 370Alternatives 121 100 74
Total Assets under management 1,193 1,013 847
Custody/brokerage/administration/deposits 379 334 302
Total Assets under supervision $ 1,572 $ 1,347 $1,149
Assets by client segment Institutional(c) $ 632 $ 538 $ 481Private Bank 201 159 145Retail(c) 300 259 169Private Client Services 60 57 52
Total Assets under management $ 1,193 $ 1,013 $ 847
Institutional(c) $ 633 $ 539 $ 484Private Bank 433 357 318Retail(c) 394 343 245Private Client Services 112 108 102
Total Assets under supervision $ 1,572 $ 1,347 $1,149
Assets by geographic regionU.S./Canada $ 760 $ 630 $ 562International 433 383 285
Total Assets under management $ 1,193 $ 1,013 $ 847
U.S./Canada $ 1,032 $ 889 $ 805International 540 458 344
Total Assets under supervision $ 1,572 $ 1,347 $1,149
Mutual fund assets by asset classLiquidity $ 339 $ 255 $ 182Fixed income 46 46 45Equities 224 206 150
Total mutual fund assets $ 609 $ 507 $ 377
Assets under management rollforward
Beginning balance, January 1 $ 1,013 $ 847 $ 791Net asset flows:
Liquidity 78 44 8Fixed income 9 11 —Equities, balanced and alternative 28 34 24
Market/performance/other impacts 65 77 24
Ending balance, December 31 $ 1,193 $ 1,013 $ 847
Assets under supervision rollforward
Beginning balance, January 1 $ 1,347 $ 1,149 $1,106Net asset flows 143 102 49Acquisitions /divestitures(d) — — (33)Market/performance/other impacts 82 96 27
Ending balance, December 31 $ 1,572 $ 1,347 $1,149
(a) Excludes Assets under management of American Century Companies, Inc., in whichthe Firm had a 44% ownership at December 31, 2007.
(b) 2006 data reflects the reclassification of $19 billion of assets under managementinto liquidity from other asset classes. Prior period data were not restated.
(c) In 2006, assets under management of $22 billion from Retirement planning serviceshas been reclassified from the Institutional client segment to the Retail client seg-ment in order to be consistent with the revenue by client segment reporting.
(d) Reflects the sale of BrownCo ($33 billion) in 2005.
Assets under supervision2007 compared with 2006Assets under supervision (“AUS”) were $1.6 trillion, an increase of $225 billion, or 17%, from the prior year. Assets under manage-ment (“AUM”) were $1.2 trillion, up 18%, or $180 billion, from the prior year. The increase in AUM was the result of net assetinflows into liquidity and alternative products and market apprecia-tion across all segments. Custody, brokerage, administration anddeposit balances were $379 billion, up $45 billion. The Firm also hasa 44% interest in American Century Companies, Inc., whose AUMtotaled $102 billion and $103 billion at December 31, 2007 and2006, respectively, which are excluded from the AUM above.
2006 compared with 2005AUS were $1.3 trillion, up 17%, or $198 billion, from the prior year.AUM were $1.0 trillion, up 20%, or $166 billion, from the prior year.The increase in AUM was the result of net asset inflows in the Retailsegment, primarily in equity-related products, Institutional segmentflows, primarily in liquidity products and market appreciation. Custody,brokerage, administration and deposit balances were $334 billion, up$32 billion. The AUM of American Century Companies, Inc., totaled$103 billion and $101 billion at December 31, 2006 and 2005,respectively, which are excluded from the AUM above.
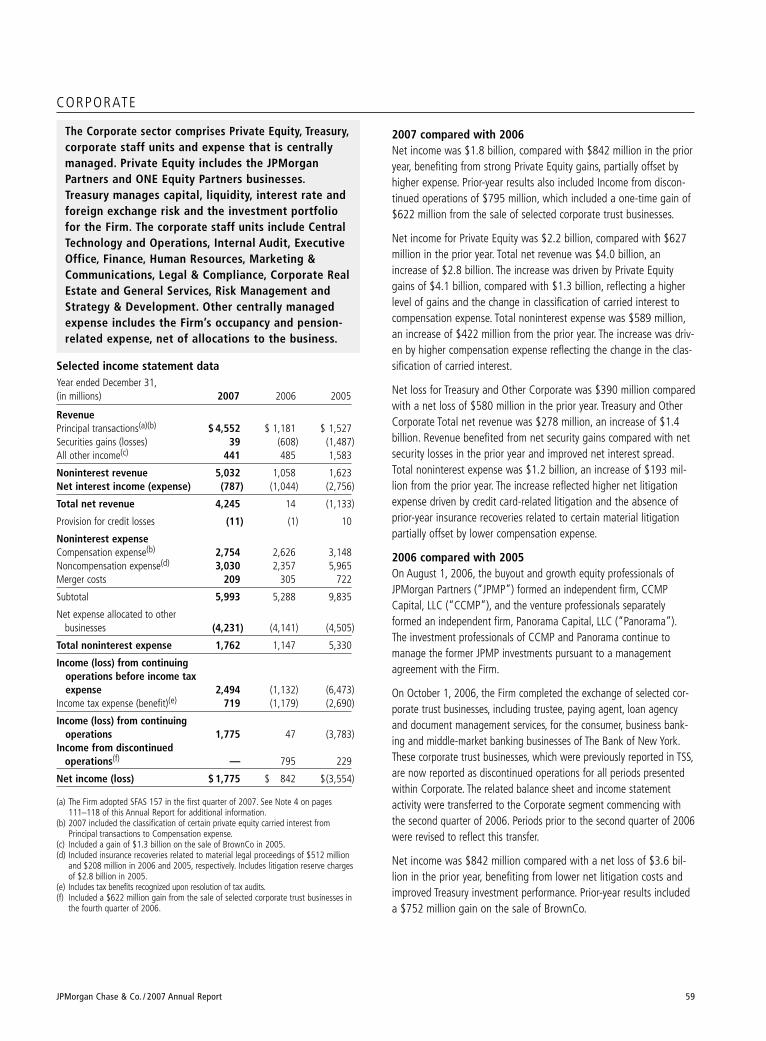
JPMorgan Chase & Co. / 2007 Annual Report 59
CORPORATE
The Corporate sector comprises Private Equity, Treasury,corporate staff units and expense that is centrallymanaged. Private Equity includes the JPMorganPartners and ONE Equity Partners businesses.Treasury manages capital, liquidity, interest rate andforeign exchange risk and the investment portfoliofor the Firm. The corporate staff units include CentralTechnology and Operations, Internal Audit, ExecutiveOffice, Finance, Human Resources, Marketing &Communications, Legal & Compliance, Corporate RealEstate and General Services, Risk Management andStrategy & Development. Other centrally managedexpense includes the Firm’s occupancy and pension-related expense, net of allocations to the business.
Selected income statement data Year ended December 31,(in millions) 2007 2006 2005
RevenuePrincipal transactions(a)(b) $ 4,552 $ 1,181 $ 1,527Securities gains (losses) 39 (608) (1,487)All other income(c) 441 485 1,583
Noninterest revenue 5,032 1,058 1,623Net interest income (expense) (787) (1,044) (2,756)
Total net revenue 4,245 14 (1,133)
Provision for credit losses (11) (1) 10
Noninterest expenseCompensation expense(b) 2,754 2,626 3,148Noncompensation expense(d) 3,030 2,357 5,965Merger costs 209 305 722
Subtotal 5,993 5,288 9,835
Net expense allocated to other businesses (4,231) (4,141) (4,505)
Total noninterest expense 1,762 1,147 5,330
Income (loss) from continuing operations before income tax expense 2,494 (1,132) (6,473)
Income tax expense (benefit)(e) 719 (1,179) (2,690)
Income (loss) from continuing operations 1,775 47 (3,783)
Income from discontinuedoperations(f) — 795 229
Net income (loss) $ 1,775 $ 842 $(3,554)
(a) The Firm adopted SFAS 157 in the first quarter of 2007. See Note 4 on pages111–118 of this Annual Report for additional information.
(b) 2007 included the classification of certain private equity carried interest fromPrincipal transactions to Compensation expense.
(c) Included a gain of $1.3 billion on the sale of BrownCo in 2005.(d) Included insurance recoveries related to material legal proceedings of $512 million
and $208 million in 2006 and 2005, respectively. Includes litigation reserve chargesof $2.8 billion in 2005.
(e) Includes tax benefits recognized upon resolution of tax audits.(f) Included a $622 million gain from the sale of selected corporate trust businesses in
the fourth quarter of 2006.
2007 compared with 2006Net income was $1.8 billion, compared with $842 million in the prioryear, benefiting from strong Private Equity gains, partially offset byhigher expense. Prior-year results also included Income from discon-tinued operations of $795 million, which included a one-time gain of$622 million from the sale of selected corporate trust businesses.
Net income for Private Equity was $2.2 billion, compared with $627million in the prior year. Total net revenue was $4.0 billion, anincrease of $2.8 billion. The increase was driven by Private Equitygains of $4.1 billion, compared with $1.3 billion, reflecting a higherlevel of gains and the change in classification of carried interest tocompensation expense. Total noninterest expense was $589 million,an increase of $422 million from the prior year. The increase was driv-en by higher compensation expense reflecting the change in the clas-sification of carried interest.
Net loss for Treasury and Other Corporate was $390 million comparedwith a net loss of $580 million in the prior year. Treasury and OtherCorporate Total net revenue was $278 million, an increase of $1.4billion. Revenue benefited from net security gains compared with netsecurity losses in the prior year and improved net interest spread.Total noninterest expense was $1.2 billion, an increase of $193 mil-lion from the prior year. The increase reflected higher net litigationexpense driven by credit card-related litigation and the absence ofprior-year insurance recoveries related to certain material litigationpartially offset by lower compensation expense.
2006 compared with 2005On August 1, 2006, the buyout and growth equity professionals ofJPMorgan Partners (“JPMP”) formed an independent firm, CCMPCapital, LLC (“CCMP”), and the venture professionals separatelyformed an independent firm, Panorama Capital, LLC (“Panorama”).The investment professionals of CCMP and Panorama continue to manage the former JPMP investments pursuant to a managementagreement with the Firm.
On October 1, 2006, the Firm completed the exchange of selected cor-porate trust businesses, including trustee, paying agent, loan agencyand document management services, for the consumer, business bank-ing and middle-market banking businesses of The Bank of New York.These corporate trust businesses, which were previously reported in TSS,are now reported as discontinued operations for all periods presentedwithin Corporate. The related balance sheet and income statementactivity were transferred to the Corporate segment commencing withthe second quarter of 2006. Periods prior to the second quarter of 2006were revised to reflect this transfer.
Net income was $842 million compared with a net loss of $3.6 bil-lion in the prior year, benefiting from lower net litigation costs andimproved Treasury investment performance. Prior-year results includeda $752 million gain on the sale of BrownCo.
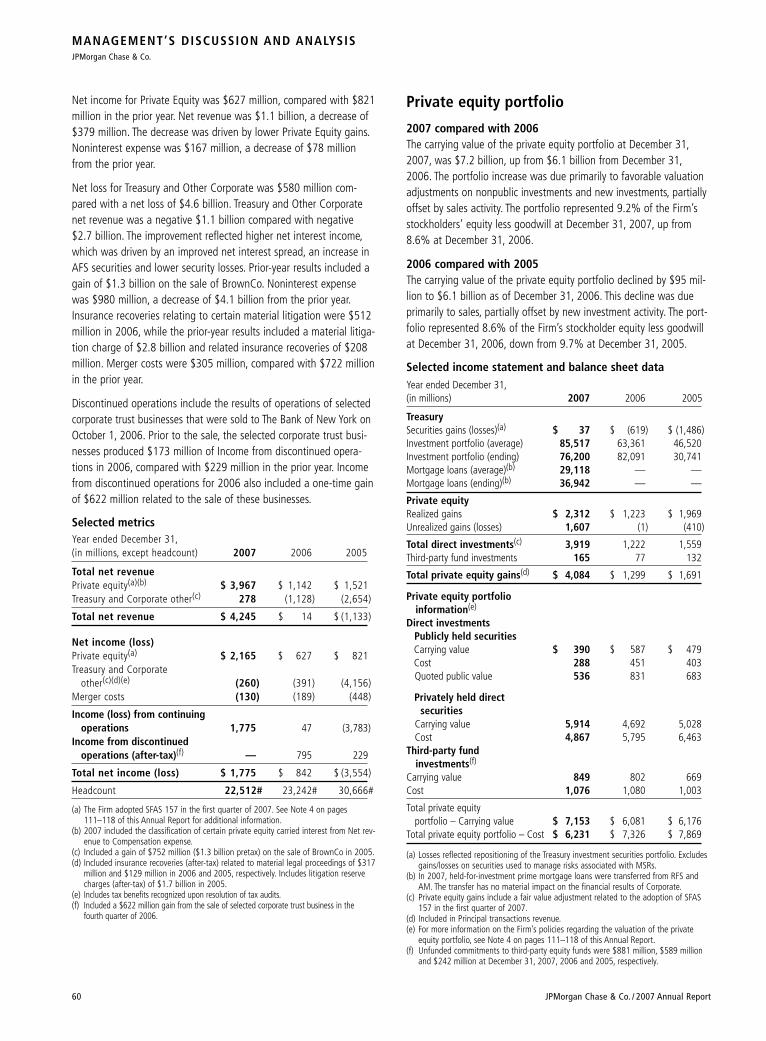
MANAGEMENT’S DISCUSSION AND ANALYSISJPMorgan Chase & Co.
60 JPMorgan Chase & Co. / 2007 Annual Report
Private equity portfolio
2007 compared with 2006 The carrying value of the private equity portfolio at December 31,2007, was $7.2 billion, up from $6.1 billion from December 31,2006. The portfolio increase was due primarily to favorable valuationadjustments on nonpublic investments and new investments, partiallyoffset by sales activity. The portfolio represented 9.2% of the Firm’sstockholders’ equity less goodwill at December 31, 2007, up from8.6% at December 31, 2006.
2006 compared with 2005The carrying value of the private equity portfolio declined by $95 mil-lion to $6.1 billion as of December 31, 2006. This decline was dueprimarily to sales, partially offset by new investment activity. The port-folio represented 8.6% of the Firm’s stockholder equity less goodwillat December 31, 2006, down from 9.7% at December 31, 2005.
Selected income statement and balance sheet data Year ended December 31,(in millions) 2007 2006 2005
TreasurySecurities gains (losses)(a) $ 37 $ (619) $ (1,486)Investment portfolio (average) 85,517 63,361 46,520Investment portfolio (ending) 76,200 82,091 30,741Mortgage loans (average)(b) 29,118 — —Mortgage loans (ending)(b) 36,942 — —
Private equity Realized gains $ 2,312 $ 1,223 $ 1,969Unrealized gains (losses) 1,607 (1) (410)
Total direct investments(c) 3,919 1,222 1,559Third-party fund investments 165 77 132
Total private equity gains(d) $ 4,084 $ 1,299 $ 1,691
Private equity portfolio information(e)
Direct investmentsPublicly held securitiesCarrying value $ 390 $ 587 $ 479Cost 288 451 403Quoted public value 536 831 683
Privately held direct securities
Carrying value 5,914 4,692 5,028Cost 4,867 5,795 6,463
Third-party fund investments(f)
Carrying value 849 802 669Cost 1,076 1,080 1,003
Total private equity portfolio – Carrying value $ 7,153 $ 6,081 $ 6,176
Total private equity portfolio – Cost $ 6,231 $ 7,326 $ 7,869
(a) Losses reflected repositioning of the Treasury investment securities portfolio. Excludesgains/losses on securities used to manage risks associated with MSRs.
(b) In 2007, held-for-investment prime mortgage loans were transferred from RFS andAM. The transfer has no material impact on the financial results of Corporate.
(c) Private equity gains include a fair value adjustment related to the adoption of SFAS157 in the first quarter of 2007.
(d) Included in Principal transactions revenue.(e) For more information on the Firm’s policies regarding the valuation of the private
equity portfolio, see Note 4 on pages 111–118 of this Annual Report.(f) Unfunded commitments to third-party equity funds were $881 million, $589 million
and $242 million at December 31, 2007, 2006 and 2005, respectively.
Net income for Private Equity was $627 million, compared with $821million in the prior year. Net revenue was $1.1 billion, a decrease of$379 million. The decrease was driven by lower Private Equity gains.Noninterest expense was $167 million, a decrease of $78 millionfrom the prior year.
Net loss for Treasury and Other Corporate was $580 million com-pared with a net loss of $4.6 billion. Treasury and Other Corporatenet revenue was a negative $1.1 billion compared with negative$2.7 billion. The improvement reflected higher net interest income,which was driven by an improved net interest spread, an increase inAFS securities and lower security losses. Prior-year results included again of $1.3 billion on the sale of BrownCo. Noninterest expensewas $980 million, a decrease of $4.1 billion from the prior year.Insurance recoveries relating to certain material litigation were $512million in 2006, while the prior-year results included a material litiga-tion charge of $2.8 billion and related insurance recoveries of $208million. Merger costs were $305 million, compared with $722 millionin the prior year.
Discontinued operations include the results of operations of selectedcorporate trust businesses that were sold to The Bank of New York onOctober 1, 2006. Prior to the sale, the selected corporate trust busi-nesses produced $173 million of Income from discontinued opera-tions in 2006, compared with $229 million in the prior year. Incomefrom discontinued operations for 2006 also included a one-time gainof $622 million related to the sale of these businesses.
Selected metrics Year ended December 31,(in millions, except headcount) 2007 2006 2005
Total net revenuePrivate equity(a)(b) $ 3,967 $ 1,142 $ 1,521Treasury and Corporate other(c) 278 (1,128) (2,654)
Total net revenue $ 4,245 $ 14 $ (1,133)
Net income (loss)Private equity(a) $ 2,165 $ 627 $ 821Treasury and Corporate
other(c)(d)(e) (260) (391) (4,156)Merger costs (130) (189) (448)
Income (loss) from continuing operations 1,775 47 (3,783)
Income from discontinued operations (after-tax)(f) — 795 229
Total net income (loss) $ 1,775 $ 842 $ (3,554)
Headcount 22,512# 23,242# 30,666#
(a) The Firm adopted SFAS 157 in the first quarter of 2007. See Note 4 on pages111–118 of this Annual Report for additional information.
(b) 2007 included the classification of certain private equity carried interest from Net rev-enue to Compensation expense.
(c) Included a gain of $752 million ($1.3 billion pretax) on the sale of BrownCo in 2005.(d) Included insurance recoveries (after-tax) related to material legal proceedings of $317
million and $129 million in 2006 and 2005, respectively. Includes litigation reservecharges (after-tax) of $1.7 billion in 2005.
(e) Includes tax benefits recognized upon resolution of tax audits.(f) Included a $622 million gain from the sale of selected corporate trust business in the
fourth quarter of 2006.
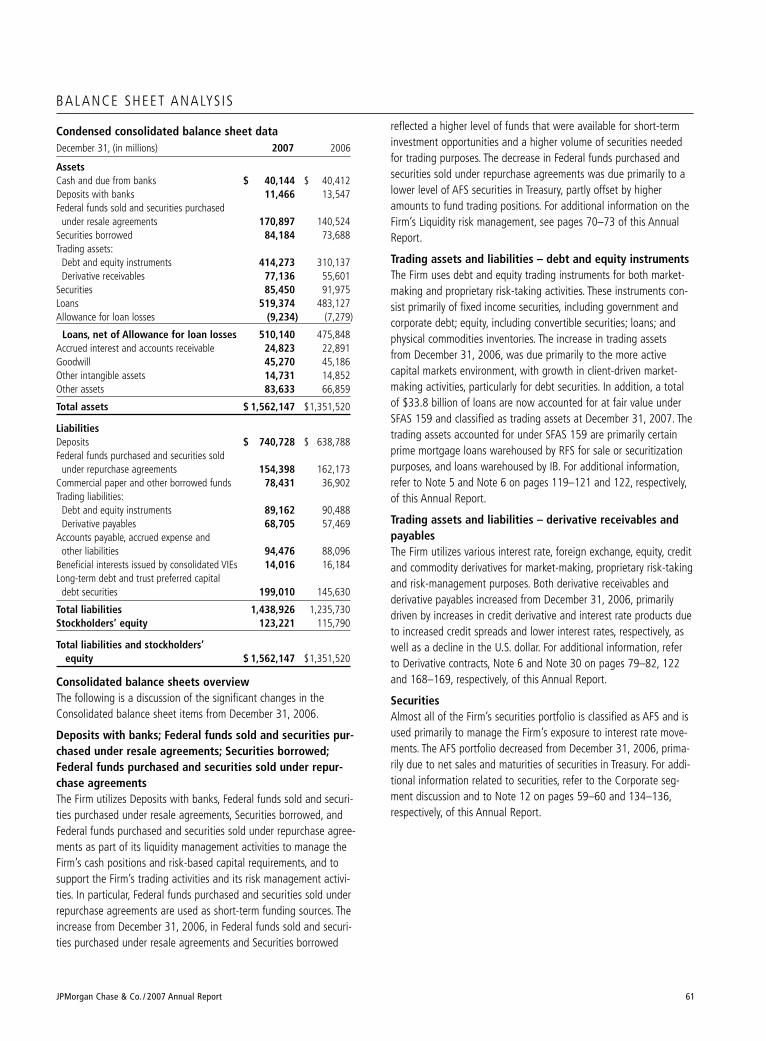
JPMorgan Chase & Co. / 2007 Annual Report 61
BALANCE SHEET ANALYS IS
Condensed consolidated balance sheet dataDecember 31, (in millions) 2007 2006
AssetsCash and due from banks $ 40,144 $ 40,412Deposits with banks 11,466 13,547Federal funds sold and securities purchased
under resale agreements 170,897 140,524Securities borrowed 84,184 73,688Trading assets:
Debt and equity instruments 414,273 310,137Derivative receivables 77,136 55,601
Securities 85,450 91,975Loans 519,374 483,127Allowance for loan losses (9,234) (7,279)
Loans, net of Allowance for loan losses 510,140 475,848Accrued interest and accounts receivable 24,823 22,891Goodwill 45,270 45,186Other intangible assets 14,731 14,852Other assets 83,633 66,859
Total assets $ 1,562,147 $1,351,520
LiabilitiesDeposits $ 740,728 $ 638,788Federal funds purchased and securities sold
under repurchase agreements 154,398 162,173Commercial paper and other borrowed funds 78,431 36,902Trading liabilities:
Debt and equity instruments 89,162 90,488Derivative payables 68,705 57,469
Accounts payable, accrued expense andother liabilities 94,476 88,096
Beneficial interests issued by consolidated VIEs 14,016 16,184Long-term debt and trust preferred capital
debt securities 199,010 145,630
Total liabilities 1,438,926 1,235,730Stockholders’ equity 123,221 115,790
Total liabilities and stockholders’ equity $ 1,562,147 $1,351,520
Consolidated balance sheets overviewThe following is a discussion of the significant changes in theConsolidated balance sheet items from December 31, 2006.
Deposits with banks; Federal funds sold and securities pur-chased under resale agreements; Securities borrowed;Federal funds purchased and securities sold under repur-chase agreementsThe Firm utilizes Deposits with banks, Federal funds sold and securi-ties purchased under resale agreements, Securities borrowed, andFederal funds purchased and securities sold under repurchase agree-ments as part of its liquidity management activities to manage theFirm’s cash positions and risk-based capital requirements, and tosupport the Firm’s trading activities and its risk management activi-ties. In particular, Federal funds purchased and securities sold underrepurchase agreements are used as short-term funding sources. Theincrease from December 31, 2006, in Federal funds sold and securi-ties purchased under resale agreements and Securities borrowed
reflected a higher level of funds that were available for short-terminvestment opportunities and a higher volume of securities neededfor trading purposes. The decrease in Federal funds purchased andsecurities sold under repurchase agreements was due primarily to alower level of AFS securities in Treasury, partly offset by higheramounts to fund trading positions. For additional information on theFirm’s Liquidity risk management, see pages 70–73 of this AnnualReport.
Trading assets and liabilities – debt and equity instrumentsThe Firm uses debt and equity trading instruments for both market-making and proprietary risk-taking activities. These instruments con-sist primarily of fixed income securities, including government andcorporate debt; equity, including convertible securities; loans; andphysical commodities inventories. The increase in trading assets from December 31, 2006, was due primarily to the more active capital markets environment, with growth in client-driven market-making activities, particularly for debt securities. In addition, a totalof $33.8 billion of loans are now accounted for at fair value underSFAS 159 and classified as trading assets at December 31, 2007. Thetrading assets accounted for under SFAS 159 are primarily certainprime mortgage loans warehoused by RFS for sale or securitizationpurposes, and loans warehoused by IB. For additional information,refer to Note 5 and Note 6 on pages 119–121 and 122, respectively,of this Annual Report.
Trading assets and liabilities – derivative receivables andpayablesThe Firm utilizes various interest rate, foreign exchange, equity, creditand commodity derivatives for market-making, proprietary risk-takingand risk-management purposes. Both derivative receivables andderivative payables increased from December 31, 2006, primarilydriven by increases in credit derivative and interest rate products dueto increased credit spreads and lower interest rates, respectively, aswell as a decline in the U.S. dollar. For additional information, referto Derivative contracts, Note 6 and Note 30 on pages 79–82, 122and 168–169, respectively, of this Annual Report.
SecuritiesAlmost all of the Firm’s securities portfolio is classified as AFS and isused primarily to manage the Firm’s exposure to interest rate move-ments. The AFS portfolio decreased from December 31, 2006, prima-rily due to net sales and maturities of securities in Treasury. For addi-tional information related to securities, refer to the Corporate seg-ment discussion and to Note 12 on pages 59–60 and 134–136,respectively, of this Annual Report.
MANAGEMENT’S DISCUSSION AND ANALYSISJPMorgan Chase & Co.
62 JPMorgan Chase & Co. / 2007 Annual Report
Loans and Allowance for loan lossesThe Firm provides loans to customers of all sizes, from large corporateand institutional clients to individual consumers. The Firm managesthe risk/reward relationship of each portfolio and discourages theretention of loan assets that do not generate a positive return abovethe cost of risk-adjusted capital. Loans increased $36.2 billion, or8%, from December 31, 2006, primarily due to business growth inwholesale lending activity, mainly in IB, CB and AM; organic growthin the Home Equity portfolio; and the decision during the third quar-ter of 2007 to retain rather than sell subprime mortgage loans. Theseincreases were offset partly by a decline in consumer loans as certainprime mortgage loans originated after January 1, 2007, are classifiedas Trading assets and accounted for at fair value under SFAS 159. Inaddition, certain loans warehoused in the IB were transferred toTrading assets on January 1, 2007, as part of the adoption of SFAS159. The Allowance for loan losses increased $2.0 billion, or 27%,from December 31, 2006. The consumer and wholesale componentsof the allowance increased $1.5 billion and $443 million, respectively.The increase in the consumer portion of the allowance was due toincreases of $1.2 billion in RFS, reflecting higher estimated lossesrelated to home equity and subprime mortgage loans, and $231 mil-lion in CS, reflecting a higher level of estimated net charge-offs in thecredit card portfolio. The increase in the wholesale portion of theallowance was primarily due to loan growth in IB and CB. For a moredetailed discussion of the loan portfolio and the Allowance for loanlosses, refer to Credit risk management on pages 73–89 of thisAnnual Report.
GoodwillGoodwill arises from business combinations and represents theexcess of the cost of an acquired entity over the net fair valueamounts assigned to assets acquired and liabilities assumed. Theincrease in Goodwill primarily resulted from certain acquisitions byTSS and CS, and currency translation adjustments on the SearsCanada credit card acquisition. Partially offsetting these increaseswas a reduction resulting from the adoption of FIN 48, as well astax-related purchase accounting adjustments. For additional informa-tion, see Notes 18 and 26 on pages 154–157 and 164–165, respec-tively, of this Annual Report.
Other intangible assetsThe Firm’s other intangible assets consist of MSRs, purchased creditcard relationships, other credit card-related intangibles, core depositintangibles and all other intangibles. The slight decline in Otherintangible assets reflects amortization, primarily related to credit cardbusiness-related intangibles and core deposit intangibles. Thisdecrease was offset largely by an increase in the MSR asset, as addi-tions from loan sales and purchases were offset partially by fair valuechanges reflecting modeled servicing portfolio runoff and negativefair value adjustments, as declining interest rates during the secondhalf of 2007 drove an increase in estimated future prepayments. Foradditional information on MSRs and other intangible assets, seeRFS’s Mortgage Banking business discussion and Note 18 on pages46–47 and 154–157 of this Annual Report.
DepositsThe Firm’s deposits represent a liability to customers, both retail andwholesale, for funds held on their behalf. Deposits are generally clas-sified by location (U.S. and non-U.S.), whether they are interest ornoninterest-bearing, and by type (i.e., demand, money market depositaccounts, savings, time or negotiable order of withdrawal accounts).Deposits help provide a stable and consistent source of funding forthe Firm. Deposits rose from December 31, 2006, primarily due to anet increase in wholesale interest-bearing deposits in TSS, AM andCB, driven by growth in business volumes. For more information ondeposits, refer to the RFS, TSS, and AM segment discussions and theLiquidity risk management discussion on pages 43–48, 54–55,56–58, and 70–73, respectively, of this Annual Report. For moreinformation on wholesale liability balances, including deposits, referto the CB and TSS segment discussions on pages 52–53 and 54–55,respectively, of this Annual Report.
Commercial paper and other borrowed fundsThe Firm utilizes Commercial paper and other borrowed funds as part of its liquidity management activities to cover short-term fundingneeds, and in connection with TSS’s cash management productwhereby clients’ excess funds, primarily in TSS, CB and RFS, are trans-ferred into commercial paper overnight sweep accounts. The increasesin Commercial paper and other borrowed funds were due primarily to the Firm’s ongoing efforts to build further liquidity, growth in thevolume of liability balances in sweep accounts and higher short-termrequirements to fund trading positions. For additional information onthe Firm’s Liquidity risk management, see pages 70–73 of this AnnualReport.
Long-term debt and trust preferred capital debt securitiesThe Firm utilizes Long-term debt and trust preferred capital debtsecurities to build liquidity as part of its longer-term liquidity andcapital management activities. Long-term debt and trust preferredcapital debt securities increased from December 31, 2006, reflectingnet new issuances, including client-driven structured notes in the IB.For additional information on the Firm’s long-term debt activities, seethe Liquidity risk management discussion on pages 70–73 of thisAnnual Report.
Stockholders’ equityTotal stockholders’ equity increased $7.4 billion from year-end 2006to $123.2 billion at December 31, 2007. The increase was primarilythe result of Net income for 2007, net shares issued under the Firm’semployee stock-based compensation plans, and the cumulative effecton Retained earnings of changes in accounting principles of $915million. These were offset partially by stock repurchases and the dec-laration of cash dividends. The $915 million increase in Retainedearnings resulting from the adoption of new accounting principlesprimarily reflected $287 million related to SFAS 157, $199 millionrelated to SFAS 159 and $436 million related to FIN 48 in the first quarter of 2007. For a further discussion of capital, see theCapital management section that follows; for a further discussion ofthe accounting changes, see Accounting and Reporting Developmentson page 99, Note 4 on pages 111–118, Note 5 on pages 119–121and Note 26 on pages 164–165 of this Form Annual Report.
JPMorgan Chase & Co. / 2007 Annual Report 63
CAPITAL MANAGEMENT
The Firm’s capital management framework is intended to ensure thatthere is capital sufficient to support the underlying risks of the Firm’sbusiness activities and to maintain “well-capitalized” status under reg-ulatory requirements. In addition, the Firm holds capital above theserequirements in amounts deemed appropriate to achieve manage-ment’s regulatory and debt rating objectives. The process of assigningequity to the lines of business is integrated into the Firm’s capitalframework and is overseen by ALCO.
Line of business equityThe Firm’s framework for allocating capital is based upon the follow-ing objectives:• integrate firmwide capital management activities with capital
management activities within each of the lines of business;• measure performance consistently across all lines of business; and• provide comparability with peer firms for each of the lines of business.
Equity for a line of business represents the amount the Firmbelieves the business would require if it were operating independ-ently, incorporating sufficient capital to address economic riskmeasures, regulatory capital requirements and capital levels for sim-ilarly rated peers. Capital is also allocated to each line of businessfor, among other things, goodwill associated with such line of busi-ness’ acquisitions since the Merger. In management’s view, thismethodology assigns responsibility to the lines of business to gener-ate returns on the amount of capital supporting acquisition-relatedgoodwill. At the time of the Merger, the Firm assigned to theCorporate segment an amount of equity capital equal to the then-current book value of goodwill from and prior to the Merger. Returnon equity is measured and internal targets for expected returns areestablished as a key measure of a business segment’s performance.The Firm may revise its equity capital-allocation methodology again inthe future.
In accordance with SFAS 142, the lines of business perform therequired goodwill impairment testing. For a further discussion ofgoodwill and impairment testing, see Critical accounting estimatesand Note 18 on pages 96–98 and 154–157, respectively, of thisAnnual Report.
Line of business equity Yearly Average(in billions) 2007 2006
Investment Bank $ 21.0 $ 20.8Retail Financial Services 16.0 14.6Card Services 14.1 14.1Commercial Banking 6.5 5.7Treasury & Securities Services 3.0 2.3Asset Management 3.9 3.5Corporate(a) 54.2 49.7
Total common stockholders’ equity $118.7 $110.7
(a) 2007 and 2006 include $41.7 billion of equity to offset goodwill and $12.5 billionand $8.0 billion, respectively, of equity, primarily related to Treasury, Private Equityand the Corporate Pension Plan.
Economic risk capitalJPMorgan Chase assesses its capital adequacy relative to the risksunderlying the Firm’s business activities, utilizing internal risk-assess-ment methodologies. The Firm measures economic capital primarilybased upon four risk factors: credit risk, market risk, operational riskand private equity risk, principally for the Firm’s private equity business.
Economic risk capital Yearly Average(in billions) 2007 2006
Credit risk(a) $ 30.0 $ 26.7Market risk 9.5 9.9Operational risk 5.6 5.7Private equity risk 3.7 3.4
Economic risk capital 48.8 45.7Goodwill 45.2 43.9Other(b) 24.7 21.1
Total common stockholders’ equity $118.7 $110.7
(a) Incorporates a change to the wholesale credit risk methodology, which has beenmodified to include a through-the-cycle adjustment (described below). The prior period has been revised to reflect this methodology change.
(b) Reflects additional capital required, in management’s view, to meet its regulatory and debt rating objectives.
Credit risk capital Credit risk capital is estimated separately for the wholesale businesses(IB, CB, TSS and AM) and consumer businesses (RFS and CS).
Credit risk capital for the overall wholesale credit portfolio is definedin terms of unexpected credit losses, both from defaults and declinesin the portfolio value due to credit deterioration, measured over aone-year period at a confidence level consistent with the level of capitalization necessary to achieve a targeted “AA” credit rating.Unexpected losses are losses in excess of those for which provisionsfor credit losses are maintained. The capital methodology is basedupon several principal drivers of credit risk: exposure at default (orloan-equivalent amount), default likelihood, credit spreads, lossseverity and portfolio correlation.
In 2007, an updated capital methodology was introduced for creditexposures in the IB and for certain non-IB credit exposures related topublicly traded entities. The updated methodology includes a through-the-cycle adjustment to capital levels that reflects capital that would be needed across the various credit cycles. Capital methodologiesemployed across all wholesale businesses now employ a through-the-cycle approach.
Credit risk capital for the consumer portfolio is based upon productand other relevant risk segmentation. Actual segment level default andseverity experience are used to estimate unexpected losses for a one-year horizon at a confidence level equivalent to the targeted “AA” creditrating. Statistical results for certain segments or portfolios are adjustedto ensure that capital is consistent with external benchmarks, such assubordination levels on market transactions or capital held at represen-tative monoline competitors, where appropriate.
Market risk capitalThe Firm calculates market risk capital guided by the principle that cap-ital should reflect the risk of loss in the value of portfolios and financialinstruments caused by adverse movements in market variables, such asinterest and foreign exchange rates, credit spreads, securities pricesand commodities prices. Daily Value-at-Risk (“VAR”), monthly stress-test results and other factors are used to determine appropriate capitallevels. The Firm allocates market risk capital to each business segmentaccording to a formula that weights that segment’s VAR and stress-testexposures. See Market risk management on pages 90–94 of thisAnnual Report for more information about these market risk measures.
Operational risk capitalCapital is allocated to the lines of business for operational risk usinga risk-based capital allocation methodology which estimates opera-tional risk on a bottom-up basis. The operational risk capital model isbased upon actual losses and potential scenario-based stress losses,with adjustments to the capital calculation to reflect changes in thequality of the control environment or the use of risk-transfer prod-ucts. The Firm believes its model is consistent with the new Basel IIFramework and expects to propose it for qualification under theBasel II advanced measurement approach for operational risk.
Private equity risk capitalCapital is allocated to privately and publicly held securities, third-partyfund investments and commitments in the Private Equity portfolio tocover the potential loss associated with a decline in equity marketsand related asset devaluations. In addition to negative market fluctua-tions, potential losses in private equity investment portfolios can bemagnified by liquidity risk. The capital allocation for the Private Equityportfolio is based upon measurement of the loss experience suffered bythe Firm and other market participants over a prolonged period ofadverse equity market conditions.
Regulatory capital The Board of Governors of the Federal Reserve System (the “FederalReserve Board”) establishes capital requirements, including well-capital-ized standards for the consolidated financial holding company. The Officeof the Comptroller of the Currency establishes similar capital require-ments and standards for the Firm’s national banks, including JPMorganChase Bank, N.A., and Chase Bank USA, N.A.
JPMorgan Chase maintained a well-capitalized position, based uponTier1 and Total capital ratios at December 31, 2007 and 2006 as indicated in the tables below.
Capital ratiosWell-capitalized
December 31, 2007 2006 ratios
Tier 1 capital ratio 8.4% 8.7% 6.0%Total capital ratio 12.6 12.3 10.0Tier 1 leverage ratio 6.0 6.2 NATotal stockholders’ equity to assets 7.9 8.6 NA
Risk-based capital components and assetsDecember 31, (in millions) 2007 2006
Total Tier 1 capital $ 88,746 $ 81,055Total Tier 2 capital 43,496 34,210
Total capital $ 132,242 $ 115,265
Risk-weighted assets $ 1,051,879 $ 935,909Total adjusted average assets 1,473,541 1,308,699
Tier 1 capital was $88.7 billion at December 31, 2007, compared with $81.1 billion at December 31, 2006, an increase of $7.7 billion.The increase was due primarily to net income of $15.4 billion; netissuances of common stock under the Firm’s employee stock-basedcompensation plans of $3.9 billion; net issuances of $2.0 billion ofqualifying trust preferred capital debt securities; and the after-taxeffects of the adoption of new accounting principles reflecting increasesof $287 million for SFAS 157, $199 million for SFAS 159 and $436million for FIN 48. These increases were partially offset by decreases inStockholders’ equity net of Accumulated other comprehensive income(loss) due to common stock repurchases of $8.2 billion and dividendsdeclared of $5.2 billion. In addition, the change in capital reflects theexclusion of an $882 million (after-tax) valuation adjustment to certainliabilities pursuant to SFAS 157 to reflect the credit quality of the Firm.Additional information regarding the Firm’s capital ratios and the fed-eral regulatory capital standards to which it is subject is presented inNote 28 on pages 166–167 of this Annual Report.
MANAGEMENT’S DISCUSSION AND ANALYSISJPMorgan Chase & Co.
64 JPMorgan Chase & Co. / 2007 Annual Report
JPMorgan Chase & Co. / 2007 Annual Report 65
Basel II The minimum risk-based capital requirements adopted by the federalbanking agencies follow the Capital Accord of the Basel Committee onBanking Supervision. In 2004, the Basel Committee published a revi-sion to the Accord (“Basel II”). The goal of the new Basel II Frameworkis to provide more risk-sensitive regulatory capital calculations and pro-mote enhanced risk management practices among large, internationallyactive banking organizations. U.S. banking regulators published a finalBasel II rule in December 2007, which will require JPMorgan Chase toimplement Basel II at the holding company level, as well as at certainkey U.S. bank subsidiaries.
Prior to full implementation of the new Basel II Framework, JPMorganChase will be required to complete a qualification period of four con-secutive quarters during which it will need to demonstrate that itmeets the requirements of the new rule to the satisfaction of its pri-mary U.S. banking regulators. The U.S. implementation timetable con-sists of the qualification period, starting any time between April 1,2008, and April 1, 2010, followed by a minimum transition period ofthree years. During the transition period Basel II risk-based capitalrequirements cannot fall below certain floors based on current (“Basel l”)regulations. JPMorgan Chase expects to be in compliance with all rele-vant Basel II rules within the established timelines. In addition, the Firmwill continue to adopt Basel II rules in certain non-U.S. jurisdictions,as required.
DividendsThe Firm’s common stock dividend policy reflects JPMorgan Chase’searnings outlook, desired dividend payout ratios, need to maintain anadequate capital level and alternative investment opportunities. TheFirm continues to target a dividend payout ratio of approximately30–40% of Net income over time. On April 17, 2007, the Board ofDirectors increased the quarterly dividend to $0.38 per share.
The following table shows the common dividend payout ratio basedupon reported Net income.
Common dividend payout ratioYear ended December 31, 2007 2006 2005
Common dividend payout ratio 34% 34% 57%
For information regarding restrictions on JPMorgan Chase’s ability to paydividends, see Note 27 on pages 165–166 of this Annual Report.
Stock repurchasesOn April 17, 2007, the Board of Directors approved a stock repurchaseprogram that authorizes the repurchase of up to $10.0 billion of theFirm’s common shares, which supersedes an $8.0 billion stock repur-chase program approved in 2006. The $10.0 billion authorizationincludes shares to be repurchased to offset issuances under the Firm’semployee stock-based plans. The actual number of shares repurchasedis subject to various factors, including market conditions; legal consid-erations affecting the amount and timing of repurchase activity; theFirm’s capital position (taking into account goodwill and intangibles);internal capital generation; and alternative potential investment oppor-tunities. The repurchase program does not include specific price targetsor timetables, may be executed through open market purchases or pri-vately negotiated transactions, or utilizing Rule 10b5-1 programs, andmay be suspended at any time.
For the year ended December 31, 2007, under the respective stockrepurchase programs then in effect, the Firm repurchased a total of 168million shares for $8.2 billion at an average price per share of $48.60.During 2006, under the respective stock repurchase programs then ineffect, the Firm repurchased 91 million shares for $3.9 billion at an aver-age price per share of $43.41.
As of December 31, 2007, $6.2 billion of authorized repurchase capacityremained under the current stock repurchase program.
The Firm has determined that it may, from time to time, enter into writ-ten trading plans under Rule 10b5-1 of the Securities Exchange Act of1934 to facilitate the repurchase of common stock in accordance withthe repurchase program. A Rule 10b5-1 repurchase plan allows theFirm to repurchase shares during periods when it would not otherwisebe repurchasing common stock – for example, during internal trading“black-out periods.” All purchases under a Rule 10b5-1 plan must bemade according to a predefined plan that is established when the Firmis not aware of material nonpublic information.
For additional information regarding repurchases of the Firm’s equitysecurities, see Part II, Item 5, Market for registrant’s common equity,related stockholder matters and issuer purchases of equity securities,on pages 13–14 of JPMorgan Chase’s 2007 Form 10-K.
OFF–BALANCE SHEET ARRANGEMENTS AND CONTRACTUAL CASH OBL IGAT IONS
in the SPE in order to provide liquidity. These commitments areincluded in other unfunded commitments to extend credit and assetpurchase agreements, as shown in the Off-balance sheet lending-related financial instruments and guarantees table on page 68 ofthis Annual Report.
As noted above, the Firm is involved with three types of SPEs.A summary of each type of SPE follows.
Multi-seller conduitsThe Firm helps customers meet their financing needs by providingaccess to the commercial paper markets through VIEs known as multi-seller conduits. Multi-seller conduit entities are separate bankruptcy-remote entities that purchase interests in, and make loans secured by,pools of receivables and other financial assets pursuant to agreementswith customers of the Firm. The conduits fund their purchases andloans through the issuance of highly rated commercial paper to third-party investors. The primary source of repayment of the commercialpaper is the cash flow from the pools of assets. JPMorgan Chasereceives fees related to the structuring of multi-seller conduit transac-tions and receives compensation from the multi-seller conduits for itsrole as administrative agent, liquidity provider, and provider of pro-gram-wide credit enhancement.
Investor intermediationAs a financial intermediary, the Firm creates certain types of VIEs andalso structures transactions, typically derivative structures, with theseVIEs to meet investor needs. The Firm may also provide liquidity andother support. The risks inherent in derivative instruments or liquiditycommitments are managed similarly to other credit, market and liq-uidity risks to which the Firm is exposed. The principal types of VIEsthe Firm uses in these structuring activities are municipal bond vehi-cles, credit-linked note vehicles and collateralized debt obligationsvehicles.
Loan SecuritizationsJPMorgan Chase securitizes and sells a variety of its consumer andwholesale loans, including warehouse loans that are classified inTrading assets, through SPEs that are structured to meet the defini-tion of a QSPE (as discussed in Note 1 on page 108 of this AnnualReport). The primary purpose of these vehicles is to meet investorneeds and to generate liquidity for the Firm through the sale of theloans to the QSPEs. Consumer activities include securitizations of res-idential real estate, credit card, automobile and education loans thatare originated or purchased by RFS and CS. Wholesale activitiesinclude securitizations of purchased residential real estate loans andcommercial loans (primarily real estate-related) originated by the IB.
Consolidation and consolidation sensitivity analysis on capitalFor more information regarding these programs and the Firm’s otherSPEs, as well as the Firm’s consolidation analysis for these programs,see Note 16 and Note 17 on pages 139–145 and 146–154, respec-tively, of this Annual Report.
MANAGEMENT’S DISCUSSION AND ANALYSISJPMorgan Chase & Co.
66 JPMorgan Chase & Co. / 2007 Annual Report
JPMorgan Chase is involved with several types of off-balance sheetarrangements, including special purpose entities (“SPEs”) and lend-ing-related financial instruments (e.g., commitments and guarantees).
Special-purpose entitiesThe basic SPE structure involves a company selling assets to the SPE.The SPE funds the purchase of those assets by issuing securities toinvestors in the form of commercial paper, short-term asset-backednotes, medium-term notes and other forms of interest. SPEs are gen-erally structured to insulate investors from claims on the SPE’s assetsby creditors of other entities, including the creditors of the seller ofthe assets.
SPEs are an important part of the financial markets, providing marketliquidity by facilitating investors’ access to specific portfolios ofassets and risks. These arrangements are integral to the markets formortgage-backed securities, commercial paper and other asset-backed securities.
JPMorgan Chase uses SPEs as a source of liquidity for itself and itsclients by securitizing financial assets, and by creating investmentproducts for clients. The Firm is involved with SPEs through multi-seller conduits and investor intermediation activities, and as a resultof its loan securitizations, through qualifying special purpose entities(“QSPEs”). This discussion focuses mostly on multi-seller conduitsand investor intermediation. For a detailed discussion of all SPEswith which the Firm is involved, and the related accounting, seeNote 1 on page 108, Note 16 on pages 139–145 and Note 17 onpages 146–154 of this Annual Report.
The Firm holds capital, as deemed appropriate, against all SPE-relat-ed transactions and related exposures, such as derivative transactionsand lending-related commitments and guarantees.
The Firm has no commitments to issue its own stock to support anySPE transaction, and its policies require that transactions with SPEsbe conducted at arm’s length and reflect market pricing. Consistentwith this policy, no JPMorgan Chase employee is permitted to investin SPEs with which the Firm is involved where such investmentwould violate the Firm’s Code of Conduct. These rules prohibitemployees from self-dealing and acting on behalf of the Firm intransactions with which they or their family have any significantfinancial interest.
Implications of a credit rating downgrade to JPMorgan Chase Bank, N.A.For certain liquidity commitments to SPEs, the Firm could be requiredto provide funding if the short-term credit rating of JPMorgan ChaseBank, N.A., was downgraded below specific levels, primarily “P-1”,“A-1” and “F1” for Moody’s, Standard & Poor’s and Fitch, respec-tively. The amount of these liquidity commitments was $94.0 billionand $74.4 billion at December 31, 2007 and 2006, respectively.Alternatively, if JPMorgan Chase Bank, N.A., were downgraded, theFirm could be replaced by another liquidity provider in lieu of provid-ing funding under the liquidity commitment, or in certain circum-stances, the Firm could facilitate the sale or refinancing of the assets
JPMorgan Chase & Co. / 2007 Annual Report 67
Special-purpose entities revenueThe following table summarizes certain revenue information related toconsolidated and nonconsolidated VIEs and QSPEs with which theFirm has significant involvement. The revenue reported in the tablebelow primarily represents contractual servicing and credit fee income(i.e., for income from acting as administrator, structurer, liquidityprovider). It does not include mark-to-market gains and losses fromchanges in the fair value of trading positions (such as derivative trans-actions) entered into with VIEs. Those gains and losses are recorded inPrincipal transactions revenue.
Revenue from VIEs and QSPEsYear ended December 31,(in millions) 2007 2006 2005
VIEs:(a)
Multi-seller conduits $ 187(b) $ 160 $ 172Investor intermediation 33 49 50
Total VIEs 220 209 222QSPEs 3,479 3,183 2,940
Total $ 3,699 $3,392 $ 3,162
(a) Includes revenue associated with consolidated VIEs and significant nonconsolidatedVIEs.
(b) Excludes the markdown on subprime CDO assets that was recorded in Principal trans-action revenue during the fourth quarter of 2007.
American Securitization Forum subprime adjustable rate mortgage loans modificationsIn December 2007, the American Securitization Forum (“ASF”) issuedthe “Streamlined Foreclosure and Loss Avoidance Framework forSecuritized Subprime Adjustable Rate Mortgage Loans” (“theFramework”). The Framework provides guidance for servicers tostreamline evaluation procedures of borrowers with certain subprimeadjustable rate mortgage (“ARM”) loans to more quickly and efficientlyprovide modification of such loans with terms that are more appropriatefor the individual needs of such borrowers. The Framework applies to allfirst-lien subprime ARM loans that have a fixed rate of interest for aninitial period of 36 months or less, are included in securitized pools,were originated between January 1, 2005, and July 31, 2007, andhave an initial interest rate reset date between January 1, 2008, andJuly 31, 2010. JPMorgan Chase has adopted the Framework, and itexpects to begin modifying eligible loans by the end of the first quar-ter of 2008. For additional discussion of the Framework, see Note 16on page 145 of this Annual Report.
Off–balance sheet lending-related financialinstruments and guaranteesJPMorgan Chase utilizes lending-related financial instruments (e.g.,commitments and guarantees) to meet the financing needs of itscustomers. The contractual amount of these financial instrumentsrepresents the maximum possible credit risk should the counterpartydraw upon the commitment or the Firm be required to fulfill its obli-gation under the guarantee, and the counterparty subsequently failto perform according to the terms of the contract. Most of thesecommitments and guarantees expire without a default occurring orwithout being drawn. As a result, the total contractual amount ofthese instruments is not, in the Firm’s view, representative of its actu-al future credit exposure or funding requirements. Further, certaincommitments, primarily related to consumer financings, are cance-lable, upon notice, at the option of the Firm. For further discussion oflending-related commitments and guarantees and the Firm’saccounting for them, see Credit risk management on pages 73–89and Note 31 on pages 170–173 of this Annual Report.
Contractual cash obligationsIn the normal course of business, the Firm enters into various con-tractual obligations that may require future cash payments.Commitments for future cash expenditures primarily include contractsto purchase future services and capital expenditures related to realestate–related obligations and equipment.
The accompanying table summarizes, by remaining maturity,JPMorgan Chase’s off–balance sheet lending-related financial instru-ments and significant contractual cash obligations at December 31,2007. Contractual purchases and capital expenditures in the tablebelow reflect the minimum contractual obligation under legallyenforceable contracts with terms that are both fixed and deter-minable. Excluded from the following table are a number of obliga-tions to be settled in cash, primarily in under one year. These obliga-tions are reflected on the Firm’s Consolidated balance sheets andinclude Federal funds purchased and securities sold under repurchaseagreements; Commercial paper; Other borrowed funds; purchases ofDebt and equity instruments; Derivative payables; and certain pur-chases of instruments that resulted in settlement failures. Alsoexcluded are contingent payments associated with certain acquisi-tions that could not be estimated. For discussion regarding Long-term debt and trust preferred capital debt securities, see Note 21 onpages 159–160 of this Annual Report. For discussion regarding oper-ating leases, see Note 29 on page 167 of this Annual Report.
MANAGEMENT’S DISCUSSION AND ANALYSISJPMorgan Chase & Co.
68 JPMorgan Chase & Co. / 2007 Annual Report
The following table presents maturity information for off-balance sheet lending-related financial instruments and guarantees.
Off–balance sheet lending-related financial instruments and guarantees
By remaining maturity at December 31, 2007 2006(in millions) 2008 2009-2010 2011-2012 After 2012 Total Total
Lending-relatedConsumer(a) $ 740,080 $ 2,852 $ 3,222 $ 69,782 $ 815,936 $ 747,535Wholesale:
Other unfunded commitments to extend credit(b)(c)(d)(e) 97,459 61,710 73,725 18,060 250,954 229,204Asset purchase agreements(f) 28,521 45,087 14,171 2,326 90,105 67,529Standby letters of credit and guarantees(c)(g)(h) 24,970 26,704 40,792 7,756 100,222 89,132Other letters of credit(c) 4,463 792 109 7 5,371 5,559
Total wholesale 155,413 134,293 128,797 28,149 446,652 391,424
Total lending-related $ 895,493 $137,145 $ 132,019 $ 97,931 $ 1,262,588 $1,138,959
Other guaranteesSecurities lending guarantees(i) $ 385,758 $ — $ — $ — $ 385,758 $ 318,095Derivatives qualifying as guarantees(j) 26,541 8,543 24,556 25,622 85,262 71,531
Contractual cash obligationsBy remaining maturity at December 31,(in millions)
Time deposits $ 243,923 $ 3,246 $ 2,108 $ 600 $ 249,877 $ 204,349Long-term debt 28,941 55,797 36,042 63,082 183,862 133,421Trust preferred capital debt securities — — — 15,148 15,148 12,209FIN 46R long-term beneficial interests(k) 35 79 2,070 5,025 7,209 8,336Operating leases(l) 1,040 1,943 1,644 6,281 10,908 11,029Contractual purchases and capital expenditures 1,597 576 131 130 2,434 1,584Obligations under affinity and co-brand programs 1,092 2,231 2,079 75 5,477 6,115Other liabilities(m) 690 937 917 3,112 5,656 5,302
Total $ 277,318 $ 64,809 $ 44,991 $ 93,453 $ 480,571 $ 382,345
(a) Included credit card and home equity lending-related commitments of $714.8 billion and $74.2 billion, respectively, at December 31, 2007; and $657.1 billion and $69.6 billion,respectively, at December 31, 2006. These amounts for credit card and home equity lending-related commitments represent the total available credit for these products. The Firm hasnot experienced, and does not anticipate, that all available lines of credit for these products will be utilized at the same time. The Firm can reduce or cancel these lines of credit by pro-viding the borrower prior notice or, in some cases, without notice as permitted by law.
(b) Includes unused advised lines of credit totaling $38.4 billion and $39.0 billion at December 31, 2007 and 2006, respectively, which are not legally binding. In regulatory filings withthe Federal Reserve Board, unused advised lines are not reportable. See the Glossary of terms, on page 181 of this Annual Report, for the Firm’s definition of advised lines of credit.
(c) Represents contractual amount net of risk participations totaling $28.3 billion and $32.8 billion at December 31, 2007 and 2006, respectively.(d) Excludes unfunded commitments for private third-party equity investments of $881 million and $589 million at December 31, 2007 and 2006, respectively. Also excludes unfunded
commitments for other equity investments of $903 million and $943 million at December 31, 2007 and 2006, respectively.(e) Included in Other unfunded commitments to extend credit are commitments to investment and noninvestment grade counterparties in connection with leveraged acquisitions of $8.2 billion at
December 31, 2007.(f) Largely represents asset purchase agreements to the Firm’s administered multi-seller, asset-backed commercial paper conduits. The maturity is based upon the weighted-average life of the
underlying assets in the SPE, which are primarily asset purchase agreements to the Firm’s administered multi-seller asset-backed commercial paper conduits. It also includes $1.1 billionand $1.4 billion of asset purchase agreements to other third-party entities at December 31, 2007 and 2006, respectively.
(g) JPMorgan Chase held collateral relating to $15.8 billion and $13.5 billion of these arrangements at December 31, 2007 and 2006, respectively.(h) Included unused commitments to issue standby letters of credit of $50.7 billion and $45.7 billion at December 31, 2007 and 2006, respectively.(i) Collateral held by the Firm in support of securities lending indemnification agreements was $390.5 billion and $317.9 billion at December 31, 2007 and 2006, respectively.(j) Represents notional amounts of derivatives qualifying as guarantees. For further discussion of guarantees, see Note 31 on pages 170–173 of this Annual Report.(k) Included on the Consolidated balance sheets in Beneficial interests issued by consolidated variable interest entities.(l) Excluded benefit of noncancelable sublease rentals of $1.3 billion and $1.2 billion at December 31, 2007 and 2006, respectively.(m)Included deferred annuity contracts. Excludes contributions for pension and other postretirement benefits plans, if any, as these contributions are not reasonably estimable at this time.
Also excluded are unrecognized tax benefits of $4.8 billion at December 31, 2007, as the timing and amount of future cash payments is not determinable at this time.
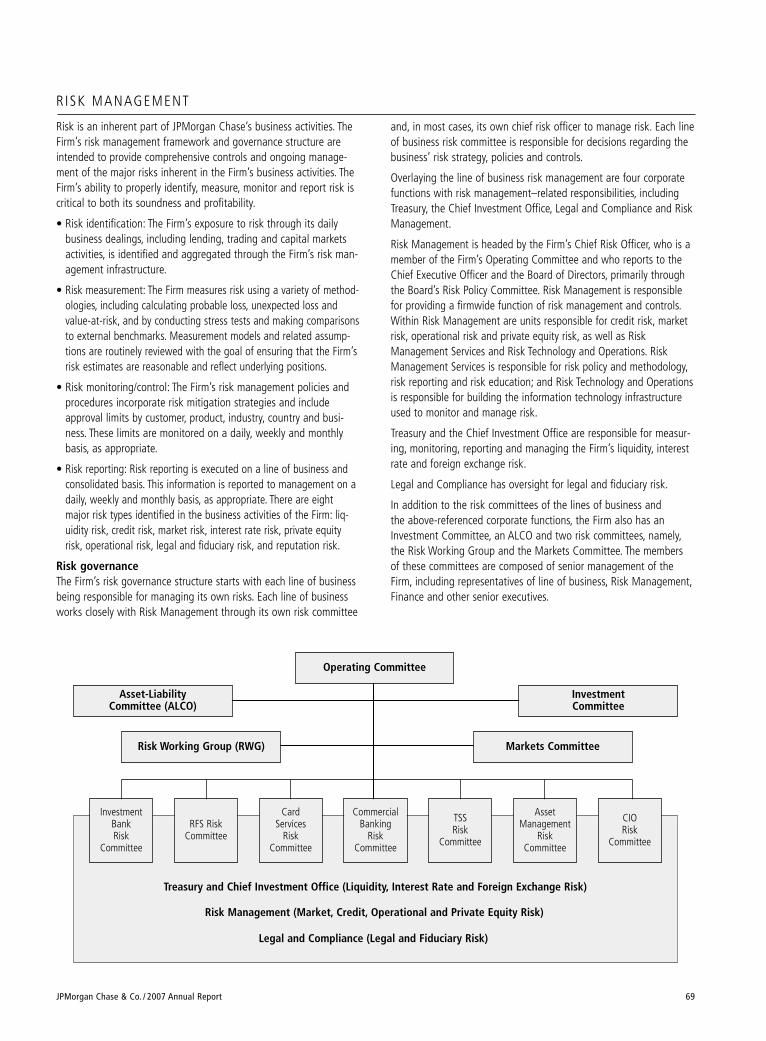
JPMorgan Chase & Co. / 2007 Annual Report 69
RISK MANAGEMENT
Risk is an inherent part of JPMorgan Chase’s business activities. TheFirm’s risk management framework and governance structure areintended to provide comprehensive controls and ongoing manage-ment of the major risks inherent in the Firm’s business activities. TheFirm’s ability to properly identify, measure, monitor and report risk iscritical to both its soundness and profitability.
• Risk identification: The Firm’s exposure to risk through its dailybusiness dealings, including lending, trading and capital marketsactivities, is identified and aggregated through the Firm’s risk man-agement infrastructure.
• Risk measurement: The Firm measures risk using a variety of method-ologies, including calculating probable loss, unexpected loss andvalue-at-risk, and by conducting stress tests and making comparisonsto external benchmarks. Measurement models and related assump-tions are routinely reviewed with the goal of ensuring that the Firm’srisk estimates are reasonable and reflect underlying positions.
• Risk monitoring/control: The Firm’s risk management policies andprocedures incorporate risk mitigation strategies and includeapproval limits by customer, product, industry, country and busi-ness. These limits are monitored on a daily, weekly and monthlybasis, as appropriate.
• Risk reporting: Risk reporting is executed on a line of business andconsolidated basis. This information is reported to management on adaily, weekly and monthly basis, as appropriate. There are eightmajor risk types identified in the business activities of the Firm: liq-uidity risk, credit risk, market risk, interest rate risk, private equityrisk, operational risk, legal and fiduciary risk, and reputation risk.
Risk governanceThe Firm’s risk governance structure starts with each line of businessbeing responsible for managing its own risks. Each line of businessworks closely with Risk Management through its own risk committee
and, in most cases, its own chief risk officer to manage risk. Each lineof business risk committee is responsible for decisions regarding thebusiness’ risk strategy, policies and controls.
Overlaying the line of business risk management are four corporatefunctions with risk management–related responsibilities, includingTreasury, the Chief Investment Office, Legal and Compliance and RiskManagement.
Risk Management is headed by the Firm’s Chief Risk Officer, who is amember of the Firm’s Operating Committee and who reports to theChief Executive Officer and the Board of Directors, primarily throughthe Board’s Risk Policy Committee. Risk Management is responsiblefor providing a firmwide function of risk management and controls.Within Risk Management are units responsible for credit risk, marketrisk, operational risk and private equity risk, as well as RiskManagement Services and Risk Technology and Operations. RiskManagement Services is responsible for risk policy and methodology,risk reporting and risk education; and Risk Technology and Operationsis responsible for building the information technology infrastructureused to monitor and manage risk.
Treasury and the Chief Investment Office are responsible for measur-ing, monitoring, reporting and managing the Firm’s liquidity, interestrate and foreign exchange risk.
Legal and Compliance has oversight for legal and fiduciary risk.
In addition to the risk committees of the lines of business and the above-referenced corporate functions, the Firm also has anInvestment Committee, an ALCO and two risk committees, namely,the Risk Working Group and the Markets Committee. The membersof these committees are composed of senior management of theFirm, including representatives of line of business, Risk Management,Finance and other senior executives.
InvestmentCommittee
Asset-LiabilityCommittee (ALCO)
Markets CommitteeRisk Working Group (RWG)
Operating Committee
Treasury and Chief Investment Office (Liquidity, Interest Rate and Foreign Exchange Risk)
RFS Risk Committee
CardServices
RiskCommittee
TSSRisk
Committee
AssetManagement
RiskCommittee
CommercialBanking
RiskCommittee
InvestmentBankRisk
Committee
CIORisk
Committee
Risk Management (Market, Credit, Operational and Private Equity Risk)
Legal and Compliance (Legal and Fiduciary Risk)

MANAGEMENT’S DISCUSSION AND ANALYSISJPMorgan Chase & Co.
70 JPMorgan Chase & Co. / 2007 Annual Report
The Investment Committee oversees global merger and acquisitionactivities undertaken by JPMorgan Chase for its own account thatfall outside the scope of the Firm’s private equity and other principalfinance activities.
The Asset-Liability Committee is responsible for approving the Firm’sliquidity policy, including contingency funding planning and exposureto SPEs (and any required liquidity support by the Firm of such SPEs).The Asset-Liability Committee also oversees the Firm’s capital man-agement and funds transfer pricing policy (through which lines ofbusiness “transfer” interest and foreign exchange risk to Treasury inthe Corporate segment).
The Risk Working Group meets monthly to review issues such as riskpolicy, risk methodology, Basel II and regulatory issues and topicsreferred to it by any line of business risk committee. The MarketsCommittee, chaired by the Chief Executive Officer, meets weekly to
review and determine appropriate courses of action with respect tosignificant risk matters, including but not limited to: limits; credit,market and operational risk; large, high risk transactions; and hedg-ing strategies.
The Board of Directors exercises its oversight of risk management,principally through the Board’s Risk Policy Committee and AuditCommittee. The Risk Policy Committee oversees senior managementrisk-related responsibilities, including reviewing management policiesand performance against these policies and related benchmarks. TheAudit Committee is responsible for oversight of guidelines and poli-cies that govern the process by which risk assessment and manage-ment is undertaken. In addition, the Audit Committee reviews withmanagement the system of internal controls and financial reportingthat is relied upon to provide reasonable assurance of compliancewith the Firm’s operational risk management processes.
L IQUID ITY R ISK MANAGEMENT
The goal of liquidity risk management is to ensure that cost-effectivefunding is available to meet actual and contingent liquidity needsover time.
JPMorgan Chase uses a centralized approach for liquidity risk man-agement. Global funding is managed by Treasury, using regionalexpertise as appropriate. Management believes that a centralizedframework maximizes liquidity access, minimizes funding costs andpermits global identification and coordination of liquidity risk.
GovernanceALCO approves and oversees the execution of the Firm’s liquiditypolicy and contingency funding plan. Treasury formulates the Firm’sliquidity and contingency planning strategies and is responsible formeasuring, monitoring, reporting and managing the Firm’s liquidityrisk profile.
Liquidity monitoring and recent actions Treasury monitors historical liquidity trends, tracks historical andprospective on- and off-balance sheet liquidity obligations, identifiesand measures internal and external liquidity warning signals to permitearly detection of liquidity issues, and manages contingency planning(including identification and testing of various company-specific andmarket-driven stress scenarios). Various tools, which together con-tribute to an overall liquidity perspective, are used to monitor andmanage liquidity. These include analysis of the timing of liquiditysources versus liquidity uses (i.e., funding gaps) over periods rangingfrom overnight to one year; management of debt and capital issuanceto ensure that the illiquid portion of the balance sheet can be fundedby equity, long-term debt, trust preferred capital debt securities anddeposits the Firm believes to be stable; and assessment of the Firm’scapacity to raise incremental unsecured and secured funding.
Liquidity of the parent holding company and its nonbank subsidiariesis monitored separately from the Firm’s bank subsidiaries. At the par-ent holding company level, long-term funding is managed to ensurethat the parent holding company has sufficient liquidity to cover itsobligations and those of its nonbank subsidiaries within the next 12months. For bank subsidiaries, the focus of liquidity risk managementis on maintenance of unsecured and secured funding capacity suffi-cient to meet on- and off-balance sheet obligations.
An extension of liquidity management is the Firm’s contingency fund-ing plan. The goal of the plan is to ensure appropriate liquidity dur-ing normal and stress periods. The plan considers various temporaryand long-term stress scenarios where access to unsecured funding is severely limited or nonexistent, taking into account both on- andoff-balance sheet exposures, and separately evaluates access tofunds by the parent holding company, JPMorgan Chase Bank, N.A.,Chase Bank USA, N.A., and J.P. Morgan Securities Inc.
In response to the market turmoil in the latter half of 2007,JPMorgan Chase took various actions to strengthen the Firm’s liquid-ity position. In anticipation of possible incremental funding require-ments that could have resulted from draws under unfunded revolvingcredit facilities and/or potential consolidation or purchase of assetsfrom VIEs, the parent holding company increased issuance of com-mercial paper, long-term debt and trust preferred capital debt securi-ties, and bank subsidiaries increased retail and wholesale unsecuredfunding liabilities. In addition, JPMorgan Chase Bank, N.A., main-tained sufficient secured borrowing capacity, when aggregated withunsecured funding sources, to cover anticipated on- and off-balancesheet obligations of bank subsidiaries.
As of December 31, 2007, the Firm’s liquidity position remainedstrong based upon its liquidity metrics.
JPMorgan Chase & Co. / 2007 Annual Report 71
FundingSources of fundsManagement uses a variety of unsecured and secured fundingsources to generate liquidity, taking into consideration, among otherfactors, market conditions, prevailing interest rates, liquidity needsand the desired maturity profile of liabilities. Markets are evaluatedon an ongoing basis to achieve an appropriate global balance ofunsecured and secured funding at favorable rates. The Firm’s abilityto generate funding from a broad range of sources in a variety ofgeographic locations enhances financial flexibility and limits depend-ence on any one source. Diversification of funding is an importantcomponent of the Firm’s liquidity management strategy.
Deposits held by the RFS, CB, TSS and AM lines of business are gen-erally a consistent source of unsecured funding for JPMorgan ChaseBank, N.A. As of December 31, 2007, total deposits for the Firmwere $740.7 billion. A significant portion of the Firm’s deposits areretail deposits, which are less sensitive to interest rate changes andtherefore are considered more stable than market-based wholesaledeposits. The Firm also benefits from stable wholesale liability bal-ances originated by CB, TSS and AM through the normal course ofbusiness. Such liability balances include deposits that are swept toon–balance sheet liabilities (e.g., Commercial paper, Federal fundspurchased and securities sold under repurchase agreements). Theseliability balances are also a stable and consistent source of fundingdue to the nature of the businesses from which they are generated.For further discussions of deposit and liability balance trends, see thediscussion of the results for the Firm’s business segments and theBalance Sheet Analysis on pages 40–58 and 61–62, respectively, ofthis Annual Report.
Additional sources of unsecured funds include a variety of short- andlong-term instruments, including federal funds purchased, commer-cial paper, bank notes, long-term debt and trust preferred capitaldebt securities. Decisions concerning timing of issuance and thetenor of liabilities are based upon relative costs, general market con-ditions, prospective views of balance sheet growth and a targetedliquidity profile.
Funding flexibility is also provided by the Firm’s ability to accesssecured funding from the repurchase and asset securitization mar-kets. The Firm maintains reserves of unencumbered liquid securitiesthat can be financed to generate liquidity. The ability to obtain collat-eralized financing against liquid securities is dependent on prevailingmarket conditions. The ability to securitize loans, and the associatedgains on those securitizations, are principally dependent upon thecredit quality and yields of the assets securitized and are generallynot dependent upon the credit ratings of the issuing entity.Transactions between the Firm and its securitization structures arereflected in JPMorgan Chase’s consolidated financial statements andare discussed in the notes to the consolidated financial statements.These relationships generally include retained interests in securitiza-tion trusts, liquidity facilities and derivative transactions. For furtherdetails, see Off–balance sheet arrangements and contractual cashobligations, Note 16 and Note 31 on pages 66–68, 139–145 and170–173, respectively, of this Annual Report.
Bank subsidiaries’ access to the Federal Reserve Account Window is anadditional source of secured funding; however, management does notview this as a primary means of funding the Firm’s bank subsidiaries.
IssuanceDuring 2007, JPMorgan Chase issued $95.1 billion of long-term debtand trust preferred capital debt securities. These issuances included$52.2 billion of IB structured notes, the issuances of which are gener-ally client-driven and not for funding or capital management purposes,as the proceeds from such transactions are generally used to purchasesecurities to mitigate the risk associated with structured note exposure.The issuances of long-term debt and trust preferred capital debt securi-ties were offset partially by $49.4 billion of long-term debt and trustpreferred capital debt securities that matured or were redeemed during2007, including IB structured notes. The increase in Treasury-issuedlong-term debt and trust preferred capital debt securities was used pri-marily to fund certain illiquid assets held by the Parent company andto build liquidity. During 2007, Commercial paper increased $30.7 bil-lion and Other borrowed funds increased $10.8 billion. The growth inboth Commercial paper and Other borrowed funds was used to buildliquidity further by increasing the amounts held of liquid securities andof overnight investments that may be readily converted to cash. Inaddition, during 2007, the Firm securitized $28.9 billion of residentialmortgage loans, $21.2 billion of credit card loans and $1.2 billion ofeducation loans. The Firm did not securitize any auto loans during2007. For further discussion of loan securitizations, see Note 16 onpages 139–145 of this Annual Report.
In connection with the issuance of certain of its trust preferred capitaldebt securities, the Firm has entered into Replacement CapitalCovenants (“RCCs”) granting certain rights to the holders of “covereddebt,” as defined in the RCCs, that prohibit the repayment, redemptionor purchase of the trust preferred capital debt securities except, withlimited exceptions, to the extent that JPMorgan Chase has receivedspecified amounts of proceeds from the sale of certain qualifying securi-ties. Currently the Firm’s covered debt is its 5.875% Junior SubordinatedDeferrable Interest Debentures, Series O, due in 2035. For more informa-tion regarding these covenants, reference is made to the respectiveRCCs entered into by the Firm in connection with the issuances of suchtrust preferred capital debt securities, which are filed with the U.S.Securities and Exchange Commission under cover of Forms 8-K.
Cash flowsFor the years ended December 31, 2007, 2006 and 2005, Cash anddue from banks decreased $268 million, and increased $3.7 billionand $1.5 billion, respectively. The following discussion highlights themajor activities and transactions that affected JPMorgan Chase’s cashflows during 2007, 2006 and 2005.
Cash Flows from Operating ActivitiesFor the years ended December 31, 2007, 2006 and 2005, net cashused in operating activities was $110.6 billion, $49.6 billion and$30.2 billion, respectively. JPMorgan Chase’s operating assets and lia-bilities support the Firm’s capital markets and lending activities, includ-ing the origination or purchase of loans initially designated as held-for-sale. During each of the three years ended December 31, 2007, netcash was used to fund loans held-for-sale primarily in the IB and RFS.In 2007, there was a significant decline in cash flows from IB loan
MANAGEMENT’S DISCUSSION AND ANALYSISJPMorgan Chase & Co.
72 JPMorgan Chase & Co. / 2007 Annual Report
originations/purchases and sale/securitization activities as a result ofthe difficult wholesale securitization market and capital markets forleveraged financings, which were affected by a significant deteriora-tion in liquidity in the credit markets in the second half of 2007. Cashflows in 2007 associated with RFS residential mortgage activities grewreflecting an increase in originations. The amount and timing of cashflows related to the Firm’s operating activities may vary significantly inthe normal course of business as a result of the level of client-drivenactivities, market conditions and trading strategies. Managementbelieves cash flows from operations, available cash balances and theFirm’s ability to generate cash through short- and long-term borrow-ings will be sufficient to fund the Firm’s operating liquidity needs.
Cash Flows from Investing ActivitiesThe Firm’s investing activities primarily involve AFS securities, loans ini-tially designated as held-for-investment and Federal funds sold andsecurities purchased under resale agreements.
For the year ended December 31, 2007, net cash of $73.1 billion wasused in investing activities, primarily to fund purchases in Treasury’sAFS securities portfolio to manage the Firm’s exposure to interest ratemovements; net additions to the wholesale retained loan portfolios inthe IB, CB and AM, mainly as a result of business growth; a netincrease in the consumer retained loan portfolio, primarily reflectinggrowth in RFS in home equity loans and net additions to RFS’s sub-prime mortgage loans portfolio, which was affected by management’sdecision in the third quarter to retain (rather than sell) new subprimemortgages, and growth in prime mortgage loans originated by RFS andAM (and held in Corporate) that cannot be sold to U.S. governmentagencies or U.S. government-sponsored enterprises; and increases insecurities purchased under resale agreements as a result of a higherlevel of cash available for short-term investment opportunities in con-nection with Treasury’s efforts to build the Firm’s liquidity. These netuses of cash were partially offset by cash proceeds received from salesand maturities of AFS securities; and credit card, residential mortgage,education and wholesale loan sales and securitization activities, whichgrew in 2007 despite the difficult conditions in the credit markets.
For the year ended December 31, 2006, net cash of $99.6 billion wasused in investing activities. Net cash was invested to fund net additionsto the retained wholesale loan portfolio, mainly resulting from capitalmarkets activity in IB leveraged financings; increases in CS loansreflecting strong organic growth; net additions in retail home equityloans; the acquisition of private-label credit card portfolios from Kohl’s,BP and Pier 1 Imports, Inc.; the acquisition of Collegiate FundingServices, and Treasury purchases of AFS securities in connection withrepositioning the portfolio in response to changes in interest rates.These uses of cash were partially offset by cash proceeds providedfrom credit card, residential mortgage, auto and wholesale loan salesand securitization activities; sales and maturities of AFS securities; thenet decline in auto loans and leases, which was caused partially bymanagement’s decision to de-emphasize vehicle leasing; and the saleof the insurance business at the beginning of the second quarter.
For the year ended December 31, 2005, net cash of $12.9 billionwas used in investing activities, primarily attributable to growth inconsumer loans, primarily home equity and in CS, reflecting growthin new account originations and the acquisition of the Sears Canadacredit card business, partially offset by securitization activity and adecline in auto loans reflecting a difficult auto lending market. Netcash was generated by the Treasury investment securities portfolioprimarily from maturities of securities, as purchases and sales ofsecurities essentially offset each other.
Cash Flows from Financing ActivitiesThe Firm’s financing activities primarily reflect transactions involvingcustomer deposits and long-term debt (including client-driven struc-tured notes in the IB), and its common stock and preferred stock.
In 2007, net cash provided by financing activities was $183.0 billiondue to a net increase in wholesale deposits from growth in businessvolumes, in particular, interest-bearing deposits at TSS, AM and CB;net issuances by Treasury of Long-term debt and trust preferred capitaldebt securities primarily to fund certain illiquid assets held by theParent company and to build liquidity and by the IB from client-drivenstructured notes transactions; and growth in Commercial paperissuances and Other borrowed funds in Treasury due to growth in thevolume of liability balances in sweep accounts, in TSS and CB, highershort-term requirements to fund trading positions and to further buildliquidity. Cash was used to repurchase common stock and to pay divi-dends on common stock, including an increase in the quarterly divi-dend in the second quarter of 2007.
In 2006, net cash provided by financing activities was $152.7 billiondue to net cash received from growth in deposits, reflecting new retailaccount acquisitions and the ongoing expansion of the retail branchdistribution network; higher wholesale business volumes; increases insecurities sold under repurchase agreements to fund trading positionsand higher AFS securities positions in Treasury; and net issuances ofLong-term debt and trust preferred capital debt securities. The net cashprovided was offset partially by the payment of cash dividends on stockand common stock repurchases.
In 2005, net cash provided by financing activities was $45.1 billion due to:growth in deposits, reflecting new retail account acquisitions, theongoing expansion of the retail branch distribution network and higherwholesale business volumes; and net new issuances of Long-term debtand trust preferred capital debt securities; offset partially by the pay-ment of cash dividends and common stock repurchases.
JPMorgan Chase & Co. / 2007 Annual Report 73
CREDIT R ISK MANAGEMENT
Credit risk is the risk of loss from obligor or counterparty default. TheFirm provides credit (for example, through loans, lending-related com-mitments and derivatives) to customers of all sizes, from large corpo-rate clients to the individual consumer. The Firm manages therisk/reward relationship of each credit extension and discourages theretention of assets that do not generate a positive return above thecost of the Firm’s risk-adjusted capital. In addition, credit risk man-agement includes the distribution of the Firm’s wholesale syndicatedloan originations into the marketplace (primarily to IB clients), withretained exposure held by the Firm averaging less than 10%.Wholesale loans generated by CB and AM are generally retained onthe balance sheet. With regard to the consumer credit market, theFirm focuses on creating a portfolio that is diversified from both aproduct and a geographic perspective. Within the mortgage business,originated loans are either retained in the mortgage portfolio, orsecuritized and sold selectively to U.S. government agencies and U.S.government-sponsored enterprises.
Credit risk organizationCredit risk management is overseen by the Chief Risk Officer andimplemented within the lines of business. The Firm’s credit risk man-agement governance consists of the following functions:
• establishing a comprehensive credit risk policy framework
• calculating the allowance for credit losses and ensuring appropriatecredit risk-based capital management
• assigning and managing credit authorities in connection with theapproval of all credit exposure
• monitoring and managing credit risk across all portfolio segments
• managing criticized exposures
Risk identificationThe Firm is exposed to credit risk through lending and capital marketsactivities. Credit risk management works in partnership with the busi-ness segments in identifying and aggregating exposures across alllines of business.
Risk measurementTo measure credit risk, the Firm employs several methodologies forestimating the likelihood of obligor or counterparty default. Lossesgenerated by consumer loans are more predictable than wholesalelosses, but are subject to cyclical and seasonal factors. Although thefrequency of loss is higher on consumer loans than on wholesaleloans, the severity of loss is typically lower and more manageable ona portfolio basis. As a result of these differences, methodologies formeasuring credit risk vary depending on several factors, includingtype of asset (e.g., consumer installment versus wholesale loan), riskmeasurement parameters (e.g., delinquency status and credit bureauscore versus wholesale risk rating) and risk management and collec-tion processes (e.g., retail collection center versus centrally managedworkout groups). Credit risk measurement is based upon the amountof exposure should the obligor or the counterparty default, the proba-
On February 14, 2007, S&P raised the senior long-term debt ratings onJPMorgan Chase & Co. and the principal bank subsidiaries to “AA-”and “AA”, respectively, from “A+” and “AA-”, respectively. S&P alsoraised the short-term debt rating of JPMorgan Chase & Co. to “A-1+”from “A-1”. On February 16, 2007, Fitch raised the senior long-termdebt ratings on JPMorgan Chase & Co. and the principal bank sub-sidiaries to “AA-” from “A+”. Fitch also raised the short-term debt rat-ing of JPMorgan Chase & Co. to “F1+” from “F1”. On March 2,2007, Moody’s raised the senior long-term debt ratings on JPMorganChase & Co. and the operating bank subsidiaries to “Aa2” and “Aaa”,respectively, from “Aa3” and “Aa2”, respectively.
The cost and availability of unsecured financing are influenced by creditratings. A reduction in these ratings could have an adverse effect on theFirm’s access to liquidity sources, increase the cost of funds, triggeradditional collateral requirements and decrease the number of investorsand counterparties willing to lend. Key factors in maintaining high credit
ratings include a stable and diverse earnings stream, leading marketpositions, strong capital ratios, strong credit quality and risk manage-ment controls, diverse funding sources and disciplined liquidity monitor-ing procedures.
If the Firm’s ratings were downgraded by one notch, the Firm esti-mates the incremental cost of funds and the potential loss of fundingto be negligible. Additionally, the Firm estimates the additional fund-ing requirements for VIEs and other third-party commitments wouldnot be material. Currently, the Firm believes a downgrade is unlikely.For additional information on the impact of a credit ratings down-grade on the funding requirements for VIEs, and on derivatives andcollateral agreements, see Special-purpose entities on pages 66–67and Ratings profile of derivative receivables mark-to-market(“MTM”) on page 81, of this Annual Report.
Credit ratings The credit ratings of JPMorgan Chase’s parent holding company and each of its significant banking subsidiaries as of December 31, 2007, were asfollows.
Short-term debt Senior long-term debt
Moody’s S&P Fitch Moody’s S&P Fitch
JPMorgan Chase & Co. P-1 A-1+ F1+ Aa2 AA- AA-JPMorgan Chase Bank, N.A. P-1 A-1+ F1+ Aaa AA AA-Chase Bank USA, N.A. P-1 A-1+ F1+ Aaa AA AA-
MANAGEMENT’S DISCUSSION AND ANALYSISJPMorgan Chase & Co.
74 JPMorgan Chase & Co. / 2007 Annual Report
bility of default and the loss severity given a default event. Basedupon these factors and related market-based inputs, the Firm esti-mates both probable and unexpected losses for the wholesale andconsumer portfolios. Probable losses, reflected in the Provision forcredit losses, primarily are based upon statistical estimates of creditlosses as a result of obligor or counterparty default. However, proba-ble losses are not the sole indicators of risk. If losses were entirelypredictable, the probable loss rate could be factored into pricing andcovered as a normal and recurring cost of doing business. Unexpectedlosses, reflected in the allocation of credit risk capital, represent thepotential volatility of actual losses relative to the probable level oflosses. Risk measurement for the wholesale portfolio is assessed pri-marily on a risk-rated basis; for the consumer portfolio, it is assessedprimarily on a credit-scored basis.
Risk-rated exposureFor portfolios that are risk-rated (generally held in IB, CB, TSS andAM), probable and unexpected loss calculations are based upon esti-mates of probability of default and loss given default. Probability ofdefault is the expected default calculated on an obligor basis. Lossgiven default is an estimate of losses that are based upon collateraland structural support for each credit facility. Calculations andassumptions are based upon management information systems andmethodologies which are under continual review. Risk ratings areassigned and reviewed on an ongoing basis by Credit RiskManagement and revised, if needed, to reflect the borrowers’ currentrisk profiles and the related collateral and structural positions.
Credit-scored exposureFor credit-scored portfolios (generally held in RFS and CS), probableloss is based upon a statistical analysis of inherent losses over dis-crete periods of time. Probable losses are estimated using sophisticat-ed portfolio modeling, credit scoring and decision-support tools toproject credit risks and establish underwriting standards. In addition,common measures of credit quality derived from historical loss experi-ence are used to predict consumer losses. Other risk characteristicsevaluated include recent loss experience in the portfolios, changes inorigination sources, portfolio seasoning, loss severity and underlyingcredit practices, including charge-off policies. These analyses areapplied to the Firm’s current portfolios in order to estimate delinquen-cies and severity of losses, which determine the amount of probablelosses. These factors and analyses are updated on a quarterly basis.
Risk monitoringThe Firm has developed policies and practices that are designed topreserve the independence and integrity of extending credit and areincluded to ensure credit risks are assessed accurately, approvedproperly, monitored regularly and managed actively at both the trans-action and portfolio levels. The policy framework establishes creditapproval authorities, concentration limits, risk-rating methodologies,portfolio review parameters and guidelines for management of dis-tressed exposure. Wholesale credit risk is monitored regularly on bothan aggregate portfolio level and on an individual customer basis. Forconsumer credit risk, the key focus items are trends and concentra-tions at the portfolio level, where potential problems can be remediedthrough changes in underwriting policies and portfolio guidelines.Consumer Credit Risk Management monitors trends against businessexpectations and industry benchmarks.
In order to meet credit risk management objectives, the Firm seeks tomaintain a risk profile that is diverse in terms of borrower, producttype, industry and geographic concentration. Management of theFirm’s wholesale exposure is accomplished through loan syndicationand participations, loan sales, securitizations, credit derivatives, use ofmaster netting agreements and collateral and other risk-reductiontechniques, which are further discussed in the following risk sections.
Risk reportingTo enable monitoring of credit risk and decision-making, aggregatecredit exposure, credit metric forecasts, hold-limit exceptions and riskprofile changes are reported regularly to senior credit risk manage-ment. Detailed portfolio reporting of industry, customer and geo-graphic concentrations occurs monthly, and the appropriateness ofthe allowance for credit losses is reviewed by senior management atleast on a quarterly basis. Through the risk reporting and governancestructure, credit risk trends and limit exceptions are provided regularlyto, and discussed with, senior management, as mentioned on page69 of this Annual Report.
2007 Credit risk overviewDespite the volatile capital markets environment in the second half of2007, the wholesale portfolio overall experienced continued low levelsof nonperforming loans and criticized assets. However, in the secondhalf of 2007, credit market liquidity levels declined significantly, whichnegatively affected loan syndication markets, resulting in an increasein funded and unfunded exposures, particularly related to leveragedlending, held on the balance sheet. This exposure is diversified acrossclients and industries and is performing, but subject to market volatilityand potentially further writedowns. In response to these events, theFirm has strengthened underwriting standards with respect to its loansyndications and leveraged lending, consistent with evolving marketpractice. For additional information on unfunded leverage acquisitionsrelated to loan syndications, see Note 31 on pages 170–173 of thisAnnual Report.
In 2007, the domestic consumer credit environment was also nega-tively affected by the deterioration in residential real estate valua-tions, leading to increased credit losses primarily for Home Equity andSubprime Mortgage loans with multiple risk elements (“risk layeredloans”). The Firm responded to these changes in the credit environ-ment through the elimination of certain products, changes andenhancements to credit underwriting criteria and refinement of pric-ing and risk management models.
More detailed discussion of the domestic consumer credit environ-ment can be found on page 84 of this Annual Report.
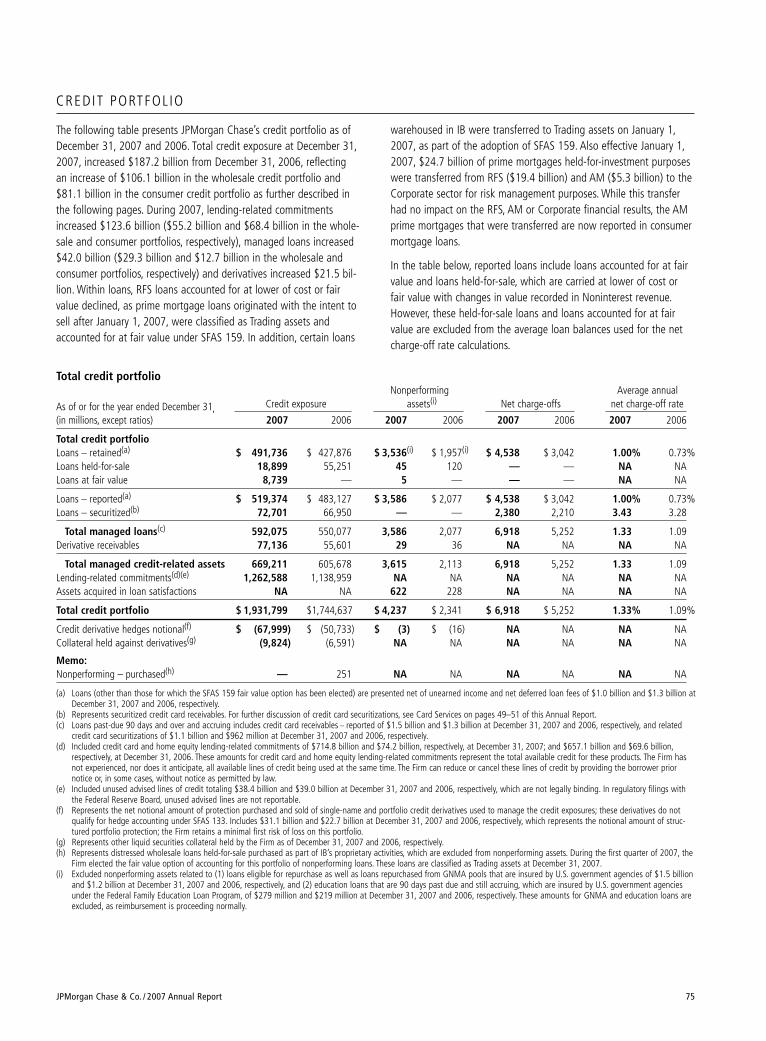
JPMorgan Chase & Co. / 2007 Annual Report 75
CREDIT PORTFOL IO
Total credit portfolioNonperforming Average annual
As of or for the year ended December 31, Credit exposure assets(i) Net charge-offs net charge-off rate
(in millions, except ratios) 2007 2006 2007 2006 2007 2006 2007 2006
Total credit portfolioLoans – retained(a) $ 491,736 $ 427,876 $ 3,536(i) $ 1,957(i) $ 4,538 $ 3,042 1.00% 0.73%Loans held-for-sale 18,899 55,251 45 120 — — NA NALoans at fair value 8,739 — 5 — — — NA NA
Loans – reported(a) $ 519,374 $ 483,127 $ 3,586 $ 2,077 $ 4,538 $ 3,042 1.00% 0.73%Loans – securitized(b) 72,701 66,950 — — 2,380 2,210 3.43 3.28
Total managed loans(c) 592,075 550,077 3,586 2,077 6,918 5,252 1.33 1.09Derivative receivables 77,136 55,601 29 36 NA NA NA NA
Total managed credit-related assets 669,211 605,678 3,615 2,113 6,918 5,252 1.33 1.09Lending-related commitments(d)(e) 1,262,588 1,138,959 NA NA NA NA NA NAAssets acquired in loan satisfactions NA NA 622 228 NA NA NA NA
Total credit portfolio $ 1,931,799 $1,744,637 $ 4,237 $ 2,341 $ 6,918 $ 5,252 1.33% 1.09%
Credit derivative hedges notional(f) $ (67,999) $ (50,733) $ (3) $ (16) NA NA NA NACollateral held against derivatives(g) (9,824) (6,591) NA NA NA NA NA NA
Memo:Nonperforming – purchased(h) — 251 NA NA NA NA NA NA
(a) Loans (other than those for which the SFAS 159 fair value option has been elected) are presented net of unearned income and net deferred loan fees of $1.0 billion and $1.3 billion atDecember 31, 2007 and 2006, respectively.
(b) Represents securitized credit card receivables. For further discussion of credit card securitizations, see Card Services on pages 49–51 of this Annual Report.(c) Loans past-due 90 days and over and accruing includes credit card receivables _ reported of $1.5 billion and $1.3 billion at December 31, 2007 and 2006, respectively, and related
credit card securitizations of $1.1 billion and $962 million at December 31, 2007 and 2006, respectively.(d) Included credit card and home equity lending-related commitments of $714.8 billion and $74.2 billion, respectively, at December 31, 2007; and $657.1 billion and $69.6 billion,
respectively, at December 31, 2006. These amounts for credit card and home equity lending-related commitments represent the total available credit for these products. The Firm hasnot experienced, nor does it anticipate, all available lines of credit being used at the same time. The Firm can reduce or cancel these lines of credit by providing the borrower priornotice or, in some cases, without notice as permitted by law.
(e) Included unused advised lines of credit totaling $38.4 billion and $39.0 billion at December 31, 2007 and 2006, respectively, which are not legally binding. In regulatory filings withthe Federal Reserve Board, unused advised lines are not reportable.
(f) Represents the net notional amount of protection purchased and sold of single-name and portfolio credit derivatives used to manage the credit exposures; these derivatives do notqualify for hedge accounting under SFAS 133. Includes $31.1 billion and $22.7 billion at December 31, 2007 and 2006, respectively, which represents the notional amount of struc-tured portfolio protection; the Firm retains a minimal first risk of loss on this portfolio.
(g) Represents other liquid securities collateral held by the Firm as of December 31, 2007 and 2006, respectively.(h) Represents distressed wholesale loans held-for-sale purchased as part of IB’s proprietary activities, which are excluded from nonperforming assets. During the first quarter of 2007, the
Firm elected the fair value option of accounting for this portfolio of nonperforming loans. These loans are classified as Trading assets at December 31, 2007.(i) Excluded nonperforming assets related to (1) loans eligible for repurchase as well as loans repurchased from GNMA pools that are insured by U.S. government agencies of $1.5 billion
and $1.2 billion at December 31, 2007 and 2006, respectively, and (2) education loans that are 90 days past due and still accruing, which are insured by U.S. government agenciesunder the Federal Family Education Loan Program, of $279 million and $219 million at December 31, 2007 and 2006, respectively. These amounts for GNMA and education loans areexcluded, as reimbursement is proceeding normally.
The following table presents JPMorgan Chase’s credit portfolio as ofDecember 31, 2007 and 2006. Total credit exposure at December 31,2007, increased $187.2 billion from December 31, 2006, reflectingan increase of $106.1 billion in the wholesale credit portfolio and$81.1 billion in the consumer credit portfolio as further described inthe following pages. During 2007, lending-related commitmentsincreased $123.6 billion ($55.2 billion and $68.4 billion in the whole-sale and consumer portfolios, respectively), managed loans increased$42.0 billion ($29.3 billion and $12.7 billion in the wholesale andconsumer portfolios, respectively) and derivatives increased $21.5 bil-lion. Within loans, RFS loans accounted for at lower of cost or fairvalue declined, as prime mortgage loans originated with the intent tosell after January 1, 2007, were classified as Trading assets andaccounted for at fair value under SFAS 159. In addition, certain loans
warehoused in IB were transferred to Trading assets on January 1,2007, as part of the adoption of SFAS 159. Also effective January 1,2007, $24.7 billion of prime mortgages held-for-investment purposeswere transferred from RFS ($19.4 billion) and AM ($5.3 billion) to theCorporate sector for risk management purposes. While this transferhad no impact on the RFS, AM or Corporate financial results, the AMprime mortgages that were transferred are now reported in consumermortgage loans.
In the table below, reported loans include loans accounted for at fairvalue and loans held-for-sale, which are carried at lower of cost orfair value with changes in value recorded in Noninterest revenue.However, these held-for-sale loans and loans accounted for at fairvalue are excluded from the average loan balances used for the netcharge-off rate calculations.
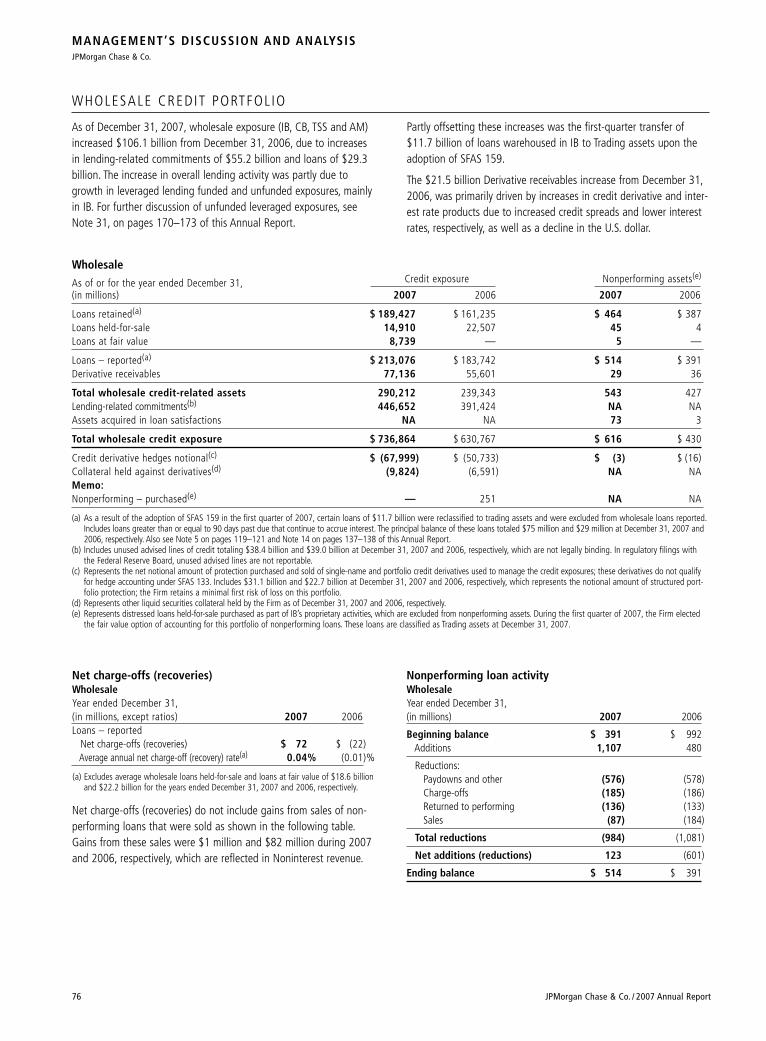
MANAGEMENT’S DISCUSSION AND ANALYSISJPMorgan Chase & Co.
76 JPMorgan Chase & Co. / 2007 Annual Report
WHOLESALE CREDIT PORTFOL IO
As of December 31, 2007, wholesale exposure (IB, CB, TSS and AM)increased $106.1 billion from December 31, 2006, due to increasesin lending-related commitments of $55.2 billion and loans of $29.3billion. The increase in overall lending activity was partly due togrowth in leveraged lending funded and unfunded exposures, mainlyin IB. For further discussion of unfunded leveraged exposures, seeNote 31, on pages 170–173 of this Annual Report.
Wholesale
As of or for the year ended December 31, Credit exposure Nonperforming assets(e)
(in millions) 2007 2006 2007 2006
Loans retained(a) $ 189,427 $ 161,235 $ 464 $ 387Loans held-for-sale 14,910 22,507 45 4Loans at fair value 8,739 — 5 —
Loans – reported(a) $ 213,076 $ 183,742 $ 514 $ 391Derivative receivables 77,136 55,601 29 36
Total wholesale credit-related assets 290,212 239,343 543 427Lending-related commitments(b) 446,652 391,424 NA NAAssets acquired in loan satisfactions NA NA 73 3
Total wholesale credit exposure $ 736,864 $ 630,767 $ 616 $ 430
Credit derivative hedges notional(c) $ (67,999) $ (50,733) $ (3) $ (16)Collateral held against derivatives(d) (9,824) (6,591) NA NAMemo:Nonperforming – purchased(e) — 251 NA NA
(a) As a result of the adoption of SFAS 159 in the first quarter of 2007, certain loans of $11.7 billion were reclassified to trading assets and were excluded from wholesale loans reported.Includes loans greater than or equal to 90 days past due that continue to accrue interest. The principal balance of these loans totaled $75 million and $29 million at December 31, 2007 and2006, respectively. Also see Note 5 on pages 119–121 and Note 14 on pages 137–138 of this Annual Report.
(b) Includes unused advised lines of credit totaling $38.4 billion and $39.0 billion at December 31, 2007 and 2006, respectively, which are not legally binding. In regulatory filings withthe Federal Reserve Board, unused advised lines are not reportable.
(c) Represents the net notional amount of protection purchased and sold of single-name and portfolio credit derivatives used to manage the credit exposures; these derivatives do not qualifyfor hedge accounting under SFAS 133. Includes $31.1 billion and $22.7 billion at December 31, 2007 and 2006, respectively, which represents the notional amount of structured port-folio protection; the Firm retains a minimal first risk of loss on this portfolio.
(d) Represents other liquid securities collateral held by the Firm as of December 31, 2007 and 2006, respectively.(e) Represents distressed loans held-for-sale purchased as part of IB’s proprietary activities, which are excluded from nonperforming assets. During the first quarter of 2007, the Firm elected
the fair value option of accounting for this portfolio of nonperforming loans. These loans are classified as Trading assets at December 31, 2007.
Partly offsetting these increases was the first-quarter transfer of$11.7 billion of loans warehoused in IB to Trading assets upon theadoption of SFAS 159.
The $21.5 billion Derivative receivables increase from December 31,2006, was primarily driven by increases in credit derivative and inter-est rate products due to increased credit spreads and lower interestrates, respectively, as well as a decline in the U.S. dollar.
Net charge-offs (recoveries) WholesaleYear ended December 31,(in millions, except ratios) 2007 2006Loans – reported
Net charge-offs (recoveries) $ 72 $ (22)Average annual net charge-off (recovery) rate(a) 0.04% (0.01)%
(a) Excludes average wholesale loans held-for-sale and loans at fair value of $18.6 billionand $22.2 billion for the years ended December 31, 2007 and 2006, respectively.
Net charge-offs (recoveries) do not include gains from sales of non-performing loans that were sold as shown in the following table.Gains from these sales were $1 million and $82 million during 2007and 2006, respectively, which are reflected in Noninterest revenue.
Nonperforming loan activityWholesaleYear ended December 31,(in millions) 2007 2006
Beginning balance $ 391 $ 992Additions 1,107 480
Reductions:Paydowns and other (576) (578)Charge-offs (185) (186)Returned to performing (136) (133)Sales (87) (184)
Total reductions (984) (1,081)
Net additions (reductions) 123 (601)
Ending balance $ 514 $ 391
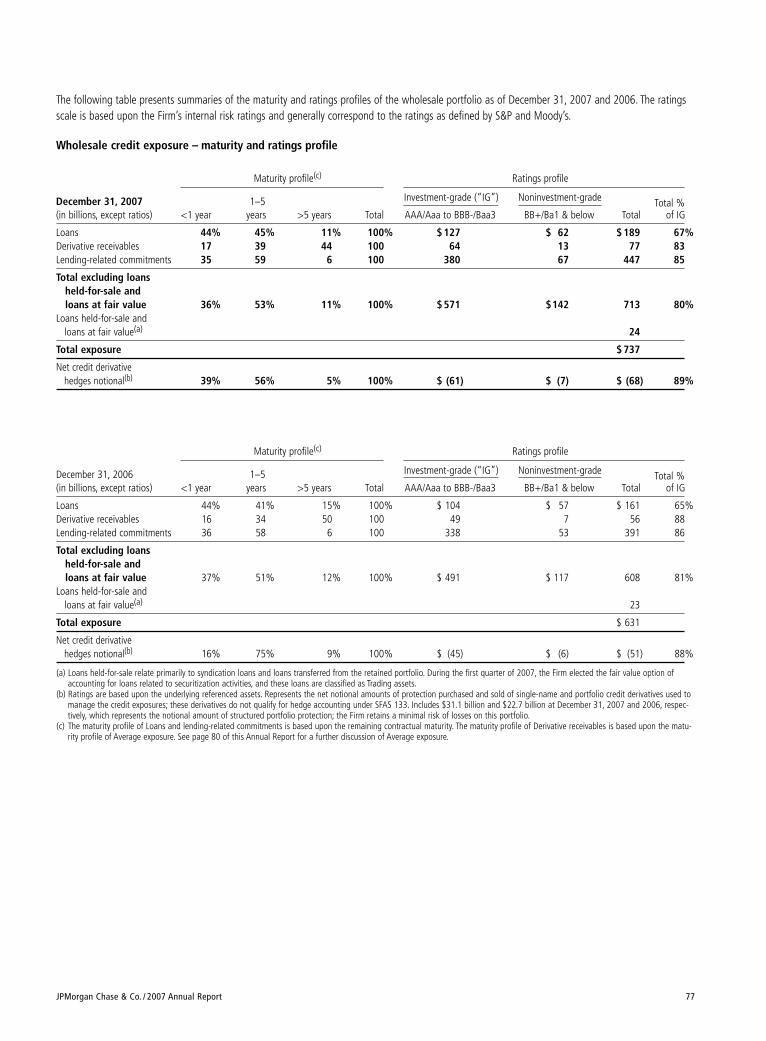
JPMorgan Chase & Co. / 2007 Annual Report 77
The following table presents summaries of the maturity and ratings profiles of the wholesale portfolio as of December 31, 2007 and 2006. The ratingsscale is based upon the Firm’s internal risk ratings and generally correspond to the ratings as defined by S&P and Moody’s.
Wholesale credit exposure – maturity and ratings profile
Maturity profile(c) Ratings profile
December 31, 2007 1–5 Investment-grade (“IG”) Noninvestment-grade Total %(in billions, except ratios) <1 year years >5 years Total AAA/Aaa to BBB-/Baa3 BB+/Ba1 & below Total of IG
Loans 44% 45% 11% 100% $ 127 $ 62 $ 189 67%Derivative receivables 17 39 44 100 64 13 77 83Lending-related commitments 35 59 6 100 380 67 447 85
Total excluding loans held-for-sale andloans at fair value 36% 53% 11% 100% $ 571 $142 713 80%
Loans held-for-sale and loans at fair value(a) 24
Total exposure $ 737
Net credit derivative hedges notional(b) 39% 56% 5% 100% $ (61) $ (7) $ (68) 89%
Maturity profile(c) Ratings profile
December 31, 2006 1–5 Investment-grade (“IG”) Noninvestment-grade Total %(in billions, except ratios) <1 year years >5 years Total AAA/Aaa to BBB-/Baa3 BB+/Ba1 & below Total of IG
Loans 44% 41% 15% 100% $ 104 $ 57 $ 161 65%Derivative receivables 16 34 50 100 49 7 56 88Lending-related commitments 36 58 6 100 338 53 391 86
Total excluding loans held-for-sale and loans at fair value 37% 51% 12% 100% $ 491 $ 117 608 81%
Loans held-for-sale and loans at fair value(a) 23
Total exposure $ 631
Net credit derivative hedges notional(b) 16% 75% 9% 100% $ (45) $ (6) $ (51) 88%
(a) Loans held-for-sale relate primarily to syndication loans and loans transferred from the retained portfolio. During the first quarter of 2007, the Firm elected the fair value option ofaccounting for loans related to securitization activities, and these loans are classified as Trading assets.
(b) Ratings are based upon the underlying referenced assets. Represents the net notional amounts of protection purchased and sold of single-name and portfolio credit derivatives used tomanage the credit exposures; these derivatives do not qualify for hedge accounting under SFAS 133. Includes $31.1 billion and $22.7 billion at December 31, 2007 and 2006, respec-tively, which represents the notional amount of structured portfolio protection; the Firm retains a minimal risk of losses on this portfolio.
(c) The maturity profile of Loans and lending-related commitments is based upon the remaining contractual maturity. The maturity profile of Derivative receivables is based upon the matu-rity profile of Average exposure. See page 80 of this Annual Report for a further discussion of Average exposure.
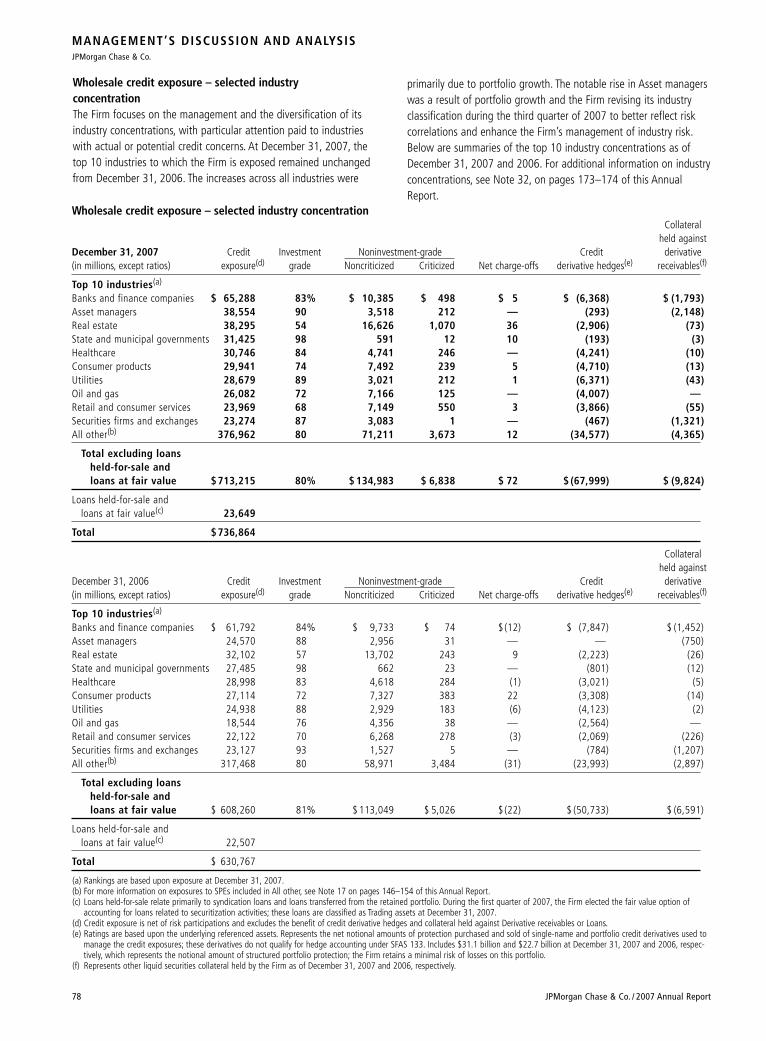
Wholesale credit exposure – selected industry concentrationCollateral
held againstDecember 31, 2007 Credit Investment Noninvestment-grade Credit derivative(in millions, except ratios) exposure(d) grade Noncriticized Criticized Net charge-offs derivative hedges(e) receivables(f)
Top 10 industries(a)
Banks and finance companies $ 65,288 83% $ 10,385 $ 498 $ 5 $ (6,368) $ (1,793)Asset managers 38,554 90 3,518 212 — (293) (2,148)Real estate 38,295 54 16,626 1,070 36 (2,906) (73)State and municipal governments 31,425 98 591 12 10 (193) (3)Healthcare 30,746 84 4,741 246 — (4,241) (10)Consumer products 29,941 74 7,492 239 5 (4,710) (13)Utilities 28,679 89 3,021 212 1 (6,371) (43)Oil and gas 26,082 72 7,166 125 — (4,007) —Retail and consumer services 23,969 68 7,149 550 3 (3,866) (55)Securities firms and exchanges 23,274 87 3,083 1 — (467) (1,321)All other(b) 376,962 80 71,211 3,673 12 (34,577) (4,365)
Total excluding loansheld-for-sale andloans at fair value $713,215 80% $ 134,983 $ 6,838 $ 72 $ (67,999) $ (9,824)
Loans held-for-sale and loans at fair value(c) 23,649
Total $736,864
Collateralheld against
December 31, 2006 Credit Investment Noninvestment-grade Credit derivative(in millions, except ratios) exposure(d) grade Noncriticized Criticized Net charge-offs derivative hedges(e) receivables(f)
Top 10 industries(a)
Banks and finance companies $ 61,792 84% $ 9,733 $ 74 $(12) $ (7,847) $ (1,452)Asset managers 24,570 88 2,956 31 — — (750)Real estate 32,102 57 13,702 243 9 (2,223) (26)State and municipal governments 27,485 98 662 23 — (801) (12)Healthcare 28,998 83 4,618 284 (1) (3,021) (5)Consumer products 27,114 72 7,327 383 22 (3,308) (14)Utilities 24,938 88 2,929 183 (6) (4,123) (2)Oil and gas 18,544 76 4,356 38 — (2,564) —Retail and consumer services 22,122 70 6,268 278 (3) (2,069) (226)Securities firms and exchanges 23,127 93 1,527 5 — (784) (1,207)All other(b) 317,468 80 58,971 3,484 (31) (23,993) (2,897)
Total excluding loansheld-for-sale andloans at fair value $ 608,260 81% $ 113,049 $ 5,026 $(22) $ (50,733) $ (6,591)
Loans held-for-sale and loans at fair value(c) 22,507
Total $ 630,767
(a) Rankings are based upon exposure at December 31, 2007.(b) For more information on exposures to SPEs included in All other, see Note 17 on pages 146–154 of this Annual Report.(c) Loans held-for-sale relate primarily to syndication loans and loans transferred from the retained portfolio. During the first quarter of 2007, the Firm elected the fair value option of
accounting for loans related to securitization activities; these loans are classified as Trading assets at December 31, 2007.(d) Credit exposure is net of risk participations and excludes the benefit of credit derivative hedges and collateral held against Derivative receivables or Loans.(e) Ratings are based upon the underlying referenced assets. Represents the net notional amounts of protection purchased and sold of single-name and portfolio credit derivatives used to
manage the credit exposures; these derivatives do not qualify for hedge accounting under SFAS 133. Includes $31.1 billion and $22.7 billion at December 31, 2007 and 2006, respec-tively, which represents the notional amount of structured portfolio protection; the Firm retains a minimal risk of losses on this portfolio.
(f) Represents other liquid securities collateral held by the Firm as of December 31, 2007 and 2006, respectively.
MANAGEMENT’S DISCUSSION AND ANALYSISJPMorgan Chase & Co.
78 JPMorgan Chase & Co. / 2007 Annual Report
Wholesale credit exposure – selected industry concentrationThe Firm focuses on the management and the diversification of itsindustry concentrations, with particular attention paid to industrieswith actual or potential credit concerns. At December 31, 2007, thetop 10 industries to which the Firm is exposed remained unchangedfrom December 31, 2006. The increases across all industries were
primarily due to portfolio growth. The notable rise in Asset managerswas a result of portfolio growth and the Firm revising its industryclassification during the third quarter of 2007 to better reflect riskcorrelations and enhance the Firm’s management of industry risk.Below are summaries of the top 10 industry concentrations as ofDecember 31, 2007 and 2006. For additional information on industryconcentrations, see Note 32, on pages 173–174 of this AnnualReport.
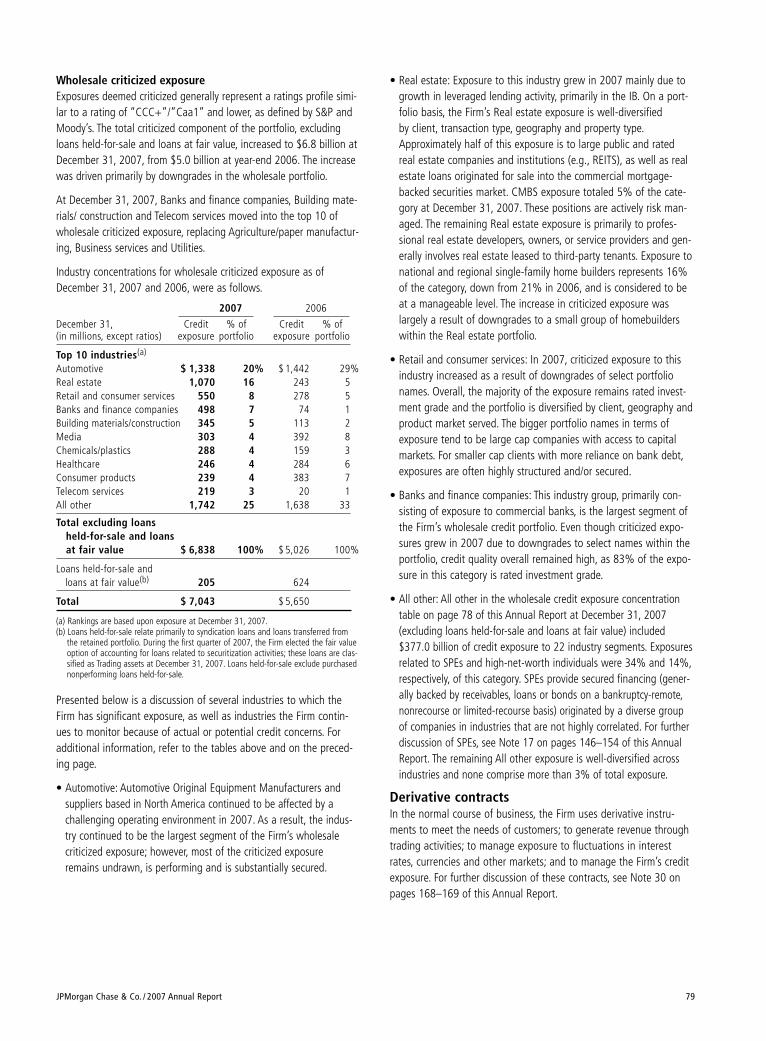
JPMorgan Chase & Co. / 2007 Annual Report 79
• Real estate: Exposure to this industry grew in 2007 mainly due togrowth in leveraged lending activity, primarily in the IB. On a port-folio basis, the Firm’s Real estate exposure is well-diversified by client, transaction type, geography and property type.Approximately half of this exposure is to large public and ratedreal estate companies and institutions (e.g., REITS), as well as realestate loans originated for sale into the commercial mortgage-backed securities market. CMBS exposure totaled 5% of the cate-gory at December 31, 2007. These positions are actively risk man-aged. The remaining Real estate exposure is primarily to profes-sional real estate developers, owners, or service providers and gen-erally involves real estate leased to third-party tenants. Exposure tonational and regional single-family home builders represents 16%of the category, down from 21% in 2006, and is considered to beat a manageable level. The increase in criticized exposure waslargely a result of downgrades to a small group of homebuilderswithin the Real estate portfolio.
• Retail and consumer services: In 2007, criticized exposure to thisindustry increased as a result of downgrades of select portfolionames. Overall, the majority of the exposure remains rated invest-ment grade and the portfolio is diversified by client, geography andproduct market served. The bigger portfolio names in terms ofexposure tend to be large cap companies with access to capitalmarkets. For smaller cap clients with more reliance on bank debt,exposures are often highly structured and/or secured.
• Banks and finance companies: This industry group, primarily con-sisting of exposure to commercial banks, is the largest segment ofthe Firm’s wholesale credit portfolio. Even though criticized expo-sures grew in 2007 due to downgrades to select names within theportfolio, credit quality overall remained high, as 83% of the expo-sure in this category is rated investment grade.
• All other: All other in the wholesale credit exposure concentrationtable on page 78 of this Annual Report at December 31, 2007(excluding loans held-for-sale and loans at fair value) included$377.0 billion of credit exposure to 22 industry segments. Exposuresrelated to SPEs and high-net-worth individuals were 34% and 14%,respectively, of this category. SPEs provide secured financing (gener-ally backed by receivables, loans or bonds on a bankruptcy-remote,nonrecourse or limited-recourse basis) originated by a diverse groupof companies in industries that are not highly correlated. For furtherdiscussion of SPEs, see Note 17 on pages 146–154 of this AnnualReport. The remaining All other exposure is well-diversified acrossindustries and none comprise more than 3% of total exposure.
Derivative contractsIn the normal course of business, the Firm uses derivative instru-ments to meet the needs of customers; to generate revenue throughtrading activities; to manage exposure to fluctuations in interestrates, currencies and other markets; and to manage the Firm’s creditexposure. For further discussion of these contracts, see Note 30 onpages 168–169 of this Annual Report.
Wholesale criticized exposureExposures deemed criticized generally represent a ratings profile simi-lar to a rating of “CCC+”/”Caa1” and lower, as defined by S&P andMoody’s. The total criticized component of the portfolio, excludingloans held-for-sale and loans at fair value, increased to $6.8 billion atDecember 31, 2007, from $5.0 billion at year-end 2006. The increasewas driven primarily by downgrades in the wholesale portfolio.
At December 31, 2007, Banks and finance companies, Building mate-rials/ construction and Telecom services moved into the top 10 ofwholesale criticized exposure, replacing Agriculture/paper manufactur-ing, Business services and Utilities.
Industry concentrations for wholesale criticized exposure as ofDecember 31, 2007 and 2006, were as follows.
2007 2006
December 31, Credit % of Credit % of(in millions, except ratios) exposure portfolio exposure portfolio
Top 10 industries(a)
Automotive $ 1,338 20% $ 1,442 29%Real estate 1,070 16 243 5Retail and consumer services 550 8 278 5Banks and finance companies 498 7 74 1Building materials/construction 345 5 113 2Media 303 4 392 8Chemicals/plastics 288 4 159 3Healthcare 246 4 284 6Consumer products 239 4 383 7Telecom services 219 3 20 1All other 1,742 25 1,638 33
Total excluding loansheld-for-sale and loansat fair value $ 6,838 100% $ 5,026 100%
Loans held-for-sale and loans at fair value(b) 205 624
Total $ 7,043 $ 5,650
(a) Rankings are based upon exposure at December 31, 2007.(b) Loans held-for-sale relate primarily to syndication loans and loans transferred from
the retained portfolio. During the first quarter of 2007, the Firm elected the fair valueoption of accounting for loans related to securitization activities; these loans are clas-sified as Trading assets at December 31, 2007. Loans held-for-sale exclude purchasednonperforming loans held-for-sale.
Presented below is a discussion of several industries to which theFirm has significant exposure, as well as industries the Firm contin-ues to monitor because of actual or potential credit concerns. Foradditional information, refer to the tables above and on the preced-ing page.
• Automotive: Automotive Original Equipment Manufacturers andsuppliers based in North America continued to be affected by a challenging operating environment in 2007. As a result, the indus-try continued to be the largest segment of the Firm’s wholesale criticized exposure; however, most of the criticized exposureremains undrawn, is performing and is substantially secured.
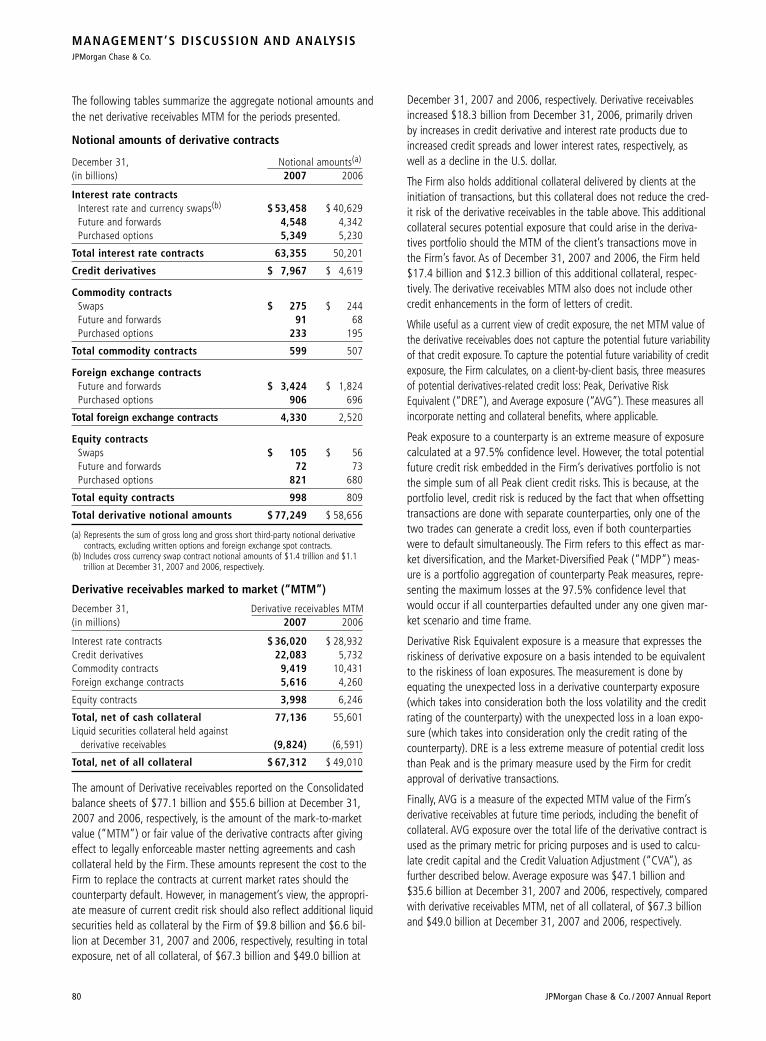
MANAGEMENT’S DISCUSSION AND ANALYSISJPMorgan Chase & Co.
80 JPMorgan Chase & Co. / 2007 Annual Report
The following tables summarize the aggregate notional amounts andthe net derivative receivables MTM for the periods presented.
Notional amounts of derivative contracts
December 31, Notional amounts(a)
(in billions) 2007 2006
Interest rate contractsInterest rate and currency swaps(b) $ 53,458 $ 40,629Future and forwards 4,548 4,342Purchased options 5,349 5,230
Total interest rate contracts 63,355 50,201
Credit derivatives $ 7,967 $ 4,619
Commodity contractsSwaps $ 275 $ 244Future and forwards 91 68Purchased options 233 195
Total commodity contracts 599 507
Foreign exchange contractsFuture and forwards $ 3,424 $ 1,824Purchased options 906 696
Total foreign exchange contracts 4,330 2,520
Equity contractsSwaps $ 105 $ 56Future and forwards 72 73Purchased options 821 680
Total equity contracts 998 809
Total derivative notional amounts $ 77,249 $ 58,656
(a) Represents the sum of gross long and gross short third-party notional derivative contracts, excluding written options and foreign exchange spot contracts.
(b) Includes cross currency swap contract notional amounts of $1.4 trillion and $1.1 trillion at December 31, 2007 and 2006, respectively.
Derivative receivables marked to market (“MTM”)
December 31, Derivative receivables MTM(in millions) 2007 2006
Interest rate contracts $ 36,020 $ 28,932Credit derivatives 22,083 5,732Commodity contracts 9,419 10,431Foreign exchange contracts 5,616 4,260
Equity contracts 3,998 6,246
Total, net of cash collateral 77,136 55,601Liquid securities collateral held against
derivative receivables (9,824) (6,591)
Total, net of all collateral $ 67,312 $ 49,010
The amount of Derivative receivables reported on the Consolidatedbalance sheets of $77.1 billion and $55.6 billion at December 31,2007 and 2006, respectively, is the amount of the mark-to-marketvalue (“MTM”) or fair value of the derivative contracts after givingeffect to legally enforceable master netting agreements and cash collateral held by the Firm. These amounts represent the cost to theFirm to replace the contracts at current market rates should thecounterparty default. However, in management’s view, the appropri-ate measure of current credit risk should also reflect additional liquidsecurities held as collateral by the Firm of $9.8 billion and $6.6 bil-lion at December 31, 2007 and 2006, respectively, resulting in totalexposure, net of all collateral, of $67.3 billion and $49.0 billion at
December 31, 2007 and 2006, respectively. Derivative receivablesincreased $18.3 billion from December 31, 2006, primarily driven by increases in credit derivative and interest rate products due toincreased credit spreads and lower interest rates, respectively, as well as a decline in the U.S. dollar.
The Firm also holds additional collateral delivered by clients at theinitiation of transactions, but this collateral does not reduce the cred-it risk of the derivative receivables in the table above. This additionalcollateral secures potential exposure that could arise in the deriva-tives portfolio should the MTM of the client’s transactions move inthe Firm’s favor. As of December 31, 2007 and 2006, the Firm held$17.4 billion and $12.3 billion of this additional collateral, respec-tively. The derivative receivables MTM also does not include othercredit enhancements in the form of letters of credit.
While useful as a current view of credit exposure, the net MTM value ofthe derivative receivables does not capture the potential future variabilityof that credit exposure. To capture the potential future variability of creditexposure, the Firm calculates, on a client-by-client basis, three measuresof potential derivatives-related credit loss: Peak, Derivative RiskEquivalent (“DRE”), and Average exposure (“AVG”). These measures allincorporate netting and collateral benefits, where applicable.
Peak exposure to a counterparty is an extreme measure of exposurecalculated at a 97.5% confidence level. However, the total potentialfuture credit risk embedded in the Firm’s derivatives portfolio is notthe simple sum of all Peak client credit risks. This is because, at theportfolio level, credit risk is reduced by the fact that when offsettingtransactions are done with separate counterparties, only one of thetwo trades can generate a credit loss, even if both counterpartieswere to default simultaneously. The Firm refers to this effect as mar-ket diversification, and the Market-Diversified Peak (“MDP”) meas-ure is a portfolio aggregation of counterparty Peak measures, repre-senting the maximum losses at the 97.5% confidence level thatwould occur if all counterparties defaulted under any one given mar-ket scenario and time frame.
Derivative Risk Equivalent exposure is a measure that expresses theriskiness of derivative exposure on a basis intended to be equivalentto the riskiness of loan exposures. The measurement is done byequating the unexpected loss in a derivative counterparty exposure(which takes into consideration both the loss volatility and the creditrating of the counterparty) with the unexpected loss in a loan expo-sure (which takes into consideration only the credit rating of thecounterparty). DRE is a less extreme measure of potential credit lossthan Peak and is the primary measure used by the Firm for creditapproval of derivative transactions.
Finally, AVG is a measure of the expected MTM value of the Firm’sderivative receivables at future time periods, including the benefit ofcollateral. AVG exposure over the total life of the derivative contract isused as the primary metric for pricing purposes and is used to calcu-late credit capital and the Credit Valuation Adjustment (“CVA”), asfurther described below. Average exposure was $47.1 billion and$35.6 billion at December 31, 2007 and 2006, respectively, comparedwith derivative receivables MTM, net of all collateral, of $67.3 billionand $49.0 billion at December 31, 2007 and 2006, respectively.
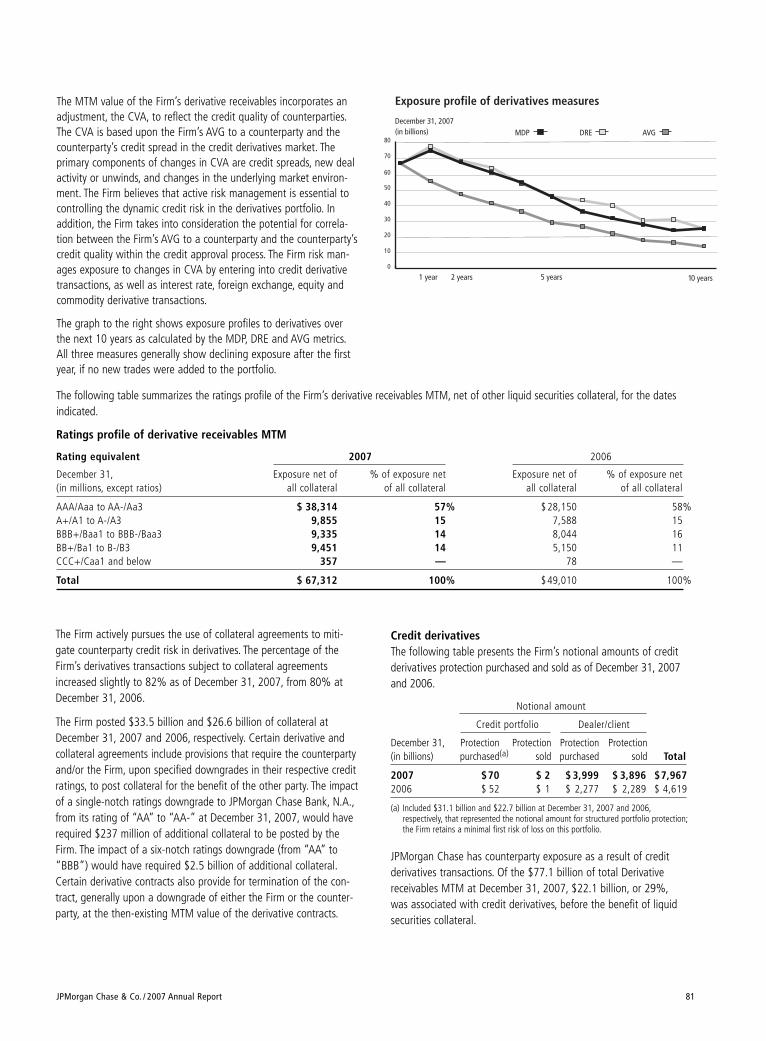
The following table summarizes the ratings profile of the Firm’s derivative receivables MTM, net of other liquid securities collateral, for the datesindicated.
Ratings profile of derivative receivables MTM
Rating equivalent 2007 2006
December 31, Exposure net of % of exposure net Exposure net of % of exposure net (in millions, except ratios) all collateral of all collateral all collateral of all collateral
AAA/Aaa to AA-/Aa3 $ 38,314 57% $28,150 58%A+/A1 to A-/A3 9,855 15 7,588 15BBB+/Baa1 to BBB-/Baa3 9,335 14 8,044 16BB+/Ba1 to B-/B3 9,451 14 5,150 11CCC+/Caa1 and below 357 — 78 —
Total $ 67,312 100% $49,010 100%
JPMorgan Chase & Co. / 2007 Annual Report 81
Credit derivatives The following table presents the Firm’s notional amounts of creditderivatives protection purchased and sold as of December 31, 2007and 2006.
Notional amount
Credit portfolio Dealer/client
December 31, Protection Protection Protection Protection(in billions) purchased(a) sold purchased sold Total
2007 $70 $ 2 $ 3,999 $ 3,896 $7,9672006 $ 52 $ 1 $ 2,277 $ 2,289 $ 4,619
(a) Included $31.1 billion and $22.7 billion at December 31, 2007 and 2006,respectively, that represented the notional amount for structured portfolio protection;the Firm retains a minimal first risk of loss on this portfolio.
JPMorgan Chase has counterparty exposure as a result of creditderivatives transactions. Of the $77.1 billion of total Derivativereceivables MTM at December 31, 2007, $22.1 billion, or 29%,was associated with credit derivatives, before the benefit of liquidsecurities collateral.
The Firm actively pursues the use of collateral agreements to miti-gate counterparty credit risk in derivatives. The percentage of theFirm’s derivatives transactions subject to collateral agreementsincreased slightly to 82% as of December 31, 2007, from 80% atDecember 31, 2006.
The Firm posted $33.5 billion and $26.6 billion of collateral atDecember 31, 2007 and 2006, respectively. Certain derivative andcollateral agreements include provisions that require the counterpartyand/or the Firm, upon specified downgrades in their respective creditratings, to post collateral for the benefit of the other party. The impactof a single-notch ratings downgrade to JPMorgan Chase Bank, N.A.,from its rating of “AA” to “AA-” at December 31, 2007, would haverequired $237 million of additional collateral to be posted by theFirm. The impact of a six-notch ratings downgrade (from “AA” to“BBB”) would have required $2.5 billion of additional collateral.Certain derivative contracts also provide for termination of the con-tract, generally upon a downgrade of either the Firm or the counter-party, at the then-existing MTM value of the derivative contracts.
0
10
20
30
40
50
60
70
80
Exposure profile of derivatives measures
December 31, 2007(in billions) MDP AVGDRE
1 year 2 years 5 years 10 years
The MTM value of the Firm’s derivative receivables incorporates anadjustment, the CVA, to reflect the credit quality of counterparties.The CVA is based upon the Firm’s AVG to a counterparty and thecounterparty’s credit spread in the credit derivatives market. The primary components of changes in CVA are credit spreads, new dealactivity or unwinds, and changes in the underlying market environ-ment. The Firm believes that active risk management is essential tocontrolling the dynamic credit risk in the derivatives portfolio. Inaddition, the Firm takes into consideration the potential for correla-tion between the Firm’s AVG to a counterparty and the counterparty’scredit quality within the credit approval process. The Firm risk man-ages exposure to changes in CVA by entering into credit derivativetransactions, as well as interest rate, foreign exchange, equity andcommodity derivative transactions.
The graph to the right shows exposure profiles to derivatives overthe next 10 years as calculated by the MDP, DRE and AVG metrics.All three measures generally show declining exposure after the firstyear, if no new trades were added to the portfolio.
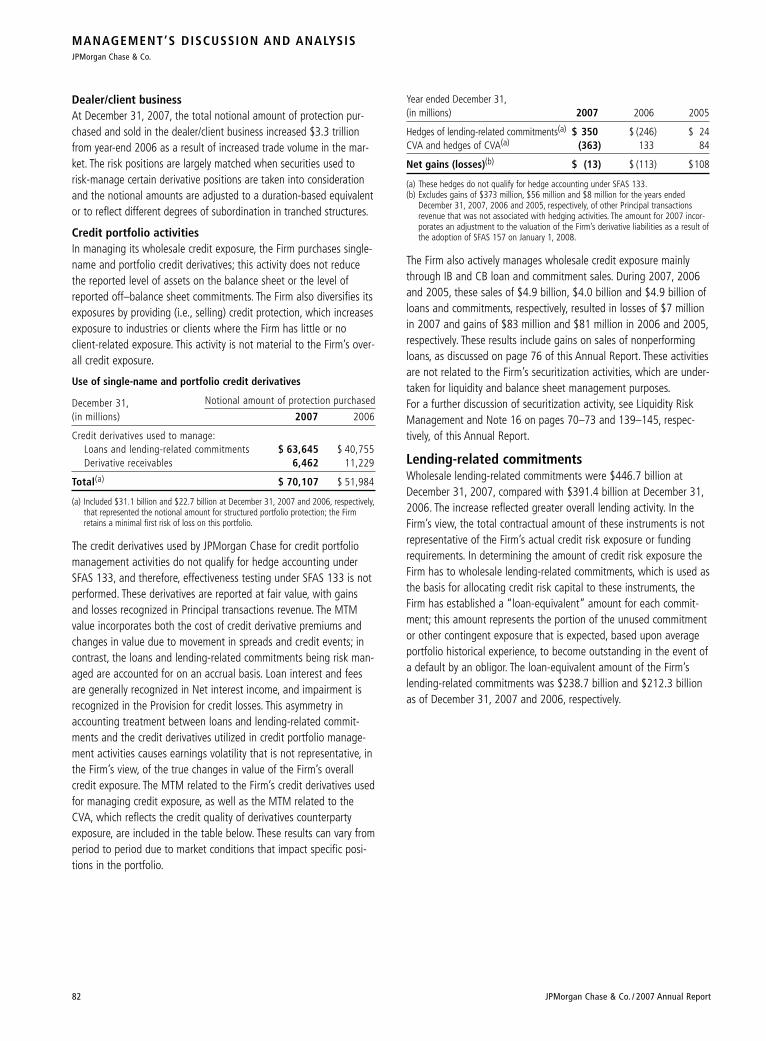
Dealer/client businessAt December 31, 2007, the total notional amount of protection pur-chased and sold in the dealer/client business increased $3.3 trillionfrom year-end 2006 as a result of increased trade volume in the mar-ket. The risk positions are largely matched when securities used torisk-manage certain derivative positions are taken into considerationand the notional amounts are adjusted to a duration-based equivalentor to reflect different degrees of subordination in tranched structures.
Credit portfolio activitiesIn managing its wholesale credit exposure, the Firm purchases single-name and portfolio credit derivatives; this activity does not reducethe reported level of assets on the balance sheet or the level ofreported off–balance sheet commitments. The Firm also diversifies itsexposures by providing (i.e., selling) credit protection, which increasesexposure to industries or clients where the Firm has little or noclient-related exposure. This activity is not material to the Firm’s over-all credit exposure.
Use of single-name and portfolio credit derivatives
December 31, Notional amount of protection purchased
(in millions) 2007 2006
Credit derivatives used to manage:Loans and lending-related commitments $ 63,645 $ 40,755Derivative receivables 6,462 11,229
Total(a) $ 70,107 $ 51,984
(a) Included $31.1 billion and $22.7 billion at December 31, 2007 and 2006, respectively,that represented the notional amount for structured portfolio protection; the Firmretains a minimal first risk of loss on this portfolio.
The credit derivatives used by JPMorgan Chase for credit portfoliomanagement activities do not qualify for hedge accounting underSFAS 133, and therefore, effectiveness testing under SFAS 133 is notperformed. These derivatives are reported at fair value, with gainsand losses recognized in Principal transactions revenue. The MTMvalue incorporates both the cost of credit derivative premiums andchanges in value due to movement in spreads and credit events; incontrast, the loans and lending-related commitments being risk man-aged are accounted for on an accrual basis. Loan interest and feesare generally recognized in Net interest income, and impairment isrecognized in the Provision for credit losses. This asymmetry inaccounting treatment between loans and lending-related commit-ments and the credit derivatives utilized in credit portfolio manage-ment activities causes earnings volatility that is not representative, inthe Firm’s view, of the true changes in value of the Firm’s overallcredit exposure. The MTM related to the Firm’s credit derivatives usedfor managing credit exposure, as well as the MTM related to theCVA, which reflects the credit quality of derivatives counterpartyexposure, are included in the table below. These results can vary fromperiod to period due to market conditions that impact specific posi-tions in the portfolio.
Year ended December 31,(in millions) 2007 2006 2005
Hedges of lending-related commitments(a) $ 350 $ (246) $ 24CVA and hedges of CVA(a) (363) 133 84
Net gains (losses)(b) $ (13) $ (113) $108
(a) These hedges do not qualify for hedge accounting under SFAS 133.(b) Excludes gains of $373 million, $56 million and $8 million for the years ended
December 31, 2007, 2006 and 2005, respectively, of other Principal transactions revenue that was not associated with hedging activities. The amount for 2007 incor-porates an adjustment to the valuation of the Firm’s derivative liabilities as a result ofthe adoption of SFAS 157 on January 1, 2008.
The Firm also actively manages wholesale credit exposure mainlythrough IB and CB loan and commitment sales. During 2007, 2006and 2005, these sales of $4.9 billion, $4.0 billion and $4.9 billion ofloans and commitments, respectively, resulted in losses of $7 millionin 2007 and gains of $83 million and $81 million in 2006 and 2005,respectively. These results include gains on sales of nonperformingloans, as discussed on page 76 of this Annual Report. These activitiesare not related to the Firm’s securitization activities, which are under-taken for liquidity and balance sheet management purposes.For a further discussion of securitization activity, see Liquidity RiskManagement and Note 16 on pages 70–73 and 139–145, respec-tively, of this Annual Report.
Lending-related commitmentsWholesale lending-related commitments were $446.7 billion atDecember 31, 2007, compared with $391.4 billion at December 31,2006. The increase reflected greater overall lending activity. In theFirm’s view, the total contractual amount of these instruments is notrepresentative of the Firm’s actual credit risk exposure or fundingrequirements. In determining the amount of credit risk exposure theFirm has to wholesale lending-related commitments, which is used asthe basis for allocating credit risk capital to these instruments, theFirm has established a “loan-equivalent” amount for each commit-ment; this amount represents the portion of the unused commitmentor other contingent exposure that is expected, based upon averageportfolio historical experience, to become outstanding in the event ofa default by an obligor. The loan-equivalent amount of the Firm’slending-related commitments was $238.7 billion and $212.3 billionas of December 31, 2007 and 2006, respectively.
MANAGEMENT’S DISCUSSION AND ANALYSISJPMorgan Chase & Co.
82 JPMorgan Chase & Co. / 2007 Annual Report
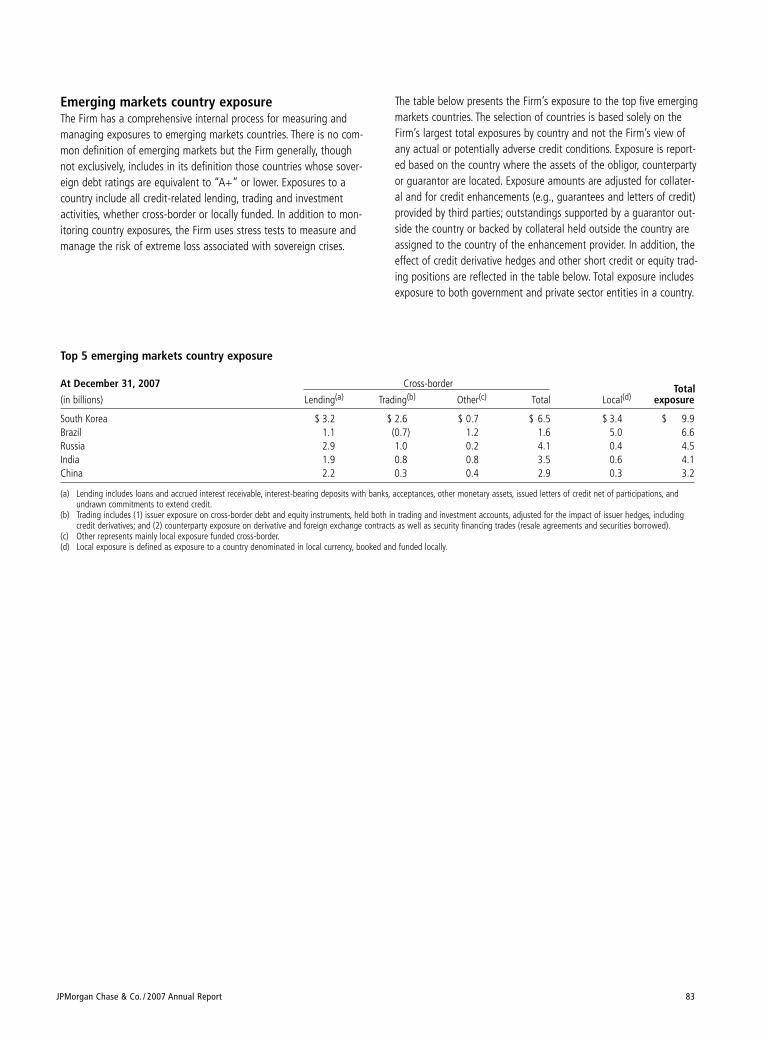
JPMorgan Chase & Co. / 2007 Annual Report 83
Top 5 emerging markets country exposure
At December 31, 2007 Cross-border Total(in billions) Lending(a) Trading(b) Other(c) Total Local(d) exposure
South Korea $ 3.2 $ 2.6 $ 0.7 $ 6.5 $ 3.4 $ 9.9Brazil 1.1 (0.7) 1.2 1.6 5.0 6.6Russia 2.9 1.0 0.2 4.1 0.4 4.5India 1.9 0.8 0.8 3.5 0.6 4.1China 2.2 0.3 0.4 2.9 0.3 3.2
(a) Lending includes loans and accrued interest receivable, interest-bearing deposits with banks, acceptances, other monetary assets, issued letters of credit net of participations, andundrawn commitments to extend credit.
(b) Trading includes (1) issuer exposure on cross-border debt and equity instruments, held both in trading and investment accounts, adjusted for the impact of issuer hedges, includingcredit derivatives; and (2) counterparty exposure on derivative and foreign exchange contracts as well as security financing trades (resale agreements and securities borrowed).
(c) Other represents mainly local exposure funded cross-border.(d) Local exposure is defined as exposure to a country denominated in local currency, booked and funded locally.
Emerging markets country exposureThe Firm has a comprehensive internal process for measuring andmanaging exposures to emerging markets countries. There is no com-mon definition of emerging markets but the Firm generally, thoughnot exclusively, includes in its definition those countries whose sover-eign debt ratings are equivalent to “A+” or lower. Exposures to acountry include all credit-related lending, trading and investmentactivities, whether cross-border or locally funded. In addition to mon-itoring country exposures, the Firm uses stress tests to measure andmanage the risk of extreme loss associated with sovereign crises.
The table below presents the Firm’s exposure to the top five emergingmarkets countries. The selection of countries is based solely on theFirm’s largest total exposures by country and not the Firm’s view ofany actual or potentially adverse credit conditions. Exposure is report-ed based on the country where the assets of the obligor, counterpartyor guarantor are located. Exposure amounts are adjusted for collater-al and for credit enhancements (e.g., guarantees and letters of credit)provided by third parties; outstandings supported by a guarantor out-side the country or backed by collateral held outside the country areassigned to the country of the enhancement provider. In addition, theeffect of credit derivative hedges and other short credit or equity trad-ing positions are reflected in the table below. Total exposure includesexposure to both government and private sector entities in a country.
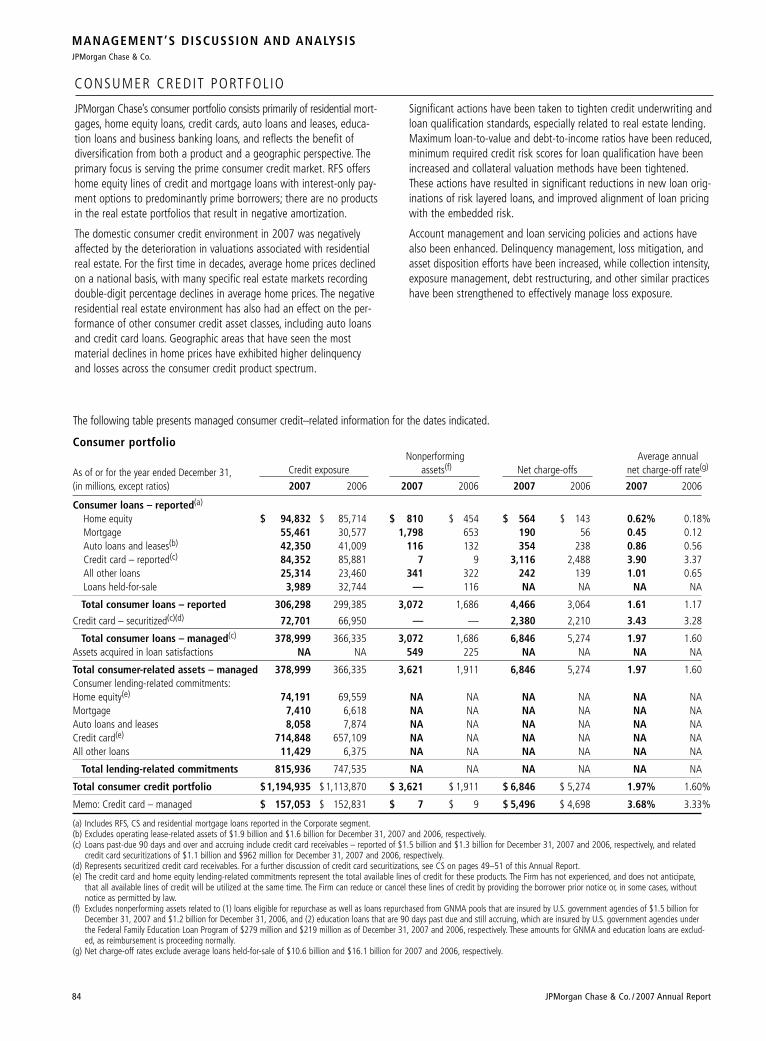
MANAGEMENT’S DISCUSSION AND ANALYSISJPMorgan Chase & Co.
84 JPMorgan Chase & Co. / 2007 Annual Report
CONSUMER CREDIT PORTFOL IO
JPMorgan Chase’s consumer portfolio consists primarily of residential mort-gages, home equity loans, credit cards, auto loans and leases, educa-tion loans and business banking loans, and reflects the benefit ofdiversification from both a product and a geographic perspective. Theprimary focus is serving the prime consumer credit market. RFS offershome equity lines of credit and mortgage loans with interest-only pay-ment options to predominantly prime borrowers; there are no productsin the real estate portfolios that result in negative amortization.
The domestic consumer credit environment in 2007 was negativelyaffected by the deterioration in valuations associated with residentialreal estate. For the first time in decades, average home prices declinedon a national basis, with many specific real estate markets recordingdouble-digit percentage declines in average home prices. The negativeresidential real estate environment has also had an effect on the per-formance of other consumer credit asset classes, including auto loansand credit card loans. Geographic areas that have seen the mostmaterial declines in home prices have exhibited higher delinquencyand losses across the consumer credit product spectrum.
Significant actions have been taken to tighten credit underwriting andloan qualification standards, especially related to real estate lending.Maximum loan-to-value and debt-to-income ratios have been reduced,minimum required credit risk scores for loan qualification have beenincreased and collateral valuation methods have been tightened.These actions have resulted in significant reductions in new loan orig-inations of risk layered loans, and improved alignment of loan pricingwith the embedded risk.
Account management and loan servicing policies and actions havealso been enhanced. Delinquency management, loss mitigation, andasset disposition efforts have been increased, while collection intensity,exposure management, debt restructuring, and other similar practiceshave been strengthened to effectively manage loss exposure.
The following table presents managed consumer credit–related information for the dates indicated.
Consumer portfolio Nonperforming Average annual
As of or for the year ended December 31, Credit exposure assets(f) Net charge-offs net charge-off rate(g)
(in millions, except ratios) 2007 2006 2007 2006 2007 2006 2007 2006
Consumer loans – reported(a)
Home equity $ 94,832 $ 85,714 $ 810 $ 454 $ 564 $ 143 0.62% 0.18%Mortgage 55,461 30,577 1,798 653 190 56 0.45 0.12Auto loans and leases(b) 42,350 41,009 116 132 354 238 0.86 0.56Credit card – reported(c) 84,352 85,881 7 9 3,116 2,488 3.90 3.37All other loans 25,314 23,460 341 322 242 139 1.01 0.65Loans held-for-sale 3,989 32,744 — 116 NA NA NA NA
Total consumer loans – reported 306,298 299,385 3,072 1,686 4,466 3,064 1.61 1.17
Credit card – securitized(c)(d) 72,701 66,950 — — 2,380 2,210 3.43 3.28
Total consumer loans – managed(c) 378,999 366,335 3,072 1,686 6,846 5,274 1.97 1.60Assets acquired in loan satisfactions NA NA 549 225 NA NA NA NA
Total consumer-related assets – managed 378,999 366,335 3,621 1,911 6,846 5,274 1.97 1.60Consumer lending-related commitments:Home equity(e) 74,191 69,559 NA NA NA NA NA NAMortgage 7,410 6,618 NA NA NA NA NA NAAuto loans and leases 8,058 7,874 NA NA NA NA NA NACredit card(e) 714,848 657,109 NA NA NA NA NA NAAll other loans 11,429 6,375 NA NA NA NA NA NA
Total lending-related commitments 815,936 747,535 NA NA NA NA NA NA
Total consumer credit portfolio $1,194,935 $1,113,870 $ 3,621 $ 1,911 $ 6,846 $ 5,274 1.97% 1.60%
Memo: Credit card – managed $ 157,053 $ 152,831 $ 7 $ 9 $ 5,496 $ 4,698 3.68% 3.33%
(a) Includes RFS, CS and residential mortgage loans reported in the Corporate segment.(b) Excludes operating lease-related assets of $1.9 billion and $1.6 billion for December 31, 2007 and 2006, respectively.(c) Loans past-due 90 days and over and accruing include credit card receivables – reported of $1.5 billion and $1.3 billion for December 31, 2007 and 2006, respectively, and related
credit card securitizations of $1.1 billion and $962 million for December 31, 2007 and 2006, respectively.(d) Represents securitized credit card receivables. For a further discussion of credit card securitizations, see CS on pages 49–51 of this Annual Report.(e) The credit card and home equity lending-related commitments represent the total available lines of credit for these products. The Firm has not experienced, and does not anticipate,
that all available lines of credit will be utilized at the same time. The Firm can reduce or cancel these lines of credit by providing the borrower prior notice or, in some cases, withoutnotice as permitted by law.
(f) Excludes nonperforming assets related to (1) loans eligible for repurchase as well as loans repurchased from GNMA pools that are insured by U.S. government agencies of $1.5 billion forDecember 31, 2007 and $1.2 billion for December 31, 2006, and (2) education loans that are 90 days past due and still accruing, which are insured by U.S. government agencies underthe Federal Family Education Loan Program of $279 million and $219 million as of December 31, 2007 and 2006, respectively. These amounts for GNMA and education loans are exclud-ed, as reimbursement is proceeding normally.
(g) Net charge-off rates exclude average loans held-for-sale of $10.6 billion and $16.1 billion for 2007 and 2006, respectively.
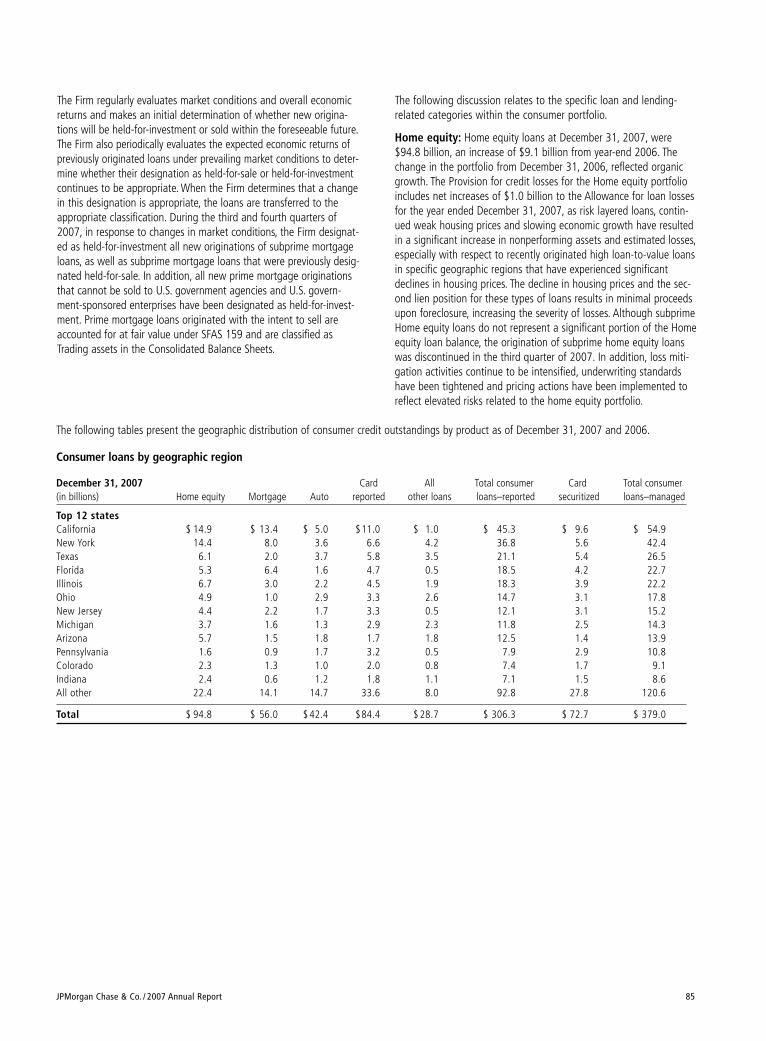
JPMorgan Chase & Co. / 2007 Annual Report 85
The following tables present the geographic distribution of consumer credit outstandings by product as of December 31, 2007 and 2006.
Consumer loans by geographic region
December 31, 2007 Card All Total consumer Card Total consumer(in billions) Home equity Mortgage Auto reported other loans loans–reported securitized loans–managed
Top 12 statesCalifornia $ 14.9 $ 13.4 $ 5.0 $11.0 $ 1.0 $ 45.3 $ 9.6 $ 54.9New York 14.4 8.0 3.6 6.6 4.2 36.8 5.6 42.4Texas 6.1 2.0 3.7 5.8 3.5 21.1 5.4 26.5Florida 5.3 6.4 1.6 4.7 0.5 18.5 4.2 22.7Illinois 6.7 3.0 2.2 4.5 1.9 18.3 3.9 22.2Ohio 4.9 1.0 2.9 3.3 2.6 14.7 3.1 17.8New Jersey 4.4 2.2 1.7 3.3 0.5 12.1 3.1 15.2Michigan 3.7 1.6 1.3 2.9 2.3 11.8 2.5 14.3Arizona 5.7 1.5 1.8 1.7 1.8 12.5 1.4 13.9Pennsylvania 1.6 0.9 1.7 3.2 0.5 7.9 2.9 10.8Colorado 2.3 1.3 1.0 2.0 0.8 7.4 1.7 9.1Indiana 2.4 0.6 1.2 1.8 1.1 7.1 1.5 8.6All other 22.4 14.1 14.7 33.6 8.0 92.8 27.8 120.6
Total $ 94.8 $ 56.0 $ 42.4 $84.4 $ 28.7 $ 306.3 $ 72.7 $ 379.0
The Firm regularly evaluates market conditions and overall economicreturns and makes an initial determination of whether new origina-tions will be held-for-investment or sold within the foreseeable future.The Firm also periodically evaluates the expected economic returns ofpreviously originated loans under prevailing market conditions to deter-mine whether their designation as held-for-sale or held-for-investmentcontinues to be appropriate. When the Firm determines that a changein this designation is appropriate, the loans are transferred to theappropriate classification. During the third and fourth quarters of2007, in response to changes in market conditions, the Firm designat-ed as held-for-investment all new originations of subprime mortgageloans, as well as subprime mortgage loans that were previously desig-nated held-for-sale. In addition, all new prime mortgage originationsthat cannot be sold to U.S. government agencies and U.S. govern-ment-sponsored enterprises have been designated as held-for-invest-ment. Prime mortgage loans originated with the intent to sell areaccounted for at fair value under SFAS 159 and are classified asTrading assets in the Consolidated Balance Sheets.
The following discussion relates to the specific loan and lending-related categories within the consumer portfolio.
Home equity: Home equity loans at December 31, 2007, were$94.8 billion, an increase of $9.1 billion from year-end 2006. Thechange in the portfolio from December 31, 2006, reflected organicgrowth. The Provision for credit losses for the Home equity portfolioincludes net increases of $1.0 billion to the Allowance for loan lossesfor the year ended December 31, 2007, as risk layered loans, contin-ued weak housing prices and slowing economic growth have resultedin a significant increase in nonperforming assets and estimated losses,especially with respect to recently originated high loan-to-value loansin specific geographic regions that have experienced significantdeclines in housing prices. The decline in housing prices and the sec-ond lien position for these types of loans results in minimal proceedsupon foreclosure, increasing the severity of losses. Although subprimeHome equity loans do not represent a significant portion of the Homeequity loan balance, the origination of subprime home equity loanswas discontinued in the third quarter of 2007. In addition, loss miti-gation activities continue to be intensified, underwriting standardshave been tightened and pricing actions have been implemented toreflect elevated risks related to the home equity portfolio.
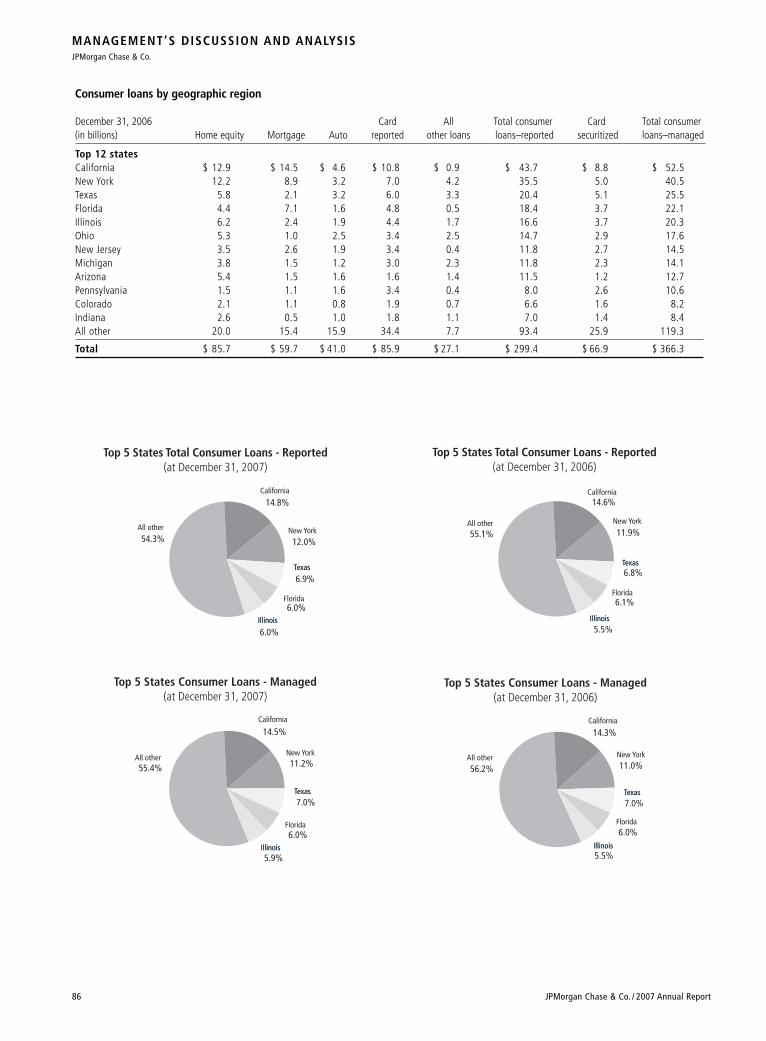
Consumer loans by geographic region
December 31, 2006 Card All Total consumer Card Total consumer(in billions) Home equity Mortgage Auto reported other loans loans–reported securitized loans–managed
Top 12 statesCalifornia $ 12.9 $ 14.5 $ 4.6 $ 10.8 $ 0.9 $ 43.7 $ 8.8 $ 52.5New York 12.2 8.9 3.2 7.0 4.2 35.5 5.0 40.5Texas 5.8 2.1 3.2 6.0 3.3 20.4 5.1 25.5Florida 4.4 7.1 1.6 4.8 0.5 18.4 3.7 22.1Illinois 6.2 2.4 1.9 4.4 1.7 16.6 3.7 20.3Ohio 5.3 1.0 2.5 3.4 2.5 14.7 2.9 17.6New Jersey 3.5 2.6 1.9 3.4 0.4 11.8 2.7 14.5Michigan 3.8 1.5 1.2 3.0 2.3 11.8 2.3 14.1Arizona 5.4 1.5 1.6 1.6 1.4 11.5 1.2 12.7Pennsylvania 1.5 1.1 1.6 3.4 0.4 8.0 2.6 10.6Colorado 2.1 1.1 0.8 1.9 0.7 6.6 1.6 8.2Indiana 2.6 0.5 1.0 1.8 1.1 7.0 1.4 8.4All other 20.0 15.4 15.9 34.4 7.7 93.4 25.9 119.3
Total $ 85.7 $ 59.7 $ 41.0 $ 85.9 $ 27.1 $ 299.4 $ 66.9 $ 366.3
MANAGEMENT’S DISCUSSION AND ANALYSISJPMorgan Chase & Co.
86 JPMorgan Chase & Co. / 2007 Annual Report
Top 5 States Total Consumer Loans - Reported(at December 31, 2007)
California
TexasTexas
New York54.3%
14.8%
6.9%
Florida
12.0%
6.0%
6.0%IllinoisIllinois
All other
Top 5 States Total Consumer Loans - Reported(at December 31, 2006)
California
TexasTexas
New York
55.1%
14.6%
6.8%
Florida
11.9%
6.1%
5.5%IllinoisIllinois
All other
Top 5 States Consumer Loans - Managed(at December 31, 2007)
California
TexasTexas
New York
55.4%
14.5%
7.0%
Florida
11.2%
6.0%
5.9%IllinoisIllinois
All other
Top 5 States Consumer Loans - Managed(at December 31, 2006)
California
TexasTexas
New York
56.2%
14.3%
7.0%
Florida
11.0%
6.0%
5.5%IllinoisIllinois
All other
JPMorgan Chase & Co. / 2007 Annual Report 87
Mortgage: Prior to the third quarter of 2007, subprime mortgageloans and substantially all of the Firm’s prime mortgages, both fixed-rate and adjustable-rate, were originated with the intent to sell.Prime mortgage loans originated into the held-for-investment portfo-lio consisted primarily of adjustable-rate products. As a result of thedecision to retain rather than sell subprime mortgage loans and neworiginations of prime mortgage loans that cannot be sold to U.S.government agencies and U.S. government-sponsored enterprises,both fixed-rate and adjustable-rate products are now being originat-ed into the held-for-investment portfolio. Mortgages, irrespective ofwhether they are originated with the intent to sell or hold-for-invest-ment, are underwritten to the same standards applicable to therespective type of mortgage.
Mortgage loans at December 31, 2007, including loans held-for-sale,were $56.0 billion, reflecting a $3.6 billion decrease from year-end2006, primarily due to the change in classification to Trading assetsfor prime mortgages originated with the intent to sell and elected tobe fair valued under SFAS 159 offset partially by the decision toretain rather than sell subprime mortgage loans and new origina-tions of prime mortgage loans that cannot be sold to U.S. govern-ment agencies and U.S. government-sponsored enterprises. As ofDecember 31, 2007, mortgage loans on the Consolidated balancesheet included $15.5 billion of subprime mortgage loans, represent-ing 28% of the total mortgage loan balance. The Provision for creditlosses for mortgage loans included $166 million in increases to theallowance for loan losses for the year ended December 31, 2007, ashousing price declines in specific geographic regions and slowingeconomic growth have resulted in increases in nonperforming assetsand estimated losses for the subprime product segment. TheProvision for credit losses also reflects the decision to retain ratherthan sell subprime mortgage loans. Loss mitigation activities havebeen intensified, products have been eliminated and underwritingstandards continue to be tightened to reflect management’s expecta-tion of elevated credit losses in the subprime market segment.Nonperforming assets have also increased in the prime product seg-ment. Borrowers are generally required to obtain private mortgageinsurance for prime mortgage loans with high loan to value ratios.Recoveries on these insurance policies offset credit losses on theseloans to the extent foreclosure proceeds are greater than 80% of theloan to value ratio at the time of origination. Additional housingprice declines could result in an increase in the number of foreclo-sures for which proceeds are less than 80% of the original loan tovalue ratio, resulting in increased losses for this product segment.
Auto loans and leases: As of December 31, 2007, Auto loans andleases of $42.4 billion increased slightly from year-end 2006. TheAllowance for loan losses for the Auto loan portfolio was increasedduring 2007, reflecting an increase in estimated losses from lowprior-year levels and deterioration in the credit environment.
All other loansAll other loans primarily include Business Banking loans (which arehighly collateralized loans, often with personal loan guarantees),Education loans, Community Development loans and other securedand unsecured consumer loans. As of December 31, 2007, otherloans, including loans held-for-sale, of $28.7 billion were up $1.6 bil-lion from year-end 2006, primarily as a result of organic growth inBusiness Banking loans.
Credit CardJPMorgan Chase analyzes its credit card portfolio on a managedbasis, which includes credit card receivables on the Consolidated bal-ance sheets and those receivables sold to investors through securiti-zation. Managed credit card receivables were $157.1 billion atDecember 31, 2007, an increase of $4.2 billion from year-end 2006,reflecting organic growth in the portfolio.
The managed credit card net charge-off rate increased to 3.68% for2007, from 3.33% in 2006. This increase was due primarily to lowerbankruptcy-related net charge-offs in 2006. The 30-day delinquencyrate increased slightly to 3.48% at December 31, 2007, from 3.13%at December 31, 2006. The Allowance for loan loss was increaseddue to higher estimated net charge-offs in the portfolio. The managedcredit card portfolio continues to reflect a well-seasoned portfoliothat has good U.S. geographic diversification.
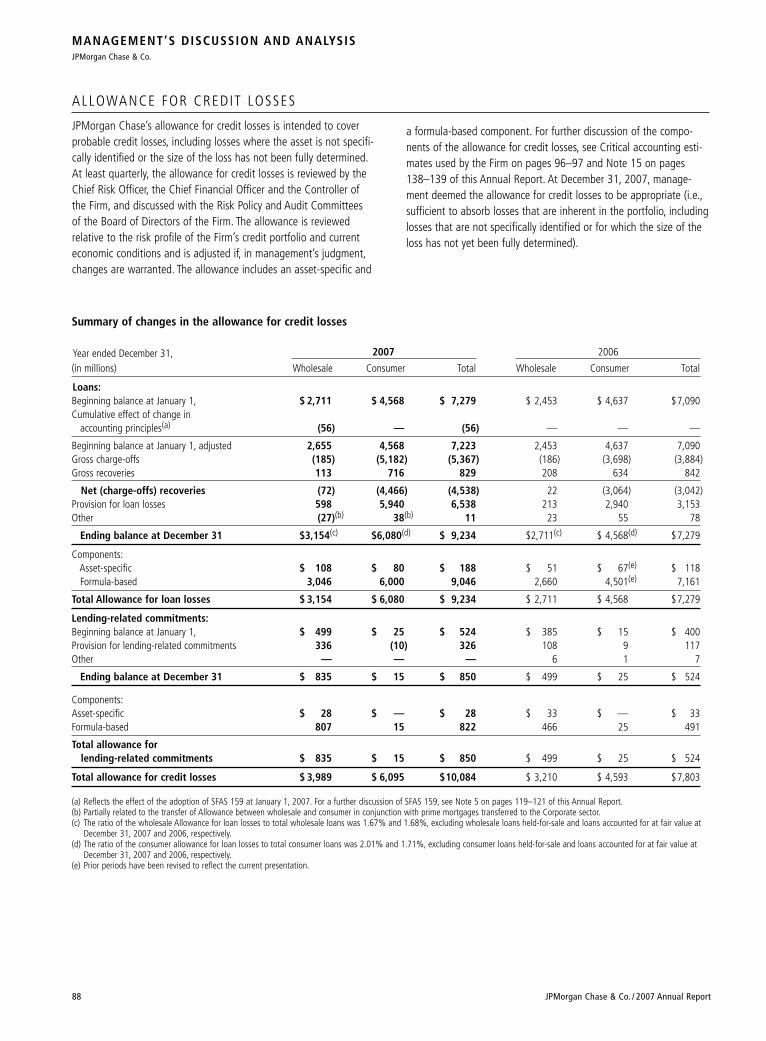
MANAGEMENT’S DISCUSSION AND ANALYSISJPMorgan Chase & Co.
88 JPMorgan Chase & Co. / 2007 Annual Report
Summary of changes in the allowance for credit losses
Year ended December 31, 2007 2006
(in millions) Wholesale Consumer Total Wholesale Consumer Total
Loans:Beginning balance at January 1, $ 2,711 $ 4,568 $ 7,279 $ 2,453 $ 4,637 $7,090Cumulative effect of change in
accounting principles(a) (56) — (56) — — —
Beginning balance at January 1, adjusted 2,655 4,568 7,223 2,453 4,637 7,090Gross charge-offs (185) (5,182) (5,367) (186) (3,698) (3,884)Gross recoveries 113 716 829 208 634 842
Net (charge-offs) recoveries (72) (4,466) (4,538) 22 (3,064) (3,042)Provision for loan losses 598 5,940 6,538 213 2,940 3,153Other (27)(b) 38(b) 11 23 55 78
Ending balance at December 31 $3,154(c) $6,080(d) $ 9,234 $2,711(c) $ 4,568(d) $7,279
Components:Asset-specific $ 108 $ 80 $ 188 $ 51 $ 67(e) $ 118Formula-based 3,046 6,000 9,046 2,660 4,501(e) 7,161
Total Allowance for loan losses $ 3,154 $ 6,080 $ 9,234 $ 2,711 $ 4,568 $7,279
Lending-related commitments:Beginning balance at January 1, $ 499 $ 25 $ 524 $ 385 $ 15 $ 400Provision for lending-related commitments 336 (10) 326 108 9 117Other — — — 6 1 7
Ending balance at December 31 $ 835 $ 15 $ 850 $ 499 $ 25 $ 524
Components:Asset-specific $ 28 $ — $ 28 $ 33 $ — $ 33Formula-based 807 15 822 466 25 491
Total allowance for lending-related commitments $ 835 $ 15 $ 850 $ 499 $ 25 $ 524
Total allowance for credit losses $ 3,989 $ 6,095 $10,084 $ 3,210 $ 4,593 $7,803
(a) Reflects the effect of the adoption of SFAS 159 at January 1, 2007. For a further discussion of SFAS 159, see Note 5 on pages 119–121 of this Annual Report.(b) Partially related to the transfer of Allowance between wholesale and consumer in conjunction with prime mortgages transferred to the Corporate sector.(c) The ratio of the wholesale Allowance for loan losses to total wholesale loans was 1.67% and 1.68%, excluding wholesale loans held-for-sale and loans accounted for at fair value at
December 31, 2007 and 2006, respectively.(d) The ratio of the consumer allowance for loan losses to total consumer loans was 2.01% and 1.71%, excluding consumer loans held-for-sale and loans accounted for at fair value at
December 31, 2007 and 2006, respectively.(e) Prior periods have been revised to reflect the current presentation.
ALLOWANCE FOR CREDIT LOSSES
JPMorgan Chase’s allowance for credit losses is intended to coverprobable credit losses, including losses where the asset is not specifi-cally identified or the size of the loss has not been fully determined.At least quarterly, the allowance for credit losses is reviewed by theChief Risk Officer, the Chief Financial Officer and the Controller ofthe Firm, and discussed with the Risk Policy and Audit Committees of the Board of Directors of the Firm. The allowance is reviewed relative to the risk profile of the Firm’s credit portfolio and currenteconomic conditions and is adjusted if, in management’s judgment,changes are warranted. The allowance includes an asset-specific and
a formula-based component. For further discussion of the compo-nents of the allowance for credit losses, see Critical accounting esti-mates used by the Firm on pages 96–97 and Note 15 on pages138–139 of this Annual Report. At December 31, 2007, manage-ment deemed the allowance for credit losses to be appropriate (i.e.,sufficient to absorb losses that are inherent in the portfolio, includinglosses that are not specifically identified or for which the size of theloss has not yet been fully determined).
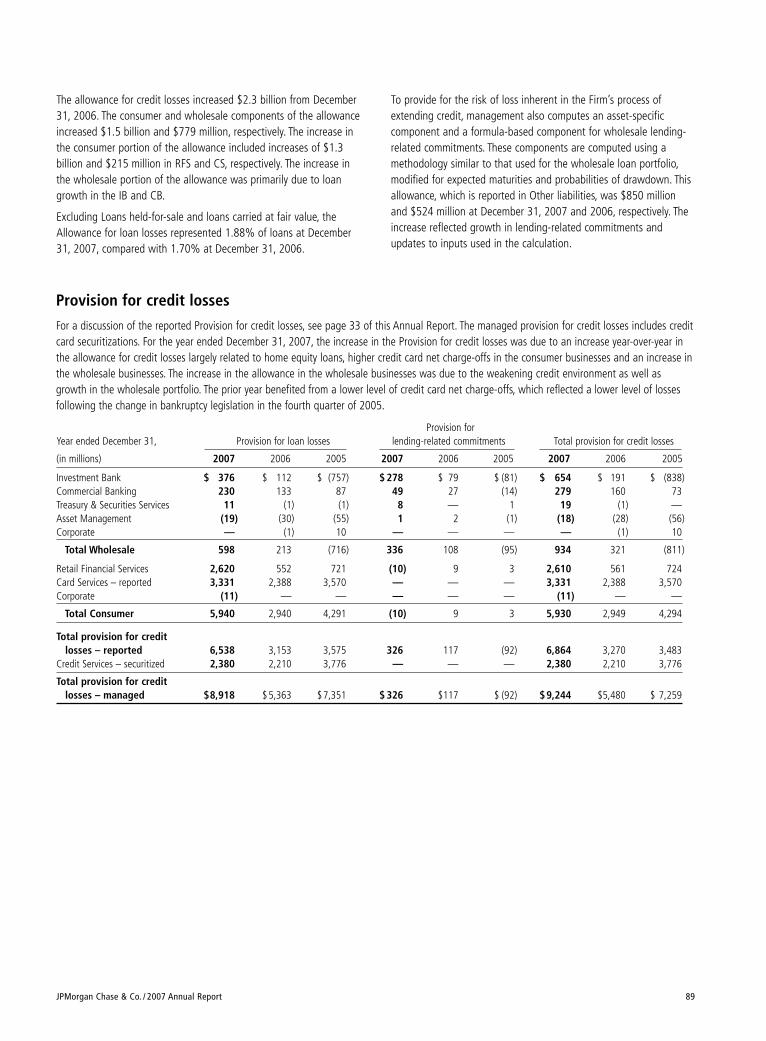
JPMorgan Chase & Co. / 2007 Annual Report 89
The allowance for credit losses increased $2.3 billion from December31, 2006. The consumer and wholesale components of the allowanceincreased $1.5 billion and $779 million, respectively. The increase inthe consumer portion of the allowance included increases of $1.3billion and $215 million in RFS and CS, respectively. The increase inthe wholesale portion of the allowance was primarily due to loangrowth in the IB and CB.
Excluding Loans held-for-sale and loans carried at fair value, theAllowance for loan losses represented 1.88% of loans at December31, 2007, compared with 1.70% at December 31, 2006.
To provide for the risk of loss inherent in the Firm’s process ofextending credit, management also computes an asset-specific component and a formula-based component for wholesale lending-related commitments. These components are computed using amethodology similar to that used for the wholesale loan portfolio,modified for expected maturities and probabilities of drawdown. Thisallowance, which is reported in Other liabilities, was $850 millionand $524 million at December 31, 2007 and 2006, respectively. Theincrease reflected growth in lending-related commitments andupdates to inputs used in the calculation.
Provision for credit losses
For a discussion of the reported Provision for credit losses, see page 33 of this Annual Report. The managed provision for credit losses includes creditcard securitizations. For the year ended December 31, 2007, the increase in the Provision for credit losses was due to an increase year-over-year inthe allowance for credit losses largely related to home equity loans, higher credit card net charge-offs in the consumer businesses and an increase inthe wholesale businesses. The increase in the allowance in the wholesale businesses was due to the weakening credit environment as well asgrowth in the wholesale portfolio. The prior year benefited from a lower level of credit card net charge-offs, which reflected a lower level of lossesfollowing the change in bankruptcy legislation in the fourth quarter of 2005.
Provision forYear ended December 31, Provision for loan losses lending-related commitments Total provision for credit losses
(in millions) 2007 2006 2005 2007 2006 2005 2007 2006 2005
Investment Bank $ 376 $ 112 $ (757) $ 278 $ 79 $ (81) $ 654 $ 191 $ (838)Commercial Banking 230 133 87 49 27 (14) 279 160 73Treasury & Securities Services 11 (1) (1) 8 — 1 19 (1) —Asset Management (19) (30) (55) 1 2 (1) (18) (28) (56)Corporate — (1) 10 — — — — (1) 10
Total Wholesale 598 213 (716) 336 108 (95) 934 321 (811)
Retail Financial Services 2,620 552 721 (10) 9 3 2,610 561 724Card Services – reported 3,331 2,388 3,570 — — — 3,331 2,388 3,570Corporate (11) — — — — — (11) — —
Total Consumer 5,940 2,940 4,291 (10) 9 3 5,930 2,949 4,294
Total provision for credit losses – reported 6,538 3,153 3,575 326 117 (92) 6,864 3,270 3,483
Credit Services – securitized 2,380 2,210 3,776 — — — 2,380 2,210 3,776
Total provision for credit losses – managed $8,918 $5,363 $7,351 $ 326 $117 $ (92) $9,244 $5,480 $ 7,259
MANAGEMENT’S DISCUSSION AND ANALYSISJPMorgan Chase & Co.
90 JPMorgan Chase & Co. / 2007 Annual Report
MARKET R ISK MANAGEMENT
Market risk is the exposure to an adverse change in the market valueof portfolios and financial instruments caused by a change in marketprices or rates.
Market risk management Market risk is identified, measured, monitored, and controlled byMarket Risk, a corporate risk governance function independent of thelines of business. Market Risk seeks to facilitate efficient risk/returndecisions, reduce volatility in operating performance and make theFirm’s market risk profile transparent to senior management, theBoard of Directors and regulators. Market Risk is overseen by theChief Risk Officer and performs the following functions:
• Establishment of a comprehensive market risk policy framework• Independent measurement, monitoring and control
of business segment market risk• Definition, approval and monitoring of limits• Performance of stress testing and qualitative risk assessments
Risk identification and classificationMarket Risk works in partnership with the business segments toidentify market risks throughout the Firm and to define and monitormarket risk policies and procedures. All business segments areresponsible for comprehensive identification and verification of mar-ket risks within their units. Risk-taking businesses have functions thatact independently from trading personnel and are responsible forverifying risk exposures that the business takes. In addition to provid-ing independent oversight for market risk arising from the businesssegments, Market Risk is also responsible for identifying exposureswhich may not be large within individual business segments, butwhich may be large for the Firm in aggregate. Regular meetings areheld between Market Risk and the heads of risk-taking businesses todiscuss and decide on risk exposures in the context of the marketenvironment and client flows.
Positions that expose the Firm to market risk can be classified intotwo categories: trading and nontrading risk. Trading risk includes posi-tions that are held by the Firm as part of a business segment or unit,the main business strategy of which is to trade or make markets.Unrealized gains and losses in these positions are generally reportedin Principal transactions revenue. Nontrading risk includes securitiesand other assets held for longer-term investment, mortgage servicingrights, and securities and derivatives used to manage the Firm’sasset/liability exposures. Unrealized gains and losses in these positionsare generally not reported in Principal transactions revenue.
Trading riskFixed income risk (which includes interest rate risk and credit spreadrisk), foreign exchange, equities and commodities and other tradingrisks involve the potential decline in Net income or financial condi-tion due to adverse changes in market rates, whether arising fromclient activities or proprietary positions taken by the Firm.
Nontrading riskNontrading risk arises from execution of the Firm’s core businessstrategies, the delivery of products and services to its customers,and the discretionary positions the Firm undertakes to risk-manageexposures.
These exposures can result from a variety of factors, including differ-ences in the timing among the maturity or repricing of assets, liabili-ties and off–balance sheet instruments. Changes in the level andshape of market interest rate curves also may create interest raterisk, since the repricing characteristics of the Firm’s assets do notnecessarily match those of its liabilities. The Firm is also exposed tobasis risk, which is the difference in the repricing characteristics oftwo floating-rate indices, such as the prime rate and 3-month LIBOR.In addition, some of the Firm’s products have embedded optionalitythat impact pricing and balances.
The Firm’s mortgage banking activities give rise to complex interestrate risks, as well as option and basis risk. Option risk arises primarilyfrom prepayment options embedded in mortgages and changes in theprobability of newly originated mortgage commitments actually clos-ing. Basis risk results from different relative movements between mort-gage rates and other interest rates.
Risk measurementTools used to measure riskBecause no single measure can reflect all aspects of market risk,the Firm uses various metrics, both statistical and nonstatistical,including:
• Nonstatistical risk measures• Value-at-risk (“VAR”)• Loss advisories• Drawdowns• Economic value stress testing• Earnings-at-risk stress testing• Risk identification for large exposures (“RIFLE”)
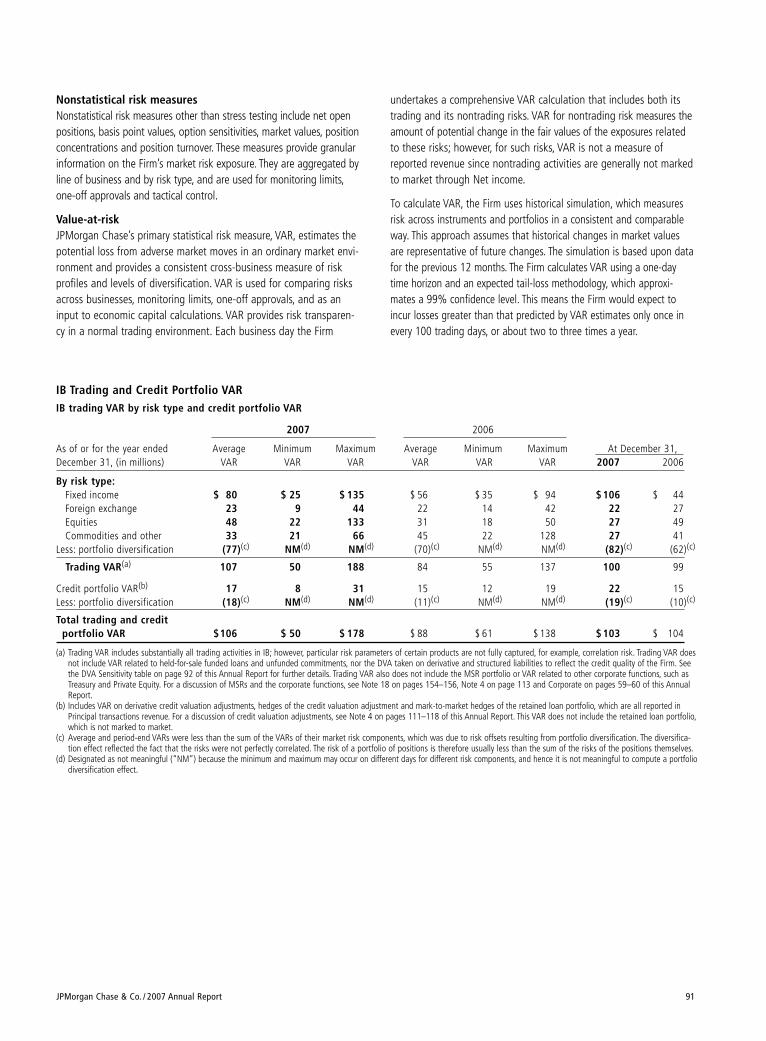
JPMorgan Chase & Co. / 2007 Annual Report 91
Nonstatistical risk measuresNonstatistical risk measures other than stress testing include net openpositions, basis point values, option sensitivities, market values, positionconcentrations and position turnover. These measures provide granularinformation on the Firm’s market risk exposure. They are aggregated byline of business and by risk type, and are used for monitoring limits,one-off approvals and tactical control.
Value-at-risk JPMorgan Chase’s primary statistical risk measure, VAR, estimates thepotential loss from adverse market moves in an ordinary market envi-ronment and provides a consistent cross-business measure of riskprofiles and levels of diversification. VAR is used for comparing risksacross businesses, monitoring limits, one-off approvals, and as aninput to economic capital calculations. VAR provides risk transparen-cy in a normal trading environment. Each business day the Firm
undertakes a comprehensive VAR calculation that includes both itstrading and its nontrading risks. VAR for nontrading risk measures theamount of potential change in the fair values of the exposures relatedto these risks; however, for such risks, VAR is not a measure ofreported revenue since nontrading activities are generally not markedto market through Net income.
To calculate VAR, the Firm uses historical simulation, which measuresrisk across instruments and portfolios in a consistent and comparableway. This approach assumes that historical changes in market valuesare representative of future changes. The simulation is based upon datafor the previous 12 months. The Firm calculates VAR using a one-daytime horizon and an expected tail-loss methodology, which approxi-mates a 99% confidence level. This means the Firm would expect toincur losses greater than that predicted by VAR estimates only once inevery 100 trading days, or about two to three times a year.
IB Trading and Credit Portfolio VARIB trading VAR by risk type and credit portfolio VAR
2007 2006
As of or for the year ended Average Minimum Maximum Average Minimum Maximum At December 31,December 31, (in millions) VAR VAR VAR VAR VAR VAR 2007 2006
By risk type:Fixed income $ 80 $ 25 $ 135 $ 56 $ 35 $ 94 $ 106 $ 44Foreign exchange 23 9 44 22 14 42 22 27Equities 48 22 133 31 18 50 27 49Commodities and other 33 21 66 45 22 128 27 41
Less: portfolio diversification (77)(c) NM(d) NM(d) (70)(c) NM(d) NM(d) (82)(c) (62)(c)
Trading VAR(a) 107 50 188 84 55 137 100 99
Credit portfolio VAR(b) 17 8 31 15 12 19 22 15Less: portfolio diversification (18)(c) NM(d) NM(d) (11)(c) NM(d) NM(d) (19)(c) (10)(c)
Total trading and creditportfolio VAR $106 $ 50 $ 178 $ 88 $ 61 $ 138 $ 103 $ 104
(a) Trading VAR includes substantially all trading activities in IB; however, particular risk parameters of certain products are not fully captured, for example, correlation risk. Trading VAR doesnot include VAR related to held-for-sale funded loans and unfunded commitments, nor the DVA taken on derivative and structured liabilities to reflect the credit quality of the Firm. Seethe DVA Sensitivity table on page 92 of this Annual Report for further details. Trading VAR also does not include the MSR portfolio or VAR related to other corporate functions, such asTreasury and Private Equity. For a discussion of MSRs and the corporate functions, see Note 18 on pages 154–156, Note 4 on page 113 and Corporate on pages 59–60 of this AnnualReport.
(b) Includes VAR on derivative credit valuation adjustments, hedges of the credit valuation adjustment and mark-to-market hedges of the retained loan portfolio, which are all reported inPrincipal transactions revenue. For a discussion of credit valuation adjustments, see Note 4 on pages 111–118 of this Annual Report. This VAR does not include the retained loan portfolio,which is not marked to market.
(c) Average and period-end VARs were less than the sum of the VARs of their market risk components, which was due to risk offsets resulting from portfolio diversification. The diversifica-tion effect reflected the fact that the risks were not perfectly correlated. The risk of a portfolio of positions is therefore usually less than the sum of the risks of the positions themselves.
(d) Designated as not meaningful (“NM”) because the minimum and maximum may occur on different days for different risk components, and hence it is not meaningful to compute a portfolio diversification effect.
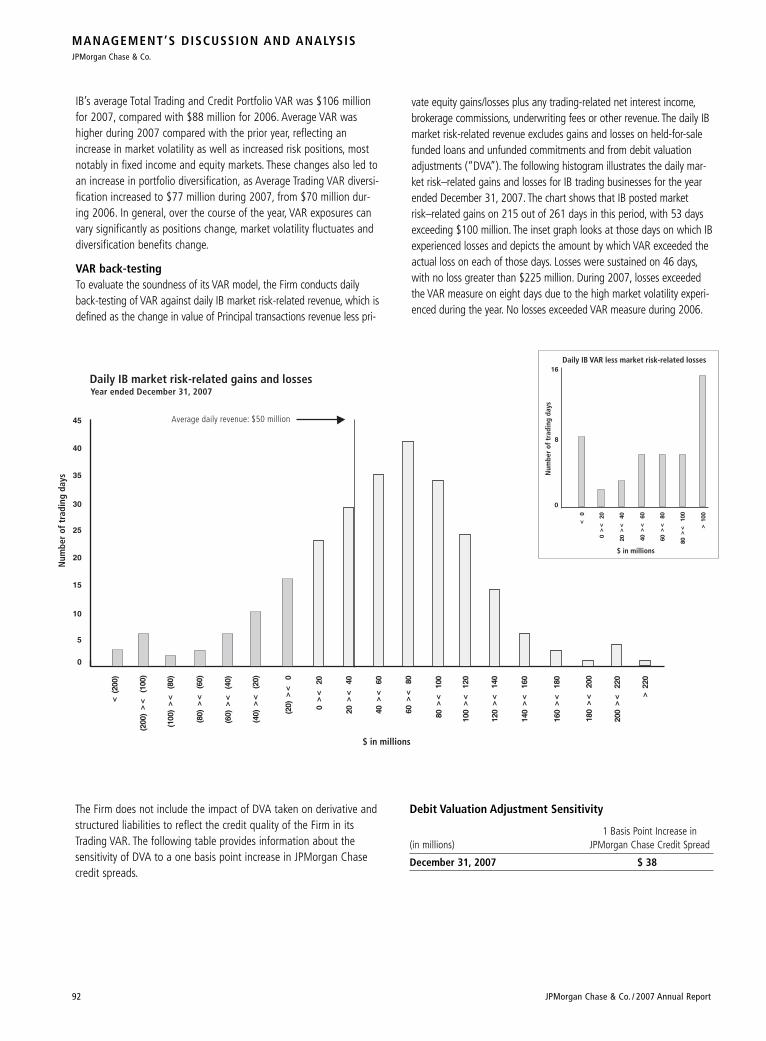
MANAGEMENT’S DISCUSSION AND ANALYSISJPMorgan Chase & Co.
92 JPMorgan Chase & Co. / 2007 Annual Report
IB’s average Total Trading and Credit Portfolio VAR was $106 millionfor 2007, compared with $88 million for 2006. Average VAR washigher during 2007 compared with the prior year, reflecting anincrease in market volatility as well as increased risk positions, mostnotably in fixed income and equity markets. These changes also led toan increase in portfolio diversification, as Average Trading VAR diversi-fication increased to $77 million during 2007, from $70 million dur-ing 2006. In general, over the course of the year, VAR exposures canvary significantly as positions change, market volatility fluctuates anddiversification benefits change.
VAR back-testingTo evaluate the soundness of its VAR model, the Firm conducts dailyback-testing of VAR against daily IB market risk-related revenue, which isdefined as the change in value of Principal transactions revenue less pri-
vate equity gains/losses plus any trading-related net interest income,brokerage commissions, underwriting fees or other revenue. The daily IBmarket risk-related revenue excludes gains and losses on held-for-salefunded loans and unfunded commitments and from debit valuationadjustments (“DVA”). The following histogram illustrates the daily mar-ket risk–related gains and losses for IB trading businesses for the yearended December 31, 2007. The chart shows that IB posted marketrisk–related gains on 215 out of 261 days in this period, with 53 daysexceeding $100 million. The inset graph looks at those days on which IBexperienced losses and depicts the amount by which VAR exceeded theactual loss on each of those days. Losses were sustained on 46 days,with no loss greater than $225 million. During 2007, losses exceededthe VAR measure on eight days due to the high market volatility experi-enced during the year. No losses exceeded VAR measure during 2006.
<(2
00)
20>
<40
40>
<60
60>
<80
80>
<10
0
100
> <
120
(20)
> <
0
(60)
> <
(40)
Daily IB market risk-related gains and lossesYear ended December 31, 2007
Num
ber
of t
radi
ng d
ays
Average daily revenue: $50 million
0
5
10
15
20
25
30
35
40
45
$ in millions
8
16
<0
0>
<20
20>
<40
40>
<60
60>
<80
>10
0
$ in millionsN
umbe
r of
tra
ding
day
s
Daily IB VAR less market risk-related losses
80>
<10
0
140
> <
160
120
> <
140
(40)
> <
(20)
160
> <
180
180
> <
200
200
> <
220
0>
<20
(200
)>
<(1
00)
(100
)>
<(8
0)
(80)
> <
(60)
0
>22
0
The Firm does not include the impact of DVA taken on derivative andstructured liabilities to reflect the credit quality of the Firm in itsTrading VAR. The following table provides information about the sensitivity of DVA to a one basis point increase in JPMorgan Chasecredit spreads.
Debit Valuation Adjustment Sensitivity
1 Basis Point Increase in(in millions) JPMorgan Chase Credit Spread
December 31, 2007 $ 38
JPMorgan Chase & Co. / 2007 Annual Report 93
Loss advisories and drawdownsLoss advisories and drawdowns are tools used to highlight to seniormanagement trading losses above certain levels and are used to ini-tiate discussion of remedies.
Economic value stress testingWhile VAR reflects the risk of loss due to adverse changes in normalmarkets, stress testing captures the Firm’s exposure to unlikely butplausible events in abnormal markets. The Firm conducts economic-value stress tests for both its trading and its nontrading activities atleast once a month using multiple scenarios that assume credit spreadswiden significantly, equity prices decline and interest rates rise in themajor currencies. Additional scenarios focus on the risks predominantin individual business segments and include scenarios that focus on thepotential for adverse moves in complex portfolios. Periodically, scenar-ios are reviewed and updated to reflect changes in the Firm’s risk pro-file and economic events. Along with VAR, stress testing is important inmeasuring and controlling risk. Stress testing enhances the understand-ing of the Firm’s risk profile and loss potential, and stress losses aremonitored against limits. Stress testing is also utilized in one-offapprovals and cross-business risk measurement, as well as an input toeconomic capital allocation. Stress-test results, trends and explanationsare provided each month to the Firm’s senior management and to thelines of business to help them better measure and manage risks and tounderstand event risk-sensitive positions.
Earnings-at-risk stress testingThe VAR and stress-test measures described above illustrate the totaleconomic sensitivity of the Firm’s balance sheet to changes in marketvariables. The effect of interest rate exposure on reported Net incomealso is important. Interest rate risk exposure in the Firm’s core non-trading business activities (i.e., asset/liability management positions)results from on– and off–balance sheet positions. The Firm conductssimulations of changes in NII from its nontrading activities under avariety of interest rate scenarios. Earnings-at-risk tests measure thepotential change in the Firm’s Net interest income over the next 12months and highlight exposures to various rate-sensitive factors, suchas the rates themselves (e.g., the prime lending rate), pricing strate-gies on deposits, optionality and changes in product mix. The testsinclude forecasted balance sheet changes, such as asset sales andsecuritizations, as well as prepayment and reinvestment behavior.
Earnings-at-risk also can result from changes in the slope of the yieldcurve, because the Firm has the ability to lend at fixed rates and bor-row at variable or short-term fixed rates. Based upon these scenarios,the Firm’s earnings would be affected negatively by a sudden andunanticipated increase in short-term rates without a correspondingincrease in long-term rates. Conversely, higher long-term rates generallyare beneficial to earnings, particularly when the increase is notaccompanied by rising short-term rates.
Immediate changes in interest rates present a limited view of risk,and so a number of alternative scenarios also are reviewed. Thesescenarios include the implied forward curve, nonparallel rate shiftsand severe interest rate shocks on selected key rates. These scenariosare intended to provide a comprehensive view of JPMorgan Chase’searnings-at-risk over a wide range of outcomes.
JPMorgan Chase’s 12-month pretax earnings sensitivity profile as ofDecember 31, 2007 and 2006, were as follows.
Immediate change in rates
(in millions) +200bp +100bp -100bp -200bp
December 31, 2007 $ (26) $ 55 $(308) $ (664)December 31, 2006 $ (101) $ 28 $ (21) $ (182)
The primary change in earnings-at-risk from December 31, 2006,reflects increased prepayments on loans and securities due to lowermarket interest rates. The Firm is exposed to both rising and fallingrates. The Firm’s risk to rising rates is largely the result of increasedfunding costs. In contrast, the exposure to falling rates is the result of higher anticipated levels of loan and securities prepayments.
Risk identification for large exposures (“RIFLE”)Individuals who manage risk positions, particularly those that arecomplex, are responsible for identifying potential losses that couldarise from specific, unusual events, such as a potential tax change, andestimating the probabilities of losses arising from such events. Thisinformation is entered into the Firm’s RIFLE database. Trading man-agement has access to RIFLE, thereby permitting the Firm to monitorfurther earnings vulnerability not adequately covered by standard riskmeasures.
Risk monitoring and control
LimitsMarket risk is controlled primarily through a series of limits. Limitsreflect the Firm’s risk appetite in the context of the market environ-ment and business strategy. In setting limits, the Firm takes into con-sideration factors such as market volatility, product liquidity, businesstrends and management experience.
Market risk management regularly reviews and updates risk limits.Senior management, including the Firm’s Chief Executive Officer andChief Risk Officer, is responsible for reviewing and approving risk limits at least once a year.
The Firm maintains different levels of limits. Corporate-level limitsinclude VAR and stress. Similarly, line-of-business limits include VARand stress limits and may be supplemented by loss advisories, non-statistical measurements and instrument authorities. Businesses areresponsible for adhering to established limits, against which expo-sures are monitored and reported. Limit breaches are reported in atimely manner to senior management, and the affected business seg-ment is required either to reduce trading positions or consult withsenior management on the appropriate action.
Qualitative reviewThe Market Risk Management group also performs periodic reviewsas necessary of both businesses and products with exposure to mar-ket risk in order to assess the ability of the businesses to control theirmarket risk. Strategies, market conditions, product details and riskcontrols are reviewed, and specific recommendations for improve-ments are made to management.
MANAGEMENT’S DISCUSSION AND ANALYSISJPMorgan Chase & Co.
94 JPMorgan Chase & Co. / 2007 Annual Report
Model reviewSome of the Firm’s financial instruments cannot be valued basedupon quoted market prices but are instead valued using pricing mod-els. Such models are used for management of risk positions, such asreporting against limits, as well as for valuation. The Model RiskGroup, independent of the businesses and market risk management,reviews the models the Firm uses and assesses model appropriate-ness and consistency. The model reviews consider a number of fac-tors about the model’s suitability for valuation and risk managementof a particular product, including whether it accurately reflects thecharacteristics of the transaction and its significant risks, the suitabilityand convergence properties of numerical algorithms, reliability of datasources, consistency of the treatment with models for similar prod-ucts, and sensitivity to input parameters and assumptions that can-not be priced from the market.
Reviews are conducted of new or changed models, as well as previ-ously accepted models, to assess whether there have been anychanges in the product or market that may impact the model’s validi-ty and whether there are theoretical or competitive developmentsthat may require reassessment of the model’s adequacy. For a sum-mary of valuations based upon models, see Critical AccountingEstimates used by the Firm on pages 96–98 of this Annual Report.
Risk reporting
Nonstatistical exposures, value-at-risk, loss advisories and limit excess-es are reported daily for each trading and nontrading business. Marketrisk exposure trends, value-at-risk trends, profit and loss changes, andportfolio concentrations are reported weekly. Stress-test results arereported monthly to business and senior management.
OPERAT IONAL R ISK MANAGEMENT
Operational risk is the risk of loss resulting from inadequate or failedprocesses or systems, human factors or external events.
OverviewOperational risk is inherent in each of the Firm’s businesses and sup-port activities. Operational risk can manifest itself in various ways,including errors, fraudulent acts, business interruptions, inappropriatebehavior of employees, or vendors that do not perform in accordancewith outsourcing arrangements. These events could result in financiallosses and other damage to the Firm, including reputational harm.
To monitor and control operational risk, the Firm maintains a systemof comprehensive policies and a control framework designed to pro-vide a sound and well-controlled operational environment. The goal isto keep operational risk at appropriate levels, in light of the Firm’sfinancial strength, the characteristics of its businesses, the markets inwhich it operates, and the competitive and regulatory environmentto which it is subject. Notwithstanding these control measures, theFirm incurs operational losses.
The Firm’s approach to operational risk management is intended to mitigate such losses by supplementing traditional control-basedapproaches to operational risk with risk measures, tools and disci-plines that are risk-specific, consistently applied and utilized firmwide.Key themes are transparency of information, escalation of key issuesand accountability for issue resolution.
The Firm’s operational risk framework is supported by Phoenix, aninternally designed operational risk software tool. Phoenix integratesthe individual components of the operational risk managementframework into a unified, web-based tool. Phoenix enhances thecapture, reporting and analysis of operational risk data by enablingrisk identification, measurement, monitoring, reporting and analysisto be done in an integrated manner, thereby enabling efficiencies inthe Firm’s monitoring and management of its operational risk.
For purposes of identification, monitoring, reporting and analysis, theFirm categorizes operational risk events as follows:
• Client service and selection• Business practices• Fraud, theft and malice• Execution, delivery and process management• Employee disputes• Disasters and public safety• Technology and infrastructure failures
PR IVATE EQUITY R ISK MANAGEMENT
Risk managementThe Firm makes direct principal investments in private equity. The illiquid nature and long-term holding period associated with theseinvestments differentiates private equity risk from the risk of positionsheld in the trading portfolios. The Firm’s approach to managing pri-vate equity risk is consistent with the Firm’s general risk governancestructure. Controls are in place establishing target levels for total andannual investment in order to control the overall size of the portfolio.Industry and geographic concentration limits are in place and intend-
ed to ensure diversification of the portfolio. An independent valuationfunction is responsible for reviewing the appropriateness of the carryingvalues of private equity investments in accordance with relevantaccounting policies. At December 31, 2007 and 2006, the carryingvalue of the private equity businesses were $7.2 billion and $6.1 bil-lion, respectively, of which $390 million and $587 million, respectively,represented publicly traded positions. For further information on thePrivate equity portfolio, see page 60 of this Annual Report.