Embed Size (px)
Citation preview

Intact Financial Corporation(TSX: IFC)
Investor PresentationMay 2012

2
1 Pro forma AXA Canada for a full year2 Industry data source: MSA Research excluding Lloyd’s, ICBC, SGI, SAF, MPI, Genworth, IFC and AXA Canada (in 2011). All data as at the end of 20113 Combined ratio includes the market yield adjustment (MYA)4 ROEs reflect IFRS beginning in 2010. IFC's 2011 ROE is adjusted return on common shareholders' equity (AROE)
2011 Direct premiums written2
($ billions)
Canada’s leader in auto, home and business insurance
• Largest P&C insurer in Canada• $6.5 billion in direct premiums written
• #1 in BC, Alberta, Ontario, Quebec, Nova Scotia
• $11.5 billion cash and invested assets
• Proven industry consolidator
Who we are1
Scale advantage
Distinct brands
16.5% 8.3% 6.3% 6.2% 5.9%Marketshare
Aviva RSA Co-operators
Top five insurersrepresent 43.1%
of the market
TDIntact1
Premium growth
Combined ratio3
Return on equity4
3.3 pts
3.4 pts
8.2 pts
IFCoutperformance
10-year performance –IFC vs. P&C industry2
Industry outperformer
3
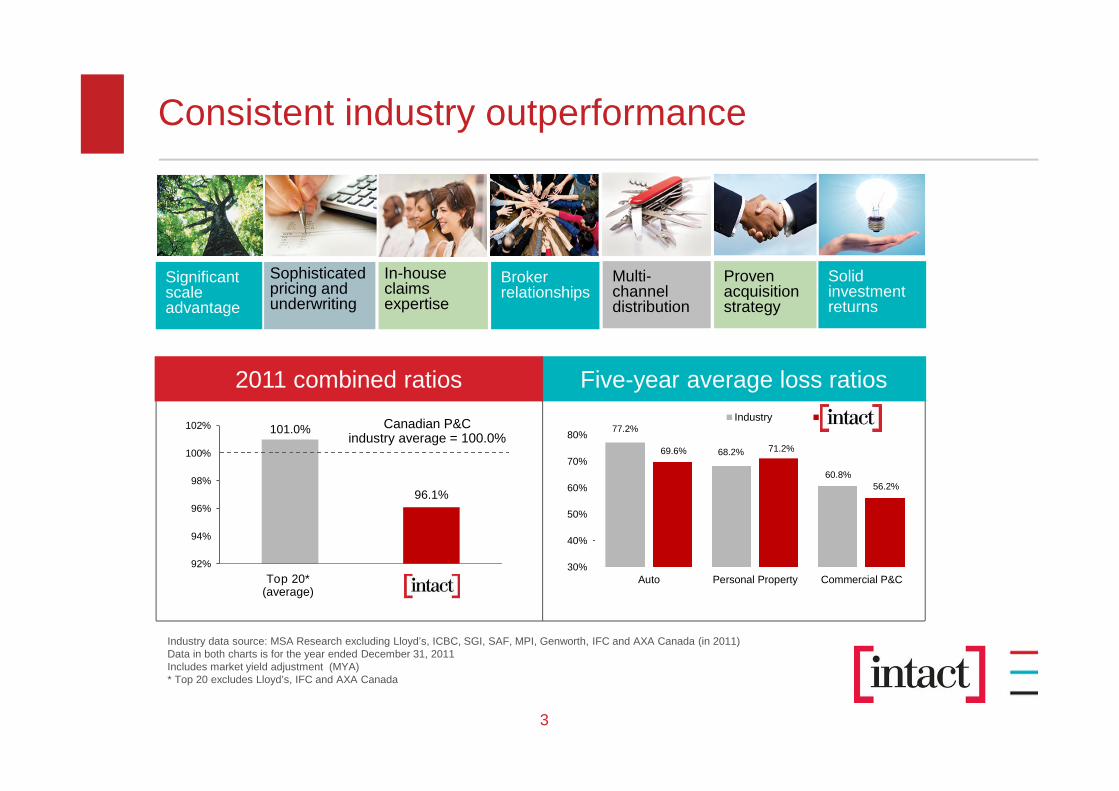
101.0%
96.1%
92%
94%
96%
98%
100%
102%
Five-year average loss ratios
Consistent industry outperformance
Industry data source: MSA Research excluding Lloyd’s, ICBC, SGI, SAF, MPI, Genworth, IFC and AXA Canada (in 2011)Data in both charts is for the year ended December 31, 2011Includes market yield adjustment (MYA)* Top 20 excludes Lloyd’s, IFC and AXA Canada
Significantscaleadvantage
Sophisticatedpricing andunderwriting
Multi-channeldistribution
Provenacquisitionstrategy
In-houseclaimsexpertise
Brokerrelationships
Top 20*(average)
Canadian P&Cindustry average = 100.0%
77.2%
68.2%
60.8%
69.6% 71.2%
56.2%
30%
40%
50%
60%
70%
80%
Auto Personal Property Commercial P&C
Industry Intact
2011 combined ratios
Solidinvestmentreturns

4
Line of Business 2010 Q1-2012
Personal Auto 50% 44%
Personal Property 24% 21%
Commercial 26% 35%
Combined Ratio 20111
IFC 96.1%
Top 20 Industry2 101.0%
Outperformance 5.0 pts
Geography 2010 Q1-2012
Ontario 46% 40%
Quebec 24% 29%
Alberta 19% 18%
Rest of Canada 11% 13%
Enhanced Business Mix
Return on Equity 20111
IFC 17.4%
Top 20 Industry2 5.6%
Outperformance 11.8 pts
Strong Capacity To Outperform
1 IFC reflects AXA Canada results for the fourth quarter of 20112 Industry data source: MSA Research excluding Lloyd’s, IFC and AXACanada
A strong base from which to build

5
Solid financial position and excess capital
$11.5 billion in cash and invested assets
• Solid financial position at Q1-2012:
– $595 million in excess capital
– Estimated MCT of 205%
– Debt-to-total-capital ratio of 19.1%
– Book value per share increased 13% from ayear earlier to $30.40
• Credit ratings - DBRS: A low, Moody’s: Baa1
• Operating return on equity of 16.2% in Q1-2012
• Pro forma the JEVCO acquisition, we estimate thatour debt-to-total-capital ratio will remain below ourtarget of 20% while our MCT will remain above 200%
High-quality investment portfolio
All figures as of March 31, 2012 unless otherwise noted
Solid balance sheet
Note: Investment mix (net of hedging positions and financialliabilities related to investments)
• 97.7% of bonds are rated A or better
• 86.5% of preferred shares are rated ‘P1’ or ‘P2’
• Minimal U.S. or European exposure
• Market-based yield of 4.0% in 2011, down 20basis points from 2010
Preferredshares, 11%
CommonShares,
10%
Cash andshort term
notes,3%
Loans,3%
Cdn. Federal24.8%
Cdn. Provincial& Municipal
34.7%
Corporate &other,40.6%
Fixed Income,73%
Column1

6
$0.34$0.37
$0.40
$0.31 $0.32
$0.1625
$0.25$0.27
-
0.05
0.10
0.15
0.20
0.25
0.30
0.35
0.40
0.45
2005 2006 2007 2008 2009 2010 2011 2012
3.2%
6.3%
8.8%
53.8%
Strategic capital management
• Strong capital base has allowed us topursue our growth objectives whilereturning capital to shareholders
8.0%
14.8%
• Dividends
• Acquisitions
• Share buybacks
Capital priorities
• 2011(1) – Repurchased 0.8 millionshares for a total of $37 million.
• 2010(2) – Repurchased 9.7 millionshares for a total of $433 million
• 2008 – Repurchased 4.6 millionshares for a total of $176 million
• 2007 – Completed a $500 millionSubstantial Issuer Bid
(1) Feb 22, 2011 – May 31, 2011 announcement of AXACanada acquisition
(2)Feb. 22, 2010 – Feb. 21, 2011
Share buyback history
Quarterly dividend
8.1%
7
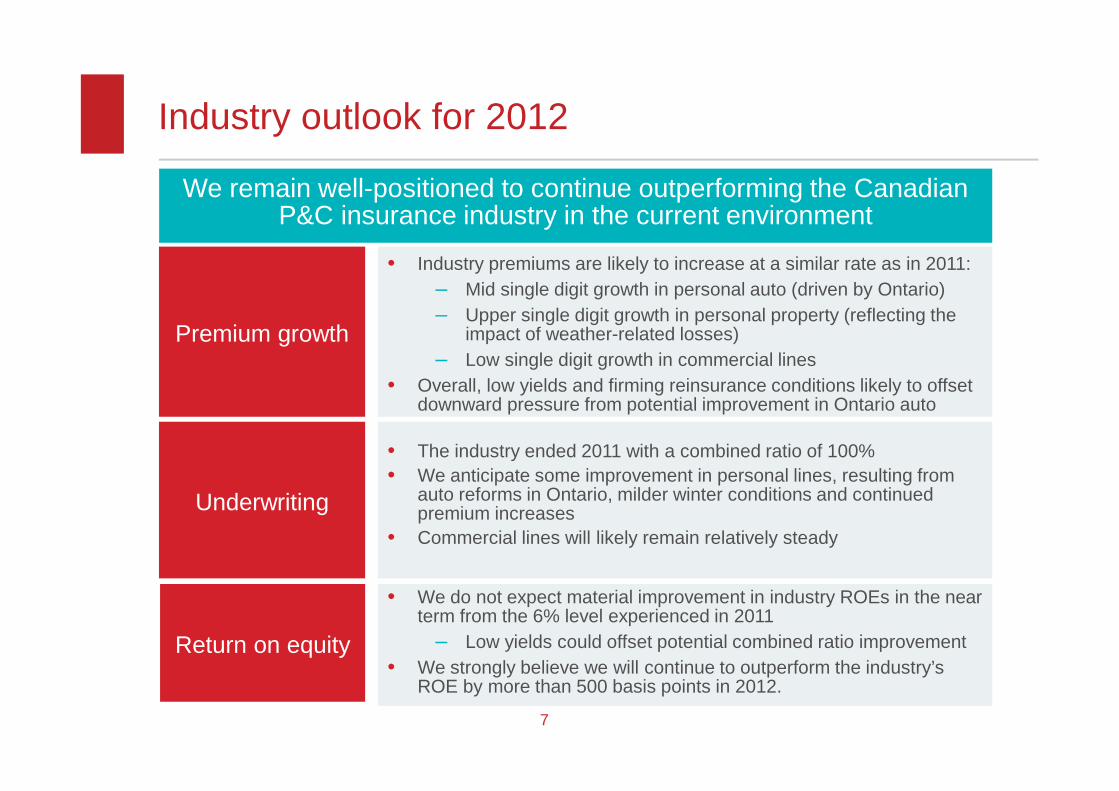
Industry outlook for 2012
Premium growth
Return on equity
• The industry ended 2011 with a combined ratio of 100%
• We anticipate some improvement in personal lines, resulting fromauto reforms in Ontario, milder winter conditions and continuedpremium increases
• Commercial lines will likely remain relatively steady
• Industry premiums are likely to increase at a similar rate as in 2011:
– Mid single digit growth in personal auto (driven by Ontario)
– Upper single digit growth in personal property (reflecting theimpact of weather-related losses)
– Low single digit growth in commercial lines
• Overall, low yields and firming reinsurance conditions likely to offsetdownward pressure from potential improvement in Ontario auto
Underwriting
• We do not expect material improvement in industry ROEs in the nearterm from the 6% level experienced in 2011
– Low yields could offset potential combined ratio improvement
• We strongly believe we will continue to outperform the industry’sROE by more than 500 basis points in 2012.
We remain well-positioned to continue outperforming the CanadianP&C insurance industry in the current environment

8
Personal lines
• Industry premiums remain inadequate in ON auto
• Home insurance premiums also on the rise
Commercial lines
• Evidence of price firming in the past 12-18 months
• Leverage acquired expertise to expand product offerand gain share in the mid-market
Firming market conditions (0-2 years)
Consolidate Canadian market (0-5 years)
Develop existing platforms (0-3 years)
Capital
• Solid financial position
Strategy
• Grow areas where IFC has a competitive advantage
Opportunities
• Global capital requirements becoming more stringent
• Industry underwriting results remain challenged
• Continued difficulties in global capital markets
Principles
• Financial guideposts: long-term customer growth,IRR>20%
• Stepped approach with limited near-term capital outlay
• Build growth pipeline with meaningful impact in 5+ years
Strategy
• Enter new market in auto insurance by leveraging ourworld-class strengths: 1) pricing and segmentation,
2) claims management and 3) online expertise
Opportunities
• Emerging or unsophisticated mature markets
• Continue to expand support toour broker partners
• Expand and grow belairdirect andGrey Power
• Build a broker offer better able tocompete with direct writers
Expand beyond existing markets (5+ years)
8
Four distinct avenues for growth

9
Summary
Disciplined pricing, underwriting, investment and capitalmanagement have positioned us well for the future
• Largest P&C insurance company in Canada
• Consistent track record of industry outperformance
• Solid financial position
• Excellent long-term earnings power
• Organic growth platforms easily expandable
• Successful progress with AXA Canada integration
• JEVCO acquisition expected to close in the fall

IFC’s acquisition of JEVCO:Continuing our journey towardsbuilding a world-class P&C insurer

11
IFC’s acquisition of JEVCO:Continuing our journey towards building a world-class P&C insurer
Strategic Fit
• Strengthens offer for brokers and customers
• Expands existing product offering:
• Recreational vehicles
• Non-standard auto
• Strengthens commercial and specialty linescapabilities
Opportunities
Financially Compelling
Financial Position
• IRR1 estimated above 20%
• Book value per share accretion estimated at 2.6%
• Accretive to NOIPS2 beginning in 2013
• Purchase price reflects a P/B multiple of 1.3x3
• Improve performance by implementing IFC's riskselection and claims management expertise
• Offer new products across IFC distribution
• Strengthen growth profile of existing products
• Attractive deployment of our excess capital
• Estimated MCT above 200% in the near term
• Debt-to-total-capital ratio estimated to remainbelow our target of 20%
1 Internal Rate of Return, based on equity returns.2 NOIPS = net operating income per share. A non-IFRS measure.3 Based on JEVCO’s book value per share as at December 31, 2011.

12
7.0
3.4
2.6 2.5 2.4 2.4
1.9 1.8 1.7
1.3
0.3
PF Intact +
AXA +
JEVCO
Aviva RSA TD
Insurance
Co-
operators
Wawanesa State Farm Desjardins Economical Northbridge JEVCO
Source: MSA Research for the 12 months ended December 31, 2011. Each insurers’ market share listed above includes all subsidiary entities consolidated under the parentcompany. Data excludes Lloyd’s, ICBC, SGI, SAF, and Genworth.
Top 10 Canadian P&C Insurance Companies by 2011 Direct Premiums Written ($ billions)
Leading position in Canadian P&C insurance
Rank 1 2 3 4 5 6 7 8 9 10 23
Share 17.0% 8.3% 6.2% 6.1% 5.9% 5.8% 4.7% 4.4% 4.2% 3.2% 0.8%

13
Personal Auto
70%
Commercial P&C
8%
Surety
8%
Other
2%
Commercial
Auto
12%
− JEVCO Insurance Company is a leading provider of specialty and niche insuranceproducts for individuals and businesses across Canada
− Insurance products are distributed through a network of independent insurancebrokers; JEVCO had approximately $350 million in direct premiums written in 2011
− JEVCO’s business lines consist of non-standard auto, recreational vehicles(motorcycles, snowmobiles, ATVs) and commercial specialty lines
Quebec
26%
Ontario
62%
Alberta
9%
Other
3%
2011 JEVCO DPW by Line of Business 2011 JEVCO DPW by Geography
Source: Westaim public disclosure and other industry data for the 12 months ended December 31, 2011.
Broadening our offer to brokers and customers
14
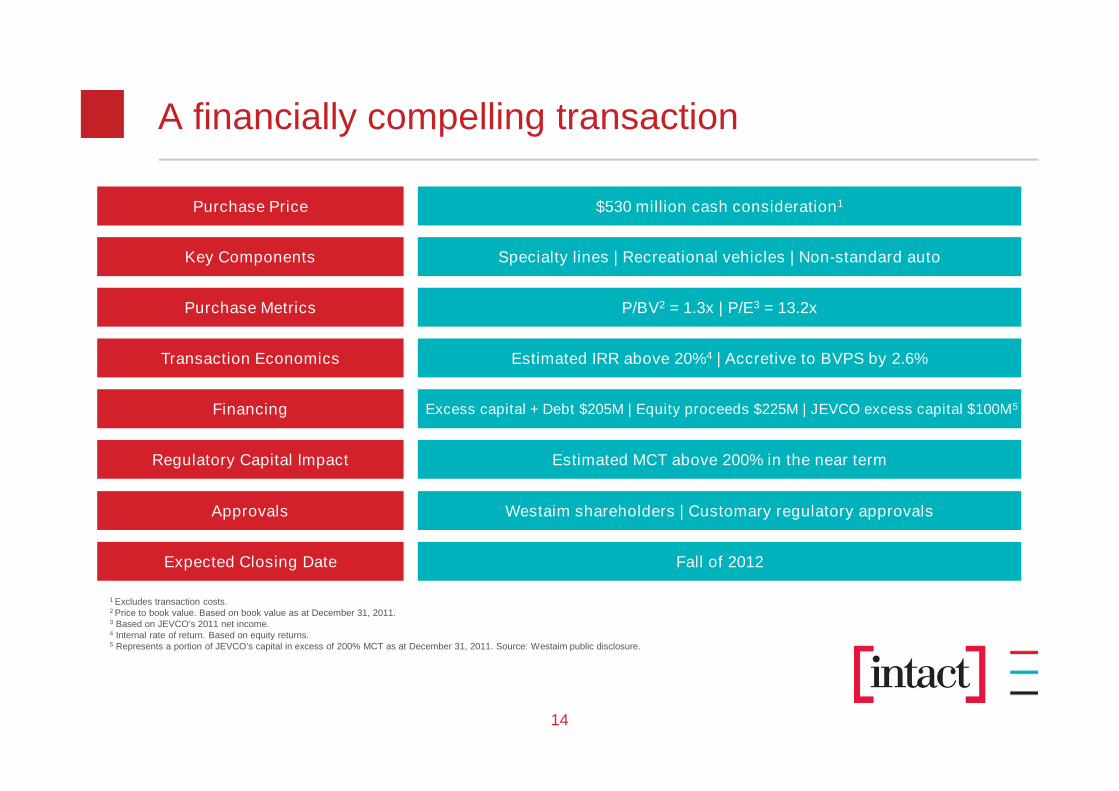
A financially compelling transaction
Purchase Price $530 million cash consideration1
Transaction Economics Estimated IRR above 20%4 | Accretive to BVPS by 2.6%
Regulatory Capital Impact Estimated MCT above 200% in the near term
Approvals Westaim shareholders | Customary regulatory approvals
Financing Excess capital + Debt $205M | Equity proceeds $225M | JEVCO excess capital $100M5
Purchase Metrics P/BV2 = 1.3x | P/E3 = 13.2x
Key Components Specialty lines | Recreational vehicles | Non-standard auto
1 Excludes transaction costs.2 Price to book value. Based on book value as at December 31, 2011.3 Based on JEVCO’s 2011 net income.4 Internal rate of return. Based on equity returns.5 Represents a portion of JEVCO’s capital in excess of 200% MCT as at December 31, 2011. Source: Westaim public disclosure.
Expected Closing Date Fall of 2012

15
IFC excess capital + debt $205 million
Equity proceeds $225 million
JEVCO excess capital $100 million
$530 million
* Represents funding structure following the close of the acquisition.
Strong financial position maintained
Ultimate Sources of Funding*
Debt-to-total-capital ratio estimated to remain below 20% upon closing of the acquisition
16
Strong strategic fit
• Strengthens offer for brokers and customers
• Expands existing product offering into complementary lines
• Strengthens commercial and specialty lines capabilities
IFC + JEVCO: Building a world-class CanadianP&C insurer
Opportunity to acquire a leading specialty and niche insurer ina financially compelling manner
• Estimated internal rate of return above 20%
• Book value per share accretion estimated at 2.6%
Strong financial position maintained• Attractive deployment of our excess capital
• Estimated MCT above 200% in the near term
• Debt-to-total-capital ratio estimated to remain below our target of 20%

Appendices

18
P&C insurance is a $40 billion market in Canada
Automobile,46.0%
Homeinsurance,
19.0%
CommercialP&C, 26.6%
Commercialother, 8.4%
Ontario, 48%
Quebec, 17%Alberta, 16%
BritishColumbia, 9%
EasternProvinces &
Territories, 7%
Prairies, 3%
3% of GDP in Canada Industry DPW by line of business
Industry – premiums by province
• Fragmented market1:
Top five represent 43%, versus bank/lifecomarkets which are closer to 65-75%
IFC is largest player with 16.5% marketshare, versus largest bank/lifeco with 22-25% market share
P&C insurance shares the same regulatoras the banks and lifecos
• Barriers to entry: scale, regulation,manufacturing capability, market knowledge
• Home and commercial insurance ratesunregulated; personal auto rates regulated insome provinces
• Capital is regulated nationally by OSFI
• Brokers continue to own commercial lines anda large share of personal lines in Canada;direct-to-consumer channel is growing(distribution = brokers 67% and direct 33%)
• 30-year return on equity for the industry isapproximately 10%
1 Pro forma IFC’s acquisition of AXA Canada and JEVCOIndustry data source: MSA Research excluding Lloyd’s, ICBC, SAF, SGI, MPI and Genworth.OSFI = Office of the Superintendent of Financial Institutions CanadaData as at the end of 2010.
18

19
0%
10%
20%
30%
40%
P&C industry 10-year performance versus IFC
85%
90%
95%
100%
105%
110%
100
120
140
160
180
200
220
240
IFC’s competitive advantages
1Industry data source: MSA Research. excluded Lloyd’s, ICBC, SGI, SAF, MPI, Genworth, IFC and AXA Canada (in 2011)2ROEs reflect IFRS beginning in 2010. IFC’s 2011 ROE is adjusted return on common shareholders’ equity (AROE)
Combined ratio
Direct premiums written growth
• Significant scale advantage
• Sophisticated pricing and underwritingdiscipline
• In-house claims expertise
• Broker relationships
• Solid investment returns
• Strong organic growth potential
Return on equity
Industry1
10-year avg.= 10.2%
10-year avg.= 18.5%2
10-year avg.= 9.3%
Industry1
10-year avg.= 6.0%
Industry1 10-yearavg. = 98.0%
10-year avg.= 94.6%
Year 2001 = base 100
19

20
0%
2%
4%
6%
8%
10%
12%
14%
1989 1991 1993 1995 1997 1999 2001 2003 2005 2007 2009 2011
P&C Industryprofitability3-5 year
Government ofCanada bondyield
Source: Insurance Bureau of Canada
$3.0B
$3.5B
$4.0B
$4.5B
$5.0B
$5.5B
$6.0B
2009 2010 2011
Impact on Industry from Low Yields
Ontario Auto Industry Results
Reinsurance
Industry Capital Levels
20
• Major catastrophes in the world in 2011 haveimpacted reinsurer’s capital levels
• The Canadian industry one of the mostconservative markets in the world in terms ofearthquake coverage required by regulators
• IFC’s B.C. earthquake exposure increaseddue to the acquisition of AXA Canada
0%
5%
10%
15%
20%
25%
30%
0%
20%
40%
60%
80%
100%
120%
2008 2009 2010 2011
Loss ratio Cumulative rate increase
Excess capital above 200% MCT
Near-term themes to monitor

21
1.6
3.13.4 3.5
3.9 4.0 4.1 4.2 4.3
6.5
0.0
1.0
2.0
3.0
4.0
5.0
6.0
7.0
0
5
10
15
20
25
30
35
40
45
50 Industry
Canadianpublic (excl.
IFC), 7%
Foreign-owned, 30%
Non-top 20,18%
Canadianprivate, 10% IFC, 16%
Canadianmutuals, 11%
Bank-owned,8%
Top 20 P&C insurers = 82% of market
Canadian M&A environment
Environment more conducive to acquisitions nowthan in recent years:
• Industry ROEs, although slightly improved fromtrough levels of mid-2009, are well below priorpeak
• Foreign parent companies are generally in lessfavourable capital position
• Demutualization likely for P&C insurance industry
Our acquisition strategy
• Targeting large-scale acquisitions of $500 million ormore in direct premiums written
• Pursuing acquisitions in lines of business where wehave expertise
• Acquisition target IRR of 15%
• Targets:
− Bring loss ratio of acquired book of business toour average loss ratio within 18 to 24 months
− Bring expense ratio to 2 pts below IFC ratio
Source: MSA Research; excluding Lloyd’s and Genworth (based on 2011 DPW )
($B)
Our track record of acquisitions
Source: MSA Research; excluding Lloyd’s and Genworth (based on 2010 DPW); IFC’s 2010 DPW includes AXA Canada
($B)
Further industry consolidation ahead
2011 – AXA ($2,600 mil.)2004 – Allianz ($600 mil.)2001 – Zurich ($510 mil.)1999 – Pafco ($40 mil.)1998 – Guardian ($630 mil.)1997 – Canadian Surety ($30 mil.)1995 – Wellington ($370 mil.)
22
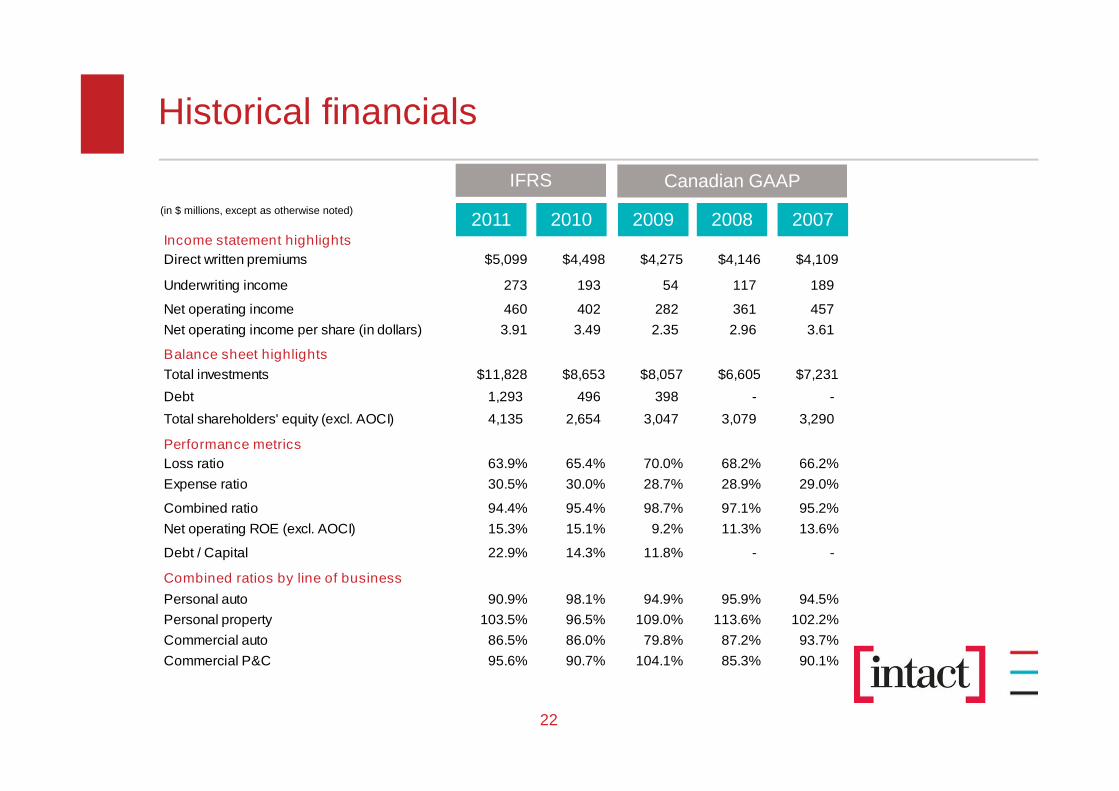
Historical financials
Income statement highlights
Direct written premiums $5,099 $4,498 $4,275 $4,146 $4,109
Underwriting income 273 193 54 117 189
Net operating income 460 402 282 361 457
Net operating income per share (in dollars) 3.91 3.49 2.35 2.96 3.61
Balance sheet highlights
Total investments $11,828 $8,653 $8,057 $6,605 $7,231
Debt 1,293 496 398 - -
Total shareholders' equity (excl. AOCI) 4,135 2,654 3,047 3,079 3,290
Performance metrics
Loss ratio 63.9% 65.4% 70.0% 68.2% 66.2%
Expense ratio 30.5% 30.0% 28.7% 28.9% 29.0%
Combined ratio 94.4% 95.4% 98.7% 97.1% 95.2%
Net operating ROE (excl. AOCI) 15.3% 15.1% 9.2% 11.3% 13.6%
Debt / Capital 22.9% 14.3% 11.8% - -
Combined ratios by line of business
Personal auto 90.9% 98.1% 94.9% 95.9% 94.5%
Personal property 103.5% 96.5% 109.0% 113.6% 102.2%
Commercial auto 86.5% 86.0% 79.8% 87.2% 93.7%
Commercial P&C 95.6% 90.7% 104.1% 85.3% 90.1%
2010 2009 2008 20072011
IFRS Canadian GAAP
(in $ millions, except as otherwise noted)

23
Asset class
Quality:
Approx. 86.5% rated P1 or P2
CorporateFederal government and agencyCdn. Provincial and municipalSupranational and foreignABS/MBSPrivate placementsTOTAL
High-quality, dividend payingCanadian companies. Objective is tocapture non-taxable dividend income
Fixed income
Quality: 97.7% of bonds rated A or better
32.6%24.8%34.7%4.9%3.1%0.0%100%
Perpetual and callable floatingand resetFixed perpetualFixed callableTOTAL
63.3%
23.5%13.1%100%
100%Canadian
CanadianUnited StatesInt’l (excl. U.S.)TOTAL
91%1%7%
100%
Cash and invested assets
As of March 31, 2012
Preferred shares
Common shares
100%Canadian

24
Long-term track record of prudent reserving practices
3.3%
7.9%
4.9%
2.9%
4.0%
3.2%
4.8% 4.9%
0%
1%
2%
3%
4%
5%
6%
7%
8%
9%
2004 2005 2006 2007 2008 2009 2010 2011
Rate of claims reserve development(favourable prior year development as a % of opening reserves)
Historical long-term averagehas been 3% to 4% per year
• Quarterly and annualfluctuations in reservedevelopment are normal
• 2005/2006 reservedevelopment was unusuallyhigh due to the favourableeffects of certain autoinsurance reforms introducedduring that time period
• This reflects our preference totake a conservative approachto managing claims reserves

25
Investor Relations contact information
Dennis Westfall, CFA
Vice President, Investor Relations
Phone: 416.341.1464 ext 45122 Cell: 416.797.7828
Email: [email protected]
Email: [email protected]
Phone: 416.941.5336 or 1.866.778.0774 (toll-free within North America)
Fax: 416.941.0006
www.intactfc.com/Investor Relations

26
Forward looking statements and disclaimer
Certain of the statements included in this Presentation about IFC’s current and future plans, expectations and intentions, results, levels of activity,performance, goals or achievements or any other future events or developments constitute forward-looking statements. The words “may”, “will”, “would”,“should”, “could”, “expects”, “plans”, “intends”, “trends”, “indications”, “anticipates”, “believes”, “estimates”, “predicts”, “likely”, “potential” or the negative orother variations of these words or other similar or comparable words or phrases, are intended to identify forward-looking statements. Forward-lookingstatements are based on estimates and assumptions made by management in light of our experience and perception of historical trends, currentconditions and expected future developments, as well as other factors that management believes are appropriate in the circumstances. Many factors couldcause IFC’s actual results, performance or achievements or future events or developments to differ materially from those expressed or implied by theforward-looking statements, including, without limitation, the following factors: IFC’s ability to implement its strategy or operate its business asmanagement currently expects; its ability to accurately assess the risks associated with the insurance policies that IFC insurance subsidiaries write;unfavourable capital market developments or other factors which may affect IFC’s investments and funding obligations under its pension plans; the cyclicalnature of the property and casualty insurance industry; management’s ability to accurately predict future claims frequency; government regulationsdesigned to protect policyholders and creditors rather than investors; litigation and regulatory actions; periodic negative publicity regarding the insuranceindustry; intense competition; IFC’s reliance on brokers and third parties to sell its products to clients; IFC’s ability to successfully pursue its acquisitionstrategy; IFC’s ability to execute its business strategy; the terms and conditions of, and regulatory approvals relating to, the acquisition of JEVCOInsurance Company (“Acquisition”); timing for completion of the Acquisition; synergies arising from, and IFC’s integration plans relating to the Acquisition;management’s estimates and expectations in relation to resulting accretion, net operating income per share, internal rate of return, return on equity, MCT,debt to capital position and other metrics used herein in relation to our discussion of the Acquisition; IFC’s financing plans for the Acquisition; various otheractions to be taken or requirements to be met in connection with the Acquisition; IFC’s participation in the Facility Association (a mandatory poolingarrangement among all industry participants) and similar mandated risk-sharing pools; terrorist attacks and ensuing events; the occurrence of catastrophicevents; IFC’s ability to maintain its financial strength and issuer credit ratings; IFC’s ability to alleviate risk through reinsurance; IFC’s ability to successfullymanage credit risk (including credit risk related to the financial health of reinsurers); IFC’s reliance on information technology and telecommunicationssystems; IFC’s dependence on key employees; general economic, financial and political conditions; IFC’s dependence on the results of operations of itssubsidiaries; the volatility of the stock market and other factors affecting IFC’s share price; and future sales of a substantial number of its common shares.These factors are not intended to represent a complete list of the factors that could affect us. These factors should, however, be considered carefully. Allof the forward-looking statements included herein are qualified by these cautionary statements. Although the forward-looking statements are based uponwhat management believes to be reasonable assumptions, IFC cannot assure investors that actual results will be consistent with these forward-lookingstatements. When relying on forward-looking statements to make decisions, investors should ensure the preceding information is carefully considered.Such forward-looking statements are made as of May 1, 2012. Undue reliance should not be placed on forward-looking statements made herein. IFC andmanagement have no intention and undertake no obligation to update or revise any forward-looking statements, whether as a result of new information,future events or otherwise, except as required by law.
27
Forward looking statements and disclaimer
Disclaimer
This Presentation does not constitute or form part of any offer for sale or solicitation of any offer to buy or subscribe for any securities nor shall it or anypart of it form the basis of or be relied on in connection with, or act as any inducement to enter into, any contract or commitment whatsoever.
The information contained in this Presentation concerning Intact Financial Corporation, its subsidiaries and affiliated companies (collectively, the “Intact”)does not purport to be all-inclusive or to contain all the information that a prospective purchaser or investor may desire to have in evaluating whether or notto make an investment in Intact. The information is qualified entirely by reference to Intact’s publicly disclosed information.
No representation or warranty, express or implied, is made or given by or on behalf of Intact or any of the directors, officers or employees of any suchentities as to the accuracy, completeness or fairness of the information or opinions contained in this Presentation and no responsibility or liability isaccepted by any person for such information or opinions. In furnishing this Presentation, Intact does not undertake or agree to any obligation to provide theattendees with access to any additional information or to update this Presentation or to correct any inaccuracies in, or omissions from, this Presentationthat may become apparent. The information and opinions contained in this Presentation are provided as at the date of this Presentation. The contents ofthis Presentation are not to be construed as legal, financial or tax advice. Each prospective purchaser should contact his, her or its own legal adviser,independent financial adviser or tax adviser for legal, financial or tax advice.
The Company uses both International Financial Reporting Standards (“IFRS”) and certain non-IFRS measures to assess performance. Non-IFRSmeasures do not have any standardized meaning prescribed by IFRS and are unlikely to be comparable to any similar measures presented by othercompanies. Management of Intact Financial Corporation analyzes performance based on underwriting ratios such as combined, general expenses andclaims ratios as well as other performance measures such as return on equity (“ROE”) and operating return on equity. These measures and otherinsurance related terms are defined in the Company’s glossary available on the Intact Financial Corporation web site at www.intactfc.com in the “InvestorRelations” section. Additional information about Intact Financial Corporation, including the Annual Information Form, may be found online on SEDAR atwww.sedar.com.