Embed Size (px)
Citation preview
22016 Midyear Outlook Eyes on the Horizon
A Letter to Investors from Darrell CronkWe’ve been through a lot in the first half of 2016. We began January with the worst start to a calendar year in history for domestic equities. Concerns about China’s growth rate, slowing U.S. growth, and a new downturn in oil prices had many questioning the viability of the recovery and an aging bull market.
A climax of negative sentiment finally arrived in February only to see markets fully recover in April and May to levels approaching 2015 highs. We also celebrated the seven-year anniversary of the current U.S. equity bull market in March, and by the end of April, we found ourselves in the second longest bull market in history, surpassed only by the bull market from 1987 to 2000.
Let’s reflect on the five major changes we anticipated in our 2016 Outlook with an eye toward what we expect between now and year-end. We believe the five changes we discussed in our December report are as relevant today as they were then.
The first two changes, Changing Consumer Behavior and Change in the Political Landscape, are exactly where we expected them to be at midyear. Consumer spending remains the bulwark of U.S. and global economic growth. Despite a tepid start, spending is now accelerating at midyear as consumers benefit from lower energy prices and improved labor markets. We believe that the consumer is poised to increase spending even more in the second half of this year.
Separately, this election year is shaping up to be one of the more important in recent memory as all three branches of government (executive, legislative, and judicial) remain in flux. Divergent views, Washington gridlock, and important progress needed on key policy issues mean that investors will need to remain vigilant in understanding evolving political agendas and their implications for financial markets. Later in this report, we outline key factors about this election for investors to watch.
Last December, we also highlighted a continuing Shift in Monetary Policy. We had expected the Federal Reserve (Fed) to moderate its guidance for interest-rate hikes, and we forecast that other major central banks’ easing policy initiatives would widen the global interest-rate differentials. That is exactly what has transpired during the first half of this year as tepid growth and global instability led the Fed and the markets to downshift their interest-rate expectations closer to our outlook during the first quarter of 2016. Simultaneously, the Bank of Japan and European Central Bank continued down their paths of easing monetary policy.
Investment and Insurance Products: NOT FDIC Insured NO Bank Guarantee MAY Lose Value
32016 Midyear Outlook Eyes on the Horizon
Global Economic Transition continues to evolve at a rapid pace. Admittedly, global growth has remained underwhelming during the first half of 2016, consistent with the trend of this entire economic recovery dating back to 2009. However, it is important to note the resiliency of global growth at just over 3 percent for the past four years, even as it has weathered sizable shocks from intense currency movements, the second largest decline in oil prices in modern history beginning in mid-2014, and a long-standing extensive decline in emerging-market growth rates.
We expected Growing Uncertainty in 2016 and made recommendations to seek to benefit from it. One of our recommendations was to add high-yield bonds to our fixed-income allocations in an attempt to take advantage of the Fed remaining on hold during the first half of the year. We have continued to reduce our overall equity exposure within asset classes that traditionally have higher volatility and challenged fundamentals, like small-cap equities and emerging markets, while still favoring U.S. large-cap equities. In our opinion, heightened volatility and largely sideways movements in major equity and fixed-income indices during the first half of the year make it even more important for qualified investors to utilize alternative investment strategies such as hedge fund or private capital opportunities focused on unlocking value and complementing asset allocation in portfolios.
We expect many of the headwinds blunting progress early this year to turn and become tailwinds in the second half. We see a steadying U.S. dollar as favorable once again for profits, and expect the stabilization of energy prices to lift the weight on corporate earnings we observed during prior quarters. We also see consumers in a very healthy position and expect spending to accelerate in the second half of 2016. Despite those tailwinds, we expect volatility. Upcoming elections, both domestic and abroad; questions about future monetary policy; and the need for new sources of fuel for economic growth will create plenty of uncertainty during the second half of 2016. That means we’re more likely to experience a bumpy ride than smooth sailing—so keep your eyes on the horizon.
Darrell Cronk, CFA®President, Wells Fargo Investment InstituteChief Investment Officer, Wealth and Investment Management
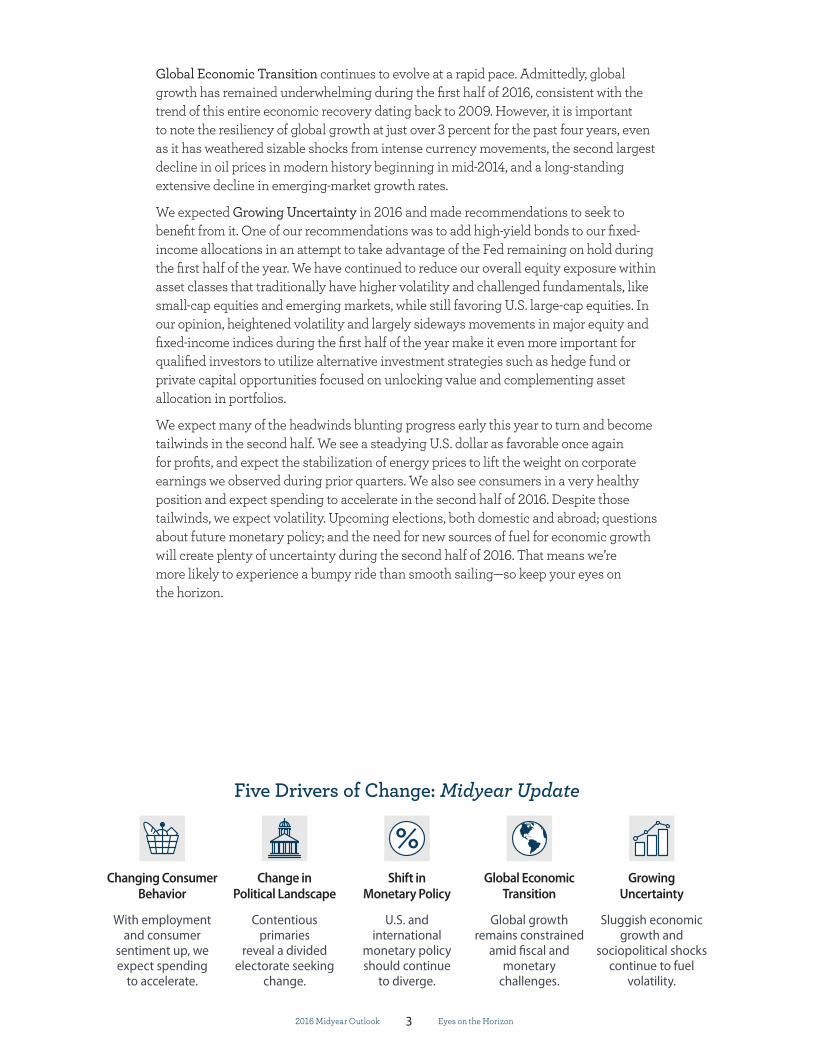
Five Drivers of Change: Midyear Update
Changing Consumer Behavior
With employment and consumer
sentiment up, we expect spending
to accelerate.
Change in Political Landscape
Contentious primaries
reveal a divided electorate seeking
change.
Shift in Monetary Policy
U.S. and international
monetary policy should continue
to diverge.
Global Economic Transition
Global growth remains constrained
amid fiscal and monetary
challenges.
Growing Uncertainty
Sluggish economic growth and
sociopolitical shocks continue to fuel
volatility.
42016 Midyear Outlook Eyes on the Horizon
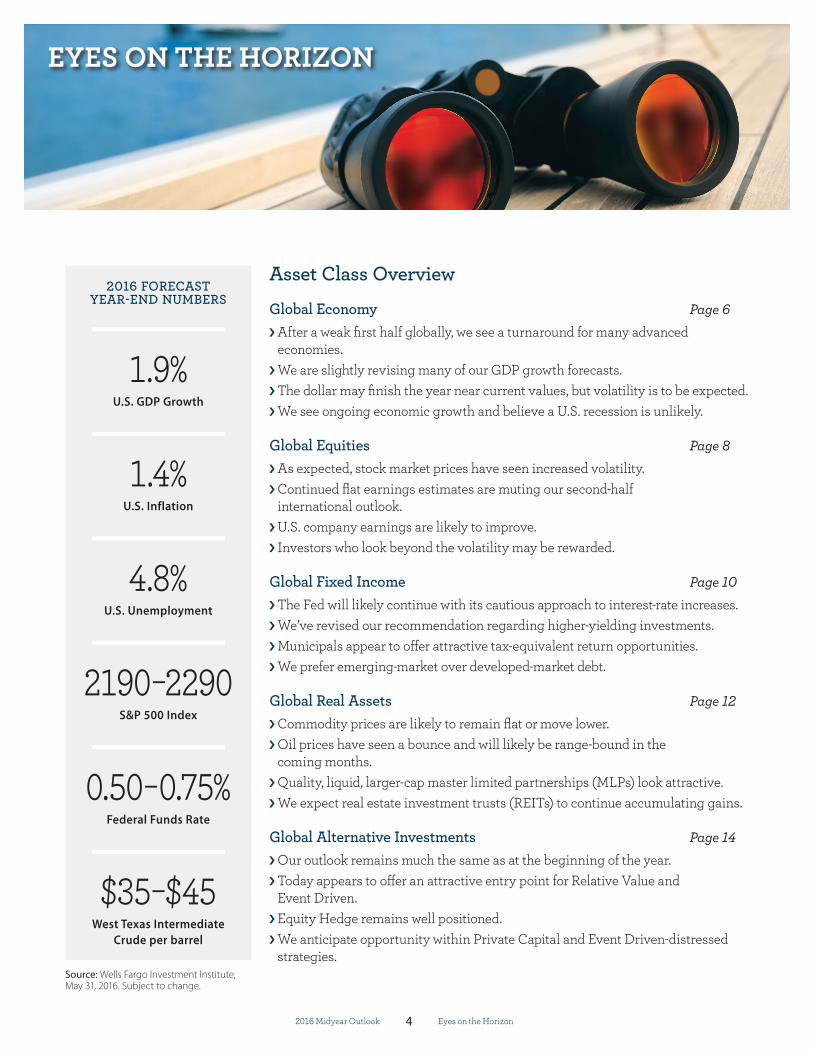
EYES ON THE HORIZON
Asset Class OverviewGlobal Economy Page 6 After a weak first half globally, we see a turnaround for many advanced economies. We are slightly revising many of our GDP growth forecasts. The dollar may finish the year near current values, but volatility is to be expected. We see ongoing economic growth and believe a U.S. recession is unlikely.
Global Equities Page 8 As expected, stock market prices have seen increased volatility. Continued flat earnings estimates are muting our second-half international outlook. U.S. company earnings are likely to improve. Investors who look beyond the volatility may be rewarded.
Global Fixed Income Page 10 The Fed will likely continue with its cautious approach to interest-rate increases. We’ve revised our recommendation regarding higher-yielding investments. Municipals appear to offer attractive tax-equivalent return opportunities. We prefer emerging-market over developed-market debt.
Global Real Assets Page 12 Commodity prices are likely to remain flat or move lower. Oil prices have seen a bounce and will likely be range-bound in the coming months. Quality, liquid, larger-cap master limited partnerships (MLPs) look attractive. We expect real estate investment trusts (REITs) to continue accumulating gains.
Global Alternative Investments Page 14 Our outlook remains much the same as at the beginning of the year. Today appears to offer an attractive entry point for Relative Value and Event Driven. Equity Hedge remains well positioned. We anticipate opportunity within Private Capital and Event Driven-distressed strategies.
2016 FORECAST YEAR-END NUMBERS
1.9%U.S. GDP Growth
1.4%U.S. Inflation
4.8%U.S. Unemployment
2190−2290S&P 500 Index
0.50−0.75%Federal Funds Rate
$35−$45West Texas Intermediate
Crude per barrel
Source: Wells Fargo Investment Institute, May 31, 2016. Subject to change.
52016 Midyear Outlook Eyes on the Horizon
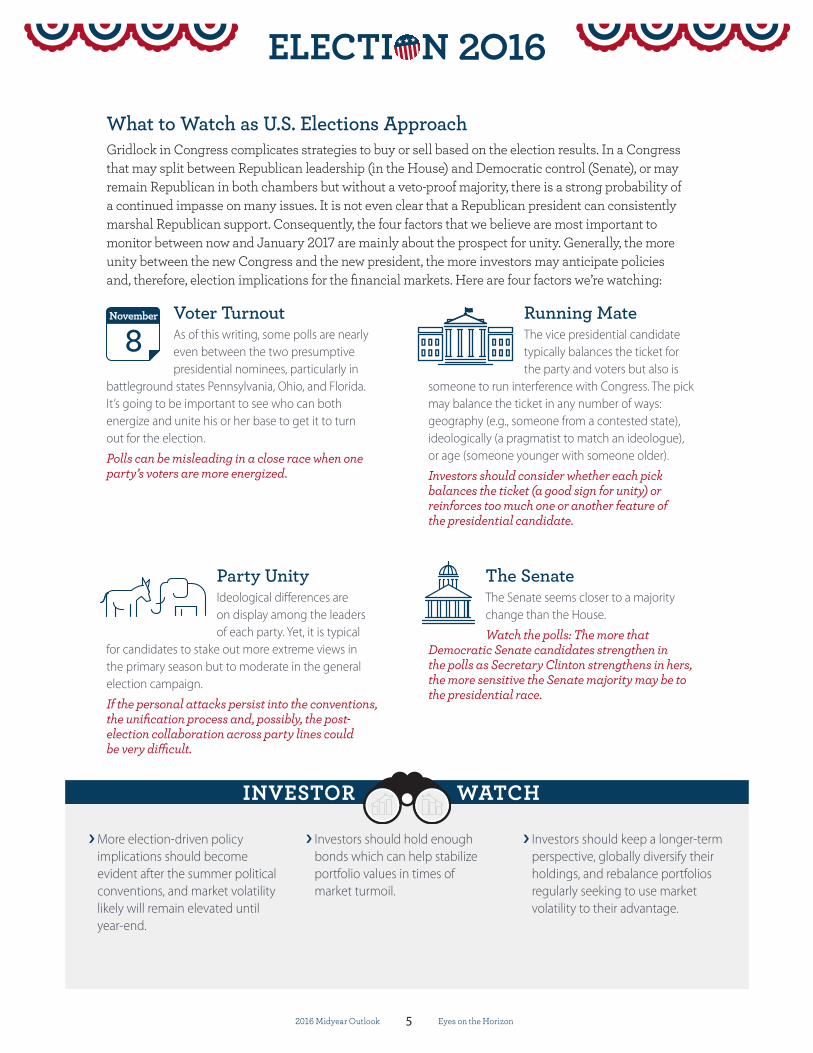
What to Watch as U.S. Elections ApproachGridlock in Congress complicates strategies to buy or sell based on the election results. In a Congress that may split between Republican leadership (in the House) and Democratic control (Senate), or may remain Republican in both chambers but without a veto-proof majority, there is a strong probability of a continued impasse on many issues. It is not even clear that a Republican president can consistently marshal Republican support. Consequently, the four factors that we believe are most important to monitor between now and January 2017 are mainly about the prospect for unity. Generally, the more unity between the new Congress and the new president, the more investors may anticipate policies and, therefore, election implications for the financial markets. Here are four factors we’re watching:
Voter TurnoutAs of this writing, some polls are nearly even between the two presumptive presidential nominees, particularly in
battleground states Pennsylvania, Ohio, and Florida. It’s going to be important to see who can both energize and unite his or her base to get it to turn out for the election.
Polls can be misleading in a close race when one party’s voters are more energized.
Running MateThe vice presidential candidate typically balances the ticket for the party and voters but also is
someone to run interference with Congress. The pick may balance the ticket in any number of ways: geography (e.g., someone from a contested state), ideologically (a pragmatist to match an ideologue), or age (someone younger with someone older).
Investors should consider whether each pick balances the ticket (a good sign for unity) or reinforces too much one or another feature of the presidential candidate.
Party UnityIdeological differences are on display among the leaders of each party. Yet, it is typical
for candidates to stake out more extreme views in the primary season but to moderate in the general election campaign.
If the personal attacks persist into the conventions, the unification process and, possibly, the post-election collaboration across party lines could be very difficult.
The SenateThe Senate seems closer to a majority change than the House.
Watch the polls: The more that Democratic Senate candidates strengthen in the polls as Secretary Clinton strengthens in hers, the more sensitive the Senate majority may be to the presidential race.
INVESTOR WATCH
More election-driven policy implications should become evident after the summer political conventions, and market volatility likely will remain elevated until year-end.
Investors should hold enough bonds which can help stabilize portfolio values in times of market turmoil.
Investors should keep a longer-term perspective, globally diversify their holdings, and rebalance portfolios regularly seeking to use market volatility to their advantage.
8November
62016 Midyear Outlook Eyes on the Horizon
GLOBAL ECONOMY
SLOW GROWTHPaul Christopher, CFA®Head Global Market Strategist
Improvement Following a Difficult First QuarterFalling oil prices and global trade plus China’s economic slowdown headlined investor concerns for the three quarters that ended in March 2016. However, we see the economic impact of these factors waning since early in the second quarter: Oil prices have stabilized, and we expect U.S. prices (measured by prices of West Texas Intermediate Crude) to finish 2016 in the $35-$45 per barrel range. Global trade contracted sharply in January but stabilized in the following three months for the U.S., Eurozone, Japanese, and Chinese economies. China’s government has injected economic stimulus, mostly through construction and infrastructure spending, which appears to have steadied economic growth.
The first quarter proved weaker than we estimated in February, and we are revising our U.S. and some international economic growth forecasts lower as a result. However, we already see signs that the drivers of the first quarter’s weakness are dissipating, and we anticipate better performance for the U.S., the Eurozone, and developed Asian economies, including Japan, in the second half. The expected improvement makes our downward revisions small, and we expect markets to respond positively to this development as the year progresses. Our largest downgrades are for emerging economies in Brazil and Mexico, which are both commodity producers and may not enjoy a second-half improvement while commodity prices remain volatile.
We Are Lowering Many of Our Growth ForecastsGDP Growth Forecasts
Feb. ‘16 LatestAdvanced Economies 1.93% 1.72%Developing Economies 4.24% 4.10%World 3.26% 3.10%
Selected Countries Feb. ‘16 LatestUnited States 2.1% 1.9%United Kingdom 2.2% 2.2%Eurozone 1.8% 1.6%Japan 1.0% 0.5%Brazil -2.5% -3.5%Mexico 3.0% 2.6%China 6.2% 6.2%India 7.2% 7.4%
Sources: IMF, Bloomberg, and Wells Fargo Investment Institute, May 2016. Subject to change.
72016 Midyear Outlook Eyes on the Horizon
Global inflation pressures remain subdued along with global growth and commodity prices. Inflation trends are rising from a near-zero pace to more historically typical levels in some developed economies, including the U.S., but the normalization is slow, especially in Europe and Japan. Inflation risks in emerging economies have been more balanced—lower commodity prices and weak trade have offset higher pricing pressures via accumulated currency depreciation since 2014.
U.S. Dollar Appreciation on Hold for a While LongerThe U.S. dollar weakened in the first quarter, reflecting a changing global monetary policy environment. Despite negative interest rates across Japan and parts of Europe, the dollar’s recent reversal lower seems to acknowledge the sentiment that extraordinary monetary stimulus now faces much stronger headwinds than it did previously from low oil prices, contracting global trade, and weak China growth. As the dollar turned lower, many emerging-market currencies reversed higher from deeply pessimistic valuations, but these same factors may limit their further gains. Considering the muted influence of monetary policy, we think the dollar could finish the year close to current values but may swing significantly higher and lower in the meantime.
Furthermore, some major risk events—new and closely watched elections in Europe and the U.S. and potentially another summer cash crisis in Greece—could cause sharp dollar moves higher or lower. Recent short-term monetary policy impotence and upcoming event risks do not suggest a quick resumption of dollar strength but also may fail to sustain a dollar downtrend.
Main Risks to Our OutlookOne principal risk to our economic and dollar outlook is that a new swoon in oil prices or trade, or new Chinese economic stress, may undermine the faster second-half economic pace we expect in the U.S., Europe, and developed Asia. For perspective, we see ongoing economic growth and put the probability of a U.S. recession at no more than 25 percent this year.
What is our forecast for the U.S. dollar?
We believe the U.S. dollar’s key exchange values will
finish the year close to their mid-May levels, between
$1.10-$1.14 per euro and ¥107–¥113 yen per dollar.
What impact can a rising or falling dollar
have on investors?Strong gains in the dollar tend to come when the
U.S. economy is stronger than those abroad. This favors U.S. markets and allocations. Conversely,
falling dollar values against key currencies suggest
international economies are improving and tend to benefit international
allocations.
INVESTOR WATCH
Even if oil prices, China, and trade do not relapse, pessimism and sentiment swings may accompany market-unfriendly political news. While the global economy is gradually gaining pace, growth is still in low gear and sentiment remains potentially vulnerable.
A neutral view on currencies and ultra-low yields does not justify adding international developed-market sovereign debt exposure at this time, and we reiterate our advice to hold less than target allocations.
The outlook is for global improvement with volatility. To reduce the potential impact, stay well-diversified.
82016 Midyear Outlook Eyes on the Horizon
GLOBAL EQUITIES
VOLATILITY TO CONTINUE
Stuart Freeman, CFA®Co-Head of Global Equity Strategy
Sean Lynch, CFA®Co-Head of Global Equity Strategy
Scott WrenSenior Global Equity Strategist
More Stormy Seas Are Probably AheadDuring the past 12 months, investors have experienced volatility not seen during the first years of the economic recovery, resulting, in part, from concerns over China’s economic growth rate and currency, questions surrounding global growth and the Fed’s attitude toward tightening, along with crude oil’s negative impact on energy-sector earnings. Since July 2015, we’ve seen a 12 percent decline in the S&P 500 Index, a 13 percent rebound, a 13 percent defensive decline, and another 14 percent cyclical rebound since February. International developed- and emerging-market movements followed similar patterns.
We should not be terribly surprised by higher levels of global stock market volatility; we have been calling for more. The world generally is struggling to sustain economic improvement. The U.S. has been more consistent but is experiencing more noticeable equity-market swings.
Fundamentals Are Less Constructive for International MarketsContinued flat earnings estimates create a muted second-half international outlook. Slow economic growth should further limit aggressively stimulative monetary policy in Europe and Japan. Among emerging markets, economic reform and restructuring remain the main themes. While valuation remains near historical averages, slowing
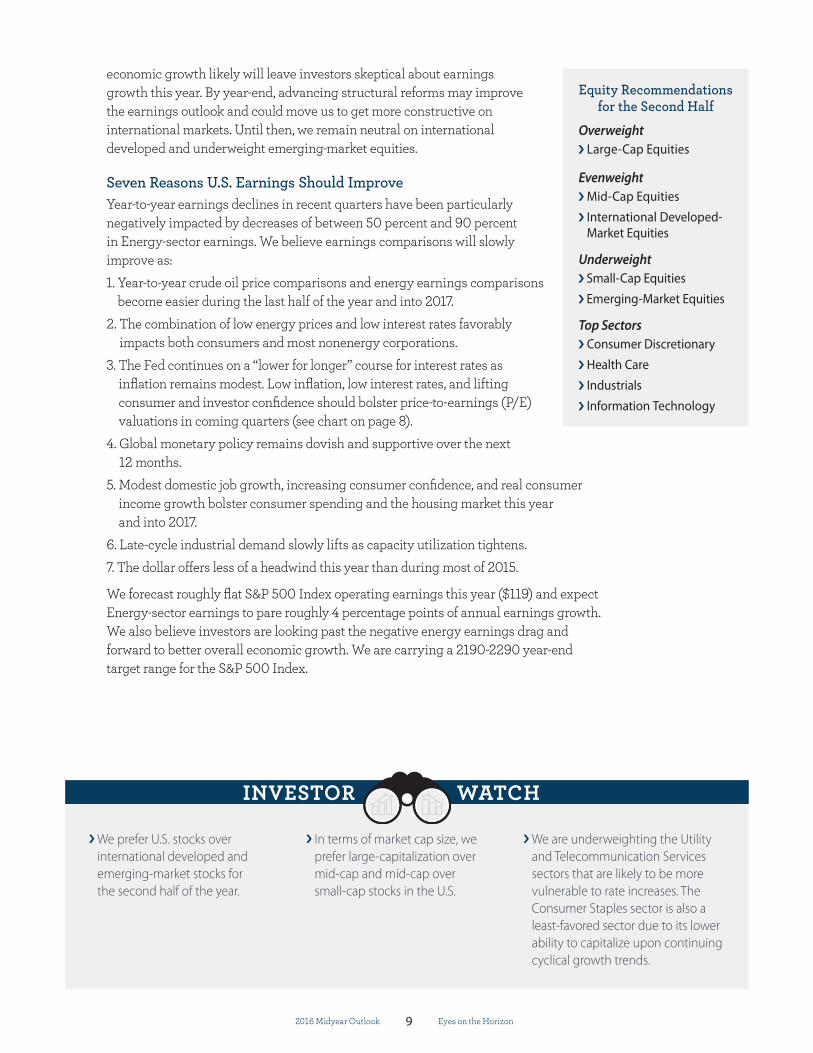
Stock Prices Appear Reasonable
’97 ’98 ’99 ’00 ’01 ’02 ’03 ’04 ’05 ’06 ’07 ’08 ’09 ’10 ’11 ’12 ’13 ’14 ’15 ’160’96
35
30
25
20
15
10
5■ Trailing 12-Month S&P 500 Index P/E■ S&P 500 Index P/E if Trading at Average Relationship Relative to 10-Year Treasury yield, back to 1996
Equity valuations are not expensive relative
to the 10-year Treasury yield. The average
20-year relationship between the two would put the yield-adjusted
P/E multiple at 28X-29X, while it’s actually in
the 18X area and the 10-year Treasury currently is yielding
only 1.9 percent.
Sources: Baseline, Factset, and Wells Fargo Investment Institute. April 30, 2016Past performance is no guarantee of future results.
92016 Midyear Outlook Eyes on the Horizon
economic growth likely will leave investors skeptical about earnings growth this year. By year-end, advancing structural reforms may improve the earnings outlook and could move us to get more constructive on international markets. Until then, we remain neutral on international developed and underweight emerging-market equities.
Seven Reasons U.S. Earnings Should ImproveYear-to-year earnings declines in recent quarters have been particularly negatively impacted by decreases of between 50 percent and 90 percent in Energy-sector earnings. We believe earnings comparisons will slowly improve as:1. Year-to-year crude oil price comparisons and energy earnings comparisons
become easier during the last half of the year and into 2017.2. The combination of low energy prices and low interest rates favorably
impacts both consumers and most nonenergy corporations.3. The Fed continues on a “lower for longer” course for interest rates as
inflation remains modest. Low inflation, low interest rates, and lifting consumer and investor confidence should bolster price-to-earnings (P/E) valuations in coming quarters (see chart on page 8).
4. Global monetary policy remains dovish and supportive over the next 12 months.
5. Modest domestic job growth, increasing consumer confidence, and real consumer income growth bolster consumer spending and the housing market this year and into 2017.
6. Late-cycle industrial demand slowly lifts as capacity utilization tightens.7. The dollar offers less of a headwind this year than during most of 2015.
We forecast roughly flat S&P 500 Index operating earnings this year ($119) and expect Energy-sector earnings to pare roughly 4 percentage points of annual earnings growth. We also believe investors are looking past the negative energy earnings drag and forward to better overall economic growth. We are carrying a 2190-2290 year-end target range for the S&P 500 Index.
Equity Recommendations for the Second Half
Overweight Large-Cap Equities
Evenweight Mid-Cap Equities International Developed-Market Equities
Underweight Small-Cap Equities Emerging-Market Equities
Top Sectors Consumer Discretionary Health Care Industrials Information Technology
INVESTOR WATCH
We prefer U.S. stocks over international developed and emerging-market stocks for the second half of the year.
In terms of market cap size, we prefer large-capitalization over mid-cap and mid-cap over small-cap stocks in the U.S.
We are underweighting the Utility and Telecommunication Services sectors that are likely to be more vulnerable to rate increases. The Consumer Staples sector is also a least-favored sector due to its lower ability to capitalize upon continuing cyclical growth trends.
102016 Midyear Outlook Eyes on the Horizon
GLOBAL FIXED INCOME
LOWER FOR LONGERBrian Rehling, CFA®Co-Head of Global Fixed Income Strategy
George RusnakCo-Head of Global Fixed Income Strategy
Fixed-Income Volatility Likely to Pick UpWe expected a volatile year for fixed income in 2016 as investors struggled with an uncertain economic, monetary, and political outlook. The bond market experienced significant declines in rates and widening credit spreads throughout January and early February. The bond market stabilized once the S&P 500 Index reached its low on February 11, but we expect a reemergence of fixed-income volatility before the end of the year. While we expect volatility to pick up, we do not anticipate that bond yields will sustain a material move higher. We encourage investors to plan and prepare for a volatile environment, yet one in which low rates persist.
Pace of Interest-Rate Hikes Should Remain SlowWe expect just one Fed rate increase before year-end as the Federal Open Market Committee continues its cautious approach to rate increases during the second half of 2016. Regardless of the eventual timing of the next rate hike, it is important that investors continue to focus on the general path of rate increases. It should be clear that the Fed will move forward at a very gradual pace as it slowly raises interest rates. A deliberate Fed coupled with an inflationary environment that remains subdued should help support a low-rate environment. As the time frame into year-end compresses, we are tightening year-end expectations for the 10-year Treasury yield to 2.00-2.25 percent, the lower end of our previous range of 2.00-2.50 percent. Our 30-year Treasury yield target has been refined to 2.50-2.75 percent from 2.50-3.00 percent.
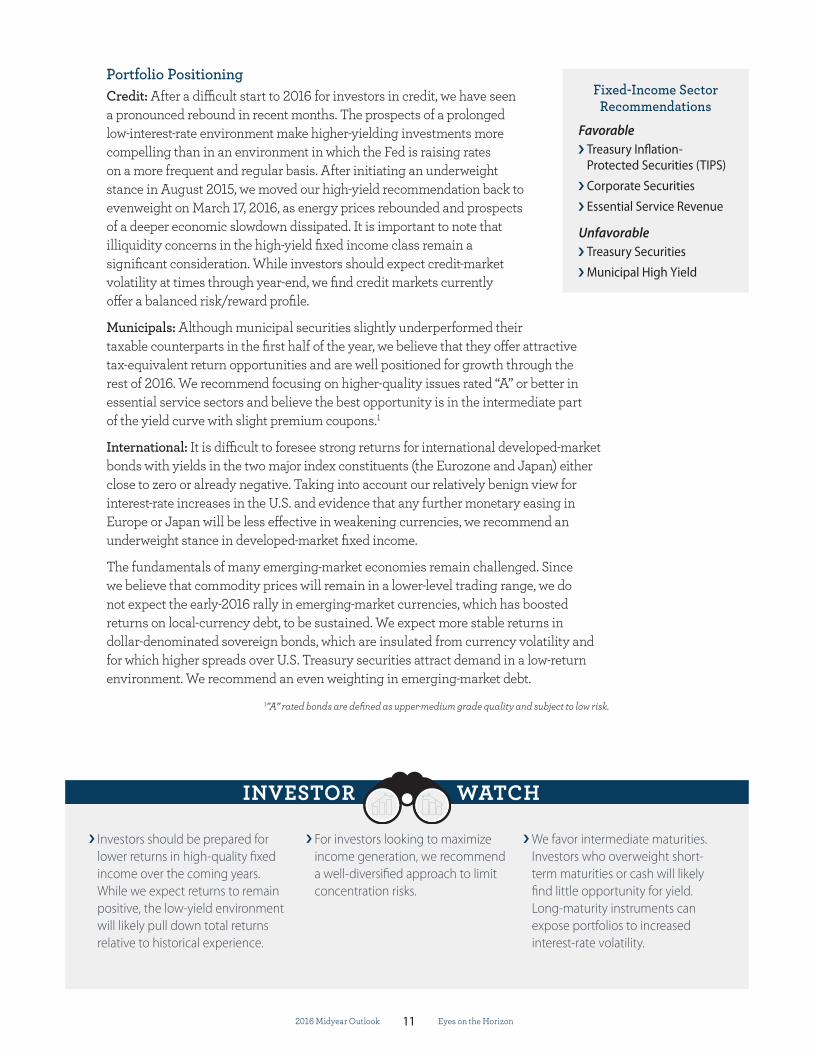
Bond Yields and Total Returns Remain Historically Low
’79 ’82 ’85 ’88 ’91 ’94 ’97 ’00 ’03 ’06 ’09 ’12 ’15-5%
’76
20%
15%
10%
5%
0%
■ Initial Yield■ Three-Year Annualized Total Return
Yields remain low and prices are unlikely
to increase, which should dampen bonds’ total
return picture.
Sources: Morningstar and Wells Fargo Investment Institute. May 2, 2016Data Sample: Monthly, January 1976 - April 2016. Past performance is no guarantee of future results.
112016 Midyear Outlook Eyes on the Horizon
Portfolio PositioningCredit: After a difficult start to 2016 for investors in credit, we have seen a pronounced rebound in recent months. The prospects of a prolonged low-interest-rate environment make higher-yielding investments more compelling than in an environment in which the Fed is raising rates on a more frequent and regular basis. After initiating an underweight stance in August 2015, we moved our high-yield recommendation back to evenweight on March 17, 2016, as energy prices rebounded and prospects of a deeper economic slowdown dissipated. It is important to note that illiquidity concerns in the high-yield fixed income class remain a significant consideration. While investors should expect credit-market volatility at times through year-end, we find credit markets currently offer a balanced risk/reward profile.
Municipals: Although municipal securities slightly underperformed their taxable counterparts in the first half of the year, we believe that they offer attractive tax-equivalent return opportunities and are well positioned for growth through the rest of 2016. We recommend focusing on higher-quality issues rated “A” or better in essential service sectors and believe the best opportunity is in the intermediate part of the yield curve with slight premium coupons.1
International: It is difficult to foresee strong returns for international developed-market bonds with yields in the two major index constituents (the Eurozone and Japan) either close to zero or already negative. Taking into account our relatively benign view for interest-rate increases in the U.S. and evidence that any further monetary easing in Europe or Japan will be less effective in weakening currencies, we recommend an underweight stance in developed-market fixed income.
The fundamentals of many emerging-market economies remain challenged. Since we believe that commodity prices will remain in a lower-level trading range, we do not expect the early-2016 rally in emerging-market currencies, which has boosted returns on local-currency debt, to be sustained. We expect more stable returns in dollar-denominated sovereign bonds, which are insulated from currency volatility and for which higher spreads over U.S. Treasury securities attract demand in a low-return environment. We recommend an even weighting in emerging-market debt.
1”A” rated bonds are defined as upper-medium grade quality and subject to low risk.
Fixed-Income Sector Recommendations
Favorable Treasury Inflation-Protected Securities (TIPS)
Corporate Securities Essential Service Revenue
Unfavorable Treasury Securities Municipal High Yield
INVESTOR WATCH
Investors should be prepared for lower returns in high-quality fixed income over the coming years. While we expect returns to remain positive, the low-yield environment will likely pull down total returns relative to historical experience.
For investors looking to maximize income generation, we recommend a well-diversified approach to limit concentration risks.
We favor intermediate maturities. Investors who overweight short-term maturities or cash will likely find little opportunity for yield. Long-maturity instruments can expose portfolios to increased interest-rate volatility.
122016 Midyear Outlook Eyes on the Horizon
GLOBAL REAL ASSETS
FOCUS ON QUALITYJohn LaForgeHead of Real Asset Strategy
Selectivity Is KeyFor the second half, we are expecting REITs to continue to accumulate gains, albeit slowly and methodically. On the other hand, for commodities, we are expecting to see flat-to-down prices as the bear super-cycle reasserts its dominance over the average commodity. For MLPs, we are expecting flattish prices but positive overall gains once dividend yields are incorporated.
A Bounce in Commodities from Previous LowsSince becoming commodity bearish in 2013, we have been expecting lower gold prices each year. This was the case in 2015, too, as we set our 2016 gold targets. Our research indicated that most commodity-price damage is typically done in the first five years of a commodity bear super-cycle, and during those down years, to try to “catch the falling knife” is considered a very risky investment strategy as it is likely prices will continue to drop. Let’s call this period Phase 1. As we entered 2016, we still appeared to be in Phase 1, so we felt it was still prudent to remain gold negative until signs of a major low appeared. Now, in June, it does appear that gold found a major low, around $1,050 per ounce. The 2016 rally has been strong enough that it appears that Phase 1 may be over. Phase 2 of a commodity bear super-cycle typically involves a price bounce, similar to what we have seen in 2016, a flattening of prices, then many years of range-bound action. If gold has indeed entered Phase 2, we can no longer argue for lower gold prices
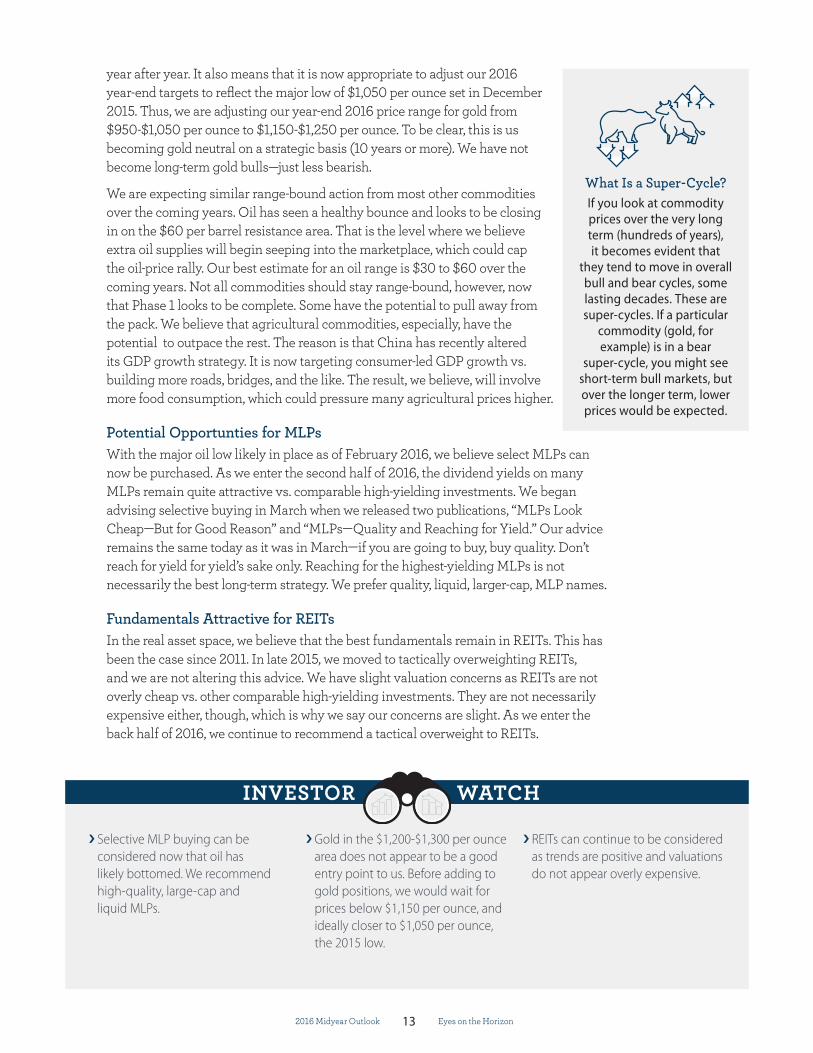
We Expect Only Short-Term Rallies in Gold PricesAug. ’11 Aug. ’14 Aug. ’17
’83 ’86 ’89 ’92 ’95 ’98
Inde
x Le
vel
■ Gold Bullion, Jan. 1980 - Dec. 1999 (bottom scale)■ Gold Bullion, Aug. 2011 - Apr. 2016 (top scale)
25.00
31.25
37.50
43.75
50.00
62.50
75.00
87.50
100.00
125.00
’80
We believe gold is in the midst of a commodity
bear super-cycle, much as it was from 1980-1999.
If so, short-term price rallies are to be expected,
but we doubt that they will amount to much.
Sources: Bloomberg, London Bullion Market Association, and Wells Fargo Investment Institute. April 27, 2016Data sample; daily 1/21/1980-12/30/1999, 8/17/2011-4/27/2016. Prices shown are in logarithmic scale.Gold bullion prices are indexed to 100 at 1/16/1970 and 2/15/2001. Past performance is no guarantee of future results.
132016 Midyear Outlook Eyes on the Horizon
year after year. It also means that it is now appropriate to adjust our 2016 year-end targets to reflect the major low of $1,050 per ounce set in December 2015. Thus, we are adjusting our year-end 2016 price range for gold from $950-$1,050 per ounce to $1,150-$1,250 per ounce. To be clear, this is us becoming gold neutral on a strategic basis (10 years or more). We have not become long-term gold bulls—just less bearish.
We are expecting similar range-bound action from most other commodities over the coming years. Oil has seen a healthy bounce and looks to be closing in on the $60 per barrel resistance area. That is the level where we believe extra oil supplies will begin seeping into the marketplace, which could cap the oil-price rally. Our best estimate for an oil range is $30 to $60 over the coming years. Not all commodities should stay range-bound, however, now that Phase 1 looks to be complete. Some have the potential to pull away from the pack. We believe that agricultural commodities, especially, have the potential to outpace the rest. The reason is that China has recently altered its GDP growth strategy. It is now targeting consumer-led GDP growth vs. building more roads, bridges, and the like. The result, we believe, will involve more food consumption, which could pressure many agricultural prices higher.
Potential Opportunties for MLPsWith the major oil low likely in place as of February 2016, we believe select MLPs can now be purchased. As we enter the second half of 2016, the dividend yields on many MLPs remain quite attractive vs. comparable high-yielding investments. We began advising selective buying in March when we released two publications, “MLPs Look Cheap—But for Good Reason” and “MLPs—Quality and Reaching for Yield.” Our advice remains the same today as it was in March—if you are going to buy, buy quality. Don’t reach for yield for yield’s sake only. Reaching for the highest-yielding MLPs is not necessarily the best long-term strategy. We prefer quality, liquid, larger-cap, MLP names.
Fundamentals Attractive for REITsIn the real asset space, we believe that the best fundamentals remain in REITs. This has been the case since 2011. In late 2015, we moved to tactically overweighting REITs, and we are not altering this advice. We have slight valuation concerns as REITs are not overly cheap vs. other comparable high-yielding investments. They are not necessarily expensive either, though, which is why we say our concerns are slight. As we enter the back half of 2016, we continue to recommend a tactical overweight to REITs.
What Is a Super-Cycle?If you look at commodity prices over the very long term (hundreds of years), it becomes evident that
they tend to move in overall bull and bear cycles, some lasting decades. These are super-cycles. If a particular
commodity (gold, for example) is in a bear
super-cycle, you might see short-term bull markets, but over the longer term, lower prices would be expected.
INVESTOR WATCH
Selective MLP buying can be considered now that oil has likely bottomed. We recommend high-quality, large-cap and liquid MLPs.
Gold in the $1,200-$1,300 per ounce area does not appear to be a good entry point to us. Before adding to gold positions, we would wait for prices below $1,150 per ounce, and ideally closer to $1,050 per ounce, the 2015 low.
REITs can continue to be considered as trends are positive and valuations do not appear overly expensive.
142016 Midyear Outlook Eyes on the Horizon
GLOBAL ALTERNATIVE INVESTMENTS
BALANCED AND TACTICALAdam TabackHead of Global Alternative Investments
View on Alternative Strategies Remains IntactDespite a highly volatile start to the year, our outlook on alternative investments remains largely intact. Our preference for “BOLT” strategies—those exhibiting a Balanced, Opportunistic, Low-net exposure, and Tactical profile—served investors well during the steep market correction at the start of the year. As selling pressure accelerated, the diversification benefit of alternative investments became evident, with some strategies such as Macro and Equity Hedge outperforming global equity indices as much as 10 percent.
The violent collapse in risky assets abruptly gave way to a V-shaped recovery through the second half of the first quarter as stabilization in oil markets and dovish central-bank rhetoric calmed market jitters. Credit spreads tightened from levels not seen since 2009, allowing Relative Value and Event Driven managers to recoup a portion of their losses. Unfortunately, both Equity Hedge and Macro strategies missed much of the recovery due to conservative positioning, short squeezes, and the (expected) lag in systematic model recognition of the changing environment.
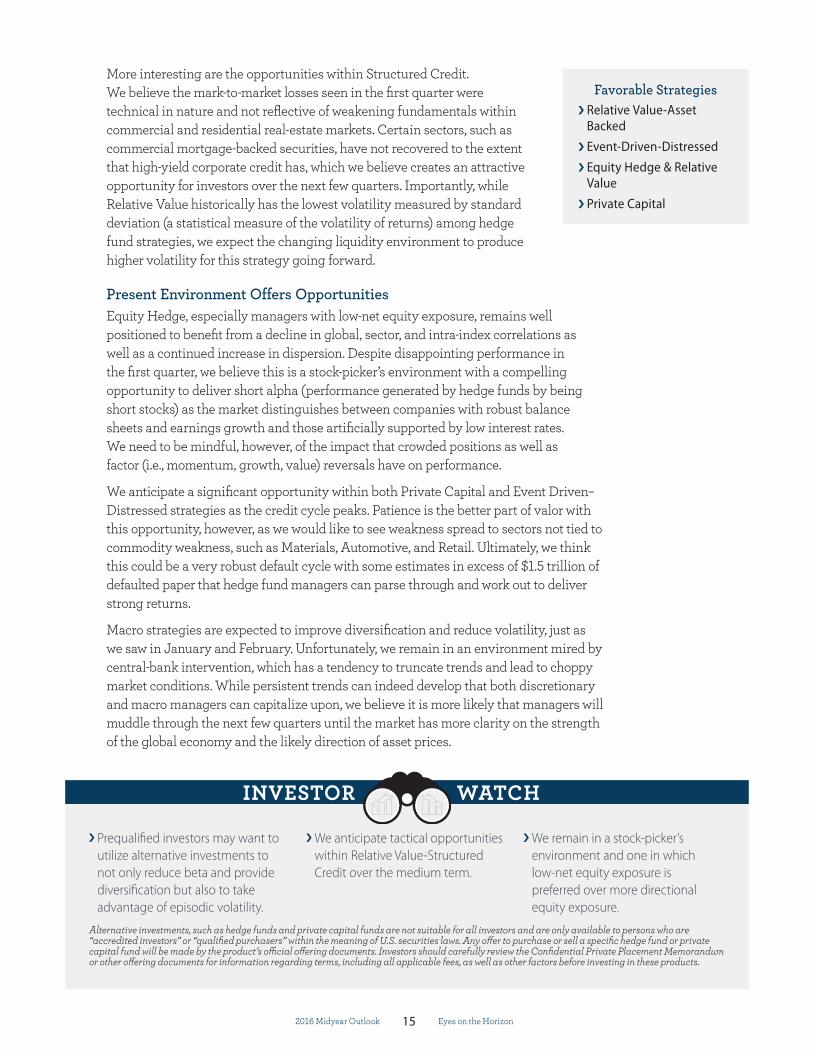
Strategies such as Relative Value and Event Driven that focused on corporate and structured credit were naturally susceptible to wider credit spreads and faced notable mark-to-market losses. However, we believe that as we enter the second half of the year, these strategies offer very compelling entry points for investors, especially with the strong fundamentals in asset-backed securities and developing opportunities in distressed investing (see chart).
High-Yield Debt Default Rates Accelerating, Especially in Energy Sector
As the credit cycle matures, defaults are expected to increase,
providing potential opportunities for
distressed investing.
Source: Wells Fargo Investment Institute, May 31, 2016
0%
16%
12%
8%
4%
20%
’98 ’00 ’02 ’04 ’06 ’08 ’10 ’12 ’14 ’16
Past
12
Mon
th Is
suer
Def
ault
Rate
■ BofA-ML U.S. High Yield Default Rate■ Energy
152016 Midyear Outlook Eyes on the Horizon
More interesting are the opportunities within Structured Credit. We believe the mark-to-market losses seen in the first quarter were technical in nature and not reflective of weakening fundamentals within commercial and residential real-estate markets. Certain sectors, such as commercial mortgage-backed securities, have not recovered to the extent that high-yield corporate credit has, which we believe creates an attractive opportunity for investors over the next few quarters. Importantly, while Relative Value historically has the lowest volatility measured by standard deviation (a statistical measure of the volatility of returns) among hedge fund strategies, we expect the changing liquidity environment to produce higher volatility for this strategy going forward.
Present Environment Offers OpportunitiesEquity Hedge, especially managers with low-net equity exposure, remains well positioned to benefit from a decline in global, sector, and intra-index correlations as well as a continued increase in dispersion. Despite disappointing performance in the first quarter, we believe this is a stock-picker’s environment with a compelling opportunity to deliver short alpha (performance generated by hedge funds by being short stocks) as the market distinguishes between companies with robust balance sheets and earnings growth and those artificially supported by low interest rates. We need to be mindful, however, of the impact that crowded positions as well as factor (i.e., momentum, growth, value) reversals have on performance.
We anticipate a significant opportunity within both Private Capital and Event Driven–Distressed strategies as the credit cycle peaks. Patience is the better part of valor with this opportunity, however, as we would like to see weakness spread to sectors not tied to commodity weakness, such as Materials, Automotive, and Retail. Ultimately, we think this could be a very robust default cycle with some estimates in excess of $1.5 trillion of defaulted paper that hedge fund managers can parse through and work out to deliver strong returns.
Macro strategies are expected to improve diversification and reduce volatility, just as we saw in January and February. Unfortunately, we remain in an environment mired by central-bank intervention, which has a tendency to truncate trends and lead to choppy market conditions. While persistent trends can indeed develop that both discretionary and macro managers can capitalize upon, we believe it is more likely that managers will muddle through the next few quarters until the market has more clarity on the strength of the global economy and the likely direction of asset prices.
Favorable Strategies Relative Value-Asset Backed
Event-Driven-Distressed Equity Hedge & Relative Value
Private Capital
INVESTOR WATCH
Prequalified investors may want to utilize alternative investments to not only reduce beta and provide diversification but also to take advantage of episodic volatility.
We anticipate tactical opportunities within Relative Value-Structured Credit over the medium term.
We remain in a stock-picker’s environment and one in which low-net equity exposure is preferred over more directional equity exposure.
Alternative investments, such as hedge funds and private capital funds are not suitable for all investors and are only available to persons who are “accredited investors” or “qualified purchasers” within the meaning of U.S. securities laws. Any offer to purchase or sell a specific hedge fund or private capital fund will be made by the product’s official offering documents. Investors should carefully review the Confidential Private Placement Memorandum or other offering documents for information regarding terms, including all applicable fees, as well as other factors before investing in these products.
162016 Midyear Outlook Eyes on the Horizon
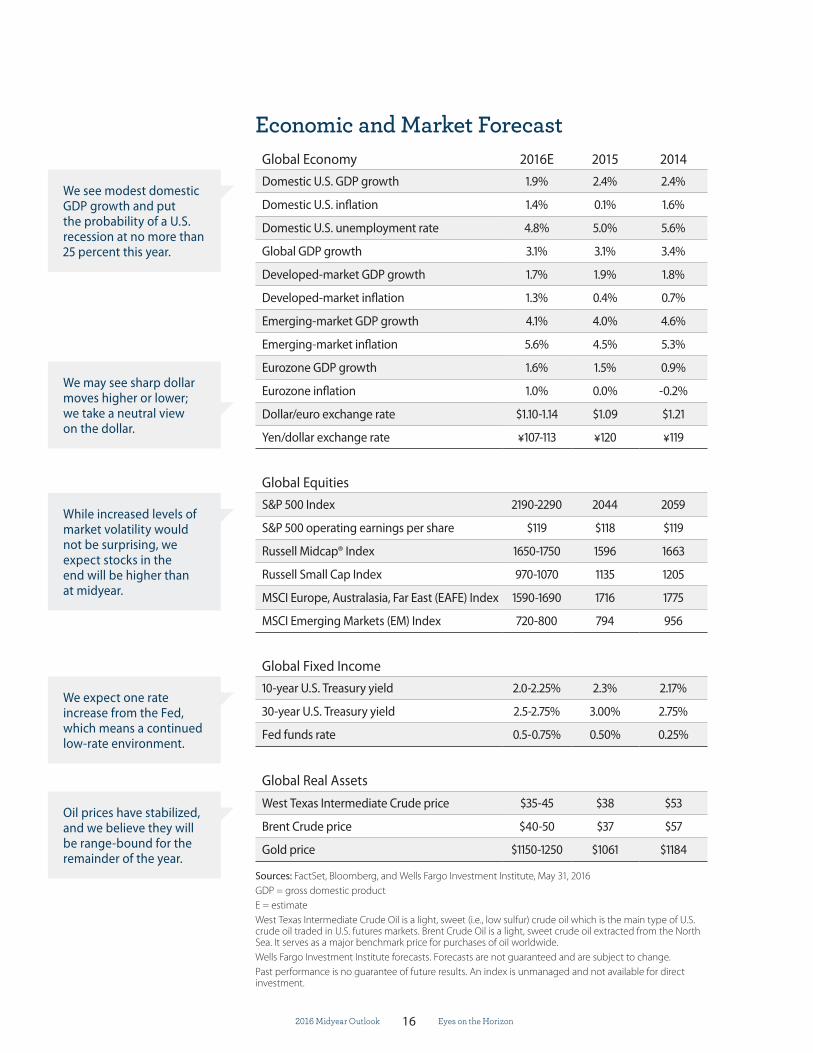
Economic and Market ForecastGlobal Economy 2016E 2015 2014Domestic U.S. GDP growth 1.9% 2.4% 2.4%
Domestic U.S. inflation 1.4% 0.1% 1.6%
Domestic U.S. unemployment rate 4.8% 5.0% 5.6%
Global GDP growth 3.1% 3.1% 3.4%
Developed-market GDP growth 1.7% 1.9% 1.8%
Developed-market inflation 1.3% 0.4% 0.7%
Emerging-market GDP growth 4.1% 4.0% 4.6%
Emerging-market inflation 5.6% 4.5% 5.3%
Eurozone GDP growth 1.6% 1.5% 0.9%
Eurozone inflation 1.0% 0.0% -0.2%
Dollar/euro exchange rate $1.10-1.14 $1.09 $1.21
Yen/dollar exchange rate ¥107-113 ¥120 ¥119
Global EquitiesS&P 500 Index 2190-2290 2044 2059
S&P 500 operating earnings per share $119 $118 $119
Russell Midcap® Index 1650-1750 1596 1663
Russell Small Cap Index 970-1070 1135 1205
MSCI Europe, Australasia, Far East (EAFE) Index 1590-1690 1716 1775
MSCI Emerging Markets (EM) Index 720-800 794 956
Global Fixed Income10-year U.S. Treasury yield 2.0-2.25% 2.3% 2.17%
30-year U.S. Treasury yield 2.5-2.75% 3.00% 2.75%
Fed funds rate 0.5-0.75% 0.50% 0.25%
Global Real AssetsWest Texas Intermediate Crude price $35-45 $38 $53
Brent Crude price $40-50 $37 $57
Gold price $1150-1250 $1061 $1184
We see modest domestic GDP growth and put the probability of a U.S. recession at no more than 25 percent this year.
We may see sharp dollar moves higher or lower; we take a neutral view on the dollar.
While increased levels of market volatility would not be surprising, we expect stocks in the end will be higher than at midyear.
We expect one rate increase from the Fed, which means a continued low-rate environment.
Oil prices have stabilized, and we believe they will be range-bound for the remainder of the year.
Sources: FactSet, Bloomberg, and Wells Fargo Investment Institute, May 31, 2016GDP = gross domestic productE = estimateWest Texas Intermediate Crude Oil is a light, sweet (i.e., low sulfur) crude oil which is the main type of U.S. crude oil traded in U.S. futures markets. Brent Crude Oil is a light, sweet crude oil extracted from the North Sea. It serves as a major benchmark price for purchases of oil worldwide.Wells Fargo Investment Institute forecasts. Forecasts are not guaranteed and are subject to change.Past performance is no guarantee of future results. An index is unmanaged and not available for direct investment.
182016 Midyear Outlook Eyes on the Horizon
DefinitionsIndexesAn index is unmanaged and not available for direct investment.
Barclays U.S. Aggregate Bond Index covers the U.S. dollar-denominated, investment-grade (rated Baa3 or above by Moody’s), fixed-rate, and taxable areas of the bond market. This is the broadest measure of the taxable U.S. bond market, including most Treasury, agency, corporate, mortgage-backed, asset-backed, and international dollar-denominated issues, all with maturities of one year or more.
BofA Merrill Lynch U.S. High-Yield Master II Index tracks the performance of below-investment-grade publically issued U.S. corporate bonds.
MSCI EAFE Index (Europe, Australasia, Far East) is a free float-adjusted market capitalization index that is designed to measure the equity market performance of developed markets, excluding the US & Canada. The Index consists of the following 21 developed market country indexes: Australia, Austria, Belgium, Denmark, Finland, France, Germany, Hong Kong, Ireland, Israel, Italy, Japan, the Netherlands, New Zealand, Norway, Portugal, Singapore, Spain, Sweden, Switzerland, and the United Kingdom.
MSCI Emerging Markets Index is a free float-adjusted market capitalization index that is designed to measure equity market performance of emerging markets. The Index consists of the following 23 emerging market country indexes: Brazil, Chile, China, Colombia, Czech Republic, Egypt, Greece, Hungary, India, Indonesia, Korea, Malaysia, Mexico, Peru, Philippines, Poland, Qatar, Russia, South Africa, Taiwan, Thailand, Turkey and United Arab Emirates.
Russell 2000® Index (small cap) measures the performance of the 2,000 smallest companies in the Russell 3000® Index, which represents approximately 8% of the total market capitalization of the Russell 3000 Index.
Russell Midcap® Index measures the performance of the 800 smallest companies in the Russell 1000® Index, which represent approximately 25% of the total market capitalization of the Russell 1000® Index.
S&P 500® Index consists of 500 industrial, financial, utility and transportation companies with market capitalizations of $4 billion or more.
Risk ConsiderationsAll investing involve risks, including the possible loss of principal. There can be no assurance that any investment strategy will be successful or will meet its investment objective. Investments fluctuate with changes in market and economic conditions and in different environments due to numerous factors some of which may be unpredictable. Each asset class has its own risks and return characteristics. The risks associated with the asset classes discussed in this report include:
Alternative Investments: The use of alternative investments, such as hedge funds and private capital funds, includes the risk of investment loss, including the loss of the entire amount invested. While investors may potentially benefit from the ability of alternative investments to potentially improve the risk-reward profiles of their portfolios, the investments themselves can carry significant risks. Government regulation and monitoring of these types of investments may be minimal or nonexistent. There may be no secondary market for alternative investment interests and transferability may be limited or even prohibited. Alternative investments employ aggressive investment techniques, including the use of short sales, leverage, swaps, futures contracts, options, forward contracts and other derivatives which can expose the investor to substantial risk. Short selling involves the potential for unlimited loss of the security sold short. The use of derivatives for other than hedging purposes is considered speculative and involves greater risks than those used for hedging. Investing in derivatives carries the risk of the underlying instrument as well as the derivative itself and may not be successful, resulting in losses to the fund, and the cost of such strategies may also reduce the fund’s returns.
Alternative Strategy Risk: Event Driven strategies involve investing in opportunities created by significant transactional events, such as spinoffs, mergers and acquisitions, bankruptcy reorganization, recapitalization and share buybacks. Managers who use such strategies may invest in, and might sell short, the securities of companies where the security’s price has been, or is expected to be, affected by a distressed situation. Event Driven-Distressed strategies involve a high degree of risk. Distressed companies could declare bankruptcy shortly, could currently be in bankruptcy proceedings or just emerging from bankruptcy. Because of their distressed situation, these securities may be illiquid, have low trading volumes, and be subject to substantial interest rate and credit risks. Equity Hedge strategies maintain positions both long and short in primarily equity and equity derivative securities. Macro managers trade a broad range of strategies in which the investment process is predicated on movements in underlying economic variables and the impact these have on equity, fixed income, hard currency and commodity markets. Relative Value strategies focus on exploiting perceived imbalances or valuation discrepancies between related markets or instruments. Structured credit strategies are not suitable for all investors. These strategies aim to generate returns via positions in the credit sensitive area of the fixed income markets. The strategy generally involves the purchase of corporate bonds, mortgages, suppliers’ claims and bank loans with hedging of the interest exposure. Such strategies involve taking advantage of mispriced credit exposure at certain points in the term structure of single name credits relative to other points in the same term structure. Positions may use, but are not limited to, traditional fixed income and credit securities, as well as other structured credit products and credit derivatives, such as credit default swaps. The use of these strategies may require a manager’s skill in assessing corporate events, the anticipation of future movements in securities prices, interest rates, or other economic factors. No assurance can be given that a manager’s view of the economy will be correct which may result in lower investment returns or higher return volatility. There can be no assurance that a manager that uses these strategies will be successful or that a manager will not deviate from its stated investment strategy and not employ other investment techniques in an effort to meet the fund’s investment objective.
192016 Midyear Outlook Eyes on the Horizon
Risk ConsiderationsCommodities: In addition to the risks of investing in commodities generally, investing in gold carries special risk considerations such as potentially severe price fluctuations over short periods of time and storage costs that exceed the custodial and/or brokerage costs associated with a portfolio’s other holdings.
Currency: Currency risk is the risk that foreign currencies will decline in value relative to that of the U.S. dollar. Exchange rate risk between the U.S. dollar and foreign currencies may cause a portfolio to decline.
Equity investments are subject to market risk which means their value may fluctuate in response to general economic and market conditions, the prospects of individual companies, and industry sectors. Technology and Internet-related stocks: Technology and Internet-related stocks, especially of smaller, less-seasoned companies, tend to be more volatile than the overall market.
Master limited partnerships (MLPs): MLPs involve certain risks which differ from an investment in the securities of a corporation. MLPs may be sensitive to price changes in oil, natural gas, etc., regulatory risk, and rising interest rates. A change in the current tax law regarding MLPs could result in the MLP being treated as a corporation for federal income tax purposes, which would reduce the amount of cash flows distributed by the MLP. Other risks include the volatility associated with the use of leverage, volatility of the commodities markets, market risks, supply and demand, natural and man-made catastrophes, competition, liquidity, market price discount from Net Asset Value, and other material risks.
Fixed-income securities: Investments in fixed-income securities are subject to market, interest rate, credit and other risks. Bond prices fluctuate inversely to changes in interest rates. Therefore, a general rise in interest rates can result in the decline in the bond’s price. Credit risk is the risk that an issuer will default on payments of interest and/or principal. This risk is heightened in lower rated bonds. High yield fixed income securities (junk bonds) are considered speculative, involve greater risk of default, and tend to be more volatile than investment grade fixed income securities. If sold prior to maturity, fixed income securities are subject to market risk. All fixed income investments may be worth less than their original cost upon redemption or maturity.
Foreign securities: Investing in foreign securities presents certain risks not associated with domestic investments, such as currency fluctuations, political and economic instability, and different accounting standards. This may result in greater share price volatility. These risks are heightened in emerging markets.
Mortgage-related securities: Investments in mortgage and asset-backed securities are subject to prepayment risk. Changes in prepayments may significantly affect yield, average life and expected maturity. Commercial Mortgage Backed Securities (CMBS) are a type of mortgage-backed security backed by commercial mortgages rather than residential real estate. CMBS tend to be more complex and volatile than residential mortgage-backed securities due to the unique nature of the underlying property assets.
Municipal bonds offer interest payments exempt from federal taxes, and potentially state and local income taxes. These bonds are subject to credit risk and potentially the Alternative Minimum Tax. Quality varies widely depending on the specific issuer.
Real estate: There are special risks associated with an investment in real estate, including the illiquidity of underlying properties, credit risk, interest rate fluctuations and the impact of varied economic conditions.
Small- and mid-capitalization stocks: The prices of small- and mid-cap company stocks are generally more volatile than large-company stocks. They often involve higher risks because smaller companies may lack the management expertise, financial resources, product diversification and competitive strengths to endure adverse economic conditions.
Sovereign Debt: In addition to the risks associated with investing in international and emerging markets, sovereign debt involves the risk that the issuing entity may not be able or willing to repay principal and/or interest when due in accordance with the terms of the debt agreement.
Treasury Inflation-Protected Securities (TIPS): TIPs are subject to interest rate risk, especially when real interest rates rise. This may cause the underlying value of the bond in the portfolio to fluctuate more than other fixed income securities.