Embed Size (px)
Citation preview

Economic Outlook
Traversing turbulent water
November 2015

Economic Outlook 2
Editorial
If there had been any doubts before, they will have
been removed by now. China dominates the global
economic scene and the rest of the world must
accept it. The events of this past summer are proof.
There was a storm from China. In July, stock
exchanges declined all over the world when the
Shanghai Stock Exchange plummeted. Investor
confidence was hardly restored when the Chinese
authorities intervened by buying stocks. In early
August, there was a comparable picture in the foreign
currency markets. Exchange rates, especially those of
Asian countries, faced volatility when the Chinese
authorities decided to let the renminbi depreciate. It
led to further downward pressure on the renminbi
and it cost China 15% of its foreign exchange reserves
to stabilise the currency. In September, even the US
Federal Reserve (Fed) admitted the impact of the
storm. The decision to not raise interest rates was
partially based on this impact, as mentioned through
a noteworthy sentence in the press release: ‘…but is
monitoring the developments abroad.’
It will come as no surprise that this Economic Outlook
acknowledges China’s dominance on the global
economic stage. China’s share in global GDP has
raced up six percentage points since 2008 to 18%. No
wonder Asian GDP growth has peaked now that
China’s economic growth is slowing. No wonder
global trade growth has been on a slower track since
China is producing more, and higher value-added
products for its home market. No wonder China’s
transition to consumption- and services-led growth
has caused a fall in commodity prices and volumes,
and pressure on growth for commodity exporters. No
wonder capital flows to emerging economies have
plummeted during 2015 as Chinese firms,
anticipating further renminbi depreciation, massively
repaid foreign loans. And, indeed, no wonder we have
placed a hard landing of the Chinese economy at the
top of our list of concerns for global growth, replacing
the much-anticipated Fed interest rate hike.
The deceleration of the Chinese economy is expected
to continue over the coming years, but a hard landing
may be avoided. The government has room for
further stimulus and has plenty of reserves to plug
any gap in the financial sector or its state-owned
enterprises. Yet, as developments over the past year
have shown, even a steady deceleration is enough to
cause significant trouble in countries across the globe.
The global economy may be expected to pick up
slightly in 2016 compared to 2015, but that picture is
surrounded with a lot of downside-tilted risks,
especially for the emerging economies. With China’s
increasing global economic weight, it is no wonder, it
will play a dominant role in determining the health of
the global economy over the coming decades.
John Lorié, Chief Economist Atradius

Economic Outlook 3
Table of contents
Executive summary ……….………………….………..…………….………...………..…….…….…..…….…………. 4
1 The global macroeconomic environment …………………….………...………..….………...…….….……. 5
2 Advanced economies – prospects and risks ...……….…………….………....………..……………........ 14
Eurozone ……..…………...…...……..…………….…………………….………...….……..…………………… 14
United States ……..…………...…...……..…………….……………….………...….……..…………………. 18
United Kingdom ……..…………...…...……..………………………….………...………..…….…….……… 20
Japan ……..…………...…...……..…………….…………………………….………...………..………………….. 21
3 Emerging economies – prospects and risks ...……………..…………….………...………..…………..… 22
Asia ……..…………...…...……..…………….………………………………….…….…...………..………………. 23
Latin America ……..…………...…...……..…………….………………….…….…...………..……………... 26
Central and Eastern Europe ……..…………...…………….………...….……..………...……..…….. 29
Middle East and North Africa ...…………….…….…………….………...………..……..……………. 32
Sub-Saharan Africa ……..…………...…...……..……………….………....………..……………….…….. 32
4 Implications for the insolvency environment …..…..………………….………...………..……….….….. 34
Appendix I: Recent publications .……..…………...…...……..…………….……….………....……..………….. 38
39 Appendix II: Risk Map ..……..…………….…….…………….……......................…….…….…...………..…………..
Appendix III: Forecast tables ……..…………...…...……..…………….……..…….…….…...………..………….. 40

Economic Outlook 4
Executive summary
The global economy has entered turbulent water.
Global growth has been sluggish in 2015 and risks
abound for the 2016 outlook. Troubled emerging
markets are the main source of weakness and concern.
Key points
� The global economy is expected to grow just 2.5%
in 2015, less than in 2014. Economic growth is
currently foreseen to accelerate to 2.9% in 2016.
� The economic recovery in advanced markets has
taken further hold. The euro area is forecast to
grow 1.5% in 2015 and 1.7% in 2016. The United
States is projected to expand 2.5% in 2015 and
2.6% in 2016.
� Latin America and Eastern Europe are both
projected to see modest economic growth of 0.8%
and 1.9% respectively in 2016 after contraction in
2015. Economic growth in Asia, excluding Japan, is
stable and forecast at 5.7% in 2016.
� We forecast that insolvencies will fall in most advanced markets in 2015 and 2016, but the level of insolvencies will remain relatively high, especially in the eurozone. Insolvency conditions in many emerging markets have, however, deteriorated notably.
Global economic growth has been disappointing in
2015, being dragged down by turbulence across
emerging markets. Chapter 1 shows that as most
pressure is expected to remain on emerging markets
in 2016, the global economy is forecast to show only a
modest increase in growth. As a result, global growth
will be well below average historical rates. Global trade
is also weak. We forecast that global trade will grow
by only 1% in 2015 and pick up modestly in 2016.
The two top risks to the 2016 outlook are a further
slowdown in China and turbulence in emerging
markets in response to rising US interest rates. The
Chinese slowdown impacts trade partners’ capital
flows and financial returns. The change in US
monetary policy may lead to capital outflows, currency
volatility and trouble with corporate debt denominated
in foreign currency.
The advanced economies are doing relatively well – as
discussed in Chapter 2. The eurozone economy has
left the euro crisis behind while the recovery is
strengthening. All member states are growing and
conditions are expected to improve further in 2016.
The expansion is based on solid domestic demand.
Nonetheless unemployment remains high and
economic growth slow. The United States and United
Kingdom have done much better over the past years
growing 2% to 3% per annum, and are expected to
continue doing so in 2016.
Conditions in many emerging markets have
deteriorated significantly. Chapter 3 shows there are
three main drivers. The fall in commodity prices,
including oil, is hurting commodity exporters. The
economic slowdown in China is adversely affecting
trade partners and capital flows. Moreover, the
expected change in official US interest rates has made
investors less likely to invest in emerging markets. The
adverse developments have hit emerging markets
across the globe and are likely to last into 2016. A
number of countries are, however, doing well.
Commodity importers are enjoying the lower prices,
Central America is benefiting from the economic
growth in the US, while Eastern Europe is benefiting
from the recovery in the eurozone.
Insolvency conditions are deteriorating in many
emerging markets while they are generally improving
across advanced markets – as argued in Chapter 4.
Insolvencies in the eurozone are forecast to fall 7.0% in
2015 and 5.4% in 2016, but the level remains 66%
higher in 2016 compared to 2007. Despite better
economic conditions, insolvencies are forecast to rise
in Portugal, France and Greece in 2015. Insolvencies in
New Zealand, Australia and Canada are also up in 2015
as a result of the lower oil price and the slowdown in
China. China itself is forecast to see a strong increase
in insolvencies in both 2015 and 2016. Among the
BRICs, insolvencies are projected to fall only in India.
As long as global economic growth remains sluggish,
business conditions will remain difficult.

Economic Outlook 5
1. The global macroeconomic
environment
Global growth sputters as emerging economies slow
In our May Economic Outlook, we signalled that a new
normal of global economic growth had become
manifest. High and rising debt levels were observed,
boding ill for future spending by households and firms
when they start to deleverage. More fundamentally,
aging, slower information technology application,
lower investments and infrastructure constraints,
have been putting pressure on potential growth, even
in the emerging economies. These factors are
expected to stay for the coming years, burdening
global growth.
Source: IHS
With the impact of these factors still difficult to gauge,
especially over shorter time periods, and forecasts
inclined to be positively biased, global growth is bound
to disappoint. 1 At least, the likelihood of positive
surprises is low, relative to negative ones. What we
have observed over the past six months neatly fits
into the picture we depicted in the May Economic
Outlook (and previous ones), at least on a global level.
Indeed, global economic growth again receded, albeit
marginally, to 2.6% (from 2.7%). Still, in 2016, a
recovery to 3% is expected, which is arguably
optimistic in view of the above.
1 See IIF, Global Economic Monitor, July 2015.
Source: IHS
While the overall picture is a bit disappointing, it is not
an across-the-board phenomenon. Advanced
economies have continued to improve and even beat
forecasts, while growth pressures in emerging
economies already reported in May have further
intensified. Growth differences between advanced and
emerging economies have now narrowed to a record
low of around one percentage point. Moreover, the
previously reported picture within the two groups
strengthened as well. As the US economy grew
steadily despite a lacklustre first quarter, the eurozone
further improved, indeed above expectations, with
limited impact from the Greek turmoil this summer. In
the emerging economies, Asia was still the bright spot,
although Chinese growth is under pressure. Latin
America fared even worse than the already poor
predictions. Economic growth across emerging
economies is definitely slowing.
The impact of this slowdown on global growth is
softened by the ever-growing share of the emerging
economies in global GDP (which continues as long as
the latter group grows faster). In 2007 both groups
held 50% of the global GDP pie, in 2015 this will be
58%-42% in favour of the emerging economies. The
latter improvement is fully borne by Asia, whose share
of global GDP has climbed from 22% to 30%. China
drove the improvement as its share increased six
percentage points to 18% of global GDP in 2015.

Economic Outlook 6
Source: IMF World Economic Outlook
Source: IMF
The observation has implications for future global
growth. Growth developments in emerging economies
will simply dominate global growth. Indeed, this
comes at the expense of the United States and the
eurozone, whose economic growth is becoming less
important. Emerging economies, and especially China,
have become the leading force in global economic
growth.
Trade on slower growth track
The cautiously optimistic tone on trade growth struck
in our previous Economic Outlook is not supported by
the data that have been released since then. While
trade growth in the US and, to a lesser extent, the
eurozone, has been steady in the first part of 2015,
Latin America and Asia have disappointed. This can be
largely attributed to the slowdown and rebalancing of
the Chinese economy. This has caused lower demand
for imports in China – especially for machinery and
metals like copper, iron ore and steel – reflecting
declining investment activity. This translates into
declining trade growth figures in countries in Asia, and,
more pronouncedly, Latin America. Most prominently,
Brazilian trade figures are under pressure.
The result is that global growth figures for the first
half of 2015 are disappointing, and even indicate a
negative figure of 0.7% according to the WTO. But
recovery is underway. WTO expects a strong recovery
in the second half of 2015 and 2.8% trade growth for
the full year. On a more cautious note, according to
our newly developed Atradius International Trade
Forecasting Model, an overall figure in the range of 1%
can be reached. The jump in the IMF-developed World
Trade Leading Index provides further support for
trade growth recovery.2 In 2016 a further pick-up is
forecast.
Source: CPB
There are several reasons for this. 3 Global supply
chains are changing. The movement of production to
China (following its WTO accession) and emerging
Europe (following the fall of the Berlin Wall) has
phased out. This is signalled by the fall in foreign value
of exports, which has declined, for China alone to 33%
in 2009 from 36% in 2005. China, as well as other
countries, is simply producing more for domestic
consumption. Moreover, US imports are structurally
lower now that the country is no longer an oil
importer due to the shale revolution that has boosted
home production. That shale revolution, in turn, has
contributed to the halting of off-shoring, and
potentially re-shoring, by US firms, putting pressure
on trade.
2 The World Trade Leading Index, which depends on six indicators and
indices for global trade: the Baltic Dry Index, the Brent price, the Commodity
Research Bureau Index, the PMI, the Ifo Business Climate Index and the US
dollar nominal effective exchange rate. Turning points of the composite WT
Leading Index are shown to be similar to those of the global trade y-o-y
changes. See IMF (2015), “World Trade Leading Index”, working paper 15/20. 3 The slowdown in world trade: temporary or permanent? Atradius, October
2015.
0%
10%
20%
30%
Emerging anddeveloping
Asia
Latin Americaand the
Caribbean
EU United States
1.3 Regional share of global GDPPercentage of total GDP
2007 2015
0%
20%
40%
60%
2007 2015
1.4 Share of global GDPPercentage of global GDP
Advanced economies
Emerging market and developing economies
-5%
0%
5%
10%
2013 2014 2015
1.5 Trade growth per region(Annual percentage change)
United States Eurozone Emerging Asia Latin America

Economic Outlook 7
Box 1.1 Atradius International Trade Forecasting
Model
The Atradius global trade forecasts are based on a
statistical model. The model is an Error Correction
Model which links trade growth to the short-run and
the long-run relationship between trade and GDP in
the following formal manner:4
ΔTradet = α Δ ln GDPt - λ (ln Tradet-1 – β ln GDPt-1) + εt
This yields estimates of a short-run and a long-run
elasticity, α and β respectively, as well as a parameter
λ that represents the speed of adjustment (in a year)
when the long-run relationship, ln Tradet-1 – β ln GDPt-1,
is deviated from. This deviation is the error, with the
speed-of-adjustment parameter correcting the error
and explaining the name of the model. The model is
developed in a working paper by IMF.5
Using quarterly trade volume data from the Dutch
Centre of Policy Research (CPB) for the period 2007
Q1 to 2015 Q2 we find that the short run elasticity α =
4.4, the long run elasticity β = 1.1 and speed of
adjustment λ= 0.27, which are all significant at the
95% confidence level.
This implies that an additional one percentage point of
global GDP growth leads to an additional 4.4
percentage point short-term trade growth. This figure
needs to be corrected in case there is an error in the
long-term relationship, which is estimated ln Tradet-1 –
1.1 ln GDPt-1. That error will be corrected in a period by
27%. Thus, if ln Tradet-1 > 1.1 ln GDPt-1, trade growth in
that year will be lowered 27%.
Sources: CPB, Atradius
4 Atradius, International trade forecasting model, Internal note, August 2015. 5 IMF, The Global Trade Slowdown: Cyclical or Structural, Working Paper 15/6.
These two factors are unlikely to change, but several
other factors are. Firstly, eurozone trade is likely to
pick up now that the rebalancing of external
imbalances, which has been driving import contraction,
for instance in Greece, has more or less ended. The
eurozone is by far the largest trade bloc in the world.
Secondly, investment in advanced economies has
been slow since the Global Financial Crisis in 2008.
That is unlikely to last, with US investment picking up
to pre-crisis levels providing support for this. The
eurozone is likely to follow suit, helping the most
trade intensive component of aggregate demand:
capital goods. Thirdly, there are signs that the increase
in trade-hindering measures is being reverted. The
number of trade liberalisation measures, such as tariff
cutting, increased between October 2014 and May
2015. Still, the number of protectionist measures is on
the rise.6 Fourthly, the on-going reinforcement of the
banking sector, especially in the eurozone, should
release a higher level of trade finance,7 supporting
trade. Finally, regional trade deals, such as the
recently-closed (but still to-be-ratified) Trans-Pacific
Partnership (TPP) agreement will clearly help as well.8
With these factors turning positive, trade growth
could indeed reach average levels between 3% and 4%
per year. This is well below the 5.5% growth level
reached over the past decade.
Oil prices further down
In our May Economic Outlook we have extensively
discussed the rather spectacular fall of the oil price
during the autumn of 2014. Oil prices tumbled from
USD 90 per barrel (Brent) to a level between USD 50
and USD 60. We have argued that supply factors were
at the heart of the fall, with OPEC countries not willing
to turn off the tap as they feared (lasting) loss of
market share to US shale producers. Those shale
producers were indeed expected to reduce their own
production levels as prices reached levels below their
cost price. As a result, prices could be expected to
recover relatively quickly.
Unfortunately, as a further sign of volatility – and
arguably unpredictability – of the oil market, prices
have not risen, but instead slid further to levels
between USD 45 and USD 50 per barrel. There are
6 See https://www.wto.org/english/news_e/archive_e/trdev_arc_e.htm 7 WTO indicates that for Africa a trade finance shortage of USD 100-110 billion
exists, whereas this figure is much higher for Asia: USD 1.1 trillion. 8 Chartered members are Australia, Brunei, Canada, Chile, Japan, Malaysia,
Mexico, New Zealand, Peru, Singapore, the US and Vietnam, comprising one
third of global GDP and one-quarter of global trade.
-30
-15
0
15
30
2001 2006 2011 2016
1.6 Global trade forecastGrowth over the past 12 months
Leading Index Trade Forecast

Economic Outlook 8
several reasons why this has occurred. Firstly, despite
a decline in investment, production growth is still
significant. US shale production has proven to be more
resilient than expected and the pace of production
growth has so far only slowed. Costs have been cut by
more than one-third, allowing more producers than
expected to remain in business. OPEC production has
been increased to a level of 31.5 million barrels a day,
1.5 million barrels above target. Russia is producing at
record levels as it attempts to keep up oil sales at
lower prices, and so is Brazil. This development is
compounded by the nuclear deal with Iran that was
struck over the summer. Iran is expected to push up
its production from 0.5 to 0.8 million barrels per day
at short notice after the sanctions are lifted. That
regular flow comes in addition to the 30 million
barrels it has stocked and can be released for sale as
well. Furthermore, whereas demand for oil has
increased because of the lower price (IEA revised
demand upwards to 1.7 million barrels above trend), it
has not been sufficient to halt pressure on prices.
The upshot is that price recovery is forecast to be
much slower. The US Energy Information
Administration price forecast now indicates USD 51
per barrel for Brent by the end of 2015 and USD 59 by
the end of 2016. The IMF, using futures as a forecast
basis, anticipated a similar number for 2015 and
forecasts even a slight decline to USD 50 for 2016.
Meanwhile, the likelihood of another ‘shot in the arm’
for the global economy is diminished. The spending
boost of any further oil price decline will be lower
since energy consumption as a part of total spending
is now much lower, especially for households. On the
other hand, oil exporters such as Russia, continue to
be affected by lower prices and may be forced to cut
spending further. The impact of low oil prices may
then turn out to be negative on global demand.
Source: IHS
Box 1.2 Oil price forecasting
Although oil prices are notoriously difficult to forecast,
it does not stop acclaimed research institutes from
doing so. The economic literature assessing the
predictive power of forecasts is rather thin.
The IMF simply uses the price of NYMEX oil futures as
a predictor. However, widely hailed as sound
predictors in theory, quantitative research proves
otherwise. Predictive power is very weak. Only at
short time horizons up to one year, using daily rather
than monthly data, the futures model performs better
than the simple ‘no change random walk’ forecast. 9
The International Energy Agency (IEA) employs the
World Energy Model, a heavily data-driven simulation
model based on supply-demand equilibrium. While the
current data limitation prevents performance
measuring, research shows that IEA’s forecasts up
until now are on average underestimations and get
even more inaccurate the further in the future forecast.
The US government’s Energy Information
Administration (EIA) uses a model similar to the IEA
one, although focusing on the US market. Their model,
the National Energy Modelling System (NEMS), is built
from a number of sectors to model energy demand.
An iterative process leads to an equilibrium oil price.
Other research suggests that the EIA one-quarter
forecasts outperform the no change forecast.10 Other
research shows that equilibrium type models
outperform the no change forecasts up until the mid-
level horizon (from two to 11 quarters).
Other commodity prices show a similar pattern
In a sense, commodity markets, at least those for
metals,11 bear a resemblance to the oil market. In both
markets, prices are under pressure as demand growth
is unable to keep up with supply. On the supply side,
giants like Rio Tinto and BHP Billiton behave like OPEC
as they continue to increase production. Like in the oil
market, where OPEC attacks US shale producers,
these firms attempt to push the high-cost producers,
especially those in China, from the metals market.12
Interestingly, these firms were helped by lower energy
9 See Alquist, R., L. Kilian and R.J.Vigfusson (2011), ‘Forecasting the Price of
Oil, Handbook of Economic Forecasting, 2, Amsterdam; North-Holland. 10 Idem. 11 Such as iron ore, aluminium, copper and nickel. 12 See Goodbye to all that, The Economist, August 22nd 2015, p. 54-55.
40
60
80
100
120
2014 2015
1.7 Oil priceBrent, USD per barrel

Economic Outlook 9
prices, which – being inputs for production – made
investments at lower prices still beneficial.
Source: IHS
On the demand side, however, the comparison with
the oil market is lost as China dominates the scene. It
consumes more than half of the global production of
iron ore, nickel and (refined) copper. With China
slowing down and rebalancing, indeed its demand
growth for commodities has been reduced. The
pressure coming from this combined force of
oversupply and pressure on demand has led to
continuation, and even slight acceleration, of the price
decline in 2015. This will definitely not go on forever,
and importantly, like in the oil market, investments
have already been reduced. Still, the end of the price
pressure is not in sight as the IMF points out.13
This is not good news for commodity exporters, a set
of countries already relatively hard hit by the price
declines that started in 2011. Metal exporters that face
this most prominently are a diversified bunch:
Mongolia, Zambia, Mauritania, Chile, Iceland and Peru
(using a minimum of 5% exports to GDP benchmark).
China’s summer turmoil adds to worries
With China now having an 18% share of global GDP
and a 50% share of the commodity market,
developments are being closely watched, if not
scrutinised. During the early summer of 2015, China
released a number of high frequency data that gave
rise to concerns over whether the targeted growth
level of 7% for 2015 would be achieved. Notably,
exports were down. Then, after a steep climb during
the late spring, the Chinese stock exchange tumbled,
having lost 40% of its value since mid-July. The
Chinese authorities intervened in the market,
13 World Economic Outlook, p. 45.
spending an amount of around USD 200 billion to halt
the fall, but to no avail. Other stock exchanges in the
world were down as well. The situation stabilised by
late August.
Finally, in early August the Chinese central bank took
the markets by surprise with a devaluation of the
renminbi. It was small in size, almost 2%, but it sent a
shock wave through the currency market, especially in
Asia, as fears of the Chinese-led currency war rose.
Further pressure on the currency forced the Chinese
central bank to intervene heavily in the market in
order to maintain the renminbi within its band versus
the USD. Chinese turmoil clearly matters.
Source: IHS
The assessment of the impact of the turmoil is a bit of
a balancing act itself. Firstly, as to growth, the
authorities have sufficient means at their disposal to
keep growth at the targeted level. Secondly, the
impact of the stock exchange fall should be fairly
limited. Less than 20% of Chinese household wealth is
held in shares, and the part held in shares is fairly
concentrated. Thirdly, through the interventions
subsequent to the devaluation, China has shown that
it does not wish to wage a currency war. Indeed, the
devaluation should be seen as a step towards a more
freely floating renminbi as recommended by the IMF.

Economic Outlook 10
Source: IHS
But, one should be careful as well. Further
government intervention to boost growth would
arguably imply authorities revert to the old trick of
investment stimulus. That would run counter to the
rebalancing objective towards a more consumption-
led growth and the attempts to manage unsustainably
high debt levels at local governments, state-owned
enterprises and firms. Therefore, the impact of the
Chinese summer turmoil should not be overestimated,
but authorities have raised doubt, at least some, on
their ability to smoothly manage the economy.
Nowadays, this is a global concern.
The Fed goes global
As we have discussed in our May Economic Outlook,
the Fed monetary policy stance, more than the ECB’s,
is to dominate the global scene. While this still holds, it
gradually became clear that the Fed would not raise
the interest rate in its September monetary policy
committee meeting, and indeed it did not. Again, this
has a lot to do with China, and more generally, the
developments in the emerging economies. This is a
remarkable development. As the press statement of
the September FOMC meeting admits, these are
concerns for the state of the US economy and thus
warrant being taken into account. We consider two
metrics, global financial flows to emerging economies
and exchange rates. Both are under pressure.
Source: IIF
Capital flows to emerging economies are important as
they fuel economic growth. They are expected to
reach USD 548 million in 2015, down from USD 1.1
billion in 2014, according to the IIF.14 The year 2014
was already notably down from USD 1.3 billion in 2013.
As a share of GDP, inflows have fallen to 2%, against
8% in 2007. The heart of the problem is in China
where capital flows are expected to reach a level of
USD 75 billion in 2015 or 1% of GDP, down from USD
385 billion in 2015 (5%). This is directly related to
Chinese corporates massively repaying their cross-
border USD-denominated debt to off-shore banks,
arguably in anticipation of further renminbi
depreciation after the August turmoil. Flows to
Indonesia are under pressure as well, whereas Russia
continues to face net capital outflows due to
international sanctions. For 2016 only a modest
recovery of inflows to emerging economies is forecast,
to USD 776 billion as inflows to China recover. But the
outlook remains bleak.
Source: IHS
14 See Capital Flows to Emerging Markets, IIF October 2015.
-5%
0%
5%
10%
15%
2007 2009 2011 2013 2015f
1.11 Capital flows to emerging economiesPercent of GDP
Brazil Mexico ChinaRussia Turkey

Economic Outlook 11
As to the other metric, exchange rates of emerging
economies relative to the USD have been under
pressure since the announcement of the Fed’s
monetary policy tapering in June 2013. But this
pressure has actually existed since the 2008 crisis,
and in most cases, even before then. Exceptions to
this observation are Mexico and, notably, China,
although the currency of the latter has been subject to
a managed float regime with clear current downward
pressures. Apart from the Fed, and most recently the
renminbi devaluation, an array of domestic issues play
a role. For Russia the low oil price and international
sanctions, for India the lacklustre infrastructure
investments, for Indonesia the vulnerability to
commodity prices and for Brazil the overreliance on
credit-led consumption growth, to name a few.
We wish to emphasise here that exchange rate moves
in reaction to these issues are to be assessed
favourably. They help rebalance the economy, as is
most visible in Russia where the rouble depreciation
triggered a dramatic decline in imports. That in turn
prevented an external imbalance, and potential
Russian default like in the 1990s. Flexible exchange
rates help prevent imbalances and so a reprise of the
Asian crisis is not in the cards.
Corporate debt levels on the radar
Care is warranted, especially now that foreign
corporate debt has gone up since the crisis. The risk of
default for firms is set to increase as capital is reverted
to advanced economies and domestic currencies face
pressure. Finance may be harder to get, and at a
higher price, because of interest rates going up due to
(i) central bank rate hikes and (ii) significantly higher
spreads for foreign currency denominated debt. The
latter arises because of the currency mismatch for
firms that have cash flows in home currencies and
debt servicing in USD or other foreign currencies. The
issue may be systemic for a country, and perhaps a
region, if foreign debt has reached danger zone levels.
The question is whether such is the case at this
moment. We have only data on foreign corporate debt
to assess the situation – no split in home and foreign
currency. We also limit ourselves to aggregate figures
for emerging economies. On that score, the increase of
almost 2 percentage points does not look dramatic for
the emerging economies, and although it is highest
relative to banks and sovereigns, neither does the
current level, at a still relatively low 9.2% of GDP.
The aggregate figures provide a first impression of the
size of the problem, but a closer look at external
corporate debt relative to country-wide exports is
needed. Doing that, we observe that external
corporate debt levels in Indonesia, Turkey, Russia,
Brazil and India stand out. Although the absolute
levels (between 50% and 75% of exports) still seem
manageable, the vulnerability of these firms to
changes in capital flows, rising interest rates, and
pressure on exchange rates is heightened. Foreign
corporate debt in Indonesia, Russia, Brazil and Turkey
in particular warrant a closer look in Chapter 3. For
now, it seems too early to signal this as the
development of a systemic risk for emerging
economies, but increased vigilance on individual
corporate monitoring is certainly justified.15
Source: Fitch
Sources: IMF, Fitch
Geopolitical issues intensify in the Middle East
The conflict in the Middle East has escalated, now that
Russia has decided to step up its support for the
15 On that account, we follow the IMF, Corporate leverage in emerging
economies – a concern?, October 2015. Their analysis has a broader scope,
however, by assessing corporate leveraging as a whole rather than only
foreign debt.
0%
5%
10%
15%
20%
25%
Banks Sovereigns Corporates Total
1.13 Foreign debt emerging economiesPercent of GDP
2008 2014
0%
25%
50%
75%
1.14 Corporate external debt Percent of exports

�Economic Outlook 12
Syrian government. It is backing it up with air strikes
on Syrian rebel forces that are supported by the US-
led coalition against IS. That complicates the Western
approach towards Syria, already put under pressure
by the tens of thousands of Syrian refugees fleeing to
Europe and seeking political asylum since the summer.
In a way, Russia, the US and Europe have another
issue to agree on as international sanctions for the
Russian approach to Ukraine are still firmly in place.
Apart from that, the conflicts have only limited global
impact, at this stage.
Outlook indicates slow growth
Global growth in 2015 is bound to disappoint. Changes
in the forecasts since the early spring reflect that,
especially in Latin America. Due to this, Latin America
as a whole is now forecast to witness a weak
recession due to the situation in Brazil, but a number
of smaller countries, such as Peru and Columbia, are
still firmly growing. In Asia, despite Chinese pressure,
growth forecasts have only been adjusted down by 0.1
percentage point and the region remains the global
growth carrier. In the advanced economies, the GDP
forecast for the US was reduced due to an
unexpectedly weak first quarter performance. On the
other hand, the eurozone outlook remained stable,
backed by ECB expansionary monetary policy, the low
oil price and a still favourable exchange rate.
Table 1.1 Real GDP growth (%) – Major regions
2014 2015f 2016f
Eurozone 0.9 1.5 1.7
United States 2.4 2.5 2.6
Asia Pacific 4.8 4.5 4.7
Latin America 1.0 -0.6 0.8
Eastern Europe 1.8 -0.1 1.9
Total 2.8 2.5 2.9
Source: Consensus Economics (October 2015)
In 2016 Latin America is forecast to move out of
recession, pulled up by the Brazilian growth pressures
bottoming out. The same holds for Eastern Europe,
where the Russian recession will gradually fade over
the year, assuming no further fall in the oil price or
intensification of the international sanctions. Then,
with Asia powering ahead and the US and the
eurozone picking up, the overall picture of 3.0%
should be achievable. That is indeed our baseline
scenario. Still, as we have already mentioned, it may
again turn out to be a bit optimistic.
Source: Consensus Economics
Risks to the outlook
Our previous Outlook emphasised the risks for our
main scenario for an unanticipated Fed rate rise,
eurozone growth, a slowdown in China’s growth, and
geopolitics, in that sequence. The events over the
summer have changed that picture somewhat. Firstly,
as can be deduced from the above analysis, China has
taken centre stage, and that will have to be reflected
in our risk assessment. Secondly, with the Greek
uprising against the eurozone bailout terms ending in
an anti-climax, the risk of Grexit has arguably declined,
at least in the short term. Meanwhile, the Fed has
shown a clear sign of empathy for global events. We
therefore include the following risks to our main
scenario.
(1) Chinese growth: We still take a 5% GDP growth
level as a hard landing scenario. If economic data
surprise, the authorities may revert to the old tricks of
infrastructure spending. That would reverse a positive
development towards more consumption-led growth.
Moreover, it will further push up already high debt
levels in the economy. Phasing that out will mean
further strain on the authorities to manage the
economy than now. That could prove too much. We
have clearly outlined above what the impact of such
situation can be on the global economy: financial
market stress, currency depreciations against the USD,
trade disruptions and even lower global commodity
prices.
(2) Global monetary policy: The point here is not so
much monetary policy itself but instead it is the timing
and communication of rate hikes by the Fed. The
decision is data driven, regarding the labour market
and inflation. Surprises may come from these data and
then uncertainty may arise as to what the reaction of
the Fed will be. Add the global economic situation and
one can argue that uncertainty regarding the Fed
-1.4-0.4
-0.2
-0.1
0.0
0.0
0.3
-1.5 -1.0 -0.5 0.0 0.5
Latin America
United States
Asia Pacific
United Kingdom
Eurozone
Western Europe
Eastern Europe
1.15 Change in 2015 GDP growth forecastsDifference between April 2015 and October 2015

Economic Outlook 13
decision has remained unchanged and high: a Fed
policy shock can lead to further, and more widespread,
capital outflows from emerging economies. A credit
crunch may then result.
(3) Eurozone growth: Strengthening growth in the
eurozone has taken hold since the early spring,
despite the threat of Grexit. That situation, however,
did not lead to the feared contagion in financial
markets. Given the unexpected U-turn that was made
by Greece in July, to accept a new bailout and the
confirmation of this by the election results of late
September, Grexit is not likely, at least not in the short
term. The ECB’s quantitative easing programme that
will last at least until September 2016 helps as well.
Moreover, with the Banking Union well underway, the
eurozone financial configuration is stronger. Still, with
a region plagued by high unemployment rates and low
inflation, as well as a banking sector under repair, the
end of the current tailwinds may throw the region
back into recession.
(4) Emerging economies’ corporate debt: The current
risk of a crisis in the emerging economies emanating
from corporate debt levels and currency mismatches
is not to be considered systemic. It may lead to a high
level of corporate defaults, but on a macro level is
expected to be contained. This may change if capital
flows, exchange rates and interest rates move sharply
in the wrong directions, in conjunction with a further
decline of commodity prices. Firms in emerging
economies, active in commodity production, and
highly leveraged in foreign currencies with insufficient
hedging may then waver. That could trigger fear and a
sharp reaction in the financial markets, creating a
vicious circle of corporate defaults as well as a lack of
confidence in the emerging economies.
(5) Geopolitics: The situation in the Middle East has
escalated, a refugee problem in Europe and Russia
potentially thwarting the US-led coalition to fight IS.
This has created a second source of significant tension,
besides Ukraine, between Russia and the US and
Europe as well. So far, the economic impact, has been
contained, but further escalation in the Middle East
and/or re-escalation in Ukraine is a source of concern.
This may extend the term of the current international
sanctions against Russia, with potential impact on
energy prices. An impact on energy prices, specifically
oil prices that may become very volatile, may also
occur if the current IS containment is stopped and
their surge restarts.
Table 1.2 Risks to the global economic outlook
Risk issue Symptoms Effects Probability Impact
1. Chinese growth
Signs of further slowdown in
economic activity. Instability in
the banking sector.
Significant lower Chinese
economic growth. Spill-overs to
the rest of the world via trade
and commodity channels.
moderate high
2. Global monetary
policy
Unguided change in US
monetary policy. Insufficient
liquidity provisioning leads to
credit crunch.
Financial market volatility.
Capital outflows from emerging
markets. Further USD
appreciation.
moderate moderate/high
3. Eurozone
growth
Slowing economic growth.
Persistent decline in the rate of
inflation. Grexit.
Stagnation across the
eurozone. Re-escalation of
sovereign debt issues.
low/moderate moderate/high
4.
Emerging
economies’
corporate debt
Firms with high debt and
currency mismatches faced with
capital outflows, high interest
rates and weakened domestic
currencies.
Increase in corporate defaults.
Financial market volatility. Loss
of confidence in emerging
market economies.
low/moderate moderate
5. Geopolitics
(i) Escalating political and social
unrest in Ukraine. More US/EU
sanctions and Russian counter
sanctions, on energy trade.
(ii) Further surge of IS, Middle
East uncertainty.
(i) Severe recession in Russia.
Adverse effects on eurozone
and energy prices.
(ii) Higher energy prices and
high volatility.
(i) low
(ii) low
(i) moderate
(ii) low
Source: Atradius Economic Research

�
Economic Outlook 14
2. Advanced economies – prospects
and risks
Back in the driver’s seat
Economic growth is forecast to be solid across
advanced economies in 2016 as the eurozone and
Japan get closer to the positive performance of the US
and UK.
Steady does it
The eurozone is set to continue its economic recovery
that started in 2013 and is forecast to grow 1.7% in
2016. That is still modest of course, but is based on
solid domestic progress in individual member states.
The recovery is therefore relatively solid and expected
to continue over the coming years.
The US and the UK have seen their economies expand
at reasonable rates between 2% and 3% over the past
couple years, a trend which is forecast to continue in
2016. Despite these growth rates being significantly
higher than those of the eurozone, they remain
modest in historical perspective. The respective
domestic economies are developing well nonetheless
with unemployment falling rapidly in both countries.
Japan, the third largest economy in the world,
continues its fight against deflation while the
economy is forecast to see a modest expansion of
1.6% in 2016.
Table 2.1 Real GDP growth (%) – Major markets
2014 2015f 2016f
Eurozone 0.9 1.5 1.7
US 2.4 2.5 2.6
UK 3.0 2.5 2.4
Japan -0.1 0.6 1.6
Source: Consensus Economics (October 2015)
Known unknowns
The outlook is rather solid, but there are a number of
risks that could undermine the expansion. The biggest
threat comes from a significant slowdown in emerging
economies which could lead to a loss of exports by
advanced economies and impact financial returns.
Another risk stems from domestic dynamics that
could turn sour, for example, if interest rate increases
in the US lead to more (personal) defaults as debt
service costs rise. In the eurozone, the debt
sustainability issue is not completely resolved yet and
may flare up again in 2016. Overall the risks to the
outlook remain on the downside.
Eurozone: out of the frying pan into the fire?
The eurozone economy is finally picking up and after
six years is leaving the crisis behind. Growth
nonetheless remains muted and unemployment high.
2016 should be a year of better business conditions,
but potentially with residual troubles for individual
member states.
The eurozone awakens
The eurozone moved in and out of recession over the
past six years as it was fighting the bust following the
financial crisis in 2008. However, since mid-2013 the
recovery has slowly but steadily started to take hold.
By the end of 2015, the eurozone economy is
expected to surpass its beginning-of-2008 size. All 19
eurozone member states are showing positive
economic growth figures indicating that the recovery
is lifting all boats. That is also clear when looking at
the individual components of the economy:
consumers are spending again, business investment is
growing and exports are rising. This suggests that the
recovery is rather stable and likely to last.
At the same time, the sense of crisis has faded. Over
the past years when Greek debt sustainability became
prominent and financial markets panicked, there was
also a strong reaction visible in the yields of other
peripheral country government bonds. Yet there was
little alarm on financial markets when the Greek crisis
reached another boiling point in June 2015. Yields on
Spanish and Italian government bonds barely moved.

Economic Outlook 15
In fact, Spanish bond spreads correlated 0.85 with
Greek ones between January 2008 and September
2014, since then however the correlation dropped to
-0.16, meaning that they no longer move in the same
direction. Italian and Portuguese spreads show a
similar pattern. Exposure to Greece by companies in
other eurozone member states has been wound down
significantly over the past years, European institutions
have strengthened and the macroeconomic and
financial picture in the other periphery countries has
improved significantly. A potential Greek exit is no
longer expected to seriously hurt other eurozone
markets.
Source: IHS
The measures by the ECB have also contributed to the
easing of the crisis while at the same time have made
credit for companies extremely cheap. Thanks to low
interest rates and its bond-buying programme,
interest rates on financial markets are at record lows.
Large companies can benefit from these rates directly
by issuing bonds. Smaller companies also benefit as
banks pass on the low rates. The composite bank
lending indicator fell to 2.16% per annum in August
2015, the lowest rate since measures began in 2003.16
The ECB’s bank lending survey indicates that banks
are easing lending conditions and expect to continue
doing so in the fourth quarter of 2015. In August,
lending to companies also increased by 0.4%
compared to August 2014. That is still modest, but a
clear break from the trend of falling lending conditions
since 2012. The ECB policies have also led to a
weakening of the euro which is boosting exports. As a
result of strong export growth, the eurozone’s current
account balance is at its highest level since measures
began in 1970.
16 In fact, global interest rates appear to be “lower than at any time in the past
5,000 years”, according to the Chief Economist of the Bank of England.
http://www.bankofengland.co.uk/publications/Documents/speeches/2015/s
peech828.pdf
Source: ECB
The low oil prices are also providing a boost to
consumer purchasing power and company
profitability. The eurozone is a large importer of oil
and is estimated to benefit to the tune of EUR 100
billion in 2015 from the lower price. Consumers
benefit from lower gasoline prices as well as other
energy sources such as gas that have their prices
linked to oil. Consumer price inflation fell to -0.1% in
September thanks to falling oil prices, boosting overall
consumer purchasing power. The savings from the
lower prices are expected to increasingly lead to
additional spending rather than savings deposits as
the low oil prices are expected to stick. Not only
consumers but also many companies benefit from low
energy prices. Industrial companies such as chemical
producers enjoy lower input costs boosting
profitability. The same goes for the transport sector
including the airline industry. As many companies had
hedged against oil price fluctuations, the benefits will
be felt increasingly as previous hedges expire.
The crisis legacy
Despite positive developments, the aftermath of the
financial crisis is not completely gone yet.
Unemployment in many eurozone member states is
falling only slowly and remains high. The
unemployment rate in Spain was still a staggering
22.2% in July 2015. The eurozone aggregate
unemployment rate was 10.9%, the last time
unemployment was so high was in 1997. The health of
the labour market is important because it drives the
income of households and determines consumer
spending. While GDP may be back at its 2008 level,
consumer spending remains 3.5% below it. The retail
and hospitality sectors have been hit especially hard
over the past years as consumers cut back on
spending. It takes a tightening of the labour market
2
4
6
2003 2006 2009 2012 2015
2.2 Cost of borrowingLending rate to non-financial companies

Economic Outlook 16
and a subsequent rise in wages before consumer
spending can take off again.
Credit may finally be picking up, but banks are still
held back by a high share of non-performing loans.
The aggregate return on equity of eurozone banks fell
from 13% before the crisis to 8% in 2014. This reflects
both a higher regulatory burden and a loss of profit
from services. According to estimates by the IMF, the
banking sector has around EUR 1 trillion worth of non-
performing loans on their books, about 9% of
eurozone GDP. Offloading these to investors would
free up EUR 600 billion in capital for lending. This
implies settling non-performing loans with debtors.
Private sector debt rose rapidly from 123% of GDP in
2000 to 155% in 2008 fuelled by the credit boom.
With the bust of the financial crisis, the share of non-
performing loans rose rapidly, but consumers and
companies have been unable to offload their debt over
the past six years: in 2014 private debt was still 156%
of GDP. This is one of the reasons why investment
remains low. Capital expenditure as a percentage of
operating cash flows was below 48% in 2014,
compared to around 58% in 2007. The low investment,
in turn, helps explain the low job growth and poor
labour market conditions.
Source: OECD
The eurozone aggregate also hides the much weaker
performance of individual member states such as Italy,
where the economy is forecast to grow only 0.7% in
2015. The French economy, the second largest in the
eurozone, is also growing only slowly. Despite many
reforms planned by the French government, they have
not translated to effective action and the economy is
not taking off. It will in fact require a much more
fundamental overhaul of labour market regulation in
order to structurally improve the economic growth
prospects. The government is unlikely to take such
unpopular action as it faces numerous local elections
in the next two years. At the same time, the German
government is overly focused on maintaining a
balanced budget in its efforts to set an example to the
rest of the eurozone. That however hinders the
government from providing a much needed boost to
domestic demand in Germany, for example by
investing in infrastructure. This investment would also
spill over to the rest of the eurozone, but the
government refuses to consider such action.
Table 2.2 Real GDP growth (%) – Major markets
2014 2015f 2016f
Austria 0.4 0.8 1.5
Belgium 1.1 1.2 1.4
France 0.2 1.1 1.5
Germany 1.6 1.8 1.9
Greece 0.8 -1.3 -1.8
Ireland 4.8 5.4 3.8
Italy -0.4 0.8 1.3
Netherlands 1.0 2.1 2.0
Portugal 0.9 1.6 1.7
Spain 1.4 3.2 2.7
Eurozone 0.9 1.5 1.7
Source: Consensus Economics (October 2015)
The uncertainty over the debt sustainability of Greece
and its place in the eurozone also remains far from
resolved. The new third bailout package agreed
between the Greek government and the European
Union does not sufficiently address the problem of the
high Greek government debt levels. The agreement
only addresses the short-term funding needs of the
Greek government, which mostly encompasses the
repayment of earlier borrowed funds from the IMF,
ECB and European Union. Talks on a restructuring of
the debt are likely to continue into 2016. So will
discussions on the extent of implementation of
recommended measures by the Greek government as
all lending to Greece is conditional on implementing
reforms. The economy is meanwhile forecast to
contract more than 1% in both 2015 and 2016. This
comes on top of the previous six-year recession that
left the Greek economy 25% smaller than it was at the
beginning of 2008.
Return of the periphery
Yet it is also telling that the best performing markets
currently are the ‘trouble shooters’ of the past years.
Ireland, which received a bailout in 2010, is growing
Economic Outlook 17
by more than 4% in 2015. Also Spain, which received a
EUR 100 billion bailout in 2012, is growing by around
3% this year and is expected to continue at this pace in
2016. The distinction between ‘core’ and ‘periphery’
no longer applies: the by-many-analysts dubbed ‘PIGS’
(Portugal, Ireland, Greece and Spain) are, on average,
forecast to grow faster than Germany in 2015. With
the return of economic growth in these countries,
(except for Greece) the discussion around government
debt sustainability has disappeared. Ratios
automatically improve as the denominator, GDP,
grows more quickly, but also government finances
automatically improve when the economy picks up as
tax income rises and social spending falls. This is not
to say that there are no risks anymore. Indeed
sovereign ratings have not yet improved and the debt
situation in Greece remains unresolved. However, the
direction of the economy has changed, the buffers
have improved and the risks are falling.
Aging: the long decline
The crisis may be behind, but that does not mean the
boom years of before 2008 are going to return. The
eurozone enjoyed strong and stable growth in the
1980s, 1990s and first part of the 21st century. This
was violently disrupted by the financial crisis, but at
the same time, the crisis masked a more fundamental
change in the composition of eurozone growth.
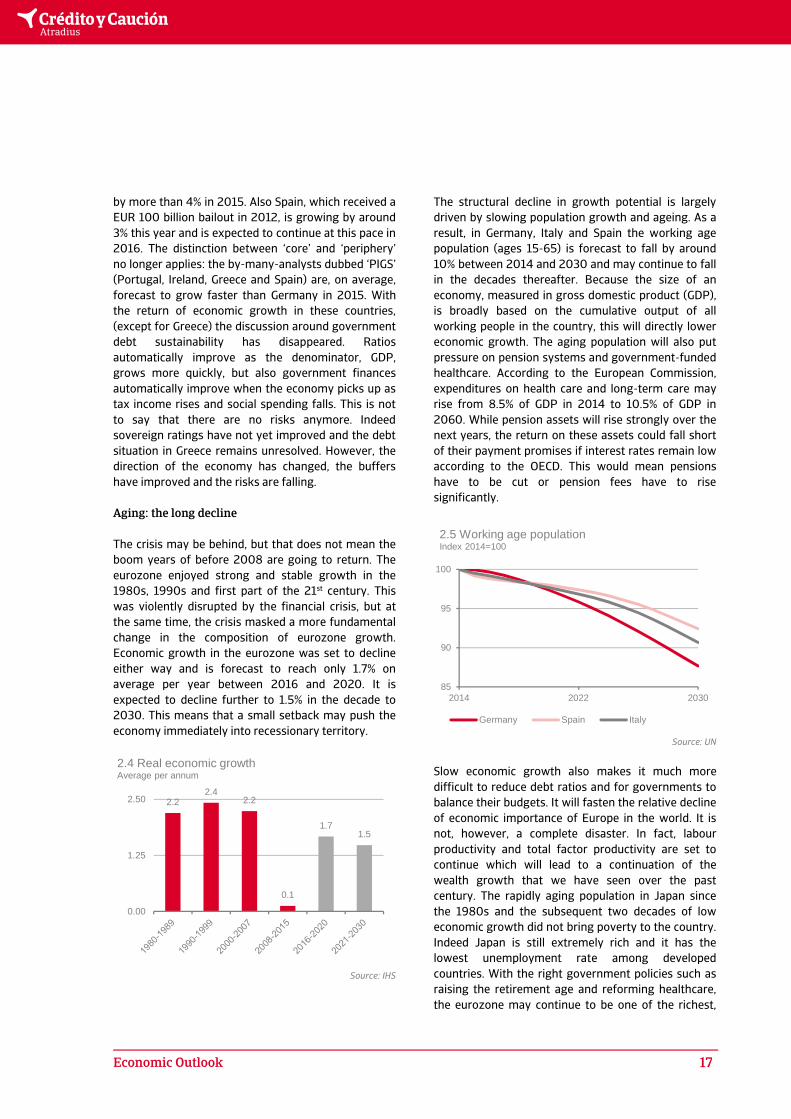
Economic growth in the eurozone was set to decline
either way and is forecast to reach only 1.7% on
average per year between 2016 and 2020. It is
expected to decline further to 1.5% in the decade to
2030. This means that a small setback may push the
economy immediately into recessionary territory.
Source: IHS
The structural decline in growth potential is largely
driven by slowing population growth and ageing. As a
result, in Germany, Italy and Spain the working age
population (ages 15-65) is forecast to fall by around
10% between 2014 and 2030 and may continue to fall
in the decades thereafter. Because the size of an
economy, measured in gross domestic product (GDP),
is broadly based on the cumulative output of all
working people in the country, this will directly lower
economic growth. The aging population will also put
pressure on pension systems and government-funded
healthcare. According to the European Commission,
expenditures on health care and long-term care may
rise from 8.5% of GDP in 2014 to 10.5% of GDP in
2060. While pension assets will rise strongly over the
next years, the return on these assets could fall short
of their payment promises if interest rates remain low
according to the OECD. This would mean pensions
have to be cut or pension fees have to rise
significantly.
Source: UN
Slow economic growth also makes it much more
difficult to reduce debt ratios and for governments to
balance their budgets. It will fasten the relative decline
of economic importance of Europe in the world. It is
not, however, a complete disaster. In fact, labour
productivity and total factor productivity are set to
continue which will lead to a continuation of the
wealth growth that we have seen over the past
century. The rapidly aging population in Japan since
the 1980s and the subsequent two decades of low
economic growth did not bring poverty to the country.
Indeed Japan is still extremely rich and it has the
lowest unemployment rate among developed
countries. With the right government policies such as
raising the retirement age and reforming healthcare,
the eurozone may continue to be one of the richest,
2.22.4
2.2
0.1
1.71.5
0.00
1.25
2.50
2.4 Real economic growthAverage per annum
85
90
95
100
2014 2022 2030
2.5 Working age populationIndex 2014=100
Germany Spain Italy

Economic Outlook 18
most modern and economically secure places in the
world over the coming decades. As the eurozone
leaves the euro crisis behind, governments, companies
and households can start looking ahead and adjust to
a positive but modest economic expansion.
United States: ready, set…wait!
The United States economy is expected to continue as
a major global engine for growth in 2015 and 2016.
The recovery is robust, marked by a 2.5% growth
forecast for 2015 and a further 2.8% expansion
forecast for 2016. Downside risks have grown over
the year, particularly stemming from external volatility,
pushing back a much-anticipated Fed lift-off.
Consumers warm up after cold start
The first quarter of 2015 was marred by one-off
factors including harsh winter weather and port
closures on the west coast. However, the economy
bounced back since the second quarter, displaying
broad-based demand-driven growth and rising
consumer confidence. Despite cheap oil and a strong
dollar, consumption growth stayed modest, below 2%
on average from 2010 to 2014. This is partly because
low interest rates caused many American consumers
to worry about not accumulating as much interest on
their pension savings, motivating them to save more
than previously planned. Consumption has been
gradually rebounding over the past year, averaging
3.3% growth in 2015. Consumer spending accounts for
more than two-thirds of US GDP so its expansion
should boost overall growth over the remainder of
2015 and in 2016.
Sources: Federal Reserve Bank of Atlanta, BEA
There are several developments encouraging
Americans to loosen their purse strings – one namely
being the improving labour market. Unemployment
has been flat at 5.1% since August 2015, one
percentage point lower than in August 2014, and
about half of the peak in October 2009. Job security
has risen and nominal wages have finally begun to tick
up, albeit very modestly, averaging 3.2% annual
growth this summer. Wage growth is expected to
continue picking up as slack in the labour market
disippates.
US consumers are further aided by a strong dollar and
low inflation of only 0.2% year-on-year in August. The
extra disposable income generated by low oil prices is
finally translating into extra spending as well.
Furthermore, in the low interest rate environment,
Americans have increased their purchases of big-
ticket items like cars and houses.
The outlook for US consumption growth is positive
and it is helping other sectors of the economy, namely
the housing market. Construction spending rose 0.7%
month-on-month in August, the largest growth since
2008, as demand for new housing feeds through.
Larger stock market volatility, however, could put
pressure on spending in the coming year since
Americans may be inclined to save instead of spend
due to relatively high exposure to equities through
investments and/or retirement savings.
Strong greenback weighing on exporters
American exporters are not faring as well as
consumers. In the first half of 2015, exports
contracted for the first time since the height of the
financial crisis. The strong USD is partly to blame: in
real effective terms, the currency has appreciated
more than 10% since mid-2014. Equally important is
waning demand for US exports in key markets like
Canada and Brazil, whose currencies have depreciated
sharply against the USD and China, where growth has
moderated. The manufacturing sector in particular has
been hit by these developments, with activity falling to
its lowest level in two years.
Overall annual export growth is expected to reach
1.7% in 2015 and rebound to 3.7% next year. However,
this estimate is likely to be optimistic. Pressure on the
USD may continue as domestic demand remains
elevated compared to most other advanced
economies, the Fed normalises monetary policy and
oil prices remain muted. Furthermore, should
emerging markets continue to weaken along with
external demand, the medium-term outlook will be
dampened.
-3
0
3
6
2008 2010 2012 2014
2.6 Wage and consumption growth3-month moving average, annual percent change
Wage growth Consumption growth

Economic Outlook 19
Source: Federal Reserve Economic Data
Oil sector hunting for savings
The American shale industry has become one of the
global energy swing producers, but pressure is
mounting. A barrel of WTI crude oil hit a seven-year
low below USD 39 in late August this year and has
stabilised between USD 45-50 in September. For now,
US production continues to grow, albeit at a slower
pace. US oil producers are now bearing the brunt of
the price pressures since such low prices have made it
difficult for shale producers to break even and to
secure new investment.
Sources: Baker Hughes, EIA
As a result, many US oil producers have shifted their
focus to belt-tightening. The number of oil rigs in
operation, an indicator for future production, has
declined by nearly 60% since the beginning of the year.
More than 60,000 jobs were cut in the energy sector
in the first half of 2015 and investment in the sector
has fallen. Exploration and other capital expenditures
will continue to fall. Access to capital is also restricting,
particularly for small producers, which could lead to
increased bankruptcies. The outlook for 2016 remains
bleak as demand for oil outside the US remains muted
and oversupply is expected to continue (notably with
Iranian oil likely entering the market). The potential
lifting of the US ban on exporting crude oil could
provide a boost for the American oil industry though.
Fed lift-off: are we there yet?
Despite difficult environment for US shale producers
and the drag on net exports, the American recovery is
expected to continue strongly over the coming years,
driven by private consumption. The negative external
pressures will be outweighed by the benefits of lower
energy prices, higher consumer spending and an
improving housing market. Although generally strong
US data pointed to a rate hike in September, the Fed
surprised markets referring to the potential
consequences of global and financial developments on
the US economy. Inflation and the labour market data
in particular held back the Fed’s decision.
Inflation remains far below the Fed’s 2% target: the
consumer price index declined 0.2% in September.
Core inflation (excluding food and energy prices) on
the other hand increased 1.9%. Low inflation appears
to be a structural issue, as opposed to one driven by
one-off factors like the low oil price and cheap imports.
Low wage growth through the recovery, for instance,
has weighed on prices. Leading up to the coming
FOMC meetings, all eyes will be on the labour market.
Source: BLS
While unemployment has indeed been falling since
late 2009, now approaching pre-crisis levels, and
wage growth has finally begun responding, the labour
market is still not performing at a level to offer
enough confidence to pursue a rate hike. Most notably,
the labour participation rate remains well below the
rate in 2007 and the steady downward trend since
2008 does not appear to be slowing down. The latest
participation rate is about 62%, more than four
percentage points lower than before the crisis and the
lowest rate the US has seen since 1977. Some of this
-25
-13
0
13
25
2007 2009 2011 2013 2015
2.7 Exports of goods and servicesPercentage change per annum
0
4000
8000
12000
0
600
1200
1800
2007 2009 2011 2013 2015
2.8 US oil productionRig count, oil production in thousands of barrels
Rig count Crude oil production (R)0
3
6
9
12
60
62
64
66
68
2005 2007 2009 2011 2013 2015
2.9 US labour marketPercentage, seasonally-adjusted
Participation rate Unemployment rate (R)

Economic Outlook 20
decline can be attributed to changing demographics
(the aging population), but many other advanced
markets are facing the same dilemma and not seeing a
shrinking labour force participation. Lower
participation in the labour force is a significant driver
of declining unemployment so until these numbers
become more robust, the Fed is likely to remain
hesitant to raise interest rates.
So while the Fed is looking to China and volatile
financial markets, they are also looking keenly at
domestic inflation and labour market data, in order to
justify lift-off. It is important that the American
economy can weather negative external shocks and
that wage growth and the participation rate in the
labour force improve. It is expected that the data will
be robust enough to show this by early 2016.
United Kingdom: time to dig deeper
The picture for the United Kingdom is more mixed, but
compared to its continental neighbours, the recovery
is well-entrenched. Economic growth has been steady
at 2.3% in the first half of 2015, supported by lower
energy prices and a gradual recovery in wage growth.
Annual growth in 2015 is forecast at 2.6% and will
continue at 2.5% in 2016.
Recovery benefitting from the “easy” fixes
UK exporters have been hampered by the strength of
the pound, reaching seven and a half year highs
against a basket of major currencies. The outlook for
exports is bleak, due to global economic uncertainty
regarding the China slowdown, falling imports in
BRICS economies and imminent Fed rate hike.
Therefore, domestic demand is critical for growth in
the near term. Similar to the situation in the US, UK
domestic demand has been strong thanks to rising
employment, a long-awaited pick-up in wage growth
and the benefits of lower global oil prices.
In the most recent Monetary Policy Committee (MPC)
meeting, the Bank of England voted to maintain the
key policy rate at 0.5%, citing continued disinflationary
pressures from the renewed decline in oil prices and
constraint to imports that the appreciated GBP has
caused. On the other hand, they recognised that
overall economic growth is robust, particularly driven
by stronger consumer sentiment, real income growth
and higher domestic demand, and gains in
productivity. Further gains in productivity, which has
flat-lined since 2008, are crucial to sustain growth in
2016 and beyond as consumption could become
restrained due to inflation picking up gradually and
the government reining in spending.
More challenging reforms needed to sustain growth
Increasing domestic demand has contributed to the
rising output of the services sector which accounts for
more than 75% of UK GDP and 80% of total
employment. Productivity growth in the services
sector has been lacklustre – growing an average of
0.5% since the crisis, compared to 2% annually in the
period before – but it appears to finally be ticking up.
In the first half of this year, productivity growth in the
services sector as measured by the annual percentage
change in output per job has grown nearly 3%. The
manufacturing sector’s productivity growth on the
other hand has contracted 0.6% in the same period,
weighed down by persistent subdued demand in the
eurozone and the strength of GBP relative to the EUR.
Source: ONS
Tradable services – mostly business, professional and
financial services – have led productivity growth in the
services sector. Services exports account for 12% of
UK GDP and according to the WTO, the UK is second
only to the US in exports of commercial services. The
share of UK service exports is likely to even surpass
that of manufacturing exports in the coming years.
While British manufacturers struggle due to the
strong pound and weak export demand, the services
sector is as important as ever to sustain economic
growth in the UK. The UK also needs to liberate trade,
particularly for services exports and diversify the
destination of exports with the aim on emerging
markets. 17 The Bank of England sees a gentle
17 See Atradius Economic Research note “Brexit: top 5 countries and sectors at
risk” for a more in-depth look into UK’s trade patterns.
-10
-5
0
5
10
2000 Q1 2003 Q1 2006 Q1 2009 Q1 2012 Q1 2015 Q1
2.10 Productivity growth Percentage change per annum, quarterly
Whole economy Services Manufacturing

Economic Outlook 21
deceleration in the services sector as a natural
consequence of the economy finally reaching a
balance after the downturn, but improvement of
productivity and export capacity of British services is
key to sustainable long-term growth.
Japan: recovery failing to pick up steam
The pace of Japan’s economic recovery remains slow.
A return to positive GDP growth is expected in 2015
(0.6%), supported by lower energy prices,
accommodative monetary policy and yen depreciation,
but the large monetary and fiscal stimulus still
struggles to significantly boost growth and inflation.
In 2016, the Japanese economy is forecast to grow
1.6%.
Not so good at archery
Despite a strong first quarter performance, the
Japanese economy contracted in the second quarter
and industrial production has continued to decline. It
appears that the country fell back into a recession in
the third quarter. The three arrows of Prime Minister
Shinzo Abe’s economics plan – otherwise known as
Abenomics – have fallen short of their targets.
Rising business profits have not translated into wage
growth and inflation is staying stubbornly low. In fact,
consumer prices contracted in August 2015 compared
to August 2014 for the first time since the quantitative
easing programme began. Abenomics has failed to
address the large fiscal deficit and government debt
so far. Sovereign debt stands at nearly 250% of GDP,
warranting a downgrade by rating agency S&P.
Despite yen depreciation, net exports have seen a little
boost – in fact, exports are even slumping now, largely
due to low demand in China.
Source: IHS
There are bright spots such as private-sector
investment spending and private consumption which
have finally picked up. Core inflation is relatively stable
and the Trans-Pacific Partnership (TPP) should
provide a boost for Japanese trade in the medium
term. Prime Minister Shinzo Abe has also reaffirmed
his policy commitment to the economy by
aggressively pursuing the third arrow of Abenomics,
structural reforms, and revamping his plan to focus on
economic growth as opposed to debt.
Structural reforms and deregulation are key to
attracting overseas investment and expanding exports.
Japan is faced with a similar productivity puzzle as
Europe and the UK, as the country is burdened with a
shrinking and aging population. The challenges remain
high, however, and it is more and more probable that
the Bank of Japan will expand its quantitative easing
programme. It is expected that in 2016, the benefits
that ultra-loose monetary policy provides to private
consumption and investment will finally bear fruit.
�
Economic Outlook 22
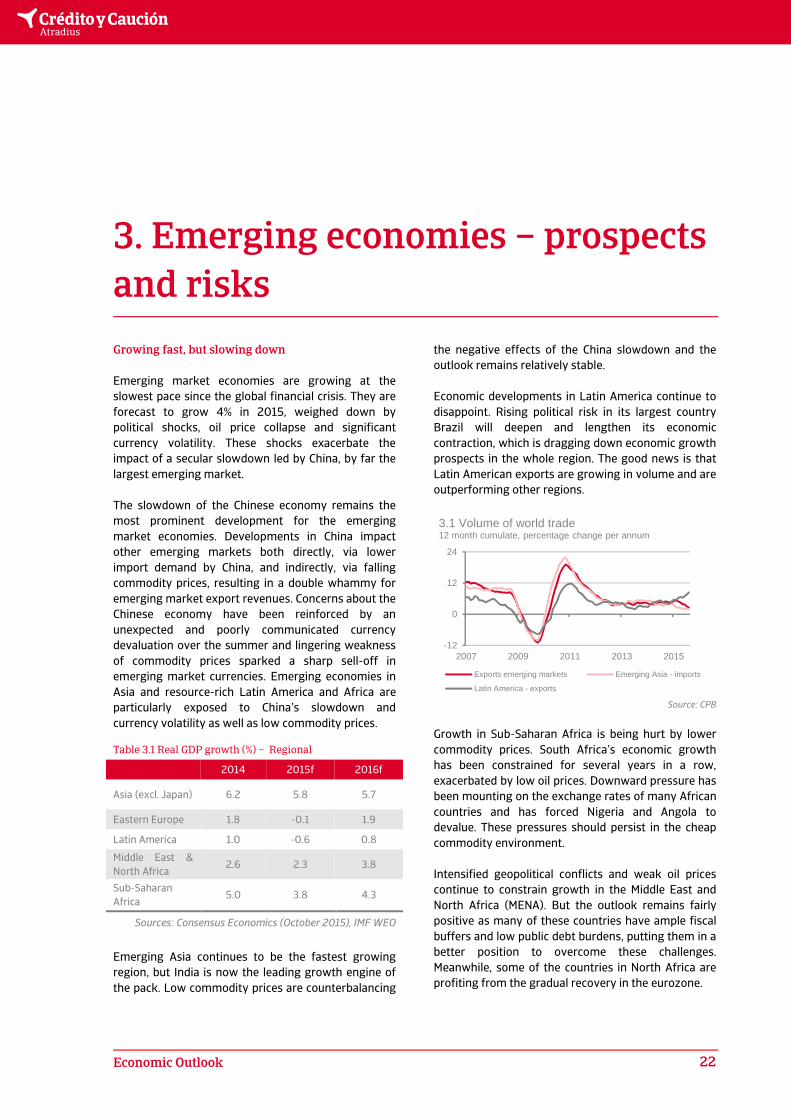
3. Emerging economies – prospects
and risks
Growing fast, but slowing down
Emerging market economies are growing at the
slowest pace since the global financial crisis. They are
forecast to grow 4% in 2015, weighed down by
political shocks, oil price collapse and significant
currency volatility. These shocks exacerbate the
impact of a secular slowdown led by China, by far the
largest emerging market.
The slowdown of the Chinese economy remains the
most prominent development for the emerging
market economies. Developments in China impact
other emerging markets both directly, via lower
import demand by China, and indirectly, via falling
commodity prices, resulting in a double whammy for
emerging market export revenues. Concerns about the
Chinese economy have been reinforced by an
unexpected and poorly communicated currency
devaluation over the summer and lingering weakness
of commodity prices sparked a sharp sell-off in
emerging market currencies. Emerging economies in
Asia and resource-rich Latin America and Africa are
particularly exposed to China’s slowdown and
currency volatility as well as low commodity prices.
Emerging Asia continues to be the fastest growing
region, but India is now the leading growth engine of
the pack. Low commodity prices are counterbalancing
the negative effects of the China slowdown and the
outlook remains relatively stable.
Economic developments in Latin America continue to
disappoint. Rising political risk in its largest country
Brazil will deepen and lengthen its economic
contraction, which is dragging down economic growth
prospects in the whole region. The good news is that
Latin American exports are growing in volume and are
outperforming other regions.
Source: CPB
Growth in Sub-Saharan Africa is being hurt by lower
commodity prices. South Africa’s economic growth
has been constrained for several years in a row,
exacerbated by low oil prices. Downward pressure has
been mounting on the exchange rates of many African
countries and has forced Nigeria and Angola to
devalue. These pressures should persist in the cheap
commodity environment.
Intensified geopolitical conflicts and weak oil prices
continue to constrain growth in the Middle East and
North Africa (MENA). But the outlook remains fairly
positive as many of these countries have ample fiscal
buffers and low public debt burdens, putting them in a
better position to overcome these challenges.
Meanwhile, some of the countries in North Africa are
profiting from the gradual recovery in the eurozone.
-12
0
12
24
2007 2009 2011 2013 2015
3.1 Volume of world trade12 month cumulate, percentage change per annum
Exports emerging markets Emerging Asia - imports
Latin America - exports
Table 3.1 Real GDP growth (%) – Regional
2014 2015f 2016f
Asia (excl. Japan) 6.2 5.8 5.7
Eastern Europe 1.8 -0.1 1.9
Latin America 1.0 -0.6 0.8
Middle East &
North Africa 2.6 2.3 3.8
Sub-Saharan
Africa 5.0 3.8 4.3
Sources: Consensus Economics (October 2015), IMF WEO

Economic Outlook 23
The gradual recovery in the eurozone also supports
economic growth in countries in Central and Eastern
Europe. The sharp economic contraction in Russia and
growing economic instability in Turkey are negatively
impacting growth for the region as a whole. On a
positive note, prospects for Russia and thus, for the
region, are somewhat improving.
Outlook marred by high external corporate debt
Although growth is set to pick up in 2016, projections
have been revised down further over the past six
months to 4.5%. The outlook has become more
pessimistic as concerns rise regarding the Chinese
slowdown, persistent low commodity prices, US
monetary policy normalisation, heightened
geopolitical risks, reduced capital flows and increasing
financial market volatility.
Mounting pressure on emerging market exchange
rates and weakening economic growth have increased
worries about debt sustainability and creditworthiness.
These concerns are being fed by increased external
debt, particularly concentrated in the corporate
sectors, in some emerging markets in recent years.
Externally-financed corporate debt ratios in terms of
export receipts are particularly high in Brazil, India,
Indonesia, Mexico, Russia and Turkey. This makes
corporates in these countries increasingly vulnerable
to a shift in global market sentiment, rising interest
rates and currency depreciation. Of these countries,
Turkey is most exposed, considering relatively low
buffers compared to its external financing
requirements, which are almost twice as high as
official reserves for the country as a whole.
Despite all these risks, shock resistance of emerging
markets as a group has improved compared to
previous episodes of financial market volatility, due to
much improved policy frameworks, more robust
foreign reserves, flexible exchange rate regimes and
lower external debts; particularly of sovereigns. The
latter enables many emerging markets to use the
exchange rate as a shock absorber.
Asia: when China sneezes, not all countries get a
cold
The growth slowdown in China is the most prominent
development in the world economy this year,
impacting global commodity prices and emerging
economies, including neighbours in emerging Asia.
Regional economic growth is forecast at 5.8% this year.
This is down from an average growth of nearly 8%
over the previous five years, when the region
benefited from loose global monetary policy
worldwide; which contributed to large capital inflows
to emerging markets.
Many countries are in much better shape today to
handle the Chinese slowdown and other uncertainties
like changing monetary policy and low commodity
prices than they were when the Asian crisis broke out
in 1998. China may be sneezing, but not all Asian
countries will catch a cold. Emerging Asia will remain
the global growth carrier this year and next.
Table 3.2 Real GDP growth (%) – Asia
2014 2015f 2016f
China 7.3 6.8 6.5
Hong Kong 2.5 2.3 2.2
India 7.3 7.5 7.8
Indonesia 5.0 4.7 5.0
Singapore 2.9 2.0 2.4
Taiwan 3.8 1.4 2.4
Sources: Consensus Economics (October 2015), Atradius
China: soft chance of a hard landing
Will the cold that the Chinese economy has caught
turn into a more serious illness? Will it turn into a hard
landing where economic growth is insufficient to
create enough jobs for the growing urban labour
force? If this ends up as the diagnosis, social unrest
could occur and the side-effects would be felt even
stronger outside of China. Credit risk in the region is
then expected to increase and private debt obligations
to be harder to fullfil.
It does not seem that such a pessimistic scenario will
unfold. Chinese authorities should be able to avoid a
hard landing and let GDP growth slow gradually, to
levels of about 6% in 2016 and 5% in 2019, after about
6.8% this year. As China’s economy loses steam, it
seems to fit into a natural transition from an export-
oriented economy to a domestic consumption-led one,
as Japan and South Korea experienced decades earlier.
Of course, there are some reasons to be concerned
that the pessimistic scenario will play out. First, weak
macro data have been published, especially in the
industrial sector. The forward-looking manufacturing
purchasing managers’ index (PMI) says it all: it has

Economic Outlook 24
declined to the lowest level in 6.5 years. In that
context, it is no surprise that investments are growing
at the lowest rate in 15 years (which still is more than
10% year-on-year). Secondly, the weak data
concerning industrial production is not expected to
abate soon. Factories are saddled with overcapacity
and the nationwide construction boom is abating.
Thirdly, China has to deal with its huge debt burden, of
about 280% of GDP, which is the result of government
stimulus programmes that started in 2008.
Source: IHS
On the other hand, private consumption is, to a certain
extent, counterbalancing investments. The rising
incomes of migrant workers (which rose by 10% year-
on-year in the second quarter) are spent more and
more on furniture, home electronics and even
jewellery. Overall, retail sales have increased by more
than 10% in real terms this year. Besides this, sales
growth is probably underestimated, as services are
not included in the retail figures and surveys show
that services account for about 40% of consumer
spending in China. The services PMI, in contrast with
its manufacturing counterpart, is well above the
neutral 50 mark. In addition, the services sector now
employs more people than the industrial sector.
Another structural tailwind for spending is that the
high savings rate of Chinese housholds is expected to
fall due to the greying population. Older people draw
down their accumulated wealth and the younger
generation is more eager to spend than the older
generations were some decades ago.
Whether the transition towards consumption-led
growth will occur with a hard landing depends
primarily on the tools the authorities can use. At the
moment, they seem to have enough ammunition to
get the economy on the right track. Monetary policy
has already been loosened and the People’s Bank of
China (PBC) has more room to lower rates further.
Inflation is rather low at only 2%, whereas the lending
rate is still at 4.6%.
The central government also has some room to help
the economy. During the summer, fiscal spending rose
rapidly, which will be felt in the economy with some
lag. The central government is in a position to prolong
the fiscal stimuli, but with overcapacity in a lot of
sectors, this questions the potential effectiveness of it.
Future measures could also be limited by local
governments who are in a weaker fiscal position than
the central government. They face straitened
circumstances because of the introduction of tougher
regulatory controls on local government financing
vehicles (LGFVs). They try to preserve their spending
plans by replacing expensive bank loans with bonds.
However, the provinces’ dependence on central
government funding will make it hard to price default
risk effectively.
The tools that the authorities have will most likely
allow China to avoid a hard landing, but the high level
of total debt will be an obstacle. Besides the local
governments, real estate and related industries are
highly leveraged, including state-owned enterprises in
the real estate sector, as well as in the mining and
utilities sectors. Whereas public debt as a percentage
of GDP is still much lower than in Europe and the US,
total debt excluding the financial sector exceeds the
levels there. The debt problem also means that the
PBC will remain cautious with further easing of the
monetary policy, but still has more targeted means of
creating more liquidity in the economy at its disposal.
China’s shift from investments to consumption,
although gradual, means that the current account
surplus should fall in the coming years, from 4% of
GDP now to about 0.5% in 2019. The high growth of
exports during the period up to 2013 is not expected
to return and the services deficit will widen sharply
because of rising tourist expenses abroad and the
liberalisation of services trade.
The rest of Asia, and emerging economies in the rest
of the world, are confronted now with weak demand
from China. Imports are declining this year more than
2% year-on-year, and probably will show weak growth
again in 2016. Furthermore, a growing portion of
imports will be used for domestic consumption rather
than in export-oriented manufacturing. The
consumption boom in China will not support the world
economy as much as the investment boom of the last

Economic Outlook 25
two decades. Chinese consumers may buy more South
Korean cosmetics and spend more money on
vacations in Thailand or the Maldives, but this will not
compensate the loss of demand that Indonesian coal
mines and Malaysian oil producers will experience.
At a further point in the future, devaluation of the
Chinese currency is also a risk for China’s trade
partners. Since the devaluation over the summer, the
PBC has intervened extensively in the foreign
exchange market to support the currency, while
capital is flowing out of China. Because of this, China’s
foreign exchange reserves tumbled so much that
concerns about the PBC engaging in a currency war
have quieted. Up to now, we have seen the
devaluation as part of the process towards a more
freely floating renminbi. A second step is not probable
in the near term. The fall in the foreign exchange
reserves in nominal terms was large, but, in relative
terms, and compared to other countries, it was limited.
However, like other countries with currency pegs,
China will eventually allow a further renminbi
depreciation.
India: outpacing the others
India’s growth outlook is the brightest in Asia with a
7.5% expansion of the economy forecast for 2015. The
country is reaping the benefits of a stable government,
low oil prices (as it is a net oil importer), and record
portfolio and direct investment. Domestic demand has
been rising on the back of strengthening fixed
investment and industrial production. The forward-
looking manufacturing and services PMIs are
optimistic. However, India’s growth story is not
without challenges in the near term.
The economic slowdown being seen across emerging
markets weighs on India’s growth as well – namely
through lower demand for Indian exports.
Furthermore, ambitious and necessary structural
reforms are also progressing at a slow pace due to
fierce opposition in the upper house of parliament
which is weighing on investor sentiment. These have
led to a reduction in India’s 2015 growth forecast, but
are expected to improve slightly next year, and more
so in the medium term should structural reforms be
effectively implemented. It is anticipated that India
willcontinue its healthy expansion in 2016 with 7.8%
growth expected.
ASEAN: turbulent times ahead
The ASEAN economies of Southeast Asia are entering
turbulent times from a good starting position. For the
so-called ASEAN-5 (the five largest developing ASEAN
markets: Indonesia, Malaysia, Philippines, Thailand
and Vietnam), economic growth is forecast at 4.6% for
2015, flat from the year before. The aggregate
number remains relatively strong, but the region is
diverse and external challenges are rising, with each
market forced to confront them differently.
Source: IHS
ASEAN’s industrial powerhouses of Indonesia,
Thailand and Malaysia are countering the hostile
external environment by widening the tax base and
shifting spending from (fuel) subsidies to considerable
infrastructure investments. Meanwhile, they face
serious political challenges at home, hindering, but not
preventing, the implementation of effective policy. In
Thailand, a military government has returned stability,
but a military push for constitutional redesign stirs
fears of possible unrest. In Malaysia, alleged
corruption by the prime minister and a crumbling
opposition have led to protests and endangered the
ruling coalition. Reformist president of Indonesia, Joko
Widodo, has to battle establishment forces to push
through necessary reforms and investment.
Thailand is relatively insulated from external trends
through its currency, which is one of the region’s most
stable, is helped by strong fundamentals in the form
of high reserves, low foreign currency debt and low
portfolio liabilities. Limited dollarisation and high long-
term FDI versus portfolio investment make monetary
easing a viable stimulus. However, soaring private
debt levels over 150% of GDP and declining regional
competitiveness will render such policy ineffective, as
debt-driven domestic demand cannot be expected to
grow much more and exports decline, causing slow
65
75
85
95
105
2013 2014 2015
3.3 Exchange rate vis-a-vis the US$index, early May 2013 = 100
Indonesia Malaysia Thailand

Economic Outlook 26
growth. While Thailand has a reasonably diversified
economy – it is not a major mineral exporter and does
not depend on China for the bulk of its exports –
falling export volumes through the beginning of the
third quarter still indicate vulnerability to falling
external demand and possibly more structural factors.
Even so, the Thai economy is showing renewed
growth under the military regime. Growth is headed
for 2.7% in 2015 and to a solid 3.4% in 2016. This,
however, is based on government investment and a
return of confidence that may fade as a result of
tensions surrounding ongoing constitutional revision
and elections set for 2017.
In Malaysia, private consumption continues to drive
GDP growth despite rising private sector indebtedness
and household debt (87% of GDP at the end of 2014).
This is followed by high investment, partially driven by
government expenditure. These factors are expected
to drive economic growth to 4.8% in 2015 and 4.7% in
2016, in spite of downward pressure on net exports.
The Malaysian ringgit has fallen very hard on the back
of commodity prices as well as political fall-out from
an ongoing corruption scandal that has hurt investor
confidence. Portfolio investment and external finance
requirement in Malaysia are high compared to
reserves, making the ringgit more vulnerable than the
Thai baht in the current environment. Dependence on
foreign currency inflows from substantial oil and
commodity exports amplifies this effect. The ringgit is
now undervalued and should be expected to rise but,
surprisingly, sharp currency depreciation has not led
to high inflation.
Currency woes are more of a headache for Indonesia,
which has seen a similarly deep fall. Downward
pressure will most likely persist over the coming year
due to the slowdown in China and low commodity
prices which have reduced exports. This has left
Indonesian firms increasingly vulnerable due to their
large share of external debt. Corporate external debt
has more than doubled since 2010 and is now 71% of
total exports, the highest such ratio in the world. This
increases refinancing risk for firms and their
vulnerability to exchange rate depreciation. Overall,
the external debt and current account deficit are
relatively low and access to liquidity is very strong for
Indonesia. Therefore, corporate external debt is a
firm-specific, rather than country-wide issue.
Rupiah depreciation also has wider implications for
the Indonesian economy. It is contributing to already
high inflation through rising import prices. High
import prices stifle previously promising consumption
growth, while the central bank cannot ease interest
rates for fear of weakening the currency further.
Infrastructure spending is lower than planned due to
establishment politicians clinging on to fiscal discipline
and because of spending inefficiencies, leading to
lower-than-potential, but nonetheless high economic
growth. Foreign exchange controls have been
implemented to reduce dollarisation. With the
currency outlook still uncertain, the overall economic
outlook for next year is positive with 5.2% expansion
forecast.
Thailand and Malaysia will refrain from instituting
foreign exchange controls, and overall, flexible
exchange rates serve as an effective shock absorber
while increasing export competitiveness. Real central
bank interest rates remain relatively high and help
retain capital and support currencies. Growth is robust
but risks linger, and much depends on the ability of
the respective governments to implement effective
policies while navigating troubled political waters.
Latin America: dragged down by Brazil and falling
commodity prices
Economic developments in Latin America continue to
disappoint. This resource-rich region is particularly
exposed to the slowdown in China and falling
commodity prices, with commodities accounting for
over 50% of exports and 10% of GDP. Policy
shortcomings in some countries, most notably Brazil,
which represents 40% of regional GDP, are negatively
affecting regional economic growth.
Table 3.3 Real GDP (annual % change)
2014 2015f 2016f
Argentina 0.5 0.9 0.8
Brazil 0.1 -2.8 -1
Chile 1.9 2.1 2.4
Colombia 4.6 2.8 2.8
Mexico 2.1 2.3 2.8
Peru 2.4 2.7 3.5
Venezuela -3.7 -7.8 -3.7
Source: Consensus Economics (October 2015)
Meanwhile, intra-regional divergences persist. The
energy importing and manufacturing countries
focused on the US will benefit from cheaper oil and a
recovering US economy. These countries are mainly
located in Central America and the Caribbean. The

Economic Outlook 27
economies of the Pacific Alliance countries – Chile,
Colombia, Mexico, and Peru – are holding up and
continue to perform above average, despite lower
commodity prices. This reflects a much improved
ability to withstand shocks stemming from global
headwinds than in the past. Stronger policy
frameworks, a large stock of foreign-exchange
reserves, and modest external refinancing needs
enable them to use the exchange rate as a shock
absorber. The latter is also true for Brazil, given its still
modest external financing needs.
Source: IHS
Argentina and Venezuela: waiting for elections
In both Argentina and Venezuela, hopes for a policy
change are elevated ahead of legislative elections,
scheduled for late 2015. Credit risks in the short- to
medium-term remain very high, independent of who
wins, given the dire state of their economies. A change
to more market-friendly policies is most likely in
Argentina, but also here, unwinding the huge
macroeconomic imbalances will be a prolonged affair,
undermining growth prospects for 2016.
Presidential elections in Argentina, where the
government remains in default, will bring an end to
the Fernández administration, as she’s unable to run
for a third term. The candidate of the government
coalition, Daniel Scioli, won the first round against
opposition candidate Mauricio Macri, but not by
enough votes to take the presidency outright (second
round on November 22). Both candidates advocate
more liberal, business-friendly policies than the
current administration, but implementation speed
would differ. A policy shift under Scioli would be more
gradual and moderate, whereas Macri’s approach
would be more forceful. Both candidates have also
prioritised reaching a deal with the holdout creditors.
Although this is a necessary condition to improve
prospects in the medium-term, it will not be sufficient
as it needs to be accompanied by a return to more
orthodox macroeconomic policymaking.
Meanwhile in the run-up to elections, policies are
further radicalized to preserve official reserves and
stabilise the exchange rate causing macroeconomic
imbalances to continue to grow. Economic growth is
being supported by very expansionary fiscal policies,
which undermine government creditworthiness and
result in accelerating inflation and capital flight.
Thereby, they are actually deepening the economic
crisis. The risk of uncontrolled currency depreciation
and transfer and convertibility risk remains extremely
high, given still substantial peso overvaluation, tight
liquidity and lack of access to international capital
markets. This creates a challenging environment for
the next government that takes office in December.
Venezuela’s economy is in free-fall, following the most
recent drop in oil prices, as oil accounts for almost all
exports. With the economic contraction deepening,
inflation is accelerating and shortages are growing. In
this environment, the ruling Partido Socialista Unido
de Venezuela (PSUV) will most likely face massive
losses at December 6 legislative elections. Although
political confrontation is likely to increase after the
election, a policy change is highly unlikely and it is
generally expected that president Maduro will stay in
office. Next presidential elections are not due until
December 2018. Foreign exchange remains extremely
scarce as official reserves have dwindled due to low oil
prices and allocation is subject to bribe and political
relations which result in long waiting lists and
payment delays. The country is heavily reliant on
financing flows from China, which funds its rising
external financing requirements. Financial fragility and
the absence of immediate policy change keep risks of
devaluation, transfer & convertibility and default
extremely high over the outlook period.
Brazil: confidence shaken, current account
rebalancing
Credit risks are rising further in Brazil and short-term
prospects have deteriorated. The economic
contraction is deepening, confidence is badly shaken
by a corruption scandal at oil giant Petrobras and
mounting political turmoil, and the currency is
depreciating. As a glimmer of hope, export volumes
are rising due to rising oil production and mining,
while external imbalances are narrowing more rapidly.
This illustrates the ability of the exchange rate to
50
75
100
2013 2014 2015
3.4 Exchange rate vis-a-vis US$early May 2013 = 100
Brazil Mexico ChileColombia Peru Argentina

Economic Outlook 28
absorb shocks. This ability is underpinned by still
relatively low external debt and refinancing needs.
Meanwhile, international reserves remain high and
provide a sound buffer against external shocks. In the
medium-term, credit risks should gradually improve,
provided that the government is able to restore trust
in its fiscal consolidation programme and will push
through structural reforms.
Brazil’s economic contraction has deepened in the
course of the year, on the back of much needed fiscal
and monetary tightening by the new economic team,
declining business and consumer confidence and a
much larger than anticipated negative impact of the
Petrobras corruption scandal on the construction
sector. Annual real GDP shrank by 2.6% in the second
quarter of 2015. Meanwhile, annual inflation jumped
to 9.6% in July due to tax increases and currency
depreciation but appears to have stabilized since then.
Still, at this level, inflation remains well above the 6.5%
ceiling of the central bank’s target range.
Fiscal consolidation is becoming increasingly difficult
due to the deeper economic contraction, higher
interest rates and a hostile congress obstructing fiscal
adjustment measures. As a result, doubts about the
ability and willingness of the government to push
through its fiscal adjustment plan have increased.
These doubts were reinforced over the summer, when
Finance Minister Joaquim Levy sent an unambitious
draft 2016 Budget Bill to Congress. This triggered the
loss of Brazil’s sovereign investment grade rating by
rating agency S&P and resulted in a full-blown
confidence crisis with the currency breaking the
psychological 4.00 barrier vis-à-vis the USD and
hitting a low of 4.21 on September 24. The
government has responded with a course of
measures: it has made revisions to its 2016 budget
and reinstalled the primary surplus target of 0.7% of
GDP, the central bank has offered foreign exchange
credit line auctions to stem currency depreciation, and
president Dilma Rousseff has reshuffled her cabinet
increasing the share held by junior coalition member,
the PMDB. This has somewhat restored confidence
but the currency is still over 30% weaker compared to
a year ago and volatility will persist until there is
greater clarity over the outlook for public finances.
Currency depreciation and a deepening economic
contraction are increasing fears over the health of
corporate balance sheets. Non-financial corporate
debt in Brazil has increased from 30% of GDP at the
end of 2007 to 51% of GDP in the first quarter of this
year. Although the level is still modest, the increase is
one of the strongest among emerging market
economies. As a risk mitigating factor, almost 90% of
this debt is financed domestically and in local currency,
which mitigates refinancing and currency risk of
corporates. Still, external debt of Brazilian corporates
is at 49% of export receipts relatively high. However,
most companies that do borrow in foreign currency
appear to be adequately hedged. That said, corporates
operating in the commodity sector, that have
borrowed extensively in foreign currency, do face a
challenging environment as their earnings are
negatively affected by low commodity prices.
Moreover, their debt servicing costs are under upward
pressure from currency depreciation.
Positively, currency depreciation and weak domestic
demand are contributing to a much needed
adjustment of the external accounts. The trade
balance has returned to surplus last spring as imports
are contracting faster than exports and the current
account deficit has narrowed by a third in nominal
terms in the period January-August of 2015. Although
exports are still falling in nominal terms on the back of
low commodity prices, they have grown significantly
in volume in the first half of 2015 due to improving
mining activity and record high oil production as
offshore fields started producing. However, export
momentum lost steam over the summer illustrating
the challenging environment for Brazil’s economy. For
a solid improvement in Brazil’s earnings capacity, the
government needs to regain confidence and push
through with its fiscal adjustment programme. Overall,
Brazil’s shock absorbing capacity remains strong and
underpinned by a diversified economy, a sound
banking system, low external debt and solid
international reserves.
Mexico: lacklustre economy, energy reforms
progressing
Mexico’s economy continues to underperform due to
domestic political woes and tougher external
conditions. The outlook is cautiously optimistic and
remains closely tied to that of the US, its main trading
partner (80% of exports, 25% of GDP). The country
remains well positioned to deal with headwinds from
lower oil prices, the fall-out from the Chinese stock
market crisis and the impending lift-off of interest
rates by the Federal Reserve due to its strong shock
absorbing capacity. This is underpinned by sound
macroeconomic policies, a stable macroeconomic
environment, moderate external debt financing

Economic Outlook 29
requirements and sufficient buffers. This has enabled
the government to use the exchange rate as a shock
absorber. Medium-term growth prospects will profit
from opening up key sectors such as energy and
telecom, to greater competition and investment. But
the extent will depend on the government’s success in
dealing with institutional weaknesses and high crime
rates, which continue to hinder economic growth.
The government of president Enrique Peña Nieto of
the Partido Revolucionario Institucional (PRI) has,
during the first half of its term, successfully pushed
through an impressive structural reforms agenda,
including an historic energy sector reform. Although
the first auction of shallow water oil fields in July 2015
failed, the government proved to be a quick learner as
it adjusted contract terms, thereby showing its
continued commitment to these important reforms.
The second auction on 30 September went much
better, with three of the five fields being sold, one of
them to Eni of Italy, which was a welcome sign of faith
from one of the world’s energy majors. These fields
are expected to generate a peak of 90,000 b/d of light
and medium crude oil by 2022 and to reverse the
downward trend in oil production by 2018.
So far Peña Nieto has had little success in dealing with
institutional weaknesses and high crime rates. Worse
even, under his presidency, institutional quality and
security have deteriorated. His government is
suffering from a crisis of confidence after repeated
corruption and crime-related scandals since
September 2014. This has weighed negatively on
confidence and domestic demand. Combined with
fiscal consolidation to deal with the negative impact of
lower oil prices on government finances, this resulted
in a slowdown of annual real GDP growth to 2.2% in
the second quarter of 2015 from 2.6% in the previous
two quarters. This marked the 10th consecutive
quarter in which annual GDP growth was below 3%.
On a positive note, real exports growth has been
picking up since the start of this year. Going forward,
domestic demand will be supported by declining
inflation (2.5% year-on-year in September 2015) and
improving business and consumer confidence since
last September, albeit from low levels. The latter
might be profiting from the approval by Congress of a
new anti-corruption framework in May 2015, which is
a step in the right direction. Still, a comprehensive and
long-term strategy to improve law enforcement and
the independence of the judiciary system and to
overhaul police institutions remains badly needed for
a solid improvement of the country’s medium-term
earnings capacity.
Chile, Colombia, Peru
Economic growth in the other Pacific Alliance
members, copper producers Chile and Peru and oil
producer Colombia, is weakening due to further
declines in commodity prices, with Chile and Peru
being most exposed (commodity exports represent
25% and 16% of GDP respectively). However,
prospects are generally good, as growth should profit
from government investments in infrastructure (Peru
and Colombia) and an expansion of mining activity
(Chile and Peru). Meanwhile, sound economic policy
frameworks keep inflation expectations in check.
Solid macro fundamentals and sound policy
frameworks also mean that these countries are well
positioned to deal with the challenges stemming from
a Fed lift-off and continuous low commodity prices.
They can generally use the exchange rate as a shock
absorber (Chile and Colombia) or they can use
extensive buffers to deal with the commodity shock
(Peru). Moreover, these sound macro fundamentals
and policy frameworks mitigate external refinancing
risks. So does good access to international capital
markets and sufficient reserves, which in the case of
Colombia are being underpinned by a flexible credit
line from the IMF.
Central and Eastern Europe: stuck in the middle
Many of the Eastern European economies have shown
resilience in 2014 and 2015 and are forecast to
continue their positive performance in 2016. Central
Europe is leading the region with Poland, Hungary and
the Czech Republic posting strong economic growth.
They have benefited from the recovering eurozone
economy, the lower oil price and the quantitative
easing programme initiated by the European Central
Bank (ECB). As a result, exports have grown and
inflation remains low boosting consumer purchasing
power. The economic expansion in these markets is
based on both internal and external demand, making
it rather solid and likely to last.

Economic Outlook 30
Table 3.4 Real GDP growth (%) – Eastern Europe
2014 2015f 2016f
Czech Republic 2.0 4.1 2.6
Hungary 3.7 2.8 2.4
Poland 3.4 3.5 3.5
Romania 2.8 3.5 3.5
Russia 0.6 -3.9 -0.1
Turkey 2.9 2.9 2.8
Ukraine -6.8 -10.8 0.8
CIS 1.0 -3.1 0.6
Source: Consensus Economics (October 2015)
The story is not so bright further east. The Russian,
Ukrainian and CIS economies are contracting in 2015
and are set to see only mild improvements in 2016. EU
sanctions on Russia and counter sanctions imposed by
Russia, the conflict in Ukraine, the Russian recession
and low oil prices are being felt across Eastern Europe.
The Turkish economy is still growing, but at a much
slower pace than previously expected. All of these
countries are facing currency volatility and are
vulnerable to external shocks.
Russia: coping with decline
The situation in Ukraine is moving towards a frozen
conflict situation, with the intensity of the conflict
waning. Russia is not willing to bring the Donbas
region under its full control, and Ukraine is not able to
do so. Under these circumstances, international
sanctions are likely to be renewed in January. Russia
recently stepped up support for the government in the
Syrian conflict which may not help in this context as it
threatens to thwart western attempts to halt the IS
surge.
Meanwhile, the internal political situation in Russia is
stable. This helps to cope with the current recession,
which is now estimated to be a bit milder than we
expected previously: a 3.8% GDP contraction in 2015
(a 4.1% GDP contraction was estimated in May 2015).
2016 growth is expected to be nearly flat. The state
supports firms and directs them if needed. Firms
simply often impose wage cuts rather than mass
redundancies to cope with demand decline. Potential
social unrest, especially in single firm cities, can thus
be avoided. That is a wise strategy as private
consumption is forced to take a severe hit, by about
10% in 2015 and another 2% in 2016. September 2016
parliamentary elections will be tightly managed and
will most likely keep the current government in
control. Opposition, if any, is weak.
The recession of this year is driven by the low oil
prices. Russia is following OPEC’s footsteps, trying to
counter the low prices by turning the tap to the
maximum in order to maintain market share. Indeed,
despite the price fall to a below USD 50 per barrel for
Brent, Russian oil production has been kept at the
level of about 10.6 million barrels a day through 2015.
The continued oil price slump during the summer has
clearly not helped. The rouble was again sent on a
downward path versus the US dollar, pushing up
inflation to record levels of 16% in May. That in turn
put a dent in consumption as wages did not keep up.
Inflation is expected to slow to around 8% in 2016, as
oil prices are expected to climb gradually. This will
help Russian GDP as well.
Underlying problems will not be helped, however,
future growth opportunities remain limited. As we
have mentioned in previous Economic Outlooks, the
business climate is plagued by uncertainty regarding
property rights, a weak transport infrastructure and
lack of competition in goods and services markets.
That is an underlying deterrent for investments, badly
needed to modernise the energy sector and help
diversify the economy. But investment has been low
and under continuous pressure since the 2008 crisis.
This is now exacerbated by the international sanctions
that aim to prevent technology transfers and financing
to Russian firms, especially in the energy and defense
sectors. Russia still needs to find a way to cope with
this to avoid long-term decline.
Source: IHS
Despite the recession and, at best, lacklustre medium-
term growth prospects, Russian macro fundamentals
look reasonably solid. The floating rouble helps to

Economic Outlook 31
maintain the external balance. Indeed, for 2015, a
current account surplus of 3.6% is expected as it is
anticipated that imports will contract sharply by
almost 30% and that exports will grow by only 2%.
Foreign debt and government debt are both low. For
2016 a current account surplus is expected as well.
Macro policy seems relatively accurate, as the IMF
confirms.18 The central bank uses monetary policy
room if possible and has now brought back the
benchmark rate to 11% from 17.5% during the late
2014 crisis. The government clearly indicated its
intention to provide capital or foreign exchange
support to firms and banks. It is using the Reserve and
Wealth Funds to smooth the decline in government
expenditures as well. Erosion of international reserves
has halted. According to the IMF, reserves are
currently sufficient. At this stage, Russia appears to be
coping relatively well with the recession.
Still, Russian corporate foreign debt is, related to
exports, one of the highest in the emerging economies,
as presented in Chapter 1. This is compounded not
only by high interest rates, pressure on capital flows
and the rouble, but also international sanctions that
severely hinder foreign (re)finance. Therefore, despite
the relatively deep coffers of the Russian state,
Russian foreign corporate debt is indeed an issue to be
watched carefully.
CIS: victims of circumstance
The economic crisis in Ukraine seems to have finally
stabilised but it remains very difficult. Consumer
spending and private investment have dropped while
external demand for Ukrainian exports has declined
due to the recession in Russia and low global oil prices.
The economy is expected to contract 10.8% in 2015. A
slight recovery from a very low base is expected in
2016, but Ukraine’s outlook is mired by downside
risks. A re-escalation of the conflict with Russia, global
financial market volatility and a decline in popular
support for the reforming government would have
devastating effects on this vulnerable country.
Overall, most CIS countries have been severely
affected by the drop in oil prices and the recession in
Russia. This is especially true for the region’s energy
exporters (Azerbaijan, Kazakhstan, Turkmenistan and
Uzbekistan). Pressure from rouble depreciation, as
well as low oil prices, have forced national currencies
18 IMF. Russian Federation. Staff report for the article IV consultation. July
2015.
to be devalued in several countries like Azerbaijan and
Kazakhstan. While these devaluations are often
painful adjustments, there is a trend away from fixed
exchange rate regimes toward allowing currencies to
float more freely against the US dollar. This will
protect these economies’ international reserves and
also help them to absorb external shocks more
smoothly in the future. The recession in Russia has
also weighed on the outlook for the region’s energy
importers (Armenia, Georgia, Kyrgyz Republic and
Tajikistan). A more challenging labour market and a
weaker rouble in Russia are weakening remittances
which are an important source for consumption and
economic growth across many CIS economies.
Turkey: unstable politics, rebalancing slowing
Credit risks in Turkey remain elevated. Economic
developments were better than expected in the first
half of 2015, but increased domestic political
instability since then is weighing negatively on
Turkey’s already mixed prospects. A drop in
confidence is counterbalancing positive effects on
domestic demand from low oil prices and is adding to
its already high vulnerability to a normalisation of US
monetary policy and shifts in market sentiment.
Turkey is one of the most exposed economies to such
shocks, due to its high stock of portfolio inflows,
relatively low buffers and persistently high external
financing needs. The latter limits the ability of the
exchange rate as a shock absorber and has raised
concerns about private sector creditworthiness,
considering rapidly rising external debt. Sound
government finances and a healthy banking sector
remain risk mitigating factors.
Political risks have increased significantly in the past
few months following an inconclusive election of June
7 in which the ruling AKP lost its parliamentary
majority after 12 years of single-party government.
However, in a surprising victory, the AKP regained its
majority in legislative elections on November 1. While
this reduces political uncertainty by re-establishing
the dominance of the AKP at least until the next
presidential election in 2019, other developments
continue to heighten political risk. These are the
breakdown of the peace process with the Kurdish
militant PKK group and the involvement of Turkey in
the conflict against IS in neighbouring Syria following
a deadly attack of IS in the south of the country.

Economic Outlook 32
Table 3.5 Key data Turkey
2014 2015f 2016f
Real GDP growth (%) 2.9 2.9 2.8
Inflation (%) 8.9 7.6 7.3
Private sector credit growth
(%) 18.0 20.0 20
Current account (% GDP) -5.8 -5.0 -5.2
Portfolio investments stock
(% reserves) 151.0 164.0 171
Gross external debt (% GDP) 53.7 58.3 61.9
Net external debt (% XGS) 107.6 125.9 133.4462
External financing need (%
reserves) 200.4 170.0 185
Sources: Consensus Economics, Atradius, IFS, IIF, Fitch
Annual real GDP growth was stronger than expected
in the first half of this year at 3.1% as domestic
demand was boosted by low oil prices and front
loading spending ahead of the elections. But
momentum slowed in the summer due to recent
political uncertainty which exacerbated concerns
about the independence of the central bank. This
resulted in further currency depreciation and a sharp
drop in business and consumer confidence. The lira
has lost some 20% of its value vis-à-vis the USD over
the course of this year.
A weaker exchange rate and low oil prices (Turkey is a
net-importer of oil) have contributed to a narrowing of
the current account deficit. The improvement was less
than expected and has recently stalled. This is due to
falling export demand from the oil producers Russia
and Iraq, Turkey’s second and third largest export
markets.
Large external financing needs and relatively high
dollarisation in the Turkish banking system, expose
Turkey to exchange rate risk and a Fed rate rise. These
risks are most imminent in the corporate sector, as
the banking system is healthy and well-hedged. Non-
financial corporate debt in Turkey has risen from 25%
of GDP end-2007 to almost 57% of GDP in the first
quarter of 2015. Although the level is still modest, this
is one of the strongest increases among emerging
markets. A third of the debt is financed externally,
with the share of foreign currency debt being even
higher due to dollarisation. Although the Turkish
central bank has recently taken measures to reduce
dollarisation of domestic lending, this will not address
the vulnerability to refinancing and exchange rate risk
in the short to medium term. So far, corporates have
good access to international capital markets with
rollover rates of corporate external debt remaining
above 100% and maturities being lengthened.
Additionally, non-performing foreign currency loans to
corporates from local banks are low at 0.9% end-June,
much below the NPL ratio on loans in lira of 3.2%.
Most at risk are smaller sized firms.
MENA: pushing through
The intensified security situation and spill-over from
the region’s conflicts in Syria, Iraq and Yemen are
having a negative impact on confidence in the region
and constraining economic growth. The collapse in the
oil price is thereby hurting the oil-exporting countries
in the region. However, ample financial buffers and
low public debt are helping these countries to weather
the lower oil prices. For instance, high investments in
infrastructure are keeping economic growth in Saudi
Arabia and the UAE relatively high. Overall, economic
growth for the oil exporting countries is expected to
slow to 1.8% this year, but to recover to 3.8% next year
in line with a higher oil price. Economic growth in the
oil-importing countries is forecast to accelerate to
3.9% this year from 2.9% in 2014. In Egypt and
Morocco especially, economic growth is picking up
through higher domestic demand and exports are
benefiting from the gradual recovery in the euro area.
The lower oil price is easing the fiscal and external
vulnerabilities of the oil importing countries.
Table 3.6 Real GDP growth (%) – MENA
2014 2015f 2016f
Egypt 2.2 4.3 3.7
Morocco 2.4 4.7 4.0
Qatar 4.0 3.9 4.1
Saudi Arabia 3.6 3.0 3.1
Tunisia 2.3 1.3 3.1
UAE 4.6 3.2 3.2
Source: IHS
Sub-Saharan Africa: facing headwinds
This region has especially been affected by the
economic slowdown in China and lower commodity
prices. China is one of the largest trading partners for
Sub-Saharan countries and most countries are
exporting commodities. Oil is the most important
commodity, but in the past years the export of metals

Economic Outlook 33
have risen sharply in several countries in this region.
The lower oil price is having a major impact on the
economies of Nigeria and Angola. Growth figures in
these countries are much lower than in the previous
year and their external finances have deteriorated
resulting in depreciating currencies. For the region as
a whole economic growth is expected to decelerate to
3.5% this year from 5% in 2014.
Table 3.7 Real GDP growth (%) – Sub-Saharan Africa
2014 2015f 2016f
Ghana 4.0 3.0 6.0
Kenya 5.3 5.9 6.1
Nigeria 6.2 2.2 2.0
South Africa 1.5 1.5 1.6
Source: IHS
Nigeria: uncertainty rising
The oil price decline is not the only one having a
negative impact on the Nigerian economy. Political
uncertainty is also affecting confidence. President
Buhari won the presidential elections in March and has
still not appointed a cabinet. The public and investors
are waiting for some clarity regarding its (economic)
policies. The country faces major challenges in a low
oil price environment. It needs to improve its business
environment, tackle corruption, improve the security
situation and raise the living standards to increase
economic growth in the medium term. The lack of
confidence in combination with the low oil price and
the expected Fed interest rate increase are keeping
the naira under pressure. A further depreciation is
therefore expected.
South Africa: external and internal vulnerabilities
The economy of South Africa is expected to show
meagre growth figures this and next year. This year
economic growth of 1.4% is expected and next year
1.3%. Inadequate infrastructure, especially electricity
shortages, skill shortages in labour and persistent
strikes along with weak investor confidence are
constraining economic growth. Next to those internal
factors, weaker external demand and low commodity
prices are contributing to the weak GDP growth. The
rand is expected to remain volatile due to the large
deficit on the current account, which is mainly being
financed by short-term debt and foreign participation
in the bond and equity market. Therefore, South Africa
is also vulnerable toa Fed interest rate increase.

Economic Outlook 34
4. Implications for the insolvency
environment
Insolvency environment in advanced economies
improving
Due to the economic recovery in the advanced
economies, we expect a decline in insolvencies in most
advanced countries in 2016. However, in Europe the
number of insolvencies still remains higher than the
pre-2007 crisis level.
Insolvencies expected to go down further in 2016
With the Atradius insolvency forecast model being
predominantly dependent on business cycle
movements, and further recovery in most advanced
economies, the insolvency forecast outlook warrants
improvement for most of the 22 advanced countries
that we track. In Table 4.1 and 4.2, the forecasts for
insolvencies growth in 2015 and 2016 are given.
In 2016, we expect the most improvement in the
Netherlands, Spain and Ireland. For the Netherlands,
this follows a record high level of insolvencies in 2013
and is grounded in the expectation of robust economic
growth over the coming period. For many eurozone
countries, for instance France and Italy, the decline is
expected to be modest. In Germany, where economic
growth is stagnating, insolvencies are not expected to
decline much at all.
Although the US and UK economies are among the
fastest growing advanced economies, only a small
further decline in insolvencies is expected in 2016.
Likewise, in Japan, we expect the rate of decline in
insolvencies to slow down to about half that of 2015
despite the anticipated acceleration in economic
growth.
-20-20
-14-10-10
-9-9-8-7-6-5-5-5
3345667
99
-25 -15 -5 5 15
SpainNetherlands
IrelandUnited States
SwedenJapan
AustriaFinland
ItalyGermanyBelgium
United KingdomNorway
DenmarkFrance
LuxembourgCanada
AustraliaNew Zealand
SwitzerlandPortugalGreece
4.1 Insolvencies 2015% change year ago
Source: Atradius Economic Research
-15-10-10
-8-6-5-5-5-4-4-4-4-3-2-2
000012
6
-25 -15 -5 5 15
NetherlandsSpain
IrelandDenmark
FinlandJapan
ItalyBelgium
United StatesSwedenFrance
PortugalAustria
GermanyUnited Kingdom
NorwayLuxembourg
AustraliaNew Zealand
CanadaSwitzerland
Greece
4.2 Insolvencies 2016% change year ago
Source: Atradius Economic Research

Economic Outlook 35
Insolvencies are not expected to decline everywhere.
We anticipate an increase in insolvencies next year for
Greece, Switzerland, and Canada, and no improvement
in New Zealand, Luxembourg, Australia and Norway.
The Greek economy still suffers from debt
sustainability and economic distress, with expected
contraction of the economy in 2015 and 2016.
Greece’s poor overall outlook stands alone this time in
the eurozone and insolvencies are expected to
increase 9% in 2015 and another 6% in 2016.
Switzerland’s economy is struggling after the change
in policy of the Swiss national bank in January 2015.
The expected moderate growth in 2016 slows the
Swiss insolvency growth however, and its economy is
expected to pick up steam later that year.
Level of insolvencies remains high
With this overall improved picture for next year, one
should remain aware of the legacy of the crisis. The
level of insolvencies in the eurozone remains high and
still hasn’t reached the pre-crisis level of 2007. Table
4.3 shows how insolvencies have developed since
2007 (2007=100). The eurozone periphery In
particular has suffered from the severe increase
registered in the period 2007-2013. For these
countries, the number of insolvencies in 2016 will still
be at, on average, three times the level of 2007. A
similar, but less severe picture, can be seen for the
euzozone as a whole. While the 2016 insolvency level
is declining, it is still forecast to be 66% higher than
the 2007 level. Meanwhile, in the US, UK and
developed Asia-Pacific, the recovery was initiated
earlier on and the insolevency level is expected to be
around the 2007 level.
Source: Atradius Economic Research
Insolvency rates in eurozone periphery indicate
split
Within the eurozone periphery (Ireland, Portugal,
Spain, Italy and Greece) all countries have seen strong
growth in insolvencies in the period after 2007.
Ireland and Spain have seen a resaonably good
recovery since 2012/2013. In Portugal the number of
insolvencies stabilized at the higher level. In Greece,
the insolvency rate continues to rise. The volatility of
the insolvency rate in Italy was relatively low, with the
rate increasing steadily, until 2014. In 2015, Atradius
expects a slight recovery for Italy. In 2016, the
insolvency rate is expected to be the higest in Portugal
and Greece, reaching almost twice the rate of Spain,
Ireland and Italy.
Source: Atradius Economic Research
Western European countries show a lower insolvency
rate with less volatility on average. Also within the
Western European markets, there is a clear split
between France and Belgium, on the one hand with a
high insolvency rate and Austria, Germany and the
Netherlands which show a lower insolveny rate. The
insolvency rate in Belgium and France is around 2%
and at a higher level than in 2007. Austria, Germany
and the Netherlands have an insolvency rate between
0.7% and 0.8%, and are back on or below their pre-
crisis level.
0
100
200
300
400
2007 2009 2011 2013 2015
4.3 Insolvency developmentsIndex, 2007 = 100
Eurozone Eurozone Periphery
Developed Asia-Pacific United States
0
2
4
6
8
2006 2008 2010 2012 2014 2016f
Portugal Greece SpainIreland Italy
4.4 Insolvency ratePercentage of total

Economic Outlook 36
Source: Atradius Economic Research
Insolvencies: level and trend
A schematic overview of the insolvency situation in
advanced markets is illustrated in the 4.6 Insolvency
Matrix. All countries expected to see deterioration in
their insolvency environment in 2016 are to be found
in the top segment of the grid. Greece is the only
country in which insolvencies are expected to increase
by more than 2% in 2016. The majority of countries
included in our forecasts are expected to display
improving insolvency developments (i.e. a drop in
insolvency of more than 2%).
4.6 Insolvency Matrix 2016
Source: Atradius Economic Research
The horizontal axis in the Insolvency Matrix depicts
the absolute level of insolvencies – whether the
frequency of insolvencies in a country is assessed as
low, average or high – in a cross-country comparative
context. As such, all countries perceived to be markets
with comparatively high insolvency frequencies are to
be found in the right-hand segment. Except for Greece
and Luxembourg, all countries with a relative high
insolvency level are expected to experience an
improvement in insolvency levels in 2016: Belgium,
Denmark, France, Ireland, Italy, Portugal, and Spain.
Emerging market insolvencies
We also applied our insolvency forecast model to the
emerging markets. Because the model has been built
on data from advanced countries, forecasts may be
somewhat off the mark; for the emerging markets,
Atradius therefore only provides a general direction of
the expected insolvency developments.
In general, conditions in many emerging markets have
deteriorated. Commodity exporters suffer from lower
natural resource prices, while the slowdown in China
negatively impacts trade and finances in many
markets. In addition, many emerging markets struggle
with the expected rise in US interest rates and the
stronger US dollar. The stagnation of economic
growth in the BRIC countries, except for India, is
expected to have consequences for the number of
insolvencies. India is the only country maintaining its
accelarated economic growth and insolvencies are
expected to decline this year and in 2016. With China’s
economy slowing down, insolvencies are expected to
increase substantially in 2015 and 2016. Companies
face a change in funding conditions and in the
structure of the economy as it rebalances towards
more services and consumption. This will inevitably
lead to shrinking business opportunities in some
sectors, and insolvencies, with possibilities opening up
in other sectors. Russia and Brazil are both forecast to
see a significant increase in insolvencies this year, as
financial conditions tighten and their economies
contract. Their insolvency rates are forecast to
increase further next year as they are expected to only
gradually move out of recession.
Table 4.1 Insolvency growth
2015f 2016f
China Strong increase Strong increase
Brazil Strong increase Increase
Russia Strong increase Increase
India Decrease Decrease
Source: Atradius Economic Research
0
1
2
3
2006 2008 2010 2012 2014 2016f
Austria Belgium FranceGermany Netherlands
4.5 Insolvency ratePercentage of total
Det
erio
ratin
g
Greece
Sta
ble Canada, Germany,
New Zealand, Norway
Australia, Switzerland, UK
Luxembourg
Impr
ovin
g Austria, Finland, Japan,
Netherlands, Sweden, US
Belgium, Denmark, France,
Ireland, Italy, Portugal, Spain
Low Average High

Economic Outlook 37
Credit risk developments for large firms
The credit risk for large firms in the eurozone
periphery shows a two-fold picture. On the one hand,
the expected default frequencies (EDFs)19 of Spain,
Ireland, and Italy have converged at a lower level after
a period of high EDF during the financial crisis.
However, default levels are still at a higher level than
in 2007. On the other hand, EDF volatilities in Greece
and Portugal are still high. During the latest Greek
debt crisis, its EDF suffered a strong increase, but
after that, the EDF showed a remarkable recovery.
Stabilisation of credit risk for large firms in Western
European countries is evident as the EDFs have
converged and have lost much volatility. The EDFs are
back to pre-crisis levels. In addition, the EDF figures
are flattered by the expansionary monetary policy of
the European Central Bank (ECB), which has pushed
up equity prices and lowered financial market risk
premia. As this latter effect can be seen as temporary,
with the end of the expansion period, EDF figures and
volatility could rise again.
19 The expected default frequency (EDF) tracks default risk among stock-listed companies. Combining balance sheet and stock market information for a particular firm, yields a 1-year default forecast. The median EDF, as referred to in the charts below, represents the 50th percentile in the total country aggregate of firms.
Credit conditions loosened for advanced, but
tightened for emerging economies
According to the October 2015 bank lending survey of
the ECB, improvements in lending conditions continue
to support the growth of lending in the eurozone,
particularly for enterprises. The third quarter of 2015
brought further easing of credit standards on loans for
businesses, with a decrease of 4%, following a
decrease of 3% in the second quarter. For the fourth
quarter, the net easing is expected to continue (6%
decrease).
According to IIF’s 2015 Q2 survey, bank lending
conditions in emerging markets, except for Eastern
Europe, have been tightened further in the second
quarter this year. The main cause of the tightening
was deteriorating supply side conditions for new loans,
due to renewed volatility in the financial markets of
emerging markets since May this year. Overall bank
lending conditions have tightened in Asia, Latin
America and Sub-Saharan Africa. Also, for the first
time since the fourth quarter of 2012, the conditions
were tightened in the MENA region. Only in Eastern
Europe have the bank conditions eased, after a
tightening in the first quarter.
Two-sided picture
The picture is two-sided, with the slowdown of the
emerging markets on the one hand and the recovery
of the advanced economies on the other hand. The
insolvency forecast is positive for most advanced
economies, especially for some countries where the
number of insolvencies rose rapidly after the financial
crisis like in the Netherlands, Spain and Ireland. Along
with the good insolvency outlook, the credit risk
outlook for large firms is improving and credit
conditions are easing. However, the insolvency level in
Europe is still substantially higher than before the
financial crisis and the higher level of credit risk in the
eurozone periphery seems to become structural.
For the emerging markets, the business and
insolvency environment has become more challenging
and is expected to remain so in 2016. The slowdown
in China, the change in US monetary policy and low
commodity prices will hit individual companies that
are exposed to these risks hard. Many emerging
markets may therefore face a rise in insolvencies in
2015 and 2016.
0
5
10
15
2007 2009 2011 2013 2015
Source: Moody’s KMV
4.7 Median EDF - Eurozone peripheryDefault risk 12 months ahead (%)
Portugal Spain GreeceIreland Italy
0.0
0.5
1.0
1.5
2.0
2007 2009 2011 2013 2015
Source: Moody’s KMV
4.8 Median EDF - EurozoneDefault risk 12 months ahead (%)
Austria Belgium FranceGermany Netherlands

Atradius Economic Outlook 38
Appendix I: Recent publications
Economic research notes and reports published since January 2015
The slowdown in world trade: temporary or permanent?, October
China stock market crunch should not be overestimated, September
Brexit: top 5 countries and sectors at risk, September
Insolvency Forecasts, August
Russia update: economic and industry outlook, July
Economic Outlook: navigating a new world, May
Iran: potential opportunities and risks, April
Cheap oil: the new normal, April
Weakening euro's effect on the UK market, March
Insolvency Forecasts, February
Most vulnerable countries to Chinese economic downturn, February
Russia update – Lower oil price will take its toll, February
Ending the Swiss franc ceiling, January
The benefits of a falling euro, January
Impact of a Greek euro exit, January
Lithuania joins the euro, January

Atradius Economic Outlook 39
Appendix II: Atradius Risk Map
The Atradius Risk Map gives an overview of the level of risk associated with countries worldwide. This map has been
created by the Economic Research team and drawn from a range of sources. This map is provided for information
purposes only and is not intended as a recommendation as to particular transactions, investments or strategies in
any way to any reader. The Atradius Risk Map is updated every month. For the latest version of the map and further
information, please visit www.atradius.com/riskmap.

Economic Outlook 40
Appendix III: Forecast tables
Table A1: Macroeconomic headline figures - Developed markets
���� GDP growth
(% change p.a.)
Inflation
(% change p.a.)
Budget balance
(% of GDP)
Current account
(% of GDP)
Export growth
(% change p.a.)
�� 2014 2015 2016 2014 2015 2016 2014 2015 2016 2014 2015 2016 2014 2015 2016
Australia 2.7 2.0 2.0 2.5 1.7 2.4 -2.5 -2.5 -2.0 -3.0 -3.8 -3.6 6.7 5.4 3.8
Austria 0.4 0.7 1.7 1.6 1.0 1.7 -2.7 -1.8 -1.4 2.0 2.6 3.2 2.1 0.6 3.7
Belgium 1.1 1.3 1.7 0.3 0.4 0.8 -3.2 -2.6 -2.3 1.1 1.2 0.6 3.8 3.9 5.1
Canada 2.4 1.0 1.8 1.9 1.1 2.0 -1.6 -1.9 -1.3 -2.1 -3.4 -2.8 5.4 2.1 2.3
Denmark 1.1 1.7 1.9 0.6 0.5 1.0 1.2 -1.6 -1.4 6.3 5.6 5.4 2.6 1.9 4.1
Finland -0.4 -0.1 1.0 0.5 0.1 1.1 -3.3 -2.8 -3.3 -1.1 -0.7 0.4 -0.7 0.0 2.3
France 0.2 1.1 1.3 0.6 0.1 1.1 -4.0 -3.7 -3.3 -0.9 -0.6 -0.8 2.4 6.4 3.3
Germany 1.6 1.7 2.1 1.0 -0.2 1.0 0.3 0.6 0.3 7.6 8.5 7.8 3.9 5.2 3.9
Greece 0.7 -1.3 -1.8 0.5 0.0 1.0 -3.5 -3.0 -2.7 0.9 0.9 1.8 8.7 -3.3 -2.0
Ireland 5.2 6.1 4.0 0.9 0.3 1.5 -4.1 -2.3 -1.9 6.1 4.4 4.6 12.1 11.7 3.8
Italy -0.4 0.7 0.9 -1.3 -1.9 0.5 -3.0 -2.8 -2.5 2.1 2.4 1.8 2.4 3.8 2.2
Japan -0.1 0.5 1.0 0.2 -0.2 1.0 -4.9 -5.9 -6.0 0.6 2.9 2.4 8.4 2.8 1.9
Luxembourg 4.1 2.8 3.4 0.2 0.1 0.7 0.6 0.2 0.1 5.5 4.5 4.1 6.8 5.1 3.7
Netherlands 1.0 2.1 1.7 2.7 0.8 0.5 -2.3 -1.7 -1.3 10.8 10.3 9.4 4.0 4.8 4.6
New Zealand 3.3 2.2 1.9 0.6 0.6 1.9 -1.8 -0.8 -0.1 -3.1 -3.2 -3.5 3.3 5.3 1.0
Norway 2.2 0.8 0.6 1.0 0.6 1.3 9.1 6.5 6.3 8.5 7.0 8.5 2.6 0.8 1.8
Portugal 0.9 1.7 1.8 1.2 0.6 2.1 -4.5 -3.0 -2.6 0.6 1.5 1.1 3.3 5.4 2.9
Spain 1.4 3.2 2.6 2.0 2.0 2.0 -5.8 -4.7 -3.4 0.7 1.4 1.3 4.2 4.6 4.7
Sweden 2.4 3.0 2.3 -0.3 0.5 0.9 -1.9 -1.0 -0.5 6.1 5.8 5.6 3.7 3.1 3.0
Switzerland 1.9 1.0 1.2 -0.1 -0.5 0.9 -0.1 -0.5 -0.3 7.1 10.0 9.3 3.5 -0.6 3.3
United Kingdom 2.9 2.4 2.4 -0.2 0.0 0.9 -5.2 -3.7 -2.7 -5.1 -4.3 -3.9 1.8 3.4 3.9
United States 2.4 2.5 2.9 0.0 -1.2 -0.5 -3.8 -3.4 -3.6 -2.2 -2.4 -2.2 3.4 1.7 3.4
Eurozone 0.9 1.6 1.7 1.5 0.1 1.2 -2.5 -2.1 -1.8 3.4 3.8 3.4 3.9 4.9 3.8
European Union 1.4 1.9 2.0 1.6 0.0 1.8 -2.9 -2.3 -2.0 1.9 2.2 1.9 3.9 4.7 3.9
Source: IHS
Note: IHS forecasts for 2015 and 2016. These forecast values are provided as an indication of direction, representative of one
vendor’s view only. The values in the table may therefore differ from the Consensus values quoted throughout the report.

Economic Outlook 41
Table A2: Macroeconomic indicators - Developed markets
���� Private cons.
(% change p.a.)
Fixed investment
(% change p.a.)
Government cons.
(% change p.a.)
Retail sales
(% change p.a.)
Industrial prod.
(% change p.a.)
�� 2014 2015 2016 2014 2015 2016 2014 2015 2016 2014 2015 2016 2014 2015 2016
Australia 2.4 2.5 2.7 -2.1 -2.8 -1.4 2.0 2.1 0.5 2.8 2.3 3.0 4.6 1.5 2.2
Austria 0.1 0.3 1.2 -0.1 -0.6 2.9 0.8 1.1 1.1 -0.5 -0.1 1.9 -0.3 1.2 2.4
Belgium 0.9 2.1 1.7 5.1 2.0 -0.1 1.0 0.3 0.5 0.0 0.8 1.7 0.9 0.3 2.0
Canada 2.7 2.0 2.2 0.2 -2.7 -0.4 0.2 0.7 1.8 2.6 1.1 1.2 4.1 -0.9 0.1
Denmark 0.8 2.0 1.4 4.0 0.9 4.5 0.2 1.6 1.5 -0.4 0.9 0.8 1.0 1.9 1.8
Finland 0.5 0.7 0.7 -3.3 -2.8 1.4 -0.2 -0.1 0.2 -2.0 -0.9 4.3 -2.0 -2.8 1.0
France 0.7 1.6 1.4 -1.2 -0.5 1.7 1.5 1.6 1.2 0.8 2.8 1.4 -1.1 0.8 0.9
Germany 1.0 1.9 1.9 3.5 2.4 3.1 1.7 1.9 1.3 1.0 2.6 0.8 1.5 1.5 2.5
Greece 1.4 -0.2 -2.6 2.9 -10.4 -9.5 -0.8 3.3 0.1 0.2 -0.9 -1.8 -1.9 -2.0 -2.7
Ireland 2.0 3.1 3.4 14.0 16.6 3.0 4.5 3.0 3.0 3.9 6.8 7.9 20.9 14.9 0.5
Italy 0.3 0.6 1.0 -3.2 0.7 1.0 -1.0 0.1 0.3 -1.4 0.8 1.3 -0.5 1.0 1.5
Japan -1.3 -0.7 1.4 2.5 0.5 2.6 0.2 0.9 -0.1 -1.0 -1.3 2.4 2.1 -1.0 0.8
Luxembourg 3.8 0.3 3.5 14.3 -2.0 7.5 0.2 4.5 1.5 7.9 -9.8 1.6 5.7 1.3 3.4
Netherlands 0.0 1.9 1.4 3.5 9.3 2.7 0.3 0.2 1.9 -0.5 1.2 0.7 -2.9 -0.5 2.0
New Zealand 3.2 2.7 3.0 8.8 2.2 0.3 3.4 2.5 1.2 2.7 3.4 1.8 2.6 0.0 1.7
Norway 2.0 2.4 1.7 0.7 -4.6 -2.8 2.7 2.1 3.3 1.4 1.0 0.8 3.5 0.3 0.9
Portugal 2.2 2.1 1.3 2.5 5.5 3.1 -0.3 -0.6 0.7 -1.1 0.6 1.2 1.6 2.3 2.5
Spain 2.4 3.6 2.6 3.4 5.7 3.9 0.1 1.1 -0.4 0.6 2.0 2.2 1.2 2.6 2.0
Sweden 2.3 2.0 1.8 7.7 4.8 3.7 1.8 1.6 1.4 2.9 4.3 2.7 -1.7 2.7 3.3
Switzerland 1.3 1.1 1.3 2.1 1.4 2.0 1.3 2.5 1.1 0.1 -1.4 1.7 1.4 -0.8 1.7
United Kingdom 2.6 3.0 2.9 7.5 4.0 4.8 1.9 1.8 0.3 1.7 1.5 2.8 1.4 1.2 1.4
United States 2.7 3.2 3.3 4.1 4.3 6.4 -0.5 0.3 0.5 2.2 2.3 3.3 3.7 1.3 2.0
Eurozone 1.0 1.7 1.6 1.4 2.2 2.3 0.8 1.2 1.0 - - - 0.5 1.4 1.8
European Union 1.4 2.1 2.0 2.7 2.7 2.9 1.1 1.4 0.9 - - - 0.8 1.6 2.0
Source: IHS
Note: IHS forecasts for 2015 and 2016. These forecast values are provided as an indication of direction, representative of one
vendor’s view only. The values in the table may therefore differ from the Consensus values quoted throughout the report. ��

Economic Outlook 42
Table A3: Macroeconomic headline figures - Emerging markets
���� GDP growth
(% change p.a.)
Inflation
(% change p.a.)
Current account
(% of GDP)
Private cons.
(% change p.a.)
Export growth
(% change p.a.)
�� 2014 2015 2016 2014 2015 2016 2014 2015 2016 2014 2015 2016 2014 2015 2016
Asia Pacific 6.0 5.4 5.5 3.0 2.2 3.0 2.0 3.6 3.3 5.2 5.1 5.2 4.0 2.4 4.8
ASEAN 4.4 4.2 4.1 4.1 2.9 3.3 3.2 4.4 4.0 4.5 4.9 4.6 3.4 1.8 3.5
China 7.3 6.5 6.3 2.0 1.7 2.6 2.1 4.2 4.3 6.8 6.3 6.0 5.9 3.5 6.1
Hong Kong 2.5 2.2 2.5 4.4 2.7 3.3 1.8 3.5 3.2 3.2 3.6 2.7 0.8 -0.6 1.5
Taiwan 3.8 1.9 2.5 1.2 -0.3 0.9 12.4 13.8 14.7 3.0 2.9 2.8 5.9 -0.1 1.7
India 7.3 7.4 7.5 6.8 4.9 5.6 -1.5 -0.8 -2.3 6.3 6.8 7.4 -0.6 2.1 6.7
Singapore 2.9 1.6 2.0 1.0 -0.3 1.6 19.1 25.5 23.6 2.5 4.2 2.9 2.1 1.8 1.8
Latin America 0.8 -1.3 -0.5 10.6 15.0 17.4 -3.4 -3.4 -2.7 1.2 -1.4 0.0 -1.3 1.4 1.0
Argentina 0.5 1.6 0.6 21.4 16.3 22.9 -1.0 -1.6 -2.2 -0.5 -0.1 0.7 -7.5 -2.4 -1.9
Brazil 0.2 -3.0 -1.9 6.3 8.8 6.2 -4.4 -3.8 -2.7 0.9 -3.4 -1.7 -1.0 8.3 2.0
Mexico 2.1 2.2 2.3 4.0 2.8 3.1 -1.9 -2.2 -0.7 2.0 2.7 2.1 7.3 7.6 4.8
CIS 0.9 -3.0 0.0 8.1 15.6 10.0 2.0 3.5 1.4 0.9 -4.6 0.6 -2.1 -4.4 2.2
Czech Republic 2.0 3.9 2.8 0.4 0.4 1.5 0.6 0.2 -0.6 1.5 2.9 2.9 8.9 6.2 4.5
Hungary 3.5 2.7 2.5 -0.2 -0.2 1.1 2.3 3.8 3.2 1.5 2.8 2.7 8.7 7.7 4.9
Poland 3.4 3.5 3.8 -0.1 -0.8 1.0 -2.0 -1.0 -2.1 3.0 3.2 3.8 5.6 5.4 5.1
Russia 0.6 -4.2 -0.8 7.8 15.8 10.5 3.0 6.1 3.0 1.3 -7.0 -0.9 0.5 -0.1 -1.7
Turkey 2.9 2.3 3.0 8.9 7.7 7.7 -5.8 -5.6 -5.4 1.4 3.3 2.9 6.9 -0.6 2.2
Africa 3.3 2.9 3.3 6.9 7.2 7.2 -4.7 -5.3 -4.4 4.6 2.3 3.6 -0.5 4.2 4.5
South Africa 1.5 1.5 1.6 6.1 4.7 6.2 -5.4 -4.4 -4.6 1.4 1.7 1.8 2.6 10.6 7.1
MENA 2.2 2.5 3.1 5.2 4.6 4.8 7.1 -0.5 0.3 4.0 3.7 3.9 2.8 3.8 4.8
BRIC 5.4 4.3 5.1 3.9 4.3 3.9 0.9 2.9 2.6 4.7 3.0 4.4 3.7 3.2 5.1
World 2.7 2.5 3.0 2.9 2.4 3.2 - - - 2.5 2.5 2.9 3.6 3.0 3.9
Source: IHS
Note: IHS forecasts for 2015 and 2016. These forecast values are provided as an indication of direction, representative of one
vendor’s view only. The values in the table may therefore differ from the Consensus values quoted throughout the report.

Economic Outlook 43
Table A4: Insolvency growth (% per annum)
�� 2007 2008 2009 2010 2011 2012 2013 2014 2015f 2016f
Australia -4 18 3 -1 5 1 4 -22 6 0
Austria -6 0 9 -8 -8 3 -10 -1 -9 -3
Belgium 1 10 11 2 7 4 11 -9 -5 -5
Canada -7 -2 -12 -20 -11 -12 -2 -2 5 1
Denmark 21 54 54 13 -15 0 -10 -20 3 -8
Finland -1 16 25 -13 3 0 11 -11 -8 -6
France 7 8 14 -5 -1 3 2 0 3 -4
Germany -15 0 12 -2 -6 -6 -8 -7 -6 -2
Greece 0 30 40 30 33 30 10 3 9 6
Ireland 19 100 50 10 7 3 -19 -15 -14 -10
Italy -35 18 29 21 8 14 16 10 -7 -5
Japan 6 11 -1 -14 -4 -5 -11 -10 -9 -5
Luxembourg 5 -13 17 33 5 8 2 -20 4 0
Netherlands -23 1 73 -10 -1 21 10 -19 -20 -15
New Zealand -5 -35 45 -6 -12 -8 -13 -7 6 0
Norway -6 28 38 -12 -2 -12 20 -5 -5 0
Portugal -12 54 36 16 18 42 8 -9 9 -4
Spain 10 100 50 -2 14 38 13 -30 -20 -10
Sweden -5 7 20 -4 -4 7 5 -7 -10 -4
Switzerland -5 -2 24 20 7 3 -5 -7 7 2
United Kingdom -5 24 23 -16 5 -4 -7 -6 -5 -2
United States 2 52 41 -7 -15 -16 -17 -19 -10 -4
Sources: National bureaus, Atradius Economic Research
Table A5: Insolvency level, index �� 2007 2008 2009 2010 2011 2012 2013 2014 2015f 2016f
Australia 100 118 121 120 126 127 133 104 110 110
Austria 100 100 110 101 93 96 87 86 78 76
Belgium 100 110 123 125 133 138 153 140 133 126
Canada 100 98 86 69 62 54 54 52 55 55
Denmark 100 154 238 269 228 227 204 163 168 155
Finland 100 116 145 127 131 131 145 129 119 112
France 100 108 123 118 116 119 122 122 126 121
Germany 100 100 112 110 103 97 89 83 78 76
Greece 100 130 182 237 315 409 450 463 505 536
Ireland 100 200 300 330 354 365 296 252 217 195
Italy 100 118 151 183 197 223 259 285 265 252
Japan 100 111 110 95 90 86 77 69 63 60
Luxembourg 100 87 102 135 141 152 155 124 128 128
Netherlands 100 101 175 158 156 189 207 167 134 114
New Zealand 100 65 94 89 78 72 63 58 62 62
Norway 100 128 176 156 153 134 161 152 145 145
Portugal 100 154 210 242 286 405 438 398 434 417
Spain 100 200 300 293 335 463 523 366 293 263
Sweden 100 107 128 123 117 126 133 123 111 106
Switzerland 100 98 121 145 154 159 150 140 149 152
United Kingdom 100 124 153 128 135 129 120 112 106 104
United States 100 152 215 199 169 142 117 95 86 82
Sources: National bureaus, Atradius Economic Research �

Paseo de la Castellana, 4
28046 Madrid
T. +34 914 326 300
F. +34 914 326 501
creditoycaucion.es
Disclaimer
This report is provided for information purposes only and is not intended as a recommendation or advice as to particular transactions, investments or
strategies in any way to any reader. Readers must make their own independent decisions, commercial or otherwise, regarding the information
provided. While we have made every attempt to ensure that the information contained in this report has been obtained from reliable sources, Atradius
is not responsible for any errors or omissions, or for the results obtained from the use of this information. All information in this report is provided ’as
is’, with no guarantee of completeness, accuracy, timeliness or of the results obtained from its use, and without warranty of any kind, express or
implied. In no event will Atradius, its related partnerships or corporations, or the partners, agents or employees thereof, be liable to you or anyone else
for any decision made or action taken in reliance on the information in this report or for any consequential, special or similar damages, even if advised
of the possibility of such damages.
Copyright Atradius N.V. 2015