Embed Size (px)
Citation preview
Income Inequality measurement in Pakistan and its four provinces by Lorenz curveBy
HINA AMIR
KANWAL BILAL
Journal of Asian Scientific Research
Online ISSN 2223-1331
Volume 1 NO 1
AUGUST, 2011

Shehnil Sajjad
The purpose of this study is to know why some people have more income than others in Pakistan.
Some people have extra income in relation to their needs and some people have not as much income that they can fulfill their basic food requirements.
The proportions of such people are different in four provinces of Pakistan.
INTRODUCTION
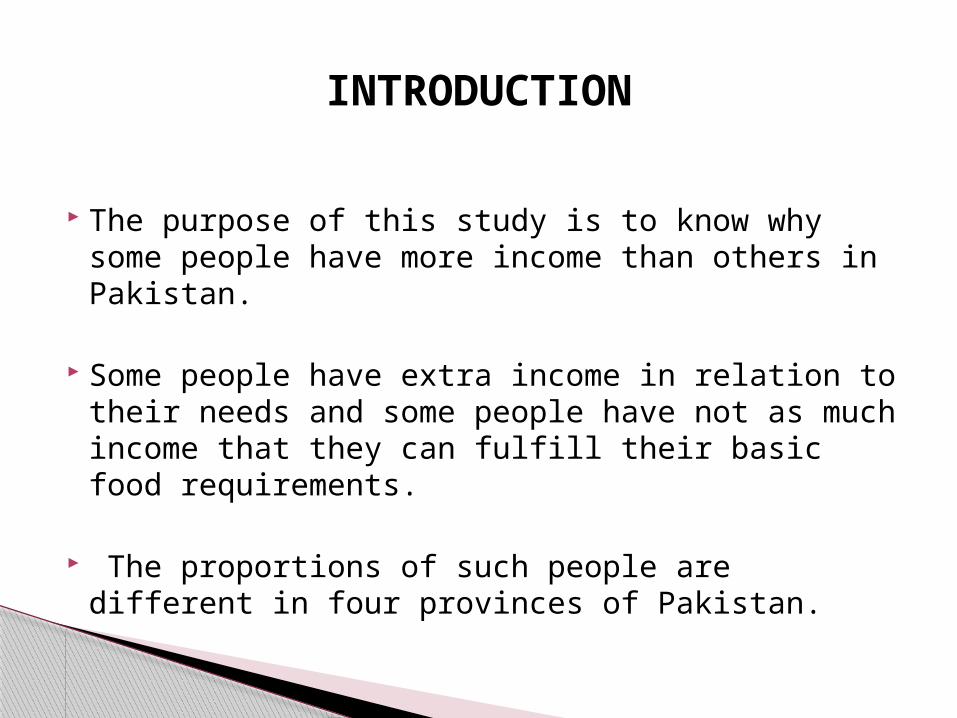
1. Income inequality is the gap between rich and poor i.e. is the
differences in the distribution of economic assets (wealth) and
income within or between populations or individuals.It is the state of an economy in which the
shares of total income earned by the rich and poor are highly unequal
2. Economic inequality varies between societies, historical periods,
economic structures and systems (for example, capitalism or
socialism), ongoing and past wars, and between individuals' abilities to
create wealth.
4. There are three types of social classes in our society
Lower classMiddle classUpper class
3. Economic policy makers can face a tradeoff between promoting equity
and economic growth. As income shares become more equal, the
incentive for individuals to accumulate skills, work hard, and take risks might become smaller,
thus shrinking the size of the economy.
INCOME INEQUALITY
• Labour market outcomes• Globalization• Technological changes
TRADE LIBERALISATION
CAUSES OF INCOME INEQUALITY
Kemal (1994), concluded of three factors contributed to rising income inequality.
First, employment declining, Second, Implementation of taxes on the poor has increased and it has declined on the rich, third, subsides have been withdrawn with effected the poor and the rich alike while increase in prices of output of agricultural goods has mainly benefited the rich.
REVIEWS
HAQQ (1998) , in Pakistan Increase inequality that occurred during the last two decades. After the study on income distribution this paper found that income inequality is greater than expenditure inequality because people smooth their consumption over their lifetimes.
This study was from 1979 to 1992-93 using the data from household income and expenditure surveys
Continue…
Adams and Jane (1995) also examines why do some people receive higher incomes than others with same talents and capabilities, which type of steps can be taken to minimize the wide differences in income earned, so that the number of people living below the poverty line can be reduced.
Continue…

Richard Gephardt’s reference to people, who earn good income as “winners in the lottery of life” is one infamous example of this attitude.
Continue…

The most commonly used measures include Gini Coefficient in which decile ratio, by the bottom 50%, 60%, 70% to household the proportions of total income earned.
The Gini is also derived from the Lorenz Curve.
METHODOLOGY
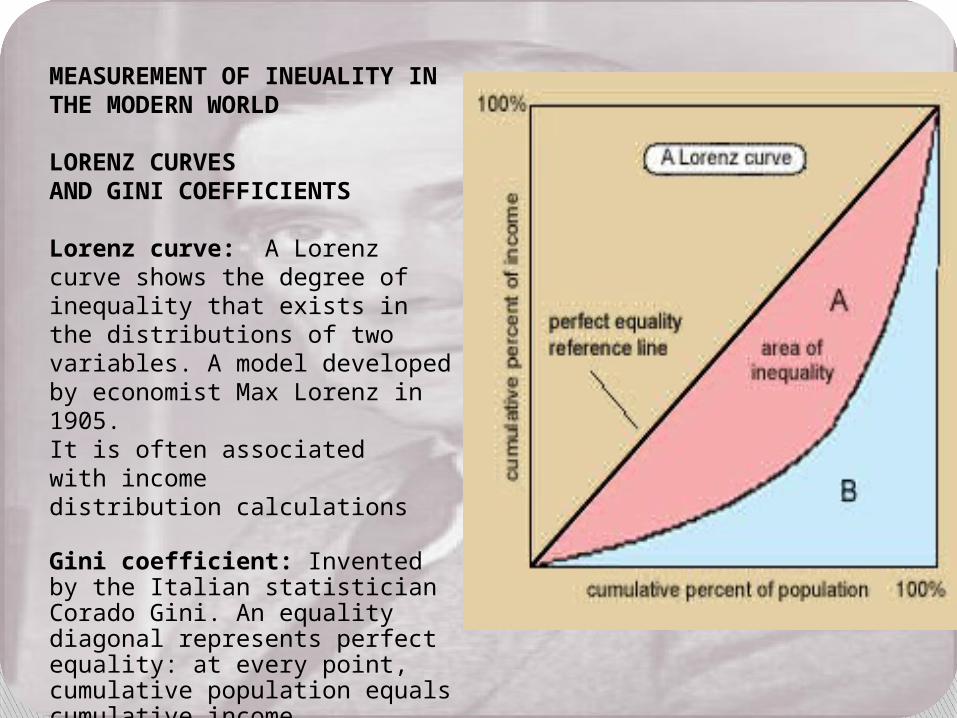
MEASUREMENT OF INEUALITY IN THE MODERN WORLD
LORENZ CURVES AND GINI COEFFICIENTS
Lorenz curve: A Lorenz curve shows the degree of inequality that exists in the distributions of two variables. A model developed by economist Max Lorenz in 1905. It is often associated with income distribution calculations
Gini coefficient: Invented by the Italian statistician Corado Gini. An equality diagonal represents perfect equality: at every point, cumulative population equals cumulative income. A - Equality Diagonal Population = IncomeB – Lorenz Curve C – Difference Between Equality and Reality
This data is about four provinces.
It can refer to cross sectional descriptions of the income or wealth at any particular period, and to the lifetime income and wealth over longer periods of time.
There are various numerical indicates for measuring economic inequality.
MEASUREMENT
The research report is based on the cross section data which is used in this report taken from HIES (Household Integrated Economic Survey (1998-1999).. There are two types of data:
1- Primary data 2- Secondary data
This data is secondary because it is coated. It has been taken from other sources.. Here, some variables are used in this report as household. A household may be either a single person household or a multi person household.
DATA
PAKISTAN
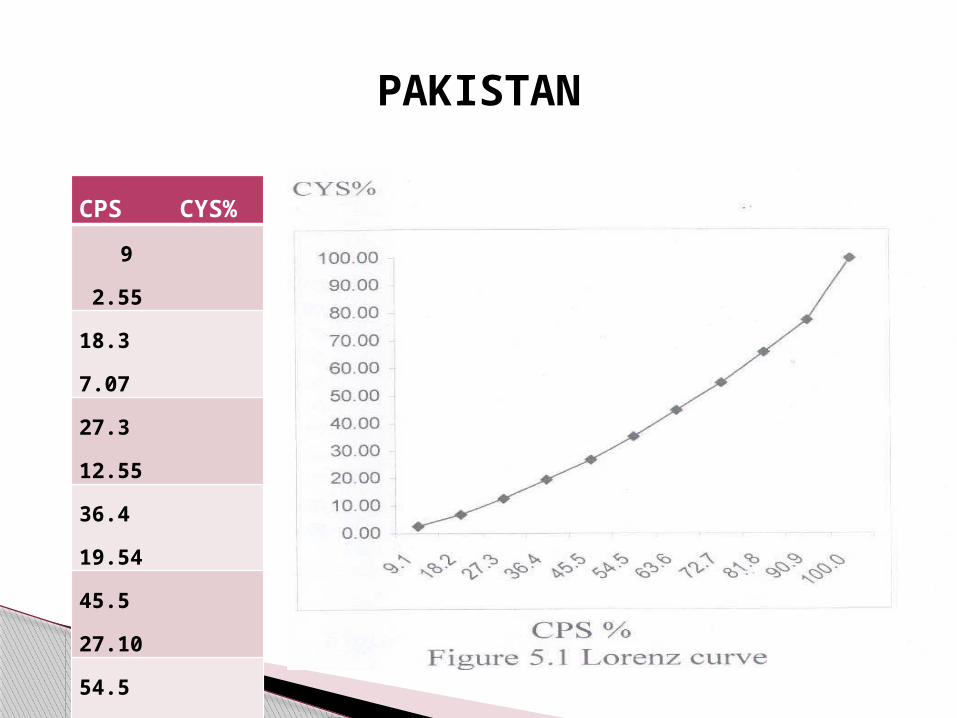
CPS CYS%
9 2.55
18.3 7.07
27.3 12.55
36.4 19.54
45.5 27.10
54.5 35.52
63.6 44.73
72.7 54.81
81.8 65.75
90.9 77.35
100 100
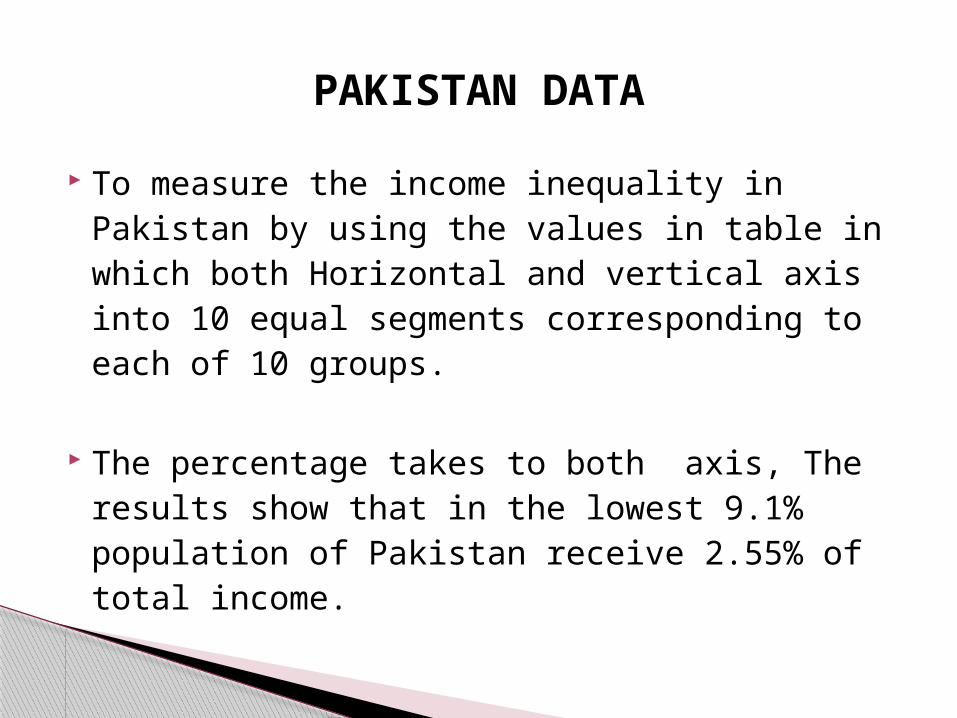
To measure the income inequality in Pakistan by using the values in table in which both Horizontal and vertical axis into 10 equal segments corresponding to each of 10 groups.
The percentage takes to both axis, The results show that in the lowest 9.1% population of Pakistan receive 2.55% of total income.
PAKISTAN DATA
PUNJAB
CPS% CYS%
9 4. 32
18 9.45
27 11.15
36 17.73
45 24.60
55 32.05
64 42.05
73 56.54
82 71.03
91 85.51
100 100
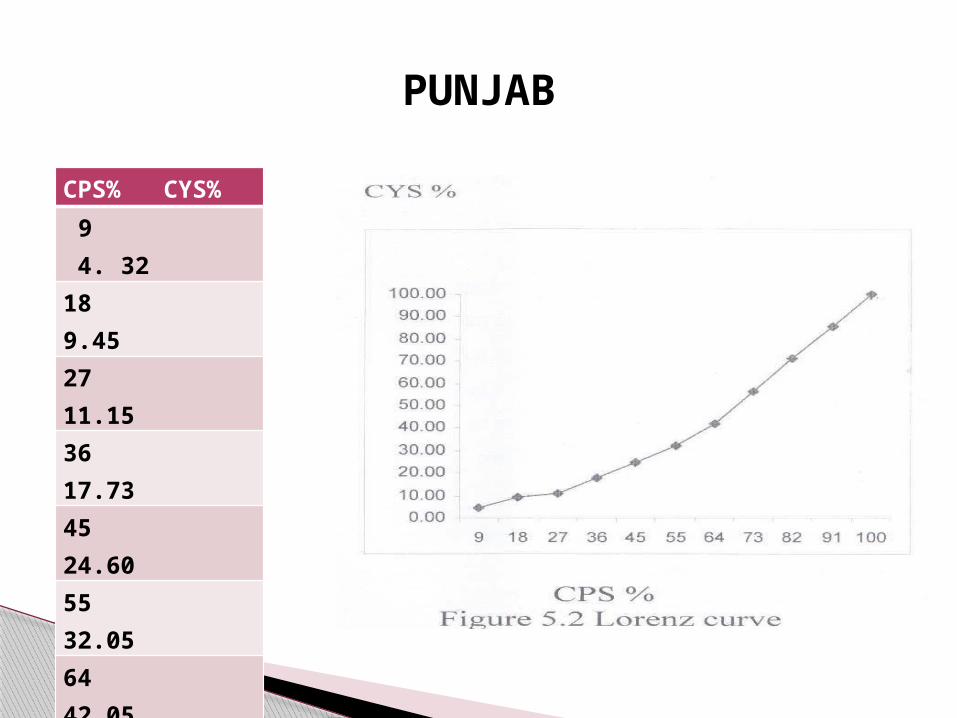
In Lorenz is drawn for the measurement of income inequality in Punjab by using the values contained in the table.
In this, also the percentage of cumulative population share is shown at horizontal axis and cumulative income share is taken at the vertical axis. In this lower 27% receives 11.15% of total income.
PUNJAB
SINDH
CPS% CYS%
9.1 3.8
18.2 8.3
27.3 13.6
36.4 19.2
45.5 25.4
54.5 32.3
63.6 43.8
72.7 57.8
81.8 7 1.9
90.9 85.9
100.0 100.0
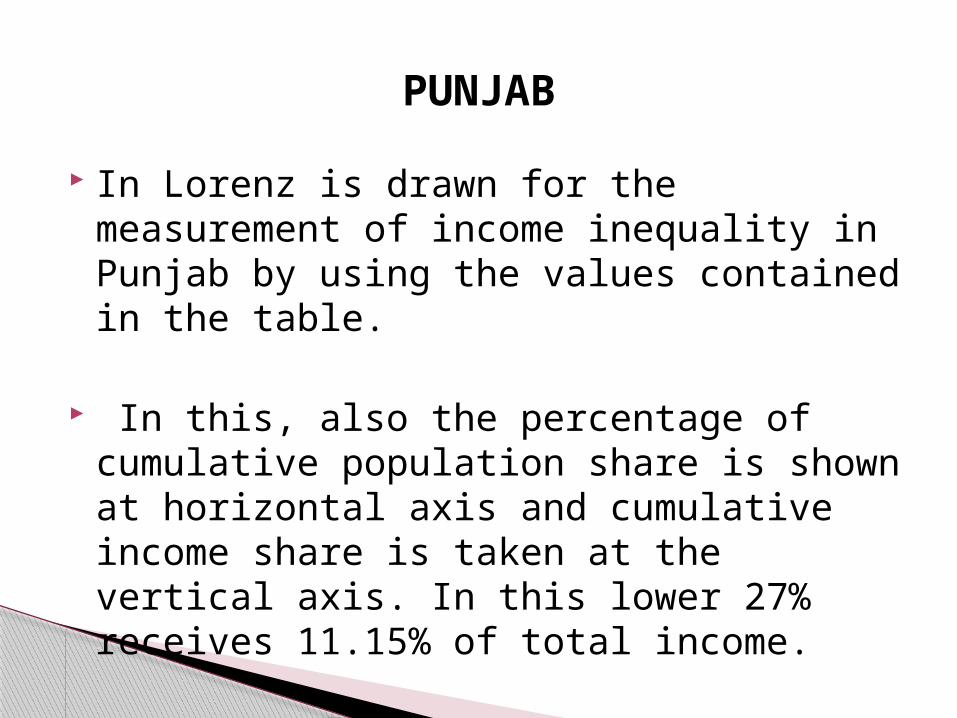
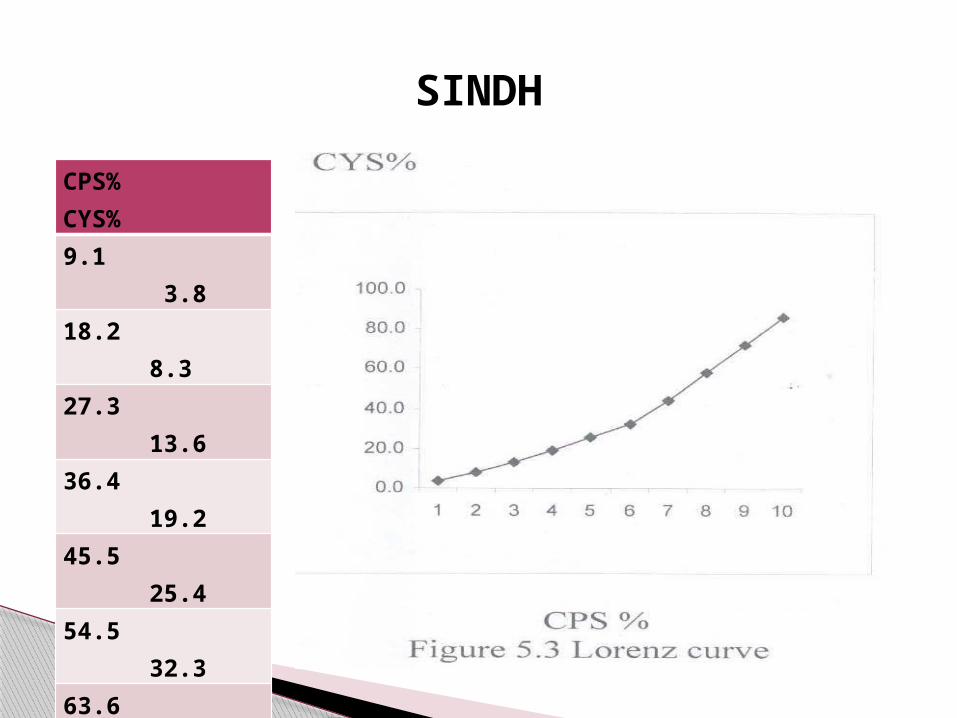
In Lorenz is drawn for the measurement of income inequality in Sindh by using the values contained in the table.
The situation of income inequality of Sindh is the lowest value of 18.2% of population is receiving 8.3% of total income.
SINDH

KHYBER PAKHTUN KHWA
CPS% CYS%
9.1 4.3
18.2 9.2
27.3 14.6
36.4 20.7
45.5 25.2
54.5 32.0
63.6 40.1
72.7 55.1
81.8 70.1
100 100

Lorenz curve is drawn to measure the income inequality in Khyber Pakhtunkhwa by using the values contained in table.
The measure of income inequality in Khyber Pakhtunkhwa is the lower point 9.1% of the population is receiving 4.3% of total income.
KPK
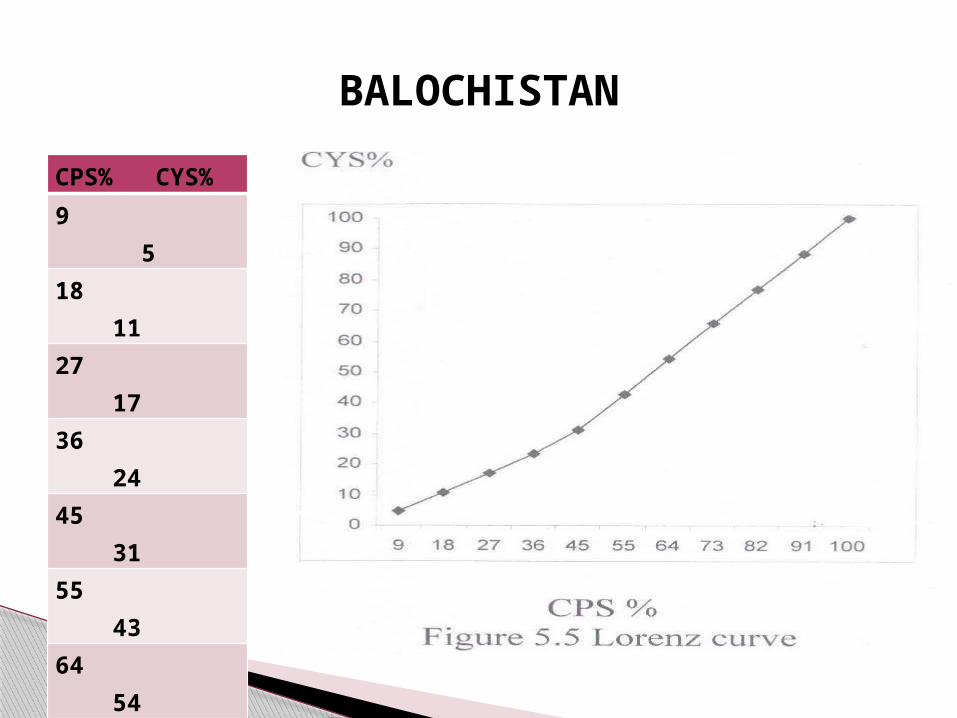
BALOCHISTAN
CPS% CYS%
9 5
18 11
27 17
36 24
45 31
55 43
64 54
73 66
82 77
91 89
100 100
In Baluchistan the situation of income inequality is different as comparing with other provinces as Punjab, Sindh and Khyber Pakhtunkhwa because values of table and Lorenz curve shows less inequality in Baluchistan than other provinces of Pakistan.
BALOCHISTAN
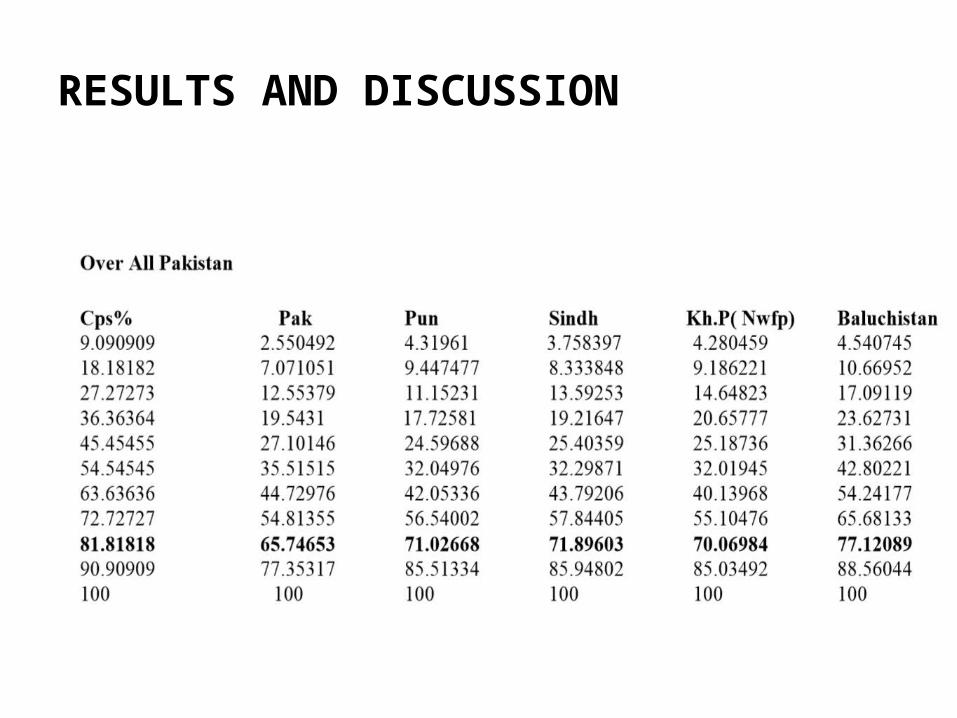
RESULTS AND DISCUSSION

RESULT
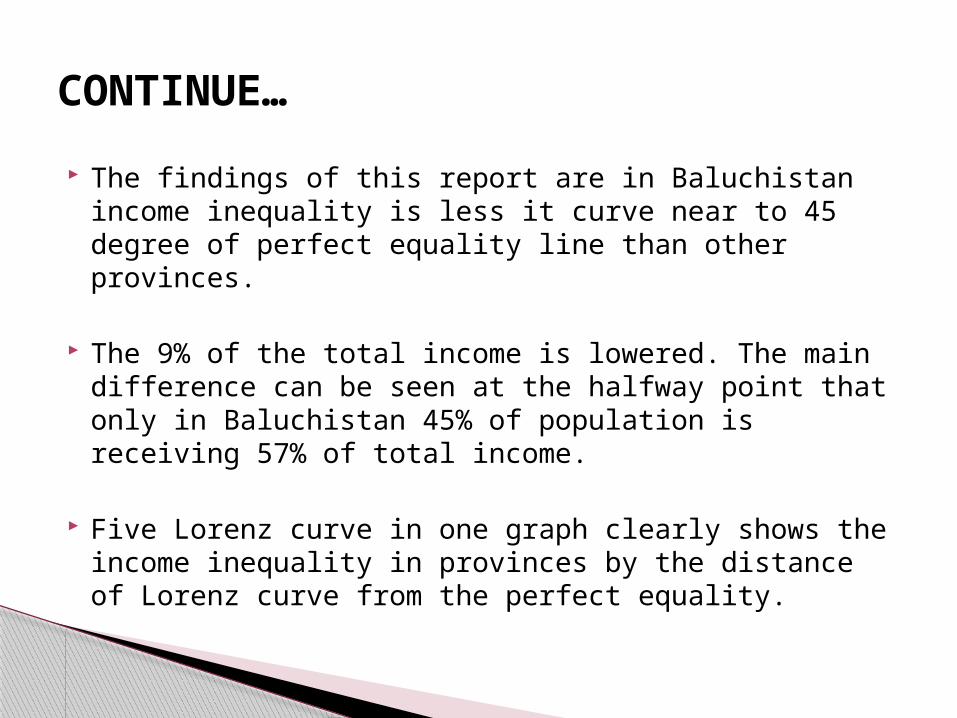
The findings of this report are in Baluchistan income inequality is less it curve near to 45 degree of perfect equality line than other provinces.
The 9% of the total income is lowered. The main difference can be seen at the halfway point that only in Baluchistan 45% of population is receiving 57% of total income.
Five Lorenz curve in one graph clearly shows the income inequality in provinces by the distance of Lorenz curve from the perfect equality.
CONTINUE…
Greater the distance shows greater the degree of inequality. As distance becomes less there will be equality
Continue..
Click icon to add picture
THANK YOUTHANK YOU