Embed Size (px)
Citation preview
Investment Risk Management
Under New Regulatory Framework
Steven Yang Yu
Muqiu Liu
Redington Ltd
08 May 2015
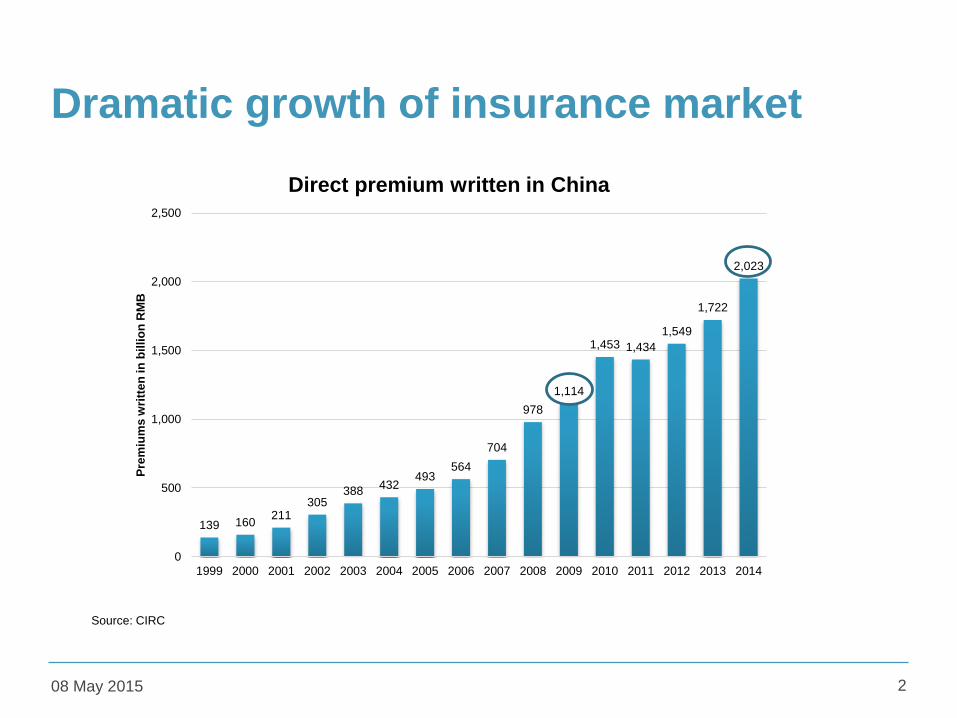
Dramatic growth of insurance market
08 May 2015 2
139 160211
305388
432493
564
704
978
1,114
1,453 1,434
1,549
1,722
2,023
0
500
1,000
1,500
2,000
2,500
1999 2000 2001 2002 2003 2004 2005 2006 2007 2008 2009 2010 2011 2012 2013 2014
Pre
miu
ms
wri
tte
n in
bil
lio
n R
MB
Direct premium written in China
Source: CIRC

4th largest globally
08 May 2015 3
1,259
532
330278 255 247
169 145 125 101
0
200
400
600
800
1,000
1,200
1,400
Pre
miu
ms
wri
tte
n in
bil
lio
n U
.S.
do
lla
rs
Direct premium written by countries 2013
Ping An Insurance is one of the 9 Globally Systematically Important Insurers (G-SIIs) in the world!
Source: Statista
Opportunities but also challenges
08 May 2015 4
• Weak risk management capability
• Low capital efficiency
• Long-term investment not performing well
• Customer complaints, mis-selling
• High expenses
Agenda for this workshop
08 May 2015 5
• Regulations: C-ROSS
• Key investment risks
• Example strategies to manage risk
• Equities
• Credit
• Interest rate
• Conclusion: 4 key takeaways
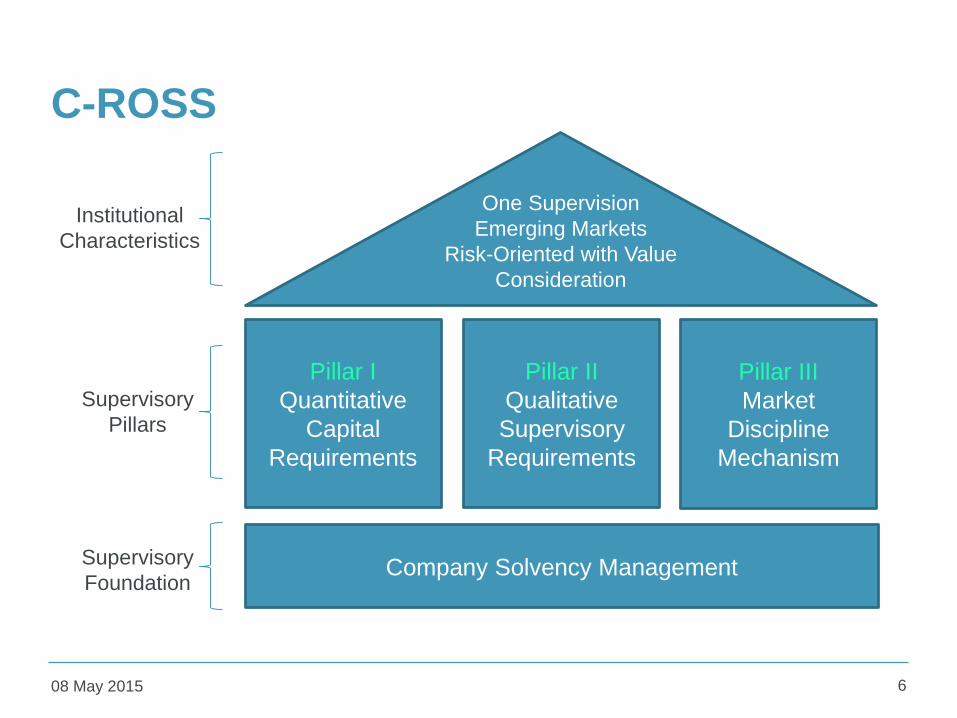
C-ROSS
08 May 2015 6
Pillar I
Quantitative
Capital
Requirements
Pillar II
Qualitative
Supervisory
Requirements
Pillar III
Market
Discipline
Mechanism
Company Solvency Management
One Supervision
Emerging Markets
Risk-Oriented with Value
Consideration
Institutional
Characteristics
Supervisory
Pillars
Supervisory
Foundation

C-ROSS
08 May 2015 7
Quantifiable Risk
Market Risk
Interest Rate Risk
Credit Risk
Insurance Risk
Investment Strategy
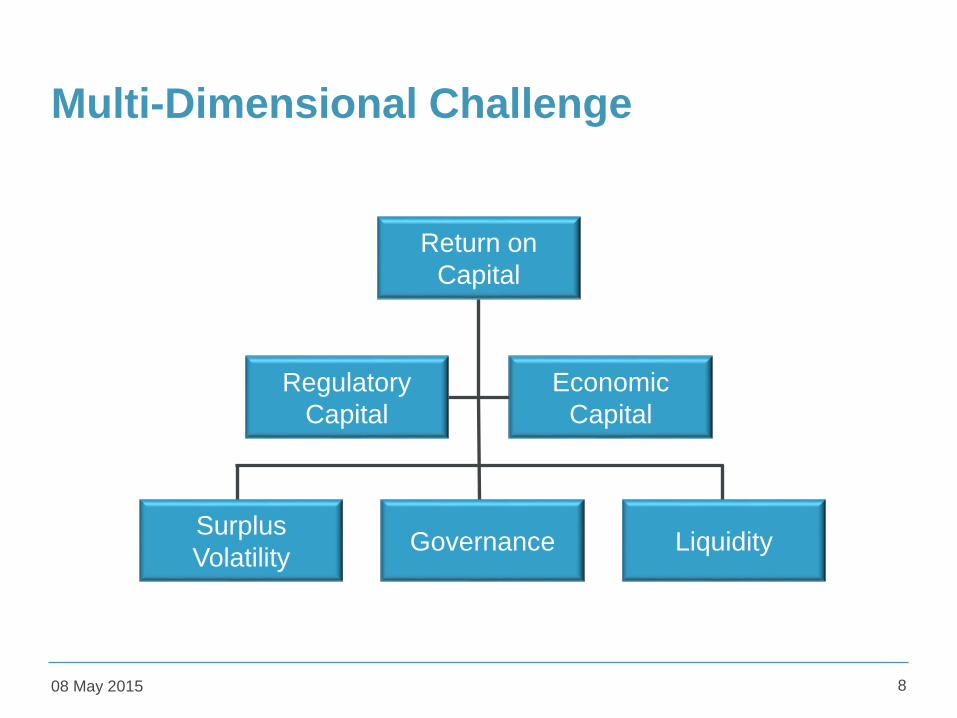
Multi-Dimensional Challenge
08 May 2015 8
Return on
Capital
Regulatory
Capital
Economic
Capital
GovernanceSurplus
VolatilityLiquidity

Investment Risk Management Framework
08 May 2015 9
Objective Measurement Quantification Action
ReturnExpected return > Shareholder
required return on capital
Expected return on capital 13.5%
-Required return on capital 12.0%
Margin (Expected return less required return) 1.5%
Risk / Capital Current capital > required capital
Economic basis
Current capital budget £1,150m
-Required capital (VaR
99.5%)£1,020m
Regulatory basis
Current capital budget £1,300Bring current capital in line
with required capitalRequired capital (VaR
99.5%)£1,350
Liquidity
The company should hold enough
eligible assets to cover additional
liquidity requirements in an adverse
scenario
Available liquid asset £400m
-
5 year cashflows if lapse rate increases by 20% £250m
Asset allocation
target
benchmark
The current asset allocation is to be
kept within +/- 5% of the target
benchmark allocation
Government bonds 20% 36.2%
Allocate out of overweight
assets into relatively
underweight assets to
bring in line with target
benchmark allocations
Corporate bonds 10% 10.5%
Equity 35% 27.0%
Property 5% 6.3%
Other assets 30% 26.0%
On track Within 10% of target Off track
Equity Risk Management
08 May 2015
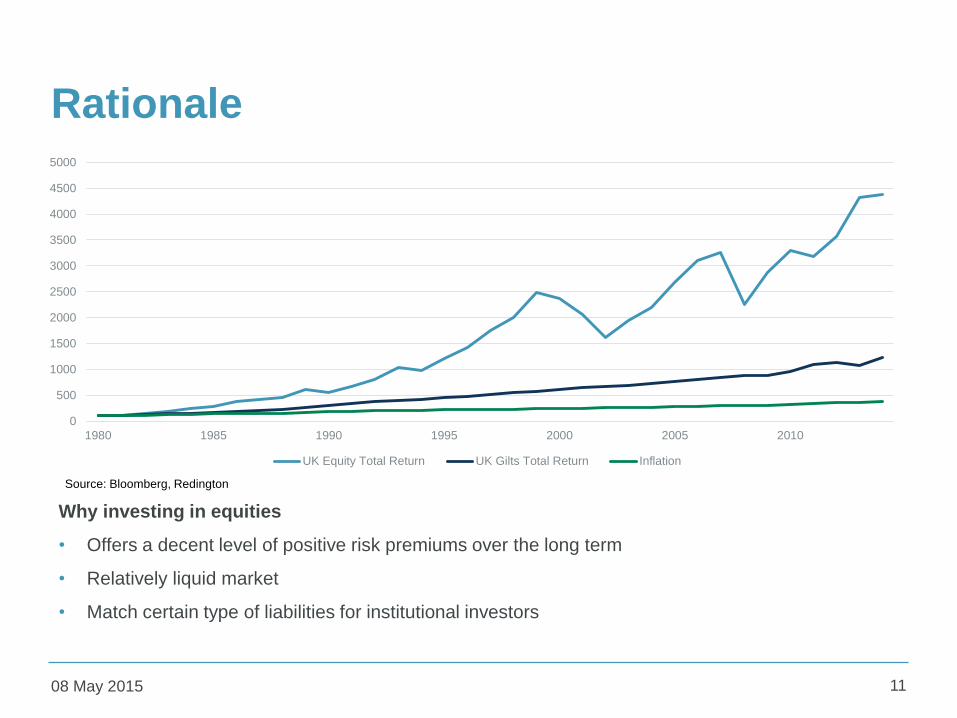
Rationale
08 May 2015 11
Why investing in equities
• Offers a decent level of positive risk premiums over the long term
• Relatively liquid market
• Match certain type of liabilities for institutional investors
0
500
1000
1500
2000
2500
3000
3500
4000
4500
5000
1980 1985 1990 1995 2000 2005 2010
UK Equity Total Return UK Gilts Total Return Inflation
Source: Bloomberg, Redington
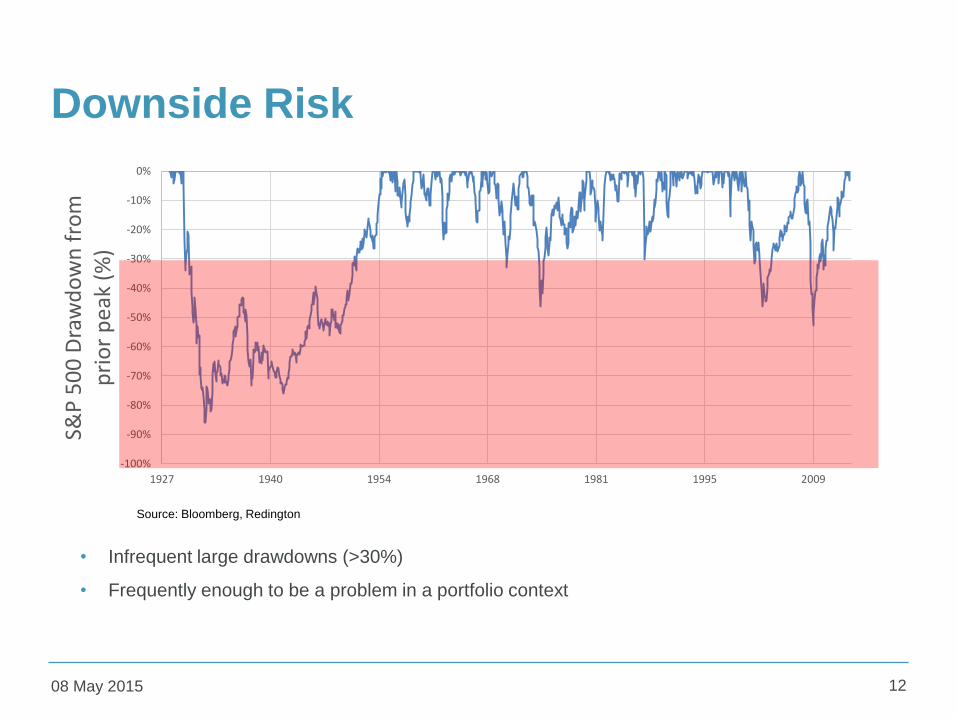
Downside Risk
• Infrequent large drawdowns (>30%)
• Frequently enough to be a problem in a portfolio context
08 May 2015 12
-100%
-90%
-80%
-70%
-60%
-50%
-40%
-30%
-20%
-10%
0%
1927 1940 1954 1968 1981 1995 2009
S&P
50
0 D
raw
do
wn
fro
m
pri
or
pe
ak (
%)
Source: Bloomberg, Redington
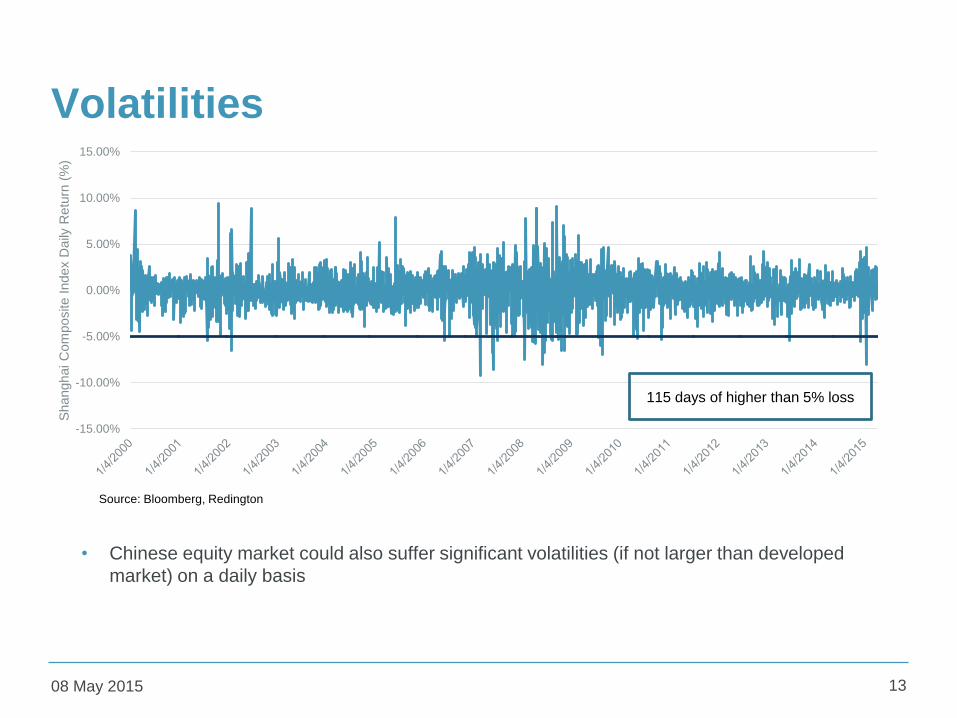
Volatilities
• Chinese equity market could also suffer significant volatilities (if not larger than developed
market) on a daily basis
08 May 2015 13
-15.00%
-10.00%
-5.00%
0.00%
5.00%
10.00%
15.00%
Shanghai C
om
posite I
ndex D
aily
Retu
rn (
%)
Source: Bloomberg, Redington
115 days of higher than 5% loss
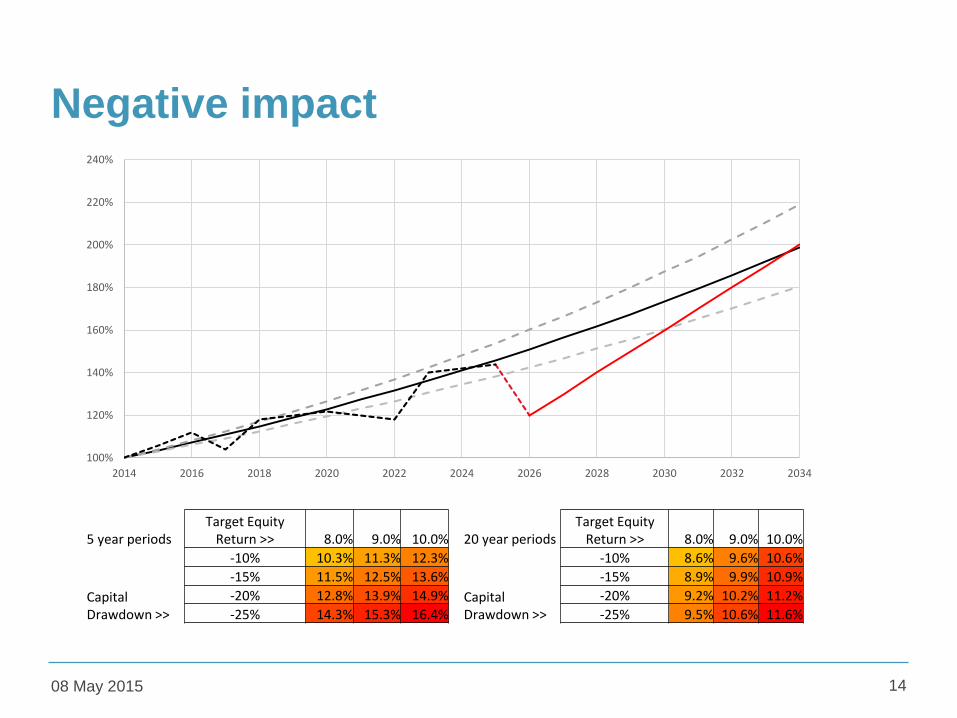
Negative impact
08 May 2015 14
100%
120%
140%
160%
180%
200%
220%
240%
2014 2016 2018 2020 2022 2024 2026 2028 2030 2032 2034
5 year periodsTarget Equity
Return >> 8.0% 9.0% 10.0%
Capital Drawdown >>
-10% 10.3% 11.3% 12.3%
-15% 11.5% 12.5% 13.6%
-20% 12.8% 13.9% 14.9%
-25% 14.3% 15.3% 16.4%
20 year periodsTarget Equity
Return >> 8.0% 9.0% 10.0%
Capital Drawdown >>
-10% 8.6% 9.6% 10.6%
-15% 8.9% 9.9% 10.9%
-20% 9.2% 10.2% 11.2%
-25% 9.5% 10.6% 11.6%
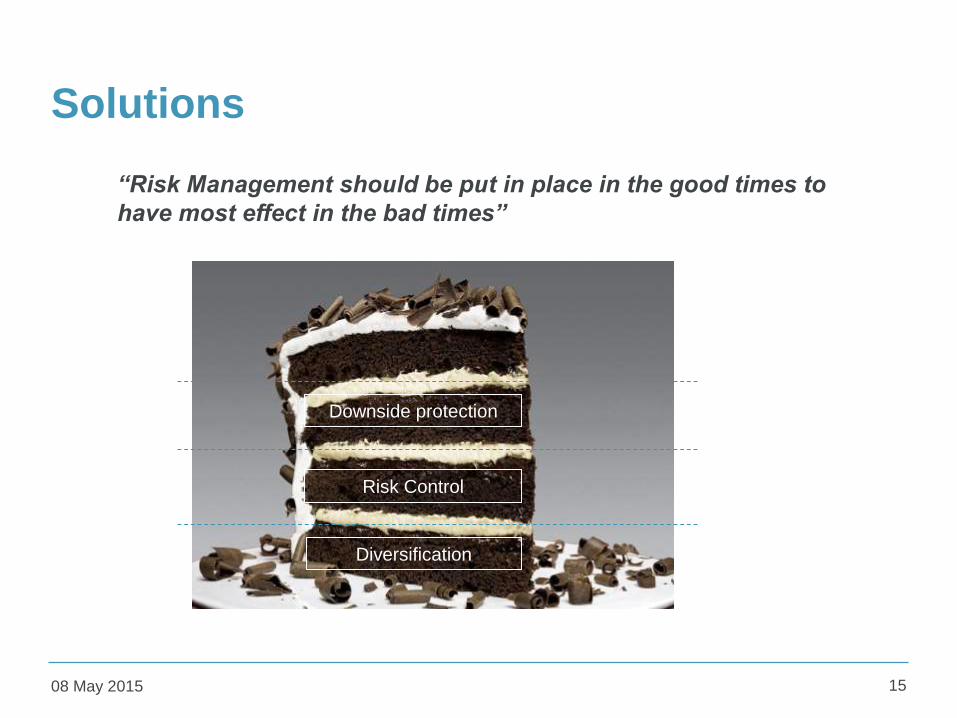
Solutions
08 May 2015 15
Diversification
Downside protection
Risk Control
“Risk Management should be put in place in the good times to
have most effect in the bad times”

5.00%
5.50%
6.00%
6.50%
7.00%
7.50%
8.00%
1.5% 3.5% 5.5% 7.5% 9.5% 11.5% 13.5% 15.5% 17.5% 19.5%
EX
pe
cte
d R
etu
rn
Risk (measured by standard deviation of annual returns)
Efficient Frontier
1. Diversification
08 May 2015 16
Concentrated equity
portfolio
50% DM Equity
10% EM Equity
30% Alternatives
40% DM Equity
0% EM Equity
60% Alternatives
50% DM Equity
30% EM Equity
20% Alternatives
20% DM Equity
80% EM Equity
0% Alternatives
Source: Redington
2. Risk Control
08 May 2015 17
Source: Bloomberg, Redington
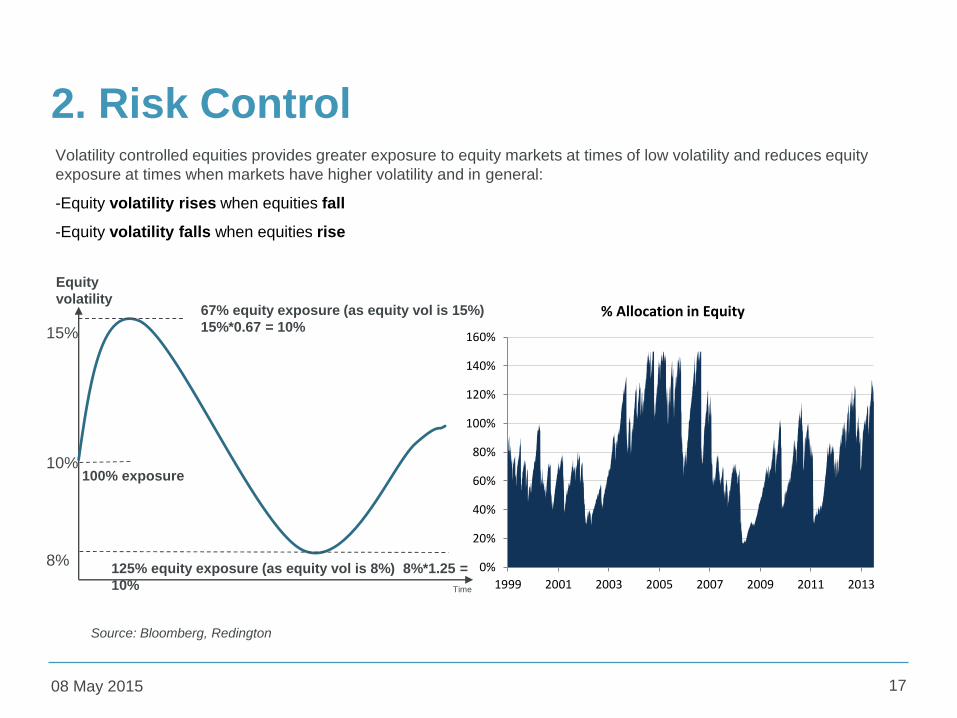
Volatility controlled equities provides greater exposure to equity markets at times of low volatility and reduces equity
exposure at times when markets have higher volatility and in general:
-Equity volatility rises when equities fall
-Equity volatility falls when equities rise
Equity
volatility
100% exposure
67% equity exposure (as equity vol is 15%)
15%*0.67 = 10%
125% equity exposure (as equity vol is 8%) 8%*1.25 =
10% Time
0%
20%
40%
60%
80%
100%
120%
140%
160%
1999 2001 2003 2005 2007 2009 2011 2013
% Allocation in Equity
15%
10%
8%
2. Risk Control
08 May 2015 18
0%
10%
20%
30%
40%
50%
60%
70%
An
nu
alized
Vo
lati
lity
(%
)
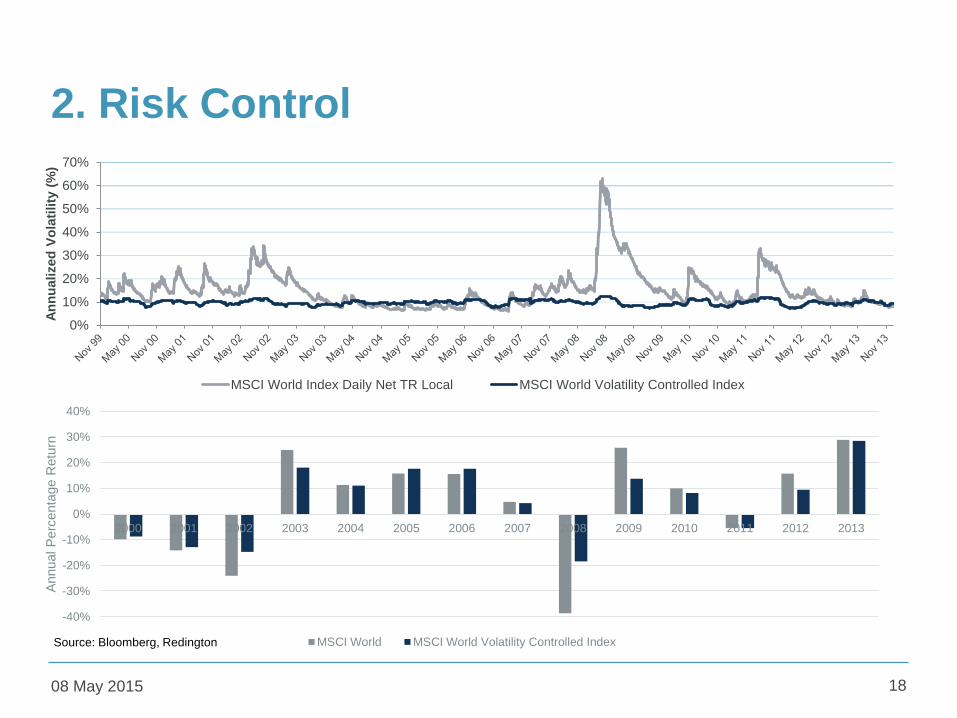
MSCI World Index Daily Net TR Local MSCI World Volatility Controlled Index
-40%
-30%
-20%
-10%
0%
10%
20%
30%
40%
2000 2001 2002 2003 2004 2005 2006 2007 2008 2009 2010 2011 2012 2013
Annual P
erc
enta
ge R
etu
rn
MSCI World MSCI World Volatility Controlled IndexSource: Bloomberg, Redington
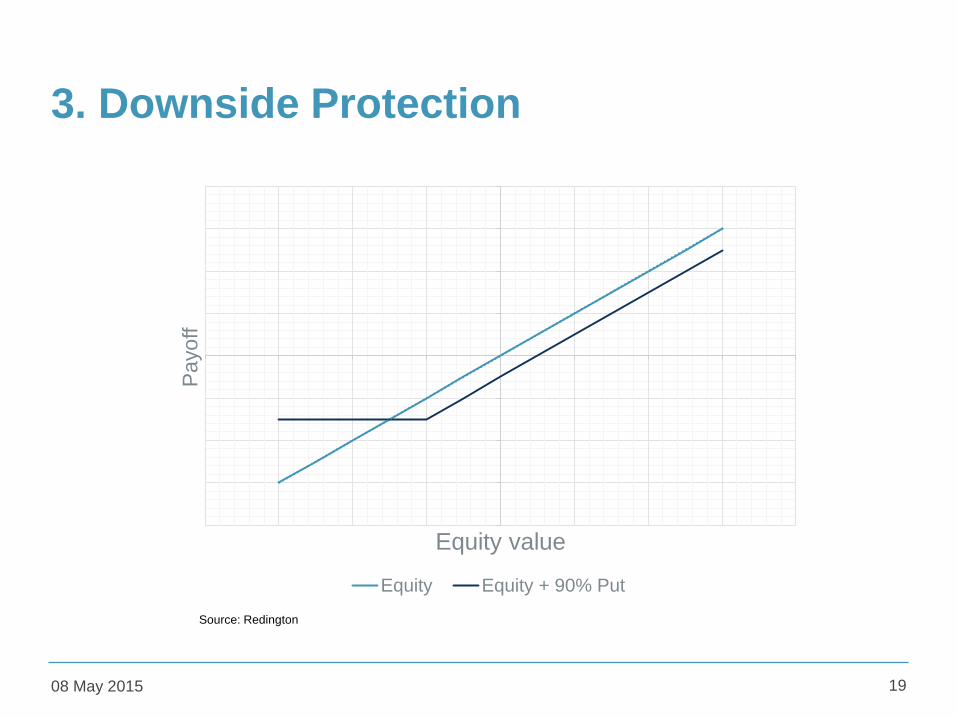
3. Downside Protection
08 May 2015 19
Payoff
Equity value
Equity Equity + 90% Put
Source: Redington
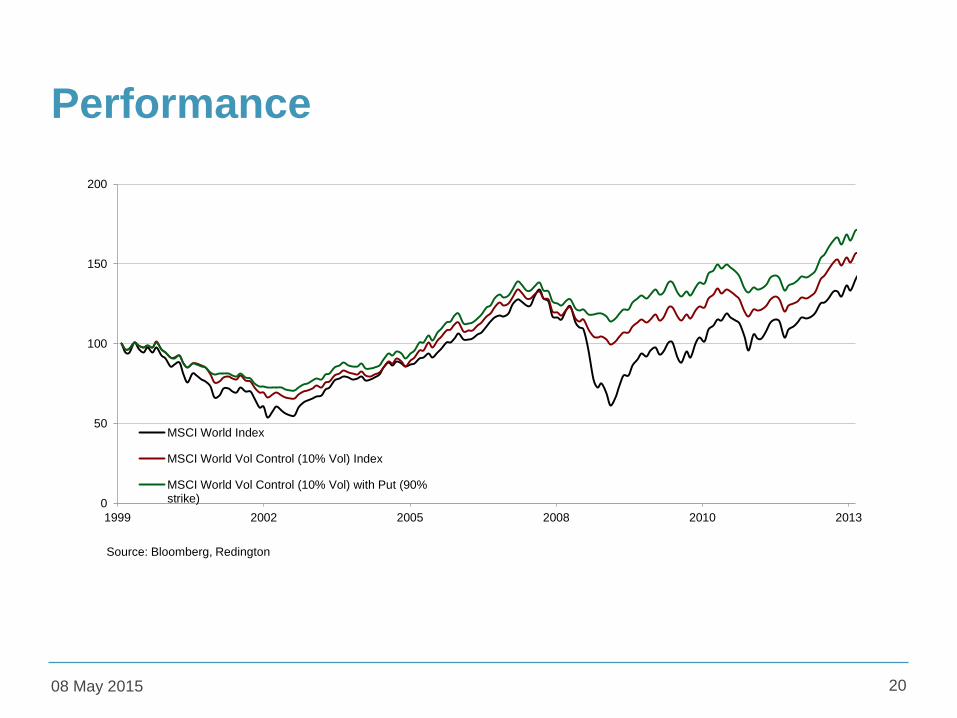
Performance
08 May 2015 20
0
50
100
150
200
1999 2002 2005 2008 2010 2013
MSCI World Index
MSCI World Vol Control (10% Vol) Index
MSCI World Vol Control (10% Vol) with Put (90%strike)
Source: Bloomberg, Redington

Credit Optimization
08 May 2015
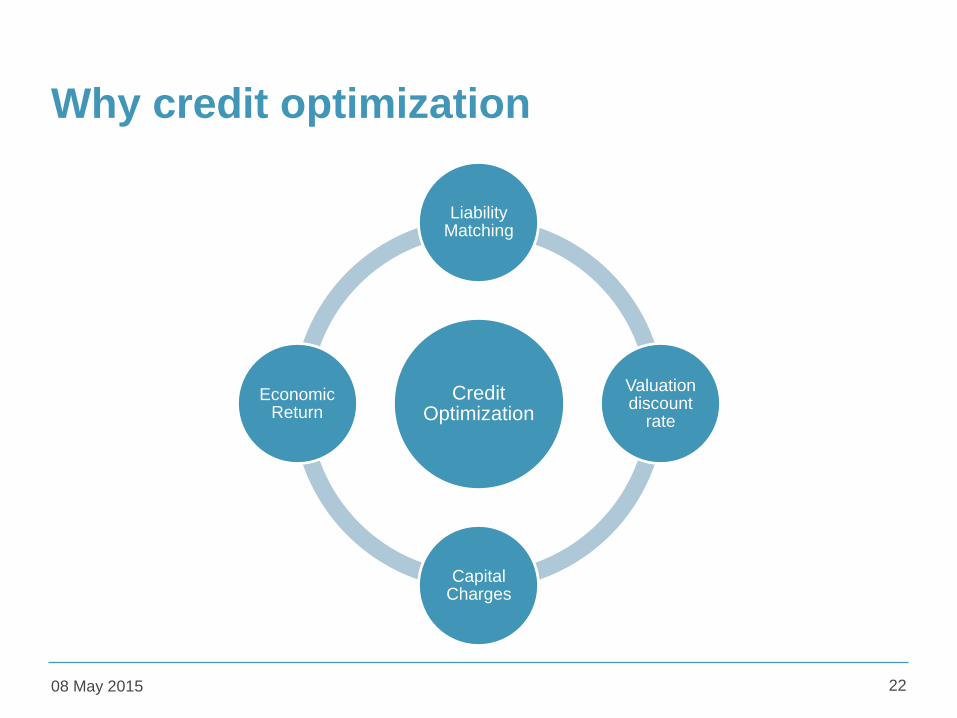
Why credit optimization
08 May 2015 22
Credit Optimization
Liability Matching
Valuation discount
rate
Capital Charges
Economic Return
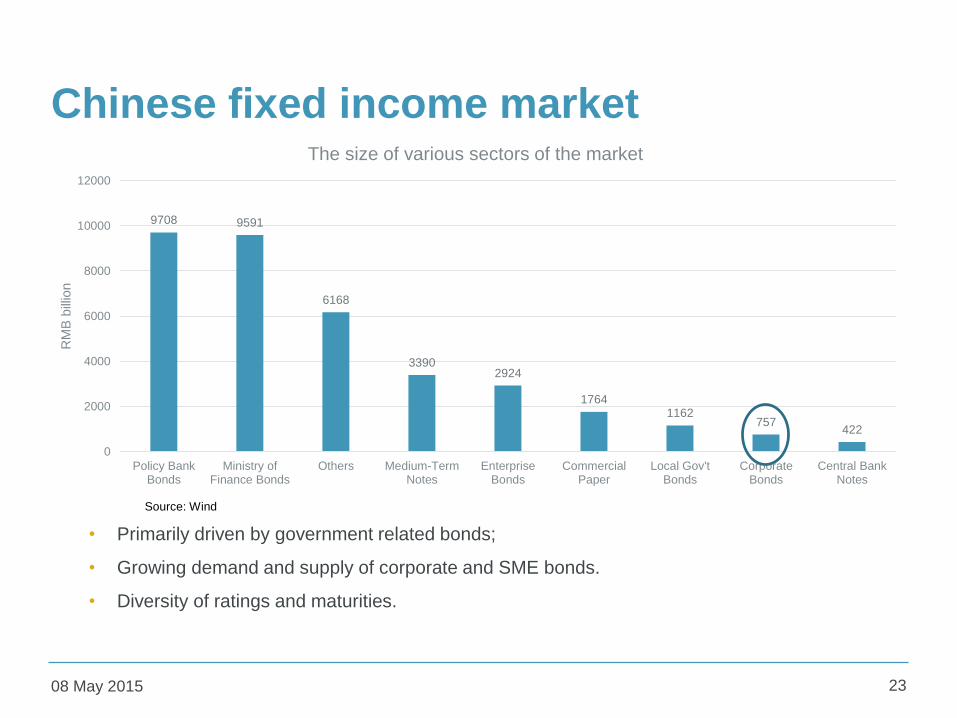
Chinese fixed income market
08 May 2015 23
• Primarily driven by government related bonds;
• Growing demand and supply of corporate and SME bonds.
• Diversity of ratings and maturities.
9708 9591
6168
33902924
17641162
757422
0
2000
4000
6000
8000
10000
12000
Policy BankBonds
Ministry ofFinance Bonds
Others Medium-TermNotes
EnterpriseBonds
CommercialPaper
Local Gov'tBonds
CorporateBonds
Central BankNotes
RM
B b
illio
n
The size of various sectors of the market
Source: Wind
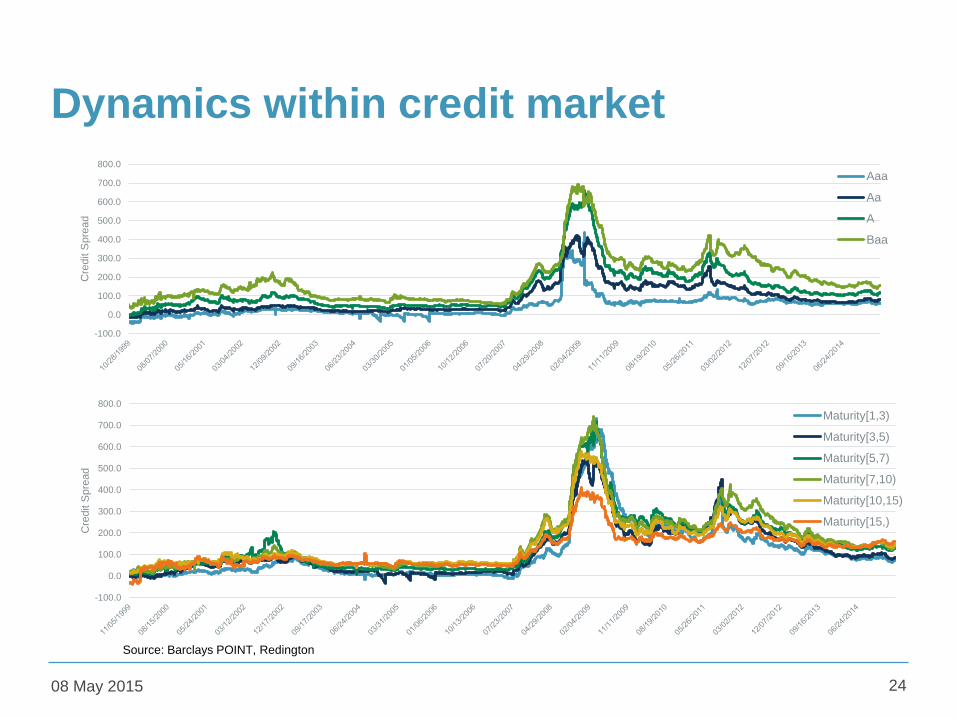
Dynamics within credit market
08 May 2015 24
-100.0
0.0
100.0
200.0
300.0
400.0
500.0
600.0
700.0
800.0
Cre
dit S
pre
ad
Aaa
Aa
A
Baa
-100.0
0.0
100.0
200.0
300.0
400.0
500.0
600.0
700.0
800.0
Cre
dit S
pre
ad
Maturity[1,3)
Maturity[3,5)
Maturity[5,7)
Maturity[7,10)
Maturity[10,15)
Maturity[15,)
Source: Barclays POINT, Redington
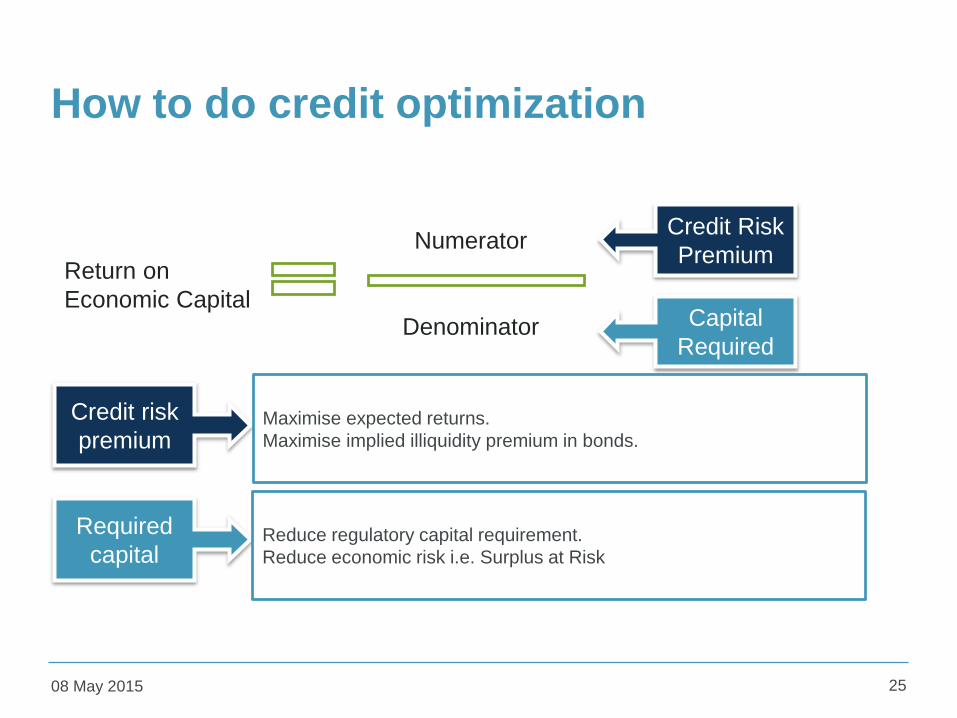
How to do credit optimization
08 May 2015 25
Return on
Economic Capital
Credit risk
premium
Required
capital
Numerator
Denominator
Credit Risk
Premium
Capital
Required
Maximise expected returns.
Maximise implied illiquidity premium in bonds.
Reduce regulatory capital requirement.
Reduce economic risk i.e. Surplus at Risk
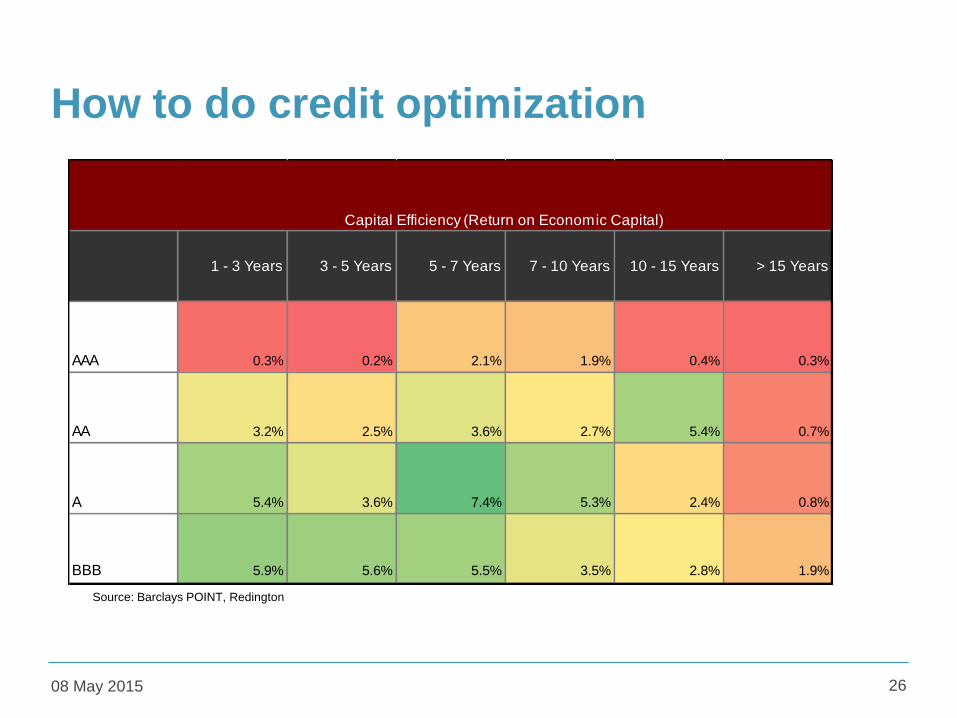
How to do credit optimization
08 May 2015 26
Source: Barclays POINT, Redington
1 - 3 Years 3 - 5 Years 5 - 7 Years 7 - 10 Years 10 - 15 Years > 15 Years
AAA 0.3% 0.2% 2.1% 1.9% 0.4% 0.3%
AA 3.2% 2.5% 3.6% 2.7% 5.4% 0.7%
A 5.4% 3.6% 7.4% 5.3% 2.4% 0.8%
BBB 5.9% 5.6% 5.5% 3.5% 2.8% 1.9%
Capital Efficiency (Return on Economic Capital)
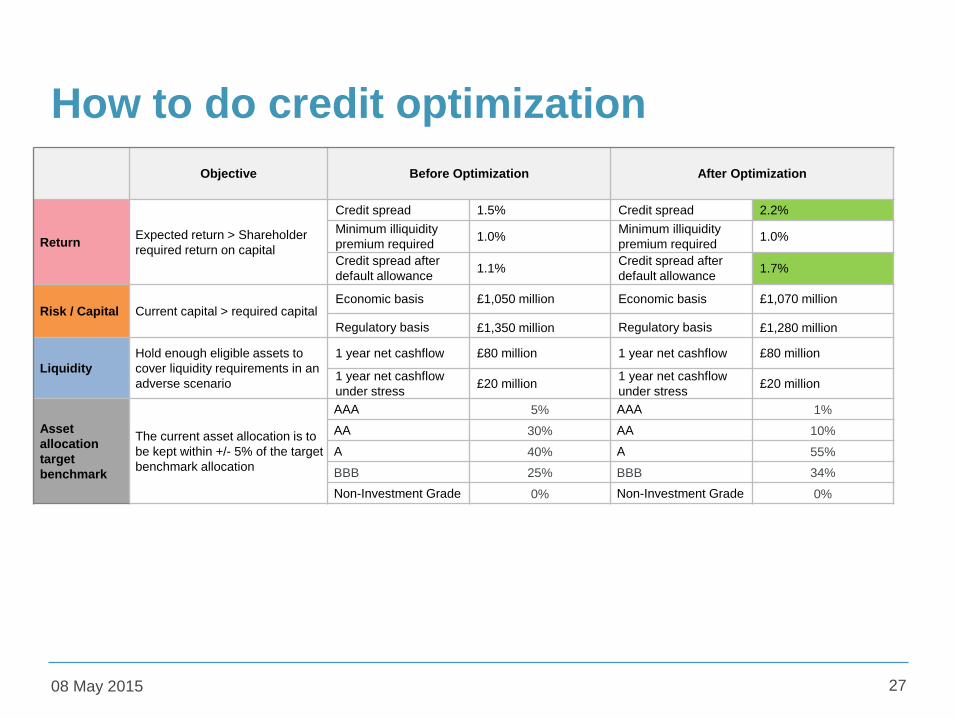
How to do credit optimization
08 May 2015 27
Objective Before Optimization After Optimization
ReturnExpected return > Shareholder
required return on capital
Credit spread 1.5% Credit spread 2.2%
Minimum illiquidity
premium required1.0%
Minimum illiquidity
premium required1.0%
Credit spread after
default allowance1.1%
Credit spread after
default allowance1.7%
Risk / Capital Current capital > required capitalEconomic basis £1,050 million Economic basis £1,070 million
Regulatory basis £1,350 million Regulatory basis £1,280 million
Liquidity
Hold enough eligible assets to
cover liquidity requirements in an
adverse scenario
1 year net cashflow £80 million 1 year net cashflow £80 million
1 year net cashflow
under stress£20 million
1 year net cashflow
under stress£20 million
Asset
allocation
target
benchmark
The current asset allocation is to
be kept within +/- 5% of the target
benchmark allocation
AAA 5% AAA 1%
AA 30% AA 10%
A 40% A 55%
BBB 25% BBB 34%
Non-Investment Grade 0% Non-Investment Grade 0%
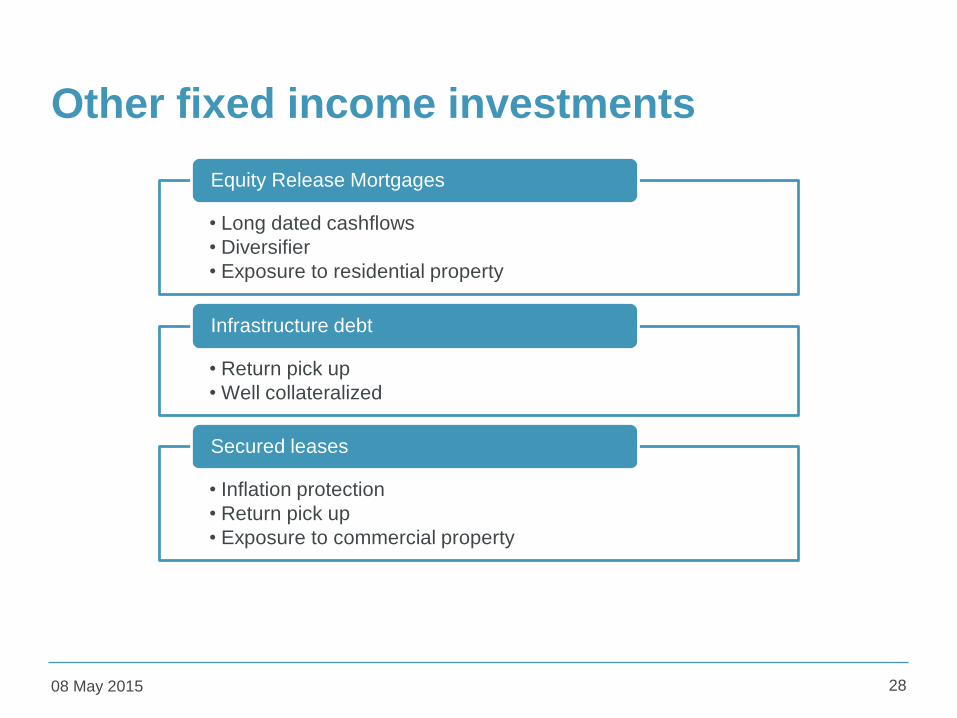
Other fixed income investments
08 May 2015 28
• Long dated cashflows
• Diversifier
• Exposure to residential property
Equity Release Mortgages
• Return pick up
• Well collateralized
Infrastructure debt
• Inflation protection
• Return pick up
• Exposure to commercial property
Secured leases
Managing Interest Rate Risk
08 May 2015
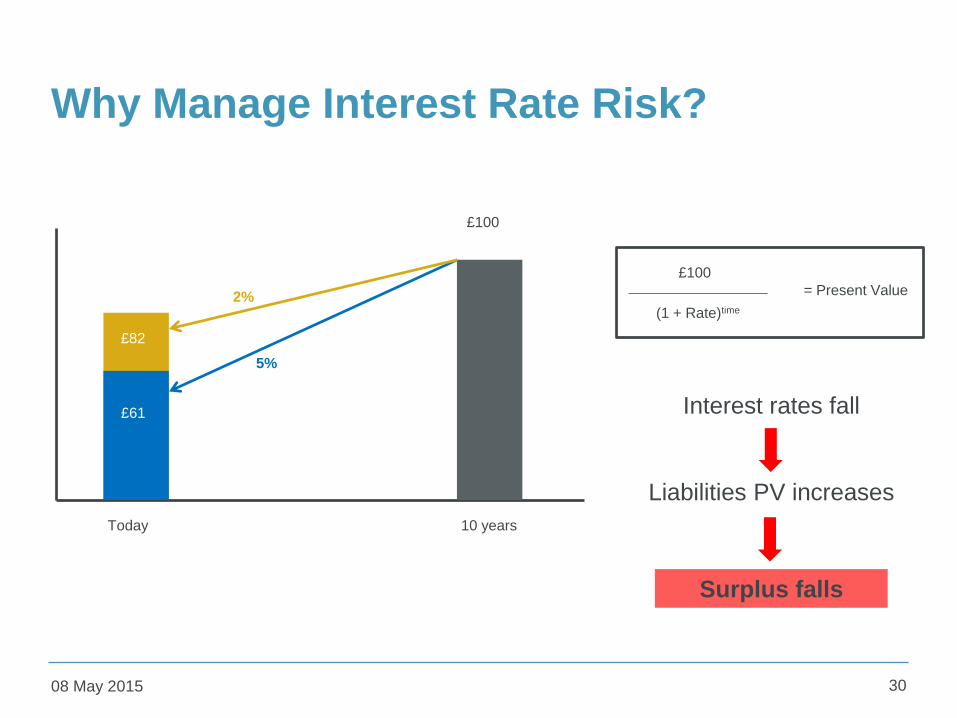
Why Manage Interest Rate Risk?
08 May 2015 30
Interest rates fall
Liabilities PV increases
Surplus falls
10 years
£100
£61
£82
Today
2%
5%
£100
(1 + Rate)time
= Present Value
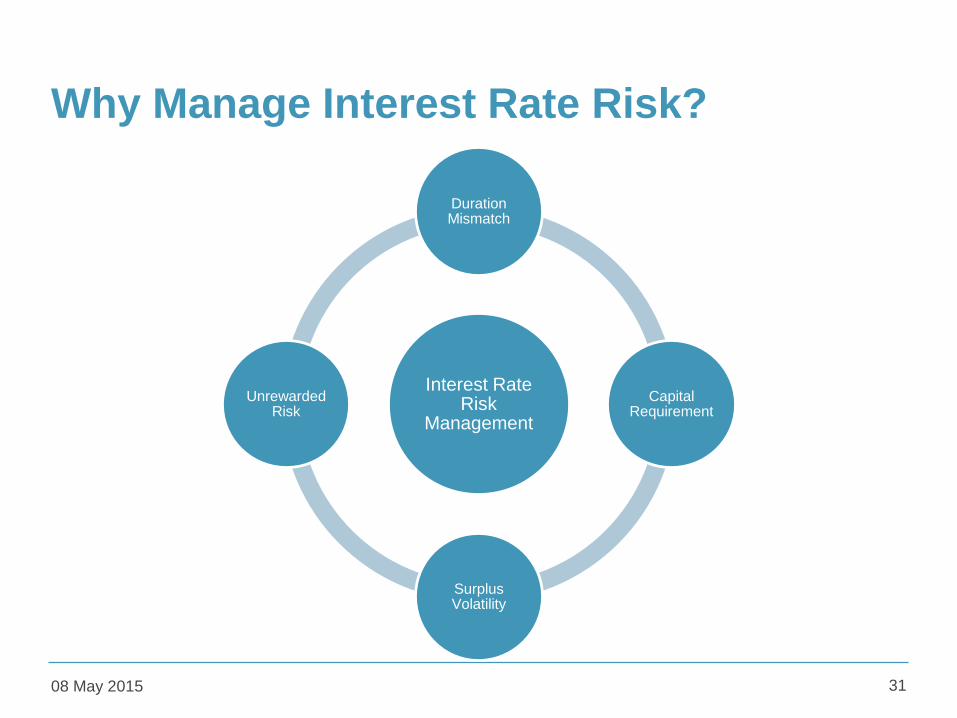
Why Manage Interest Rate Risk?
08 May 2015 31
Interest Rate Risk
Management
Duration Mismatch
Capital Requirement
Surplus Volatility
Unrewarded Risk
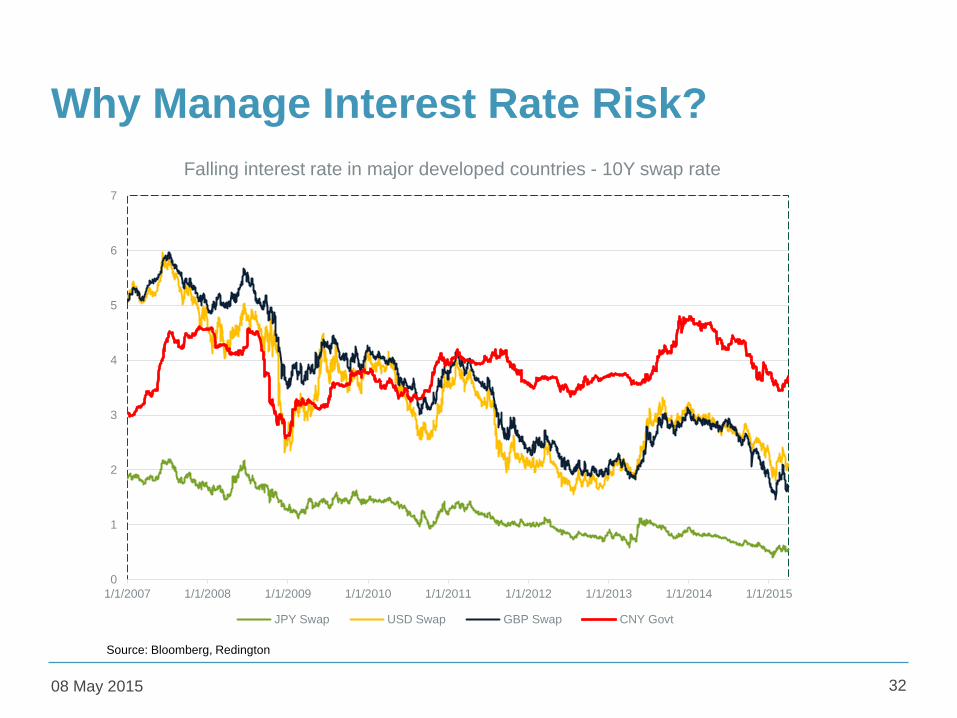
Why Manage Interest Rate Risk?
08 May 2015 32
0
1
2
3
4
5
6
7
1/1/2007 1/1/2008 1/1/2009 1/1/2010 1/1/2011 1/1/2012 1/1/2013 1/1/2014 1/1/2015
Falling interest rate in major developed countries - 10Y swap rate
JPY Swap USD Swap GBP Swap CNY Govt
Source: Bloomberg, Redington
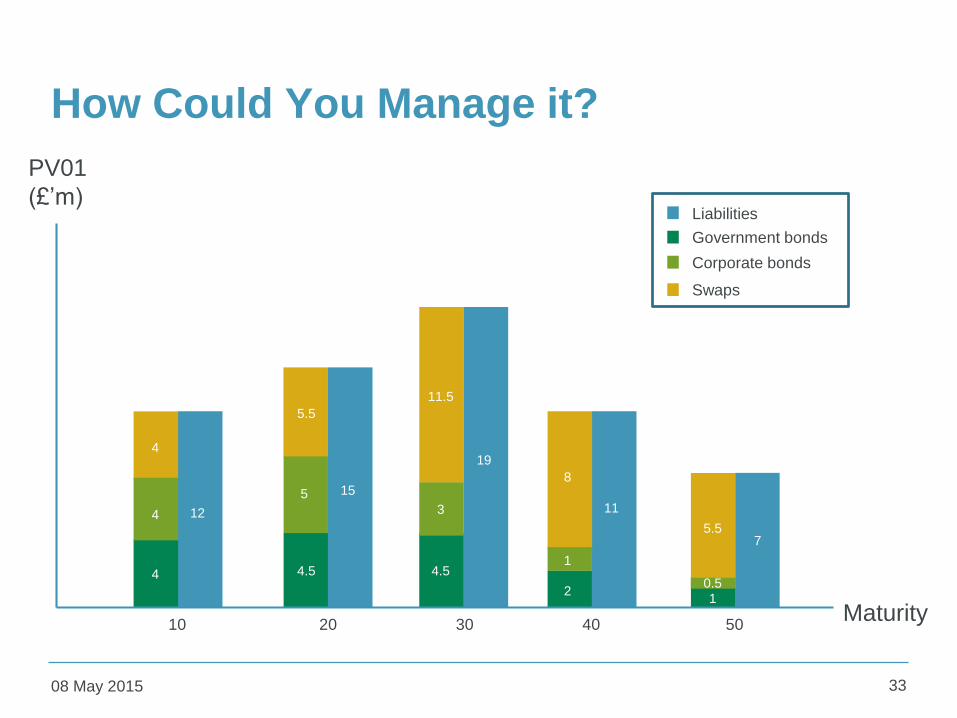
How Could You Manage it?
08 May 2015 33
PV01
(£’m)
Maturity5040302010
Liabilities
Swaps
Government bonds
Corporate bonds
12
4
4
4
15
4.5
5
5.5
4.5
19
3
11.5
8
15
2
11
1
5.5
10.5
7
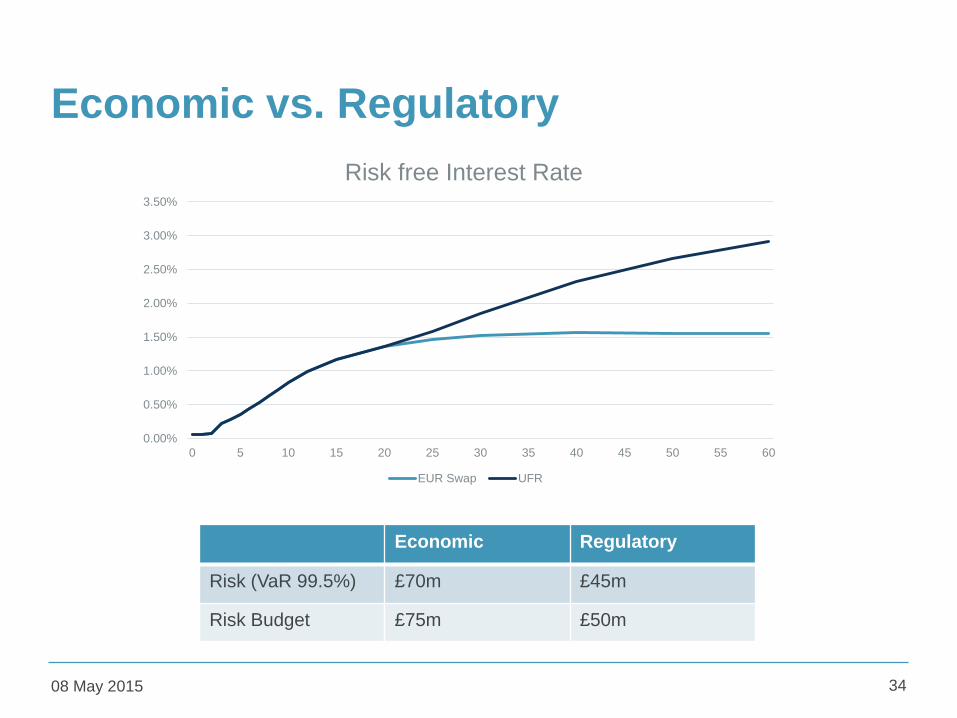
Economic vs. Regulatory
08 May 2015 34
Economic Regulatory
Risk (VaR 99.5%) £70m £45m
Risk Budget £75m £50m
0.00%
0.50%
1.00%
1.50%
2.00%
2.50%
3.00%
3.50%
0 5 10 15 20 25 30 35 40 45 50 55 60
Risk free Interest Rate
EUR Swap UFR
Conclusion: 4 key takeaways
• Strong need of risk/capital management practices
• Investment strategy in the context of ALM
• People, system and process
• Constant learning and dynamically adapt to changes
08 May 2015 35

08 May 2015 36
Expressions of individual views by members of the Institute and
Faculty of Actuaries and its staff are encouraged.
The views expressed in this presentation are those of the
presenter.
Questions Comments