Embed Size (px)
Citation preview

How do Endowments Measure Up Against Cheap Market Portfolios?
Endowment Returns Performance over Time
Author Neal M. Dikeman
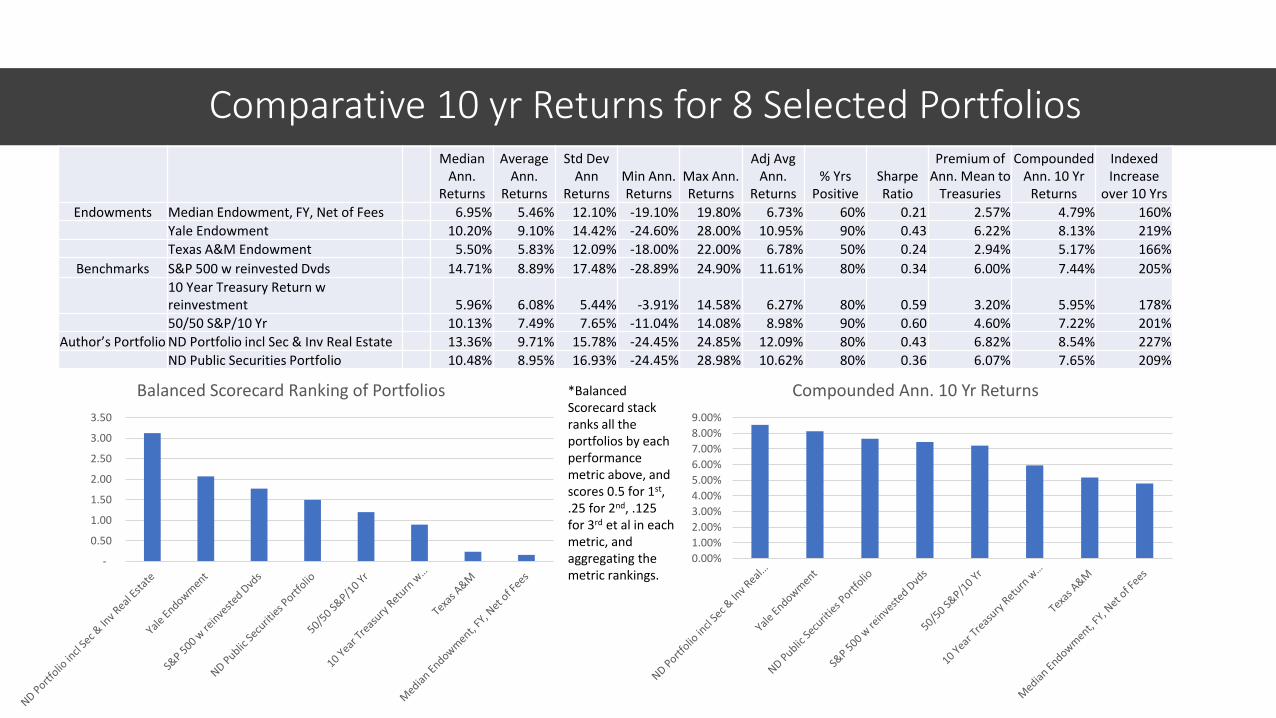
Comparative 10 yr Returns for 8 Selected Portfolios
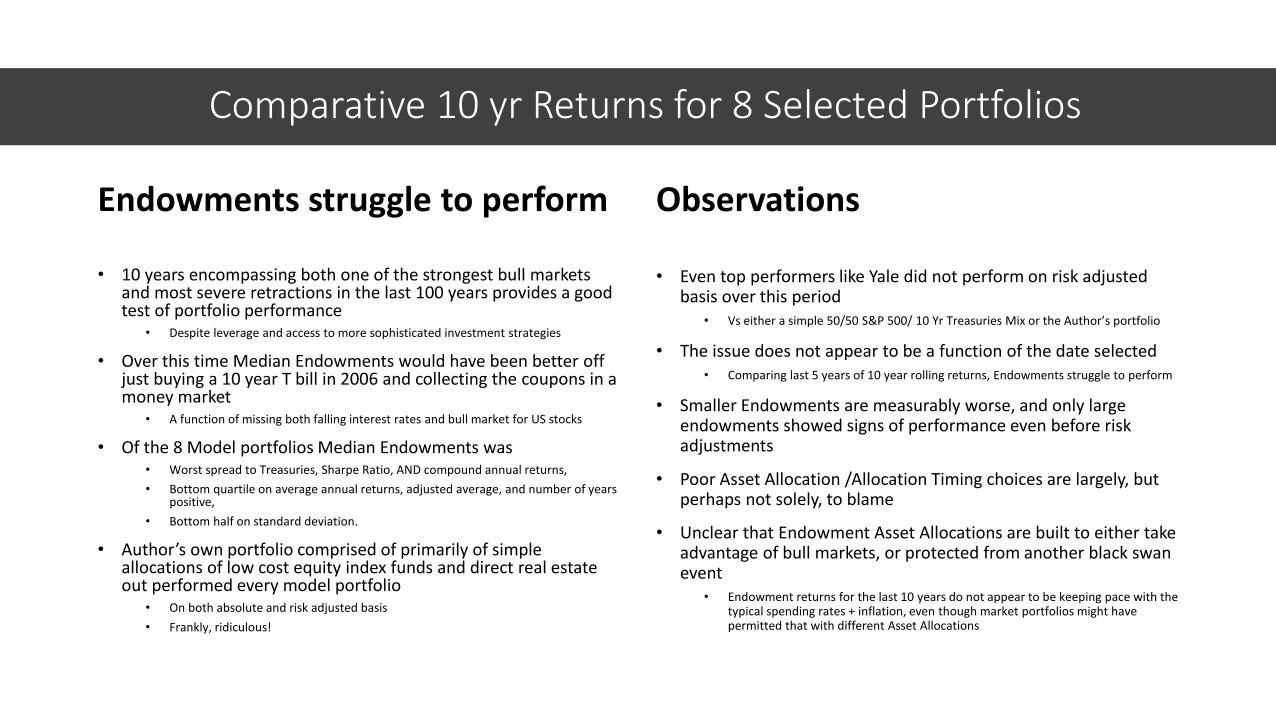
Endowments struggle to perform
• 10 years encompassing both one of the strongest bull markets and most severe retractions in the last 100 years provides a good test of portfolio performance
• Despite leverage and access to more sophisticated investment strategies
• Over this time Median Endowments would have been better off just buying a 10 year T bill in 2006 and collecting the coupons in a money market
• A function of missing both falling interest rates and bull market for US stocks
• Of the 8 Model portfolios Median Endowments was• Worst spread to Treasuries, Sharpe Ratio, AND compound annual returns,
• Bottom quartile on average annual returns, adjusted average, and number of years positive,
• Bottom half on standard deviation.
• Author’s own portfolio comprised of primarily of simple allocations of low cost equity index funds and direct real estate out performed every model portfolio
• On both absolute and risk adjusted basis
• Frankly, ridiculous!
Observations
• Even top performers like Yale did not perform on risk adjusted basis over this period
• Vs either a simple 50/50 S&P 500/ 10 Yr Treasuries Mix or the Author’s portfolio
• The issue does not appear to be a function of the date selected• Comparing last 5 years of 10 year rolling returns, Endowments struggle to perform
• Smaller Endowments are measurably worse, and only large endowments showed signs of performance even before risk adjustments
• Poor Asset Allocation /Allocation Timing choices are largely, but perhaps not solely, to blame
• Unclear that Endowment Asset Allocations are built to either take advantage of bull markets, or protected from another black swan event
• Endowment returns for the last 10 years do not appear to be keeping pace with the typical spending rates + inflation, even though market portfolios might have permitted that with different Asset Allocations
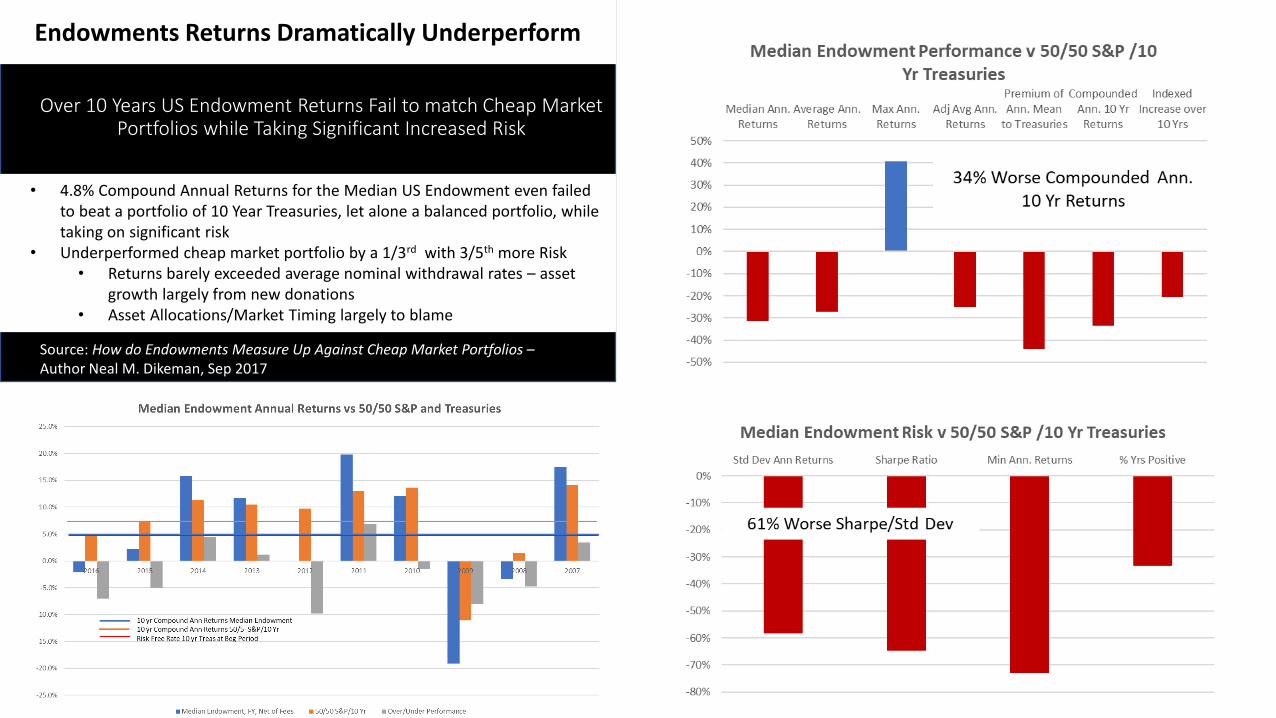
Over 10 Years US Endowment Returns Fail to match Cheap Market Portfolios while Taking Significant Increased Risk
• 4.8% Compound Annual Returns for the Median US Endowment even failed to beat a portfolio of 10 Year Treasuries, let alone a balanced portfolio, while taking on significant risk
• Underperformed cheap market portfolio by a 1/3rd with 3/5th more Risk• Returns barely exceeded average nominal withdrawal rates – asset
growth largely from new donations• Asset Allocations/Market Timing largely to blame
Endowments Returns Dramatically Underperform
Source: How do Endowments Measure Up Against Cheap Market Portfolios –Author Neal M. Dikeman, Sep 2017
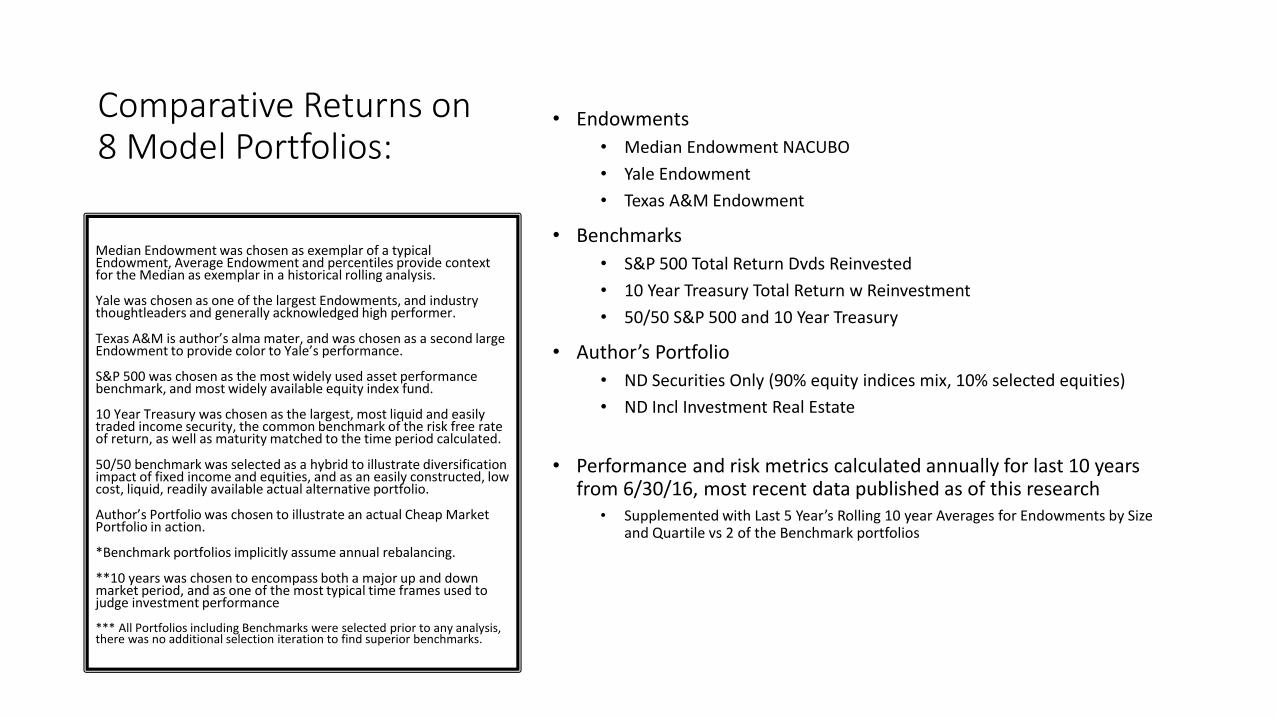
Comparative Returns on8 Model Portfolios:
• Endowments
• Median Endowment NACUBO
• Yale Endowment
• Texas A&M Endowment
• Benchmarks
• S&P 500 Total Return Dvds Reinvested
• 10 Year Treasury Total Return w Reinvestment
• 50/50 S&P 500 and 10 Year Treasury
• Author’s Portfolio
• ND Securities Only (90% equity indices mix, 10% selected equities)
• ND Incl Investment Real Estate
• Performance and risk metrics calculated annually for last 10 years from 6/30/16, most recent data published as of this research
• Supplemented with Last 5 Year’s Rolling 10 year Averages for Endowments by Size and Quartile vs 2 of the Benchmark portfolios
Median Endowment was chosen as exemplar of a typical Endowment, Average Endowment and percentiles provide context for the Median as exemplar in a historical rolling analysis.
Yale was chosen as one of the largest Endowments, and industry thoughtleaders and generally acknowledged high performer.
Texas A&M is author’s alma mater, and was chosen as a second large Endowment to provide color to Yale’s performance.
S&P 500 was chosen as the most widely used asset performance benchmark, and most widely available equity index fund.
10 Year Treasury was chosen as the largest, most liquid and easily traded income security, the common benchmark of the risk free rate of return, as well as maturity matched to the time period calculated.
50/50 benchmark was selected as a hybrid to illustrate diversification impact of fixed income and equities, and as an easily constructed, low cost, liquid, readily available actual alternative portfolio.
Author’s Portfolio was chosen to illustrate an actual Cheap Market Portfolio in action.
*Benchmark portfolios implicitly assume annual rebalancing.
**10 years was chosen to encompass both a major up and down market period, and as one of the most typical time frames used to judge investment performance
*** All Portfolios including Benchmarks were selected prior to any analysis, there was no additional selection iteration to find superior benchmarks.
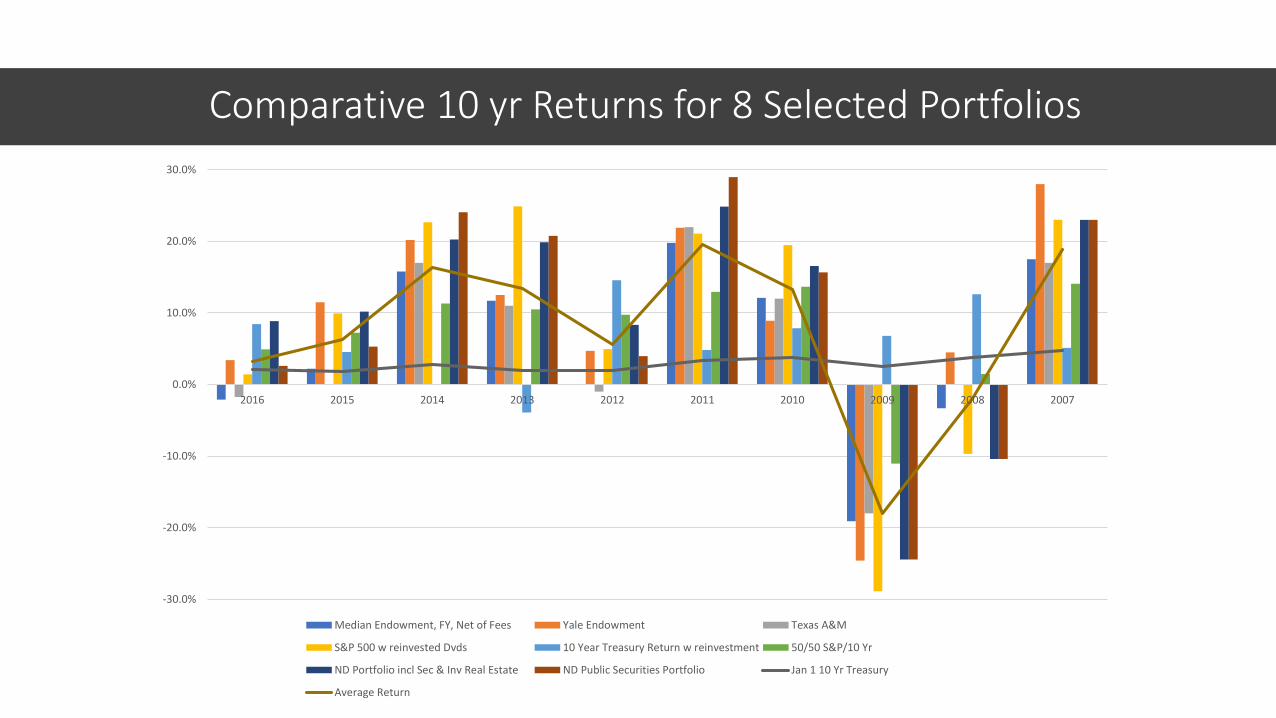
Comparative 10 yr Returns for 8 Selected Portfolios
-30.0%
-20.0%
-10.0%
0.0%
10.0%
20.0%
30.0%
2016 2015 2014 2013 2012 2011 2010 2009 2008 2007
Median Endowment, FY, Net of Fees Yale Endowment Texas A&M
S&P 500 w reinvested Dvds 10 Year Treasury Return w reinvestment 50/50 S&P/10 Yr
ND Portfolio incl Sec & Inv Real Estate ND Public Securities Portfolio Jan 1 10 Yr Treasury
Average Return
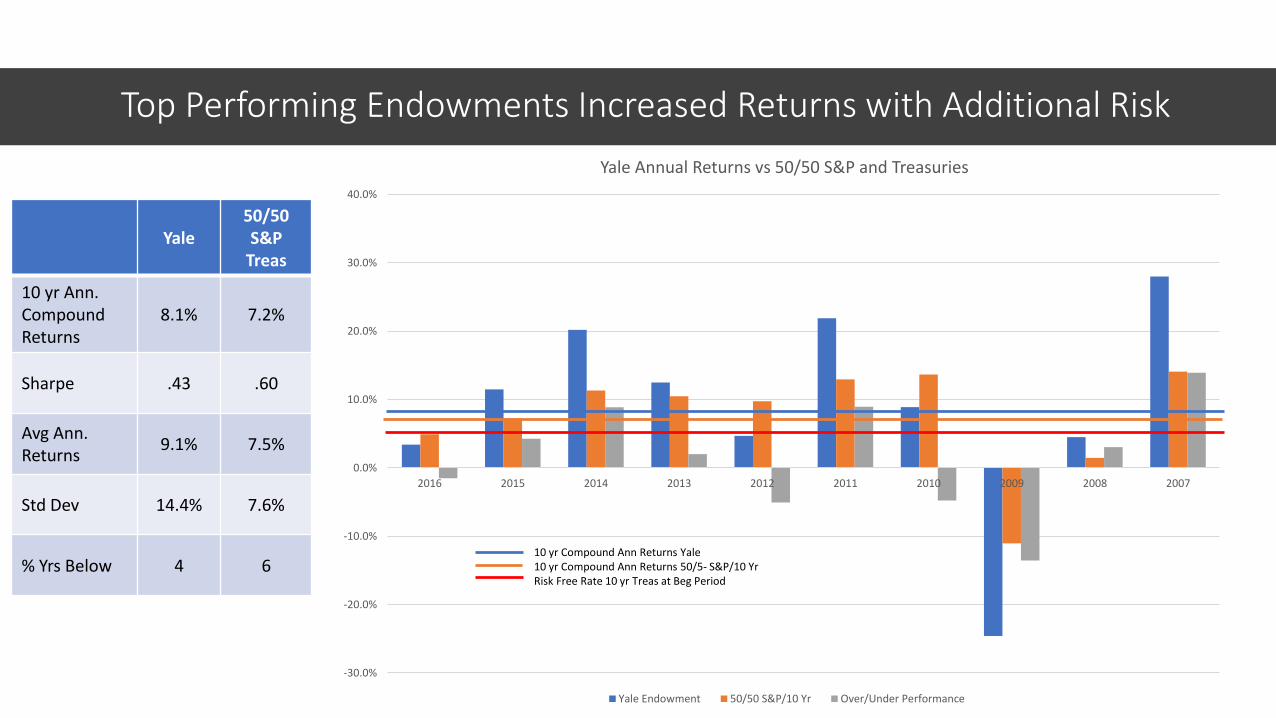
Top Performing Endowments Increased Returns with Additional Risk
-30.0%
-20.0%
-10.0%
0.0%
10.0%
20.0%
30.0%
40.0%
2016 2015 2014 2013 2012 2011 2010 2009 2008 2007
Yale Annual Returns vs 50/50 S&P and Treasuries
Yale Endowment 50/50 S&P/10 Yr Over/Under Performance
Yale50/50 S&P
Treas
10 yr Ann. Compound Returns
8.1% 7.2%
Sharpe .43 .60
Avg Ann. Returns
9.1% 7.5%
Std Dev 14.4% 7.6%
% Yrs Below 4 610 yr Compound Ann Returns Yale10 yr Compound Ann Returns 50/5- S&P/10 YrRisk Free Rate 10 yr Treas at Beg Period
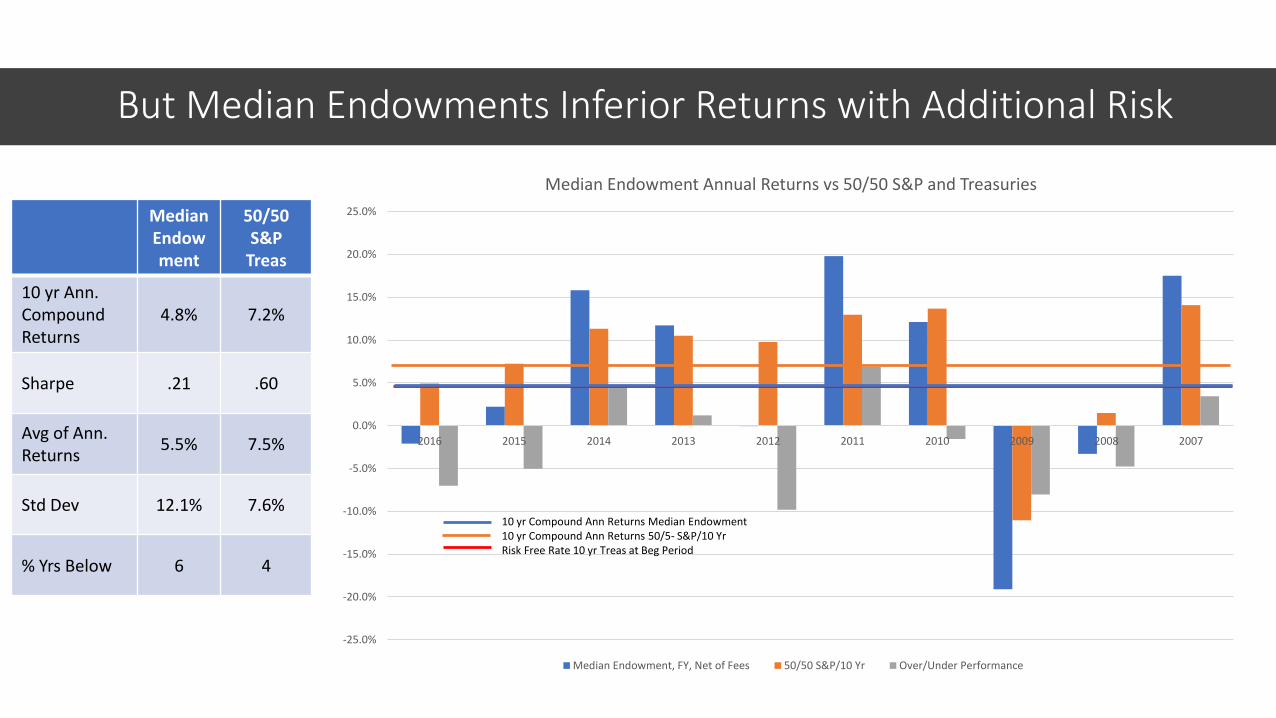
But Median Endowments Inferior Returns with Additional Risk
Median Endowment
50/50 S&P
Treas
10 yr Ann. Compound Returns
4.8% 7.2%
Sharpe .21 .60
Avg of Ann. Returns
5.5% 7.5%
Std Dev 12.1% 7.6%
% Yrs Below 6 4
-25.0%
-20.0%
-15.0%
-10.0%
-5.0%
0.0%
5.0%
10.0%
15.0%
20.0%
25.0%
2016 2015 2014 2013 2012 2011 2010 2009 2008 2007
Median Endowment Annual Returns vs 50/50 S&P and Treasuries
Median Endowment, FY, Net of Fees 50/50 S&P/10 Yr Over/Under Performance
10 yr Compound Ann Returns Median Endowment10 yr Compound Ann Returns 50/5- S&P/10 YrRisk Free Rate 10 yr Treas at Beg Period
-25.0%
-20.0%
-15.0%
-10.0%
-5.0%
0.0%
5.0%
10.0%
15.0%
20.0%
25.0%
2016 2015 2014 2013 2012 2011 2010 2009 2008 2007
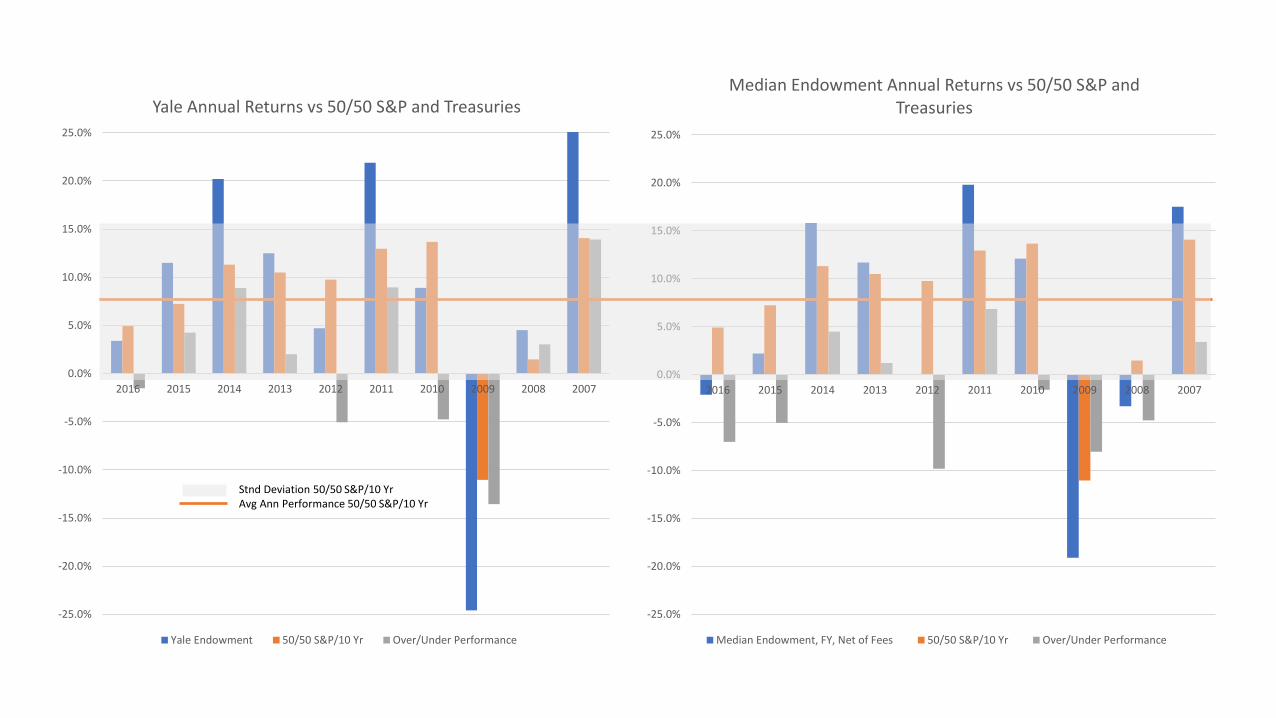
Median Endowment Annual Returns vs 50/50 S&P and Treasuries
Median Endowment, FY, Net of Fees 50/50 S&P/10 Yr Over/Under Performance
-25.0%
-20.0%
-15.0%
-10.0%
-5.0%
0.0%
5.0%
10.0%
15.0%
20.0%
25.0%
2016 2015 2014 2013 2012 2011 2010 2009 2008 2007
Yale Annual Returns vs 50/50 S&P and Treasuries
Yale Endowment 50/50 S&P/10 Yr Over/Under Performance
Stnd Deviation 50/50 S&P/10 YrAvg Ann Performance 50/50 S&P/10 Yr
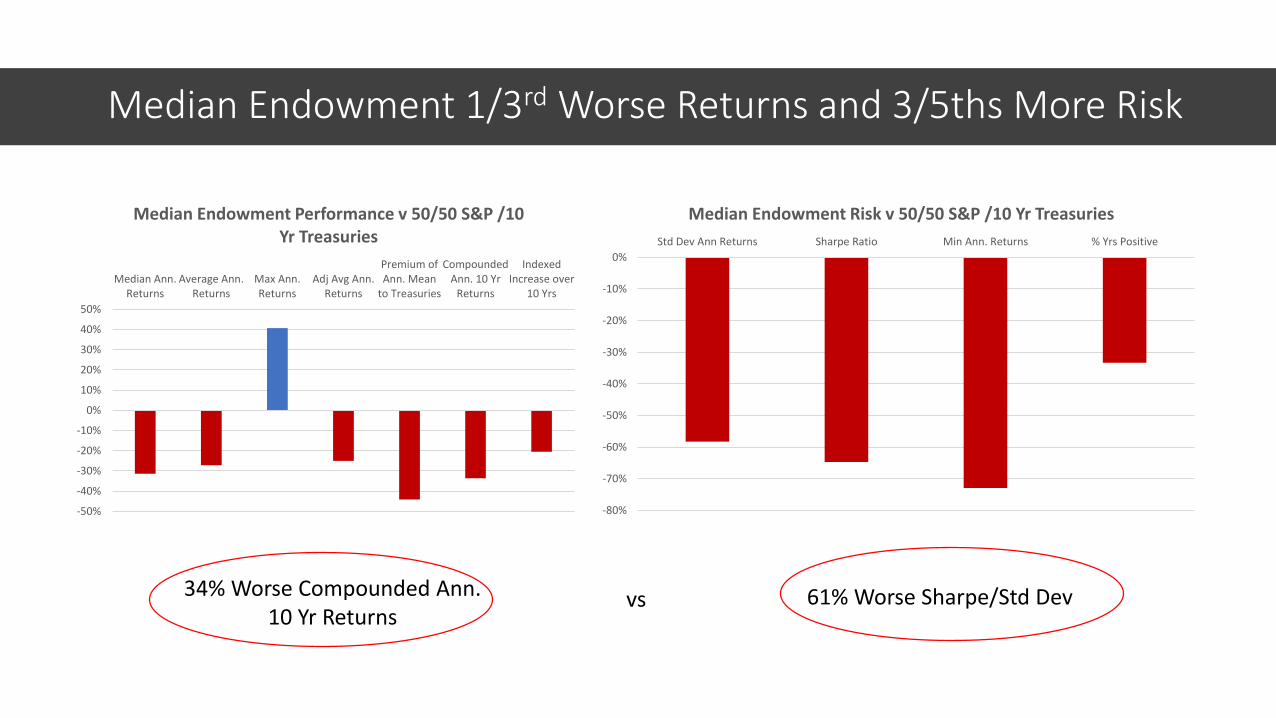
Median Endowment 1/3rd Worse Returns and 3/5ths More Risk
-50%
-40%
-30%
-20%
-10%
0%
10%
20%
30%
40%
50%
Median Ann.Returns
Average Ann.Returns
Max Ann.Returns
Adj Avg Ann.Returns
Premium ofAnn. Mean
to Treasuries
CompoundedAnn. 10 Yr
Returns
IndexedIncrease over
10 Yrs
Median Endowment Performance v 50/50 S&P /10 Yr Treasuries
-80%
-70%
-60%
-50%
-40%
-30%
-20%
-10%
0%
Std Dev Ann Returns Sharpe Ratio Min Ann. Returns % Yrs Positive
Median Endowment Risk v 50/50 S&P /10 Yr Treasuries
34% Worse Compounded Ann. 10 Yr Returns
61% Worse Sharpe/Std Devvs

Yale Endowment 4.6x Increase in Risk to Increase in Reward
13% Better Compounded Ann. 10 Yr Returns
58% Worse Sharpe/Std Devvs
0%
20%
40%
60%
80%
100%
120%
Median Ann.Returns
Average Ann.Returns
Max Ann.Returns
Adj Avg Ann.Returns
Premium ofAnn. Mean to
Treasuries
CompoundedAnn. 10 Yr
Returns
IndexedIncrease over
10 Yrs
Yale Endowment Performance v 50/50 S&P /10 Yr Treasuries
-140%
-120%
-100%
-80%
-60%
-40%
-20%
0%
Std Dev Ann Returns Sharpe Ratio Min Ann. Returns % Yrs Positive
Yale Endowment Risk v 50/50 S&P /10 Yr Treasuries
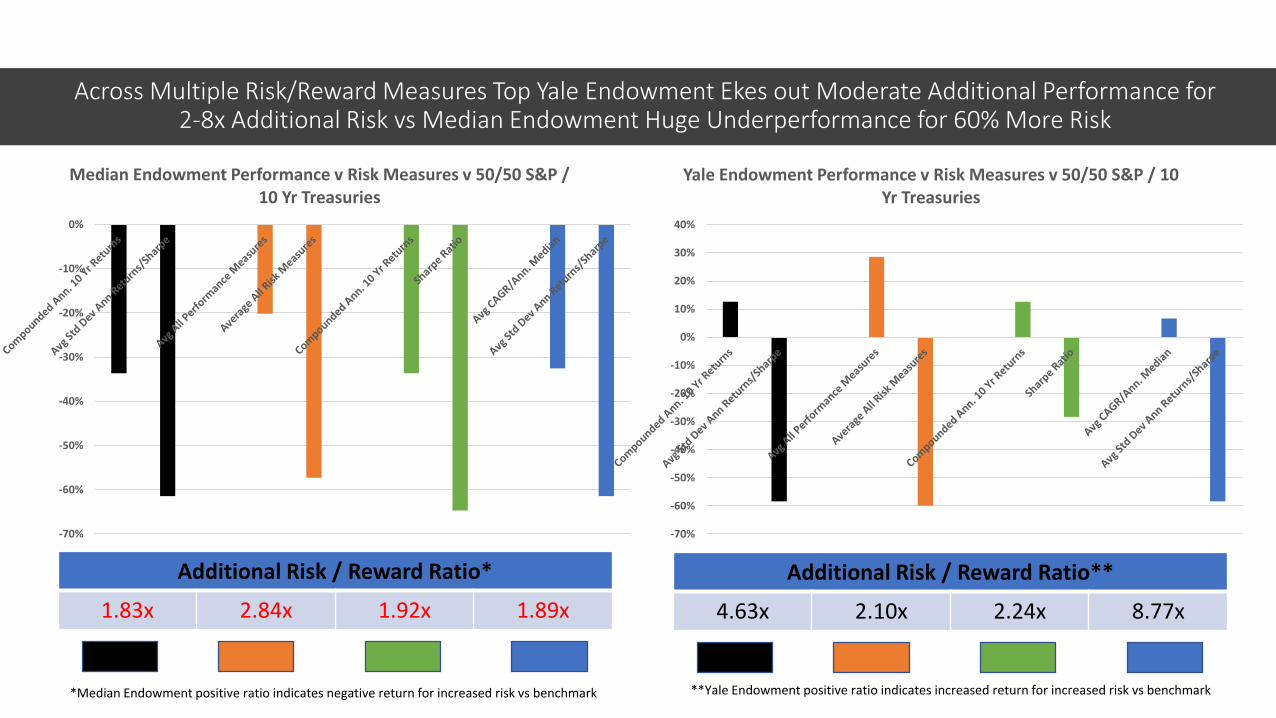
Across Multiple Risk/Reward Measures Top Yale Endowment Ekes out Moderate Additional Performance for 2-8x Additional Risk vs Median Endowment Huge Underperformance for 60% More Risk
-70%
-60%
-50%
-40%
-30%
-20%
-10%
0%
Median Endowment Performance v Risk Measures v 50/50 S&P / 10 Yr Treasuries
-70%
-60%
-50%
-40%
-30%
-20%
-10%
0%
10%
20%
30%
40%
Yale Endowment Performance v Risk Measures v 50/50 S&P / 10 Yr Treasuries
Additional Risk / Reward Ratio*
1.83x 2.84x 1.92x 1.89x
Additional Risk / Reward Ratio**
4.63x 2.10x 2.24x 8.77x
*Median Endowment positive ratio indicates negative return for increased risk vs benchmark **Yale Endowment positive ratio indicates increased return for increased risk vs benchmark
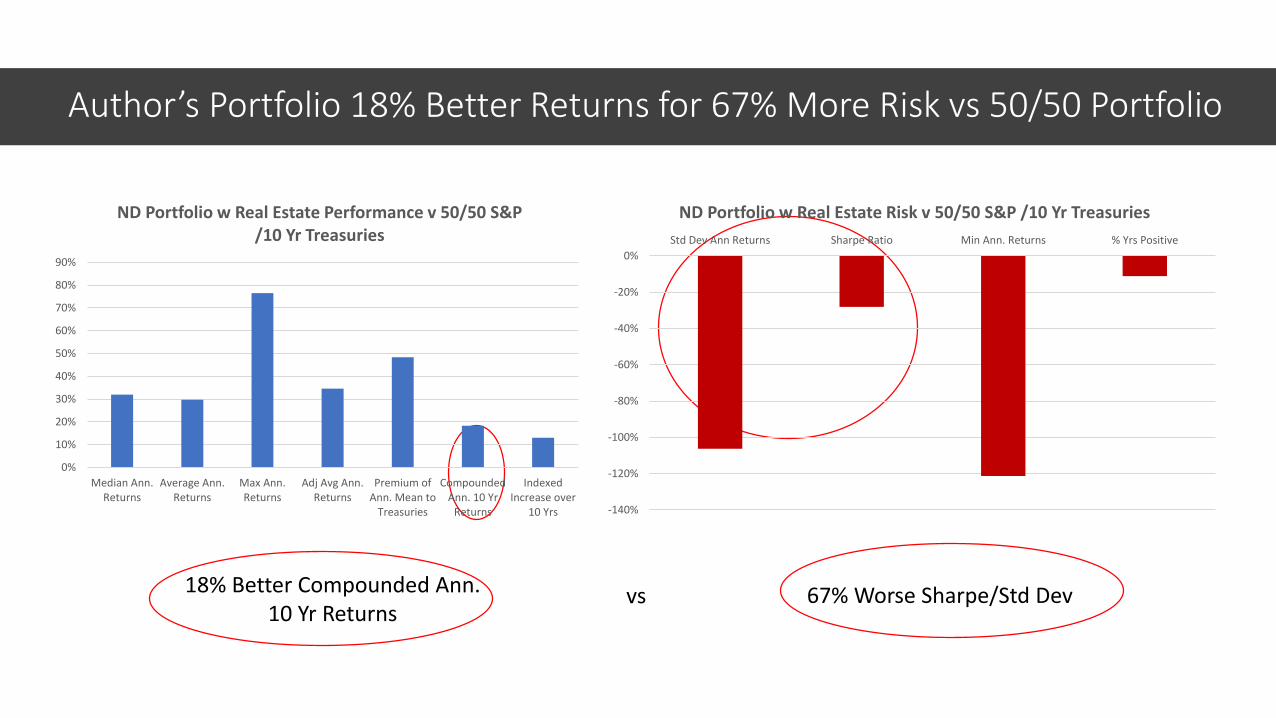
Author’s Portfolio 18% Better Returns for 67% More Risk vs 50/50 Portfolio
18% Better Compounded Ann. 10 Yr Returns
67% Worse Sharpe/Std Devvs
0%
10%
20%
30%
40%
50%
60%
70%
80%
90%
Median Ann.Returns
Average Ann.Returns
Max Ann.Returns
Adj Avg Ann.Returns
Premium ofAnn. Mean to
Treasuries
CompoundedAnn. 10 Yr
Returns
IndexedIncrease over
10 Yrs
ND Portfolio w Real Estate Performance v 50/50 S&P /10 Yr Treasuries
-140%
-120%
-100%
-80%
-60%
-40%
-20%
0%
Std Dev Ann Returns Sharpe Ratio Min Ann. Returns % Yrs Positive
ND Portfolio w Real Estate Risk v 50/50 S&P /10 Yr Treasuries
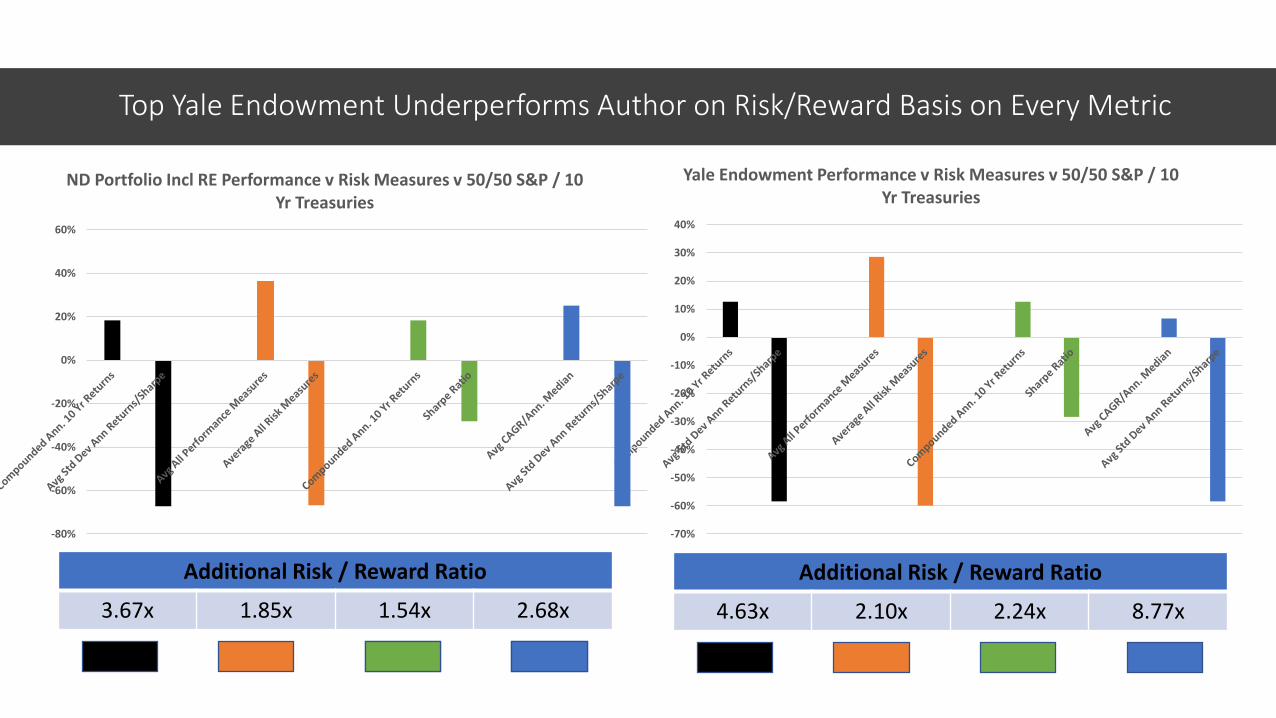
Top Yale Endowment Underperforms Author on Risk/Reward Basis on Every Metric
-70%
-60%
-50%
-40%
-30%
-20%
-10%
0%
10%
20%
30%
40%
Yale Endowment Performance v Risk Measures v 50/50 S&P / 10 Yr Treasuries
Additional Risk / Reward Ratio
3.67x 1.85x 1.54x 2.68x
Additional Risk / Reward Ratio
4.63x 2.10x 2.24x 8.77x
-80%
-60%
-40%
-20%
0%
20%
40%
60%
ND Portfolio Incl RE Performance v Risk Measures v 50/50 S&P / 10 Yr Treasuries
Additional Risk / Reward Ratio
3.67x 1.85x 1.54x 2.68x
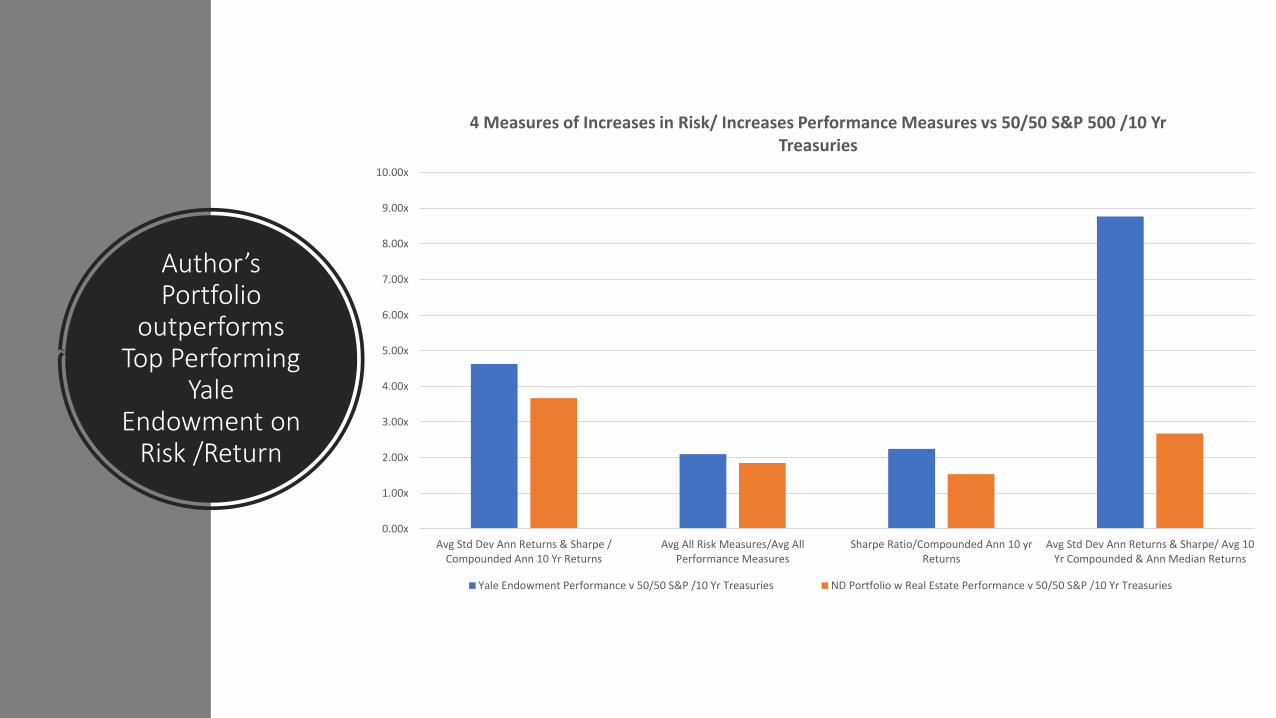
Author’s Portfolio
outperforms Top Performing
Yale Endowment on
Risk /Return
0.00x
1.00x
2.00x
3.00x
4.00x
5.00x
6.00x
7.00x
8.00x
9.00x
10.00x
Avg Std Dev Ann Returns & Sharpe /Compounded Ann 10 Yr Returns
Avg All Risk Measures/Avg AllPerformance Measures
Sharpe Ratio/Compounded Ann 10 yrReturns
Avg Std Dev Ann Returns & Sharpe/ Avg 10Yr Compounded & Ann Median Returns
4 Measures of Increases in Risk/ Increases Performance Measures vs 50/50 S&P 500 /10 Yr Treasuries
Yale Endowment Performance v 50/50 S&P /10 Yr Treasuries ND Portfolio w Real Estate Performance v 50/50 S&P /10 Yr Treasuries
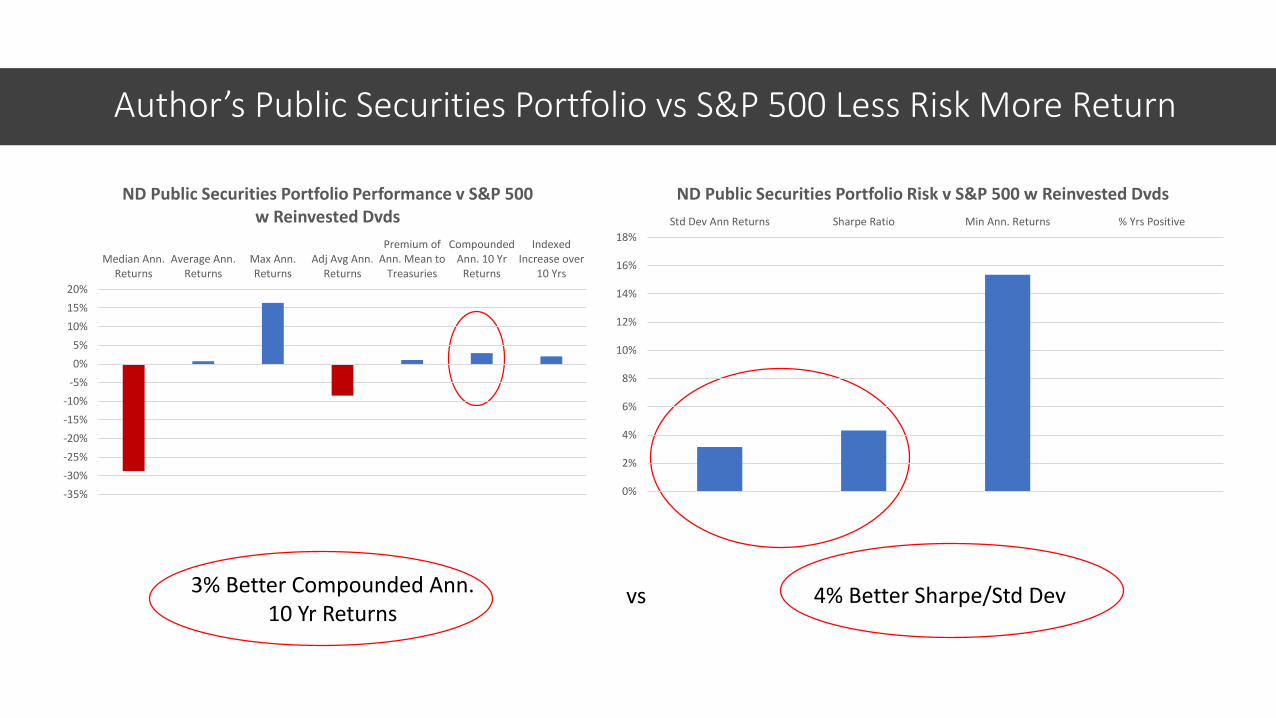
Author’s Public Securities Portfolio vs S&P 500 Less Risk More Return
3% Better Compounded Ann. 10 Yr Returns
4% Better Sharpe/Std Devvs
-35%
-30%
-25%
-20%
-15%
-10%
-5%
0%
5%
10%
15%
20%
Median Ann.Returns
Average Ann.Returns
Max Ann.Returns
Adj Avg Ann.Returns
Premium ofAnn. Mean to
Treasuries
CompoundedAnn. 10 Yr
Returns
IndexedIncrease over
10 Yrs
ND Public Securities Portfolio Performance v S&P 500 w Reinvested Dvds
0%
2%
4%
6%
8%
10%
12%
14%
16%
18%
Std Dev Ann Returns Sharpe Ratio Min Ann. Returns % Yrs Positive
ND Public Securities Portfolio Risk v S&P 500 w Reinvested Dvds
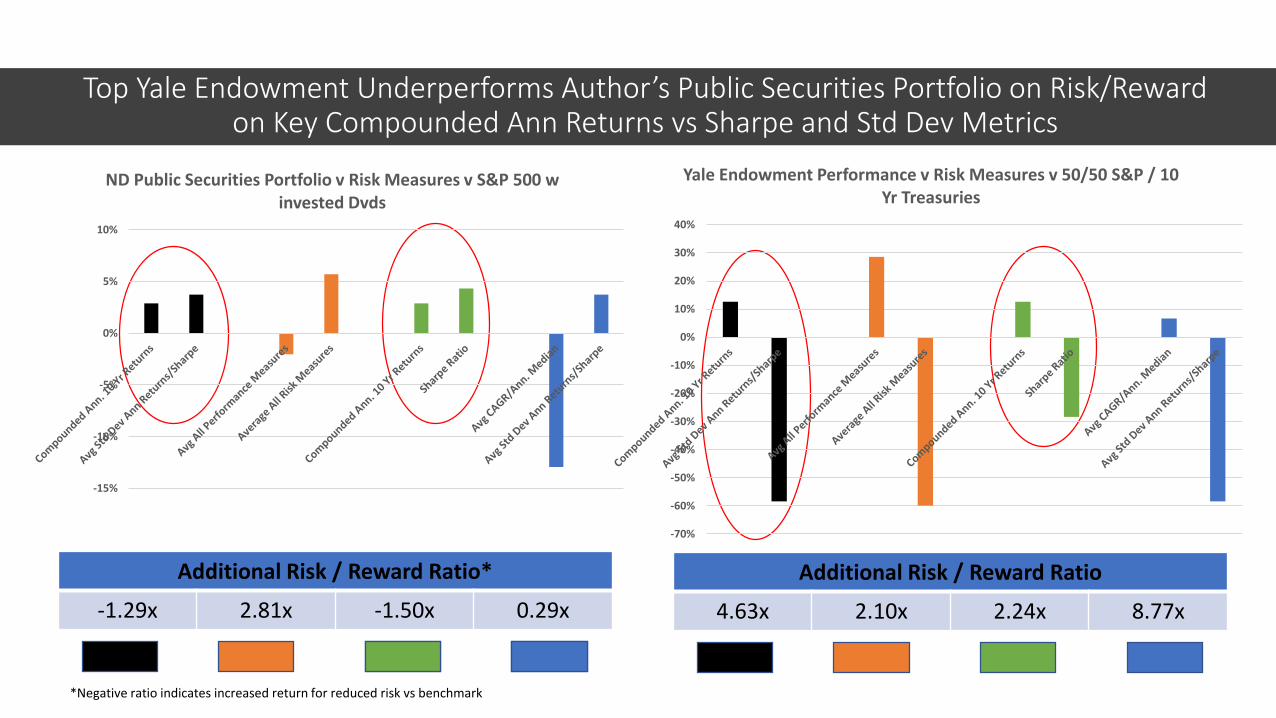
Top Yale Endowment Underperforms Author’s Public Securities Portfolio on Risk/Reward on Key Compounded Ann Returns vs Sharpe and Std Dev Metrics
-70%
-60%
-50%
-40%
-30%
-20%
-10%
0%
10%
20%
30%
40%
Yale Endowment Performance v Risk Measures v 50/50 S&P / 10 Yr Treasuries
Additional Risk / Reward Ratio
3.67x 1.85x 1.54x 2.68x
Additional Risk / Reward Ratio
4.63x 2.10x 2.24x 8.77x
Additional Risk / Reward Ratio*
-1.29x 2.81x -1.50x 0.29x
-15%
-10%
-5%
0%
5%
10%
ND Public Securities Portfolio v Risk Measures v S&P 500 w invested Dvds
*Negative ratio indicates increased return for reduced risk vs benchmark
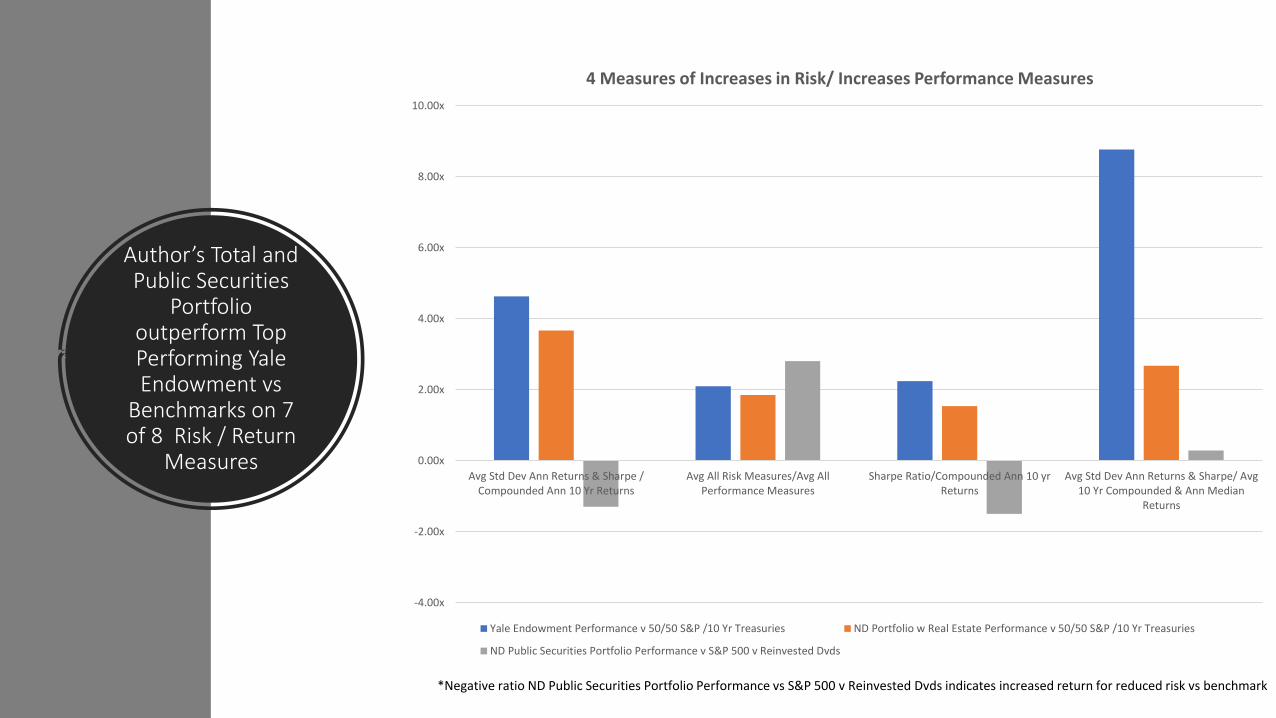
Author’s Total and Public Securities
Portfolio outperform Top Performing Yale Endowment vs
Benchmarks on 7 of 8 Risk / Return
Measures
-4.00x
-2.00x
0.00x
2.00x
4.00x
6.00x
8.00x
10.00x
Avg Std Dev Ann Returns & Sharpe /Compounded Ann 10 Yr Returns
Avg All Risk Measures/Avg AllPerformance Measures
Sharpe Ratio/Compounded Ann 10 yrReturns
Avg Std Dev Ann Returns & Sharpe/ Avg10 Yr Compounded & Ann Median
Returns
4 Measures of Increases in Risk/ Increases Performance Measures
Yale Endowment Performance v 50/50 S&P /10 Yr Treasuries ND Portfolio w Real Estate Performance v 50/50 S&P /10 Yr Treasuries
ND Public Securities Portfolio Performance v S&P 500 v Reinvested Dvds
*Negative ratio ND Public Securities Portfolio Performance vs S&P 500 v Reinvested Dvds indicates increased return for reduced risk vs benchmark
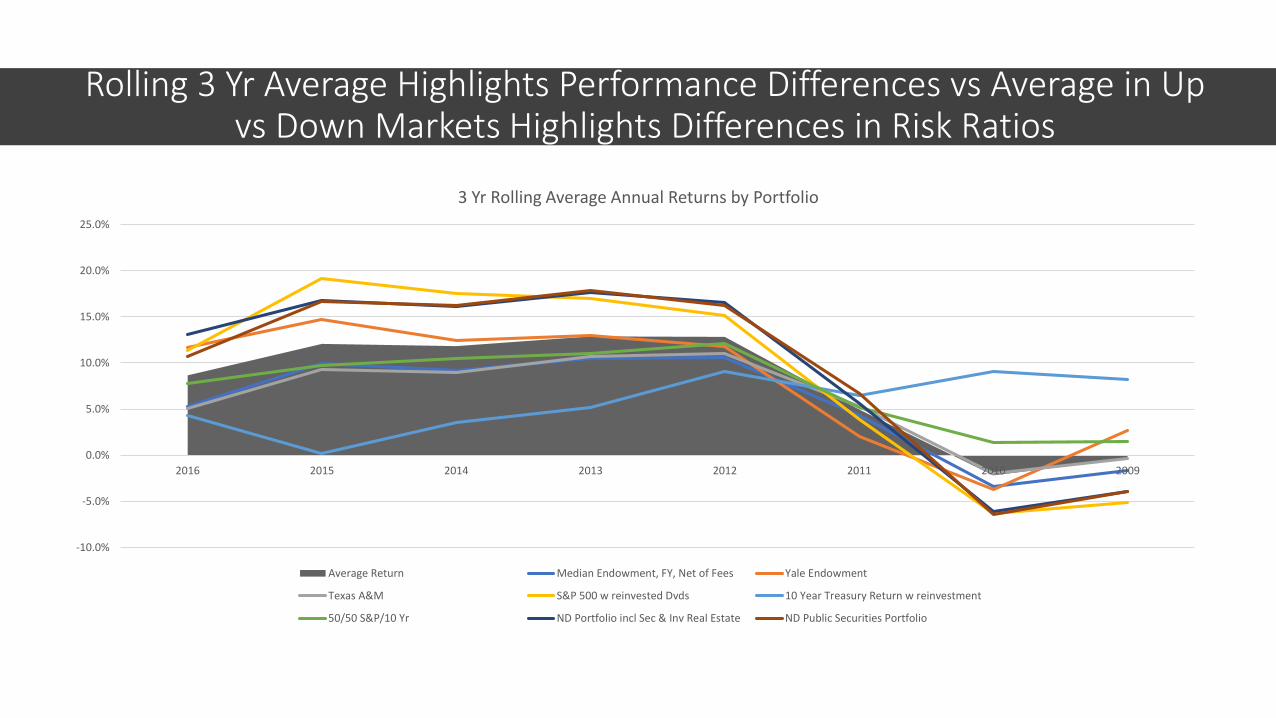
Rolling 3 Yr Average Highlights Performance Differences vs Average in Up vs Down Markets Highlights Differences in Risk Ratios
-10.0%
-5.0%
0.0%
5.0%
10.0%
15.0%
20.0%
25.0%
2016 2015 2014 2013 2012 2011 2010 2009
3 Yr Rolling Average Annual Returns by Portfolio
Average Return Median Endowment, FY, Net of Fees Yale Endowment
Texas A&M S&P 500 w reinvested Dvds 10 Year Treasury Return w reinvestment
50/50 S&P/10 Yr ND Portfolio incl Sec & Inv Real Estate ND Public Securities Portfolio
Comparative 10 yr Returns for 8 Selected PortfoliosMedian
Ann. Returns
Average Ann.
Returns
Std Dev Ann
ReturnsMin Ann. Returns
Max Ann. Returns
Adj Avg Ann.
Returns% Yrs
PositiveSharpe Ratio
Premium of Ann. Mean to
Treasuries
Compounded Ann. 10 Yr
Returns
Indexed Increase
over 10 Yrs
Endowments Median Endowment, FY, Net of Fees 6.95% 5.46% 12.10% -19.10% 19.80% 6.73% 60% 0.21 2.57% 4.79% 160%
Yale Endowment 10.20% 9.10% 14.42% -24.60% 28.00% 10.95% 90% 0.43 6.22% 8.13% 219%
Texas A&M Endowment 5.50% 5.83% 12.09% -18.00% 22.00% 6.78% 50% 0.24 2.94% 5.17% 166%
Benchmarks S&P 500 w reinvested Dvds 14.71% 8.89% 17.48% -28.89% 24.90% 11.61% 80% 0.34 6.00% 7.44% 205%
10 Year Treasury Return w reinvestment 5.96% 6.08% 5.44% -3.91% 14.58% 6.27% 80% 0.59 3.20% 5.95% 178%
50/50 S&P/10 Yr 10.13% 7.49% 7.65% -11.04% 14.08% 8.98% 90% 0.60 4.60% 7.22% 201%
Author’s Portfolio ND Portfolio incl Sec & Inv Real Estate 13.36% 9.71% 15.78% -24.45% 24.85% 12.09% 80% 0.43 6.82% 8.54% 227%
ND Public Securities Portfolio 10.48% 8.95% 16.93% -24.45% 28.98% 10.62% 80% 0.36 6.07% 7.65% 209%
-
0.50
1.00
1.50
2.00
2.50
3.00
3.50
Balanced Scorecard Ranking of Portfolios
0.00%
1.00%
2.00%
3.00%
4.00%
5.00%
6.00%
7.00%
8.00%
9.00%
Compounded Ann. 10 Yr Returns*Balanced Scorecard stack ranks all the portfolios by each performance metric above, and scores 0.5 for 1st, .25 for 2nd, .125 for 3rd et al in each metric, and aggregating the metric rankings.
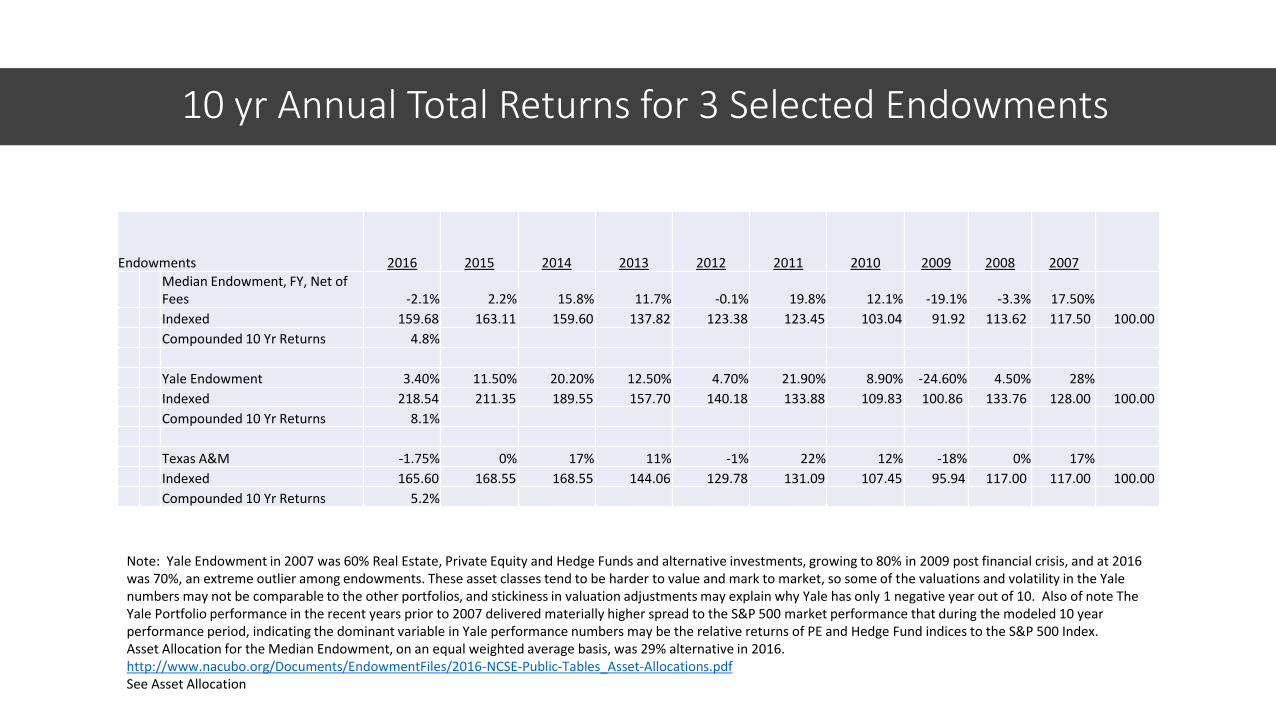
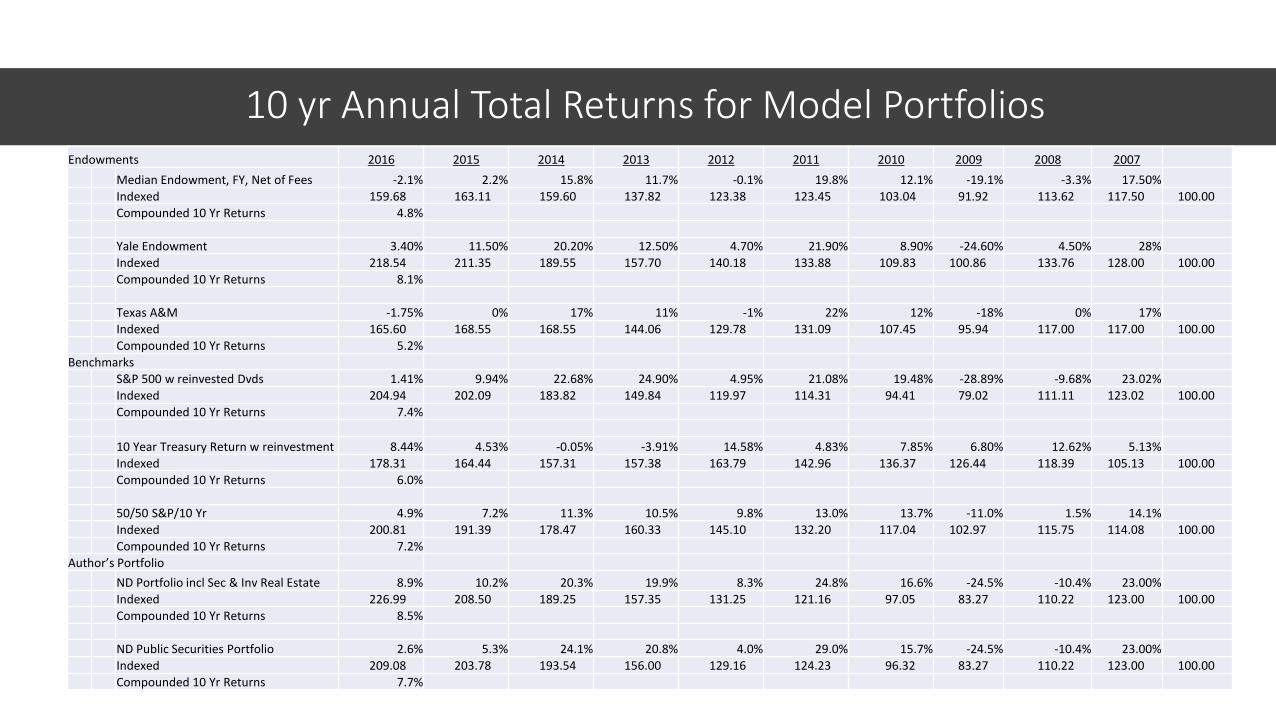
10 yr Annual Total Returns for 3 Selected Endowments
Endowments 2016 2015 2014 2013 2012 2011 2010 2009 2008 2007
Median Endowment, FY, Net of Fees -2.1% 2.2% 15.8% 11.7% -0.1% 19.8% 12.1% -19.1% -3.3% 17.50%
Indexed 159.68 163.11 159.60 137.82 123.38 123.45 103.04 91.92 113.62 117.50 100.00
Compounded 10 Yr Returns 4.8%
Yale Endowment 3.40% 11.50% 20.20% 12.50% 4.70% 21.90% 8.90% -24.60% 4.50% 28%
Indexed 218.54 211.35 189.55 157.70 140.18 133.88 109.83 100.86 133.76 128.00 100.00
Compounded 10 Yr Returns 8.1%
Texas A&M -1.75% 0% 17% 11% -1% 22% 12% -18% 0% 17%
Indexed 165.60 168.55 168.55 144.06 129.78 131.09 107.45 95.94 117.00 117.00 100.00
Compounded 10 Yr Returns 5.2%
Note: Yale Endowment in 2007 was 60% Real Estate, Private Equity and Hedge Funds and alternative investments, growing to 80% in 2009 post financial crisis, and at 2016 was 70%, an extreme outlier among endowments. These asset classes tend to be harder to value and mark to market, so some of the valuations and volatility in the Yale numbers may not be comparable to the other portfolios, and stickiness in valuation adjustments may explain why Yale has only 1 negative year out of 10. Also of note The Yale Portfolio performance in the recent years prior to 2007 delivered materially higher spread to the S&P 500 market performance that during the modeled 10 year performance period, indicating the dominant variable in Yale performance numbers may be the relative returns of PE and Hedge Fund indices to the S&P 500 Index.Asset Allocation for the Median Endowment, on an equal weighted average basis, was 29% alternative in 2016.http://www.nacubo.org/Documents/EndowmentFiles/2016-NCSE-Public-Tables_Asset-Allocations.pdfSee Asset Allocation
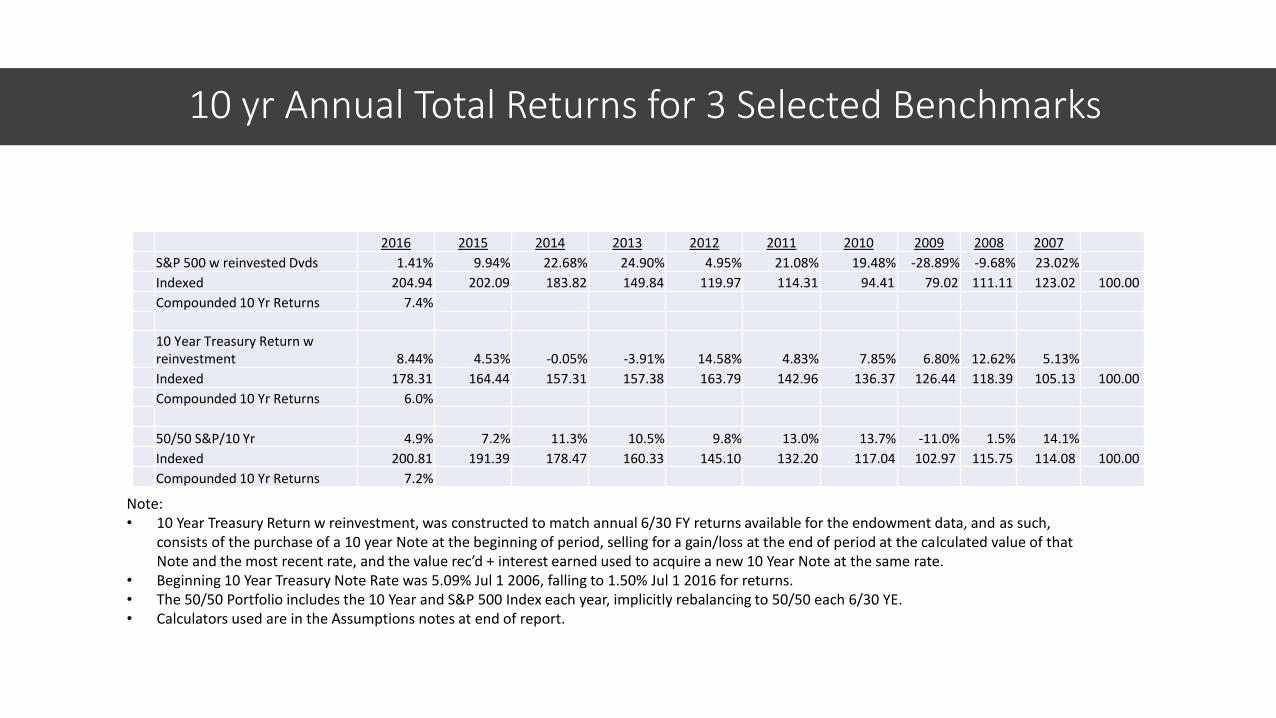
10 yr Annual Total Returns for 3 Selected Benchmarks
2016 2015 2014 2013 2012 2011 2010 2009 2008 2007
S&P 500 w reinvested Dvds 1.41% 9.94% 22.68% 24.90% 4.95% 21.08% 19.48% -28.89% -9.68% 23.02%
Indexed 204.94 202.09 183.82 149.84 119.97 114.31 94.41 79.02 111.11 123.02 100.00
Compounded 10 Yr Returns 7.4%
10 Year Treasury Return w reinvestment 8.44% 4.53% -0.05% -3.91% 14.58% 4.83% 7.85% 6.80% 12.62% 5.13%
Indexed 178.31 164.44 157.31 157.38 163.79 142.96 136.37 126.44 118.39 105.13 100.00
Compounded 10 Yr Returns 6.0%
50/50 S&P/10 Yr 4.9% 7.2% 11.3% 10.5% 9.8% 13.0% 13.7% -11.0% 1.5% 14.1%
Indexed 200.81 191.39 178.47 160.33 145.10 132.20 117.04 102.97 115.75 114.08 100.00
Compounded 10 Yr Returns 7.2%
Note:• 10 Year Treasury Return w reinvestment, was constructed to match annual 6/30 FY returns available for the endowment data, and as such,
consists of the purchase of a 10 year Note at the beginning of period, selling for a gain/loss at the end of period at the calculated value of that Note and the most recent rate, and the value rec’d + interest earned used to acquire a new 10 Year Note at the same rate.
• Beginning 10 Year Treasury Note Rate was 5.09% Jul 1 2006, falling to 1.50% Jul 1 2016 for returns. • The 50/50 Portfolio includes the 10 Year and S&P 500 Index each year, implicitly rebalancing to 50/50 each 6/30 YE.• Calculators used are in the Assumptions notes at end of report.
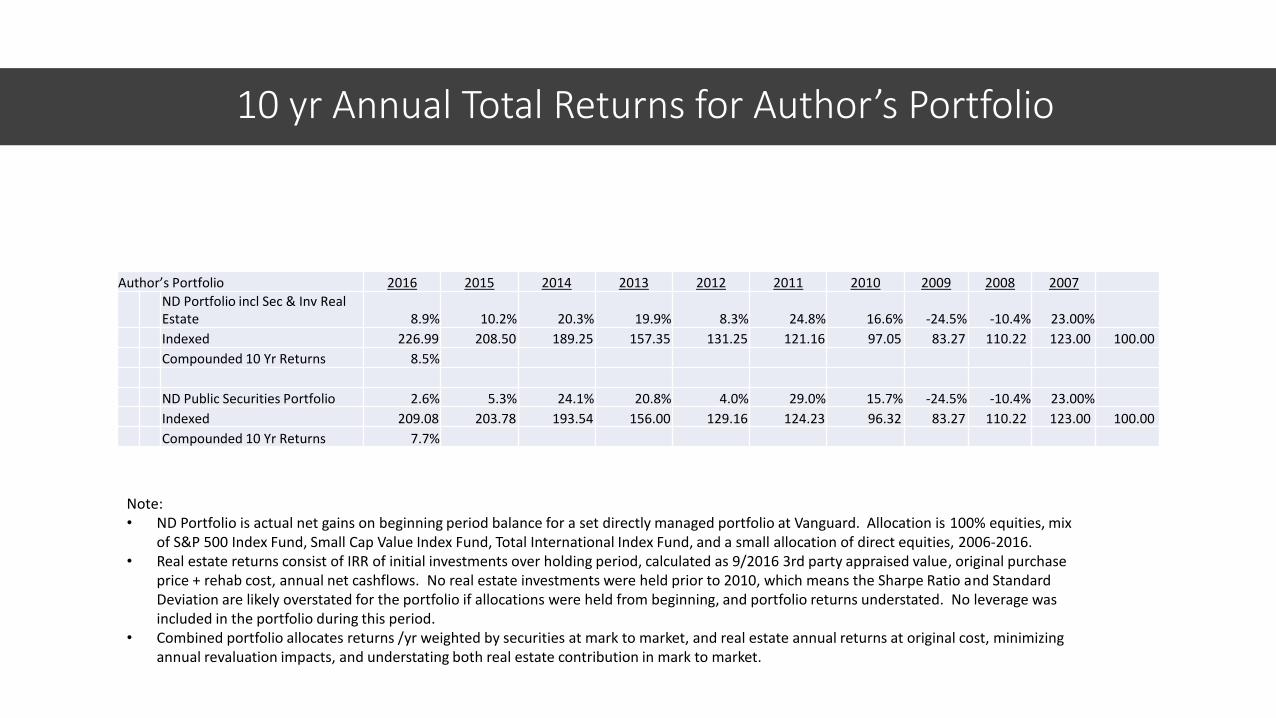
10 yr Annual Total Returns for Author’s Portfolio
Author’s Portfolio 2016 2015 2014 2013 2012 2011 2010 2009 2008 2007
ND Portfolio incl Sec & Inv Real Estate 8.9% 10.2% 20.3% 19.9% 8.3% 24.8% 16.6% -24.5% -10.4% 23.00%
Indexed 226.99 208.50 189.25 157.35 131.25 121.16 97.05 83.27 110.22 123.00 100.00
Compounded 10 Yr Returns 8.5%
ND Public Securities Portfolio 2.6% 5.3% 24.1% 20.8% 4.0% 29.0% 15.7% -24.5% -10.4% 23.00%
Indexed 209.08 203.78 193.54 156.00 129.16 124.23 96.32 83.27 110.22 123.00 100.00
Compounded 10 Yr Returns 7.7%
Note:• ND Portfolio is actual net gains on beginning period balance for a set directly managed portfolio at Vanguard. Allocation is 100% equities, mix
of S&P 500 Index Fund, Small Cap Value Index Fund, Total International Index Fund, and a small allocation of direct equities, 2006-2016. • Real estate returns consist of IRR of initial investments over holding period, calculated as 9/2016 3rd party appraised value, original purchase
price + rehab cost, annual net cashflows. No real estate investments were held prior to 2010, which means the Sharpe Ratio and Standard Deviation are likely overstated for the portfolio if allocations were held from beginning, and portfolio returns understated. No leverage was included in the portfolio during this period.
• Combined portfolio allocates returns /yr weighted by securities at mark to market, and real estate annual returns at original cost, minimizing annual revaluation impacts, and understating both real estate contribution in mark to market.
10 yr Annual Total Returns for Model PortfoliosEndowments 2016 2015 2014 2013 2012 2011 2010 2009 2008 2007
Median Endowment, FY, Net of Fees -2.1% 2.2% 15.8% 11.7% -0.1% 19.8% 12.1% -19.1% -3.3% 17.50%
Indexed 159.68 163.11 159.60 137.82 123.38 123.45 103.04 91.92 113.62 117.50 100.00
Compounded 10 Yr Returns 4.8%
Yale Endowment 3.40% 11.50% 20.20% 12.50% 4.70% 21.90% 8.90% -24.60% 4.50% 28%
Indexed 218.54 211.35 189.55 157.70 140.18 133.88 109.83 100.86 133.76 128.00 100.00
Compounded 10 Yr Returns 8.1%
Texas A&M -1.75% 0% 17% 11% -1% 22% 12% -18% 0% 17%
Indexed 165.60 168.55 168.55 144.06 129.78 131.09 107.45 95.94 117.00 117.00 100.00 Compounded 10 Yr Returns 5.2%
Benchmarks
S&P 500 w reinvested Dvds 1.41% 9.94% 22.68% 24.90% 4.95% 21.08% 19.48% -28.89% -9.68% 23.02%
Indexed 204.94 202.09 183.82 149.84 119.97 114.31 94.41 79.02 111.11 123.02 100.00
Compounded 10 Yr Returns 7.4%
10 Year Treasury Return w reinvestment 8.44% 4.53% -0.05% -3.91% 14.58% 4.83% 7.85% 6.80% 12.62% 5.13%
Indexed 178.31 164.44 157.31 157.38 163.79 142.96 136.37 126.44 118.39 105.13 100.00
Compounded 10 Yr Returns 6.0%
50/50 S&P/10 Yr 4.9% 7.2% 11.3% 10.5% 9.8% 13.0% 13.7% -11.0% 1.5% 14.1%
Indexed 200.81 191.39 178.47 160.33 145.10 132.20 117.04 102.97 115.75 114.08 100.00
Compounded 10 Yr Returns 7.2%
Author’s Portfolio
ND Portfolio incl Sec & Inv Real Estate 8.9% 10.2% 20.3% 19.9% 8.3% 24.8% 16.6% -24.5% -10.4% 23.00%
Indexed 226.99 208.50 189.25 157.35 131.25 121.16 97.05 83.27 110.22 123.00 100.00
Compounded 10 Yr Returns 8.5%
ND Public Securities Portfolio 2.6% 5.3% 24.1% 20.8% 4.0% 29.0% 15.7% -24.5% -10.4% 23.00%
Indexed 209.08 203.78 193.54 156.00 129.16 124.23 96.32 83.27 110.22 123.00 100.00
Compounded 10 Yr Returns 7.7%
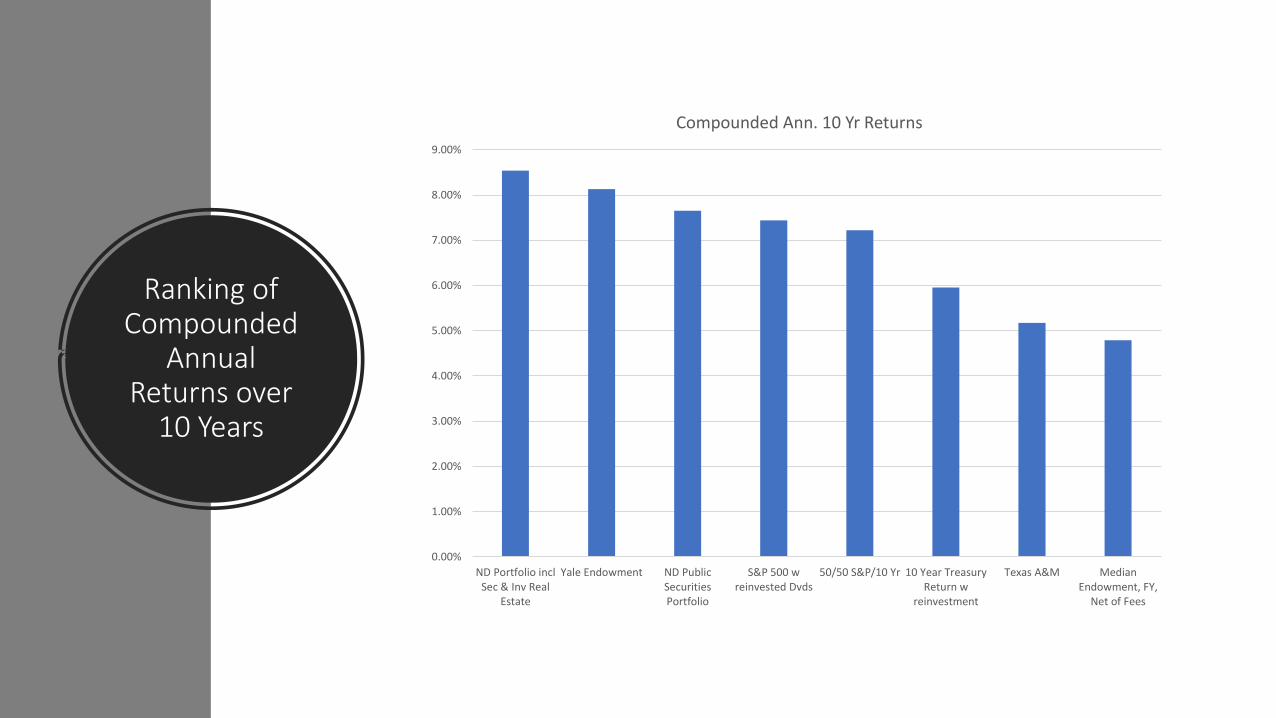
Ranking of Compounded
Annual Returns over
10 Years
0.00%
1.00%
2.00%
3.00%
4.00%
5.00%
6.00%
7.00%
8.00%
9.00%
ND Portfolio inclSec & Inv Real
Estate
Yale Endowment ND PublicSecuritiesPortfolio
S&P 500 wreinvested Dvds
50/50 S&P/10 Yr 10 Year TreasuryReturn w
reinvestment
Texas A&M MedianEndowment, FY,
Net of Fees
Compounded Ann. 10 Yr Returns
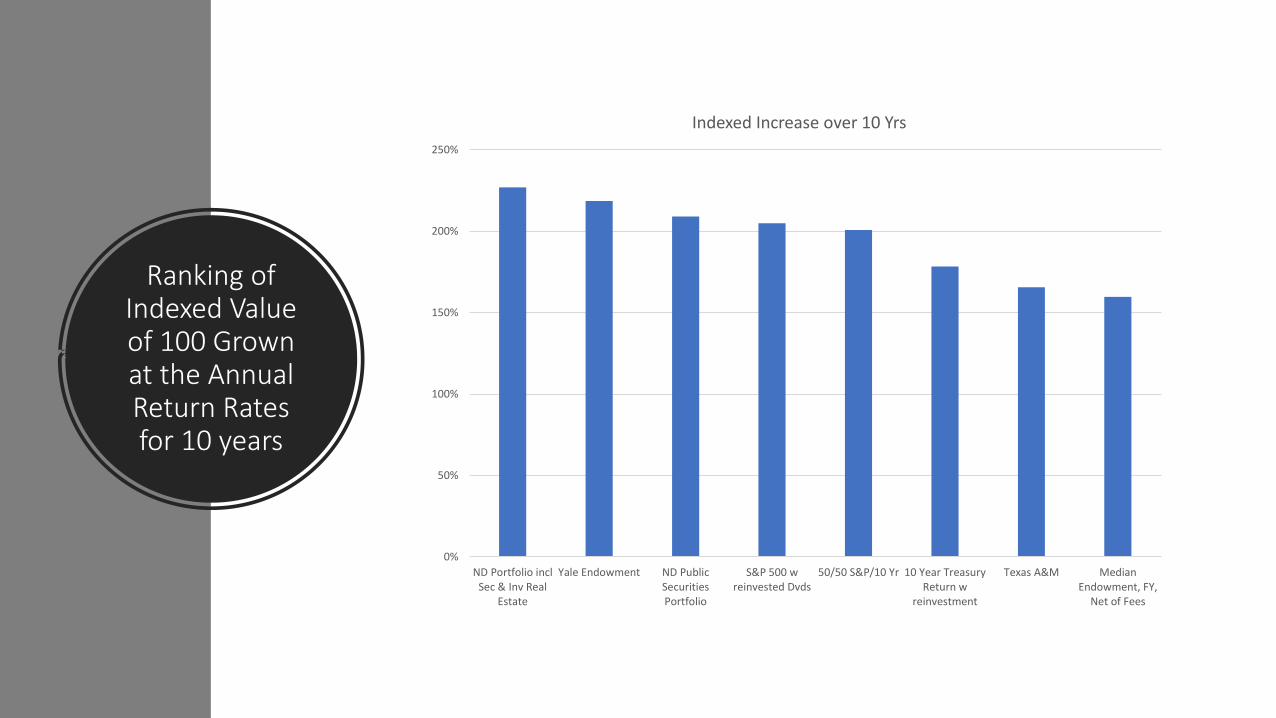
Ranking of Indexed Value of 100 Grown at the Annual Return Rates for 10 years
0%
50%
100%
150%
200%
250%
ND Portfolio inclSec & Inv Real
Estate
Yale Endowment ND PublicSecuritiesPortfolio
S&P 500 wreinvested Dvds
50/50 S&P/10 Yr 10 Year TreasuryReturn w
reinvestment
Texas A&M MedianEndowment, FY,
Net of Fees
Indexed Increase over 10 Yrs
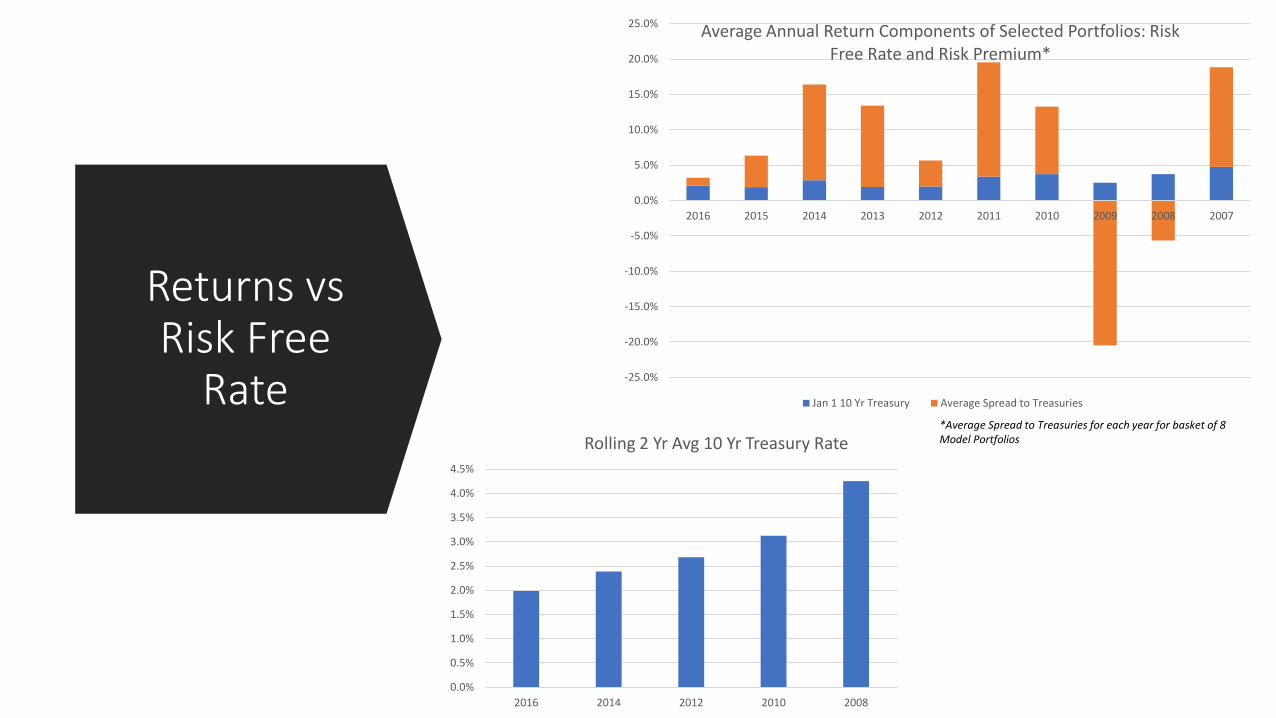
Returns vs Risk Free
Rate -25.0%
-20.0%
-15.0%
-10.0%
-5.0%
0.0%
5.0%
10.0%
15.0%
20.0%
25.0%
2016 2015 2014 2013 2012 2011 2010 2009 2008 2007
Average Annual Return Components of Selected Portfolios: Risk Free Rate and Risk Premium*
Jan 1 10 Yr Treasury Average Spread to Treasuries
0.0%
0.5%
1.0%
1.5%
2.0%
2.5%
3.0%
3.5%
4.0%
4.5%
2016 2014 2012 2010 2008
Rolling 2 Yr Avg 10 Yr Treasury Rate*Average Spread to Treasuries for each year for basket of 8 Model Portfolios
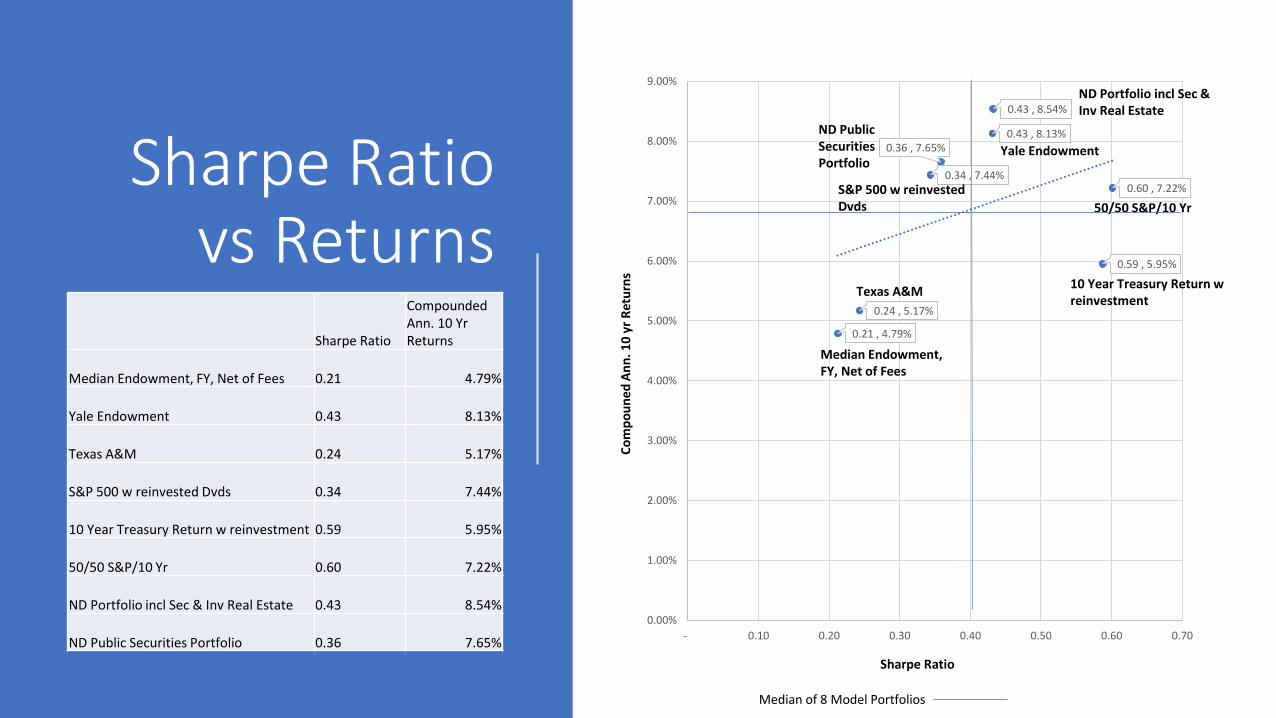
Sharpe Ratio vs Returns
0.21 , 4.79%
0.43 , 8.13%
0.24 , 5.17%
0.34 , 7.44%
0.59 , 5.95%
0.60 , 7.22%
0.43 , 8.54%
0.36 , 7.65%
0.00%
1.00%
2.00%
3.00%
4.00%
5.00%
6.00%
7.00%
8.00%
9.00%
- 0.10 0.20 0.30 0.40 0.50 0.60 0.70
Sharpe Ratio
Compounded Ann. 10 Yr Returns
Median Endowment, FY, Net of Fees 0.21 4.79%
Yale Endowment 0.43 8.13%
Texas A&M 0.24 5.17%
S&P 500 w reinvested Dvds 0.34 7.44%
10 Year Treasury Return w reinvestment 0.59 5.95%
50/50 S&P/10 Yr 0.60 7.22%
ND Portfolio incl Sec & Inv Real Estate 0.43 8.54%
ND Public Securities Portfolio 0.36 7.65%
Texas A&M
Median Endowment, FY, Net of Fees
Yale Endowment
S&P 500 w reinvested Dvds
10 Year Treasury Return w reinvestment
50/50 S&P/10 Yr
ND Portfolio incl Sec & Inv Real Estate
ND Public Securities Portfolio
Co
mp
ou
ned
An
n. 1
0 y
rR
etu
rns
Sharpe Ratio
Median of 8 Model Portfolios
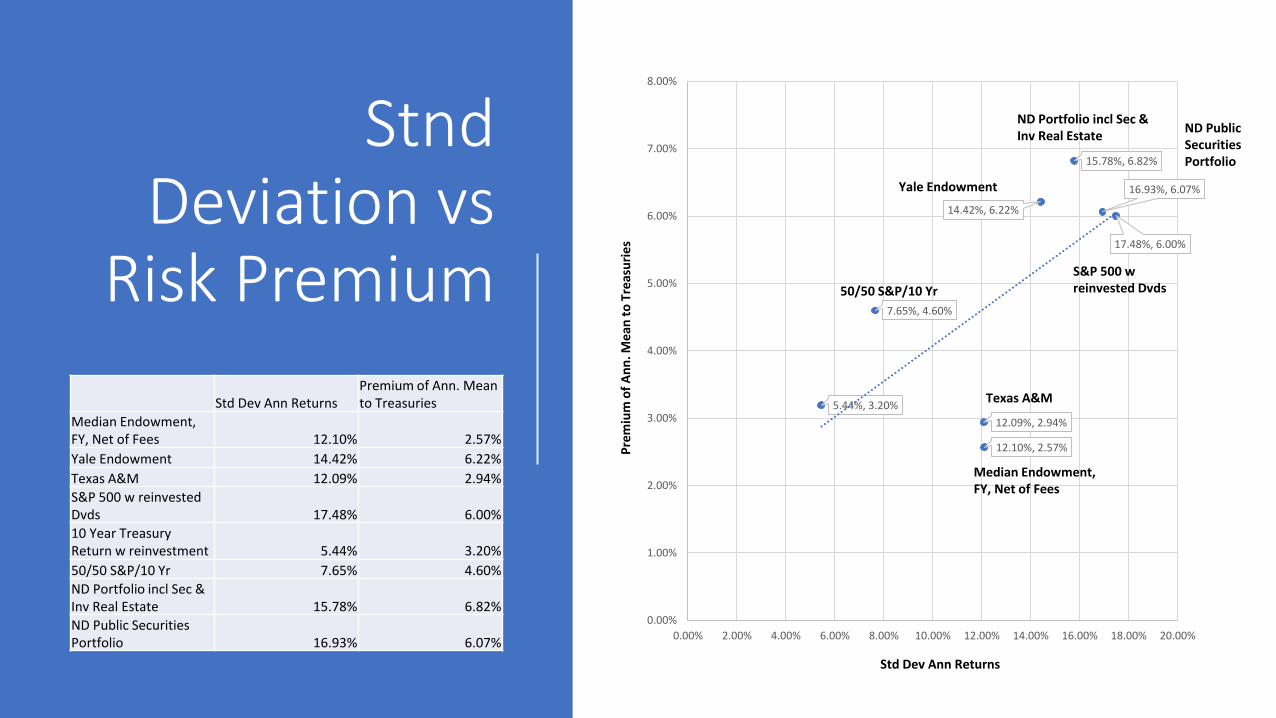
StndDeviation vs
Risk Premium
12.10%, 2.57%
14.42%, 6.22%
12.09%, 2.94%
17.48%, 6.00%
5.44%, 3.20%
7.65%, 4.60%
15.78%, 6.82%
16.93%, 6.07%
0.00%
1.00%
2.00%
3.00%
4.00%
5.00%
6.00%
7.00%
8.00%
0.00% 2.00% 4.00% 6.00% 8.00% 10.00% 12.00% 14.00% 16.00% 18.00% 20.00%
Std Dev Ann ReturnsPremium of Ann. Mean to Treasuries
Median Endowment, FY, Net of Fees 12.10% 2.57%
Yale Endowment 14.42% 6.22%
Texas A&M 12.09% 2.94%
S&P 500 w reinvested Dvds 17.48% 6.00%
10 Year Treasury Return w reinvestment 5.44% 3.20%
50/50 S&P/10 Yr 7.65% 4.60%
ND Portfolio incl Sec & Inv Real Estate 15.78% 6.82%
ND Public Securities Portfolio 16.93% 6.07%
Texas A&M
Median Endowment, FY, Net of Fees
Yale Endowment
S&P 500 w reinvested Dvds
Pre
miu
m o
f A
nn
. Mea
n t
o T
reas
uri
es
50/50 S&P/10 Yr
ND Portfolio incl Sec & Inv Real Estate
ND Public Securities Portfolio
Std Dev Ann Returns
(0.25)
(0.20)
(0.15)
(0.10)
(0.05)
-
0.05
0.10
0.15
0.20
0.25
-2.50% -2.00% -1.50% -1.00% -0.50% 0.00% 0.50% 1.00% 1.50% 2.00% 2.50%
Spre
ad t
o M
ean
Sh
arp
e R
atio
Spread to Mean Compounded Ann. 10 yr Returns
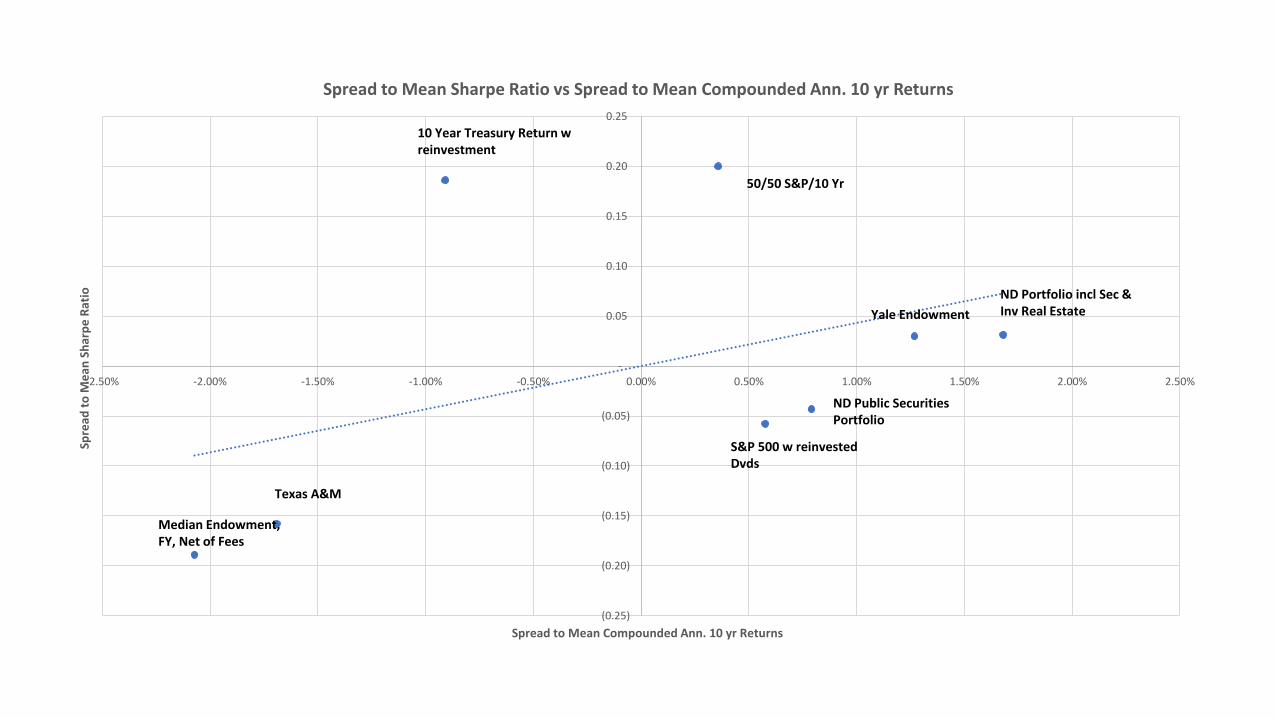
Spread to Mean Sharpe Ratio vs Spread to Mean Compounded Ann. 10 yr Returns
Texas A&M
Median Endowment, FY, Net of Fees
Yale Endowment
S&P 500 w reinvested Dvds
10 Year Treasury Return w reinvestment
50/50 S&P/10 Yr
ND Portfolio incl Sec & Inv Real Estate
ND Public Securities Portfolio
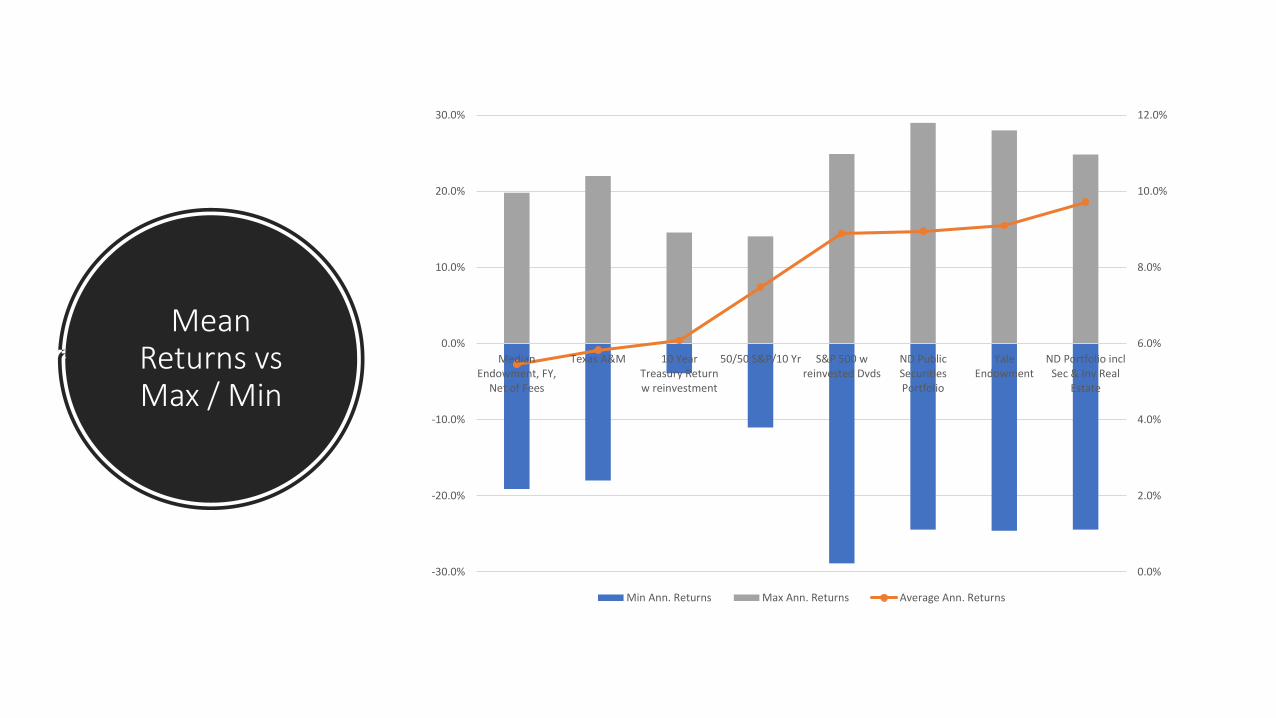
Mean Returns vs Max / Min
0.0%
2.0%
4.0%
6.0%
8.0%
10.0%
12.0%
-30.0%
-20.0%
-10.0%
0.0%
10.0%
20.0%
30.0%
MedianEndowment, FY,
Net of Fees
Texas A&M 10 YearTreasury Returnw reinvestment
50/50 S&P/10 Yr S&P 500 wreinvested Dvds
ND PublicSecuritiesPortfolio
YaleEndowment
ND Portfolio inclSec & Inv Real
Estate
Min Ann. Returns Max Ann. Returns Average Ann. Returns
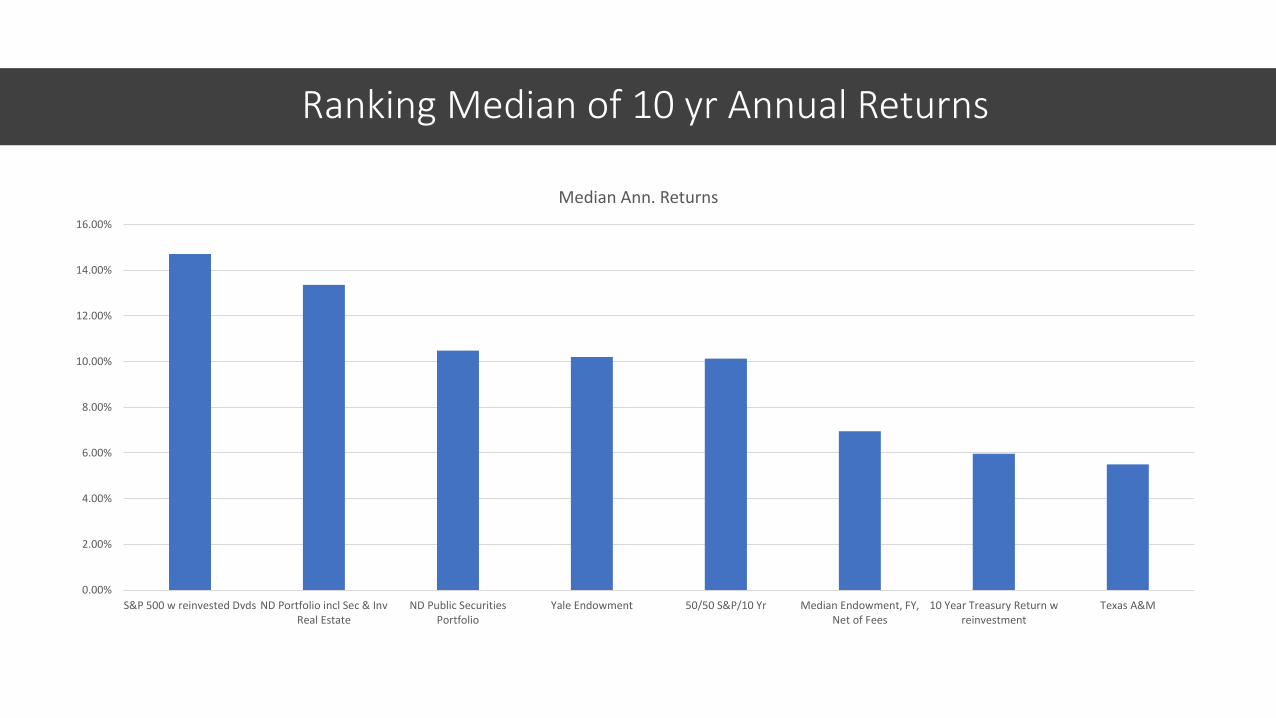
Ranking Median of 10 yr Annual Returns
0.00%
2.00%
4.00%
6.00%
8.00%
10.00%
12.00%
14.00%
16.00%
S&P 500 w reinvested Dvds ND Portfolio incl Sec & InvReal Estate
ND Public SecuritiesPortfolio
Yale Endowment 50/50 S&P/10 Yr Median Endowment, FY,Net of Fees
10 Year Treasury Return wreinvestment
Texas A&M
Median Ann. Returns
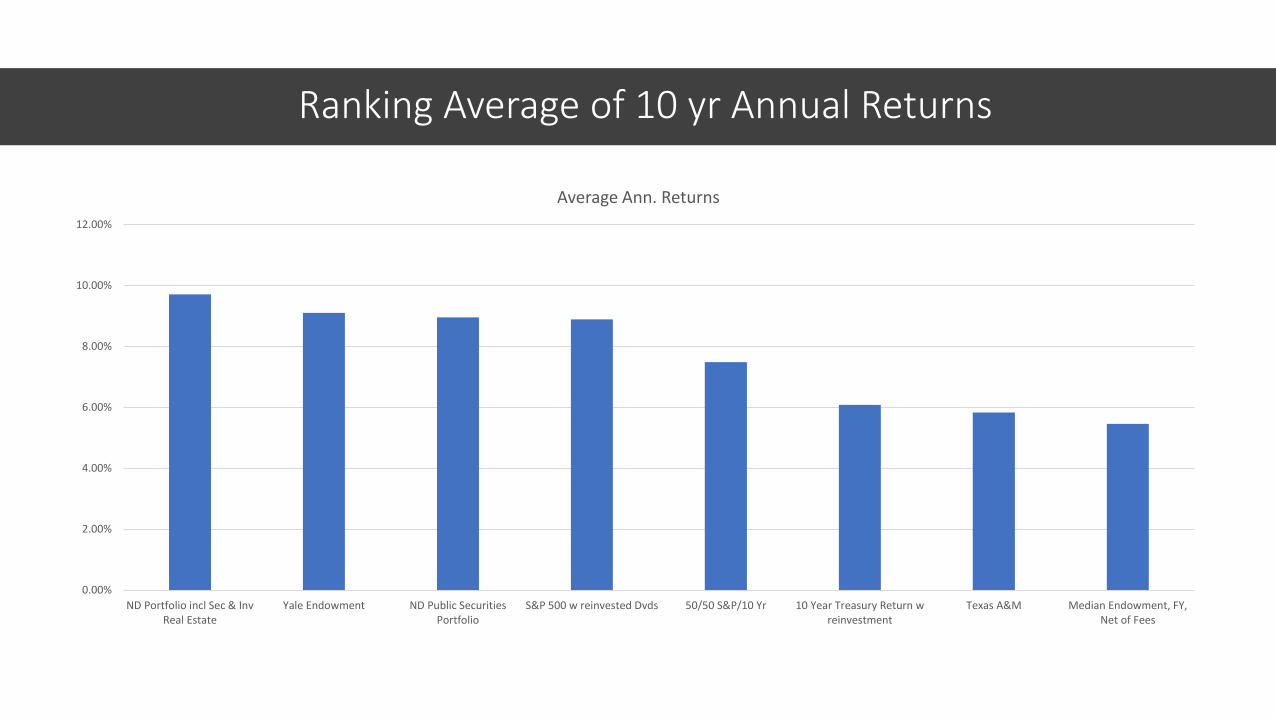
Ranking Average of 10 yr Annual Returns
0.00%
2.00%
4.00%
6.00%
8.00%
10.00%
12.00%
ND Portfolio incl Sec & InvReal Estate
Yale Endowment ND Public SecuritiesPortfolio
S&P 500 w reinvested Dvds 50/50 S&P/10 Yr 10 Year Treasury Return wreinvestment
Texas A&M Median Endowment, FY,Net of Fees
Average Ann. Returns
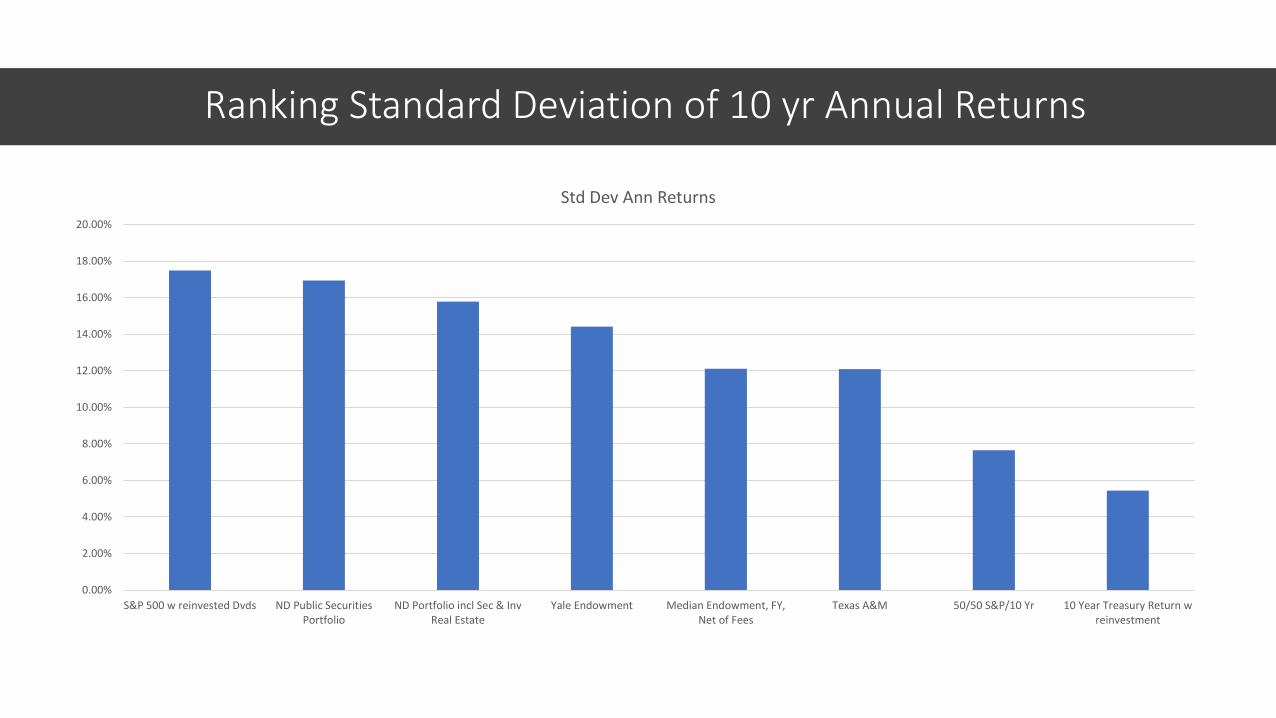
Ranking Standard Deviation of 10 yr Annual Returns
0.00%
2.00%
4.00%
6.00%
8.00%
10.00%
12.00%
14.00%
16.00%
18.00%
20.00%
S&P 500 w reinvested Dvds ND Public SecuritiesPortfolio
ND Portfolio incl Sec & InvReal Estate
Yale Endowment Median Endowment, FY,Net of Fees
Texas A&M 50/50 S&P/10 Yr 10 Year Treasury Return wreinvestment
Std Dev Ann Returns
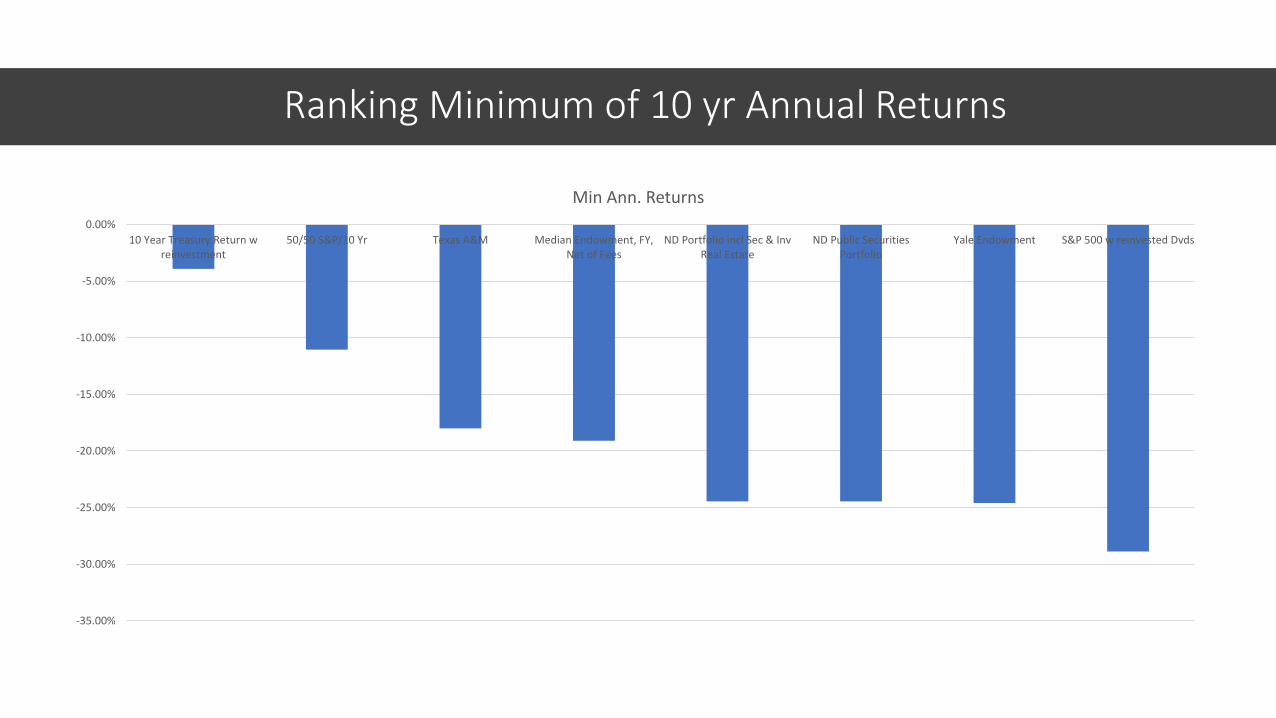
Ranking Minimum of 10 yr Annual Returns
-35.00%
-30.00%
-25.00%
-20.00%
-15.00%
-10.00%
-5.00%
0.00%
10 Year Treasury Return wreinvestment
50/50 S&P/10 Yr Texas A&M Median Endowment, FY,Net of Fees
ND Portfolio incl Sec & InvReal Estate
ND Public SecuritiesPortfolio
Yale Endowment S&P 500 w reinvested Dvds
Min Ann. Returns
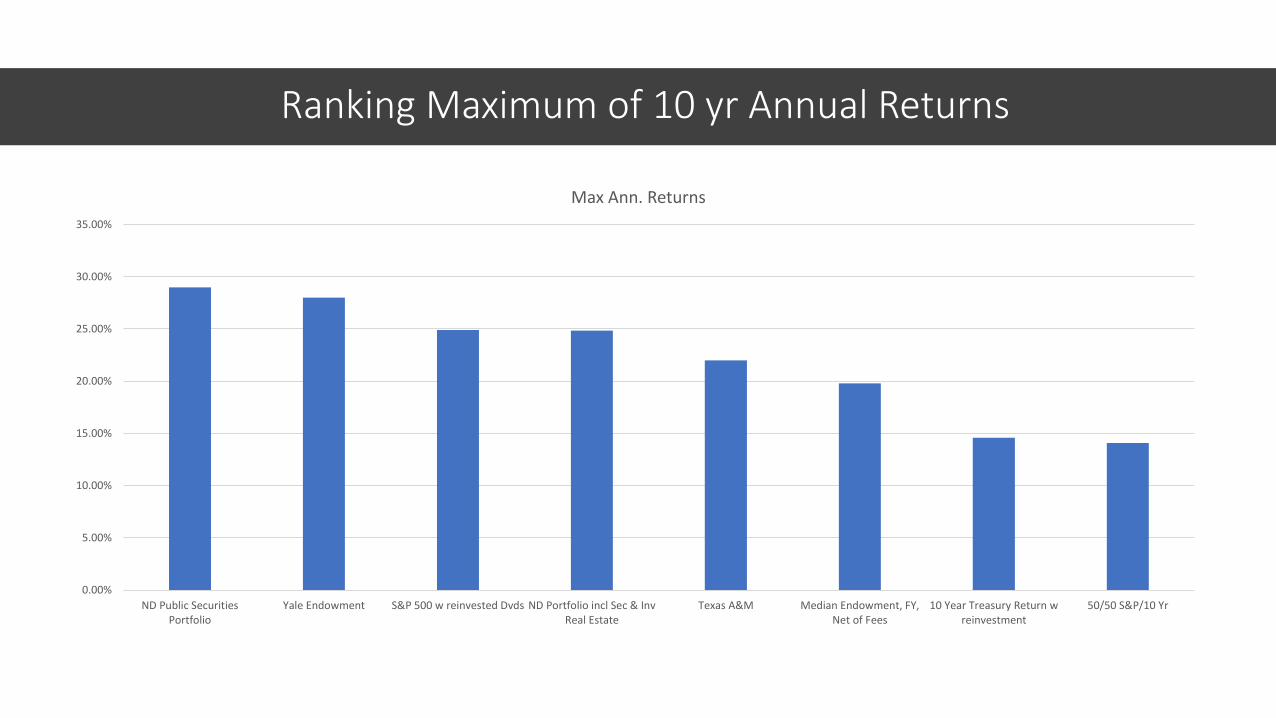
Ranking Maximum of 10 yr Annual Returns
0.00%
5.00%
10.00%
15.00%
20.00%
25.00%
30.00%
35.00%
ND Public SecuritiesPortfolio
Yale Endowment S&P 500 w reinvested Dvds ND Portfolio incl Sec & InvReal Estate
Texas A&M Median Endowment, FY,Net of Fees
10 Year Treasury Return wreinvestment
50/50 S&P/10 Yr
Max Ann. Returns
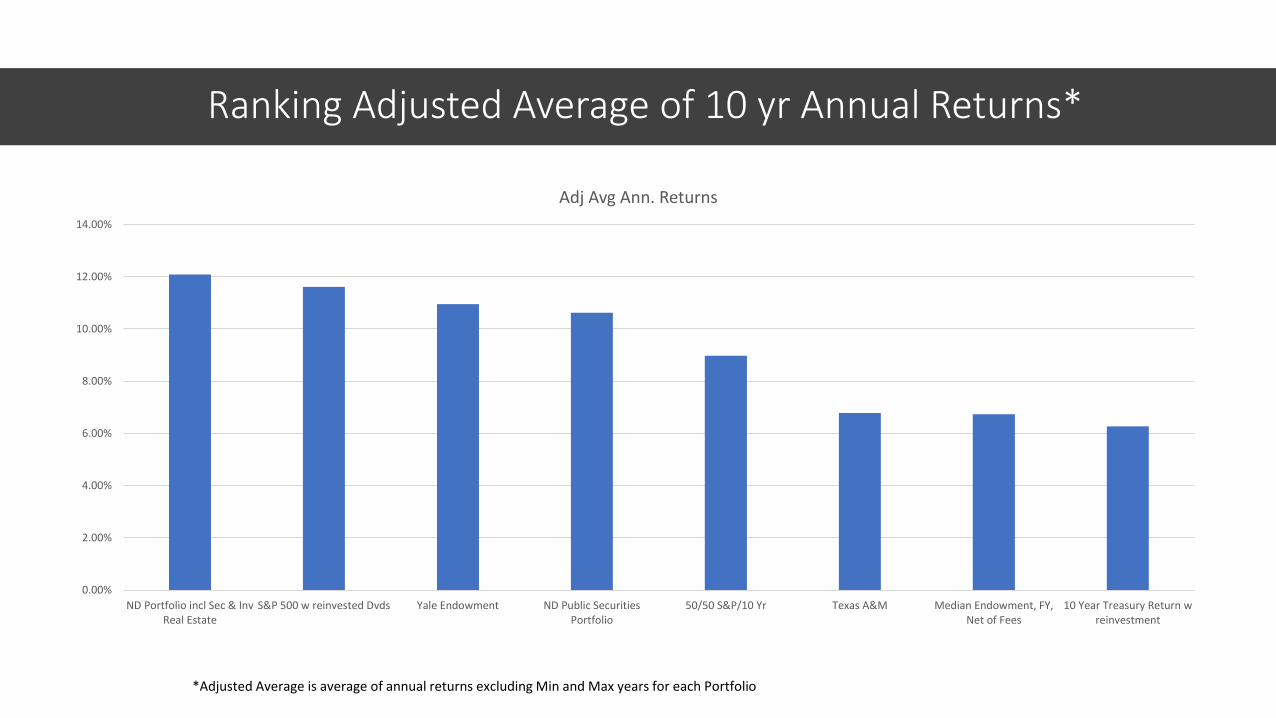
Ranking Adjusted Average of 10 yr Annual Returns*
0.00%
2.00%
4.00%
6.00%
8.00%
10.00%
12.00%
14.00%
ND Portfolio incl Sec & InvReal Estate
S&P 500 w reinvested Dvds Yale Endowment ND Public SecuritiesPortfolio
50/50 S&P/10 Yr Texas A&M Median Endowment, FY,Net of Fees
10 Year Treasury Return wreinvestment
Adj Avg Ann. Returns
*Adjusted Average is average of annual returns excluding Min and Max years for each Portfolio
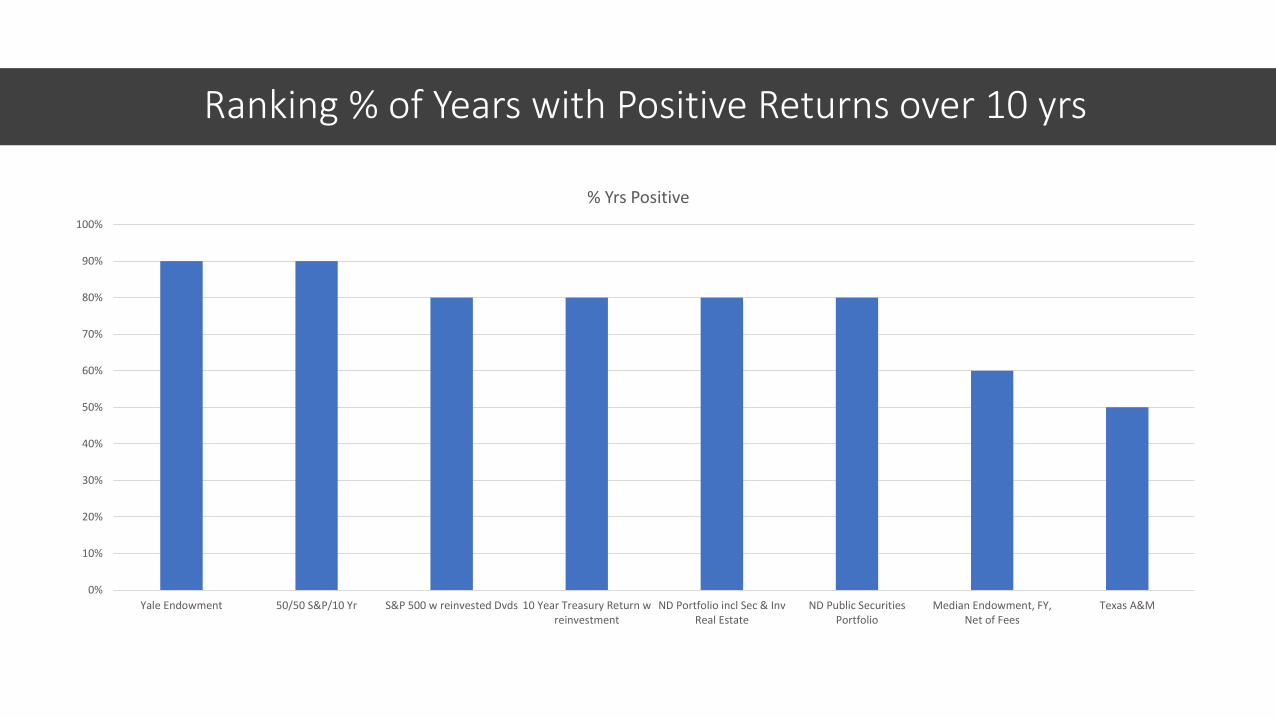
Ranking % of Years with Positive Returns over 10 yrs
0%
10%
20%
30%
40%
50%
60%
70%
80%
90%
100%
Yale Endowment 50/50 S&P/10 Yr S&P 500 w reinvested Dvds 10 Year Treasury Return wreinvestment
ND Portfolio incl Sec & InvReal Estate
ND Public SecuritiesPortfolio
Median Endowment, FY,Net of Fees
Texas A&M
% Yrs Positive
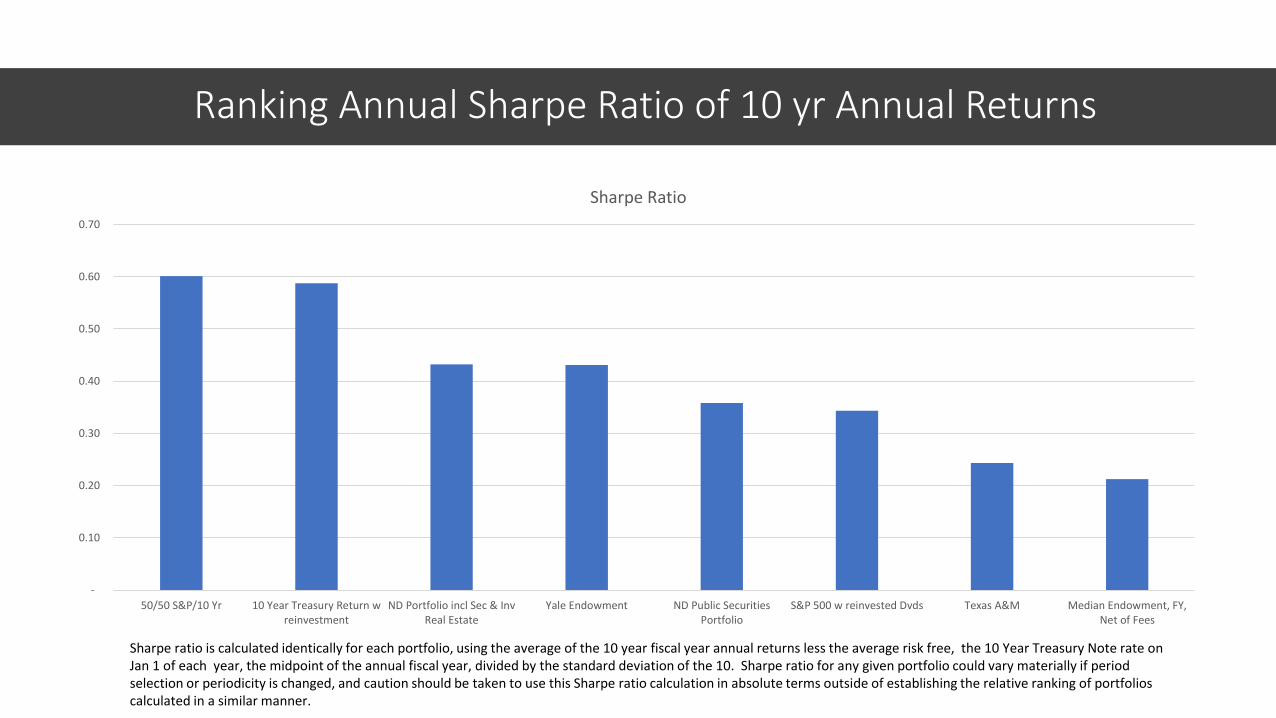
Ranking Annual Sharpe Ratio of 10 yr Annual Returns
-
0.10
0.20
0.30
0.40
0.50
0.60
0.70
50/50 S&P/10 Yr 10 Year Treasury Return wreinvestment
ND Portfolio incl Sec & InvReal Estate
Yale Endowment ND Public SecuritiesPortfolio
S&P 500 w reinvested Dvds Texas A&M Median Endowment, FY,Net of Fees
Sharpe Ratio
Sharpe ratio is calculated identically for each portfolio, using the average of the 10 year fiscal year annual returns less the average risk free, the 10 Year Treasury Note rate on Jan 1 of each year, the midpoint of the annual fiscal year, divided by the standard deviation of the 10. Sharpe ratio for any given portfolio could vary materially if period selection or periodicity is changed, and caution should be taken to use this Sharpe ratio calculation in absolute terms outside of establishing the relative ranking of portfolios calculated in a similar manner.
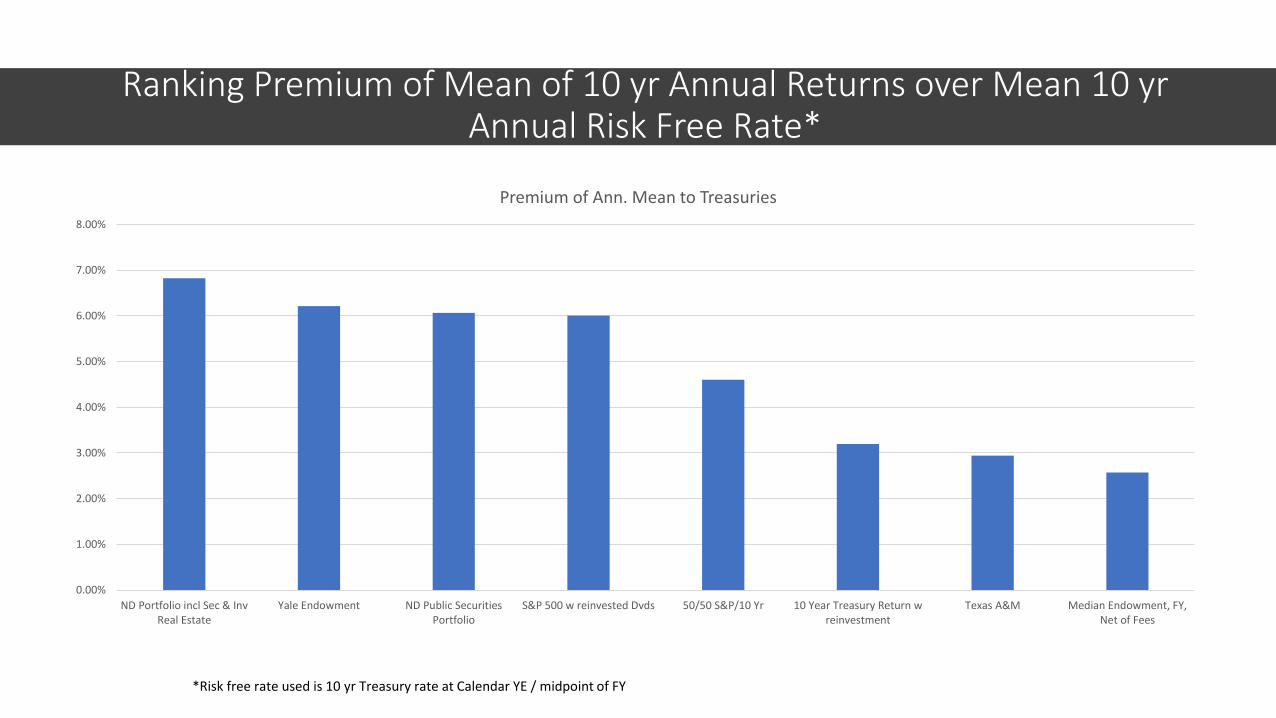
Ranking Premium of Mean of 10 yr Annual Returns over Mean 10 yrAnnual Risk Free Rate*
0.00%
1.00%
2.00%
3.00%
4.00%
5.00%
6.00%
7.00%
8.00%
ND Portfolio incl Sec & InvReal Estate
Yale Endowment ND Public SecuritiesPortfolio
S&P 500 w reinvested Dvds 50/50 S&P/10 Yr 10 Year Treasury Return wreinvestment
Texas A&M Median Endowment, FY,Net of Fees
Premium of Ann. Mean to Treasuries
*Risk free rate used is 10 yr Treasury rate at Calendar YE / midpoint of FY
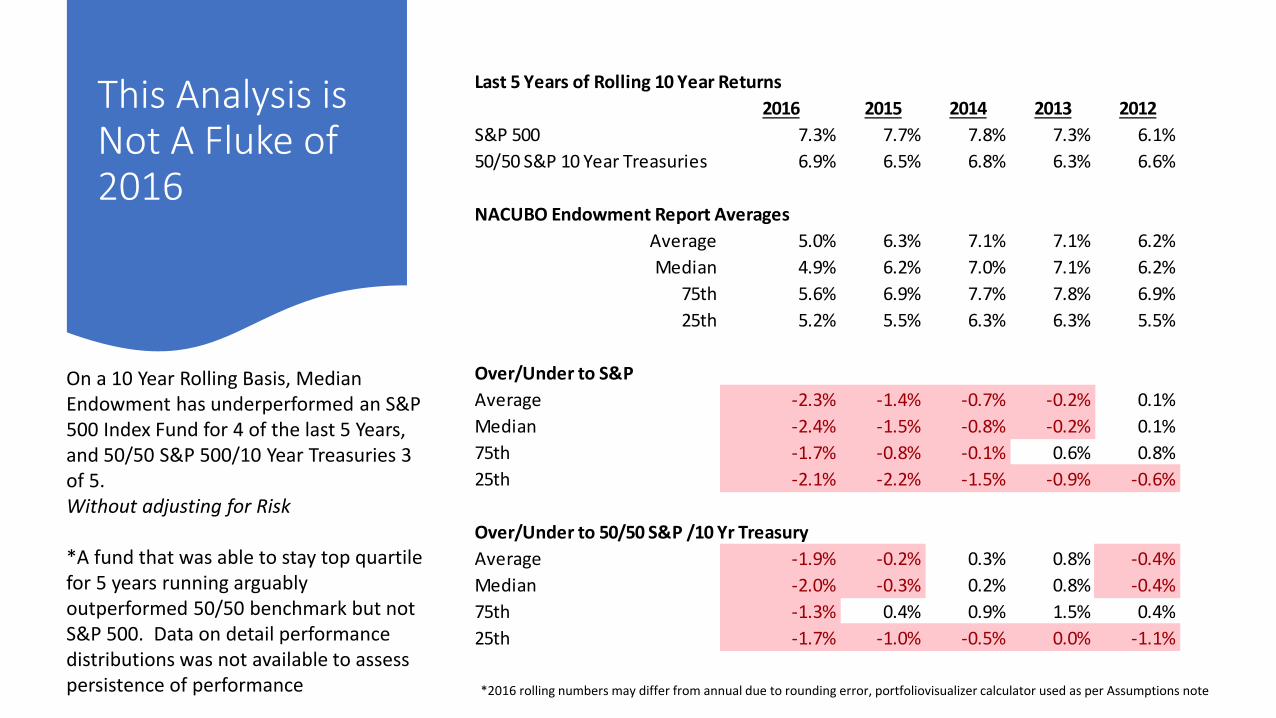
Last 5 Years of Rolling 10 Year Returns
2016 2015 2014 2013 2012
S&P 500 7.3% 7.7% 7.8% 7.3% 6.1%
50/50 S&P 10 Year Treasuries 6.9% 6.5% 6.8% 6.3% 6.6%
NACUBO Endowment Report Averages
Average 5.0% 6.3% 7.1% 7.1% 6.2%
Median 4.9% 6.2% 7.0% 7.1% 6.2%
75th 5.6% 6.9% 7.7% 7.8% 6.9%
25th 5.2% 5.5% 6.3% 6.3% 5.5%
Over/Under to S&P
Average -2.3% -1.4% -0.7% -0.2% 0.1%
Median -2.4% -1.5% -0.8% -0.2% 0.1%
75th -1.7% -0.8% -0.1% 0.6% 0.8%
25th -2.1% -2.2% -1.5% -0.9% -0.6%
Over/Under to 50/50 S&P /10 Yr Treasury
Average -1.9% -0.2% 0.3% 0.8% -0.4%
Median -2.0% -0.3% 0.2% 0.8% -0.4%
75th -1.3% 0.4% 0.9% 1.5% 0.4%
25th -1.7% -1.0% -0.5% 0.0% -1.1%
This Analysis is Not A Fluke of 2016
On a 10 Year Rolling Basis, Median Endowment has underperformed an S&P 500 Index Fund for 4 of the last 5 Years, and 50/50 S&P 500/10 Year Treasuries 3 of 5.Without adjusting for Risk
*A fund that was able to stay top quartile for 5 years running arguably outperformed 50/50 benchmark but not S&P 500. Data on detail performance distributions was not available to assess persistence of performance *2016 rolling numbers may differ from annual due to rounding error, portfoliovisualizer calculator used as per Assumptions note
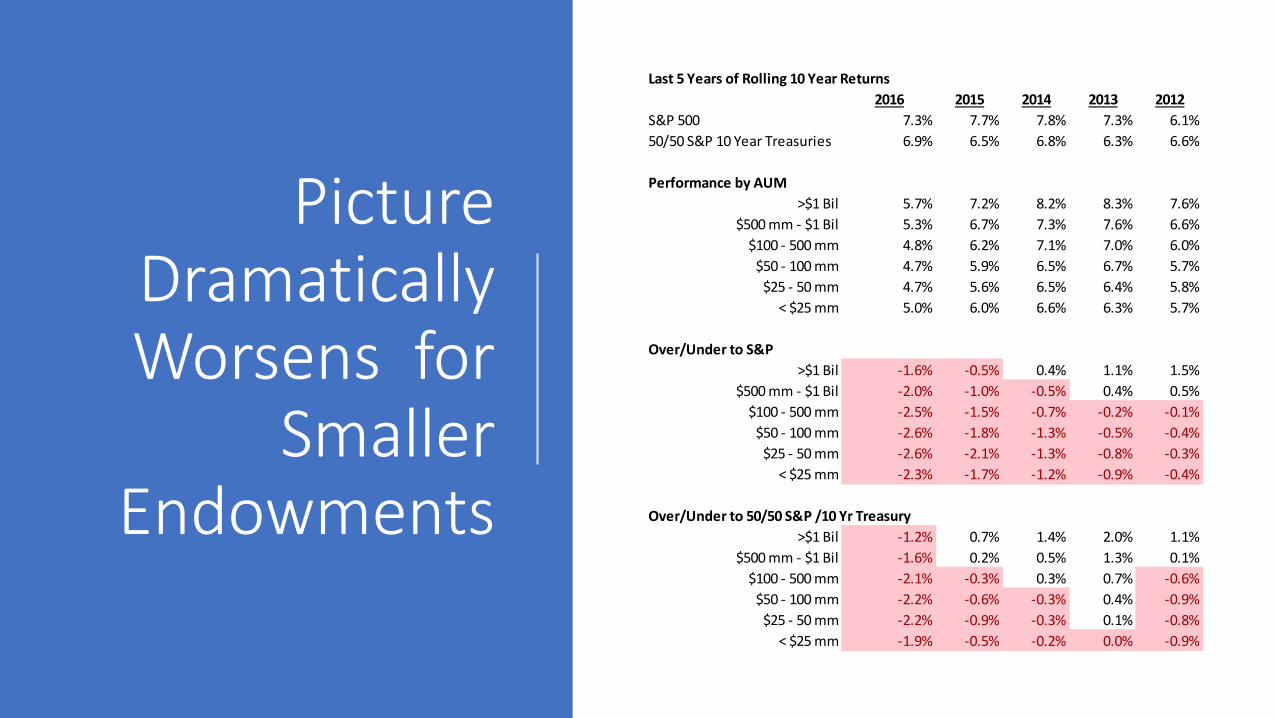
Last 5 Years of Rolling 10 Year Returns
2016 2015 2014 2013 2012
S&P 500 7.3% 7.7% 7.8% 7.3% 6.1%
50/50 S&P 10 Year Treasuries 6.9% 6.5% 6.8% 6.3% 6.6%
Performance by AUM
>$1 Bil 5.7% 7.2% 8.2% 8.3% 7.6%
$500 mm - $1 Bil 5.3% 6.7% 7.3% 7.6% 6.6%
$100 - 500 mm 4.8% 6.2% 7.1% 7.0% 6.0%
$50 - 100 mm 4.7% 5.9% 6.5% 6.7% 5.7%
$25 - 50 mm 4.7% 5.6% 6.5% 6.4% 5.8%
< $25 mm 5.0% 6.0% 6.6% 6.3% 5.7%
Over/Under to S&P
>$1 Bil -1.6% -0.5% 0.4% 1.1% 1.5%
$500 mm - $1 Bil -2.0% -1.0% -0.5% 0.4% 0.5%
$100 - 500 mm -2.5% -1.5% -0.7% -0.2% -0.1%
$50 - 100 mm -2.6% -1.8% -1.3% -0.5% -0.4%
$25 - 50 mm -2.6% -2.1% -1.3% -0.8% -0.3%
< $25 mm -2.3% -1.7% -1.2% -0.9% -0.4%
Over/Under to 50/50 S&P /10 Yr Treasury
>$1 Bil -1.2% 0.7% 1.4% 2.0% 1.1%
$500 mm - $1 Bil -1.6% 0.2% 0.5% 1.3% 0.1%
$100 - 500 mm -2.1% -0.3% 0.3% 0.7% -0.6%
$50 - 100 mm -2.2% -0.6% -0.3% 0.4% -0.9%
$25 - 50 mm -2.2% -0.9% -0.3% 0.1% -0.8%
< $25 mm -1.9% -0.5% -0.2% 0.0% -0.9%
Picture Dramatically Worsens for
Smaller Endowments
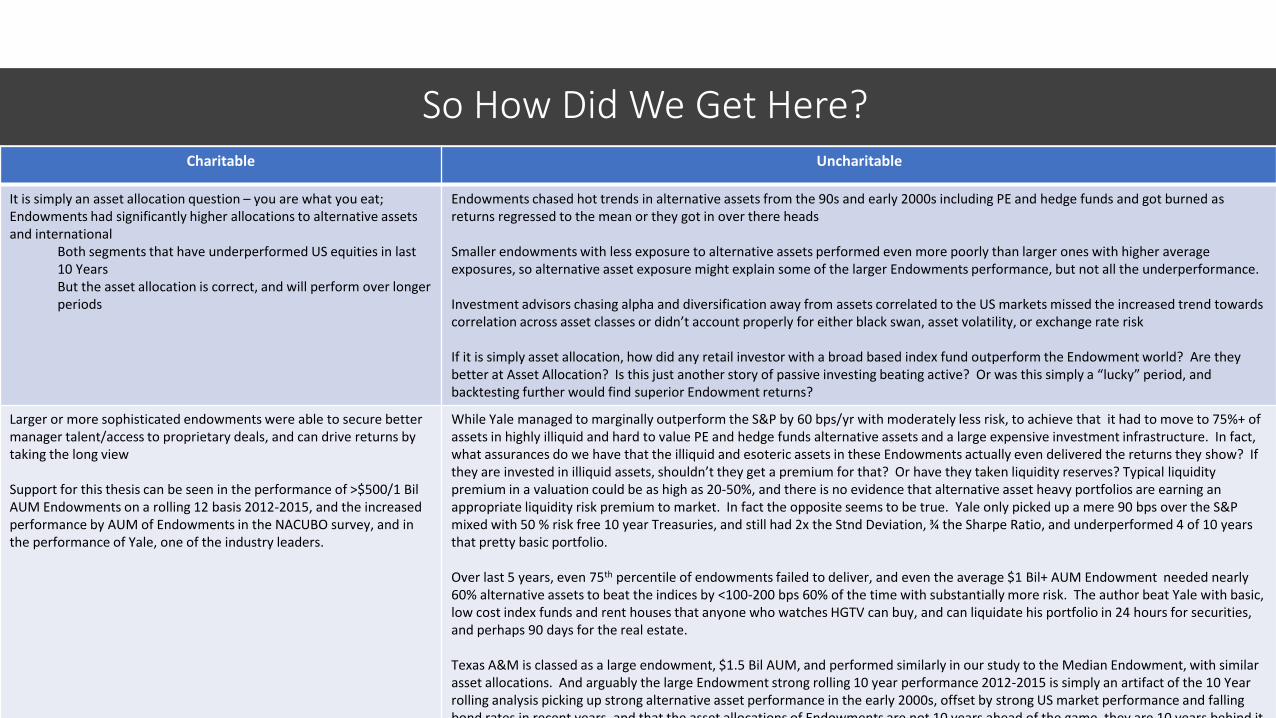
So How Did We Get Here?Charitable Uncharitable
It is simply an asset allocation question – you are what you eat; Endowments had significantly higher allocations to alternative assets and international
Both segments that have underperformed US equities in last 10 YearsBut the asset allocation is correct, and will perform over longer periods
Endowments chased hot trends in alternative assets from the 90s and early 2000s including PE and hedge funds and got burned as returns regressed to the mean or they got in over there heads
Smaller endowments with less exposure to alternative assets performed even more poorly than larger ones with higher average exposures, so alternative asset exposure might explain some of the larger Endowments performance, but not all the underperformance.
Investment advisors chasing alpha and diversification away from assets correlated to the US markets missed the increased trend towards correlation across asset classes or didn’t account properly for either black swan, asset volatility, or exchange rate risk
If it is simply asset allocation, how did any retail investor with a broad based index fund outperform the Endowment world? Are they better at Asset Allocation? Is this just another story of passive investing beating active? Or was this simply a “lucky” period, and backtesting further would find superior Endowment returns?
Larger or more sophisticated endowments were able to secure better manager talent/access to proprietary deals, and can drive returns by taking the long view
Support for this thesis can be seen in the performance of >$500/1 BilAUM Endowments on a rolling 12 basis 2012-2015, and the increased performance by AUM of Endowments in the NACUBO survey, and in the performance of Yale, one of the industry leaders.
While Yale managed to marginally outperform the S&P by 60 bps/yr with moderately less risk, to achieve that it had to move to 75%+ of assets in highly illiquid and hard to value PE and hedge funds alternative assets and a large expensive investment infrastructure. In fact, what assurances do we have that the illiquid and esoteric assets in these Endowments actually even delivered the returns they show? If they are invested in illiquid assets, shouldn’t they get a premium for that? Or have they taken liquidity reserves? Typical liquidity premium in a valuation could be as high as 20-50%, and there is no evidence that alternative asset heavy portfolios are earning an appropriate liquidity risk premium to market. In fact the opposite seems to be true. Yale only picked up a mere 90 bps over the S&P mixed with 50 % risk free 10 year Treasuries, and still had 2x the Stnd Deviation, ¾ the Sharpe Ratio, and underperformed 4 of 10 years that pretty basic portfolio.
Over last 5 years, even 75th percentile of endowments failed to deliver, and even the average $1 Bil+ AUM Endowment needed nearly 60% alternative assets to beat the indices by <100-200 bps 60% of the time with substantially more risk. The author beat Yale with basic, low cost index funds and rent houses that anyone who watches HGTV can buy, and can liquidate his portfolio in 24 hours for securities, and perhaps 90 days for the real estate.
Texas A&M is classed as a large endowment, $1.5 Bil AUM, and performed similarly in our study to the Median Endowment, with similar asset allocations. And arguably the large Endowment strong rolling 10 year performance 2012-2015 is simply an artifact of the 10 Year rolling analysis picking up strong alternative asset performance in the early 2000s, offset by strong US market performance and falling bond rates in recent years, and that the asset allocations of Endowments are not 10 years ahead of the game, they are 10 years behind it,
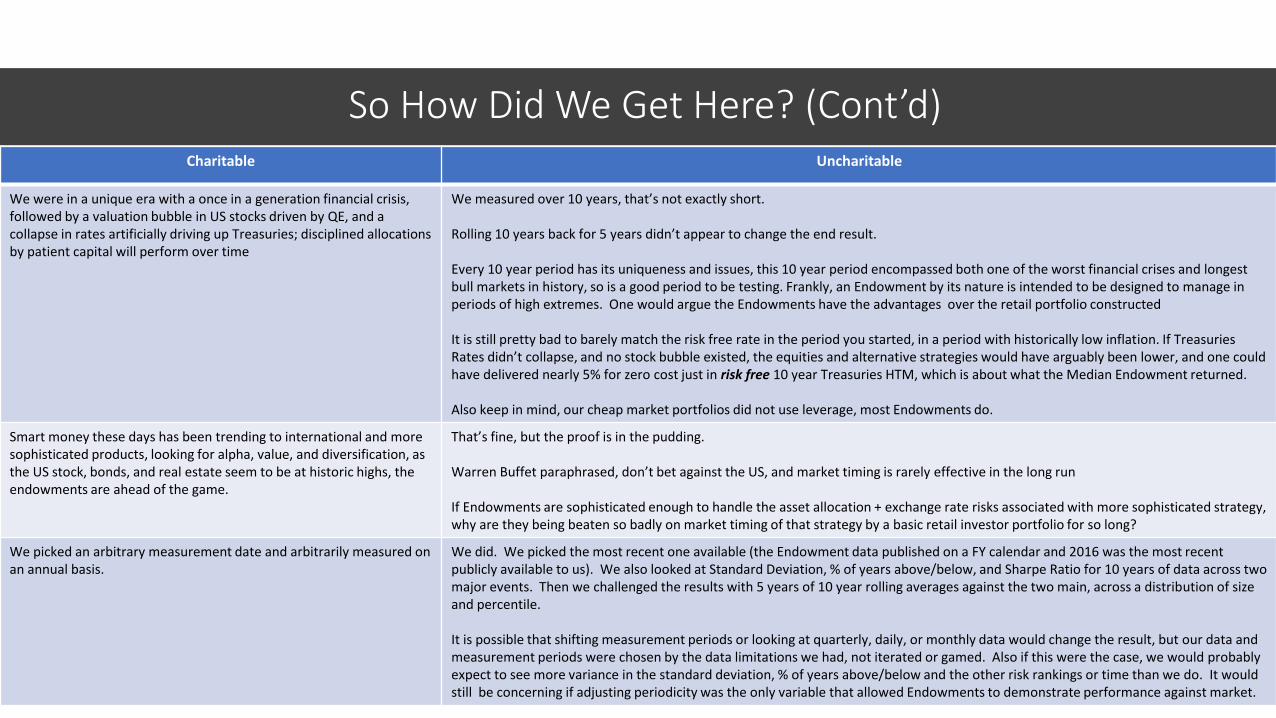
So How Did We Get Here? (Cont’d)Charitable Uncharitable
We were in a unique era with a once in a generation financial crisis, followed by a valuation bubble in US stocks driven by QE, and a collapse in rates artificially driving up Treasuries; disciplined allocations by patient capital will perform over time
We measured over 10 years, that’s not exactly short.
Rolling 10 years back for 5 years didn’t appear to change the end result.
Every 10 year period has its uniqueness and issues, this 10 year period encompassed both one of the worst financial crises and longest bull markets in history, so is a good period to be testing. Frankly, an Endowment by its nature is intended to be designed to manage in periods of high extremes. One would argue the Endowments have the advantages over the retail portfolio constructed
It is still pretty bad to barely match the risk free rate in the period you started, in a period with historically low inflation. If Treasuries Rates didn’t collapse, and no stock bubble existed, the equities and alternative strategies would have arguably been lower, and one could have delivered nearly 5% for zero cost just in risk free 10 year Treasuries HTM, which is about what the Median Endowment returned.
Also keep in mind, our cheap market portfolios did not use leverage, most Endowments do.
Smart money these days has been trending to international and more sophisticated products, looking for alpha, value, and diversification, as the US stock, bonds, and real estate seem to be at historic highs, the endowments are ahead of the game.
That’s fine, but the proof is in the pudding.
Warren Buffet paraphrased, don’t bet against the US, and market timing is rarely effective in the long run
If Endowments are sophisticated enough to handle the asset allocation + exchange rate risks associated with more sophisticated strategy, why are they being beaten so badly on market timing of that strategy by a basic retail investor portfolio for so long?
We picked an arbitrary measurement date and arbitrarily measured on an annual basis.
We did. We picked the most recent one available (the Endowment data published on a FY calendar and 2016 was the most recent publicly available to us). We also looked at Standard Deviation, % of years above/below, and Sharpe Ratio for 10 years of data across two major events. Then we challenged the results with 5 years of 10 year rolling averages against the two main, across a distribution of size and percentile.
It is possible that shifting measurement periods or looking at quarterly, daily, or monthly data would change the result, but our data and measurement periods were chosen by the data limitations we had, not iterated or gamed. Also if this were the case, we would probably expect to see more variance in the standard deviation, % of years above/below and the other risk rankings or time than we do. It would still be concerning if adjusting periodicity was the only variable that allowed Endowments to demonstrate performance against market.
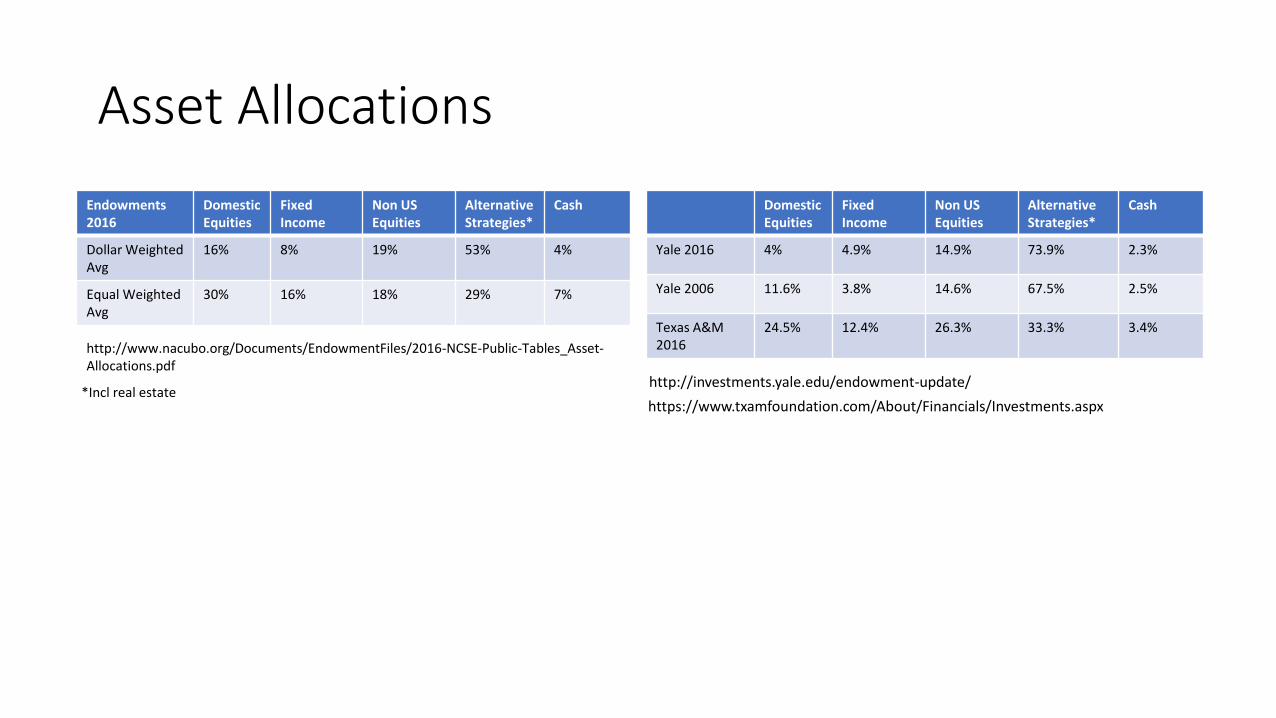
Asset Allocations
Endowments 2016
Domestic Equities
Fixed Income
Non US Equities
Alternative Strategies*
Cash
Dollar Weighted Avg
16% 8% 19% 53% 4%
Equal Weighted Avg
30% 16% 18% 29% 7%
Domestic Equities
Fixed Income
Non US Equities
Alternative Strategies*
Cash
Yale 2016 4% 4.9% 14.9% 73.9% 2.3%
Yale 2006 11.6% 3.8% 14.6% 67.5% 2.5%
Texas A&M 2016
24.5% 12.4% 26.3% 33.3% 3.4%
http://www.nacubo.org/Documents/EndowmentFiles/2016-NCSE-Public-Tables_Asset-Allocations.pdf
https://www.txamfoundation.com/About/Financials/Investments.aspx
http://investments.yale.edu/endowment-update/*Incl real estate
Author Neal M. Dikeman
• Author Neal M. Dikeman is a venture capitalist and startup executive with significant investment, board level, and executive experience, having spent 1/3rd of his career in finance roles at some of the largest companies in the world, Bankers Trust/Deutsche Bank, Royal Dutch Shell, and a CalPERS backed PE fund, and in between founded, ran, served as director, CFO and other executive positions in successful tech startups.
• Professionally he has been a venture capitalist at Royal Dutch Shell, prior to that cofounded merchant bank Jane Capital Partners in 2001 at age 25, delivering superior returns to partners and clients from 2001-2013, including multiple IPOs.
• At Jane Capital he was Founder of 7 Silicon Valley venture backed technology startups, including in fintech, cleantech, and internet. Served as CFO, CEO, Chairman, and VP, and board director multiple times. The companies he founded have gone on to raise over $250 mm in venture capital, with 3 reaching 9 figure valuations <48 months from founding.
• He is an experienced private equity and venture capital investor for 18 years, at a CalPERS backed PE fund, at Globalgate, the ecommerce venture capital firm behind YellowPages.com, Jane Capital Partners, and Royal Dutch Shell. Involved in highly successful exits at each stop. Began career in investment banking at a Wall Street investment bank, Bankers Trust, later Deutsche Bank.
• BA in Economics from Texas A&M University; Author of DIY Wealth; Currently board member at American ElectricTechnologies (NASDAQ:AETI), and Greenhome.com.
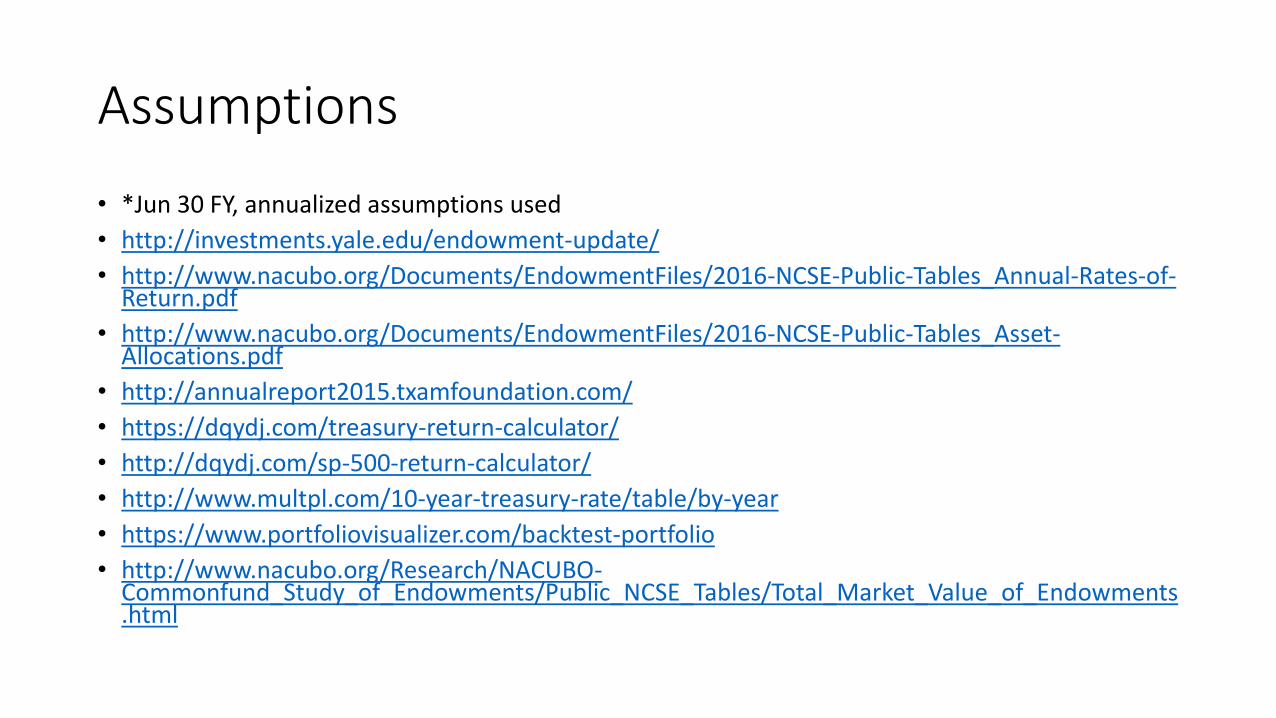
Assumptions
• *Jun 30 FY, annualized assumptions used
• http://investments.yale.edu/endowment-update/
• http://www.nacubo.org/Documents/EndowmentFiles/2016-NCSE-Public-Tables_Annual-Rates-of-Return.pdf
• http://www.nacubo.org/Documents/EndowmentFiles/2016-NCSE-Public-Tables_Asset-Allocations.pdf
• http://annualreport2015.txamfoundation.com/
• https://dqydj.com/treasury-return-calculator/
• http://dqydj.com/sp-500-return-calculator/
• http://www.multpl.com/10-year-treasury-rate/table/by-year
• https://www.portfoliovisualizer.com/backtest-portfolio
• http://www.nacubo.org/Research/NACUBO-Commonfund_Study_of_Endowments/Public_NCSE_Tables/Total_Market_Value_of_Endowments.html