Embed Size (px)
Citation preview

Half-Time 2012July 24th & July 26th
11330 Vanstory Drive Huntersville, NC 28078

Agenda
1. Exercise Your Brain
2. Year-To-Date Market Review
3. What to Watch the Rest of the Year
4. Current Environment in Historical Context
5. Words of Investing Wisdom

AreAlways Welcome
Questions

Exercise Your Brain

How many times must you shuffle a deck of 52 playing cards in order to ensure it is truly scrambled?
a) 5b) 7c) 9d) 10
Source: http://online.wsj.com/article/SB10001424052970204826704577074501731476934.html?mod=WSJ_LifeStyle_Lifestyle_5
Exercise Your Brain

Exercise Your Brain
If the world’s 7 billion people stood shoulder to shoulder, which of the following geographic areas is the smallest that could accommodate them?
a) Zanzibar (about 650 square miles)
b) Maui (about 727 square miles)
c) Rhode Island (about 1,033 square miles)
d) Sicily (about 9,925 square miles)
Source: http://www.economist.com/node/21533364

Which state has the longest coastline?
a) Californiab) Alaskac) Floridad) Texas
Source: http://www.factmonster.com/ipka/A0770175.html
Exercise Your Brain

What country has the greatest number of active volcanoes?
a) United Statesb) South Americac) Japand) Indonesia
Source: http://www.scholastic.com/teachers/article/general-facts-about-volcanoes
Exercise Your Brain

Year-To-DateMarketReview

Year-To-Date June 30, 2012 Market Review
Domestic Stocks(1) 8.3%
Foreign Stocks(2) 1.1%
Gold 1.5%
U.S. Dollar Index 1.8%
Sources: Yahoo! Finance; Barron’s; djindexes.com, London Bullion Market Association, WSJ. Past performance is no guarantee of future results. Indices are unmanaged and cannot be invested into directly. 1) S&P 500, 2) DJ Global ex US, 3) DJ-UBS Commodity Index, 4) IBEX 35
10-year Treasury Yield 8.3%
Commodities(3) 3.7%
Oil 14.0%
Spain(4) 17.1%

The United States of Europe?

European Rates Have Diverged
Source: European Central Bank, Stefano Micossi
European Interest Rates

Bail out
Bail outBail out
Bail out
Bail out
European GDP

So Who Pays For These Bailouts?

U.S. Growth is Moderate
Source: U.S. Department of Commerce

Employment Recovery Is Slow

Still Missing 4.6M Jobs
-1000
-800
-600
-400
-200
0
200
400
600
Jan
-05
Ap
r-0
5
Jul-
05
Oct
-05
Jan
-06
Ap
r-0
6
Jul-
06
Oct
-06
Jan
-07
Ap
r-0
7
Jul-
07
Oct
-07
Jan
-08
Ap
r-0
8
Jul-
08
Oct
-08
Jan
-09
Ap
r-0
9
Jul-
09
Oct
-09
Jan
-10
Ap
r-1
0
Jul-
10
Oct
-10
Jan
-11
Ap
r-1
1
Jul-
11
Oct
-11
Jan
-12
Ap
r-1
2
Employment - Total Private PayrollTotal Job Gain/Loss (thousands)
8.9 mm Jobs Lost
4.3 mm Jobs Gained
Source: Federal Reserve Bank of St. Louis

What to Watch the Rest of the Year

S&P 500 Corporate Earnings
Source: Zacks
2010
44.9%
2012
9.6%
2011
15.2%
2013
12.4%
EstimateActual
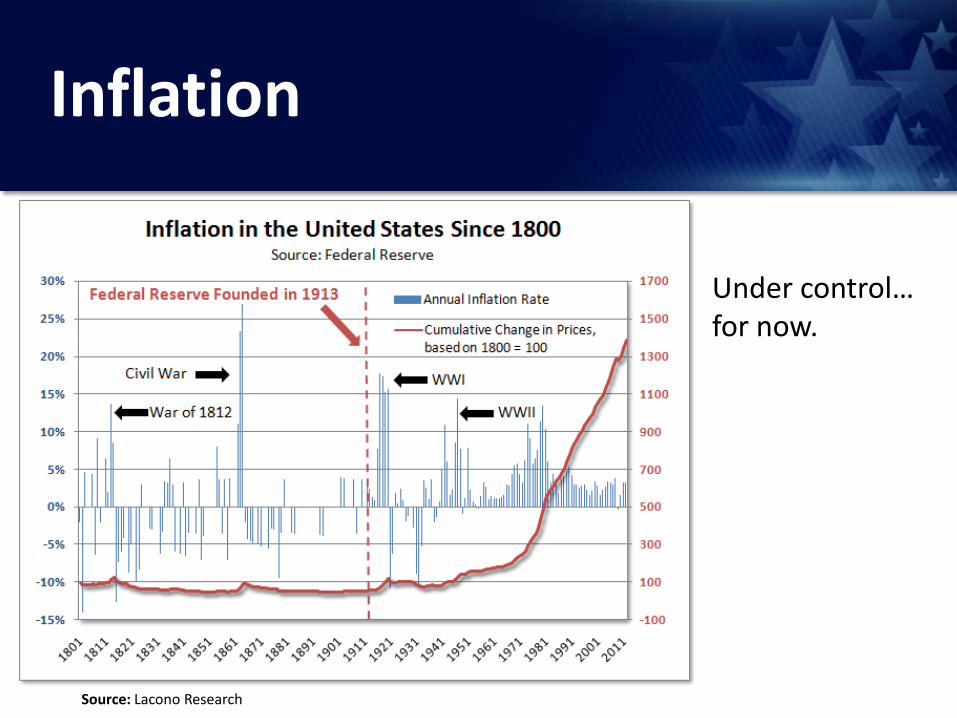
Inflation
Source: Lacono Research
Under control…for now.

Home Sales
The recent trend is up.

Small Business Optimism
Small business owners are more optimistic.

Unemployment Rate
Heading in the right direction.

The “Fiscal Cliff”

Budget Mix
Source: Congressional Budget Office
The 2012 Federal BudgetCBO Baseline Forecast, Trillions USD
Total Spending: $3.6tn$4.0
Other: $504bn (14%) Borrowing: $1,171bn (32%)
$3.5
$3.0 Net Int.: $224bn (6%)
Non-defense Discretionary: $630bn (17%)
$2.5
Defense:$673bn (19%)
$2.0
$1.5Social Security:$769bn (21%)$1.0
Medicare & Medicaid: $827bn (23%)
$0.5
$0.0Total Government Spending Sources of Financing
Revenue:$2,456bn (68%)

“A budget tells us what we can't afford, but it doesn't keep us from buying it.”
--William Feather

Current Environment in Historical Context

Slide Header

How Do Market Bubbles Form?

Slide Header

20%
30%
40%
50%
60%
70%
80%
90%
100%
19
50
19
55
19
60
19
65
19
70
19
75
19
80
19
85
19
90
19
95
20
00
20
05
20
10
20
15
Consumer Debt as a % of GDP
Strong Stock Market
Weak Stock Market
Consumer Debt
Source: Federal Reserve Bank of St. Louis

Corporate Profits as % of GDP
3%
4%
5%
6%
7%
8%
9%
10%
11%
12%
19
60
19
65
19
70
19
75
19
80
19
85
19
90
19
95
20
00
20
05
20
10
20
15
Adjusted After-Tax Corporate Profits as a % of GDP
50-yr. avg.: 6.2%
10.1%
Source: Bureau of Economic Analysis

Source: Federal Reserve Bank of St. Louis.
Employment as % of Total Population
54%
55%
56%
57%
58%
59%
60%
61%
62%
63%
64%
65%
19
60
19
65
19
70
19
75
19
80
19
85
19
90
19
95
20
00
20
05
20
10
20
15
Civilian Employment as a % of Total Population)
58.4%
1983

Source: Federal Reserve Bank of St. Louis.
Wages as % of GDP
43%
45%
47%
49%
51%
53%
55%
19
60
19
65
19
70
19
75
19
80
19
85
19
90
19
95
20
00
20
05
20
10
20
15
Wages as a % of GDP
Slide Header

Source: Washington Post
Reason for Optimism

Up and Down

Words of Investing Wisdom

Words of Investing Wisdom
“Look at (market) fluctuations as your friend rather than your enemy—profit from folly rather than participate in it.”
--Warren Buffett

“If you watch a basketball game and at the end of the game the score is 105 to 95, no one says, wait a second, in the third quarter, you lost 28 to 18, what was the story in the third quarter?”
--Peter Lynch
Words of Investing Wisdom

“In the stock market, the only way to get a bargain is to buy what most investors are selling.”
--Sir John Templeton
Words of Investing Wisdom

“It is learning to listen to the gloom and doom at bottoms and question it, and to the exultation at tops and question this as well, that makes a sharp investor.”
--Jim Rogers
Words of Investing Wisdom

Summary
1. Deleveraging is a long, drawn-out process
2. Europe is a wildcard
3. The U.S. is still a great country

The opinions voiced in this material are for general information only and are not intended to provide specific advice or recommendations for any individual. To
determine which investment(s) may be appropriate for you, consult your financial advisor prior to investing. All performance referenced is historical and is no guarantee
of future results. All indices are unmanaged and cannot be invested into directly.
Securities offered through LPL Financial. Member FINRA/SIPC.
Thank You For Your Continued Support!