Embed Size (px)
Citation preview

Goodrich CorporationThird Quarter 2008 Results
October 23, 2008
2
Certain statements made in this presentation are forward-looking statements within the meaning of the Private Securities Litigation Reform Act of 1995 regarding the Company's future plans, objectives and expected performance. The Company cautions readers that any such forward-looking statements are based on assumptions that the Company believes are reasonable, but are subject to a wide range of risks, and actual results may differ materially.
Important factors that could cause actual results to differ include, but are not limited to: demand for and market acceptance of new and existing products, such as the Airbus A350 XWB and A380, the Boeing 787 Dreamliner, the Embraer 190, the Dassault Falcon 7X, and the Lockheed Martin F-35 Lightning II and F-22 Raptor; the health of the commercial aerospace industry, including the impact of bankruptcies and/or mergers in the airline industry; global demand for aircraft spare parts and aftermarket services; and other factors discussed in the Company's filings with the Securities and Exchange Commission and in the Company's October 23, 2008 Third Quarter 2008 Results press release.
The Company cautions you not to place undue reliance on the forward-looking statements contained in this presentation, which speak only as of the date on which such statements were made. The Company undertakes no obligation to release publicly any revisions to these forward-looking statements to reflect events or circumstances after the date on which such statements were made or to reflect the occurrence of unanticipated events.
Forward Looking Statements

3
Commercial Aerospace Environment
44
Fuel Price and GDP GrowthHistorical and Forecast
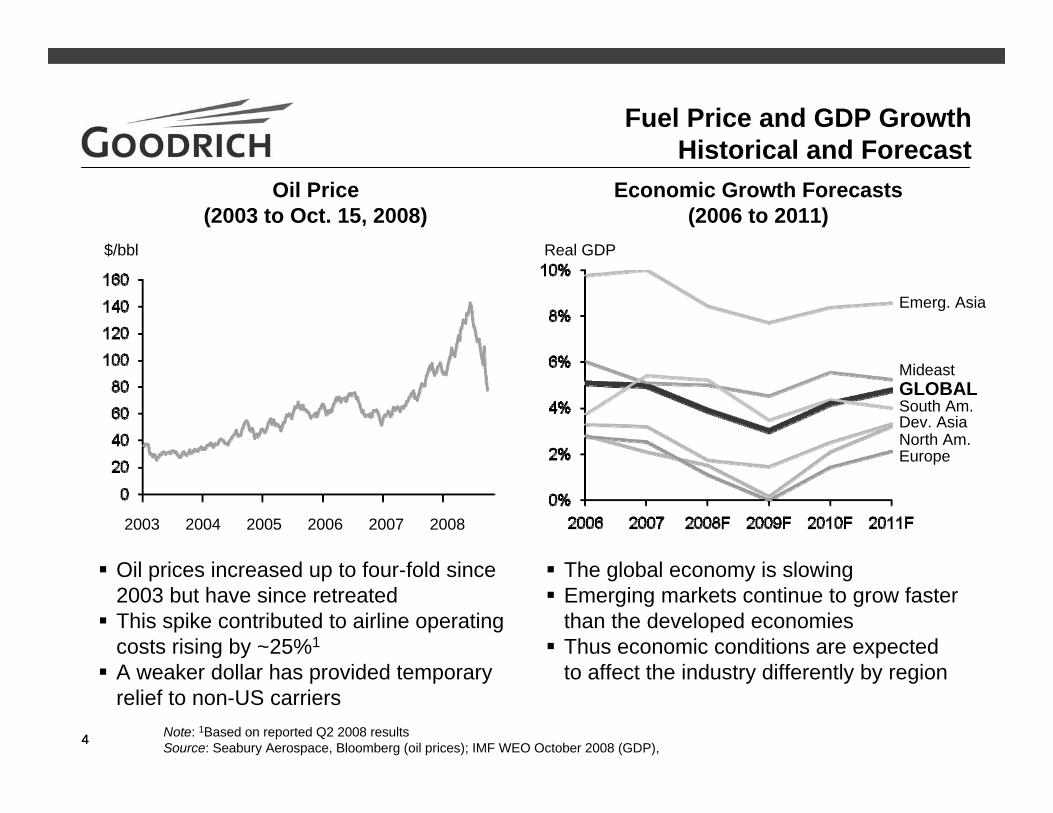
Oil Price(2003 to Oct. 15, 2008)
Economic Growth Forecasts(2006 to 2011)
Oil prices increased up to four-fold since 2003 but have since retreatedThis spike contributed to airline operating costs rising by ~25%1
A weaker dollar has provided temporary relief to non-US carriers
The global economy is slowingEmerging markets continue to grow faster than the developed economiesThus economic conditions are expected to affect the industry differently by region
Note: 1Based on reported Q2 2008 resultsSource: Seabury Aerospace, Bloomberg (oil prices); IMF WEO October 2008 (GDP),
2003 2004 2005 2006 2007 2008
EuropeNorth Am.Dev. AsiaSouth Am.GLOBALMideast
Emerg. Asia
$/bbl Real GDP
5
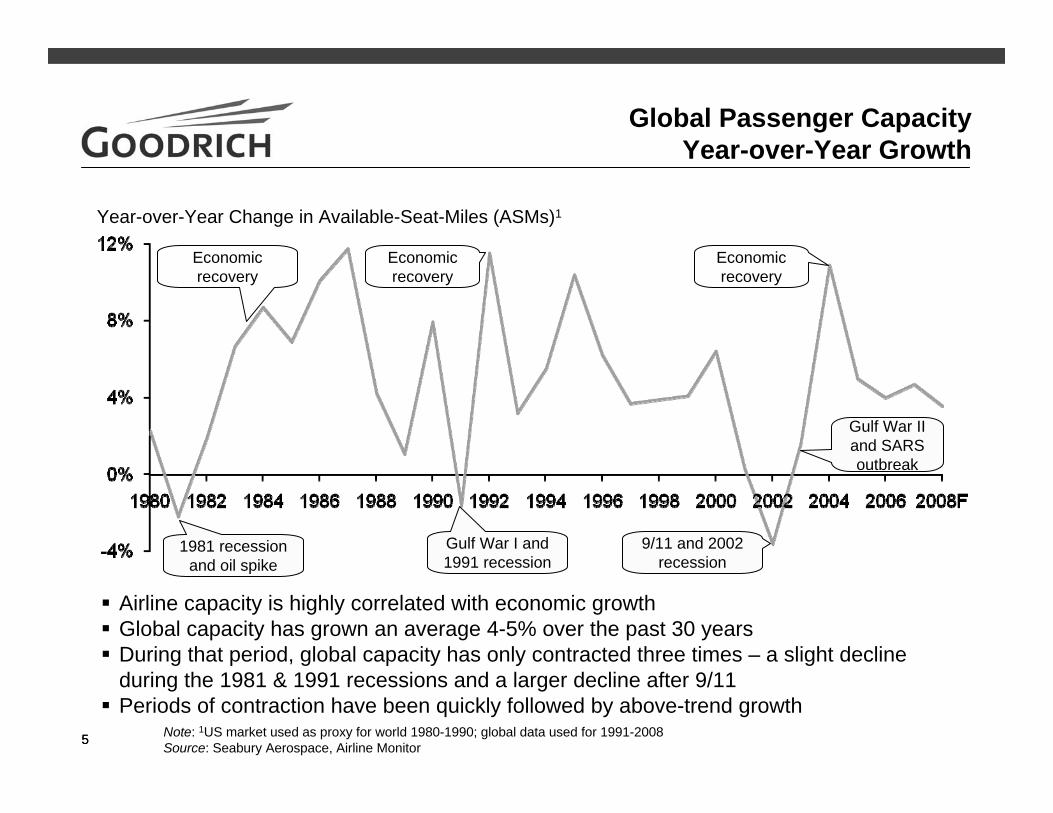
Airline capacity is highly correlated with economic growthGlobal capacity has grown an average 4-5% over the past 30 yearsDuring that period, global capacity has only contracted three times – a slight decline during the 1981 & 1991 recessions and a larger decline after 9/11Periods of contraction have been quickly followed by above-trend growth
5
Global Passenger CapacityYear-over-Year Growth
Note: 1US market used as proxy for world 1980-1990; global data used for 1991-2008Source: Seabury Aerospace, Airline Monitor
Year-over-Year Change in Available-Seat-Miles (ASMs)1
1981 recession and oil spike
Economic recovery
Gulf War I and 1991 recession
9/11 and 2002 recession
Gulf War II and SARS outbreak
Economic recovery
Economic recovery

66
Global Passenger Capacity2007-2009 Growth
Note: Scheduled passenger capacity onlySource: Seabury Aerospace
For most of 2008, capacity was increasing near historical averageRising fuel prices drove airlines to cut capacity in the backend of 2008Impact of capacity cuts are expected to be fully felt in 2009 as carriers maintain implemented cuts due to operational constraints and concerns about slowing demand
‐4%
‐2%
0%
2%
4%
6%
8%
2008F vs. 2007 2009F vs. 2008F
Year-over-year change in Available-Seat-Miles (ASMs)
Q12008
Q22008
Q32008 Q4
2008
Full Year 2008
Q12009
Q22009
Q32009
Q42009
Full Year 2009

77
Expected Aircraft Retirements2008-2009
1Expected retirements from Nov. 2008 to end of Nov. 2009Note: Scheduled passenger aircraft only; excludes potential for later return-to-serviceSource: Seabury Aerospace, Announced capacity cuts
As a result, airlines continue to ground aircraftAlmost all announced and implemented capacity cuts have been old-gen aircraftMD80/90, DC9, and 737-300 aircraft continue to be attractive to replace at lower oil pricesDespite the decline in oil prices, airlines have reaffirmed many of their retirement plans
Aircraft1
773
943
170
88
Capacity By Region2007-2009 Growth
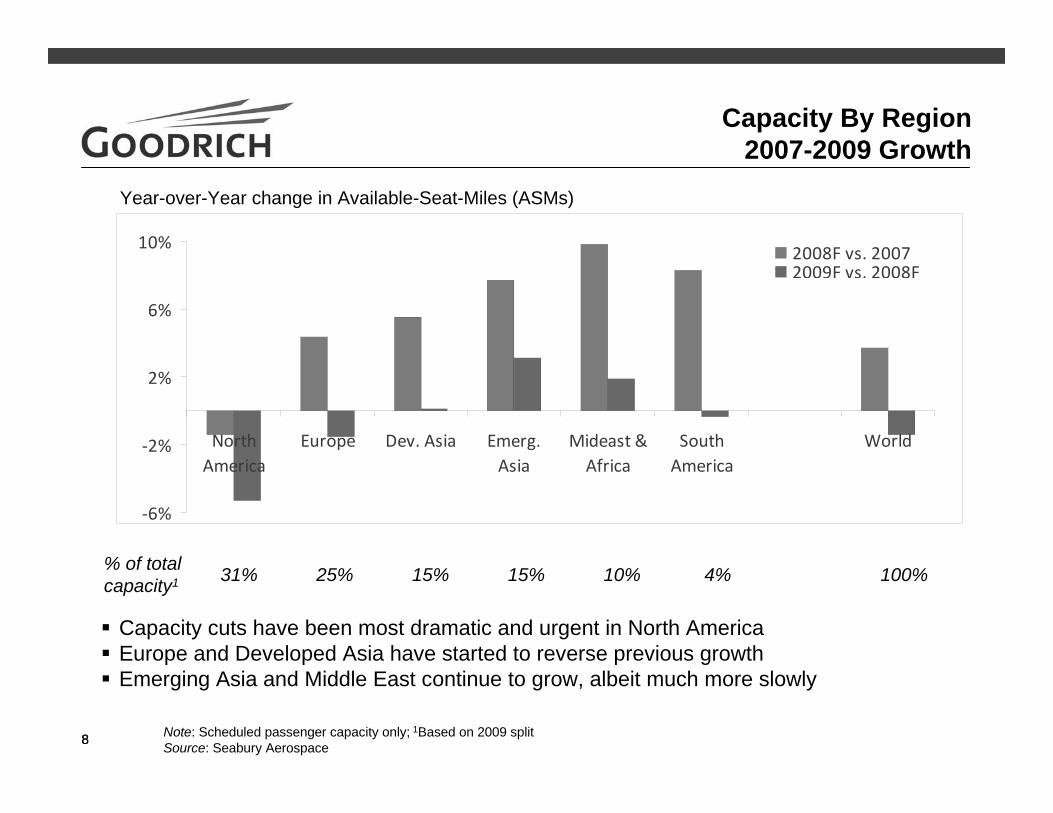
Note: Scheduled passenger capacity only; 1Based on 2009 splitSource: Seabury Aerospace
Capacity cuts have been most dramatic and urgent in North AmericaEurope and Developed Asia have started to reverse previous growthEmerging Asia and Middle East continue to grow, albeit much more slowly
‐6%
‐2%
2%
6%
10%
NorthAmerica
Europe Dev. Asia Emerg.Asia
Mideast &Africa
SouthAmerica
World
2008F vs. 20072009F vs. 2008F
Year-over-Year change in Available-Seat-Miles (ASMs)
31% 25% 15% 15% 10% 4%% of total capacity1 100%

99
Large Commercial AircraftEstimated Capacity Growth from 2008 to 2009
Note: Scheduled passenger capacity excluding regional jets; 1Based on 2009 daily average excluding A380 and 787 which remain small share; 2Excludes impact of continued Boeing strikeSource: Seabury Aerospace
In-production aircraft are not targeted for grounding to achieve desired capacity cutsIn-production aircraft utilization rates have not dropped and are unlikely to fall2009 production rates have only been slightly adjusted by OEMs2
Therefore, in-production ASMs are expected to continue to grow and gain share of global capacity
In-Production Slowing or Recently Out-of-Production
Long Out-of-ProductionYear-over-Year change in Available-Seat-Miles (ASMs)
% of total capacity1 20% 16% 15% 9% 9% 7% 6% 5% 6% 3% 1% 1% 2%
60% 27% 13% (After '08/'09 retirements)
10
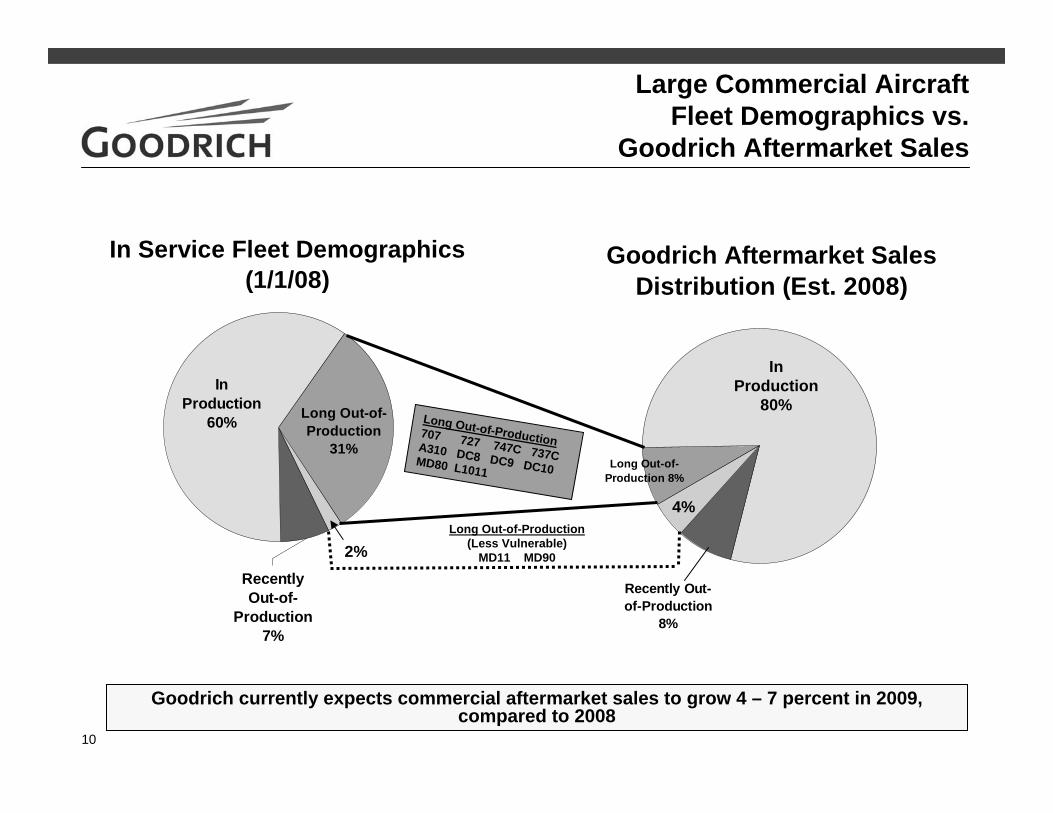
Large Commercial AircraftFleet Demographics vs.
Goodrich Aftermarket Sales
In Service Fleet Demographics (1/1/08)
Recently Out-of-
Production 7%
In Production
60% Long Out-of-Production
31%
Goodrich currently expects commercial aftermarket sales to grow 4 – 7 percent in 2009, compared to 2008
Goodrich Aftermarket Sales Distribution (Est. 2008)
Long Out-of-Production 8%
Recently Out-of-Production
8%
Long Out-of-Production707 727 747C 737CA310 DC8 DC9 DC10MD80 L1011
Long Out-of-Production(Less Vulnerable)
MD11 MD90
4%
2%
InProduction
80%
11
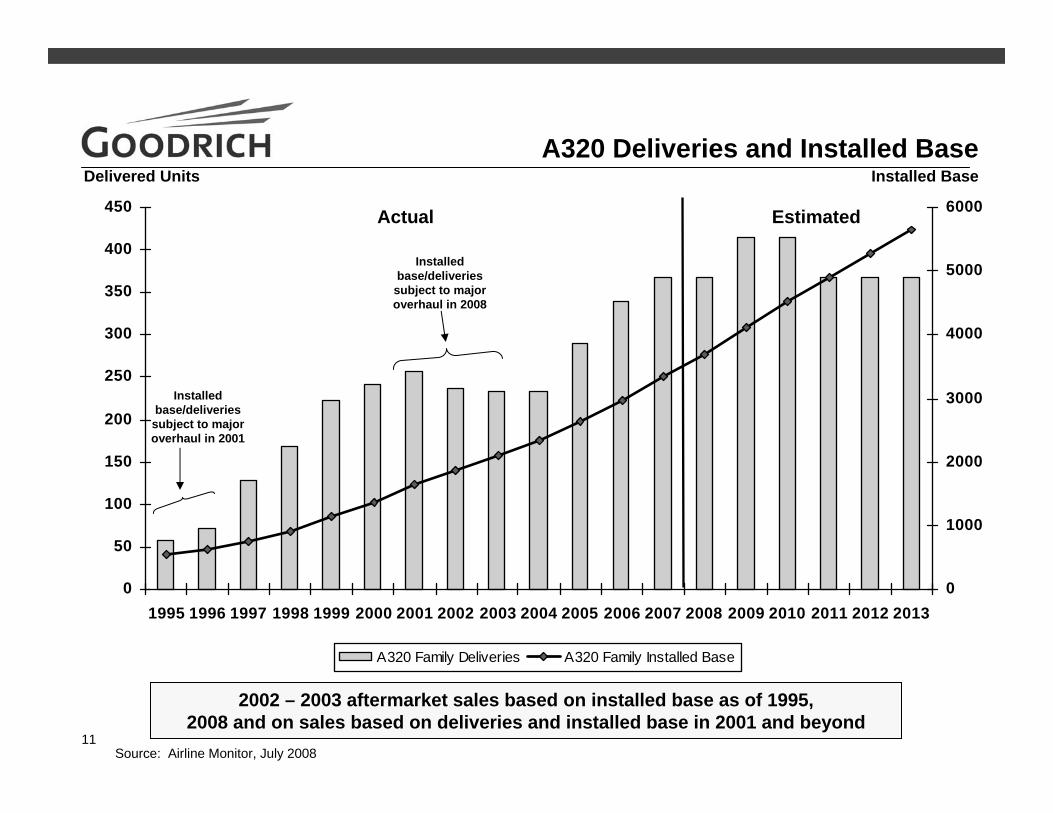
A320 Deliveries and Installed Base
0
50
100
150
200
250
300
350
400
450
1995 1996 1997 1998 1999 2000 2001 2002 2003 2004 2005 2006 2007 2008 2009 2010 2011 2012 20130
1000
2000
3000
4000
5000
6000
A320 Family Deliveries A320 Family Installed Base
Actual Estimated
Delivered Units
2002 – 2003 aftermarket sales based on installed base as of 1995, 2008 and on sales based on deliveries and installed base in 2001 and beyond
Installed Base
Installed base/deliveries subject to major overhaul in 2001
Installed base/deliveries
subject to major overhaul in 2008
Source: Airline Monitor, July 2008

12
Large Commercial Airplane Delivery Forecast
0
200
400
600
800
1,000
1,200
2002 2003 2004 2005 2006 2007 2008 2009 2010 2011 2012 2013
Uni
ts
Actuals Goodrich outlook
OEMs have only slightly adjusted production growth rates, and are maintaining discipline in managing the downturnRecord backlogs also afford flexibility, with some airlines seeking earlier delivery slots while others look to deferDemand remains high in Middle East and China (and strongest European and American carriers)
Potential Impact of Boeing Strike

13
Financial and Operational Highlights

14
Third Quarter 2008 Highlights
Increased quarterly dividend to $0.25 per share, an 11 percent increase over the previous quarterly dividend of $0.225 per share of common stock
Received a contract from the U.S. Army to provide up to 1,000 Vehicle Health Management Systems for UH-60A/L Black Hawk helicopters
The five-year Indefinite Delivery, Indefinite Quantity contract is valued at up to $300 million and covers deliveries through 2013
Selected by Airbus to supply the air data system and ice detection system for the new A350 XWB commercial aircraft
The awards are expected to generate more than $600 million in original equipment and aftermarket revenue over 20 years
Goodrich and Rolls-Royce signed a Letter of Intent proposing the formation of a joint venture company which would develop and supply engine controls for Rolls-Royce aero engines
Goodrich would retain the aftermarket products and services business associated with the joint venture's productsExpect to complete the JV around year-end 2008
15
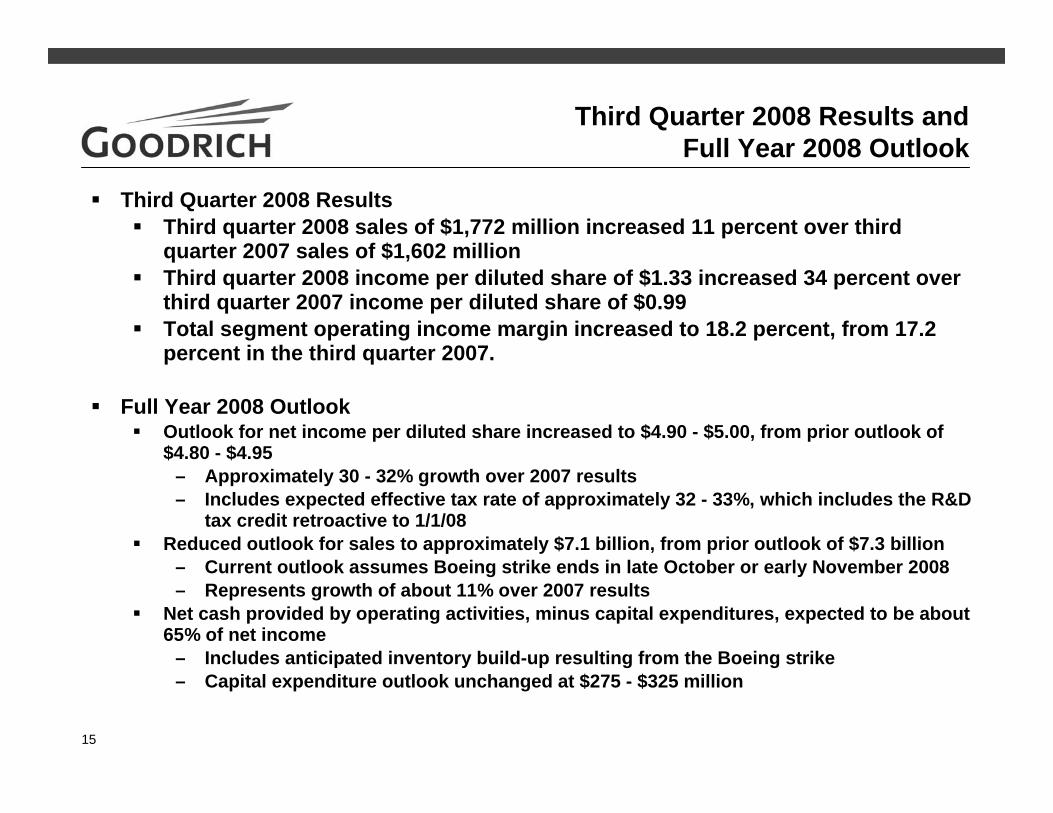
Third Quarter 2008 Results andFull Year 2008 Outlook
Third Quarter 2008 ResultsThird quarter 2008 sales of $1,772 million increased 11 percent over third quarter 2007 sales of $1,602 million Third quarter 2008 income per diluted share of $1.33 increased 34 percent over third quarter 2007 income per diluted share of $0.99 Total segment operating income margin increased to 18.2 percent, from 17.2 percent in the third quarter 2007.
Full Year 2008 OutlookOutlook for net income per diluted share increased to $4.90 - $5.00, from prior outlook of $4.80 - $4.95
– Approximately 30 - 32% growth over 2007 results– Includes expected effective tax rate of approximately 32 - 33%, which includes the R&D
tax credit retroactive to 1/1/08Reduced outlook for sales to approximately $7.1 billion, from prior outlook of $7.3 billion
– Current outlook assumes Boeing strike ends in late October or early November 2008– Represents growth of about 11% over 2007 results
Net cash provided by operating activities, minus capital expenditures, expected to be about 65% of net income
– Includes anticipated inventory build-up resulting from the Boeing strike– Capital expenditure outlook unchanged at $275 - $325 million

16
Full Year 2009 Outlook
Full Year 2009 OutlookSales outlook of $7.7 - $7.8 billion – approximately 8 - 10% growth over expected 2008 results
– Large commercial OE sales expected to increase about 20%Assuming the Boeing strike is over in late October or early November
– Large commercial, regional business and general aviation aftermarket sales expected to increase 4 – 7%
Outlook for net income and income per diluted share from continuing operations of $5.05 - $5.25 - approximately 2 - 8% growth over expected 2008 results, including:
– Higher pension expense of up to $0.27 per share– Full year 2009 tax rate of about 33%– Unfavorable foreign exchange translation costs of $0.06– Closing of the Rolls-Royce joint venture around year-end 2008
Net cash provided by operating activities, minus capital expenditures, expected to be greater than 75% of net income

17
Delivering Sustained Sales Growthand Margin Expansion
3,000
3,500
4,000
4,500
5,000
5,500
6,000
6,500
7,000
7,500
Q42004
Q22005
Q42005
Q22006
Q42006
Q22007
Q42007
Q22008
0.0%
2.0%
4.0%
6.0%
8.0%
10.0%
12.0%
14.0%
16.0%
18.0%
Q42004
Q22005
Q42005
Q22006
Q42006
Q22007
Q42007
2Q2008
$M$M Sales(Trailing Four Qtrs.) Segment Operating Income Margins
(Trailing Four Qtrs.)
18
Year-over-Year Financial Results

19
21%34%
20%32%
+1.0%
17%
11%
Change
$1.10$0.99
$1.33$1.33
Diluted EPS- Continuing Operations- Net Income
$140$127
$168$168
Income- Continuing Operations- Net Income
$276$322Segment operating income
17.2%18.2%- % of Sales
$1,602$1,772Sales
3rd Qtr 2007
3rd Qtr2008(Dollars in Millions, excluding EPS)
Third Quarter 2008 – Financial SummaryYear-over-Year Performance

20
40%47%
39%46%
+1.4%
23%
14%
Change
$2.84$2.75
$3.97$4.03
Diluted EPS- Continuing Operations- Net Income
$363$351
$505$513
Income- Continuing Operations- Net Income
$762$940Segment operating income
16.1%17.5%- % of Sales
$4,724$5,367Sales
1st Nine Months
2007
1st Nine Months
2008(Dollars in Millions, excluding EPS)
First Nine Months 2008 – Financial SummaryYear-over-Year Performance
21
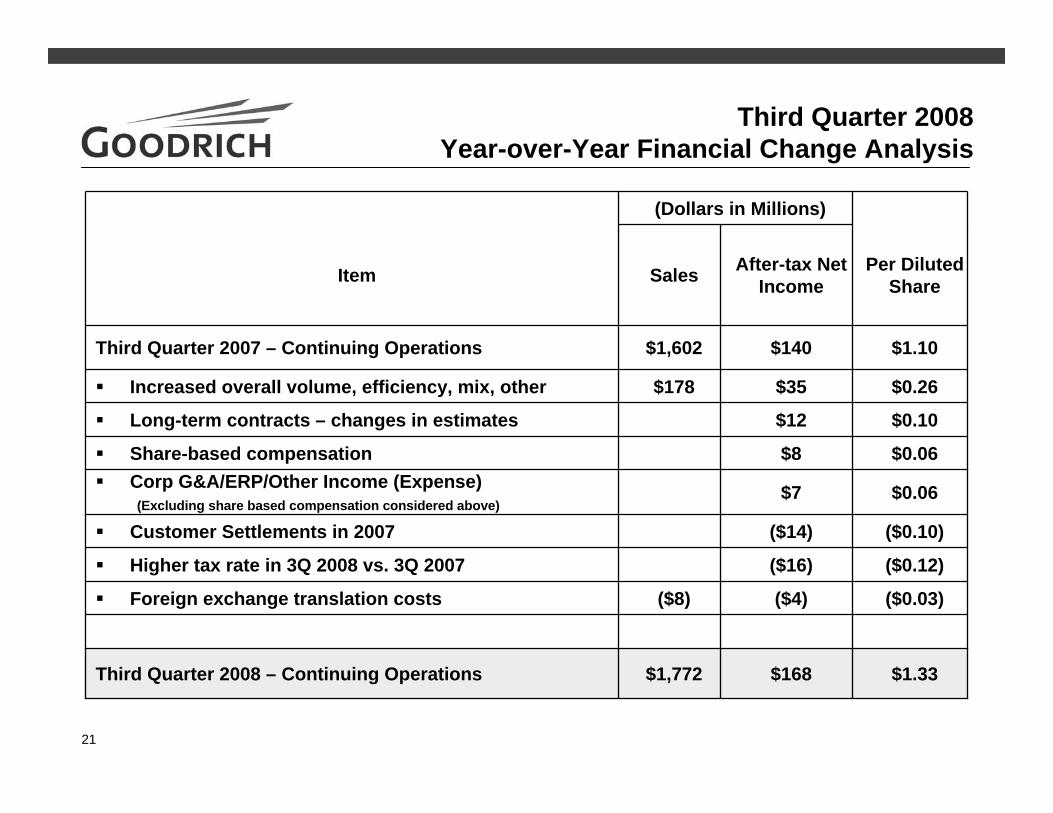
Third Quarter 2008Year-over-Year Financial Change Analysis
($0.12)($16)Higher tax rate in 3Q 2008 vs. 3Q 2007
$0.06$7Corp G&A/ERP/Other Income (Expense)(Excluding share based compensation considered above)
$0.06$8Share-based compensation
$0.10$12Long-term contracts – changes in estimates
$0.26$35$178Increased overall volume, efficiency, mix, other
($0.03)($4)($8)Foreign exchange translation costs
($0.10)($14)Customer Settlements in 2007
$1.33$168$1,772Third Quarter 2008 – Continuing Operations
(Dollars in Millions)
$1,602
Sales
$1.10$140Third Quarter 2007 – Continuing Operations
Per Diluted Share
After-tax Net IncomeItem

22
Third Quarter 2008 Year-over-Year Segment Results
12.0%27.2%15.5%18.2%
$ 80.0$162.4$ 79.3$321.7
$ 664.2$ 596.5$ 511.6$1,772.3
3rd Quarter2008 %$Dollars in Millions
(0.1%)+0.9%+2.4%+1.0%
N/AN/AN/AN/A
12.1%26.3%13.1%17.2%
Segment MarginActuation and Landing SystemsNacelles and Interior SystemsElectronic Systems
Overall Segment Margin
9%13%35%17%
$ 6.4$18.8$20.6$45.8
$ 73.6$143.6$ 58.7$275.9
Segment OIActuation and Landing SystemsNacelles and Interior SystemsElectronic Systems
Total Segment OI
9%9%
14%11%
$ 56.4$ 51.3$ 62.9$170.6
$ 607.8$ 545.2$ 448.7$1,601.7
SalesActuation and Landing SystemsNacelles and Interior SystemsElectronic Systems
Total Sales
Change3rd Quarter2007

23
First Nine Months 2008 Year-over-Year Segment Results
11.7%26.7%13.8%17.5%
$238.6$501.9$199.8$940.3
$2,035.9$1,882.1$1,448.6$5,366.6
1st Nine Months2008 %$Dollars in Millions
+1.4%+1.8%+0.6%+1.4%
N/AN/AN/AN/A
10.3%24.9%13.2%16.1%
Segment MarginActuation and Landing SystemsNacelles and Interior SystemsElectronic Systems
Overall Segment Margin
31%24%14%23%
$ 56.6$ 97.2$ 24.1$177.9
$182.0$404.7$175.7$762.4
Segment OIActuation and Landing SystemsNacelles and Interior SystemsElectronic Systems
Total Segment OI
15%16%9%
14%
$271.8$256.3$114.1$642.2
$1,764.1$1,625.8$1,334.5$4,724.4
SalesActuation and Landing SystemsNacelles and Interior SystemsElectronic Systems
Total Sales
Change1st Nine Months2007

24
Summary Cash Flow Information
($13)($81)Pension Contributions - worldwide
$87($51)Accrued expenses, other (including pension contributions)
($66)($73)Capital Expenditures
$141
$31
($72)
$65
$168
3rd Quarter2008
$214
--
($67)
$67
$127
3rd Quarter 2007
Cash Flow from Operations
Deferred income taxes and taxes payable
Working Capital – (increase)/decrease – defined as the sum of A/R, Inventory and A/P
Depreciation and Amortization
Net Income
Item(Dollars in Millions)

25
Sales by Market Channel
26
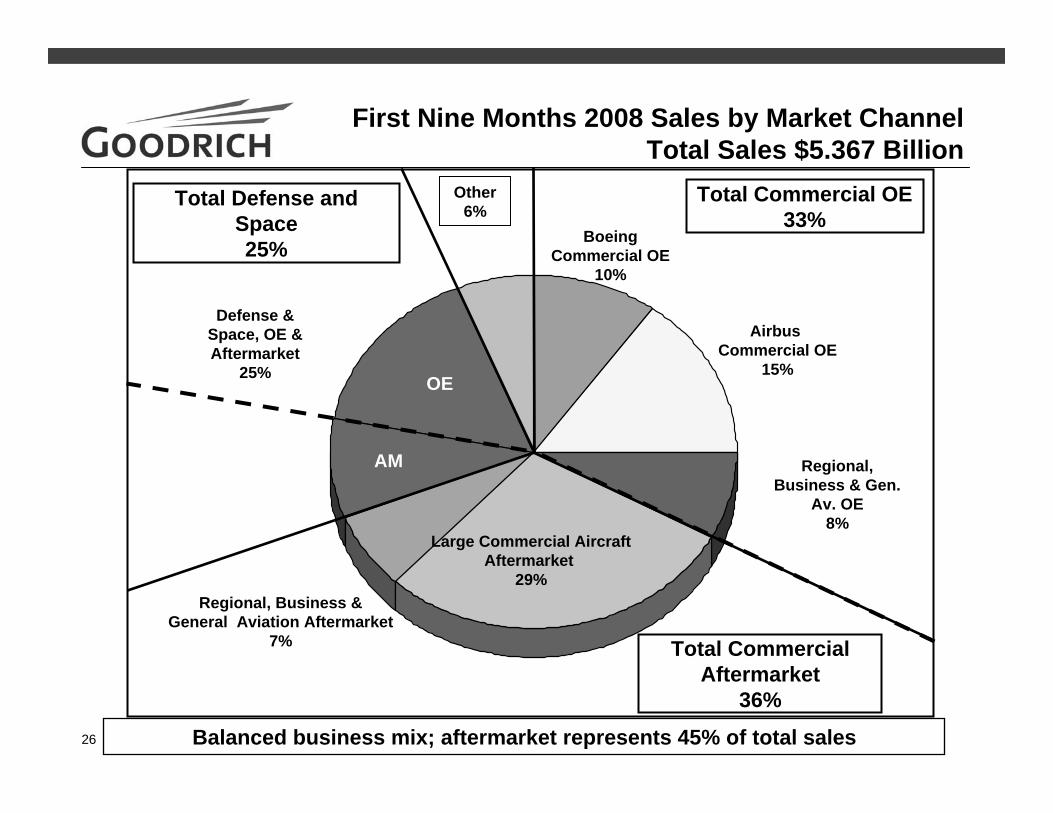
First Nine Months 2008 Sales by Market ChannelTotal Sales $5.367 Billion
Large Commercial AircraftAftermarket
29%Regional, Business &
General Aviation Aftermarket7%
Boeing Commercial OE
10%
Airbus Commercial OE
15%
Defense & Space, OE & Aftermarket
25%
Other 6%
OE
AM
Balanced business mix; aftermarket represents 45% of total sales
Regional, Business & Gen.
Av. OE8%
Total Commercial Aftermarket
36%
Total Commercial OE33%
Total Defense and Space25%
27
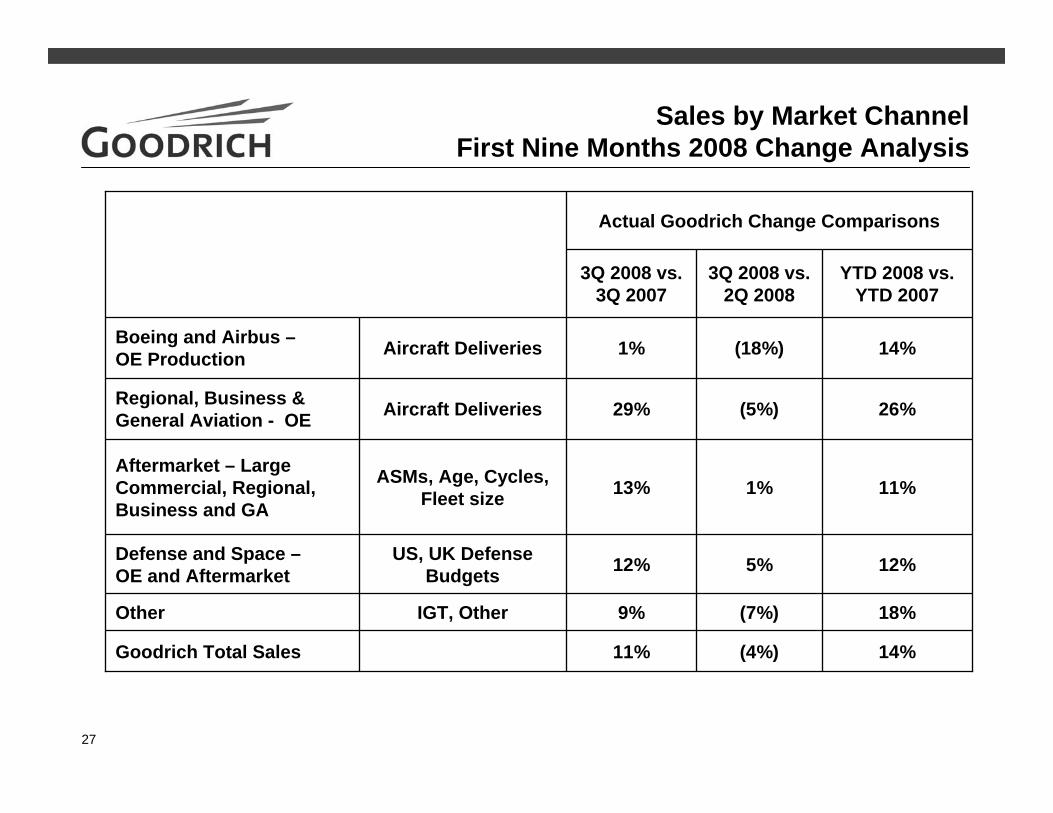
Sales by Market Channel First Nine Months 2008 Change Analysis
11%
9%
12%
13%
29%
1%
3Q 2008 vs. 3Q 2007
(4%)
(7%)
5%
1%
(5%)
(18%)
3Q 2008 vs. 2Q 2008
Actual Goodrich Change Comparisons
YTD 2008 vs. YTD 2007
IGT, Other
US, UK Defense Budgets
ASMs, Age, Cycles, Fleet size
Aircraft Deliveries
Aircraft Deliveries
12%Defense and Space –OE and Aftermarket
18%Other
26%Regional, Business & General Aviation - OE
14%Goodrich Total Sales
11%Aftermarket – Large Commercial, Regional, Business and GA
14%Boeing and Airbus –OE Production

28
2009 Outlook

29
2008 Sales ExpectationsBy Market Channel
~11%
~14%
~11%
~9 - 11%
~20%
~5 - 10%*
2008 Goodrich Expected Growth
8 – 10%
2 – 5%
5 – 7%
4 – 7%
7 – 8%
~20%*
2009 Goodrich Expected Growth
14%Other6%
7%Defense and Space OE and Aftermarket
25%
12%
16%
20%
8%
2007 Goodrich Actual Growth
Total 100%
Aftermarket (Commercial/Regional/Bus/GA)
36%
Regional/Bus/GA OE (Weighted)
8%
MarketFull Year 2007
Sales Mix
Boeing OE Del.Airbus OE Del.
Total (GR Weight)
10%15%25%
* Dependent on length of Boeing Strike
30
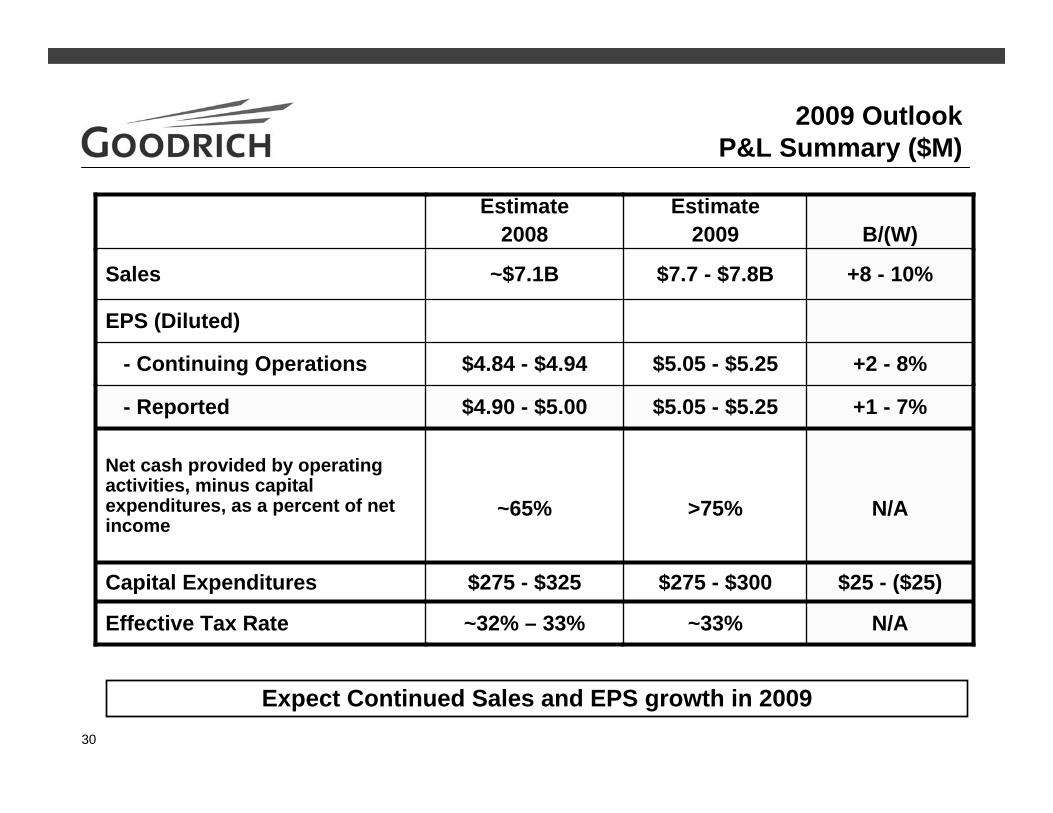
2009 OutlookP&L Summary ($M)
$25 - ($25)$275 - $300$275 - $325Capital Expenditures
N/A>75%~65%
Net cash provided by operating activities, minus capital expenditures, as a percent of net income
N/A~33%~32% – 33%Effective Tax Rate
+1 - 7%$5.05 - $5.25$4.90 - $5.00- Reported
+2 - 8%$5.05 - $5.25$4.84 - $4.94- Continuing Operations
EPS (Diluted)
+8 - 10%$7.7 - $7.8B~$7.1BSales
B/(W)Estimate
2009Estimate
2008
Expect Continued Sales and EPS growth in 2009