Embed Size (px)
Citation preview

Four Coliseum Centre 2730 West Tyvola Road
Charlotte, NC 28217-4578 USA
+1 704-423-7000 | www.goodrich.com
Goodrich C
orporation Annual R
eport 200
6
Goodrich Corporation Annual Report 2006
right attitude.right approach.right alongside. We’re on it.™
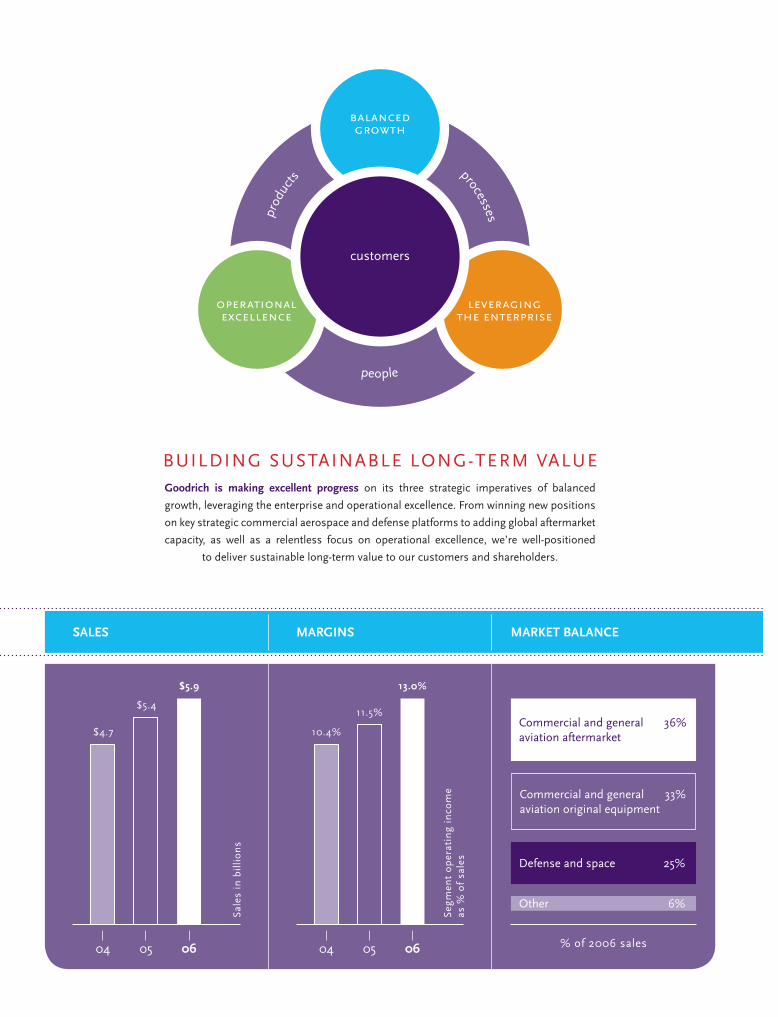
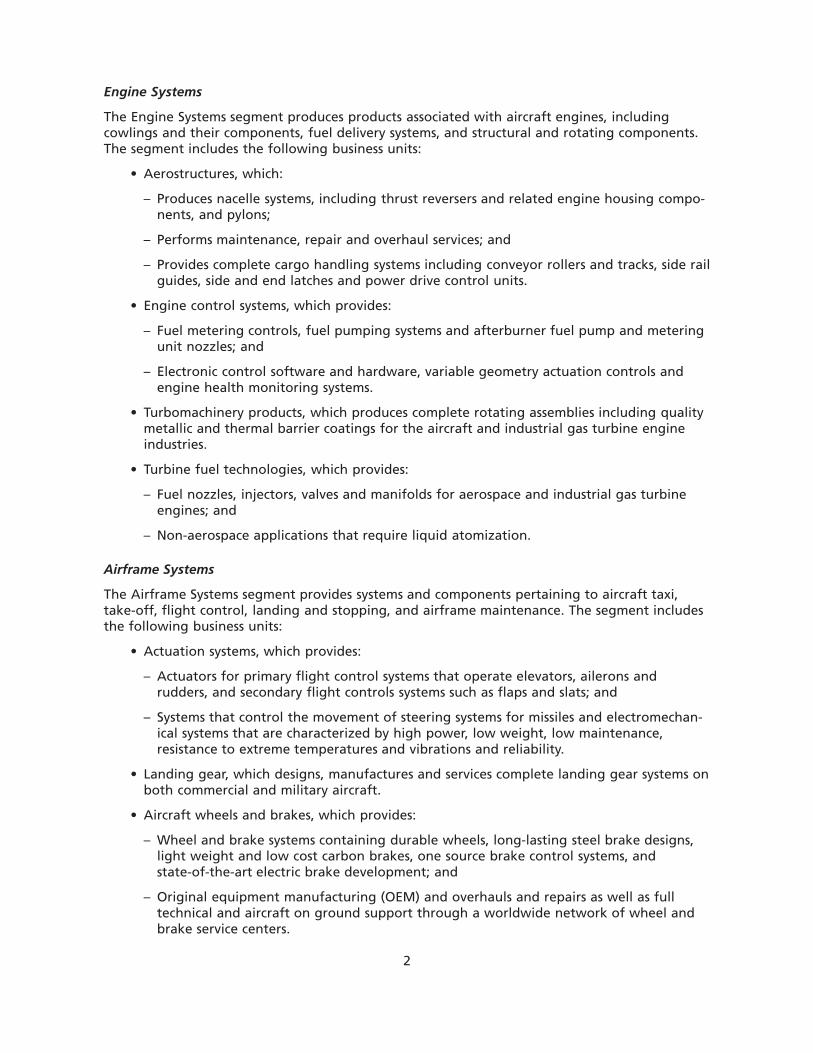
BUildiNG SUSTAiNABle loNG-TeRm VAlUegoodrich is making excellent progress on its three strategic imperatives of balanced
growth, leveraging the enterprise and operational excellence. From winning new positions
on key strategic commercial aerospace and defense platforms to adding global aftermarket
capacity, as well as a relentless focus on operational excellence, we’re well-positioned
to deliver sustainable long-term value to our customers and shareholders.
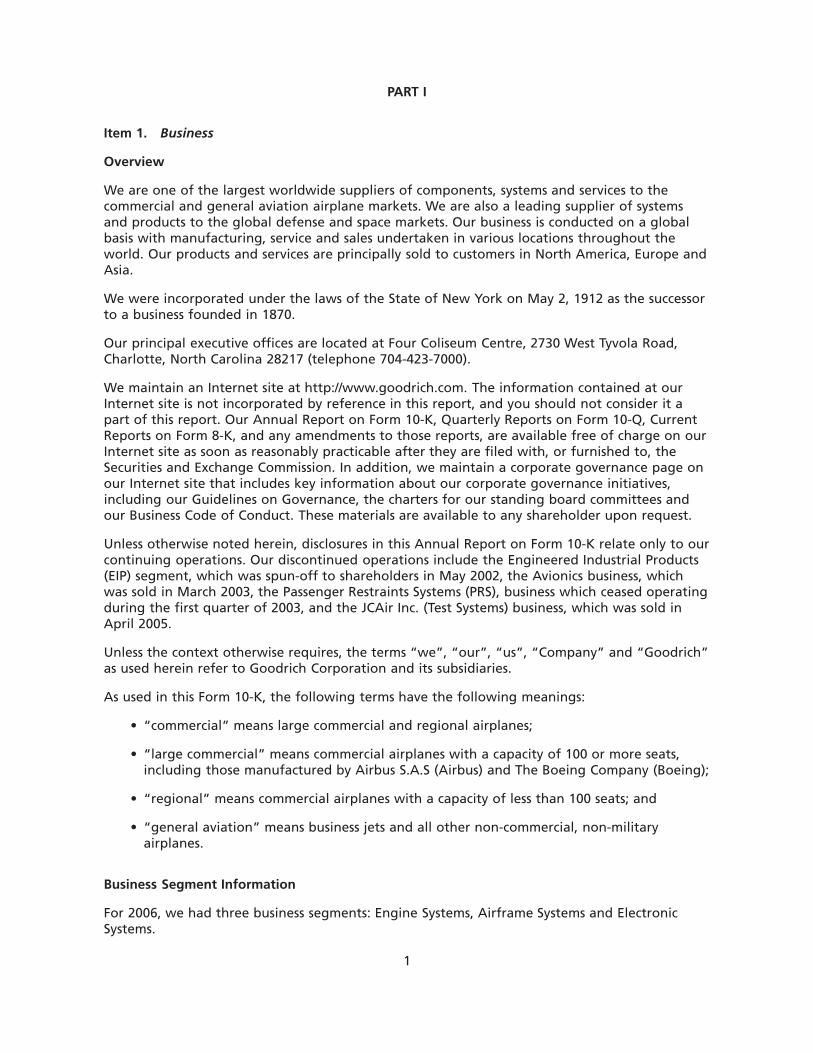
Commercial and general 36% aviation aftermarket
Commercial and general 33% aviation original equipment
defense and space 25%
other 6%
% of 2006 sales04
Sal
es i
n b
illi
on
s
$4.7
$5.4
05
$5.9
06 04
Seg
men
t o
per
atin
g in
com
e
as %
of
sale
s
10.4%
11.5%
05
13.0%
06
desi
gned
and
pro
duce
d by
see
see
eye
/ A
tlant
a, G
eorg
ia
annual Meetingour annual meeting of shareholders will be held at the Goodrich Corporate Headquarters, Four Coliseum Centre, 2730 West Tyvola Road, Charlotte, North Carolina, U.S.A. on April 24, 2007 at 10:00 a.m. The meeting notice and proxy materials were mailed to shareholders with this report.
shareholder servicesif you have questions concerning your account as a shareholder, dividend payments, lost certificates and other related items, please contact our transfer agent:
The Bank of New York Shareholder Relations dept. P.o. Box 11258 Church Street Station New York, N.Y. 10286-1258 1-866-557-8700 (United States, Canada and Puerto Rico) 1-212-815-3700 (outside the continental United States) 1-888-269-5221 (Hearing impaired / Tdd Phone) e-mail: [email protected]
The Bank of New York’s Shareholder Services website can be located at https://www.stockbny.com. Registered shareholders can access their account online and review account holdings, transaction history and check history. in addition, the site offers an extensive Q&A, instructions on the direct purchase, sale and transfer of plan shares and information about dividend reinvestment plans. Shareholders also can download frequently used forms.
stock transfer and address changesPlease send certificates for transfer and address changes to:
The Bank of New York Receive and deliver dept. P.o. Box 11002 Church Street Station New York, N.Y. 10286-1002
investor relationsSecurities analysts and others seeking financial information should contact:
Paul S. Gifford, Vice President of investor Relations Goodrich Corporation Four Coliseum Centre 2730 West Tyvola Road Charlotte, North Carolina 28217-4578 U.S.A. +1 704-423-5517 e-mail: [email protected]
To request an Annual Report, Proxy Statement, 10-K, 10-Q or quarterly earnings release, visit our website at www.goodrich.com or call +1 704-423-7103. All other press releases are available on our website.
annual report on Form 10-Kour 2006 Annual Report on Form 10-K is available on our website at www.goodrich.com. We will also provide a copy of our 2006 Annual Report on Form 10-K (without exhibits) at no charge upon written request addressed to our Vice President of investor Relations.
affirmative actionWe hire, train, promote, compensate and make all other employment decisions without regard to race, sex, age, religion, national origin, disability, veteran or disabled veteran status or other protected classifications. We have affirmative action programs in place in accordance with executive order 11246 and other federal laws and regulations to ensure equal employment opportunity for our employees.
SHAReHoldeR iNFoRmATioN
stock exchange listingGoodrich common stock is listed on the New York Stock exchange (Symbol: GR). options to acquire our common stock are traded on the Chicago Board options exchange.
The following table sets forth on a per share basis the high and low sales prices for our common stock for the periods indicated as reported on the New York Stock exchange composite transactions reporting system, as well as the cash dividends declared on our common stock for these periods.
2006
Quarter high low dividend
First $ 44.00 $ 37.34 $ .20second 47.45 37.15 .20third 42.14 37.25 .20Fourth 46.48 40.08 .20
2005
Quarter High low dividend
First $ 39.11 $ 30.11 $ .20Second 42.98 36.45 .20Third 45.82 40.25 .20Fourth 44.99 33.60 .20
As of december 31, 2006, there were approximately 8,736 holders of record of our common stock.
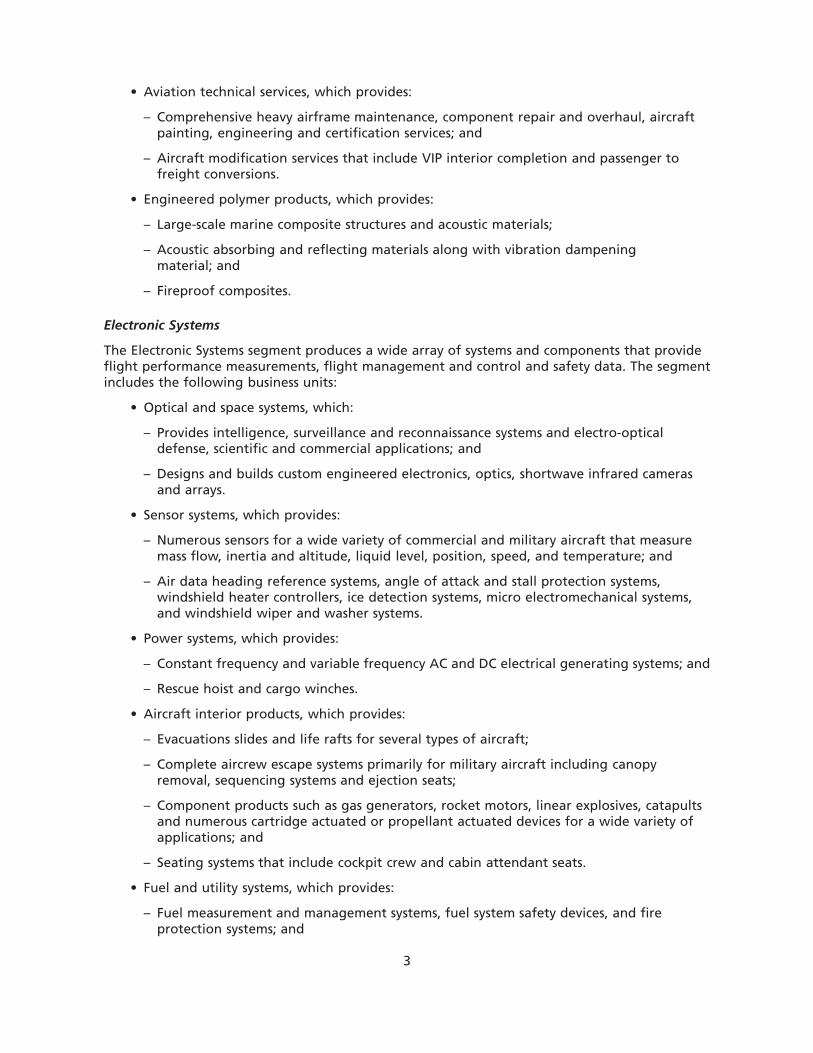
cumulative total shareholder return performance graphSet forth below is a line graph showing the yearly percentage change in the cumulative total shareholder return for our Common Stock with the similar returns for the Standard & Poor’s 500 Stock index and the Standard & Poor’s 500 Aerospace & defense index. each of the returns is calculated assuming the investment of $100 in each of the securities on december 31, 2001 and reinvestment of dividends into additional shares of the respective equity securities when paid.
Margins MarKet balancesales
operational excellence
leveraging the enterprise
balanced growth
people
prod
ucts
customers
processes
$50
$100
$150
$200
$250Goodrich Corp.S&P 500 Aerospace & DefenseS&P 500 Index
12/0612/0512/0412/0312/0212/01
Base PeriodCompany/index dec. 01 dec. 02 dec. 03 dec. 04 dec. 05 dec. 06
Goodrich Corp. 100 74.59 125.66 141.75 181.99 205.58
S&P 500 index 100 77.90 100.25 111.15 116.61 135.03
S&P 500 Aerospace & defense 100 94.86 116.77 135.45 157.02 196.53
Go
od
rich C
orp
oratio
n
For the years 2006 2005 % Changedollars in millions, except per share amounts
Sales $ 5,878 $ 5,397 9 %
Segment operating income $ 761 $ 622 22 %
Segment operating margins 13.0 % 11.5 %
Net income $ 482 $ 264 83 %
Net cash from operations $ 276 $ 345 (20)%
Net income per share:
Basic $ 3.88 $ 2.17 79 %
Diluted $ 3.81 $ 2.13 79 %
Dividends per share $ 0.80 $ 0.80
Shares outstanding (millions)* 125.0 123.1
* Excluding 14,000,000 shares held by a wholly-owned subsidiary
Dear Fellow Shareholders:2006 was a very successful year for Goodrich. We continued to build on our
market leadership positions with strategic new business wins in both the
commercial aerospace and defense market sectors. Our strategy to achieve
top quartile aerospace results through balanced growth, leveraging the
enterprise and operational excellence is working.
We expect that the robust market for commercial aerospace and
defense products will continue for several years. The strength in our
commercial aerospace markets and our relentless focus on operational excellence led to higher sales and
significantly improved earnings in 2006. This is the third consecutive year that we have achieved both sales
and earnings growth. Our margins are increasing steadily – segment operating income margins improved from
11.5% of sales in 2005 to 13.0% in 2006, and we are on track to achieve margins of at least 15% by 2009. We
continue to invest in our businesses and expect these investments to deliver sustainable long-term growth.
Operational excellence continued to be a key strategic focus for us in 2006. Our entire enterprise
is focused on achieving world-class levels of delivery and quality performance by 2009. Our global supply
chain management effort is gaining traction, and we are increasing our own engineering and manufacturing
Marshall O. Larsen
Chairman, President and Chief Executive Officer
FiNaNCiaL hiGhLiGhTS
Continued on following page
an
nu
al R
epo
rt 2
00
6
capabilities in low-cost countries. The organizational realignment that we announced in December 2006 is
expected to enable us to accelerate our progress in this important area.
in 2006, we welcomed a new member to the Goodrich Board of Directors. Lloyd W. Newton, retired
General, U.S. air Force, brings to Goodrich’s Board extensive experience in high-level leadership roles gained
during a distinguished 34-year military career. James R. Wilson, a Director since December 1997, will retire at
the 2007 annual Meeting of Shareholders. his wise counsel and able assistance will be missed.
During the year we placed additional emphasis on the four characteristics that form the basis of our
enterprise culture: ethical behavior, customer-focused improvement, accountability and teamwork, and openness
and trust. One of the cornerstones of our culture is the development of talent – having the right people in the
right place at the right time. Going forward, the combination of strategic investments and operational excellence,
along with developing our talent and a strong enterprise culture, will perpetuate our business.
as we look ahead, our new program wins will require alignment of all of our businesses and a strong
focus on execution. We expect to use our solid market positions to deliver balanced top-line growth. Our entire
organization is concentrating on expanding our margins and accelerating cash flow through leveraging the
enterprise and operational excellence. With our key strategies firmly in place, Goodrich is well-positioned to deliver
sustained growth over the next several years and beyond the eventual peak of new commercial aircraft deliveries.
in closing, i would like to thank our 23,000 employees around the world for working so hard to enhance
customer and shareholder value in 2006.
Marshall O. Larsen Chairman, President and Chief Executive Officer
February 22, 2007
cOMMerciaL and generaL aviatiOn OriginaL equipMentthree Main Market sectOrs
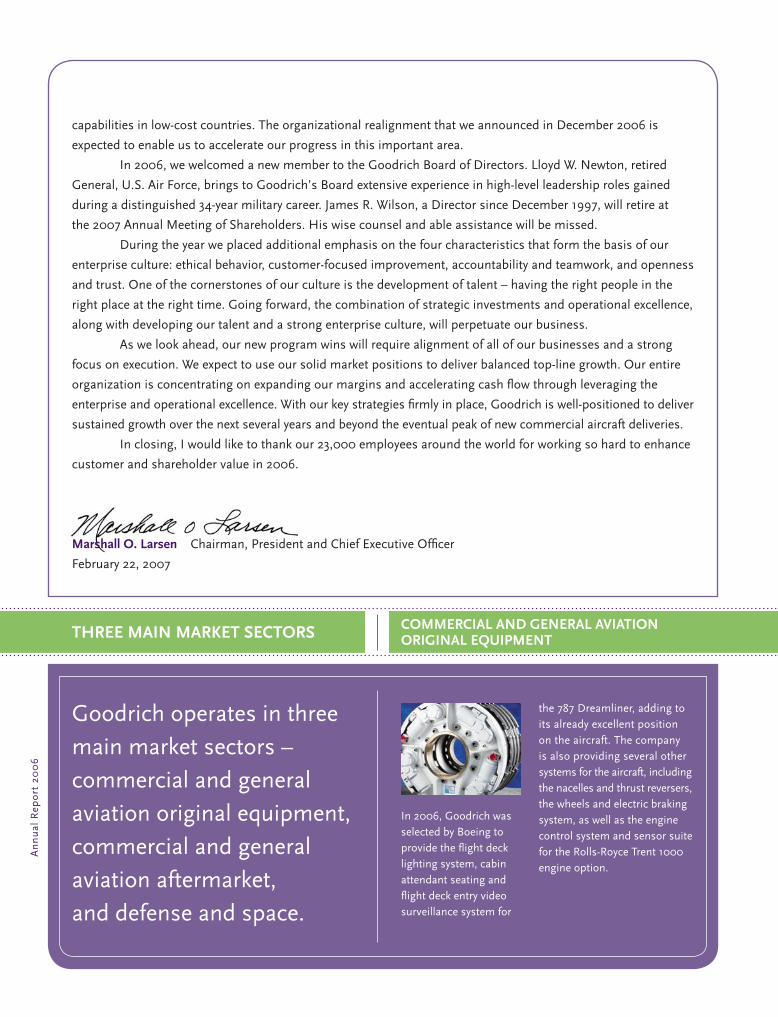
Goodrich operates in three main market sectors – commercial and general aviation original equipment, commercial and general aviation aftermarket, and defense and space.
in 2006, Goodrich was selected by Boeing to provide the flight deck lighting system, cabin attendant seating and flight deck entry video surveillance system for
the 787 Dreamliner, adding to its already excellent position on the aircraft. The company is also providing several other systems for the aircraft, including the nacelles and thrust reversers, the wheels and electric braking system, as well as the engine control system and sensor suite for the Rolls-Royce Trent 1000 engine option.
Go
od
rich C
orp
oratio
n
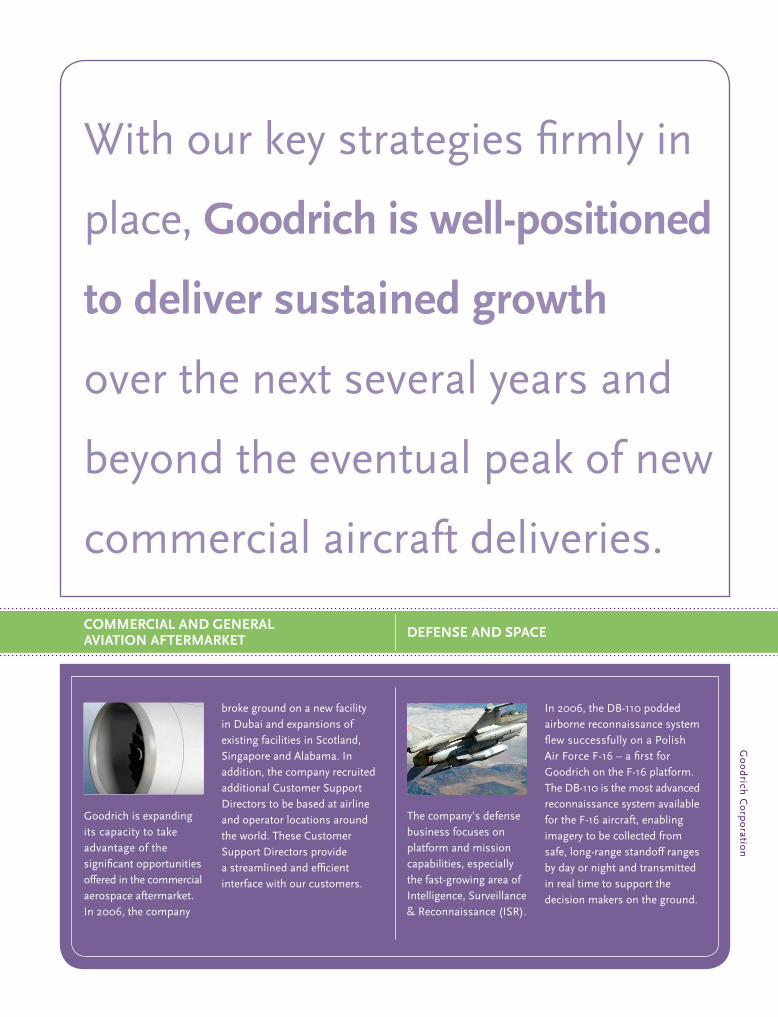
The company’s defense business focuses on platform and mission capabilities, especially the fast-growing area of intelligence, Surveillance & Reconnaissance (iSR).
in 2006, the DB-110 podded airborne reconnaissance system flew successfully on a Polish air Force F-16 – a first for Goodrich on the F-16 platform. The DB-110 is the most advanced reconnaissance system available for the F-16 aircraft, enabling imagery to be collected from safe, long-range standoff ranges by day or night and transmitted in real time to support the decision makers on the ground.
cOMMerciaL and generaL aviatiOn afterMarket defense and space
Goodrich is expanding its capacity to take advantage of the significant opportunities offered in the commercial aerospace aftermarket. in 2006, the company
broke ground on a new facility in Dubai and expansions of existing facilities in Scotland, Singapore and alabama. in addition, the company recruited additional Customer Support Directors to be based at airline and operator locations around the world. These Customer Support Directors provide a streamlined and efficient interface with our customers.
With our key strategies firmly in
place, goodrich is well-positioned
to deliver sustained growth
over the next several years and
beyond the eventual peak of new
commercial aircraft deliveries.
UNITED STATES SECURITIES AND EXCHANGE COMMISSIONWashington, D.C. 20549
Form 10-K¥ ANNUAL REPORT PURSUANT TO SECTION 13 OR 15(d) OF THE
SECURITIES EXCHANGE ACT OF 1934For the fiscal year ended December 31, 2006
Or
n TRANSITION REPORT PURSUANT TO SECTION 13 OR 15(d) OF THESECURITIES EXCHANGE ACT OF 1934For the transition period from to
Commission file number 1-892
GOODRICH CORPORATION(Exact name of registrant as specified in its charter)
New York 34-0252680(State of incorporation) (I.R.S. Employer Identification No.)
Four Coliseum Centre 282172730 West Tyvola Road (Zip Code)
Charlotte, North Carolina(Address of principal executive offices)
Registrant’s telephone number, including area code: (704) 423-7000
SECURITIES REGISTERED PURSUANT TO SECTION 12(b) OF THE ACT:Title of Each Class Name of Each Exchange on Which Registered
Common Stock, $5 par value New York Stock Exchange
SECURITIES REGISTERED PURSUANT TO SECTION 12(g) OF THE ACT: None
Indicate by check mark if the registrant is a well-known seasoned issuer, as defined in Rule 405of the Securities Act. Yes ¥ No n
Indicate by check mark if the registrant is not required to file reports pursuant to Section 13 orSection 15(d) of the Exchange Act. Yes n No ¥
Indicate by check mark whether the registrant (1) has filed all reports required to be filed bySection 13 or 15(d) of the Securities Exchange Act of 1934 during the preceding 12 months (orfor such shorter period that the registrant was required to file such reports), and (2) has beensubject to such filing requirements for the past 90 days. Yes ¥ No n
Indicate by check mark if disclosure of delinquent filers pursuant to Item 405 of Regulation S-Kis not contained herein, and will not be contained, to the best of registrant’s knowledge, indefinitive proxy or information statements incorporated by reference in Part III of this Form 10-Kor any amendment to this Form 10-K. n
Indicate by check mark whether the registrant is a large accelerated filer, an accelerated filer ora non-accelerated filer. See definition of “accelerated filer and large accelerated filer” inRule 12b-2 of the Exchange Act.
Large accelerated filer ¥ Accelerated filer n Non-accelerated filer n
Indicate by check mark whether the registrant is a shell company filer (as defined in Rule 12b-2of the Exchange Act). Yes n No ¥
The aggregate market value of the voting and non-voting common equity of the registrant,consisting solely of common stock, held by nonaffiliates of the registrant as of June 30, 2006was $5 billion.The number of shares of common stock outstanding as of January 31, 2007 was 125,375,447(excluding 14,000,000 shares held by a wholly owned subsidiary).
DOCUMENTS INCORPORATED BY REFERENCEPortions of the proxy statement dated March 12, 2007 are incorporated by reference into Part III(Items 10, 11, 12, 13 and 14).
PART I
Item 1. Business
Overview
We are one of the largest worldwide suppliers of components, systems and services to thecommercial and general aviation airplane markets. We are also a leading supplier of systemsand products to the global defense and space markets. Our business is conducted on a globalbasis with manufacturing, service and sales undertaken in various locations throughout theworld. Our products and services are principally sold to customers in North America, Europe andAsia.
We were incorporated under the laws of the State of New York on May 2, 1912 as the successorto a business founded in 1870.
Our principal executive offices are located at Four Coliseum Centre, 2730 West Tyvola Road,Charlotte, North Carolina 28217 (telephone 704-423-7000).
We maintain an Internet site at http://www.goodrich.com. The information contained at ourInternet site is not incorporated by reference in this report, and you should not consider it apart of this report. Our Annual Report on Form 10-K, Quarterly Reports on Form 10-Q, CurrentReports on Form 8-K, and any amendments to those reports, are available free of charge on ourInternet site as soon as reasonably practicable after they are filed with, or furnished to, theSecurities and Exchange Commission. In addition, we maintain a corporate governance page onour Internet site that includes key information about our corporate governance initiatives,including our Guidelines on Governance, the charters for our standing board committees andour Business Code of Conduct. These materials are available to any shareholder upon request.
Unless otherwise noted herein, disclosures in this Annual Report on Form 10-K relate only to ourcontinuing operations. Our discontinued operations include the Engineered Industrial Products(EIP) segment, which was spun-off to shareholders in May 2002, the Avionics business, whichwas sold in March 2003, the Passenger Restraints Systems (PRS), business which ceased operatingduring the first quarter of 2003, and the JCAir Inc. (Test Systems) business, which was sold inApril 2005.
Unless the context otherwise requires, the terms “we”, “our”, “us”, “Company” and “Goodrich”as used herein refer to Goodrich Corporation and its subsidiaries.
As used in this Form 10-K, the following terms have the following meanings:
• “commercial” means large commercial and regional airplanes;
• “large commercial” means commercial airplanes with a capacity of 100 or more seats,including those manufactured by Airbus S.A.S (Airbus) and The Boeing Company (Boeing);
• “regional” means commercial airplanes with a capacity of less than 100 seats; and
• “general aviation” means business jets and all other non-commercial, non-militaryairplanes.
Business Segment Information
For 2006, we had three business segments: Engine Systems, Airframe Systems and ElectronicSystems.
1
Engine Systems
The Engine Systems segment produces products associated with aircraft engines, includingcowlings and their components, fuel delivery systems, and structural and rotating components.The segment includes the following business units:
• Aerostructures, which:
– Produces nacelle systems, including thrust reversers and related engine housing compo-nents, and pylons;
– Performs maintenance, repair and overhaul services; and
– Provides complete cargo handling systems including conveyor rollers and tracks, side railguides, side and end latches and power drive control units.
• Engine control systems, which provides:
– Fuel metering controls, fuel pumping systems and afterburner fuel pump and meteringunit nozzles; and
– Electronic control software and hardware, variable geometry actuation controls andengine health monitoring systems.
• Turbomachinery products, which produces complete rotating assemblies including qualitymetallic and thermal barrier coatings for the aircraft and industrial gas turbine engineindustries.
• Turbine fuel technologies, which provides:
– Fuel nozzles, injectors, valves and manifolds for aerospace and industrial gas turbineengines; and
– Non-aerospace applications that require liquid atomization.
Airframe Systems
The Airframe Systems segment provides systems and components pertaining to aircraft taxi,take-off, flight control, landing and stopping, and airframe maintenance. The segment includesthe following business units:
• Actuation systems, which provides:
– Actuators for primary flight control systems that operate elevators, ailerons andrudders, and secondary flight controls systems such as flaps and slats; and
– Systems that control the movement of steering systems for missiles and electromechan-ical systems that are characterized by high power, low weight, low maintenance,resistance to extreme temperatures and vibrations and reliability.
• Landing gear, which designs, manufactures and services complete landing gear systems onboth commercial and military aircraft.
• Aircraft wheels and brakes, which provides:
– Wheel and brake systems containing durable wheels, long-lasting steel brake designs,light weight and low cost carbon brakes, one source brake control systems, andstate-of-the-art electric brake development; and
– Original equipment manufacturing (OEM) and overhauls and repairs as well as fulltechnical and aircraft on ground support through a worldwide network of wheel andbrake service centers.
2
• Aviation technical services, which provides:
– Comprehensive heavy airframe maintenance, component repair and overhaul, aircraftpainting, engineering and certification services; and
– Aircraft modification services that include VIP interior completion and passenger tofreight conversions.
• Engineered polymer products, which provides:
– Large-scale marine composite structures and acoustic materials;
– Acoustic absorbing and reflecting materials along with vibration dampeningmaterial; and
– Fireproof composites.
Electronic Systems
The Electronic Systems segment produces a wide array of systems and components that provideflight performance measurements, flight management and control and safety data. The segmentincludes the following business units:
• Optical and space systems, which:
– Provides intelligence, surveillance and reconnaissance systems and electro-opticaldefense, scientific and commercial applications; and
– Designs and builds custom engineered electronics, optics, shortwave infrared camerasand arrays.
• Sensor systems, which provides:
– Numerous sensors for a wide variety of commercial and military aircraft that measuremass flow, inertia and altitude, liquid level, position, speed, and temperature; and
– Air data heading reference systems, angle of attack and stall protection systems,windshield heater controllers, ice detection systems, micro electromechanical systems,and windshield wiper and washer systems.
• Power systems, which provides:
– Constant frequency and variable frequency AC and DC electrical generating systems; and
– Rescue hoist and cargo winches.
• Aircraft interior products, which provides:
– Evacuations slides and life rafts for several types of aircraft;
– Complete aircrew escape systems primarily for military aircraft including canopyremoval, sequencing systems and ejection seats;
– Component products such as gas generators, rocket motors, linear explosives, catapultsand numerous cartridge actuated or propellant actuated devices for a wide variety ofapplications; and
– Seating systems that include cockpit crew and cabin attendant seats.
• Fuel and utility systems, which provides:
– Fuel measurement and management systems, fuel system safety devices, and fireprotection systems; and
3
– Health and usage management systems, motion controls and actuators, proximitysensing systems, braking and steering systems and computer interfaces.
• De-Icing and specialty systems, which provides:
– Pneumatic and electrothermal ice protection application;
– Heated aircraft components, including heated drain masts, lavatory and galley waterheaters and specialty air heaters; and
– Potable water systems and components, aerospace composites and molding resin.
• Lighting systems, which provides:
– Interior lighting systems that include cabin and compartment lights, cockpit lights andcontrollers along with information signs;
– External lighting systems that include anti-collision lights and power supplies, wing andtail strobe lights, navigation and flood lights, and external emergency lights; and
– Night vision imaging systems, covert lighting, main landing gear cables and nose gearsteering cables.
Effective January 1, 2007, we will be reporting our results under a reorganized structure andwill rename two of our three business segments. The three business segments will be Nacellesand Interior Systems, Actuation and Landing Systems, and Electronic Systems. Under the reorga-nized structure, several businesses will be combined into larger strategic business units andseveral businesses will be moved into different segments.
Key Products
Our key products include:
• Nacelles — the structure surrounding an aircraft engine. Components that make up anacelle include thrust reversers, inlet and fan cowls, nozzle assemblies, exhaust systemsand other structural components. Aerostructures is one of a few businesses that is anacelle integrator, which means that we have the capabilities to design and manufactureall components of a nacelle, dress the engine systems and coordinate the installation ofthe engine and nacelle to the aircraft.
• Actuation systems — equipment that utilizes linear, rotary or fly-by-wire actuation tocontrol movement. We manufacture a wide-range of actuators including primary andsecondary flight controls, helicopter main and tail rotor actuation, engine and nacelleactuation, utility actuation, precision weapon actuation and land vehicle actuation.
• Landing gear — complete landing gear systems for commercial, general aviation anddefense aircraft.
• Aircraft wheels and brakes — aircraft wheels and brakes for a variety of commercial,general aviation and defense applications.
• Engine control systems — applications for commercial engines, large and small, helicoptersand all forms of military aircraft. Our products include fuel metering controls, fuelpumping systems, electronic controls (software and hardware), variable geometry actua-tion controls and engine health monitoring systems.
• Optical and space systems — high performance custom engineered electronics, optics,shortwave infrared cameras and arrays, and electro-optical products and services forsophisticated defense, scientific and commercial applications.
• Sensor systems — aircraft and engine sensors that provide critical measurements for flightcontrol, cockpit information and engine control systems.
4
• Power systems — aircraft electrical power systems for large commercial airplanes, business jetsand helicopters. We supply these systems to defense and civil customers around the globe.
Customers
We serve a diverse group of customers worldwide in the commercial and general aviationairplane markets and in the global defense and space markets. We market our products, systemsand services directly to our customers through an internal marketing and sales force.
In 2006, 2005 and 2004, direct and indirect sales to the United States (U.S.) government totaledapproximately 15%, 18% and 20%, respectively, of consolidated sales. Indirect sales to theU.S. government include a portion of the direct and indirect sales to Boeing referred to in thefollowing paragraph.
In 2006 direct and indirect sales to Airbus totaled approximately 17% of consolidated sales. In2005 and 2004, direct and indirect sales to Airbus totaled approximately 16% of consolidatedsales. In 2006, 2005 and 2004, direct and indirect sales to Boeing totaled approximately 14%,12% and 13%, respectively, of consolidated sales.
Competition
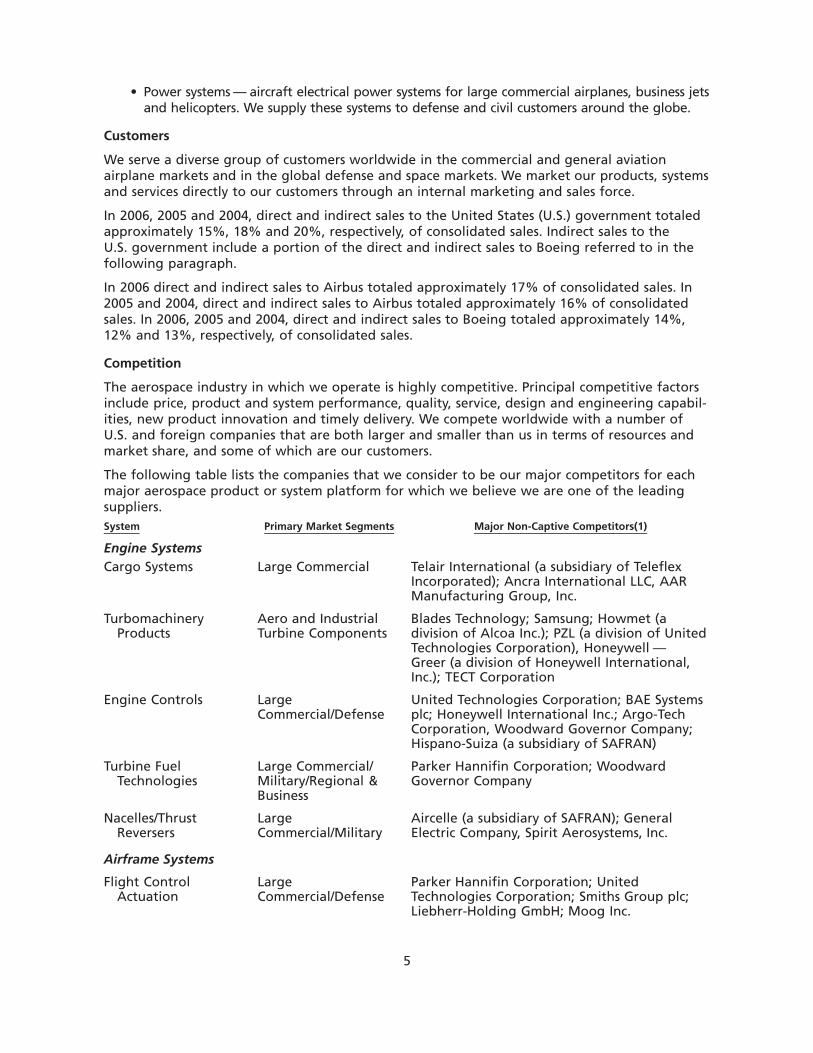
The aerospace industry in which we operate is highly competitive. Principal competitive factorsinclude price, product and system performance, quality, service, design and engineering capabil-ities, new product innovation and timely delivery. We compete worldwide with a number ofU.S. and foreign companies that are both larger and smaller than us in terms of resources andmarket share, and some of which are our customers.
The following table lists the companies that we consider to be our major competitors for eachmajor aerospace product or system platform for which we believe we are one of the leadingsuppliers.System Primary Market Segments Major Non-Captive Competitors(1)
Engine SystemsCargo Systems Large Commercial Telair International (a subsidiary of Teleflex
Incorporated); Ancra International LLC, AARManufacturing Group, Inc.
TurbomachineryProducts
Aero and IndustrialTurbine Components
Blades Technology; Samsung; Howmet (adivision of Alcoa Inc.); PZL (a division of UnitedTechnologies Corporation), Honeywell —Greer (a division of Honeywell International,Inc.); TECT Corporation
Engine Controls LargeCommercial/Defense
United Technologies Corporation; BAE Systemsplc; Honeywell International Inc.; Argo-TechCorporation, Woodward Governor Company;Hispano-Suiza (a subsidiary of SAFRAN)
Turbine FuelTechnologies
Large Commercial/Military/Regional &Business
Parker Hannifin Corporation; WoodwardGovernor Company
Nacelles/ThrustReversers
LargeCommercial/Military
Aircelle (a subsidiary of SAFRAN); GeneralElectric Company, Spirit Aerosystems, Inc.
Airframe Systems
Flight ControlActuation
LargeCommercial/Defense
Parker Hannifin Corporation; UnitedTechnologies Corporation; Smiths Group plc;Liebherr-Holding GmbH; Moog Inc.
5
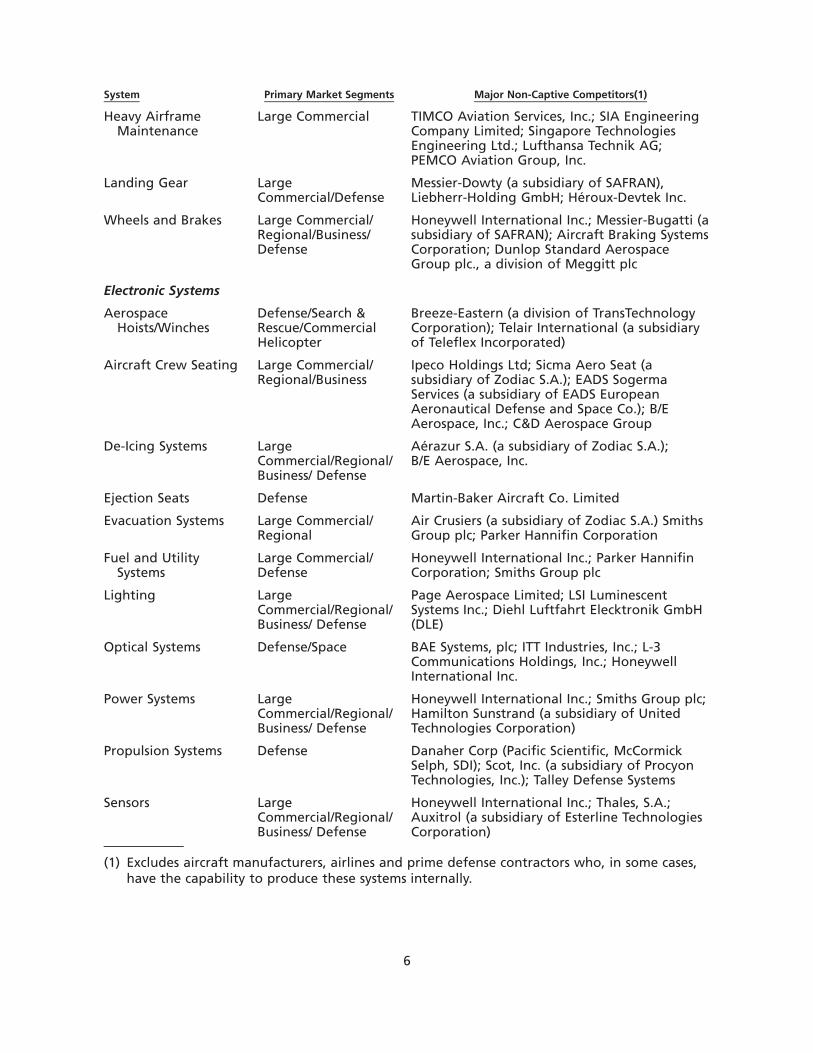
System Primary Market Segments Major Non-Captive Competitors(1)
Heavy AirframeMaintenance
Large Commercial TIMCO Aviation Services, Inc.; SIA EngineeringCompany Limited; Singapore TechnologiesEngineering Ltd.; Lufthansa Technik AG;PEMCO Aviation Group, Inc.
Landing Gear LargeCommercial/Defense
Messier-Dowty (a subsidiary of SAFRAN),Liebherr-Holding GmbH; Héroux-Devtek Inc.
Wheels and Brakes Large Commercial/Regional/Business/Defense
Honeywell International Inc.; Messier-Bugatti (asubsidiary of SAFRAN); Aircraft Braking SystemsCorporation; Dunlop Standard AerospaceGroup plc., a division of Meggitt plc
Electronic Systems
AerospaceHoists/Winches
Defense/Search &Rescue/CommercialHelicopter
Breeze-Eastern (a division of TransTechnologyCorporation); Telair International (a subsidiaryof Teleflex Incorporated)
Aircraft Crew Seating Large Commercial/Regional/Business
Ipeco Holdings Ltd; Sicma Aero Seat (asubsidiary of Zodiac S.A.); EADS SogermaServices (a subsidiary of EADS EuropeanAeronautical Defense and Space Co.); B/EAerospace, Inc.; C&D Aerospace Group
De-Icing Systems LargeCommercial/Regional/Business/ Defense
Aérazur S.A. (a subsidiary of Zodiac S.A.);B/E Aerospace, Inc.
Ejection Seats Defense Martin-Baker Aircraft Co. Limited
Evacuation Systems Large Commercial/Regional
Air Crusiers (a subsidiary of Zodiac S.A.) SmithsGroup plc; Parker Hannifin Corporation
Fuel and UtilitySystems
Large Commercial/Defense
Honeywell International Inc.; Parker HannifinCorporation; Smiths Group plc
Lighting LargeCommercial/Regional/Business/ Defense
Page Aerospace Limited; LSI LuminescentSystems Inc.; Diehl Luftfahrt Elecktronik GmbH(DLE)
Optical Systems Defense/Space BAE Systems, plc; ITT Industries, Inc.; L-3Communications Holdings, Inc.; HoneywellInternational Inc.
Power Systems LargeCommercial/Regional/Business/ Defense
Honeywell International Inc.; Smiths Group plc;Hamilton Sunstrand (a subsidiary of UnitedTechnologies Corporation)
Propulsion Systems Defense Danaher Corp (Pacific Scientific, McCormickSelph, SDI); Scot, Inc. (a subsidiary of ProcyonTechnologies, Inc.); Talley Defense Systems
Sensors LargeCommercial/Regional/Business/ Defense
Honeywell International Inc.; Thales, S.A.;Auxitrol (a subsidiary of Esterline TechnologiesCorporation)
(1) Excludes aircraft manufacturers, airlines and prime defense contractors who, in some cases,have the capability to produce these systems internally.
6
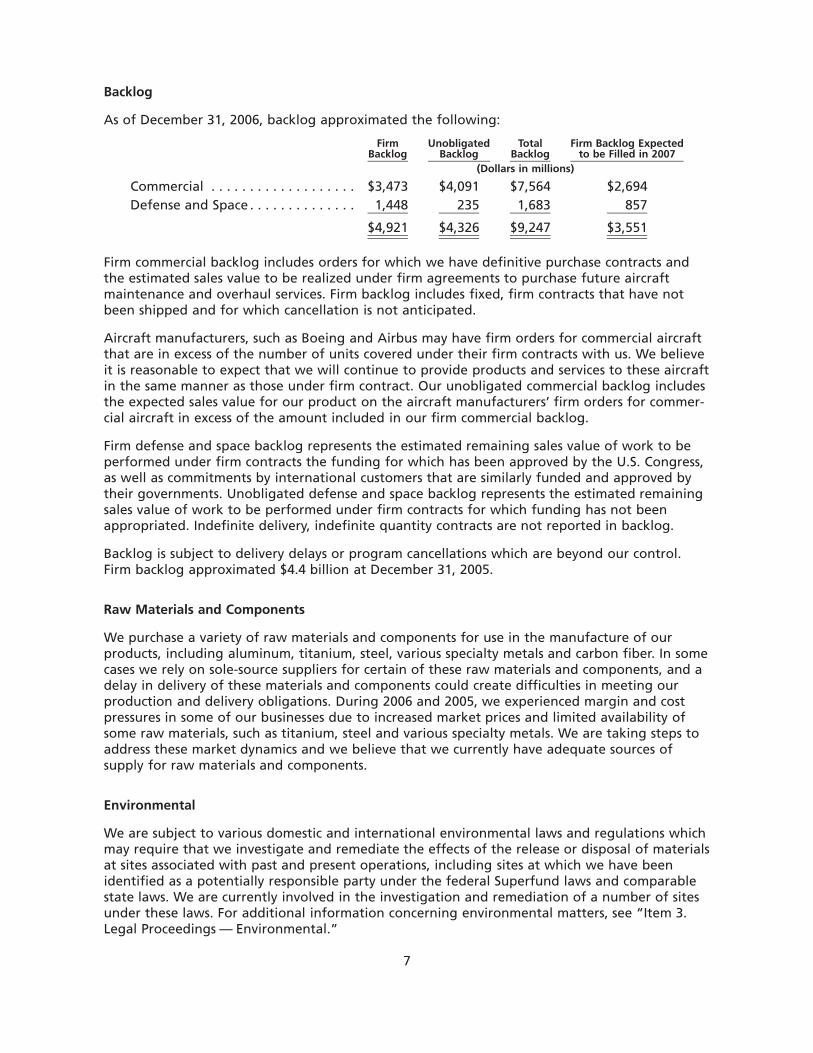
Backlog
As of December 31, 2006, backlog approximated the following:
FirmBacklog
UnobligatedBacklog
TotalBacklog
Firm Backlog Expectedto be Filled in 2007
(Dollars in millions)
Commercial . . . . . . . . . . . . . . . . . . . $3,473 $4,091 $7,564 $2,694Defense and Space . . . . . . . . . . . . . . 1,448 235 1,683 857
$4,921 $4,326 $9,247 $3,551
Firm commercial backlog includes orders for which we have definitive purchase contracts andthe estimated sales value to be realized under firm agreements to purchase future aircraftmaintenance and overhaul services. Firm backlog includes fixed, firm contracts that have notbeen shipped and for which cancellation is not anticipated.
Aircraft manufacturers, such as Boeing and Airbus may have firm orders for commercial aircraftthat are in excess of the number of units covered under their firm contracts with us. We believeit is reasonable to expect that we will continue to provide products and services to these aircraftin the same manner as those under firm contract. Our unobligated commercial backlog includesthe expected sales value for our product on the aircraft manufacturers’ firm orders for commer-cial aircraft in excess of the amount included in our firm commercial backlog.
Firm defense and space backlog represents the estimated remaining sales value of work to beperformed under firm contracts the funding for which has been approved by the U.S. Congress,as well as commitments by international customers that are similarly funded and approved bytheir governments. Unobligated defense and space backlog represents the estimated remainingsales value of work to be performed under firm contracts for which funding has not beenappropriated. Indefinite delivery, indefinite quantity contracts are not reported in backlog.
Backlog is subject to delivery delays or program cancellations which are beyond our control.Firm backlog approximated $4.4 billion at December 31, 2005.
Raw Materials and Components
We purchase a variety of raw materials and components for use in the manufacture of ourproducts, including aluminum, titanium, steel, various specialty metals and carbon fiber. In somecases we rely on sole-source suppliers for certain of these raw materials and components, and adelay in delivery of these materials and components could create difficulties in meeting ourproduction and delivery obligations. During 2006 and 2005, we experienced margin and costpressures in some of our businesses due to increased market prices and limited availability ofsome raw materials, such as titanium, steel and various specialty metals. We are taking steps toaddress these market dynamics and we believe that we currently have adequate sources ofsupply for raw materials and components.
Environmental
We are subject to various domestic and international environmental laws and regulations whichmay require that we investigate and remediate the effects of the release or disposal of materialsat sites associated with past and present operations, including sites at which we have beenidentified as a potentially responsible party under the federal Superfund laws and comparablestate laws. We are currently involved in the investigation and remediation of a number of sitesunder these laws. For additional information concerning environmental matters, see “Item 3.Legal Proceedings — Environmental.”
7

Research and Development
We perform research and development under company-funded programs for commercial prod-ucts and under contracts with customers. Research and development under contracts with othersis performed on both defense and commercial products. Total research and developmentexpenses from continuing operations in 2006, 2005 and 2004 were $360 million, $379 millionand $346.2 million, respectively. These amounts are net of approximately $113 million,$112.1 million and $99.5 million, respectively, which were funded by customers.
Intellectual Property
We own or are licensed to use various intellectual property rights, including patents, trade-marks, copyrights and trade secrets. While such intellectual property rights are important to us,we do not believe that the loss of any individual property right or group of related rights wouldhave a material adverse effect on our overall business or on any of our business segments.
Human Resources
As of December 31, 2006, we employed approximately 15,600 people in the U.S. Additionally,we employed approximately 7,800 people in other countries. We believe that we have goodrelationships with our employees. The hourly employees who are unionized are covered bycollective bargaining agreements with a number of labor unions and with varying contracttermination dates through April 2011. Approximately 19% of our global labor force is coveredby collective bargaining arrangements and approximately 6% of our global labor force iscovered by collective bargaining arrangements that will expire within one year. There were nomaterial work stoppages during 2006.
Foreign Operations
We are engaged in business in foreign markets. Our foreign manufacturing and service facilitiesare located in Australia, Canada, China, England, France, Germany, India, Indonesia, NorthernIreland, Japan, Mexico, Poland, Scotland, Singapore and the United Arab Emirates. We marketour products and services through sales subsidiaries and distributors in a number of foreigncountries. We also have joint venture agreements with various foreign companies.
Currency fluctuations, tariffs and similar import limitations, price controls and labor regulationscan affect our foreign operations, including foreign affiliates. Other potential limitations on ourforeign operations include expropriation, nationalization, restrictions on foreign investments ortheir transfers and additional political and economic risks. In addition, the transfer of fundsfrom foreign operations could be impaired by the unavailability of dollar exchange or otherrestrictive regulations that foreign governments could enact.
For financial information about our U.S. and foreign sales and assets, see Note 3, “BusinessSegment Information” to our Consolidated Financial Statements.
Item 1A. Risk Factors
Our business, financial condition, results of operations and cash flows can be affected by anumber of factors, including but not limited to those set forth below and elsewhere in thisAnnual Report on Form 10-K, any one of which could cause our actual results to vary materiallyfrom recent results or from our anticipated future results.
Our future success is dependent on demand for and market acceptance of new commercial andmilitary aircraft programs.
We are currently under contract to supply components and systems for a number of newcommercial, general aviation and military aircraft programs, including the Airbus A380 and
8

A350 XWB, the Boeing 787, the Embraer 190, the Dassault Falcon 7X and the Lockheed MartinF-35 JSF and F-22 Raptor. We have made and will continue to make substantial investments andincur substantial development costs in connection with these programs. We cannot provideassurance that each of these programs will enter full-scale production as expected or thatdemand for the aircraft will be sufficient to allow us to recoup our investment in theseprograms. In addition, we cannot assure you that we will be able to extend our contractsrelating to these programs beyond the initial contract periods. If any of these programs are notsuccessful, it could have a material adverse effect on our business, financial condition or resultsof operations.
The market segments we serve are cyclical and sensitive to domestic and foreign economicconsiderations that could adversely affect our business and financial results.
The market segments in which we sell our products are, to varying degrees, cyclical and haveexperienced periodic downturns in demand. For example, certain of our commercial aviationproducts sold to aircraft manufacturers have experienced downturns during periods of slow-downs in the commercial airline industry and during periods of weak general economicconditions, as demand for new aircraft typically declines during these periods. Although webelieve that aftermarket demand for many of our products may reduce our exposure to thesebusiness downturns, we have experienced these conditions in our business in the recent pastand may experience downturns in the future.
Capital spending by airlines and aircraft manufacturers may be influenced by a variety of factorsincluding current and predicted traffic levels, load factors, aircraft fuel pricing, labor issues,competition, the retirement of older aircraft, regulatory changes, terrorism and related safetyconcerns, general economic conditions, worldwide airline profits and backlog levels. Also, sincea substantial portion of commercial airplane OE deliveries are scheduled beyond 2006, changesin economic conditions may cause customers to request that firm orders be rescheduled orcanceled. Aftermarket sales and service trends are affected by similar factors, including usage,pricing, regulatory changes, the retirement of older aircraft and technological improvementsthat increase reliability and performance. A reduction in spending by airlines or aircraftmanufacturers could have a significant effect on the demand for our products, which couldhave an adverse effect on our business, financial condition, results of operations or cash flows.
Current conditions in the airline industry could adversely affect our business and financialresults.
Increases in fuel costs, high labor costs and heightened competition from low cost carriers haveadversely affected the financial condition of some commercial airlines. Recently, several airlineshave declared bankruptcy. A portion of our sales are derived from the sale of products directlyto airlines, and we sometimes provide sales incentives to airlines and record unamortized salesincentives as other assets. If an airline declares bankruptcy, we may be unable to collect ouroutstanding accounts receivable from the airline and we may be required to record a chargerelated to unamortized sales incentives to the extent they cannot be recovered.
A significant decline in business with Airbus or Boeing could adversely affect our business andfinancial results.
For the year 2006, approximately 17% and 14% of our sales were made to Airbus and Boeing,respectively, for all categories of products, including original equipment (OE) and aftermarketproducts for commercial and military aircraft and space applications. Accordingly, a significantreduction in purchases by either of these customers could have a material adverse effect on ourbusiness, financial condition, results of operations and cash flows.
9
Demand for our defense and space-related products is dependent upon government spending.
Approximately 25% of our sales for the year 2006 were derived from the defense and spacemarket segment. Included in that category are direct and indirect sales to the U.S. Government,which represented approximately 15% of our sales for the year 2006. The military and spacemarket segments are largely dependent upon government budgets, particularly the U.S. defensebudget. We cannot assure you that an increase in defense spending will be allocated toprograms that would benefit our business. Moreover, we cannot assure you that new militaryaircraft programs in which we participate will enter full-scale production as expected. A changein levels of defense spending or levels of military flight operations could curtail or enhance ourprospects in these market segments, depending upon the programs affected.
Our business could be adversely affected if we are unable to obtain the necessary rawmaterials and components.
We purchase a variety of raw materials and components for use in the manufacture of ourproducts, including aluminum, titanium, steel, various specialty metals and carbon fiber. The lossof a significant supplier or the inability of a supplier to meet our performance and qualityspecifications or delivery schedules could affect our ability to complete our contractual obliga-tions to our customers on a satisfactory, timely and/or profitable basis. These events mayadversely affect our operating results, result in the termination of one or more of our customercontracts or damage our reputation and relationships with our customers. All of these eventscould have a material adverse effect on our business.
We use a number of estimates in accounting for some long-term contracts. Changes in ourestimates could materially affect our future financial results.
We account for sales and profits on some long-term contracts in accordance with thepercentage-of-completion method of accounting, using the cumulative catch-up method toaccount for revisions in estimates. The percentage-of-completion method of accounting involvesthe use of various estimating techniques to project revenues and costs at completion and variousassumptions and projections relative to the outcome of future events, including the quantityand timing of product deliveries, future labor performance and rates, and material andoverhead costs. These assumptions involve various levels of expected performance improve-ments. Under the cumulative catch-up method, the impact of revisions in our estimates relatedto units shipped to date is recognized immediately.
Because of the significance of the judgments and estimates described above, it is likely that wecould record materially different amounts if we used different assumptions or if the underlyingcircumstances or estimates were to change. Accordingly, changes in underlying assumptions,circumstances or estimates may materially affect our future financial performance.
Competitive pressures may adversely affect our business and financial results.
The aerospace industry in which we operate is highly competitive. We compete worldwide witha number of U.S. and foreign companies that are both larger and smaller than we are in termsof resources and market share, and some of which are our customers. While we are the marketand technology leader in many of our products, in certain areas some of our competitors mayhave more extensive or more specialized engineering, manufacturing or marketing capabilitiesand lower manufacturing cost. As a result, these competitors may be able to adapt more quicklyto new or emerging technologies and changes in customer requirements or may be able todevote greater resources to the development, promotion and sale of their products than wecan.
10

The significant consolidation occurring in the aerospace industry could adversely affect ourbusiness and financial results.
The aerospace industry in which we operate has been experiencing significant consolidationamong suppliers, including us and our competitors, and the customers we serve. Commercialairlines have increasingly been merging and creating global alliances to achieve greater econo-mies of scale and enhance their geographic reach. Aircraft manufacturers have made acquisi-tions to expand their product portfolios to better compete in the global marketplace. Inaddition, aviation suppliers have been consolidating and forming alliances to broaden theirproduct and integrated system offerings and achieve critical mass. This supplier consolidation isin part attributable to aircraft manufacturers and airlines more frequently awarding long-termsole source or preferred supplier contracts to the most capable suppliers, thus reducing the totalnumber of suppliers from whom components and systems are purchased. Our business andfinancial results may be adversely impacted as a result of consolidation by our competitors orcustomers.
Expenses related to employee and retiree medical and pension benefits may continue to rise.
We have periodically experienced significant increases in expenses related to our employee andretiree medical and pension benefits. Although we have taken action seeking to contain thesecost increases, including making material changes to some of these plans, there are risks thatour expenses will rise as a result of continued increases in medical costs due to increased usageof medical benefits and medical cost inflation in the U.S. Pension expense may increase ifinvestment returns on our pension plan assets do not meet our long-term return assumption, ifthere are reductions in the discount rate used to determine the present value of our benefitobligation, or if other actuarial assumptions are not realized.
The aerospace industry is highly regulated.
The aerospace industry is highly regulated in the U.S. by the Federal Aviation Administrationand in other countries by similar regulatory agencies. We must be certified by these agenciesand, in some cases, by individual OE manufacturers in order to engineer and service systems andcomponents used in specific aircraft models. If material authorizations or approvals wererevoked or suspended, our operations would be adversely affected. New or more stringentgovernmental regulations may be adopted, or industry oversight heightened, in the future, andwe may incur significant expenses to comply with any new regulations or any heightenedindustry oversight.
We may have liabilities relating to environmental laws and regulations that could adverselyaffect our financial results.
We are subject to various domestic and international environmental laws and regulations whichmay require that we investigate and remediate the effects of the release or disposal of materialsat sites associated with past and present operations. We are currently involved in the investiga-tion and remediation of a number of sites for which we have been identified as a potentiallyresponsible party under these laws. Based on currently available information, we do not believethat future environmental costs in excess of those accrued with respect to such sites will have amaterial adverse effect on our financial condition. We cannot assure you that additional futuredevelopments, administrative actions or liabilities relating to environmental matters will nothave a material adverse effect on our results of operations and/or cash flows in a given period.
In connection with the divestiture of our tire, vinyl and other businesses, we received contrac-tual rights of indemnification from third parties for environmental and other claims arising outof the divested businesses. If these third parties do not honor their indemnification obligations
11

to us, it could have a material adverse effect on our financial condition, results of operationsand/or cash flows.
Any material product liability or environmental claims in excess of insurance may adverselyaffect us.
We are exposed to potential liability for personal injury or death with respect to products thathave been designed, manufactured, serviced or sold by us, including potential liability forasbestos and other toxic tort claims. In addition, we are exposed to potential liability pursuantto various domestic and international environmental laws and regulations. While we believethat we have substantial insurance coverage available to us related to any such claims, ourinsurance may not cover all liabilities. Additionally, insurance coverage may not be available inthe future at a cost acceptable to us. Any material liability not covered by insurance or forwhich third-party indemnification is not available could have a material adverse effect on ourfinancial condition, results of operations and/or cash flows.
Any material product warranty obligations may adversely affect us.
Our operations expose us to potential liability for warranty claims made by third parties withrespect to aircraft components that have been designed, manufactured, distributed or servicedby us. Any material product warranty obligations could have a material adverse effect on ourfinancial condition, results of operations and/or cash flows.
Our operations depend on our production facilities throughout the world. These productionfacilities are subject to physical and other risks that could disrupt production.
Our production facilities could be damaged or disrupted by a natural disaster, labor strike, war,political unrest, terrorist activity or a pandemic. Although we have obtained property damageand business interruption insurance, a major catastrophe such as an earthquake or other naturaldisaster at any of our sites, or significant labor strikes, work stoppages, political unrest, war orterrorist activities in any of the areas where we conduct operations, could result in a prolongedinterruption of our business. Any disruption resulting from these events could cause significantdelays in shipments of products and the loss of sales and customers. We cannot assure you thatwe will have insurance to adequately compensate us for any of these events.
We have significant international operations and assets and are therefore subject to additionalfinancial and regulatory risks.
We have operations and assets throughout the world. In addition, we sell our products andservices in foreign countries and seek to increase our level of international business activity.Accordingly, we are subject to various risks, including: U.S.-imposed embargoes of sales tospecific countries; foreign import controls (which may be arbitrarily imposed or enforced); priceand currency controls; exchange rate fluctuations; dividend remittance restrictions; expropriationof assets; war, civil uprisings and riots; government instability; the necessity of obtaininggovernmental approval for new and continuing products and operations; legal systems ofdecrees, laws, taxes, regulations, interpretations and court decisions that are not always fullydeveloped and that may be retroactively or arbitrarily applied; and difficulties in managing aglobal enterprise. We may also be subject to unanticipated income taxes, excise duties, importtaxes, export taxes or other governmental assessments. Any of these events could result in a lossof business or other unexpected costs that could reduce sales or profits and have a materialadverse effect on our financial condition, results of operations and/or cash flows.
We are exposed to foreign currency risks that arise from normal business operations. These risksinclude transactions denominated in foreign currencies and the translation of certain non-functional currency balances of our subsidiaries. Our international operations also expose us to
12

translation risk when the local currency financial statements are translated to U.S. Dollars, ourparent company’s functional currency. As currency exchange rates fluctuate, translation of thestatements of income of international businesses into U.S. Dollars will affect comparability ofrevenues and expenses between years.
Creditors may seek to recover from us if the businesses that we spun off are unable to meettheir obligations in the future, including obligations to asbestos claimants.
On May 31, 2002, we completed the spin-off of our wholly owned subsidiary, EnPro Industries,Inc. (EnPro). Prior to the spin-off, we contributed the capital stock of Coltec Industries Inc(Coltec) to EnPro. At the time of the spin-off, two subsidiaries of Coltec were defendants in asignificant number of personal injury claims relating to alleged asbestos-containing productssold by those subsidiaries. It is possible that asbestos-related claims might be asserted against uson the theory that we have some responsibility for the asbestos-related liabilities of EnPro,Coltec or its subsidiaries, even though the activities that led to those claims occurred prior toour ownership of any of those subsidiaries. Also, it is possible that a claim might be assertedagainst us that Coltec’s dividend of its aerospace business to us prior to the spin-off was madeat a time when Coltec was insolvent or caused Coltec to become insolvent. Such a claim couldseek recovery from us on behalf of Coltec of the fair market value of the dividend.
A limited number of asbestos-related claims have been asserted against us as “successor” toColtec or one of its subsidiaries. We believe that we have substantial legal defenses againstthese claims, as well as against any other claims that may be asserted against us on the theoriesdescribed above. In addition, the agreement between EnPro and us that was used to effectuatethe spin-off provides us with an indemnification from EnPro covering, among other things,these liabilities. The success of any such asbestos-related claims would likely require, as apractical matter, that Coltec’s subsidiaries were unable to satisfy their asbestos-related liabilitiesand that Coltec was found to be responsible for these liabilities and was unable to meet itsfinancial obligations. We believe any such claims would be without merit and that Coltec wassolvent both before and after the dividend of its aerospace business to us. If we are ultimatelyfound to be responsible for the asbestos-related liabilities of Coltec’s subsidiaries, we believe itwould not have a material adverse effect on our financial condition, but could have a materialadverse effect on our results of operations and cash flows in a particular period. However,because of the uncertainty as to the number, timing and payments related to future asbestos-related claims, there can be no assurance that any such claims will not have a material adverseeffect on our financial condition, results of operations and cash flows. If a claim related to thedividend of Coltec’s aerospace business were successful, it could have a material adverse impacton our financial condition, results of operations and/or cash flows.
Item 1B. Unresolved Staff Comments
Not applicable.
13
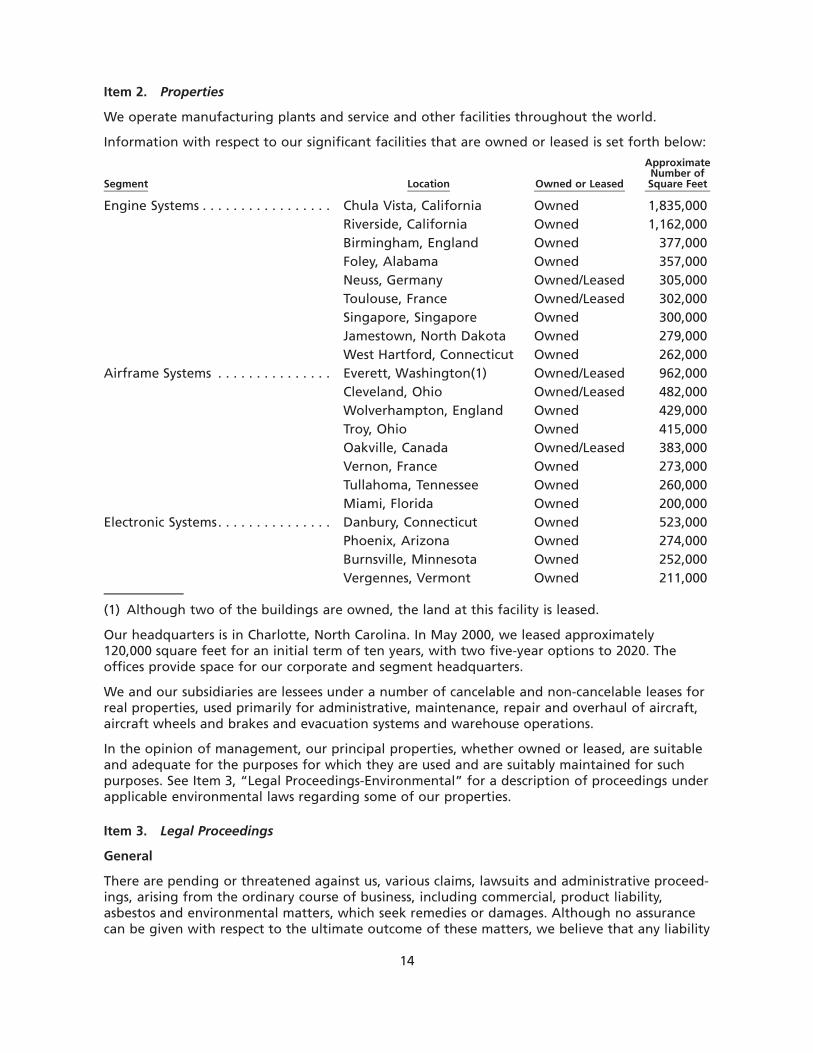
Item 2. Properties
We operate manufacturing plants and service and other facilities throughout the world.
Information with respect to our significant facilities that are owned or leased is set forth below:
Segment Location Owned or Leased
ApproximateNumber ofSquare Feet
Engine Systems . . . . . . . . . . . . . . . . . Chula Vista, California Owned 1,835,000Riverside, California Owned 1,162,000Birmingham, England Owned 377,000Foley, Alabama Owned 357,000Neuss, Germany Owned/Leased 305,000Toulouse, France Owned/Leased 302,000Singapore, Singapore Owned 300,000Jamestown, North Dakota Owned 279,000West Hartford, Connecticut Owned 262,000
Airframe Systems . . . . . . . . . . . . . . . Everett, Washington(1) Owned/Leased 962,000Cleveland, Ohio Owned/Leased 482,000Wolverhampton, England Owned 429,000Troy, Ohio Owned 415,000Oakville, Canada Owned/Leased 383,000Vernon, France Owned 273,000Tullahoma, Tennessee Owned 260,000Miami, Florida Owned 200,000
Electronic Systems. . . . . . . . . . . . . . . Danbury, Connecticut Owned 523,000Phoenix, Arizona Owned 274,000Burnsville, Minnesota Owned 252,000Vergennes, Vermont Owned 211,000
(1) Although two of the buildings are owned, the land at this facility is leased.
Our headquarters is in Charlotte, North Carolina. In May 2000, we leased approximately120,000 square feet for an initial term of ten years, with two five-year options to 2020. Theoffices provide space for our corporate and segment headquarters.
We and our subsidiaries are lessees under a number of cancelable and non-cancelable leases forreal properties, used primarily for administrative, maintenance, repair and overhaul of aircraft,aircraft wheels and brakes and evacuation systems and warehouse operations.
In the opinion of management, our principal properties, whether owned or leased, are suitableand adequate for the purposes for which they are used and are suitably maintained for suchpurposes. See Item 3, “Legal Proceedings-Environmental” for a description of proceedings underapplicable environmental laws regarding some of our properties.
Item 3. Legal Proceedings
General
There are pending or threatened against us, various claims, lawsuits and administrative proceed-ings, arising from the ordinary course of business, including commercial, product liability,asbestos and environmental matters, which seek remedies or damages. Although no assurancecan be given with respect to the ultimate outcome of these matters, we believe that any liability
14
that may finally be determined with respect to commercial and non-asbestos product liabilityclaims should not have a material effect on our consolidated financial position, results ofoperations or cash flow. From time to time, we are also involved in legal proceedings as aplaintiff involving tax, contract, patent protection, environmental and other matters. Gaincontingencies, if any, are recognized when they are realized. Legal costs are generally expensedas incurred.
Environmental
We are subject to various domestic and international environmental laws and regulations whichmay require that we investigate and remediate the effects of the release or disposal of materialsat sites associated with past and present operations, including divested sites for which we havecontractual obligations relating to the environmental conditions of such site. At certain sites, wehave been identified as a potentially responsible party under the federal Superfund laws andcomparable state laws. We are currently involved in the investigation and remediation of anumber of sites under these laws.
Estimates of our environmental liabilities are based on currently available facts, present lawsand regulations and current technology. Such estimates take into consideration our priorexperience in site investigation and remediation, the data concerning cleanup costs availablefrom other companies and regulatory authorities and the professional judgment of our environ-mental specialists in consultation with outside environmental specialists, when necessary. Esti-mates of our environmental liabilities are further subject to uncertainties regarding the natureand extent of site contamination, the range of remediation alternatives available, evolvingremediation standards, imprecise engineering evaluations and estimates of appropriate cleanuptechnology, methodology and cost, the extent of corrective actions that may be required andthe number and financial condition of other potentially responsible parties, as well as the extentof their responsibility for the remediation.
Accordingly, as investigation and remediation of these sites proceed, it is likely that adjustmentsin our accruals will be necessary to reflect new information. The amounts of any suchadjustments could have a material adverse effect on the results of operations in a given period,but the amounts, and the possible range of loss in excess of the amounts accrued, are notreasonably estimable. Based on currently available information, however, we do not believe thatfuture environmental costs in excess of those accrued with respect to sites for which we havebeen identified as a potentially responsible party are likely to have a material adverse effect onour financial condition. There can be no assurance, however, that additional future develop-ments, administrative actions or liabilities relating to environmental matters will not have amaterial adverse effect on our results of operations or cash flows in a given period.
Environmental liabilities are recorded when the liability is probable and the costs are reasonablyestimable, which generally is not later than at completion of a feasibility study or when we haverecommended a remedy or have committed to an appropriate plan of action. The liabilities arereviewed periodically and, as investigation and remediation proceed, adjustments are made asnecessary. Liabilities for losses from environmental remediation obligations do not consider theeffects of inflation and anticipated expenditures are not discounted to their present value. Theliabilities are not reduced by possible recoveries from insurance carriers or other third parties,but do reflect anticipated allocations among potentially responsible parties at federal Superfundsites or similar state-managed sites and an assessment of the likelihood that such parties willfulfill their obligations at such sites.
Our Consolidated Balance Sheet included an accrued liability for environmental remediationobligations of $74.3 million and $81 million at December 31, 2006 and 2005, respectively. AtDecember 31, 2006 and 2005, $17.7 million and $18.3 million, respectively, of the accruedliability for environmental remediation was included in current liabilities as accrued expenses. At
15
December 31, 2006 and 2005, $31 million and $31.4 million, respectively, was associated withongoing operations and $43.3 million and $49.6 million, respectively, was associated withbusinesses previously disposed of or discontinued.
The timing of expenditures depends on a number of factors that vary by site, including thenature and extent of contamination, the number of potentially responsible parties, the timingof regulatory approvals, the complexity of the investigation and remediation, and the standardsfor remediation. We expect that we will expend present accruals over many years, and willgenerally complete remediation in less than 30 years at all sites for which it has been identifiedas a potentially responsible party. This period includes operation and monitoring costs that aregenerally incurred over 15 to 25 years.
Asbestos
We and a number of our subsidiaries have been named as defendants in various actions byplaintiffs alleging injury or death as a result of exposure to asbestos fibers in products, or whichmay have been present in our facilities. A number of these cases involve maritime claims, whichhave been and are expected to continue to be administratively dismissed by the court. Theseactions primarily relate to previously owned businesses. We believe that pending and reasonablyanticipated future actions, net of anticipated insurance recoveries, are not likely to have amaterial adverse effect on our financial condition, results of operations or cash flows. There canbe no assurance, however, that future legislative or other developments will not have a materialadverse effect on our results of operations or cash flow in a given period.
Insurance Coverage
We believe that we have substantial insurance coverage available to us related to third partyclaims. However, the pre-1976 primary layer of insurance coverage was provided by the KemperInsurance Companies (Kemper). Kemper has indicated that, due to capital constraints anddowngrades from various rating agencies, it has ceased underwriting new business and nowfocuses on administering policy commitments from prior years. Kemper has also indicated that itis currently operating under a “run-off” plan under the supervision of the Illinois Division ofInsurance. We cannot predict the impact of Kemper’s financial position on the availability of theKemper insurance.
In addition, a portion of our primary and excess layers of pre-1986 insurance coverage for thirdparty claims was provided by certain insurance carriers who are either insolvent or undergoingsolvent schemes of arrangement. We have entered into settlement agreements with a numberof these insurers pursuant to which we agreed to give up our rights with respect to certaininsurance policies in exchange for negotiated payments, some of which are subject to increaseunder certain circumstances. These settlements represent negotiated payments for our loss ofinsurance coverage, as we no longer have insurance available for claims that may have qualifiedfor coverage. These settlements have been recorded as income for reimbursement of past claimpayments under the settled insurance policies and as a deferred settlement credit for futureclaim payments.
At December 31, 2006, the deferred settlement credit was approximately $38 million for which$2.8 million is reported in accrued expenses and $35.2 million was reported in other non-currentliabilities. The proceeds from such insurance settlements were reported as a component of netcash provided by operating activities.
16
Liabilities of Divested Businesses
Asbestos
In May 2002, we completed the tax-free spin-off of our Engineered Products (EIP) segment,which at the time of the spin-off included EnPro and Coltec. At that time, two subsidiaries ofColtec were defendants in a significant number of personal injury claims relating to allegedasbestos-containing products sold by those subsidiaries. It is possible that asbestos-related claimsmight be asserted against us on the theory that we have some responsibility for the asbestos-related liabilities of EnPro, Coltec or its subsidiaries, even though the activities that led to thoseclaims occurred prior to our ownership of any of those subsidiaries. Also, it is possible that aclaim might be asserted against us that Coltec’s dividend of its aerospace business to us prior tothe spin-off was made at a time when Coltec was insolvent or caused Coltec to becomeinsolvent. Such a claim could seek recovery from us on behalf of Coltec of the fair market valueof the dividend.
A limited number of asbestos-related claims have been asserted against us as “successor” toColtec or one of its subsidiaries. We believe that we have substantial legal defenses againstthese claims, as well as against any other claims that may be asserted against us on the theoriesdescribed above. In addition, the agreement between EnPro and us that was used to effectuatethe spin-off provides us with an indemnification from EnPro covering, among other things,these liabilities. The success of any such asbestos-related claims would likely require, as apractical matter, that Coltec’s subsidiaries were unable to satisfy their asbestos-related liabilitiesand that Coltec was found to be responsible for these liabilities and was unable to meet itsfinancial obligations. We believe any such claims would be without merit and that Coltec wassolvent both before and after the dividend of its aerospace business to us. If we are ultimatelyfound to be responsible for the asbestos-related liabilities of Coltec’s subsidiaries, it believessuch finding would not have a material adverse effect on its financial condition, but could havea material adverse effect on its results of operations and cash flows in a particular period.However, because of the uncertainty as to the number, timing and payments related to futureasbestos-related claims, there can be no assurance that any such claims will not have a materialadverse effect on our financial condition, results of operations and cash flows. If a claim relatedto the dividend of Coltec’s aerospace business were successful, it could have a material adverseimpact on our financial condition, results of operations and cash flows.
Tax
We are continuously undergoing examination by the Internal Revenue Service (IRS), as well asvarious state and foreign jurisdictions. The IRS and other taxing authorities routinely challengecertain deductions and credits reported by us on our income tax returns. In accordance withStatement of Financial Accounting Standards No. 109, “Accounting for Income Taxes,”(SFAS 109) and Statement of Financial Accounting Standards No. 5, “Accounting for Contingen-cies” (SFAS 5), we establish reserves for tax contingencies that reflect our best estimate of thedeductions and credits that we may be unable to sustain, or that we could be willing to concedeas part of a broader tax settlement. Differences between the reserves for tax contingencies andthe amounts ultimately owed by us are recorded in the period they become known. Adjust-ments to our reserves could have a material effect on our financial statements. As of Decem-ber 31, 2006, we had recorded tax contingency reserves of approximately $173 million.
In 2000, Coltec, a former Goodrich subsidiary, paid $113.7 million to the IRS. This paymentrepresented the tax and accrued interest arising out of the IRS’s disallowance of a capital lossand certain tax credits relating to Coltec’s 1996 tax year. On February 13, 2001, Coltec filed suitagainst the U.S. Government in the U.S. Court of Federal Claims for a refund of this payment.The case went to trial, and on November 2, 2004, the trial court ruled in favor of Coltec. During2005, the government appealed the decision to the U.S. Court of Appeals for the Federal Circuit.
17
The appeals court reversed the decision of the trial court on July 12, 2006. On August 2, 2006,we paid the tax and accrued interest relating to subsequent years of approximately $57 millionto the IRS. On November 8, 2006, Coltec filed a petition for a writ of certiorari with the SupremeCourt of the United States asking the Court to review the decision of the appeals court. OnFebruary 20, 2007 the Supreme Court of the United States denied Coltec’s petition. Coltec doesnot owe any additional federal income tax or interest with respect to these matters for the years1996 through 2000. There is no financial statement effect since all related impacts for this casewere previously recorded.
In 2000, the IRS issued a statutory notice of deficiency asserting that Rohr, Inc. (Rohr), asubsidiary of ours was liable for $85.3 million of additional income taxes for the fiscal yearsended July 31, 1986 through 1989. In 2003, the IRS issued an additional statutory notice ofdeficiency asserting that Rohr was liable for $23 million of additional income taxes for the fiscalyears ended July 31, 1990 through 1993. The proposed assessments relate primarily to the timingof certain tax deductions and tax credits. Rohr filed petitions in the U.S. Tax Court opposing theproposed assessments. We previously reached a tentative settlement agreement with the IRSwith regard to the proposed assessments that required further review by the Joint Committeeon Taxation (JCT). On March 15, 2006, we received notification that the JCT approved thetentative settlement agreement entered into with the IRS. As a result of receiving the JCTnotification, we recorded a tax benefit of approximately $74.1 million, primarily related to thereversal of tax reserves, during 2006.
The current IRS examination cycle began on September 29, 2005 and involves the taxable yearsended December 31, 2000 through December 31, 2004. Based on communications with the IRSexam team, we expect field examination of the current cycle to be completed during 2007. Theprior examination cycle which began in March 2002, includes the consolidated income taxgroups in the audit periods identified below:
Rohr, Inc. and Subsidiaries . . . . . . . . . . . . . . July, 1995 — December, 1997 (throughdate of acquisition)
Coltec Industries Inc and Subsidiaries . . . . . December, 1997 — July, 1999 (throughdate of acquisition)
Goodrich Corporation and Subsidiaries . . . . 1998-1999 (including Rohr and Coltec)
There were numerous tax issues that had been raised by the IRS as part of the priorexamination, including, but not limited to, transfer pricing, research and development credits,foreign tax credits, tax accounting for long-term contracts, tax accounting for inventory, taxaccounting for stock options, depreciation, amortization and the proper timing for certain otherdeductions for income tax purposes. We previously reached tentative settlement agreementswith the IRS on substantially all of the issues raised with respect to the prior examination cycle.Due to the amount of tax involved, certain portions of the tentative settlement agreementswere required to be reviewed by the JCT. We received notification on April 25, 2006 that theJCT approved the tentative settlement agreement entered into with the IRS with regard to Rohr,Inc. and Subsidiaries (for the period from July, 1995 through December, 1997). As a result ofreceiving the JCT notification, we recorded a tax benefit of approximately $14.9 million,primarily related to the reversal of tax reserves, during 2006. In addition to the JCT approvalswith regard to Rohr, we reached agreement with the IRS regarding most of the issues withrespect to Coltec Industries Inc and Subsidiaries (for the period from December, 1997 throughJuly, 1999). Consequently, we recorded a tax benefit of approximately $44.4 million, primarilyrelated to the reversal of tax reserves, during 2006. During 2006, we reached final settlementwith the IRS on substantially all of the issues relating to the Goodrich Corporation andSubsidiaries 1998-1999 examination cycle. As a result, we recorded a benefit of approximately$13.5 million, primarily related to the reversal of tax reserves. We anticipate filing a petitionwith the U.S. Tax Court to contest the remaining unresolved issues which involve the proper
18
timing of certain deductions. The amount of the estimated tax liability if the IRS were to prevailis fully reserved. We cannot predict the timing or ultimate outcome of the remaining issues.
Rohr has been under examination by the State of California for the tax years ended July 31,1985, 1986 and 1987. The State of California has disallowed certain expenses incurred by one ofRohr’s subsidiaries in connection with the lease of certain tangible property. California’sFranchise Tax Board held that the deductions associated with the leased equipment were non-business deductions. The additional tax associated with the Franchise Tax Board’s position wasapproximately $4.5 million. The amount of accrued interest associated with the additional taxwas approximately $20 million as of December 31, 2006. In addition, the State of Californiaenacted an amnesty provision that imposes nondeductible penalty interest equal to 50% of theunpaid interest amounts relating to taxable years ended before 2003. The penalty interest wasapproximately $10 million as of December 31, 2006. The tax and interest amounts continue tobe contested by Rohr. We believe that we are adequately reserved for this contingency. During2005, Rohr made payments of approximately $3.9 million ($0.6 million for tax and $3.3 millionfor interest) related to items that are not being contested and approximately $4.5 millionrelated to items that are being contested. No payment has been made for the $20 million ofinterest or $10 million of penalty interest. Under California law, Rohr may be required to paythe full amount of interest prior to filing any suit for refund. If required, Rohr expects to makethis payment and file suit for a refund in late 2007 or early 2008.
Item 4. Submission of Matters to a Vote of Security Holders
Not applicable.
Executive Officers of the Registrant
Marshall O. Larsen, age 58, Chairman, President and Chief Executive Officer
Mr. Larsen joined the Company in 1977 as an Operations Analyst. In 1981, he became Director ofPlanning and Analysis and subsequently Director of Product Marketing. In 1986, he becameAssistant to the President and later served as General Manager of several divisions of theCompany’s aerospace business. He was elected a Vice President of the Company and named aGroup Vice President of Goodrich Aerospace in 1994 and was elected an Executive Vice Presidentof the Company and President and Chief Operating Officer of Goodrich Aerospace in 1995. Hewas elected President and Chief Operating Officer and a director of the Company in February2002, Chief Executive Officer in April 2003 and Chairman in October 2003. Mr. Larsen is adirector of Lowe’s Companies, Inc. He received a B.S. in engineering from the U.S. MilitaryAcademy and an M.S. in industrial management from the Krannert Graduate School of Manage-ment at Purdue University.
John J. Carmola, age 51, Vice President and Segment President, Actuation and Landing Systems
Mr. Carmola joined the Company in 1996 as President of the Landing Gear Division. He served inthat position until 2000, when he was appointed President of the Engine Systems Division. Laterin 2000, Mr. Carmola was elected a Vice President of the Company and Group President, Engineand Safety Systems. In 2002, he was elected Vice President and Group President, ElectronicSystems. He was elected Vice President and Segment President, Engine Systems, in 2003, VicePresident and Segment President, Airframe Systems, in 2005, and Vice President and SegmentPresident, Actuation and Landing Systems in 2007. Prior to joining the Company, Mr. Carmolaserved in various management positions with General Electric Company. Mr. Carmola received aB.S. in mechanical and aerospace engineering from the University of Rochester and an M.B.A. infinance from Xavier University.
19
Cynthia M. Egnotovich, age 49, Vice President and Segment President, Nacelles and InteriorSystems
Ms. Egnotovich joined the Company in 1986 and served in various positions with the IceProtection Systems Division, including Controller from 1993 to 1996, Director of Operations from1996 to 1998 and Vice President and General Manager from 1998 to 2000. Ms. Egnotovich wasappointed as Vice President and General Manager of Commercial Wheels and Brakes in 2000.She was elected a Vice President of the Company and Group President, Engine and SafetySystems in 2002. In 2003, she was elected Vice President and Segment President, ElectronicSystems. Ms. Egnotovich was elected Vice President and Segment President, Engine Systems in2005. In 2007, she was elected Vice President and Segment President, Nacelles and InteriorSystems. Ms. Egnotovich received a B.B.A. in accounting from Kent State University and a B.S. inbiology from Immaculata College.
Gerald T. Witowski, age 59, Vice President and Segment President, Electronic Systems
Mr. Witowski joined the Company in 1978 as a Marketing Engineer in the Sensor Systemsbusiness. He was promoted to Vice President of Marketing and Sales in 1988 and was namedVice President and General Manager for the Commercial Transport Business Unit of SensorSystems as well the head of Goodrich’s Test System Business Unit in New Century, Kansas in1997. In January 2001, he was named President and General Manager of Sensor Systems. He waselected to his current position in March 2006. Prior to joining Goodrich, Mr. Witowski spent10 years on active duty in the U.S. Navy where he was a commissioned officer and pilot.Mr. Witowski received a B.S. in Aerospace Engineering, Naval Science from the U.S. NavalAcademy and an M.A. in Management and Human Relations from Webster University.
John J. Grisik, age 60, Executive Vice President, Operational Excellence and Technology
Mr. Grisik joined the Company in 1991 as General Manager of the De-Icing Systems Division. Heserved in that position until 1993, when he was appointed General Manager of the LandingGear Division. In 1995, he was appointed Group Vice President of Safety Systems and served inthat position until 1996 when he was appointed Group Vice President of Sensors and IntegratedSystems. In 2000, Mr. Grisik was elected a Vice President of the Company and Group President,Landing Systems. He was elected Vice President and Segment President, Airframe Systems, in2003, Vice President and Segment President, Electronic Systems, in 2005 and Executive VicePresident, Operational Excellence and Technology in March 2006. Prior to joining the Company,Mr. Grisik served in various management positions with General Electric Company and U.S. SteelCompany. Mr. Grisik received a B.S., M.S. and D.S. in engineering from the University ofCincinnati and an M.S. in management from Stanford University.
Terrence G. Linnert, age 60, Executive Vice President, Administration and General Counsel
Mr. Linnert joined the Company in 1997 as Senior Vice President and General Counsel. In 1999,he was elected to the additional positions of Senior Vice President, Human Resources andAdministration, and Secretary. He was elected Executive Vice President, Human Resources andAdministration, General Counsel in 2002 and Executive Vice President, Administration andGeneral Counsel in February 2005. Prior to joining Goodrich, Mr. Linnert was Senior VicePresident of Corporate Administration, Chief Financial Officer and General Counsel of CenteriorEnergy Corporation. Mr. Linnert received a B.S. in electrical engineering from the University ofNotre Dame and a J.D. from the Cleveland-Marshall School of Law at Cleveland State University.
Scott E. Kuechle, age 47, Senior Vice President and Chief Financial Officer
Mr. Kuechle joined the Company in 1983 as a Financial Analyst in the Company’s former TireDivision. He has held several subsequent management positions, including Manager of Planning
20
and Analysis in the Tire Division, Manager of Analysis in Corporate Analysis and Control as wellas Director of Planning and Control for the Company’s former Water Systems and ServicesGroup. He was promoted to Director of Finance and Banking in 1994 and elected Vice Presidentand Treasurer in 1998. Mr. Kuechle was elected Vice President and Controller in September 2004and served in that position until his election as Senior Vice President and Chief Financial Officerin August 2005. Mr. Kuechle received a B.B.A. in economics from the University of Wisconsin —Eau Claire and an M.S.I.A. in finance from Carnegie-Mellon University.
Jennifer Pollino, age 42, Senior Vice President, Human Resources
Ms. Pollino joined the Company in 1992 as an Accounting Manager at Aircraft EvacuationSystems and since that time has served in a variety of positions, including Controller of AircraftEvacuation Systems from 1995 to 1998, Vice President, Finance of the Safety Systems from 1999to 2000, Vice President and General Manager of Aircraft Seating Products from 2000 to 2001,President and General Manager of Turbomachinery Products from 2001 to 2002 and Presidentand General Manager of Aircraft Wheels and Brakes from 2002 to 2005. She was elected asSenior Vice President, Human Resources in February 2005. Prior to joining Goodrich, Ms. Pollinoserved as a Field Accounting Officer for the Resolution Trust Corporation from 1990 to 1992, asController of Lincoln Savings and Loan Association from 1987 to 1990 and as an Auditor for PeatMarwick Main & Co. from 1986 to 1987. Ms. Pollino received a B.B.A. in accounting from theUniversity of Notre Dame.
Scott A. Cottrill, age 41, Vice President and Controller
Mr. Cottrill joined the Company in 1998 as Director — External Reporting. He later served asDirector — Accounting and Financial Reporting from 1999 to 2002 and as Vice President, InternalAudit from 2002 to 2005. Mr. Cottrill was elected as Vice President and Controller effectiveOctober 2005. Prior to joining the Company, Mr. Cottrill served as a Senior Manager withPricewaterhouseCoopers LLP. Mr. Cottrill received a B.S. in accounting from The PennsylvaniaState University and is a Certified Public Accountant and a Certified Internal Auditor.
21
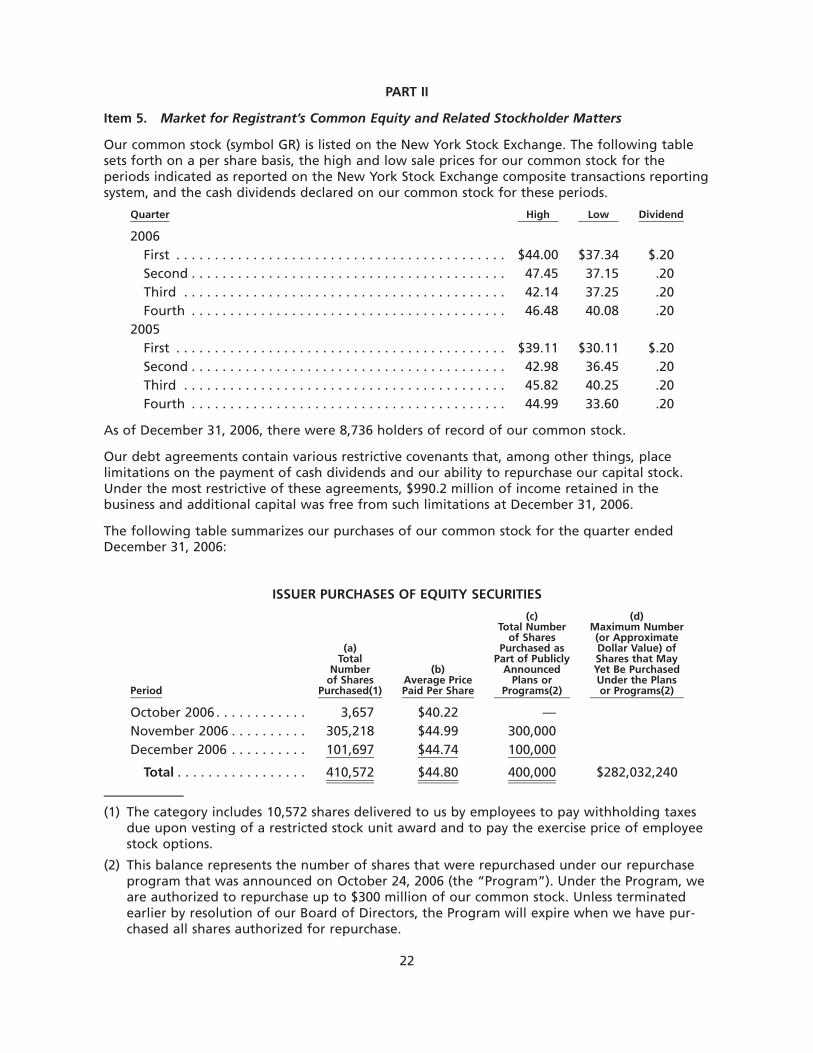
PART II
Item 5. Market for Registrant’s Common Equity and Related Stockholder Matters
Our common stock (symbol GR) is listed on the New York Stock Exchange. The following tablesets forth on a per share basis, the high and low sale prices for our common stock for theperiods indicated as reported on the New York Stock Exchange composite transactions reportingsystem, and the cash dividends declared on our common stock for these periods.
Quarter High Low Dividend
2006First . . . . . . . . . . . . . . . . . . . . . . . . . . . . . . . . . . . . . . . . . . . $44.00 $37.34 $.20Second . . . . . . . . . . . . . . . . . . . . . . . . . . . . . . . . . . . . . . . . . 47.45 37.15 .20Third . . . . . . . . . . . . . . . . . . . . . . . . . . . . . . . . . . . . . . . . . . 42.14 37.25 .20Fourth . . . . . . . . . . . . . . . . . . . . . . . . . . . . . . . . . . . . . . . . . 46.48 40.08 .20
2005First . . . . . . . . . . . . . . . . . . . . . . . . . . . . . . . . . . . . . . . . . . . $39.11 $30.11 $.20Second . . . . . . . . . . . . . . . . . . . . . . . . . . . . . . . . . . . . . . . . . 42.98 36.45 .20Third . . . . . . . . . . . . . . . . . . . . . . . . . . . . . . . . . . . . . . . . . . 45.82 40.25 .20Fourth . . . . . . . . . . . . . . . . . . . . . . . . . . . . . . . . . . . . . . . . . 44.99 33.60 .20
As of December 31, 2006, there were 8,736 holders of record of our common stock.
Our debt agreements contain various restrictive covenants that, among other things, placelimitations on the payment of cash dividends and our ability to repurchase our capital stock.Under the most restrictive of these agreements, $990.2 million of income retained in thebusiness and additional capital was free from such limitations at December 31, 2006.
The following table summarizes our purchases of our common stock for the quarter endedDecember 31, 2006:
ISSUER PURCHASES OF EQUITY SECURITIES
Period
(a)Total
Numberof Shares
Purchased(1)
(b)Average PricePaid Per Share
(c)Total Number
of SharesPurchased as
Part of PubliclyAnnounced
Plans orPrograms(2)
(d)Maximum Number(or ApproximateDollar Value) ofShares that MayYet Be PurchasedUnder the Plansor Programs(2)
October 2006 . . . . . . . . . . . . 3,657 $40.22 —November 2006 . . . . . . . . . . 305,218 $44.99 300,000December 2006 . . . . . . . . . . 101,697 $44.74 100,000
Total . . . . . . . . . . . . . . . . . 410,572 $44.80 400,000 $282,032,240
(1) The category includes 10,572 shares delivered to us by employees to pay withholding taxesdue upon vesting of a restricted stock unit award and to pay the exercise price of employeestock options.
(2) This balance represents the number of shares that were repurchased under our repurchaseprogram that was announced on October 24, 2006 (the “Program”). Under the Program, weare authorized to repurchase up to $300 million of our common stock. Unless terminatedearlier by resolution of our Board of Directors, the Program will expire when we have pur-chased all shares authorized for repurchase.
22
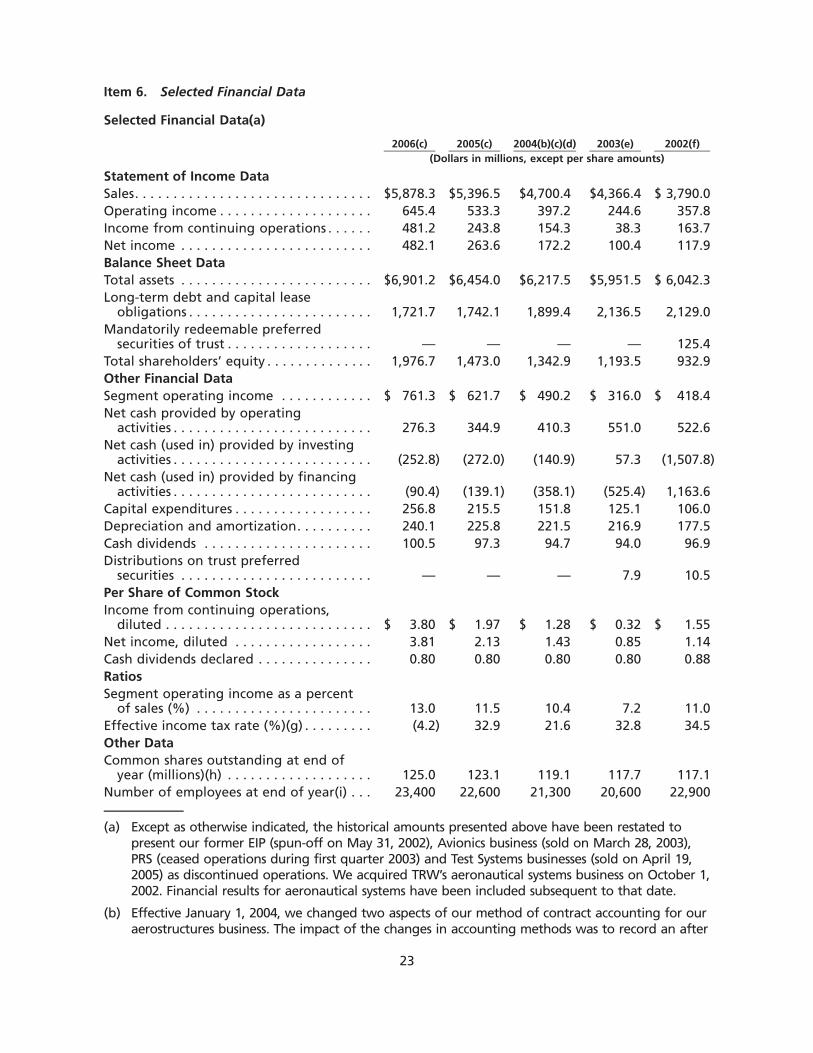
Item 6. Selected Financial Data
Selected Financial Data(a)
2006(c) 2005(c) 2004(b)(c)(d) 2003(e) 2002(f)(Dollars in millions, except per share amounts)
Statement of Income DataSales. . . . . . . . . . . . . . . . . . . . . . . . . . . . . . . $5,878.3 $5,396.5 $4,700.4 $4,366.4 $ 3,790.0Operating income . . . . . . . . . . . . . . . . . . . . 645.4 533.3 397.2 244.6 357.8Income from continuing operations . . . . . . 481.2 243.8 154.3 38.3 163.7Net income . . . . . . . . . . . . . . . . . . . . . . . . . 482.1 263.6 172.2 100.4 117.9Balance Sheet DataTotal assets . . . . . . . . . . . . . . . . . . . . . . . . . $6,901.2 $6,454.0 $6,217.5 $5,951.5 $ 6,042.3Long-term debt and capital lease
obligations . . . . . . . . . . . . . . . . . . . . . . . . 1,721.7 1,742.1 1,899.4 2,136.5 2,129.0Mandatorily redeemable preferred
securities of trust . . . . . . . . . . . . . . . . . . . — — — — 125.4Total shareholders’ equity . . . . . . . . . . . . . . 1,976.7 1,473.0 1,342.9 1,193.5 932.9Other Financial DataSegment operating income . . . . . . . . . . . . $ 761.3 $ 621.7 $ 490.2 $ 316.0 $ 418.4Net cash provided by operating
activities . . . . . . . . . . . . . . . . . . . . . . . . . . 276.3 344.9 410.3 551.0 522.6Net cash (used in) provided by investing
activities . . . . . . . . . . . . . . . . . . . . . . . . . . (252.8) (272.0) (140.9) 57.3 (1,507.8)Net cash (used in) provided by financing
activities . . . . . . . . . . . . . . . . . . . . . . . . . . (90.4) (139.1) (358.1) (525.4) 1,163.6Capital expenditures . . . . . . . . . . . . . . . . . . 256.8 215.5 151.8 125.1 106.0Depreciation and amortization. . . . . . . . . . 240.1 225.8 221.5 216.9 177.5Cash dividends . . . . . . . . . . . . . . . . . . . . . . 100.5 97.3 94.7 94.0 96.9Distributions on trust preferred
securities . . . . . . . . . . . . . . . . . . . . . . . . . — — — 7.9 10.5Per Share of Common StockIncome from continuing operations,
diluted . . . . . . . . . . . . . . . . . . . . . . . . . . . $ 3.80 $ 1.97 $ 1.28 $ 0.32 $ 1.55Net income, diluted . . . . . . . . . . . . . . . . . . 3.81 2.13 1.43 0.85 1.14Cash dividends declared . . . . . . . . . . . . . . . 0.80 0.80 0.80 0.80 0.88RatiosSegment operating income as a percent
of sales (%) . . . . . . . . . . . . . . . . . . . . . . . 13.0 11.5 10.4 7.2 11.0Effective income tax rate (%)(g) . . . . . . . . . (4.2) 32.9 21.6 32.8 34.5Other DataCommon shares outstanding at end of
year (millions)(h) . . . . . . . . . . . . . . . . . . . 125.0 123.1 119.1 117.7 117.1Number of employees at end of year(i) . . . 23,400 22,600 21,300 20,600 22,900
(a) Except as otherwise indicated, the historical amounts presented above have been restated topresent our former EIP (spun-off on May 31, 2002), Avionics business (sold on March 28, 2003),PRS (ceased operations during first quarter 2003) and Test Systems businesses (sold on April 19,2005) as discontinued operations. We acquired TRW’s aeronautical systems business on October 1,2002. Financial results for aeronautical systems have been included subsequent to that date.
(b) Effective January 1, 2004, we changed two aspects of our method of contract accounting for ouraerostructures business. The impact of the changes in accounting methods was to record an after
23
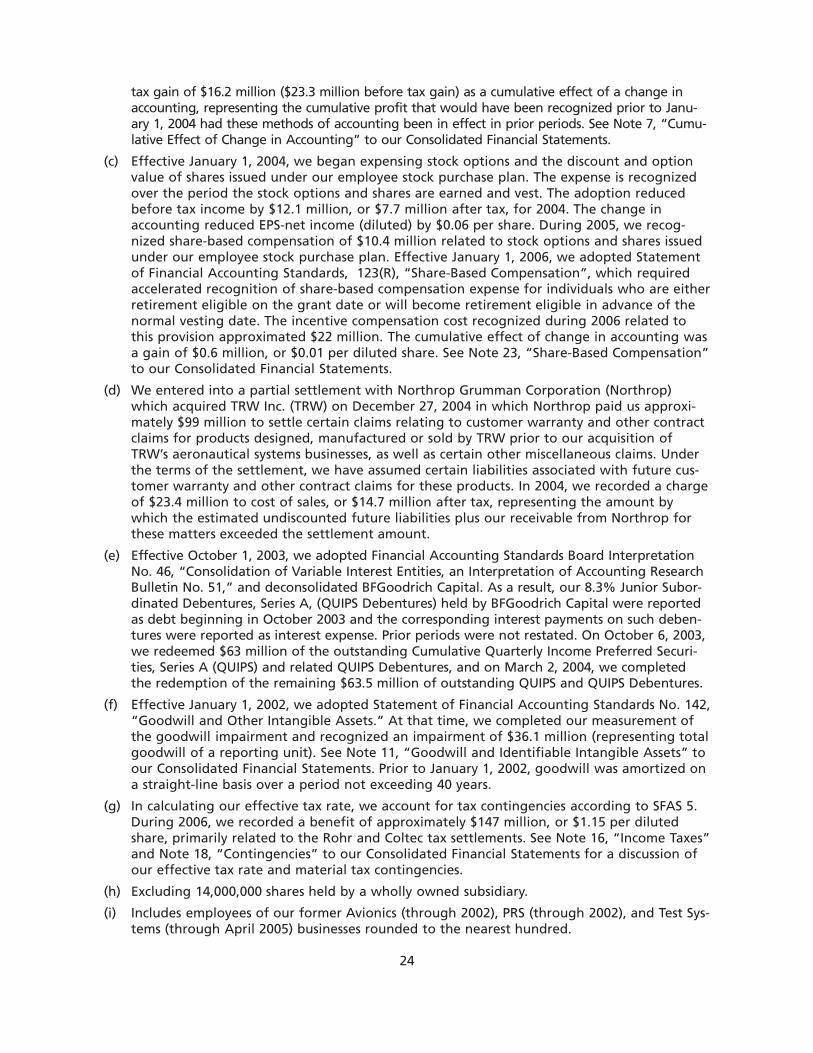
tax gain of $16.2 million ($23.3 million before tax gain) as a cumulative effect of a change inaccounting, representing the cumulative profit that would have been recognized prior to Janu-ary 1, 2004 had these methods of accounting been in effect in prior periods. See Note 7, “Cumu-lative Effect of Change in Accounting” to our Consolidated Financial Statements.
(c) Effective January 1, 2004, we began expensing stock options and the discount and optionvalue of shares issued under our employee stock purchase plan. The expense is recognizedover the period the stock options and shares are earned and vest. The adoption reducedbefore tax income by $12.1 million, or $7.7 million after tax, for 2004. The change inaccounting reduced EPS-net income (diluted) by $0.06 per share. During 2005, we recog-nized share-based compensation of $10.4 million related to stock options and shares issuedunder our employee stock purchase plan. Effective January 1, 2006, we adopted Statementof Financial Accounting Standards, 123(R), “Share-Based Compensation”, which requiredaccelerated recognition of share-based compensation expense for individuals who are eitherretirement eligible on the grant date or will become retirement eligible in advance of thenormal vesting date. The incentive compensation cost recognized during 2006 related tothis provision approximated $22 million. The cumulative effect of change in accounting wasa gain of $0.6 million, or $0.01 per diluted share. See Note 23, “Share-Based Compensation”to our Consolidated Financial Statements.
(d) We entered into a partial settlement with Northrop Grumman Corporation (Northrop)which acquired TRW Inc. (TRW) on December 27, 2004 in which Northrop paid us approxi-mately $99 million to settle certain claims relating to customer warranty and other contractclaims for products designed, manufactured or sold by TRW prior to our acquisition ofTRW’s aeronautical systems businesses, as well as certain other miscellaneous claims. Underthe terms of the settlement, we have assumed certain liabilities associated with future cus-tomer warranty and other contract claims for these products. In 2004, we recorded a chargeof $23.4 million to cost of sales, or $14.7 million after tax, representing the amount bywhich the estimated undiscounted future liabilities plus our receivable from Northrop forthese matters exceeded the settlement amount.
(e) Effective October 1, 2003, we adopted Financial Accounting Standards Board InterpretationNo. 46, “Consolidation of Variable Interest Entities, an Interpretation of Accounting ResearchBulletin No. 51,” and deconsolidated BFGoodrich Capital. As a result, our 8.3% Junior Subor-dinated Debentures, Series A, (QUIPS Debentures) held by BFGoodrich Capital were reportedas debt beginning in October 2003 and the corresponding interest payments on such deben-tures were reported as interest expense. Prior periods were not restated. On October 6, 2003,we redeemed $63 million of the outstanding Cumulative Quarterly Income Preferred Securi-ties, Series A (QUIPS) and related QUIPS Debentures, and on March 2, 2004, we completedthe redemption of the remaining $63.5 million of outstanding QUIPS and QUIPS Debentures.
(f) Effective January 1, 2002, we adopted Statement of Financial Accounting Standards No. 142,“Goodwill and Other Intangible Assets.” At that time, we completed our measurement ofthe goodwill impairment and recognized an impairment of $36.1 million (representing totalgoodwill of a reporting unit). See Note 11, “Goodwill and Identifiable Intangible Assets” toour Consolidated Financial Statements. Prior to January 1, 2002, goodwill was amortized ona straight-line basis over a period not exceeding 40 years.
(g) In calculating our effective tax rate, we account for tax contingencies according to SFAS 5.During 2006, we recorded a benefit of approximately $147 million, or $1.15 per dilutedshare, primarily related to the Rohr and Coltec tax settlements. See Note 16, “Income Taxes”and Note 18, “Contingencies” to our Consolidated Financial Statements for a discussion ofour effective tax rate and material tax contingencies.
(h) Excluding 14,000,000 shares held by a wholly owned subsidiary.
(i) Includes employees of our former Avionics (through 2002), PRS (through 2002), and Test Sys-tems (through April 2005) businesses rounded to the nearest hundred.
24
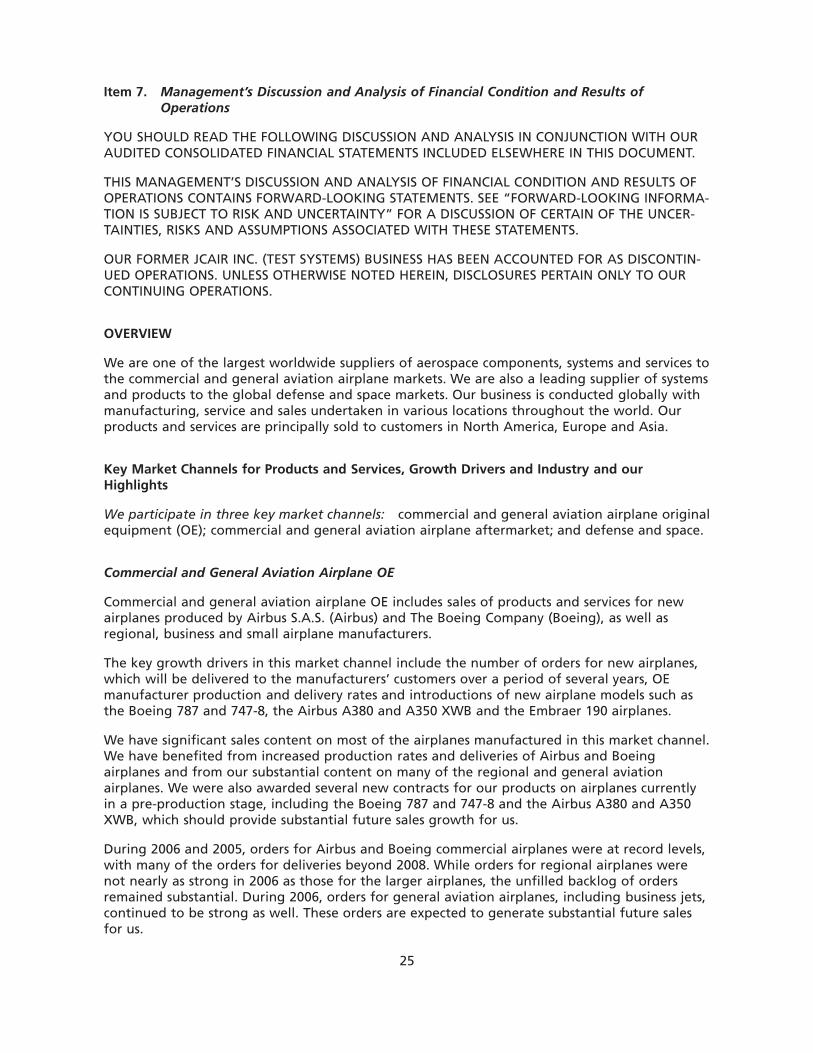
Item 7. Management’s Discussion and Analysis of Financial Condition and Results ofOperations
YOU SHOULD READ THE FOLLOWING DISCUSSION AND ANALYSIS IN CONJUNCTION WITH OURAUDITED CONSOLIDATED FINANCIAL STATEMENTS INCLUDED ELSEWHERE IN THIS DOCUMENT.
THIS MANAGEMENT’S DISCUSSION AND ANALYSIS OF FINANCIAL CONDITION AND RESULTS OFOPERATIONS CONTAINS FORWARD-LOOKING STATEMENTS. SEE “FORWARD-LOOKING INFORMA-TION IS SUBJECT TO RISK AND UNCERTAINTY” FOR A DISCUSSION OF CERTAIN OF THE UNCER-TAINTIES, RISKS AND ASSUMPTIONS ASSOCIATED WITH THESE STATEMENTS.
OUR FORMER JCAIR INC. (TEST SYSTEMS) BUSINESS HAS BEEN ACCOUNTED FOR AS DISCONTIN-UED OPERATIONS. UNLESS OTHERWISE NOTED HEREIN, DISCLOSURES PERTAIN ONLY TO OURCONTINUING OPERATIONS.
OVERVIEW
We are one of the largest worldwide suppliers of aerospace components, systems and services tothe commercial and general aviation airplane markets. We are also a leading supplier of systemsand products to the global defense and space markets. Our business is conducted globally withmanufacturing, service and sales undertaken in various locations throughout the world. Ourproducts and services are principally sold to customers in North America, Europe and Asia.
Key Market Channels for Products and Services, Growth Drivers and Industry and ourHighlights
We participate in three key market channels: commercial and general aviation airplane originalequipment (OE); commercial and general aviation airplane aftermarket; and defense and space.
Commercial and General Aviation Airplane OE
Commercial and general aviation airplane OE includes sales of products and services for newairplanes produced by Airbus S.A.S. (Airbus) and The Boeing Company (Boeing), as well asregional, business and small airplane manufacturers.
The key growth drivers in this market channel include the number of orders for new airplanes,which will be delivered to the manufacturers’ customers over a period of several years, OEmanufacturer production and delivery rates and introductions of new airplane models such asthe Boeing 787 and 747-8, the Airbus A380 and A350 XWB and the Embraer 190 airplanes.
We have significant sales content on most of the airplanes manufactured in this market channel.We have benefited from increased production rates and deliveries of Airbus and Boeingairplanes and from our substantial content on many of the regional and general aviationairplanes. We were also awarded several new contracts for our products on airplanes currentlyin a pre-production stage, including the Boeing 787 and 747-8 and the Airbus A380 and A350XWB, which should provide substantial future sales growth for us.
During 2006 and 2005, orders for Airbus and Boeing commercial airplanes were at record levels,with many of the orders for deliveries beyond 2008. While orders for regional airplanes werenot nearly as strong in 2006 as those for the larger airplanes, the unfilled backlog of ordersremained substantial. During 2006, orders for general aviation airplanes, including business jets,continued to be strong as well. These orders are expected to generate substantial future salesfor us.
25
Commercial and General Aviation Airplane Aftermarket
The commercial and general aviation airplane aftermarket channel includes sales of productsand services for existing commercial and general aviation airplanes, primarily to airlines andpackage carriers around the world.
The key growth drivers in this channel include worldwide passenger capacity growth measuredby Available Seat Miles (ASM) and the size and activity level of the airplane fleet. Otherimportant factors affecting growth in this market channel are the age of the airplanes in thefleet and Gross Domestic Product (GDP) trends in countries and regions around the world.
We estimate that capacity in the global airline system, as measured by ASMs, will growapproximately 4% to 5% annually in 2007 through 2011. We expect that the global airplanefleet will continue to grow in 2007 and beyond, as the OE manufacturers are expected to delivermore airplanes than are retired.
We have significant product content on most of the airplane models that are currently inservice. We have benefited from good growth in ASMs, especially in Asia, and from the aging ofthe worldwide fleet of airplanes.
Defense and Space
Worldwide defense and space sales include sales to prime contractors such as Boeing, NorthropGrumman, Lockheed Martin, the U.S. Government and foreign companies and governments.
The key growth drivers in this channel include the level of defense spending by the U.S. andforeign governments, the number of new platform starts, the level of military flight operationsand the level of upgrade, overhaul and maintenance activities associated with existingplatforms.
The market for our defense and space products is global, and is not dependent on any singleprogram, platform or customer. While we anticipate fewer new platform starts over the nextseveral years, which are expected to negatively affect OE sales, we anticipate that upgrades onexisting defense and space platforms will be necessary and will provide long-term growth in thismarket channel. Additionally, we are participating in, and developing new products for therapidly expanding homeland security and intelligence, surveillance and reconnaissance sectors,which should further strengthen our position in this market channel.
Long-term Sustainable Growth
We believe that we are well positioned to continue to grow our commercial airplane anddefense and space sales due to:
• Awards for key products on important new and expected programs, including the AirbusA380 and A350 XWB, the Boeing 787 and 747-8, the Embraer 190, the Dassault Falcon 7Xand the Lockheed Martin F-35 Lightning II and F-22 Raptor;
• Growing commercial airplane fleet, which should fuel sustained aftermarket strength;
• Balance in the large commercial airplane market, with strong sales to both Airbus andBoeing;
• Aging of the existing large commercial and regional airplane fleets, which should resultin increased aftermarket support;
• Increased number of long-term agreements for product sales on new and existingcommercial airplanes;
• Increased opportunities for aftermarket growth due to airline outsourcing;
26
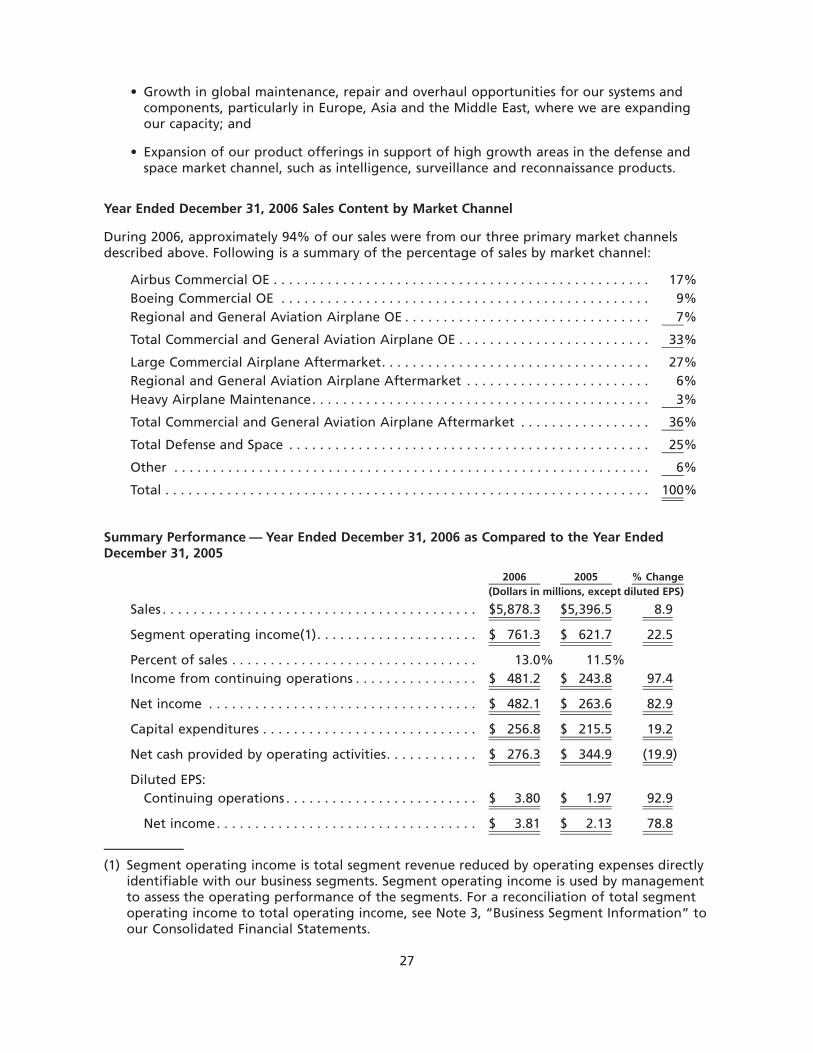
• Growth in global maintenance, repair and overhaul opportunities for our systems andcomponents, particularly in Europe, Asia and the Middle East, where we are expandingour capacity; and
• Expansion of our product offerings in support of high growth areas in the defense andspace market channel, such as intelligence, surveillance and reconnaissance products.
Year Ended December 31, 2006 Sales Content by Market Channel
During 2006, approximately 94% of our sales were from our three primary market channelsdescribed above. Following is a summary of the percentage of sales by market channel:
Airbus Commercial OE . . . . . . . . . . . . . . . . . . . . . . . . . . . . . . . . . . . . . . . . . . . . . . . . . 17%Boeing Commercial OE . . . . . . . . . . . . . . . . . . . . . . . . . . . . . . . . . . . . . . . . . . . . . . . . 9%Regional and General Aviation Airplane OE . . . . . . . . . . . . . . . . . . . . . . . . . . . . . . . . 7%
Total Commercial and General Aviation Airplane OE . . . . . . . . . . . . . . . . . . . . . . . . . 33%
Large Commercial Airplane Aftermarket. . . . . . . . . . . . . . . . . . . . . . . . . . . . . . . . . . . 27%Regional and General Aviation Airplane Aftermarket . . . . . . . . . . . . . . . . . . . . . . . . 6%Heavy Airplane Maintenance. . . . . . . . . . . . . . . . . . . . . . . . . . . . . . . . . . . . . . . . . . . . 3%
Total Commercial and General Aviation Airplane Aftermarket . . . . . . . . . . . . . . . . . 36%
Total Defense and Space . . . . . . . . . . . . . . . . . . . . . . . . . . . . . . . . . . . . . . . . . . . . . . . 25%
Other . . . . . . . . . . . . . . . . . . . . . . . . . . . . . . . . . . . . . . . . . . . . . . . . . . . . . . . . . . . . . . 6%
Total . . . . . . . . . . . . . . . . . . . . . . . . . . . . . . . . . . . . . . . . . . . . . . . . . . . . . . . . . . . . . . . 100%
Summary Performance — Year Ended December 31, 2006 as Compared to the Year EndedDecember 31, 2005
2006 2005 % Change(Dollars in millions, except diluted EPS)
Sales . . . . . . . . . . . . . . . . . . . . . . . . . . . . . . . . . . . . . . . . . $5,878.3 $5,396.5 8.9
Segment operating income(1). . . . . . . . . . . . . . . . . . . . . $ 761.3 $ 621.7 22.5
Percent of sales . . . . . . . . . . . . . . . . . . . . . . . . . . . . . . . . 13.0% 11.5%Income from continuing operations . . . . . . . . . . . . . . . . $ 481.2 $ 243.8 97.4
Net income . . . . . . . . . . . . . . . . . . . . . . . . . . . . . . . . . . . $ 482.1 $ 263.6 82.9
Capital expenditures . . . . . . . . . . . . . . . . . . . . . . . . . . . . $ 256.8 $ 215.5 19.2
Net cash provided by operating activities. . . . . . . . . . . . $ 276.3 $ 344.9 (19.9)
Diluted EPS:Continuing operations . . . . . . . . . . . . . . . . . . . . . . . . . $ 3.80 $ 1.97 92.9
Net income. . . . . . . . . . . . . . . . . . . . . . . . . . . . . . . . . . $ 3.81 $ 2.13 78.8
(1) Segment operating income is total segment revenue reduced by operating expenses directlyidentifiable with our business segments. Segment operating income is used by managementto assess the operating performance of the segments. For a reconciliation of total segmentoperating income to total operating income, see Note 3, “Business Segment Information” toour Consolidated Financial Statements.
27
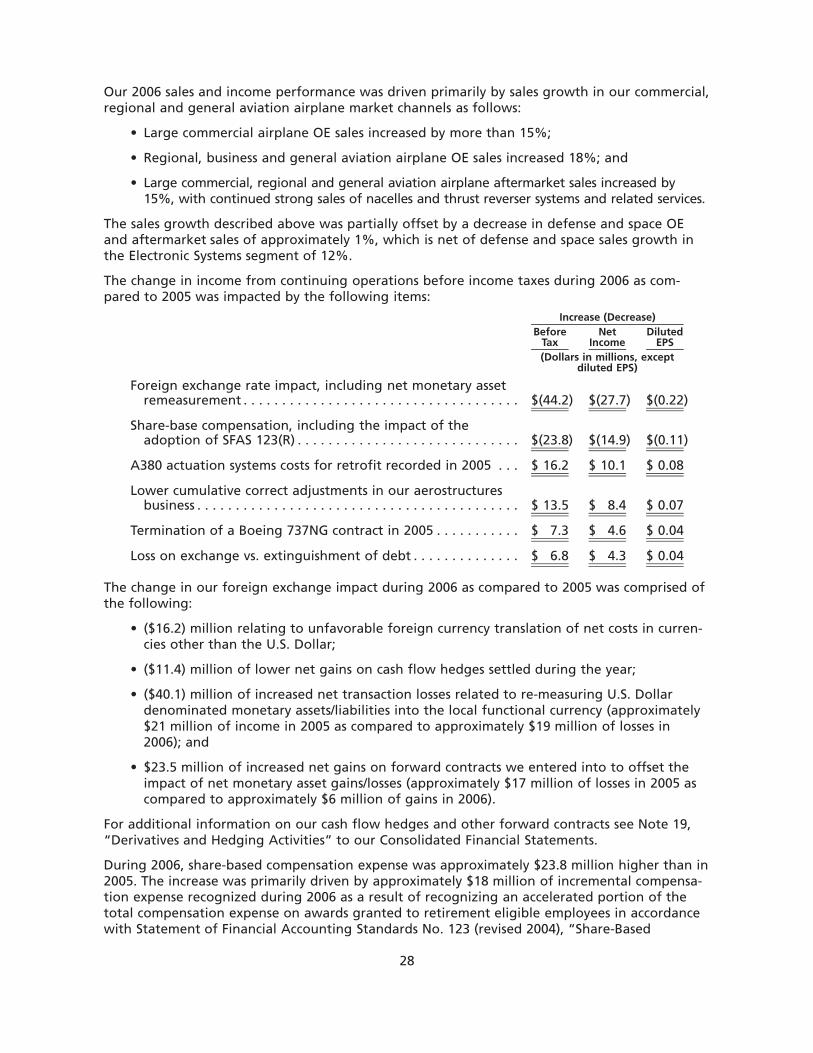
Our 2006 sales and income performance was driven primarily by sales growth in our commercial,regional and general aviation airplane market channels as follows:
• Large commercial airplane OE sales increased by more than 15%;
• Regional, business and general aviation airplane OE sales increased 18%; and
• Large commercial, regional and general aviation airplane aftermarket sales increased by15%, with continued strong sales of nacelles and thrust reverser systems and related services.
The sales growth described above was partially offset by a decrease in defense and space OEand aftermarket sales of approximately 1%, which is net of defense and space sales growth inthe Electronic Systems segment of 12%.
The change in income from continuing operations before income taxes during 2006 as com-pared to 2005 was impacted by the following items:
BeforeTax
NetIncome
DilutedEPS
Increase (Decrease)
(Dollars in millions, exceptdiluted EPS)
Foreign exchange rate impact, including net monetary assetremeasurement . . . . . . . . . . . . . . . . . . . . . . . . . . . . . . . . . . . . $(44.2) $(27.7) $(0.22)
Share-base compensation, including the impact of theadoption of SFAS 123(R) . . . . . . . . . . . . . . . . . . . . . . . . . . . . . $(23.8) $(14.9) $(0.11)
A380 actuation systems costs for retrofit recorded in 2005 . . . $ 16.2 $ 10.1 $ 0.08
Lower cumulative correct adjustments in our aerostructuresbusiness . . . . . . . . . . . . . . . . . . . . . . . . . . . . . . . . . . . . . . . . . . $ 13.5 $ 8.4 $ 0.07
Termination of a Boeing 737NG contract in 2005 . . . . . . . . . . . $ 7.3 $ 4.6 $ 0.04
Loss on exchange vs. extinguishment of debt . . . . . . . . . . . . . . $ 6.8 $ 4.3 $ 0.04
The change in our foreign exchange impact during 2006 as compared to 2005 was comprised ofthe following:
• ($16.2) million relating to unfavorable foreign currency translation of net costs in curren-cies other than the U.S. Dollar;
• ($11.4) million of lower net gains on cash flow hedges settled during the year;
• ($40.1) million of increased net transaction losses related to re-measuring U.S. Dollardenominated monetary assets/liabilities into the local functional currency (approximately$21 million of income in 2005 as compared to approximately $19 million of losses in2006); and
• $23.5 million of increased net gains on forward contracts we entered into to offset theimpact of net monetary asset gains/losses (approximately $17 million of losses in 2005 ascompared to approximately $6 million of gains in 2006).
For additional information on our cash flow hedges and other forward contracts see Note 19,“Derivatives and Hedging Activities” to our Consolidated Financial Statements.
During 2006, share-based compensation expense was approximately $23.8 million higher than in2005. The increase was primarily driven by approximately $18 million of incremental compensa-tion expense recognized during 2006 as a result of recognizing an accelerated portion of thetotal compensation expense on awards granted to retirement eligible employees in accordancewith Statement of Financial Accounting Standards No. 123 (revised 2004), “Share-Based
28
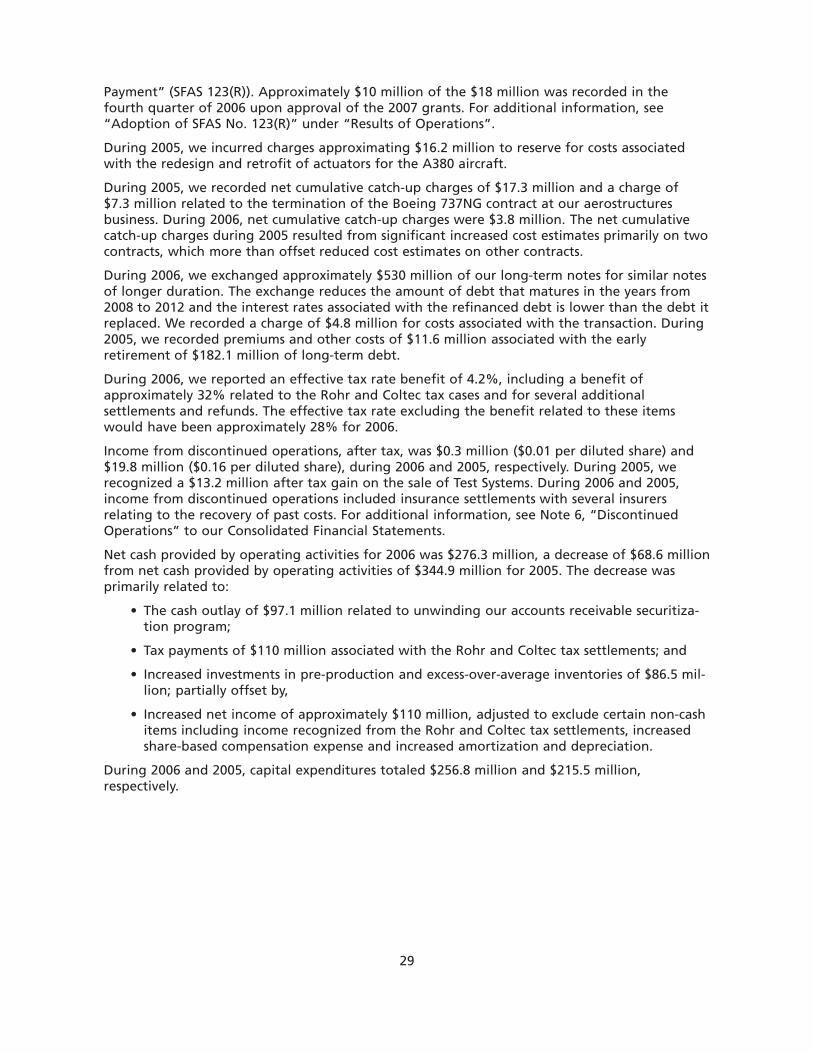
Payment” (SFAS 123(R)). Approximately $10 million of the $18 million was recorded in thefourth quarter of 2006 upon approval of the 2007 grants. For additional information, see“Adoption of SFAS No. 123(R)” under “Results of Operations”.
During 2005, we incurred charges approximating $16.2 million to reserve for costs associatedwith the redesign and retrofit of actuators for the A380 aircraft.
During 2005, we recorded net cumulative catch-up charges of $17.3 million and a charge of$7.3 million related to the termination of the Boeing 737NG contract at our aerostructuresbusiness. During 2006, net cumulative catch-up charges were $3.8 million. The net cumulativecatch-up charges during 2005 resulted from significant increased cost estimates primarily on twocontracts, which more than offset reduced cost estimates on other contracts.
During 2006, we exchanged approximately $530 million of our long-term notes for similar notesof longer duration. The exchange reduces the amount of debt that matures in the years from2008 to 2012 and the interest rates associated with the refinanced debt is lower than the debt itreplaced. We recorded a charge of $4.8 million for costs associated with the transaction. During2005, we recorded premiums and other costs of $11.6 million associated with the earlyretirement of $182.1 million of long-term debt.
During 2006, we reported an effective tax rate benefit of 4.2%, including a benefit ofapproximately 32% related to the Rohr and Coltec tax cases and for several additionalsettlements and refunds. The effective tax rate excluding the benefit related to these itemswould have been approximately 28% for 2006.
Income from discontinued operations, after tax, was $0.3 million ($0.01 per diluted share) and$19.8 million ($0.16 per diluted share), during 2006 and 2005, respectively. During 2005, werecognized a $13.2 million after tax gain on the sale of Test Systems. During 2006 and 2005,income from discontinued operations included insurance settlements with several insurersrelating to the recovery of past costs. For additional information, see Note 6, “DiscontinuedOperations” to our Consolidated Financial Statements.
Net cash provided by operating activities for 2006 was $276.3 million, a decrease of $68.6 millionfrom net cash provided by operating activities of $344.9 million for 2005. The decrease wasprimarily related to:
• The cash outlay of $97.1 million related to unwinding our accounts receivable securitiza-tion program;
• Tax payments of $110 million associated with the Rohr and Coltec tax settlements; and
• Increased investments in pre-production and excess-over-average inventories of $86.5 mil-lion; partially offset by,
• Increased net income of approximately $110 million, adjusted to exclude certain non-cashitems including income recognized from the Rohr and Coltec tax settlements, increasedshare-based compensation expense and increased amortization and depreciation.
During 2006 and 2005, capital expenditures totaled $256.8 million and $215.5 million,respectively.
29
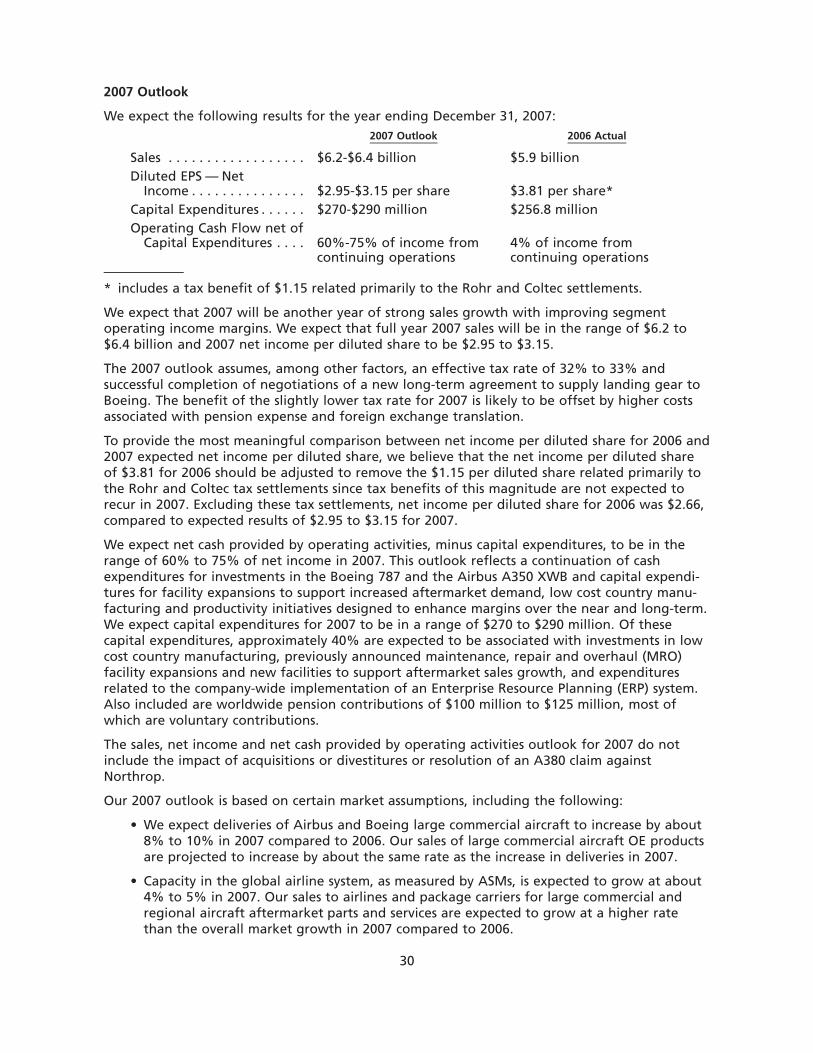
2007 Outlook
We expect the following results for the year ending December 31, 2007:2007 Outlook 2006 Actual
Sales . . . . . . . . . . . . . . . . . . $6.2-$6.4 billion $5.9 billionDiluted EPS — Net
Income . . . . . . . . . . . . . . . $2.95-$3.15 per share $3.81 per share*Capital Expenditures . . . . . . $270-$290 million $256.8 millionOperating Cash Flow net of
Capital Expenditures . . . . 60%-75% of income fromcontinuing operations
4% of income fromcontinuing operations
* includes a tax benefit of $1.15 related primarily to the Rohr and Coltec settlements.
We expect that 2007 will be another year of strong sales growth with improving segmentoperating income margins. We expect that full year 2007 sales will be in the range of $6.2 to$6.4 billion and 2007 net income per diluted share to be $2.95 to $3.15.
The 2007 outlook assumes, among other factors, an effective tax rate of 32% to 33% andsuccessful completion of negotiations of a new long-term agreement to supply landing gear toBoeing. The benefit of the slightly lower tax rate for 2007 is likely to be offset by higher costsassociated with pension expense and foreign exchange translation.
To provide the most meaningful comparison between net income per diluted share for 2006 and2007 expected net income per diluted share, we believe that the net income per diluted shareof $3.81 for 2006 should be adjusted to remove the $1.15 per diluted share related primarily tothe Rohr and Coltec tax settlements since tax benefits of this magnitude are not expected torecur in 2007. Excluding these tax settlements, net income per diluted share for 2006 was $2.66,compared to expected results of $2.95 to $3.15 for 2007.
We expect net cash provided by operating activities, minus capital expenditures, to be in therange of 60% to 75% of net income in 2007. This outlook reflects a continuation of cashexpenditures for investments in the Boeing 787 and the Airbus A350 XWB and capital expendi-tures for facility expansions to support increased aftermarket demand, low cost country manu-facturing and productivity initiatives designed to enhance margins over the near and long-term.We expect capital expenditures for 2007 to be in a range of $270 to $290 million. Of thesecapital expenditures, approximately 40% are expected to be associated with investments in lowcost country manufacturing, previously announced maintenance, repair and overhaul (MRO)facility expansions and new facilities to support aftermarket sales growth, and expendituresrelated to the company-wide implementation of an Enterprise Resource Planning (ERP) system.Also included are worldwide pension contributions of $100 million to $125 million, most ofwhich are voluntary contributions.
The sales, net income and net cash provided by operating activities outlook for 2007 do notinclude the impact of acquisitions or divestitures or resolution of an A380 claim againstNorthrop.
Our 2007 outlook is based on certain market assumptions, including the following:
• We expect deliveries of Airbus and Boeing large commercial aircraft to increase by about8% to 10% in 2007 compared to 2006. Our sales of large commercial aircraft OE productsare projected to increase by about the same rate as the increase in deliveries in 2007.
• Capacity in the global airline system, as measured by ASMs, is expected to grow at about4% to 5% in 2007. Our sales to airlines and package carriers for large commercial andregional aircraft aftermarket parts and services are expected to grow at a higher ratethan the overall market growth in 2007 compared to 2006.
30
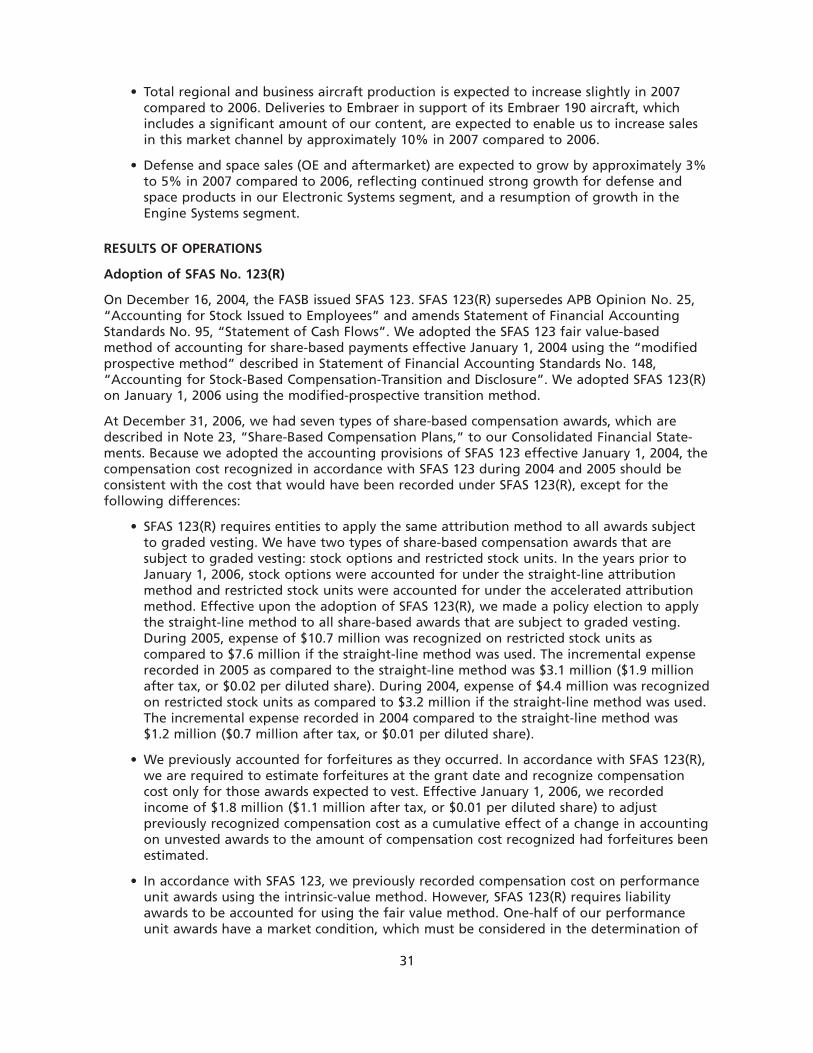
• Total regional and business aircraft production is expected to increase slightly in 2007compared to 2006. Deliveries to Embraer in support of its Embraer 190 aircraft, whichincludes a significant amount of our content, are expected to enable us to increase salesin this market channel by approximately 10% in 2007 compared to 2006.
• Defense and space sales (OE and aftermarket) are expected to grow by approximately 3%to 5% in 2007 compared to 2006, reflecting continued strong growth for defense andspace products in our Electronic Systems segment, and a resumption of growth in theEngine Systems segment.
RESULTS OF OPERATIONS
Adoption of SFAS No. 123(R)
On December 16, 2004, the FASB issued SFAS 123. SFAS 123(R) supersedes APB Opinion No. 25,“Accounting for Stock Issued to Employees” and amends Statement of Financial AccountingStandards No. 95, “Statement of Cash Flows”. We adopted the SFAS 123 fair value-basedmethod of accounting for share-based payments effective January 1, 2004 using the “modifiedprospective method” described in Statement of Financial Accounting Standards No. 148,“Accounting for Stock-Based Compensation-Transition and Disclosure”. We adopted SFAS 123(R)on January 1, 2006 using the modified-prospective transition method.
At December 31, 2006, we had seven types of share-based compensation awards, which aredescribed in Note 23, “Share-Based Compensation Plans,” to our Consolidated Financial State-ments. Because we adopted the accounting provisions of SFAS 123 effective January 1, 2004, thecompensation cost recognized in accordance with SFAS 123 during 2004 and 2005 should beconsistent with the cost that would have been recorded under SFAS 123(R), except for thefollowing differences:
• SFAS 123(R) requires entities to apply the same attribution method to all awards subjectto graded vesting. We have two types of share-based compensation awards that aresubject to graded vesting: stock options and restricted stock units. In the years prior toJanuary 1, 2006, stock options were accounted for under the straight-line attributionmethod and restricted stock units were accounted for under the accelerated attributionmethod. Effective upon the adoption of SFAS 123(R), we made a policy election to applythe straight-line method to all share-based awards that are subject to graded vesting.During 2005, expense of $10.7 million was recognized on restricted stock units ascompared to $7.6 million if the straight-line method was used. The incremental expenserecorded in 2005 as compared to the straight-line method was $3.1 million ($1.9 millionafter tax, or $0.02 per diluted share). During 2004, expense of $4.4 million was recognizedon restricted stock units as compared to $3.2 million if the straight-line method was used.The incremental expense recorded in 2004 compared to the straight-line method was$1.2 million ($0.7 million after tax, or $0.01 per diluted share).
• We previously accounted for forfeitures as they occurred. In accordance with SFAS 123(R),we are required to estimate forfeitures at the grant date and recognize compensationcost only for those awards expected to vest. Effective January 1, 2006, we recordedincome of $1.8 million ($1.1 million after tax, or $0.01 per diluted share) to adjustpreviously recognized compensation cost as a cumulative effect of a change in accountingon unvested awards to the amount of compensation cost recognized had forfeitures beenestimated.
• In accordance with SFAS 123, we previously recorded compensation cost on performanceunit awards using the intrinsic-value method. However, SFAS 123(R) requires liabilityawards to be accounted for using the fair value method. One-half of our performanceunit awards have a market condition, which must be considered in the determination of
31
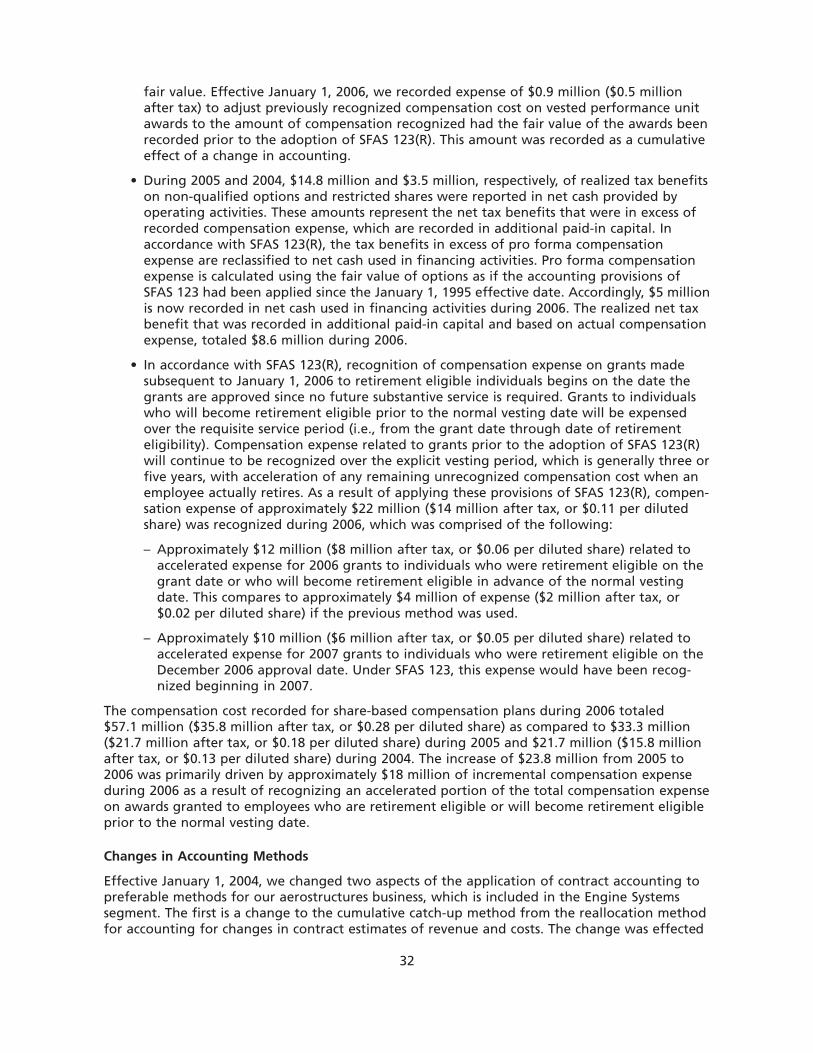
fair value. Effective January 1, 2006, we recorded expense of $0.9 million ($0.5 millionafter tax) to adjust previously recognized compensation cost on vested performance unitawards to the amount of compensation recognized had the fair value of the awards beenrecorded prior to the adoption of SFAS 123(R). This amount was recorded as a cumulativeeffect of a change in accounting.
• During 2005 and 2004, $14.8 million and $3.5 million, respectively, of realized tax benefitson non-qualified options and restricted shares were reported in net cash provided byoperating activities. These amounts represent the net tax benefits that were in excess ofrecorded compensation expense, which are recorded in additional paid-in capital. Inaccordance with SFAS 123(R), the tax benefits in excess of pro forma compensationexpense are reclassified to net cash used in financing activities. Pro forma compensationexpense is calculated using the fair value of options as if the accounting provisions ofSFAS 123 had been applied since the January 1, 1995 effective date. Accordingly, $5 millionis now recorded in net cash used in financing activities during 2006. The realized net taxbenefit that was recorded in additional paid-in capital and based on actual compensationexpense, totaled $8.6 million during 2006.
• In accordance with SFAS 123(R), recognition of compensation expense on grants madesubsequent to January 1, 2006 to retirement eligible individuals begins on the date thegrants are approved since no future substantive service is required. Grants to individualswho will become retirement eligible prior to the normal vesting date will be expensedover the requisite service period (i.e., from the grant date through date of retirementeligibility). Compensation expense related to grants prior to the adoption of SFAS 123(R)will continue to be recognized over the explicit vesting period, which is generally three orfive years, with acceleration of any remaining unrecognized compensation cost when anemployee actually retires. As a result of applying these provisions of SFAS 123(R), compen-sation expense of approximately $22 million ($14 million after tax, or $0.11 per dilutedshare) was recognized during 2006, which was comprised of the following:
– Approximately $12 million ($8 million after tax, or $0.06 per diluted share) related toaccelerated expense for 2006 grants to individuals who were retirement eligible on thegrant date or who will become retirement eligible in advance of the normal vestingdate. This compares to approximately $4 million of expense ($2 million after tax, or$0.02 per diluted share) if the previous method was used.
– Approximately $10 million ($6 million after tax, or $0.05 per diluted share) related toaccelerated expense for 2007 grants to individuals who were retirement eligible on theDecember 2006 approval date. Under SFAS 123, this expense would have been recog-nized beginning in 2007.
The compensation cost recorded for share-based compensation plans during 2006 totaled$57.1 million ($35.8 million after tax, or $0.28 per diluted share) as compared to $33.3 million($21.7 million after tax, or $0.18 per diluted share) during 2005 and $21.7 million ($15.8 millionafter tax, or $0.13 per diluted share) during 2004. The increase of $23.8 million from 2005 to2006 was primarily driven by approximately $18 million of incremental compensation expenseduring 2006 as a result of recognizing an accelerated portion of the total compensation expenseon awards granted to employees who are retirement eligible or will become retirement eligibleprior to the normal vesting date.
Changes in Accounting Methods
Effective January 1, 2004, we changed two aspects of the application of contract accounting topreferable methods for our aerostructures business, which is included in the Engine Systemssegment. The first is a change to the cumulative catch-up method from the reallocation methodfor accounting for changes in contract estimates of revenue and costs. The change was effected
32
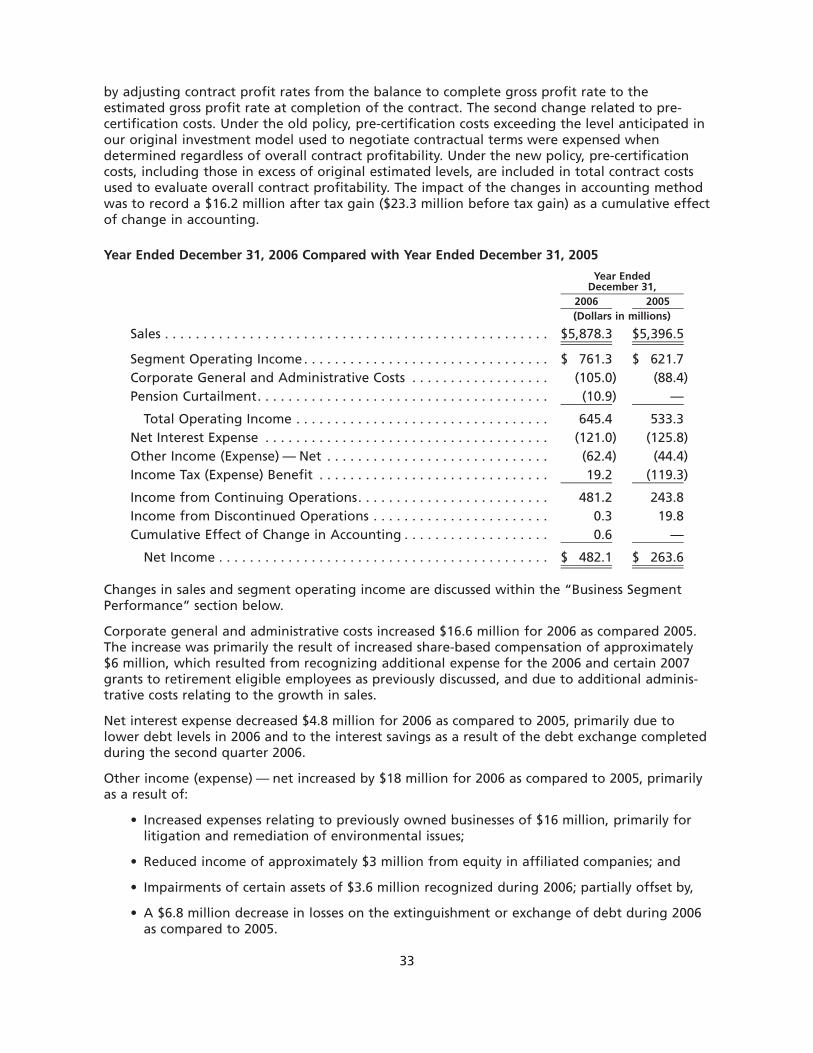
by adjusting contract profit rates from the balance to complete gross profit rate to theestimated gross profit rate at completion of the contract. The second change related to pre-certification costs. Under the old policy, pre-certification costs exceeding the level anticipated inour original investment model used to negotiate contractual terms were expensed whendetermined regardless of overall contract profitability. Under the new policy, pre-certificationcosts, including those in excess of original estimated levels, are included in total contract costsused to evaluate overall contract profitability. The impact of the changes in accounting methodwas to record a $16.2 million after tax gain ($23.3 million before tax gain) as a cumulative effectof change in accounting.
Year Ended December 31, 2006 Compared with Year Ended December 31, 2005
2006 2005
Year EndedDecember 31,
(Dollars in millions)
Sales . . . . . . . . . . . . . . . . . . . . . . . . . . . . . . . . . . . . . . . . . . . . . . . . . . $5,878.3 $5,396.5
Segment Operating Income. . . . . . . . . . . . . . . . . . . . . . . . . . . . . . . . $ 761.3 $ 621.7Corporate General and Administrative Costs . . . . . . . . . . . . . . . . . . (105.0) (88.4)Pension Curtailment. . . . . . . . . . . . . . . . . . . . . . . . . . . . . . . . . . . . . . (10.9) —
Total Operating Income . . . . . . . . . . . . . . . . . . . . . . . . . . . . . . . . . 645.4 533.3Net Interest Expense . . . . . . . . . . . . . . . . . . . . . . . . . . . . . . . . . . . . . (121.0) (125.8)Other Income (Expense) — Net . . . . . . . . . . . . . . . . . . . . . . . . . . . . . (62.4) (44.4)Income Tax (Expense) Benefit . . . . . . . . . . . . . . . . . . . . . . . . . . . . . . 19.2 (119.3)
Income from Continuing Operations. . . . . . . . . . . . . . . . . . . . . . . . . 481.2 243.8Income from Discontinued Operations . . . . . . . . . . . . . . . . . . . . . . . 0.3 19.8Cumulative Effect of Change in Accounting . . . . . . . . . . . . . . . . . . . 0.6 —
Net Income . . . . . . . . . . . . . . . . . . . . . . . . . . . . . . . . . . . . . . . . . . . $ 482.1 $ 263.6
Changes in sales and segment operating income are discussed within the “Business SegmentPerformance” section below.
Corporate general and administrative costs increased $16.6 million for 2006 as compared 2005.The increase was primarily the result of increased share-based compensation of approximately$6 million, which resulted from recognizing additional expense for the 2006 and certain 2007grants to retirement eligible employees as previously discussed, and due to additional adminis-trative costs relating to the growth in sales.
Net interest expense decreased $4.8 million for 2006 as compared to 2005, primarily due tolower debt levels in 2006 and to the interest savings as a result of the debt exchange completedduring the second quarter 2006.
Other income (expense) — net increased by $18 million for 2006 as compared to 2005, primarilyas a result of:
• Increased expenses relating to previously owned businesses of $16 million, primarily forlitigation and remediation of environmental issues;
• Reduced income of approximately $3 million from equity in affiliated companies; and
• Impairments of certain assets of $3.6 million recognized during 2006; partially offset by,
• A $6.8 million decrease in losses on the extinguishment or exchange of debt during 2006as compared to 2005.
33
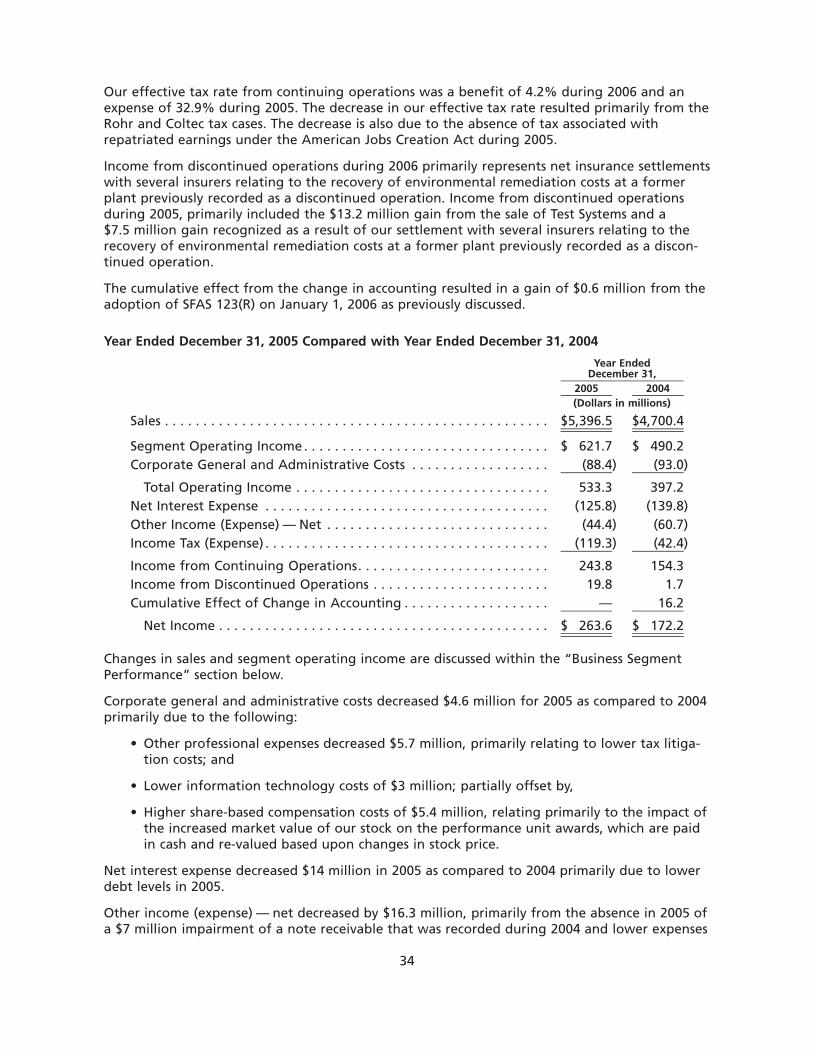
Our effective tax rate from continuing operations was a benefit of 4.2% during 2006 and anexpense of 32.9% during 2005. The decrease in our effective tax rate resulted primarily from theRohr and Coltec tax cases. The decrease is also due to the absence of tax associated withrepatriated earnings under the American Jobs Creation Act during 2005.
Income from discontinued operations during 2006 primarily represents net insurance settlementswith several insurers relating to the recovery of environmental remediation costs at a formerplant previously recorded as a discontinued operation. Income from discontinued operationsduring 2005, primarily included the $13.2 million gain from the sale of Test Systems and a$7.5 million gain recognized as a result of our settlement with several insurers relating to therecovery of environmental remediation costs at a former plant previously recorded as a discon-tinued operation.
The cumulative effect from the change in accounting resulted in a gain of $0.6 million from theadoption of SFAS 123(R) on January 1, 2006 as previously discussed.
Year Ended December 31, 2005 Compared with Year Ended December 31, 2004
2005 2004
Year EndedDecember 31,
(Dollars in millions)
Sales . . . . . . . . . . . . . . . . . . . . . . . . . . . . . . . . . . . . . . . . . . . . . . . . . . $5,396.5 $4,700.4
Segment Operating Income. . . . . . . . . . . . . . . . . . . . . . . . . . . . . . . . $ 621.7 $ 490.2Corporate General and Administrative Costs . . . . . . . . . . . . . . . . . . (88.4) (93.0)
Total Operating Income . . . . . . . . . . . . . . . . . . . . . . . . . . . . . . . . . 533.3 397.2Net Interest Expense . . . . . . . . . . . . . . . . . . . . . . . . . . . . . . . . . . . . . (125.8) (139.8)Other Income (Expense) — Net . . . . . . . . . . . . . . . . . . . . . . . . . . . . . (44.4) (60.7)Income Tax (Expense) . . . . . . . . . . . . . . . . . . . . . . . . . . . . . . . . . . . . . (119.3) (42.4)
Income from Continuing Operations. . . . . . . . . . . . . . . . . . . . . . . . . 243.8 154.3Income from Discontinued Operations . . . . . . . . . . . . . . . . . . . . . . . 19.8 1.7Cumulative Effect of Change in Accounting . . . . . . . . . . . . . . . . . . . — 16.2
Net Income . . . . . . . . . . . . . . . . . . . . . . . . . . . . . . . . . . . . . . . . . . . $ 263.6 $ 172.2
Changes in sales and segment operating income are discussed within the “Business SegmentPerformance” section below.
Corporate general and administrative costs decreased $4.6 million for 2005 as compared to 2004primarily due to the following:
• Other professional expenses decreased $5.7 million, primarily relating to lower tax litiga-tion costs; and
• Lower information technology costs of $3 million; partially offset by,
• Higher share-based compensation costs of $5.4 million, relating primarily to the impact ofthe increased market value of our stock on the performance unit awards, which are paidin cash and re-valued based upon changes in stock price.
Net interest expense decreased $14 million in 2005 as compared to 2004 primarily due to lowerdebt levels in 2005.
Other income (expense) — net decreased by $16.3 million, primarily from the absence in 2005 ofa $7 million impairment of a note receivable that was recorded during 2004 and lower expenses
34
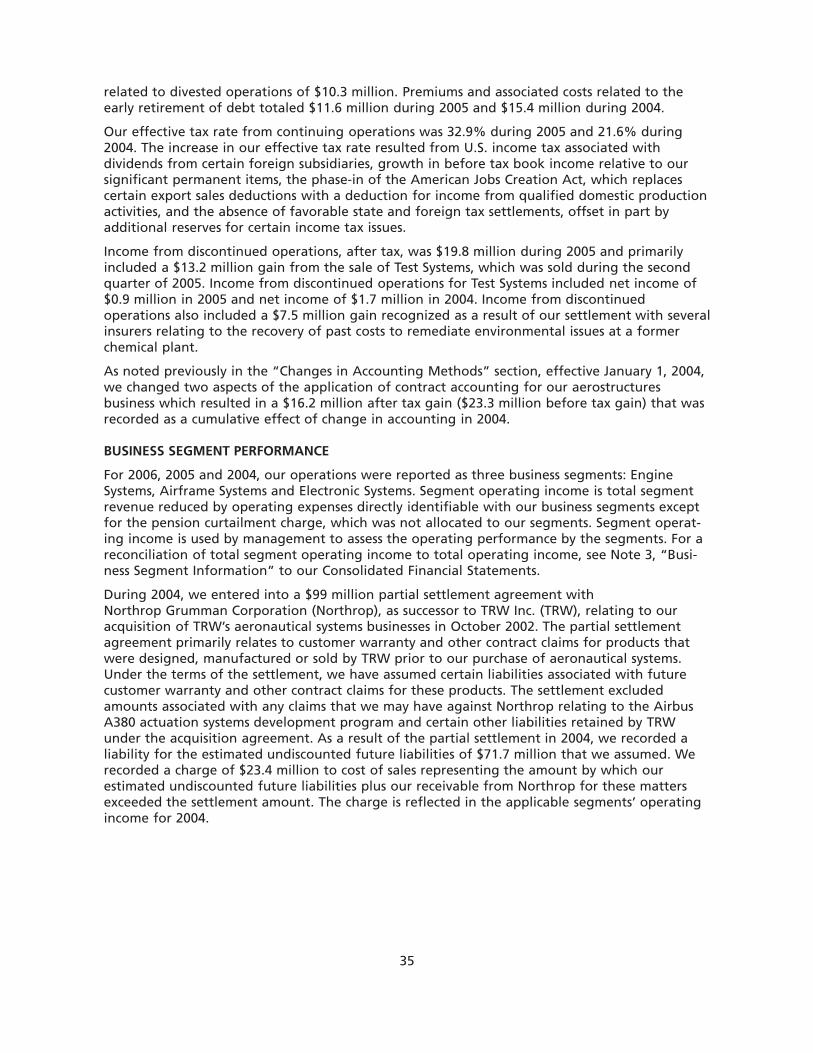
related to divested operations of $10.3 million. Premiums and associated costs related to theearly retirement of debt totaled $11.6 million during 2005 and $15.4 million during 2004.
Our effective tax rate from continuing operations was 32.9% during 2005 and 21.6% during2004. The increase in our effective tax rate resulted from U.S. income tax associated withdividends from certain foreign subsidiaries, growth in before tax book income relative to oursignificant permanent items, the phase-in of the American Jobs Creation Act, which replacescertain export sales deductions with a deduction for income from qualified domestic productionactivities, and the absence of favorable state and foreign tax settlements, offset in part byadditional reserves for certain income tax issues.
Income from discontinued operations, after tax, was $19.8 million during 2005 and primarilyincluded a $13.2 million gain from the sale of Test Systems, which was sold during the secondquarter of 2005. Income from discontinued operations for Test Systems included net income of$0.9 million in 2005 and net income of $1.7 million in 2004. Income from discontinuedoperations also included a $7.5 million gain recognized as a result of our settlement with severalinsurers relating to the recovery of past costs to remediate environmental issues at a formerchemical plant.
As noted previously in the “Changes in Accounting Methods” section, effective January 1, 2004,we changed two aspects of the application of contract accounting for our aerostructuresbusiness which resulted in a $16.2 million after tax gain ($23.3 million before tax gain) that wasrecorded as a cumulative effect of change in accounting in 2004.
BUSINESS SEGMENT PERFORMANCE
For 2006, 2005 and 2004, our operations were reported as three business segments: EngineSystems, Airframe Systems and Electronic Systems. Segment operating income is total segmentrevenue reduced by operating expenses directly identifiable with our business segments exceptfor the pension curtailment charge, which was not allocated to our segments. Segment operat-ing income is used by management to assess the operating performance by the segments. For areconciliation of total segment operating income to total operating income, see Note 3, “Busi-ness Segment Information” to our Consolidated Financial Statements.
During 2004, we entered into a $99 million partial settlement agreement withNorthrop Grumman Corporation (Northrop), as successor to TRW Inc. (TRW), relating to ouracquisition of TRW’s aeronautical systems businesses in October 2002. The partial settlementagreement primarily relates to customer warranty and other contract claims for products thatwere designed, manufactured or sold by TRW prior to our purchase of aeronautical systems.Under the terms of the settlement, we have assumed certain liabilities associated with futurecustomer warranty and other contract claims for these products. The settlement excludedamounts associated with any claims that we may have against Northrop relating to the AirbusA380 actuation systems development program and certain other liabilities retained by TRWunder the acquisition agreement. As a result of the partial settlement in 2004, we recorded aliability for the estimated undiscounted future liabilities of $71.7 million that we assumed. Werecorded a charge of $23.4 million to cost of sales representing the amount by which ourestimated undiscounted future liabilities plus our receivable from Northrop for these mattersexceeded the settlement amount. The charge is reflected in the applicable segments’ operatingincome for 2004.
35
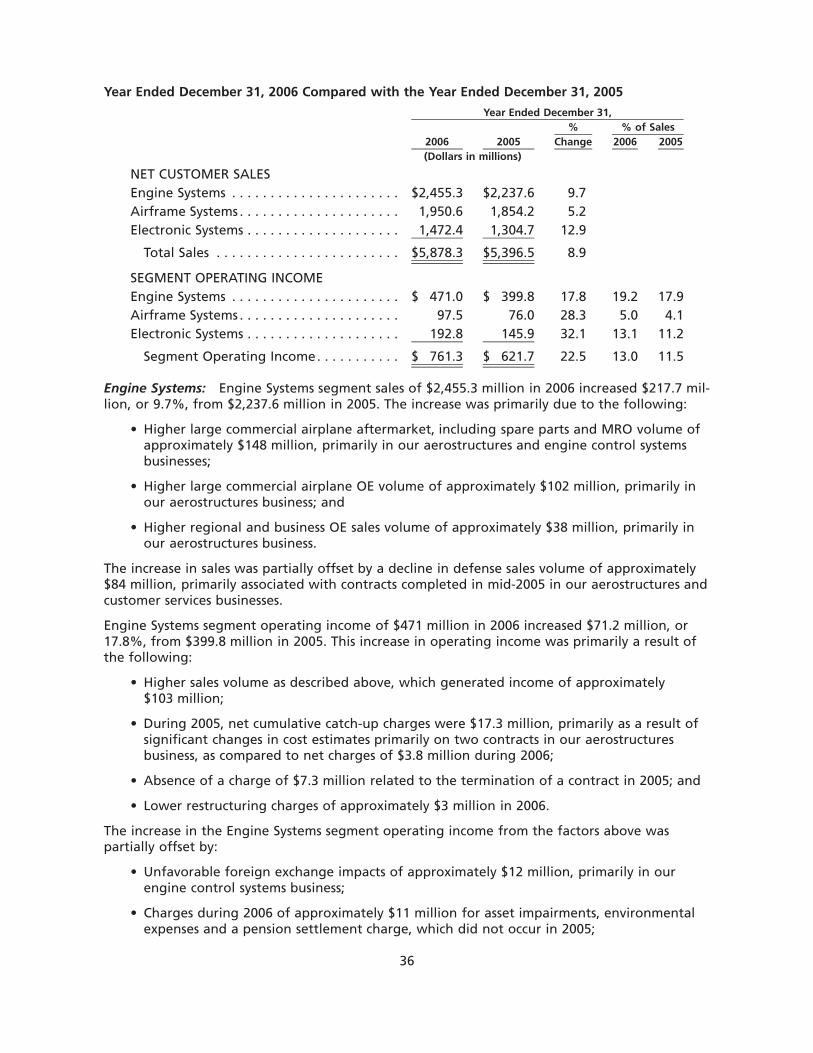
Year Ended December 31, 2006 Compared with the Year Ended December 31, 2005
2006 2005 Change 2006 2005% % of Sales
Year Ended December 31,
(Dollars in millions)
NET CUSTOMER SALESEngine Systems . . . . . . . . . . . . . . . . . . . . . . $2,455.3 $2,237.6 9.7Airframe Systems . . . . . . . . . . . . . . . . . . . . . 1,950.6 1,854.2 5.2Electronic Systems . . . . . . . . . . . . . . . . . . . . 1,472.4 1,304.7 12.9
Total Sales . . . . . . . . . . . . . . . . . . . . . . . . $5,878.3 $5,396.5 8.9
SEGMENT OPERATING INCOMEEngine Systems . . . . . . . . . . . . . . . . . . . . . . $ 471.0 $ 399.8 17.8 19.2 17.9Airframe Systems . . . . . . . . . . . . . . . . . . . . . 97.5 76.0 28.3 5.0 4.1Electronic Systems . . . . . . . . . . . . . . . . . . . . 192.8 145.9 32.1 13.1 11.2
Segment Operating Income. . . . . . . . . . . $ 761.3 $ 621.7 22.5 13.0 11.5
Engine Systems: Engine Systems segment sales of $2,455.3 million in 2006 increased $217.7 mil-lion, or 9.7%, from $2,237.6 million in 2005. The increase was primarily due to the following:
• Higher large commercial airplane aftermarket, including spare parts and MRO volume ofapproximately $148 million, primarily in our aerostructures and engine control systemsbusinesses;
• Higher large commercial airplane OE volume of approximately $102 million, primarily inour aerostructures business; and
• Higher regional and business OE sales volume of approximately $38 million, primarily inour aerostructures business.
The increase in sales was partially offset by a decline in defense sales volume of approximately$84 million, primarily associated with contracts completed in mid-2005 in our aerostructures andcustomer services businesses.
Engine Systems segment operating income of $471 million in 2006 increased $71.2 million, or17.8%, from $399.8 million in 2005. This increase in operating income was primarily a result ofthe following:
• Higher sales volume as described above, which generated income of approximately$103 million;
• During 2005, net cumulative catch-up charges were $17.3 million, primarily as a result ofsignificant changes in cost estimates primarily on two contracts in our aerostructuresbusiness, as compared to net charges of $3.8 million during 2006;
• Absence of a charge of $7.3 million related to the termination of a contract in 2005; and
• Lower restructuring charges of approximately $3 million in 2006.
The increase in the Engine Systems segment operating income from the factors above waspartially offset by:
• Unfavorable foreign exchange impacts of approximately $12 million, primarily in ourengine control systems business;
• Charges during 2006 of approximately $11 million for asset impairments, environmentalexpenses and a pension settlement charge, which did not occur in 2005;
36
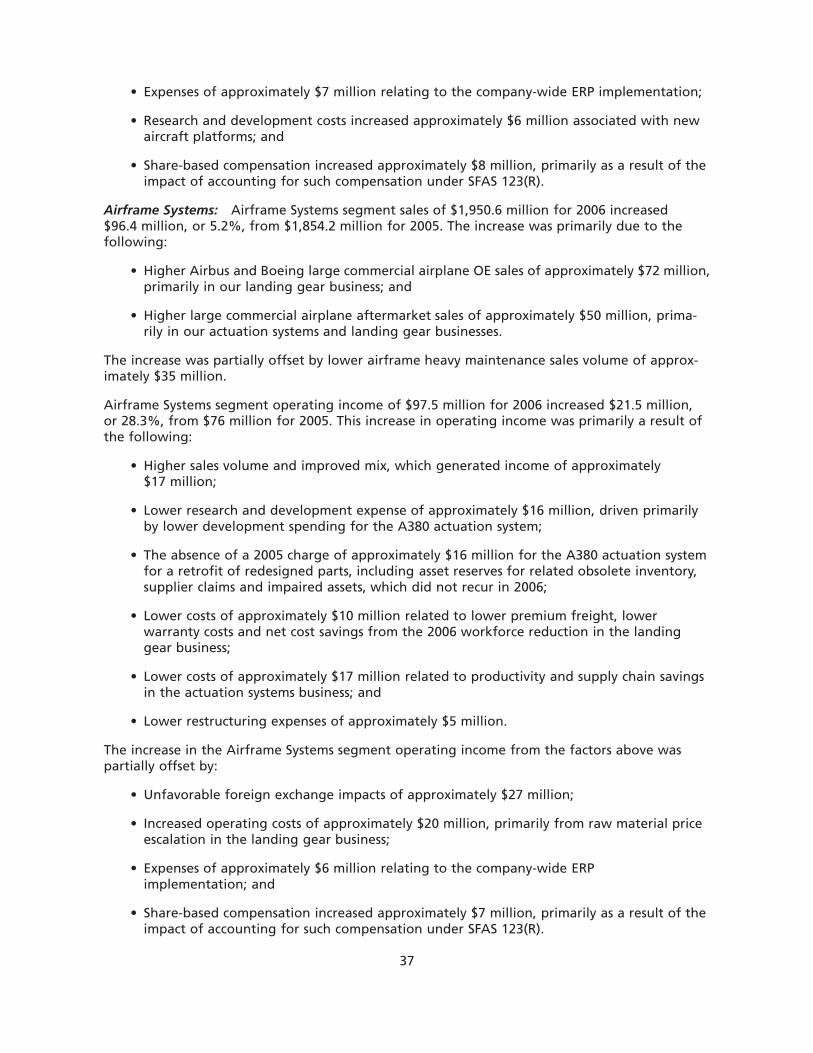
• Expenses of approximately $7 million relating to the company-wide ERP implementation;
• Research and development costs increased approximately $6 million associated with newaircraft platforms; and
• Share-based compensation increased approximately $8 million, primarily as a result of theimpact of accounting for such compensation under SFAS 123(R).
Airframe Systems: Airframe Systems segment sales of $1,950.6 million for 2006 increased$96.4 million, or 5.2%, from $1,854.2 million for 2005. The increase was primarily due to thefollowing:
• Higher Airbus and Boeing large commercial airplane OE sales of approximately $72 million,primarily in our landing gear business; and
• Higher large commercial airplane aftermarket sales of approximately $50 million, prima-rily in our actuation systems and landing gear businesses.
The increase was partially offset by lower airframe heavy maintenance sales volume of approx-imately $35 million.
Airframe Systems segment operating income of $97.5 million for 2006 increased $21.5 million,or 28.3%, from $76 million for 2005. This increase in operating income was primarily a result ofthe following:
• Higher sales volume and improved mix, which generated income of approximately$17 million;
• Lower research and development expense of approximately $16 million, driven primarilyby lower development spending for the A380 actuation system;
• The absence of a 2005 charge of approximately $16 million for the A380 actuation systemfor a retrofit of redesigned parts, including asset reserves for related obsolete inventory,supplier claims and impaired assets, which did not recur in 2006;
• Lower costs of approximately $10 million related to lower premium freight, lowerwarranty costs and net cost savings from the 2006 workforce reduction in the landinggear business;
• Lower costs of approximately $17 million related to productivity and supply chain savingsin the actuation systems business; and
• Lower restructuring expenses of approximately $5 million.
The increase in the Airframe Systems segment operating income from the factors above waspartially offset by:
• Unfavorable foreign exchange impacts of approximately $27 million;
• Increased operating costs of approximately $20 million, primarily from raw material priceescalation in the landing gear business;
• Expenses of approximately $6 million relating to the company-wide ERPimplementation; and
• Share-based compensation increased approximately $7 million, primarily as a result of theimpact of accounting for such compensation under SFAS 123(R).
37
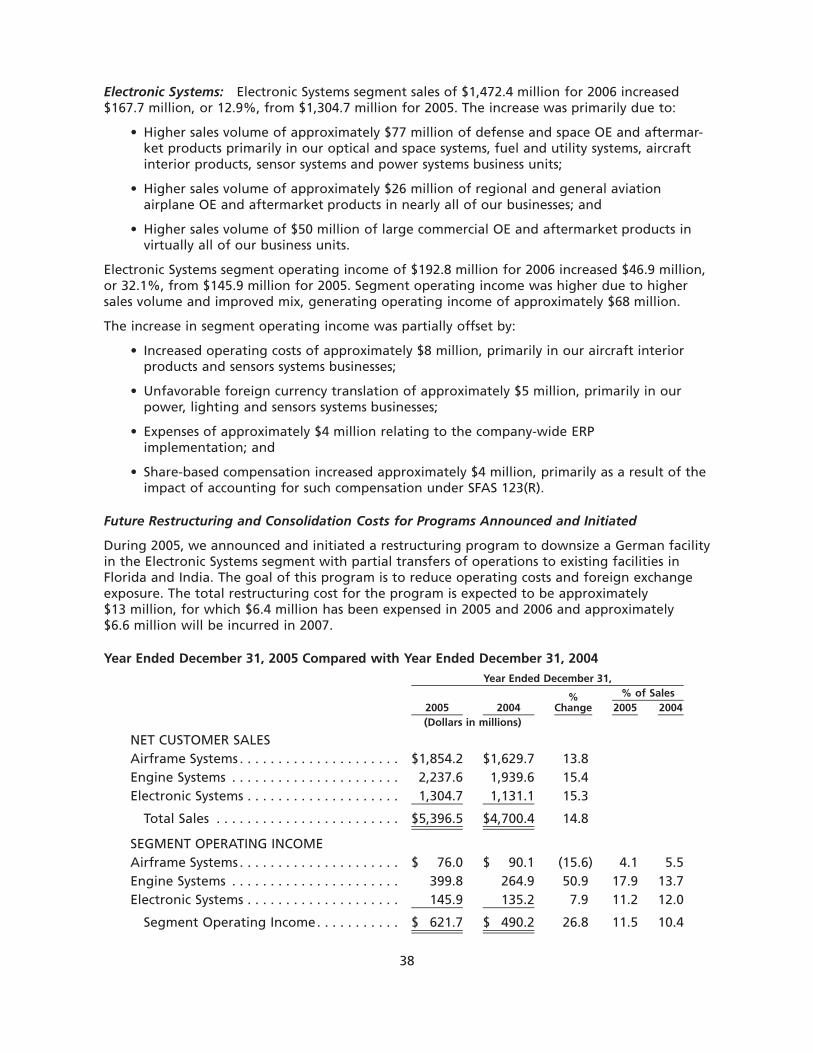
Electronic Systems: Electronic Systems segment sales of $1,472.4 million for 2006 increased$167.7 million, or 12.9%, from $1,304.7 million for 2005. The increase was primarily due to:
• Higher sales volume of approximately $77 million of defense and space OE and aftermar-ket products primarily in our optical and space systems, fuel and utility systems, aircraftinterior products, sensor systems and power systems business units;
• Higher sales volume of approximately $26 million of regional and general aviationairplane OE and aftermarket products in nearly all of our businesses; and
• Higher sales volume of $50 million of large commercial OE and aftermarket products invirtually all of our business units.
Electronic Systems segment operating income of $192.8 million for 2006 increased $46.9 million,or 32.1%, from $145.9 million for 2005. Segment operating income was higher due to highersales volume and improved mix, generating operating income of approximately $68 million.
The increase in segment operating income was partially offset by:
• Increased operating costs of approximately $8 million, primarily in our aircraft interiorproducts and sensors systems businesses;
• Unfavorable foreign currency translation of approximately $5 million, primarily in ourpower, lighting and sensors systems businesses;
• Expenses of approximately $4 million relating to the company-wide ERPimplementation; and
• Share-based compensation increased approximately $4 million, primarily as a result of theimpact of accounting for such compensation under SFAS 123(R).
Future Restructuring and Consolidation Costs for Programs Announced and Initiated
During 2005, we announced and initiated a restructuring program to downsize a German facilityin the Electronic Systems segment with partial transfers of operations to existing facilities inFlorida and India. The goal of this program is to reduce operating costs and foreign exchangeexposure. The total restructuring cost for the program is expected to be approximately$13 million, for which $6.4 million has been expensed in 2005 and 2006 and approximately$6.6 million will be incurred in 2007.
Year Ended December 31, 2005 Compared with Year Ended December 31, 2004
2005 2004%
Change 2005 2004% of Sales
Year Ended December 31,
(Dollars in millions)
NET CUSTOMER SALESAirframe Systems . . . . . . . . . . . . . . . . . . . . . $1,854.2 $1,629.7 13.8Engine Systems . . . . . . . . . . . . . . . . . . . . . . 2,237.6 1,939.6 15.4Electronic Systems . . . . . . . . . . . . . . . . . . . . 1,304.7 1,131.1 15.3
Total Sales . . . . . . . . . . . . . . . . . . . . . . . . $5,396.5 $4,700.4 14.8
SEGMENT OPERATING INCOMEAirframe Systems . . . . . . . . . . . . . . . . . . . . . $ 76.0 $ 90.1 (15.6) 4.1 5.5Engine Systems . . . . . . . . . . . . . . . . . . . . . . 399.8 264.9 50.9 17.9 13.7Electronic Systems . . . . . . . . . . . . . . . . . . . . 145.9 135.2 7.9 11.2 12.0
Segment Operating Income. . . . . . . . . . . $ 621.7 $ 490.2 26.8 11.5 10.4
38
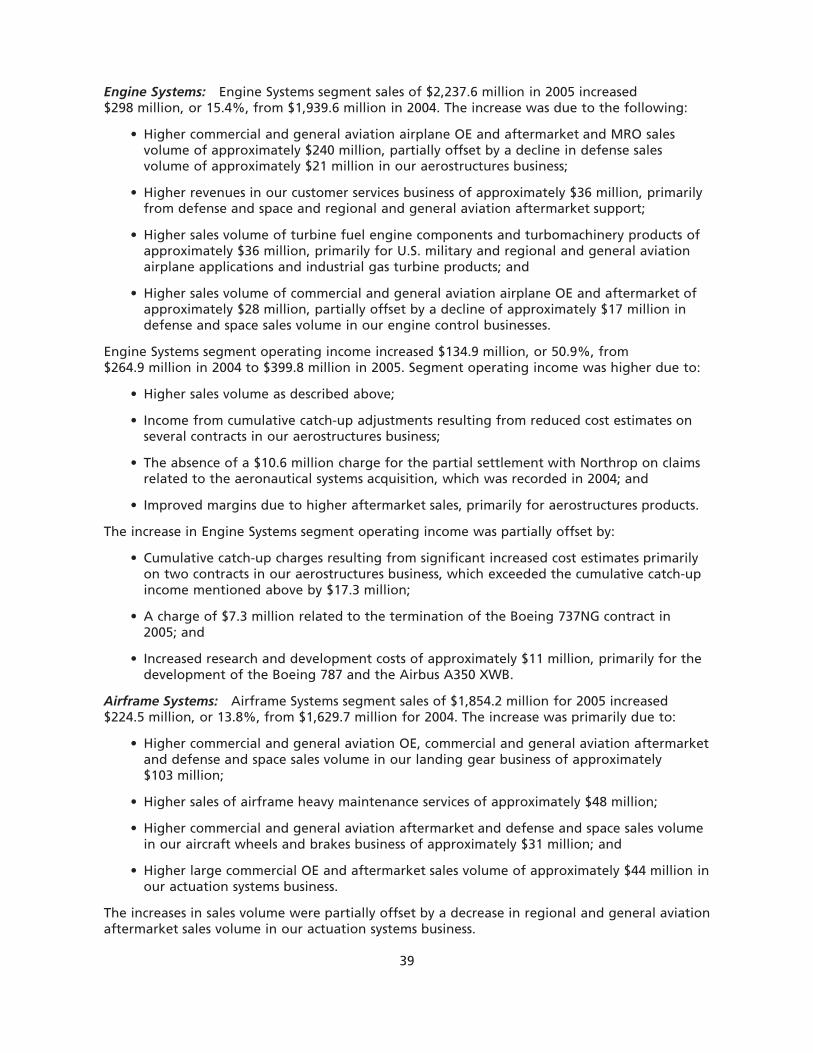
Engine Systems: Engine Systems segment sales of $2,237.6 million in 2005 increased$298 million, or 15.4%, from $1,939.6 million in 2004. The increase was due to the following:
• Higher commercial and general aviation airplane OE and aftermarket and MRO salesvolume of approximately $240 million, partially offset by a decline in defense salesvolume of approximately $21 million in our aerostructures business;
• Higher revenues in our customer services business of approximately $36 million, primarilyfrom defense and space and regional and general aviation aftermarket support;
• Higher sales volume of turbine fuel engine components and turbomachinery products ofapproximately $36 million, primarily for U.S. military and regional and general aviationairplane applications and industrial gas turbine products; and
• Higher sales volume of commercial and general aviation airplane OE and aftermarket ofapproximately $28 million, partially offset by a decline of approximately $17 million indefense and space sales volume in our engine control businesses.
Engine Systems segment operating income increased $134.9 million, or 50.9%, from$264.9 million in 2004 to $399.8 million in 2005. Segment operating income was higher due to:
• Higher sales volume as described above;
• Income from cumulative catch-up adjustments resulting from reduced cost estimates onseveral contracts in our aerostructures business;
• The absence of a $10.6 million charge for the partial settlement with Northrop on claimsrelated to the aeronautical systems acquisition, which was recorded in 2004; and
• Improved margins due to higher aftermarket sales, primarily for aerostructures products.
The increase in Engine Systems segment operating income was partially offset by:
• Cumulative catch-up charges resulting from significant increased cost estimates primarilyon two contracts in our aerostructures business, which exceeded the cumulative catch-upincome mentioned above by $17.3 million;
• A charge of $7.3 million related to the termination of the Boeing 737NG contract in2005; and
• Increased research and development costs of approximately $11 million, primarily for thedevelopment of the Boeing 787 and the Airbus A350 XWB.
Airframe Systems: Airframe Systems segment sales of $1,854.2 million for 2005 increased$224.5 million, or 13.8%, from $1,629.7 million for 2004. The increase was primarily due to:
• Higher commercial and general aviation OE, commercial and general aviation aftermarketand defense and space sales volume in our landing gear business of approximately$103 million;
• Higher sales of airframe heavy maintenance services of approximately $48 million;
• Higher commercial and general aviation aftermarket and defense and space sales volumein our aircraft wheels and brakes business of approximately $31 million; and
• Higher large commercial OE and aftermarket sales volume of approximately $44 million inour actuation systems business.
The increases in sales volume were partially offset by a decrease in regional and general aviationaftermarket sales volume in our actuation systems business.
39
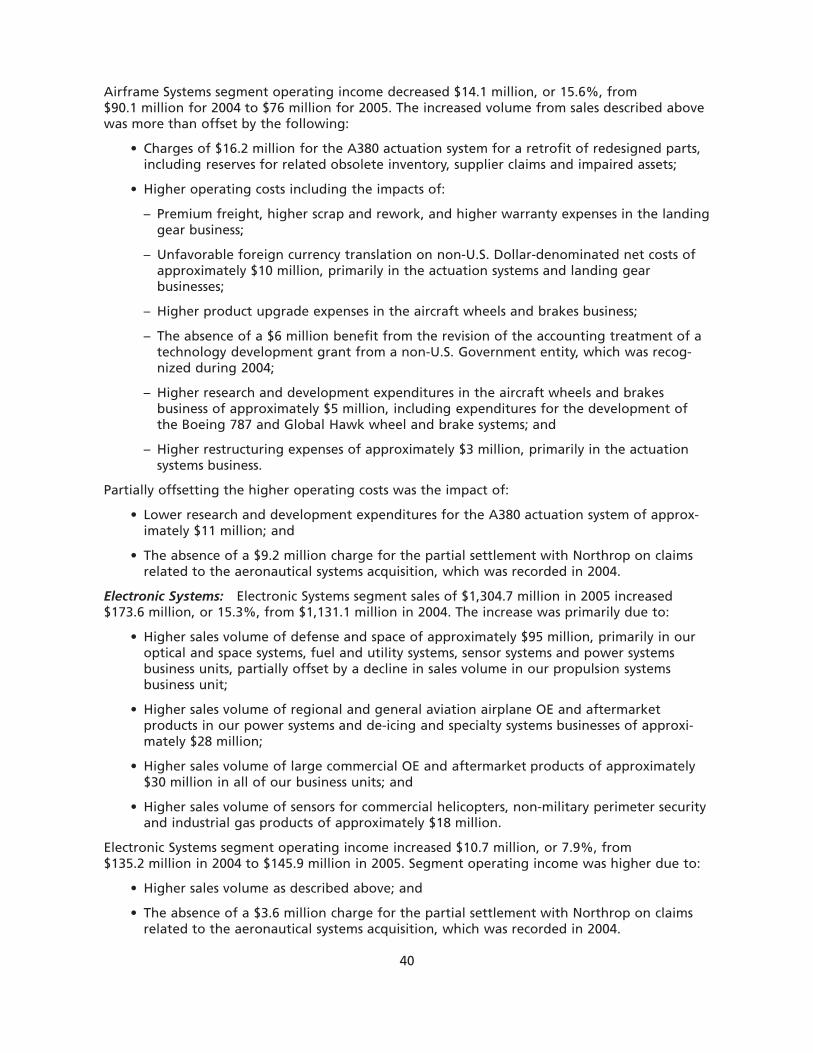
Airframe Systems segment operating income decreased $14.1 million, or 15.6%, from$90.1 million for 2004 to $76 million for 2005. The increased volume from sales described abovewas more than offset by the following:
• Charges of $16.2 million for the A380 actuation system for a retrofit of redesigned parts,including reserves for related obsolete inventory, supplier claims and impaired assets;
• Higher operating costs including the impacts of:
– Premium freight, higher scrap and rework, and higher warranty expenses in the landinggear business;
– Unfavorable foreign currency translation on non-U.S. Dollar-denominated net costs ofapproximately $10 million, primarily in the actuation systems and landing gearbusinesses;
– Higher product upgrade expenses in the aircraft wheels and brakes business;
– The absence of a $6 million benefit from the revision of the accounting treatment of atechnology development grant from a non-U.S. Government entity, which was recog-nized during 2004;
– Higher research and development expenditures in the aircraft wheels and brakesbusiness of approximately $5 million, including expenditures for the development ofthe Boeing 787 and Global Hawk wheel and brake systems; and
– Higher restructuring expenses of approximately $3 million, primarily in the actuationsystems business.
Partially offsetting the higher operating costs was the impact of:
• Lower research and development expenditures for the A380 actuation system of approx-imately $11 million; and
• The absence of a $9.2 million charge for the partial settlement with Northrop on claimsrelated to the aeronautical systems acquisition, which was recorded in 2004.
Electronic Systems: Electronic Systems segment sales of $1,304.7 million in 2005 increased$173.6 million, or 15.3%, from $1,131.1 million in 2004. The increase was primarily due to:
• Higher sales volume of defense and space of approximately $95 million, primarily in ouroptical and space systems, fuel and utility systems, sensor systems and power systemsbusiness units, partially offset by a decline in sales volume in our propulsion systemsbusiness unit;
• Higher sales volume of regional and general aviation airplane OE and aftermarketproducts in our power systems and de-icing and specialty systems businesses of approxi-mately $28 million;
• Higher sales volume of large commercial OE and aftermarket products of approximately$30 million in all of our business units; and
• Higher sales volume of sensors for commercial helicopters, non-military perimeter securityand industrial gas products of approximately $18 million.
Electronic Systems segment operating income increased $10.7 million, or 7.9%, from$135.2 million in 2004 to $145.9 million in 2005. Segment operating income was higher due to:
• Higher sales volume as described above; and
• The absence of a $3.6 million charge for the partial settlement with Northrop on claimsrelated to the aeronautical systems acquisition, which was recorded in 2004.
40
The increase in segment operating income was partially offset by:
• Unfavorable sales mix shift from higher margin aftermarket sales towards proportionatelymore OE sales in military and commercial markets;
• Increased investments in research and development costs of approximately $12 million fornew programs that have been won;
• Increases in operating costs, primarily warranty expenses; and
• A charge of approximately $2 million to establish an environmental reserve for remedia-tion activities.
Segment Reorganization and Other Changes
Beginning with our Form 10-Q for the period ended March 31, 2007, we will reflect thefollowing changes in our business segment reporting:
• New organizational structure, effective January 1, 2007;
• Results of our customer services business will be reallocated to the business that manufac-tures the product or system; and
• ERP implementation costs that are not directly associated with a specific business will bereclassified and reported within corporate administrative expense.
Prior period results will be reclassified to conform to the 2007 presentation.
FOREIGN OPERATIONS
We are engaged in business in foreign markets. Our foreign manufacturing and service facilitiesare located in Australia, Canada, China, England, France, Germany, India, Indonesia,Northern Ireland, Japan, Mexico, Poland, Scotland, Singapore and the United Arab Emirates. Wemarket our products and services through sales subsidiaries and distributors in a number offoreign countries. We also have joint venture agreements with various foreign companies.
Currency fluctuations, tariffs and similar import limitations, price controls and labor regulationscan affect our foreign operations, including foreign affiliates. Other potential limitations on ourforeign operations include expropriation, nationalization, restrictions on foreign investments ortheir transfers and additional political and economic risks. In addition, the transfer of fundsfrom foreign operations could be impaired by the unavailability of dollar exchange or otherrestrictive regulations that foreign governments could enact.
Sales to non-U.S. customers were $2,807.6 million or 48% of total sales, $2,501.7 million or 46%of total sales and $2,270.1 million or 48% of total sales for 2006, 2005 and 2004, respectively.
LIQUIDITY AND CAPITAL RESOURCES
We currently expect to fund expenditures for capital requirements, as well as other liquidityneeds from a combination of cash, internally generated funds and financing arrangements. Webelieve that our internal liquidity, together with access to external capital resources, will besufficient to satisfy existing plans and commitments including our stock buy back program, andalso provide adequate financial flexibility.
Cash
At December 31, 2006, we had cash and marketable securities of $201.3 million, as compared to$251.3 million at December 31, 2005.
41

Credit Facilities
We have a $500 million committed global syndicated revolving credit facility that expires in May2011. In May 2006, we exercised an option within the credit facility to extend the maturity ofthe facility by one year from May 2010 to May 2011. This facility permits borrowing, includingletters of credit, up to a maximum of $500 million. At December 31, 2006, there were$34.9 million in borrowings, classified as long-term debt, and $20.4 million in letters of creditoutstanding under this facility. At December 31, 2005, there were $34.9 million in borrowingsand $19.6 million in letters of credit outstanding under this facility.
The level of unused borrowing capacity under our committed syndicated revolving credit facilityvaries from time to time depending in part upon our compliance with financial and othercovenants set forth in the related agreement, including the consolidated net worth requirementand maximum leverage ratio. We are currently in compliance with all such covenants. As ofDecember 31, 2006, we had borrowing capacity under this facility of $444.7 million, afterreductions for borrowings and letters of credit outstanding under the facility.
At December 31, 2006, we maintained $75 million of uncommitted domestic money marketfacilities and $149.8 million of uncommitted and committed foreign working capital facilitieswith various banks to meet short-term borrowing requirements. As of December 31, 2006, therewas $11.8 million outstanding under these facilities. At December 31, 2005, we maintained$75 million of uncommitted domestic money market facilities and $111.5 million of uncommit-ted and committed foreign working capital facilities with $22.4 million outstanding in borrow-ings under these facilities. These credit facilities are provided by a small number of commercialbanks that also provide us with committed credit through the syndicated revolving credit facilityand with various cash management, trust and other services.
Our credit facilities do not contain any credit rating downgrade triggers that would acceleratethe maturity of our indebtedness. However, a ratings downgrade would result in an increase inthe interest rate and fees payable under our committed syndicated revolving credit facility. Sucha downgrade also could adversely affect our ability to renew existing or obtain access to newcredit facilities in the future and could increase the cost of such new facilities. In May 2006,Standard & Poor’s Rating Services raised our credit rating to BBB from BBB- which reduced ourfacility fee from 15 basis points per annum to 12.5 basis points per annum.
Long-Term Financing
At December 31, 2006, we had long-term debt and capital lease obligations, including currentmaturities, of $1,723.1 million with maturities ranging from 2007 to 2046. Long-term debtincludes $34.9 million borrowed under the committed revolving syndicated credit facility tofacilitate our implementation of the cash repatriation provisions in 2005 of the American JobsCreation Act. The earliest maturity of a material long-term debt obligation is April 2008. We alsomaintain a shelf registration statement that allows us to issue up to $1.4 billion of debtsecurities, series preferred stock, common stock, stock purchase contracts and stock purchaseunits.
In June 2006, we exchanged the following notes for $290.7 million principal amount of a newseries of 6.29% notes due in 2016:
• $177.9 million principal amount of our 7.5% notes due in 2008;
• $32.7 million principal amount of our 6.45% notes due in 2008; and
• $80.1 million principal amount of our 6.6% notes due in 2009.
Additionally, in June 2006, we exchanged $242.5 million principal amount of our outstanding7.625% notes due 2012 for $254.6 million principal amount of a new series of our 6.8% notesdue in 2036.
42
We paid an aggregate cash premium of $8.6 million to exchange the 6.29% notes due in 2016and paid an aggregate premium of $24 million, including $12 million in cash and $12 millionfinanced by issuing additional notes, for the exchange of the 6.8% notes due 2036. Thepremiums will be amortized over the lives of the new notes. We recorded $4.8 million oftransaction costs associated with the exchange offers in other income (expense) — net during2006.
The 6.29% notes due in 2016 and the 6.8% notes due in 2036 were issued in a transactionexempt from the registration requirements of the Securities Act of 1933, as amended (theSecurities Act). As required by a registration rights agreement entered into in connection withthe issuance of the new notes, on October 4, 2006, we completed exchange offers, registeredunder the Securities Act, of notes of the same series in exchange for the outstanding 6.29% notesdue in 2016 and 6.8% notes due in 2036.
Lease Agreements
We finance some of our office and manufacturing facilities and machinery and equipment,including corporate aircraft, under committed lease arrangements provided by financial institu-tions. Some of these arrangements allow us to claim a deduction for the tax depreciation on theassets, rather than the lessor, and allow us to lease aircraft and equipment having a maximumunamortized value of $55 million at December 31, 2006 for which $16.6 million of futureminimum lease payments were outstanding under these arrangements. The other arrangementsare standard operating leases. Future minimum lease payments under the standard operatingleases approximated $135.2 million at December 31, 2006.
Additionally, at December 31, 2006, we had guarantees of residual values of lease obligations of$32.7 million. The residual values relate primarily to corporate aircraft which we are obligatedto either purchase at the end of the lease term or remarket. Under some of these operatinglease agreements, we receive rent holidays, which represent periods of free or reduced rent.Rent holidays are recorded as a liability and recognized on a straight-line basis over the leaseterm. In addition, we may receive incentives or allowances from the lessor as part of the leaseagreement. We recognize these payments as a liability and amortize them as reductions to leaseexpense over the lease term. We capitalize leasehold improvements and amortize them over theshorter of the lease term or the asset’s useful life.
Sale of Receivables
Effective June 30, 2006, we terminated the variable rate trade receivables securitization programand repaid the outstanding balance of $97.1 million.
Cash Flow Hedges
We have subsidiaries that conduct a substantial portion of their business in Euros, Great BritainPounds Sterling, Canadian Dollars and Polish Zlotys, but have significant sales contracts that aredenominated in U.S. Dollars. Approximately 10% of our revenues and approximately 25% ofour costs are denominated in currencies other than the U.S. Dollar. Approximately 90% of thesenet costs are in Euros, Great Britain Pounds Sterling and Canadian Dollars. Periodically, we enterinto forward contracts to exchange U.S. Dollars for Euros, Great Britain Pounds Sterling,Canadian Dollars and Polish Zlotys to hedge a portion of our exposure from U.S. Dollar sales.
The forward contracts described above are used to mitigate the potential volatility of earningsand cash flow arising from changes in currency exchange rates that impact our U.S. Dollar salesfor certain foreign operations. The forward contracts are being accounted for as cash flowhedges. The forward contracts are recorded on our Consolidated Balance Sheet at fair valuewith the net change in fair value reflected in accumulated other comprehensive income (loss),net of deferred taxes. The notional value of the forward contracts at December 31, 2006 was
43
$1,639.4 million. The fair value of the forward contracts at December 31, 2006, was a net assetof $85.2 million, including:
• $50.7 million recorded as a current asset in prepaid expenses and other assets; and
• $46.2 million recorded as a non-current asset in other assets; partially offset by,
• $3.8 million recorded as a current liability in accrued expenses; and
• $7.9 million recorded as a non-current liability in other non-current liabilities.
The total fair value of our forward contracts of $85.2 million (before deferred taxes of$29.9 million) at December 31, 2006, combined with $0.9 million of gains on previously maturedhedges of intercompany sales and gains from forward contracts terminated prior to the originalmaturity dates, is recorded in accumulated other comprehensive income (loss) and will bereflected in income as the earnings are affected by the hedged items. As of December 31, 2006,the portion of the $86.1 million fair value that would be reclassified into earnings as an increasein sales to offset the effect of the hedged item in the next 12 months is a net gain of$46.9 million. During 2006, hedge ineffectiveness of a charge of $0.6 million was recorded inother income (expense) — net. There was a negligible amount of ineffectiveness during 2005.
In June 2006, we entered into treasury locks and reverse treasury locks in connection with ourlong-term debt exchange offers. In accordance with Statement of Financial Accounting Stan-dards No. 133, “Accounting for Derivative Instruments and Hedging Activities” (SFAS 133), thetreasury locks were accounted for as cash flow hedges. We entered into $288.5 million oftreasury locks to offset changes in the issue price of our 6.29% notes due 2016 and entered into$288.5 million of reverse treasury locks to offset changes in the exchange prices of the7.5% notes due in 2008, 6.45% notes due in 2008 and 6.6% notes due in 2009 attributable tomovements in treasury rates prior to the exchange date. We paid $0.3 million in cash to settlethe locks, and the amount was recorded in accumulated other comprehensive income (loss)during 2006, and will be amortized over the life of the 6.29% notes due 2016. In June 2006, wealso entered into $235.5 million of treasury locks to offset changes in the issue price of the 6.8%notes due 2036 and entered into $235.5 million of reverse treasury locks to offset changes in theexchange price of the 7.625% notes due in 2012 attributable to movements in treasury ratesprior to the exchange date. We paid $1.9 million in cash to settle the locks, and the amount wasrecorded in accumulated other comprehensive income (loss) during 2006 and will be amortizedover the life of the 6.8% notes due 2036.
Fair Value Hedges
We enter into interest rate swaps to increase our exposure to variable interest rates. We havethe following interest rate swaps outstanding as of December 31, 2006:
• A $43 million fixed-to-floating interest rate swap on the 6.45% notes due in 2008;
• Two $50 million fixed-to-floating interest rate swaps on the 7.5% notes due in 2008; and
• A $50 million fixed-to-floating interest rate swap on the 6.29% notes due in 2016.
In September 2006, we entered into a $50 million fixed to floating interest rate swap on our6.29% senior notes due in 2016. The settlement and maturity dates on the swap are the same asthose on the referenced notes. In accordance with SFAS 133, the interest rate swap is beingaccounted for as a fair value hedge and the carrying value of the notes has been adjusted toreflect the fair value of the interest rate swap.
In June 2006, we terminated $7 million of a $50 million fixed-to-floating interest rate swap onour 6.45% notes due in 2008 in connection with our long-life debt exchange offers. We paid$0.3 million in cash to terminate this portion of the interest rate swap, which was recorded asan expense in other income (expense) — net during 2006. This portion of the interest rate swap
44
was terminated so that the outstanding notional amount of the fixed-to-floating interest rateswap would match the outstanding principal amount, subsequent to the exchange of the6.45% notes due in 2008.
The settlement and maturity dates on each swap are the same as those on the referenced notes.In accordance with SFAS 133, the interest rate swaps are being accounted for as fair valuehedges and the carrying value of the notes has been adjusted to reflect the fair values of theinterest rate swaps. The fair value of the interest rate swaps was a net liability/(loss) of$2.6 million at December 31, 2006.
Other Forward Contracts
As a supplement to the foreign exchange cash flow hedging program, we enter into forwardcontracts to manage our foreign currency risk related to the translation of monetary assets andliabilities denominated in currencies other than the relevant functional currency. These forwardcontracts mature monthly and the notional amounts are adjusted periodically to reflect changesin net monetary asset balances. Since these contracts are not designated as hedges, the gains orlosses on these forward contracts are recorded in cost of sales. These contracts are utilized tomitigate the earnings impact of the translation of net monetary assets and liabilities. Under thisprogram, as of December 31, 2006, we had forward contracts with a notional value of$63.1 million to buy Great Britain Pounds Sterling, forward contracts with a notional value of$120.7 million to buy Euros and forward contracts with a notional value of $11 million to buyCanadian Dollars. These contracts mature within one month.
During 2006, we recorded a transaction loss on our monetary assets of approximately $19 mil-lion, which was partially offset by gains on the forward contracts described above of approxi-mately $6 million. During 2005, we recorded a transaction gain on our monetary assets ofapproximately $21 million, which was partially offset by losses on the forward contractsdescribed above of approximately $17 million.
45
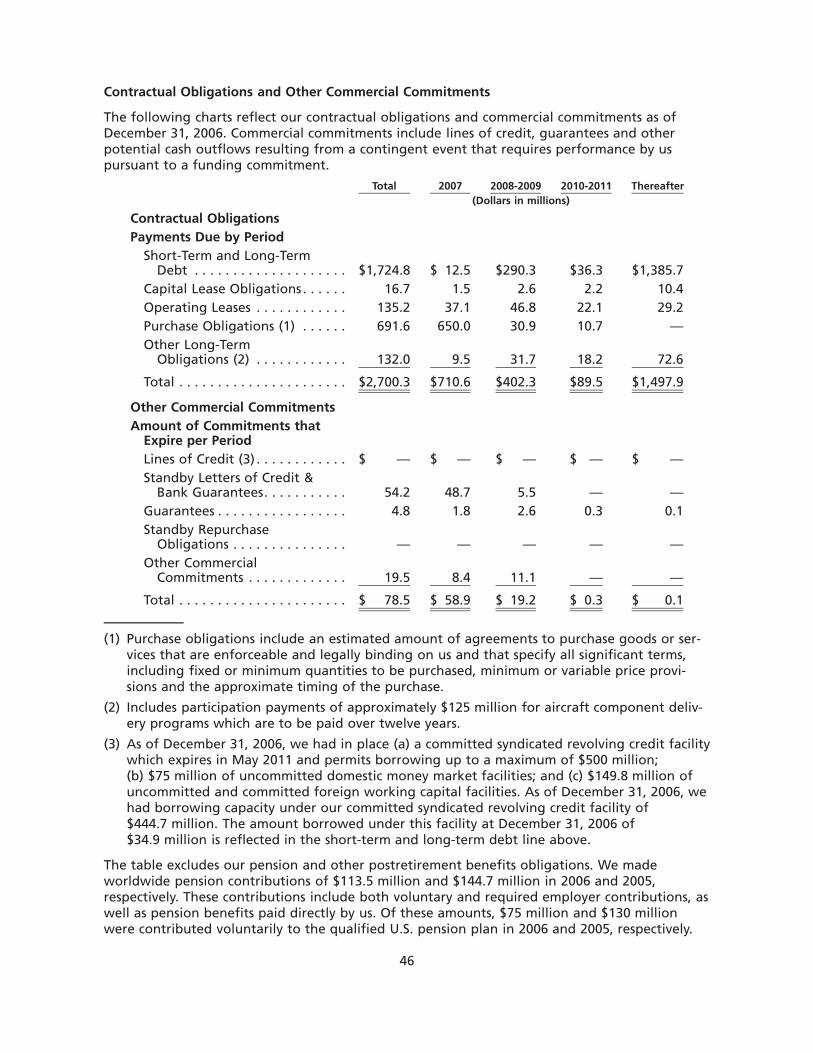
Contractual Obligations and Other Commercial Commitments
The following charts reflect our contractual obligations and commercial commitments as ofDecember 31, 2006. Commercial commitments include lines of credit, guarantees and otherpotential cash outflows resulting from a contingent event that requires performance by uspursuant to a funding commitment.
Total 2007 2008-2009 2010-2011 Thereafter(Dollars in millions)
Contractual ObligationsPayments Due by Period
Short-Term and Long-TermDebt . . . . . . . . . . . . . . . . . . . . $1,724.8 $ 12.5 $290.3 $36.3 $1,385.7
Capital Lease Obligations . . . . . . 16.7 1.5 2.6 2.2 10.4Operating Leases . . . . . . . . . . . . 135.2 37.1 46.8 22.1 29.2Purchase Obligations (1) . . . . . . 691.6 650.0 30.9 10.7 —Other Long-Term
Obligations (2) . . . . . . . . . . . . 132.0 9.5 31.7 18.2 72.6
Total . . . . . . . . . . . . . . . . . . . . . . $2,700.3 $710.6 $402.3 $89.5 $1,497.9
Other Commercial CommitmentsAmount of Commitments that
Expire per PeriodLines of Credit (3) . . . . . . . . . . . . $ — $ — $ — $ — $ —Standby Letters of Credit &
Bank Guarantees. . . . . . . . . . . 54.2 48.7 5.5 — —Guarantees . . . . . . . . . . . . . . . . . 4.8 1.8 2.6 0.3 0.1Standby Repurchase
Obligations . . . . . . . . . . . . . . . — — — — —Other Commercial
Commitments . . . . . . . . . . . . . 19.5 8.4 11.1 — —
Total . . . . . . . . . . . . . . . . . . . . . . $ 78.5 $ 58.9 $ 19.2 $ 0.3 $ 0.1
(1) Purchase obligations include an estimated amount of agreements to purchase goods or ser-vices that are enforceable and legally binding on us and that specify all significant terms,including fixed or minimum quantities to be purchased, minimum or variable price provi-sions and the approximate timing of the purchase.
(2) Includes participation payments of approximately $125 million for aircraft component deliv-ery programs which are to be paid over twelve years.
(3) As of December 31, 2006, we had in place (a) a committed syndicated revolving credit facilitywhich expires in May 2011 and permits borrowing up to a maximum of $500 million;(b) $75 million of uncommitted domestic money market facilities; and (c) $149.8 million ofuncommitted and committed foreign working capital facilities. As of December 31, 2006, wehad borrowing capacity under our committed syndicated revolving credit facility of$444.7 million. The amount borrowed under this facility at December 31, 2006 of$34.9 million is reflected in the short-term and long-term debt line above.
The table excludes our pension and other postretirement benefits obligations. We madeworldwide pension contributions of $113.5 million and $144.7 million in 2006 and 2005,respectively. These contributions include both voluntary and required employer contributions, aswell as pension benefits paid directly by us. Of these amounts, $75 million and $130 millionwere contributed voluntarily to the qualified U.S. pension plan in 2006 and 2005, respectively.
46
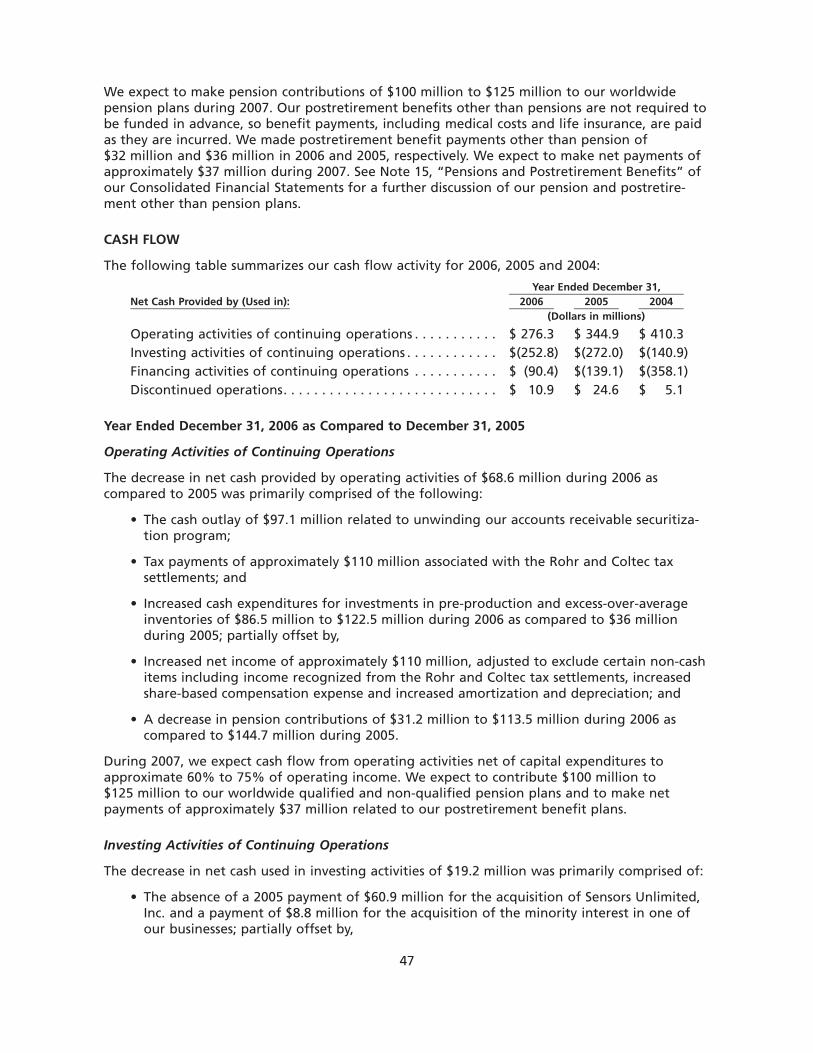
We expect to make pension contributions of $100 million to $125 million to our worldwidepension plans during 2007. Our postretirement benefits other than pensions are not required tobe funded in advance, so benefit payments, including medical costs and life insurance, are paidas they are incurred. We made postretirement benefit payments other than pension of$32 million and $36 million in 2006 and 2005, respectively. We expect to make net payments ofapproximately $37 million during 2007. See Note 15, “Pensions and Postretirement Benefits” ofour Consolidated Financial Statements for a further discussion of our pension and postretire-ment other than pension plans.
CASH FLOW
The following table summarizes our cash flow activity for 2006, 2005 and 2004:
Net Cash Provided by (Used in): 2006 2005 2004Year Ended December 31,
(Dollars in millions)
Operating activities of continuing operations . . . . . . . . . . . $ 276.3 $ 344.9 $ 410.3Investing activities of continuing operations . . . . . . . . . . . . $(252.8) $(272.0) $(140.9)Financing activities of continuing operations . . . . . . . . . . . $ (90.4) $(139.1) $(358.1)Discontinued operations. . . . . . . . . . . . . . . . . . . . . . . . . . . . $ 10.9 $ 24.6 $ 5.1
Year Ended December 31, 2006 as Compared to December 31, 2005
Operating Activities of Continuing Operations
The decrease in net cash provided by operating activities of $68.6 million during 2006 ascompared to 2005 was primarily comprised of the following:
• The cash outlay of $97.1 million related to unwinding our accounts receivable securitiza-tion program;
• Tax payments of approximately $110 million associated with the Rohr and Coltec taxsettlements; and
• Increased cash expenditures for investments in pre-production and excess-over-averageinventories of $86.5 million to $122.5 million during 2006 as compared to $36 millionduring 2005; partially offset by,
• Increased net income of approximately $110 million, adjusted to exclude certain non-cashitems including income recognized from the Rohr and Coltec tax settlements, increasedshare-based compensation expense and increased amortization and depreciation; and
• A decrease in pension contributions of $31.2 million to $113.5 million during 2006 ascompared to $144.7 million during 2005.
During 2007, we expect cash flow from operating activities net of capital expenditures toapproximate 60% to 75% of operating income. We expect to contribute $100 million to$125 million to our worldwide qualified and non-qualified pension plans and to make netpayments of approximately $37 million related to our postretirement benefit plans.
Investing Activities of Continuing Operations
The decrease in net cash used in investing activities of $19.2 million was primarily comprised of:
• The absence of a 2005 payment of $60.9 million for the acquisition of Sensors Unlimited,Inc. and a payment of $8.8 million for the acquisition of the minority interest in one ofour businesses; partially offset by,
47
• An increase in capital expenditures of $41.3 to $256.8 million during 2006 as compared to$215.5 million during 2005.
We expect capital expenditures in 2007 to be in the range of $270 million to $290 million,reflecting continued cash expenditures for investments in programs such as the Boeing 787 andthe Airbus A350 XWB, capital expenditures for facility expansions to support higher OE deliver-ies to Airbus and Boeing and productivity initiatives that are expected to enhance margins. Ofthese capital expenditures, approximately 40% are expected to be associated with investmentsin low cost country manufacturing, previously announced MRO facility expansions and newfacilities to support aftermarket sales growth, and expenditures related to the company-wideimplementation of an ERP system.
Financing Activities of Continuing Operations
The decrease in net cash used in financing activities of $48.7 million during 2006 as compared to2005 was primarily comprised of:
• The absence of the 2005 redemption of our remaining outstanding 6.45% notes in theaggregate principal amount of $182.1 million; partially offset by,
• A decline of $41.6 million of proceeds from issuance of common stock to $66.1 millionduring 2006 as compared to $107.7 million during 2005;
• A 2006 payment of $20.6 million of premiums related to the debt exchange;
• Purchases of treasury stock during 2006 totaling $20.2 million, in conjunction with therepurchase program announced on October 24, 2006; and
• Repayments of short-term debt totaling $11.6 million during 2006 as compared toincreased short-term debt of $21.3 million during 2005.
On October 24, 2006, our Board of Directors approved a program that authorizes us torepurchase up to $300 million of our common stock. The primary purpose of the program is toreduce dilution to existing shareholders from our share-based compensation plans. While notime limit was set for completion of the program, we expect repurchases to occur over a threeyear period. Repurchases under the program, which could aggregate to approximately 6% ofour outstanding common stock, may be made through open market or privately negotiatedtransactions at times and in such amounts as we deem appropriate, subject to market condi-tions, regulatory requirements and other factors. The program does not obligate us to repur-chase any particular amount of common stock, and may be suspended or discontinued at anytime without notice.
On October 24, 2006, our Board of Directors declared a quarterly dividend of $0.20 per share onour common stock, paid January 2, 2007 to shareholders of record as of December 4, 2006.
Discontinued Operations
Net cash provided by discontinued operations was $10.9 million in 2006 primarily from insurancesettlements, net of tax, with several insurers relating to the recovery of environmentalremediation costs at a former plant previously recorded as a discontinued operation. Net cashprovided by discontinued operations in 2005 included after tax proceeds of $13.2 million fromthe sale of Test Systems.
Year Ended December 31, 2005 as Compared to December 31, 2004
Operating Activities of Continuing Operations
Net cash provided by operating activities decreased $65.4 million from $410.3 million during2004 to $344.9 million during 2005. The decrease in net cash from operations was primarily due
48
to higher working capital requirements to support the increase in sales and production rates forlarge commercial aircraft, offset partially by higher income and the absence of the $99 millionpartial settlement with Northrop which occurred in 2004. Net cash provided by operatingactivities in 2005 also included an increase in the accounts receivable sold under our securitiza-tion program of $24.8 million, offset by worldwide pension contributions of $144.7 million andnet tax payments of approximately $52.1 million. Net cash provided by operating activities in2004 included cash received from the partial settlement with Northrop of $99 million, termina-tion of certain life insurance policies of $23 million and commutation of a general liabilityinsurance policy of $18 million, offset by worldwide pension contributions of $128.6 million, nettax payments of approximately $32 million, a reduction of $25 million in receivables sold underour securitization program and cash paid to acquire certain aftermarket rights of $15 million.
Investing Activities of Continuing Operations
Net cash used in investing activities was $272 million in 2005 and $140.9 million in 2004. Netcash used in investing activities for 2005 included capital expenditures of $215.5 million and theacquisitions of SUI for $60.9 million and the minority interest in one of our businesses for$8.8 million. Net cash used in investing activities in 2004 included capital expenditures of$151.8 million.
Financing Activities of Continuing Operations
Net cash used in financing activities was $139.1 million in 2005, compared to $358.1 million for2004. During 2005, we redeemed all remaining outstanding 6.45% notes due in 2007 in theaggregate principal amount of $182.1 million. Also during 2005, we issued common stock of$107.7 million, primarily through the exercise of stock options, and paid dividends to sharehold-ers of $97.3 million. During 2004, we repurchased $142.2 million principal amount of long-termdebt and redeemed $60 million principal amount of Special Facilities Airport Revenue Bonds,$5.9 million principal amount of industrial revenue bonds and $63.5 million principal of theQUIPS debentures.
Discontinued Operations
Net cash provided by discontinued operations was $24.6 million in 2005 and $5.1 million in2004. After tax proceeds of approximately $13.2 million from the sale of Test Systems wereincluded in the net cash provided by discontinued operations in 2005.
CONTINGENCIES
General
There are pending or threatened against us or our subsidiaries various claims, lawsuits andadministrative proceedings, arising in the ordinary course of business, including commercial,product liability, asbestos and environmental matters, which seek remedies or damages.Although no assurance can be given with respect to the ultimate outcome of these matters, webelieve that any liability that may finally be determined with respect to commercial and non-asbestos product liability claims should not have a material effect on our consolidated financialposition, results of operations or cash flows. From time to time, we are also involved in legalproceedings as a plaintiff involving tax, contract, patent protection, environmental and othermatters. Gain contingencies, if any, are recognized when they are realized. Legal costs aregenerally expensed when incurred.
Environmental
We are subject to various domestic and international environmental laws and regulations whichmay require that we investigate and remediate the effects of the release or disposal of materials
49
at sites associated with past and present operations, including divested sites for which we havecontractual obligations relating to the environmental condition of such site. At certain sites wehave been identified as a potentially responsible party under the federal Superfund laws andcomparable state laws. We are currently involved in the investigation and remediation of anumber of sites under these laws.
Estimates of our environmental liabilities are based on currently available facts, present lawsand regulations and current technology. These estimates take into consideration our priorexperience in site investigation and remediation, the data concerning cleanup costs availablefrom other companies and regulatory authorities and the professional judgment of our environ-mental specialists in consultation with outside environmental specialists, when necessary. Esti-mates of our environmental liabilities are further subject to uncertainties regarding the natureand extent of site contamination, the range of remediation alternatives available, evolvingremediation standards, imprecise engineering evaluations and estimates of appropriate cleanuptechnology, methodology and cost, the extent of corrective actions that may be required andthe number and financial condition of other potentially responsible parties, as well as the extentof their responsibility for the remediation.
Accordingly, as investigation and remediation of these sites proceed, it is likely that adjustmentsin our accruals will be necessary to reflect new information. The amounts of any suchadjustments could have a material adverse effect on our results of operations in a given period,but the amounts, and the possible range of loss in excess of the amounts accrued, are notreasonably estimable. Based on currently available information, however, we do not believe thatfuture environmental costs in excess of those accrued with respect to sites for which we havebeen identified as a potentially responsible party are likely to have a material adverse effect onour financial condition. There can be no assurance, however, that additional future develop-ments, administrative actions or liabilities relating to environmental matters will not have amaterial adverse effect on our results of operations or cash flows in a given period.
Environmental liabilities are recorded when the liability is probable and the costs are reasonablyestimable, which generally is not later than at completion of a feasibility study or when we haverecommended a remedy or have committed to an appropriate plan of action. The liabilities arereviewed periodically and, as investigation and remediation proceed, adjustments are made asnecessary. Liabilities for losses from environmental remediation obligations do not consider theeffects of inflation and anticipated expenditures are not discounted to their present value. Theliabilities are not reduced by possible recoveries from insurance carriers or other third parties,but do reflect anticipated allocations among potentially responsible parties at federal Superfundsites or similar state-managed sites and an assessment of the likelihood that such parties willfulfill their obligations at such sites.
Our Consolidated Balance Sheet included an accrued liability for environmental remediationobligations of $74.3 million and $81 million at December 31, 2006 and 2005, respectively. AtDecember 31, 2006 and 2005, $17.7 million and $18.3 million, respectively, of the accruedliability for environmental remediation was included in current liabilities as accrued expenses. AtDecember 31, 2006 and 2005, $31 million and $31.4 million, respectively, was associated withongoing operations and $43.3 million and $49.6 million, respectively, was associated withbusinesses previously disposed of or discontinued.
The timing of expenditures depends on a number of factors that vary by site, including thenature and extent of contamination, the number of potentially responsible parties, the timingof regulatory approvals, the complexity of the investigation and remediation, and the standardsfor remediation. We expect that we will expend present accruals over many years, and willgenerally complete remediation in less than 30 years at all sites for which we have beenidentified as a potentially responsible party. This period includes operation and monitoring coststhat are generally incurred over 15 to 25 years.
50
Asbestos
We and a number of our subsidiaries have been named as defendants in various actions byplaintiffs alleging injury or death as a result of exposure to asbestos fibers in products, or whichmay have been present in our facilities. A number of these cases involve maritime claims, whichhave been and are expected to continue to be administratively dismissed by the court. Theseactions primarily relate to previously owned businesses. We believe that pending and reasonablyanticipated future actions, net of anticipated insurance recoveries, are not likely to have amaterial adverse effect on our financial condition, results of operations or cash flows. There canbe no assurance, however, that future legislative or other developments will not have a materialadverse effect on our results of operations in a given period.
Insurance Coverage
We believe that we have substantial insurance coverage available to us related to third partyclaims. However, the pre-1976 primary layer of insurance coverage was provided by the KemperInsurance Companies (Kemper). Kemper has indicated that, due to capital constraints anddowngrades from various rating agencies, it has ceased underwriting new business and nowfocuses on administering policy commitments from prior years. Kemper has also indicated that itis currently operating under a “run-off” plan under the supervision of the Illinois Division ofInsurance. We cannot predict the impact of Kemper’s financial position on the availability of theKemper insurance.
In addition, a portion of our primary and excess layers of pre-1986 insurance coverage for thirdparty claims was provided by certain insurance carriers who are either insolvent or undergoingsolvent schemes of arrangement. We have entered into settlement agreements with a numberof these insurers pursuant to which we agreed to give up our rights with respect to certaininsurance policies in exchange for negotiated payments, some of which are subject to increaseunder certain circumstances. These settlements represent negotiated payments for our loss ofinsurance coverage, as we no longer have insurance available for claims that may have qualifiedfor coverage. These settlements have been recorded as income for reimbursement of past claimpayments under the settled insurance policies and as a deferred settlement credit for futureclaim payments.
At December 31, 2006, the deferred settlement credit was approximately $38 million for which$2.8 million is reported in accrued expenses and $35.2 million was reported in other non-currentliabilities. The proceeds from such insurance settlements were reported as a component of netcash provided by operating activities.
Liabilities of Divested Businesses
Asbestos
In May 2002, we completed the tax-free spin-off of our Engineered Products (EIP) segment,which at the time of the spin-off included EnPro Industries, Inc. (EnPro) and Coltec Industries Inc(Coltec). At that time, two subsidiaries of Coltec were defendants in a significant number ofpersonal injury claims relating to alleged asbestos-containing products sold by those subsidiaries.It is possible that asbestos-related claims might be asserted against us on the theory that wehave some responsibility for the asbestos-related liabilities of EnPro, Coltec or its subsidiaries,even though the activities that led to those claims occurred prior to our ownership of any ofthose subsidiaries. Also, it is possible that a claim might be asserted against us that Coltec’sdividend of its aerospace business to us prior to the spin-off was made at a time when Coltecwas insolvent or caused Coltec to become insolvent. Such a claim could seek recovery from us onbehalf of Coltec of the fair market value of the dividend.
51
A limited number of asbestos-related claims have been asserted against us as “successor” toColtec or one of its subsidiaries. We believe that we have substantial legal defenses againstthese claims, as well as against any other claims that may be asserted against us on the theoriesdescribed above. In addition, the agreement between EnPro and us that was used to effectuatethe spin-off provides us with an indemnification from EnPro covering, among other things,these liabilities. The success of any such asbestos-related claims would likely require, as apractical matter, that Coltec’s subsidiaries were unable to satisfy their asbestos-related liabilitiesand that Coltec was found to be responsible for these liabilities and was unable to meet itsfinancial obligations. We believe any such claims would be without merit and that Coltec wassolvent both before and after the dividend of its aerospace business to us. If we are ultimatelyfound to be responsible for the asbestos-related liabilities of Coltec’s subsidiaries, we believesuch finding would not have a material adverse effect on our financial condition, but couldhave a material adverse effect on our results of operations and cash flows in a particular period.However, because of the uncertainty as to the number, timing and payments related to futureasbestos-related claims, there can be no assurance that any such claims will not have a materialadverse effect on our financial condition, results of operations and cash flows. If a claim relatedto the dividend of Coltec’s aerospace business were successful, it could have a material adverseimpact on our financial condition, results of operations and cash flows.
Other
In connection with the divestiture of our tire, vinyl and other businesses, we have receivedcontractual rights of indemnification from third parties for environmental and other claimsarising out of the divested businesses. Failure of these third parties to honor their indemnifica-tion obligations could have a material adverse effect on our financial condition, results ofoperations and cash flows.
Guarantees
At December 31, 2006, we had an outstanding contingent liability for guarantees of debt andlease payments of $2.1 million, letters of credit and bank guarantees of $54.2 million andresidual value of lease obligations of $32.7 million. See Note 14, “Lease Commitments” andNote 13, “Financing Arrangements” to our Consolidated Financial Statements.
Aerostructures Long-Term Contracts
Our aerostructures business has several long-term contracts in the pre-production and earlyproduction phases (e.g., Boeing 787, Airbus A380 and A350 XWB). The pre-production phaseincludes design of the product to meet customer specifications as well as design of the manufac-turing processes to manufacture the product. Also involved in this phase is securing supply ofmaterial and subcomponents produced by third party suppliers that are generally accomplishedthrough long-term supply agreements. In addition to these factors, contracts in the early produc-tion phase include excess-over-average inventories, which represent the excess of current manu-factured cost over the estimated average manufactured cost over the life of the contract. Costestimates over the life of the contract are affected by estimates of future cost reductions includinglearning curve efficiencies. Because these contracts cover periods of up to 20 years or more, thereis risk that estimates of future costs made during the pre-production and early production phaseswill be different from actual costs and that difference could be significant.
Tax
We are continuously undergoing examination by the Internal Revenue Service (IRS), as well asvarious state and foreign jurisdictions. The IRS and other taxing authorities routinely challengecertain deductions and credits reported by us on our income tax returns. In accordance withStatement of Financial Accounting Standards No. 109, “Accounting for Income Taxes” (SFAS 109),
52
and Statement of Financial Accounting Standards No. 5, “Accounting for Contingencies”(SFAS 5), we establish reserves for tax contingencies that reflect our best estimate of thedeductions and credits that we may be unable to sustain, or that we could be willing to concedeas part of a broader tax settlement. Differences between the reserves for tax contingencies andthe amounts ultimately owed by us are recorded in the period they become known. Adjust-ments to our reserves could have a material effect on our financial statements. As of Decem-ber 31, 2006, we had recorded tax contingency reserves of approximately $173 million.
In 2000, Coltec, a former Goodrich subsidiary, paid $113.7 million to the IRS. This paymentrepresented the tax and accrued interest arising out of the IRS’s disallowance of a capital lossand certain tax credits relating to Coltec’s 1996 tax year. On February 13, 2001, Coltec filed suitagainst the U.S. Government in the U.S. Court of Federal Claims for a refund of this payment.The case went to trial, and on November 2, 2004, the trial court ruled in favor of Coltec. During2005, the government appealed the decision to the U.S. Court of Appeals for the Federal Circuit.The appeals court reversed the decision of the trial court on July 12, 2006. On August 2, 2006,we paid the tax and accrued interest relating to subsequent years of approximately $57 millionto the IRS. On November 8, 2006, Coltec filed a petition for a writ of certiorari with the SupremeCourt of the United States asking the Court to review the decision of the appeals court. OnFebruary 20, 2007 the Supreme Court of the United States denied Coltec’s petition. Coltec doesnot owe any additional federal income tax or interest with respect to these matters for the years1996 through 2000. There is no financial statement effect since all related impacts for this casewere previously recorded.
In 2000, the IRS issued a statutory notice of deficiency asserting that Rohr, Inc. (Rohr), oursubsidiary, was liable for $85.3 million of additional income taxes for the fiscal years endedJuly 31, 1986 through 1989. In 2003, the IRS issued an additional statutory notice of deficiencyasserting that Rohr was liable for $23 million of additional income taxes for the fiscal yearsended July 31, 1990 through 1993. The proposed assessments relate primarily to the timing ofcertain tax deductions and tax credits. Rohr filed petitions in the U.S. Tax Court opposing theproposed assessments. We previously reached a tentative settlement agreement with the IRSwith regard to the proposed assessments that required further review by the Joint Committeeon Taxation (JCT). On March 15, 2006 we received notification that the JCT approved thetentative settlement agreement entered into with the IRS. As a result of receiving the JCTnotification we recorded a tax benefit of approximately $74.1 million primarily related to thereversal of the tax reserves during 2006.
Our current IRS examination cycle began on September 29, 2005 and involves the taxable yearsended December 31, 2000 through December 31, 2004. Based on communications with the IRSexam team, we expect field examination of the current cycle to be completed during 2007. Theprior examination cycle which began in March 2002, includes the consolidated income taxgroups in the audit periods identified below:
Rohr, Inc. and Subsidiaries . . . . . . . . . . . . . . July, 1995 — December, 1997 (throughdate of acquisition)
Coltec Industries Inc and Subsidiaries . . . . . December, 1997 — July, 1999 (throughdate of acquisition)
Goodrich Corporation and Subsidiaries . . . . 1998-1999 (including Rohr and Coltec)
There were numerous tax issues that had been raised by the IRS as part of the prior examinationcycle, including, but not limited to, transfer pricing, research and development credits, foreigntax credits, tax accounting for long-term contracts, tax accounting for inventory, tax accountingfor stock options, depreciation, amortization and the proper timing for certain other deductionsfor income tax purposes. We previously reached tentative settlement agreements with the IRSon substantially all of the issues raised with respect to the prior examination cycle. Due to theamounts of tax involved certain portions of the tentative settlement agreements were required
53
to be reviewed by the JCT. We received notification on April 25, 2006 that the JCT approved thetentative settlement agreement entered into with the IRS with regard to Rohr, Inc. andSubsidiaries (for the period from July, 1995 through December, 1997). As a result of receivingthe JCT notification, we recorded a tax benefit of approximately $14.9 million, primarily relatedto the reversal of tax reserves, during 2006. In addition to the JCT approvals with regard to Rohr,we reached agreement with the IRS regarding most of the issues with respect to ColtecIndustries Inc and Subsidiaries (for the period from December, 1997 through July, 1999).Consequently, we recorded a tax benefit of approximately $44.4 million, primarily related to thereversal of tax reserves in 2006. During 2006, we reached final settlement with the IRS onsubstantially all of the issues relating to the Goodrich Corporation and Subsidiaries 1998-1999examination cycle. As a result, we recorded a benefit of approximately $13.5 million, primarilyrelated to the reversal of tax reserves. We anticipate filing a petition with the U.S. Tax Court tocontest the remaining unresolved issues which involve the proper timing of certain deductions.The amount of the estimated tax liability if the IRS were to prevail is fully reserved. We cannotpredict the timing or ultimate outcome of the remaining issues.
Rohr has been under examination by the State of California for the tax years ended July 31,1985, 1986 and 1987. The State of California has disallowed certain expenses incurred by one ofRohr’s subsidiaries in connection with the lease of certain tangible property. California’sFranchise Tax Board held that the deductions associated with the leased equipment were non-business deductions. The additional tax associated with the Franchise Tax Board’s position isapproximately $4.5 million. The amount of accrued interest associated with the additional tax isapproximately $20 million as of December 31, 2006. In addition, the State of California enactedan amnesty provision that imposes nondeductible penalty interest equal to 50% of the unpaidinterest amounts relating to taxable years ended before 2003. The penalty interest is approx-imately $10 million as of December 31, 2006. The tax and interest amounts continue to becontested by Rohr. We believe that we are adequately reserved for this contingency. During2005, Rohr made payments of approximately $3.9 million ($0.6 million for tax and $3.3 millionfor interest) related to items that were not being contested and approximately $4.5 millionrelated to items that are being contested. No payment has been made for the $20 million ofinterest or $10 million of penalty interest. Under California law, Rohr may be required to paythe full amount of interest prior to filing any suit for refund. If required, Rohr expects to makethis payment and file suit for a refund in late 2007 or early 2008.
NEW ACCOUNTING STANDARDS NOT ADOPTED
Accounting for Uncertainty in Income Taxes
In July 2006, the Financial Accounting Standards Board (FASB) issued FASB Interpretation No. 48,“Accounting for Uncertainty in Income Taxes, an Interpretation of FASB Statement No. 109”(FIN 48). FIN 48 creates a single model for accounting and disclosure of uncertain tax positions.This interpretation prescribes the minimum recognition threshold a tax position is required tomeet before being recognized in the financial statements. Additionally, FIN 48 provides guid-ance on derecognition, measurement, classification, interest and penalties, and transition ofuncertain tax positions. FIN 48 is effective for fiscal years beginning after December 15, 2006.We will adopt FIN 48 as of January 1, 2007, with any cumulative effect of the adoption recordedas an adjustment to beginning retained earnings. We are currently finalizing our evaluation ofthe impact of the adoption and have not yet determined the effect on our earnings or financialposition.
Fair Value Measurement
In September 2006, the FASB issued Statement of Financial Accounting Standards No. 157, “FairValue Measurements” (SFAS 157). SFAS 157 defines fair value, establishes a framework formeasuring fair value in accordance with generally accepted accounting principles and expands
54
disclosures about fair value measurements. SFAS 157 is effective for the fiscal years beginningafter November 15, 2007. We are currently evaluating the impact of the adoption of SFAS 157on our financial condition, results of operations and cash flows.
Accounting for Postretirement Benefits Associated with Split-Dollar Life Insurance
In September 2006, the FASB ratified Emerging Issues Task Force No. 06-4, “Postretirement BenefitsAssociated with Split-Dollar Life Insurance” (EITF 06-4). EITF 06-4 requires deferred-compensation orpostretirement benefit aspects of an endorsement-type split-dollar life insurance arrangement to berecognized as a liability by the employer and the obligation is not effectively settled by thepurchase of a life insurance policy. The liability for future benefits should be recognized based onthe substantive agreement with the employee, which may be either to provide a future deathbenefit or to pay for the future cost of the life insurance. EITF 06-4 is effective for fiscal yearsbeginning after December 15, 2007. We are currently evaluating the impact of the adoption of EITF06-4 on our financial condition, results of operations and cash flows.
CRITICAL ACCOUNTING POLICIES
Our discussion and analysis of our financial condition and results of operations is based uponour Consolidated Financial Statements, which have been prepared in accordance with account-ing principles generally accepted in the United States. The preparation of these financialstatements requires us to make estimates and judgments that affect the reported amounts ofassets, liabilities, revenues and expenses, and related disclosure of contingent assets and liabili-ties. On an ongoing basis, we evaluate our estimates, including those related to customerprograms and incentives, product returns, bad debts, inventories, investments, intangible assets,income taxes, financing obligations, warranty obligations, excess component order cancellationcosts, restructuring, long-term service contracts, pensions and other postretirement benefits, andcontingencies and litigation. We base our estimates on historical experience and on variousother assumptions that are believed to be reasonable under the circumstances, the results ofwhich form the basis for making judgments about the carrying values of assets and liabilitiesthat are not readily apparent from other sources. Actual results may differ from these estimatesunder different assumptions or conditions.
We believe the following critical accounting policies affect our more significant judgments andestimates used in the preparation of our Consolidated Financial Statements.
Contract Accounting-Percentage of Completion
Revenue Recognition
We have sales under long-term contracts, many of which contain escalation clauses, requiringdelivery of products over several years and frequently providing the buyer with option pricing onfollow-on orders. Sales and profits on each contract are recognized in accordance with thepercentage-of-completion method of accounting, primarily using the units-of-delivery method.We follow the requirements of Statement of Position 81-1 (SOP 81-1), “Accounting for Perfor-mance of Construction-Type and Certain Production-Type Contracts” (the contract method ofaccounting), using the cumulative catch-up method in accounting for revisions in estimates. Underthe cumulative catch-up method, the impact of revisions in estimates related to units shipped todate is recognized immediately when changes in estimated contract profitability are known.
Estimates of revenue and cost for our contracts span a period of many years from the inceptionof the contracts to the date of actual shipments and are based on a substantial number ofunderlying assumptions. We believe that the underlying factors are sufficiently reliable toprovide a reasonable estimate of the profit to be generated. However, due to the significantlength of time over which revenue streams will be generated, the variability of the assumptions
55
of the revenue and cost streams can be significant if the factors change. The factors include butare not limited to estimates of the following:
• Projected number of units to be delivered under the contracts;
• Escalation of future sales prices under the contracts;
• Costs, including material and labor costs and related escalation;
• Labor improvements due to the learning curve experience; and
• Supplier pricing including escalation where applicable.
Inventory
Inventoried costs on long-term contracts include certain pre-production costs, consisting prima-rily of tooling and design costs and production costs, including applicable overhead. The costsattributed to units delivered under long-term commercial contracts are based on the estimatedaverage cost of all units expected to be produced and are determined under the learning curveconcept, which anticipates a predictable decrease in unit costs as tasks and production tech-niques become more efficient through repetition. During the early years of a contract, manufac-turing costs per unit delivered are typically greater than the estimated average unit cost for thetotal contract. This excess manufacturing cost for units shipped results in an increase ininventory (referred to as “excess-over-average”) during the early years of a contract.
If in-process inventory plus estimated costs to complete a specific contract exceeds the antici-pated remaining sales value of such contract, such excess is charged to cost of sales in the periodrecognized, thus reducing inventory to estimated realizable value.
Income Taxes
In accordance with SFAS 109, Accounting Principles Board Opinion No. 28, “Interim FinancialReporting” and FASB Interpretation No. 18, “Accounting for Income Taxes in Interim Periods,”as of each reporting period, we estimate an effective income tax rate that is expected to beapplicable for the full fiscal year. The estimate of our effective income tax rate involvessignificant judgments regarding the application of complex tax regulations across many jurisdic-tions and estimates as to the amount and jurisdictional source of income expected to be earnedduring the full fiscal year. Further influencing this estimate are evolving interpretations of newand existing tax laws, rulings by taxing authorities and court decisions. Due to the subjectiveand complex nature of these underlying issues, our actual effective tax rate and related taxliabilities may differ from our initial estimates. Differences between our estimated and actualeffective income tax rates and related liabilities are recorded in the period they become known.The resulting adjustment to our income tax expense could have a material effect on our resultsof operations in the period the adjustment is recorded.
In accordance with SFAS 5, we record tax contingencies when the exposure item becomesprobable and the amount is reasonably estimable. As of December 31, 2006 and 2005, we hadrecorded tax contingency reserves of approximately $173 million and $325.6 million, respectively.
In accordance with SFAS 109, deferred tax assets and liabilities are recorded for tax carryfor-wards and the net tax effects of temporary differences between the carrying amounts of assetsand liabilities for financial reporting and income tax purposes are measured using enacted taxlaws and rates. A valuation allowance is provided on deferred tax assets if it is determined thatit is more likely than not that the asset will not be realized.
56
Identifiable Intangible Assets
Impairments of identifiable intangible assets are recognized when events or changes in circum-stances indicate that the carrying amount of the asset, or related groups of assets, may not berecoverable and our estimate of undiscounted cash flows over the assets’ remaining useful livesis less than the carrying value of the assets. The determination of undiscounted cash flow isbased on our segments’ plans. The revenue growth is based upon aircraft build projections fromaircraft manufacturers and widely available external publications. The profit margin assumptionis based upon the current cost structure and anticipated cost reductions. Changes to theseassumptions could result in the recognition of impairment.
Participation Payments
Certain of our businesses make cash payments under long-term contractual arrangements to OEmanufacturers (OEM) or system contractors in return for a secured position on an aircraftprogram. Participation payments are capitalized, when a contractual liability has been incurred,as other assets and amortized as cost of sales. The carrying amount of participation payments isevaluated for recovery at least annually or when other indicators of impairment, such as achange in the estimated number of units or a revision in the economics of the program. If suchestimates change, amortization expense is adjusted and/or an impairment charge is recorded, asappropriate, for the effect of the revised estimates.
Entry Fees
Certain businesses in our Engine Systems segment make cash payments to an OEM under long-term contractual arrangements related to new engine programs. The payments are referred toas entry fees and entitle us to a controlled access supply contract and a percentage of totalprogram revenue generated by the OEM. Entry fees are capitalized in other assets and areamortized on a straight-line basis to cost of sales or as a reduction of sales, as appropriate. Thecarrying amount of entry fees is evaluated for recovery at least annually or when othersignificant assumptions or economic conditions change. Recovery of entry fees is assessed basedon the expected cash flow from the program over the remaining program life as compared tothe recorded amount of entry fees. If the carrying value of the entry fees exceeds the cash flowto be generated from the program, a charge would be recorded for the amount by which thecarrying amount of the entry fee exceeds its fair value.
As with any investment, there are risks inherent in recovering the value of entry fees. Such risksare consistent with the risks associated in acquiring a revenue-producing asset in which marketconditions may change or the risks that arise when a manufacturer of a product on which aroyalty is based has business difficulties and cannot produce the product. Such risks include butare not limited to the following:
• Changes in market conditions that may affect product sales under the program, includingmarket acceptance and competition from others;
• Performance of subcontract suppliers and other production risks;
• Bankruptcy or other less significant financial difficulties of other program participants,including the aircraft manufacturer, the OEM and other program suppliers or the aircraftcustomer; and
• Availability of specialized raw materials in the marketplace.
Sales Incentives
We offer sales incentives such as up-front cash payments, merchandise credits and/or freeproducts to certain airline customers in connection with sales contracts. The cost of these
57
incentives is recognized in the period incurred unless recovery of these costs is specificallyguaranteed by the customer in the contract. If the contract contains such a guarantee, then thecost of the sales incentive is capitalized as other assets and amortized to cost of sales. Thecarrying amount of sales incentives is evaluated for recovery when indicators of potentialimpairment exist. The carrying value of the sales incentives is also compared annually to theamount recoverable under the terms of the guarantee in the customer contract. If the amountof the carrying value of the sales incentives exceeds the amount recoverable in the contract, thecarrying value is reduced.
Flight Certification Costs
When a supply arrangement is secured, certain of our businesses may agree to supply hardwareto an OEM to be used in flight certification testing and/or make cash payments to reimburse anOEM for costs incurred in testing the hardware. The flight certification testing is necessary tocertify aircraft systems/components for the aircraft’s airworthiness and allows the aircraft to beflown and thus sold in the country certifying the aircraft. Flight certification costs are capitalizedin other assets and are amortized to cost of sales. The carrying amount of flight certificationcosts is evaluated for recovery when indicators of impairment exist or when the estimatednumber of units to be manufactured changes.
Service and Product Warranties
We provide service and warranty policies on certain of our products. We accrue liabilities underservice and warranty policies based upon specific claims and a review of historical warranty andservice claim experience in accordance with SFAS 5. Adjustments are made to accruals as claimdata and historical experience change. In addition, we incur discretionary costs to service itsproducts in connection with product performance issues.
Our service and product warranty reserves are based upon a variety of factors. Any significantchange in these factors could have a material impact on our results of operations. Such factorsinclude but are not limited to the following:
• The historical performance of our products and changes in performance of newerproducts;
• The mix and volumes of products being sold; and
• The impact of product changes.
Pension and Postretirement Benefits Other Than Pensions
We consult with an outside actuary as to the appropriateness for many of the assumptions usedin determining the benefit obligations and the annual expense for our pension and postretire-ment benefits other than pensions. Assumptions such as the rate of compensation increase andthe long-term rate of return on plan assets are based upon our historical and benchmark data,as well as our outlook for the future. Health care cost projections and the mortality rateassumption are evaluated annually. For December 31, 2006 the U.S. discount rate was deter-mined based on a customized yield curve approach. Our projected pension and postretirementbenefit payment cash flows were each plotted against a yield curve composed of a large, diversegroup of Aa-rated corporate bonds. The resulting discount rate was used to determine thebenefit obligations as of December 31, 2006. This same approach was used to determineU.S. discount rates to use to remeasure plan obligations on April 11, 2006, in connection withour definitive agreement to divest the turbomachinery products business (which agreement wassubsequently terminated), on May 19, 2006 and due to the closure of the election period for theRetirement Choice Program. In the U.K. and Canada, a similar approach to determining discountrates in the U.S. is utilized. This is a change in methodology for setting the U.K. discount rate,
58
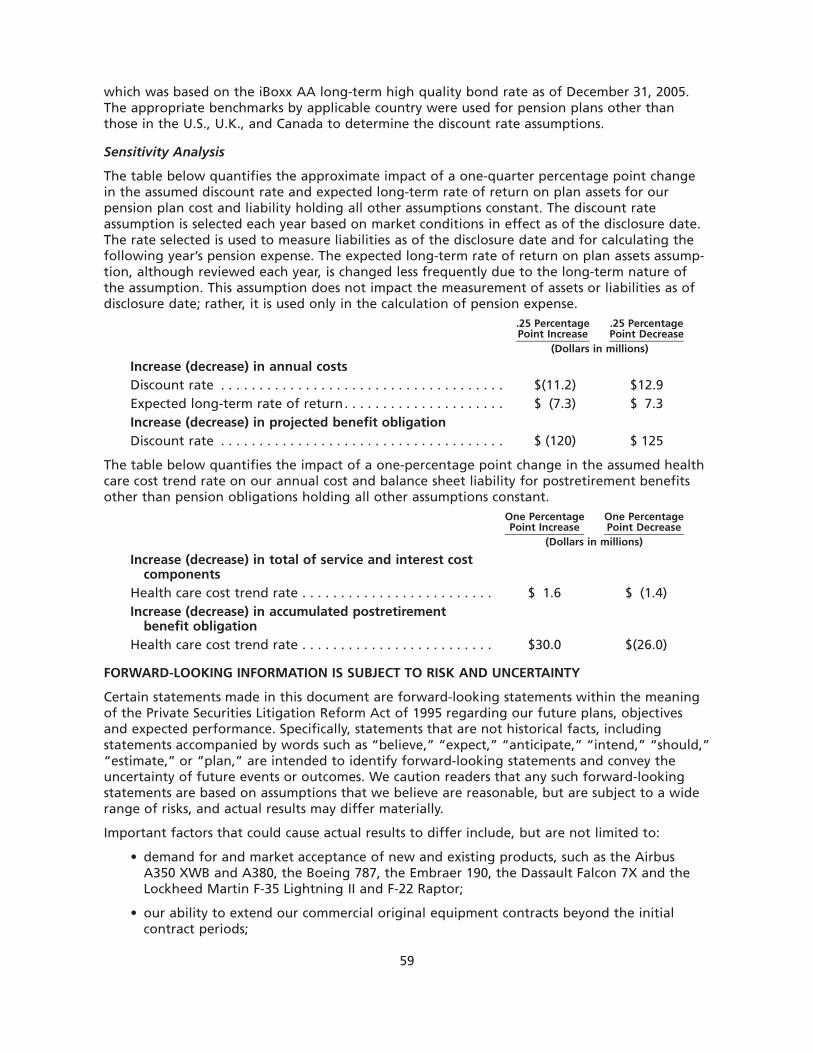
which was based on the iBoxx AA long-term high quality bond rate as of December 31, 2005.The appropriate benchmarks by applicable country were used for pension plans other thanthose in the U.S., U.K., and Canada to determine the discount rate assumptions.
Sensitivity Analysis
The table below quantifies the approximate impact of a one-quarter percentage point changein the assumed discount rate and expected long-term rate of return on plan assets for ourpension plan cost and liability holding all other assumptions constant. The discount rateassumption is selected each year based on market conditions in effect as of the disclosure date.The rate selected is used to measure liabilities as of the disclosure date and for calculating thefollowing year’s pension expense. The expected long-term rate of return on plan assets assump-tion, although reviewed each year, is changed less frequently due to the long-term nature ofthe assumption. This assumption does not impact the measurement of assets or liabilities as ofdisclosure date; rather, it is used only in the calculation of pension expense.
.25 PercentagePoint Increase
.25 PercentagePoint Decrease
(Dollars in millions)
Increase (decrease) in annual costsDiscount rate . . . . . . . . . . . . . . . . . . . . . . . . . . . . . . . . . . . . . $(11.2) $12.9Expected long-term rate of return. . . . . . . . . . . . . . . . . . . . . $ (7.3) $ 7.3Increase (decrease) in projected benefit obligationDiscount rate . . . . . . . . . . . . . . . . . . . . . . . . . . . . . . . . . . . . . $ (120) $ 125
The table below quantifies the impact of a one-percentage point change in the assumed healthcare cost trend rate on our annual cost and balance sheet liability for postretirement benefitsother than pension obligations holding all other assumptions constant.
One PercentagePoint Increase
One PercentagePoint Decrease
(Dollars in millions)
Increase (decrease) in total of service and interest costcomponents
Health care cost trend rate . . . . . . . . . . . . . . . . . . . . . . . . . $ 1.6 $ (1.4)Increase (decrease) in accumulated postretirement
benefit obligationHealth care cost trend rate . . . . . . . . . . . . . . . . . . . . . . . . . $30.0 $(26.0)
FORWARD-LOOKING INFORMATION IS SUBJECT TO RISK AND UNCERTAINTY
Certain statements made in this document are forward-looking statements within the meaningof the Private Securities Litigation Reform Act of 1995 regarding our future plans, objectivesand expected performance. Specifically, statements that are not historical facts, includingstatements accompanied by words such as “believe,” “expect,” “anticipate,” “intend,” “should,”“estimate,” or “plan,” are intended to identify forward-looking statements and convey theuncertainty of future events or outcomes. We caution readers that any such forward-lookingstatements are based on assumptions that we believe are reasonable, but are subject to a widerange of risks, and actual results may differ materially.
Important factors that could cause actual results to differ include, but are not limited to:
• demand for and market acceptance of new and existing products, such as the AirbusA350 XWB and A380, the Boeing 787, the Embraer 190, the Dassault Falcon 7X and theLockheed Martin F-35 Lightning II and F-22 Raptor;
• our ability to extend our commercial original equipment contracts beyond the initialcontract periods;
59
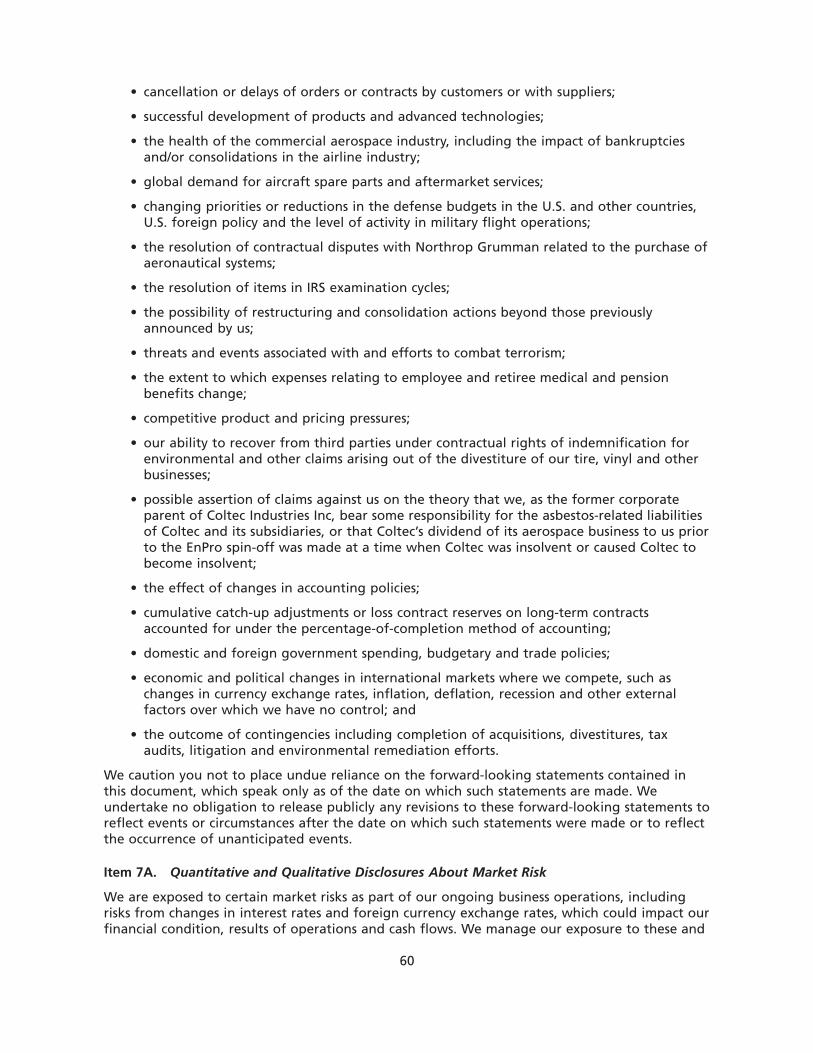
• cancellation or delays of orders or contracts by customers or with suppliers;
• successful development of products and advanced technologies;
• the health of the commercial aerospace industry, including the impact of bankruptciesand/or consolidations in the airline industry;
• global demand for aircraft spare parts and aftermarket services;
• changing priorities or reductions in the defense budgets in the U.S. and other countries,U.S. foreign policy and the level of activity in military flight operations;
• the resolution of contractual disputes with Northrop Grumman related to the purchase ofaeronautical systems;
• the resolution of items in IRS examination cycles;
• the possibility of restructuring and consolidation actions beyond those previouslyannounced by us;
• threats and events associated with and efforts to combat terrorism;
• the extent to which expenses relating to employee and retiree medical and pensionbenefits change;
• competitive product and pricing pressures;
• our ability to recover from third parties under contractual rights of indemnification forenvironmental and other claims arising out of the divestiture of our tire, vinyl and otherbusinesses;
• possible assertion of claims against us on the theory that we, as the former corporateparent of Coltec Industries Inc, bear some responsibility for the asbestos-related liabilitiesof Coltec and its subsidiaries, or that Coltec’s dividend of its aerospace business to us priorto the EnPro spin-off was made at a time when Coltec was insolvent or caused Coltec tobecome insolvent;
• the effect of changes in accounting policies;
• cumulative catch-up adjustments or loss contract reserves on long-term contractsaccounted for under the percentage-of-completion method of accounting;
• domestic and foreign government spending, budgetary and trade policies;
• economic and political changes in international markets where we compete, such aschanges in currency exchange rates, inflation, deflation, recession and other externalfactors over which we have no control; and
• the outcome of contingencies including completion of acquisitions, divestitures, taxaudits, litigation and environmental remediation efforts.
We caution you not to place undue reliance on the forward-looking statements contained inthis document, which speak only as of the date on which such statements are made. Weundertake no obligation to release publicly any revisions to these forward-looking statements toreflect events or circumstances after the date on which such statements were made or to reflectthe occurrence of unanticipated events.
Item 7A. Quantitative and Qualitative Disclosures About Market Risk
We are exposed to certain market risks as part of our ongoing business operations, includingrisks from changes in interest rates and foreign currency exchange rates, which could impact ourfinancial condition, results of operations and cash flows. We manage our exposure to these and
60
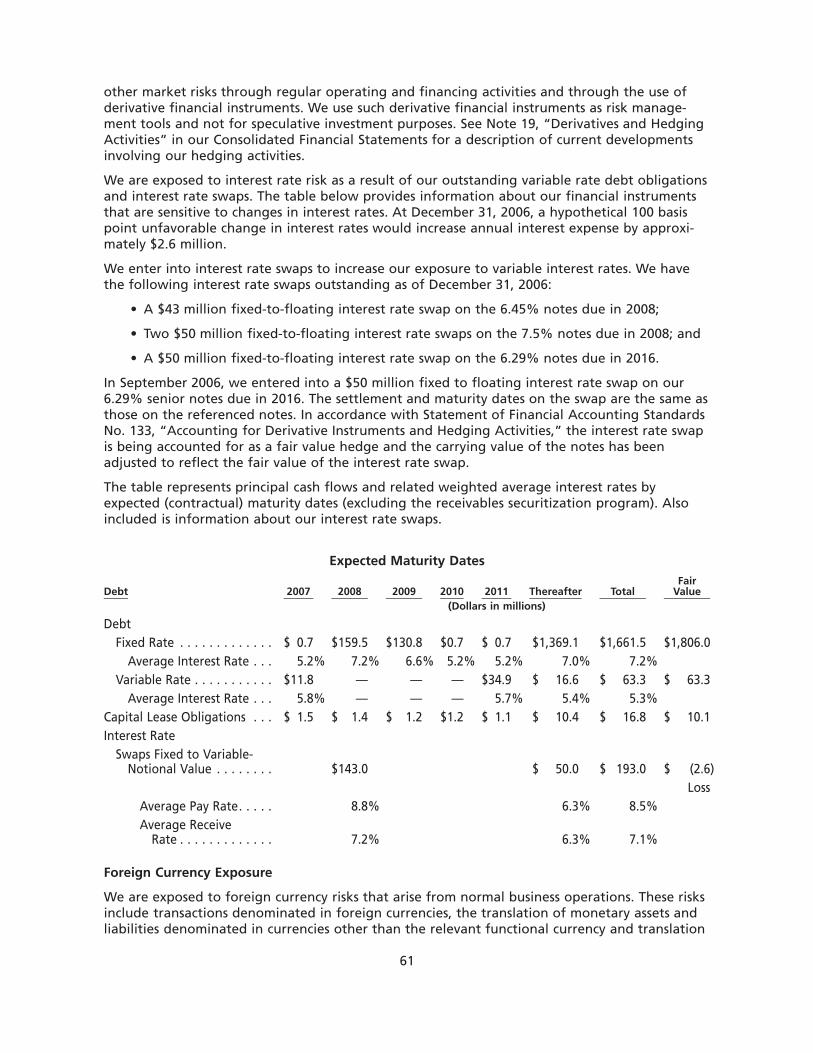
other market risks through regular operating and financing activities and through the use ofderivative financial instruments. We use such derivative financial instruments as risk manage-ment tools and not for speculative investment purposes. See Note 19, “Derivatives and HedgingActivities” in our Consolidated Financial Statements for a description of current developmentsinvolving our hedging activities.
We are exposed to interest rate risk as a result of our outstanding variable rate debt obligationsand interest rate swaps. The table below provides information about our financial instrumentsthat are sensitive to changes in interest rates. At December 31, 2006, a hypothetical 100 basispoint unfavorable change in interest rates would increase annual interest expense by approxi-mately $2.6 million.
We enter into interest rate swaps to increase our exposure to variable interest rates. We havethe following interest rate swaps outstanding as of December 31, 2006:
• A $43 million fixed-to-floating interest rate swap on the 6.45% notes due in 2008;
• Two $50 million fixed-to-floating interest rate swaps on the 7.5% notes due in 2008; and
• A $50 million fixed-to-floating interest rate swap on the 6.29% notes due in 2016.
In September 2006, we entered into a $50 million fixed to floating interest rate swap on our6.29% senior notes due in 2016. The settlement and maturity dates on the swap are the same asthose on the referenced notes. In accordance with Statement of Financial Accounting StandardsNo. 133, “Accounting for Derivative Instruments and Hedging Activities,” the interest rate swapis being accounted for as a fair value hedge and the carrying value of the notes has beenadjusted to reflect the fair value of the interest rate swap.
The table represents principal cash flows and related weighted average interest rates byexpected (contractual) maturity dates (excluding the receivables securitization program). Alsoincluded is information about our interest rate swaps.
Expected Maturity Dates
Debt 2007 2008 2009 2010 2011 Thereafter TotalFair
Value(Dollars in millions)
DebtFixed Rate . . . . . . . . . . . . . $ 0.7 $159.5 $130.8 $0.7 $ 0.7 $1,369.1 $1,661.5 $1,806.0
Average Interest Rate . . . 5.2% 7.2% 6.6% 5.2% 5.2% 7.0% 7.2%Variable Rate . . . . . . . . . . . $11.8 — — — $34.9 $ 16.6 $ 63.3 $ 63.3
Average Interest Rate . . . 5.8% — — — 5.7% 5.4% 5.3%Capital Lease Obligations . . . $ 1.5 $ 1.4 $ 1.2 $1.2 $ 1.1 $ 10.4 $ 16.8 $ 10.1Interest Rate
Swaps Fixed to Variable-Notional Value . . . . . . . . $143.0 $ 50.0 $ 193.0 $ (2.6)
LossAverage Pay Rate. . . . . 8.8% 6.3% 8.5%Average Receive
Rate . . . . . . . . . . . . . 7.2% 6.3% 7.1%
Foreign Currency Exposure
We are exposed to foreign currency risks that arise from normal business operations. These risksinclude transactions denominated in foreign currencies, the translation of monetary assets andliabilities denominated in currencies other than the relevant functional currency and translation
61
of income and expense and balance sheet amounts of our foreign subsidiaries to the U.S. Dollar.Our objective is to minimize our exposure to transaction and income risks through our normaloperating activities and, where appropriate, through foreign currency forward exchangecontracts.
Foreign exchange negatively impacted our business segments financial results in 2006. Approx-imately 10% of our revenues and approximately 25% of our costs are denominated in currenciesother than the U.S. Dollar. Over 90% of these net costs are in Euros, Great Britain PoundsSterling and Canadian Dollars. We hedge a portion of our exposure of U.S. Dollar sales on anongoing basis.
As currency exchange rates fluctuate, translation of the statements of income of internationalbusinesses into U.S. Dollars will affect comparability of revenues and expenses between years.
We have entered into foreign exchange forward contracts to sell U.S. Dollars for Great BritainPounds Sterling, Canadian Dollars, Euros and Polish Zlotys. These forward contracts are used tomitigate a portion of the potential volatility to earnings and cash flows arising from changes incurrency exchange rates. As of December 31, 2006 we had forward contracts with an aggregatenotional amount of $633 million to buy Great Britain Pounds Sterling, forward contracts with anaggregate notional amount of $551.6 million to buy Canadian Dollars, forward contracts withan aggregate notional amount of $418.2 million to buy Euros and forward contracts with anaggregate notional amount of $36.6 million to buy Polish Zlotys. These forward contractsmature on a monthly basis with maturity dates that range from January 2007 to December2010.
At December 31, 2006, a hypothetical 10% strengthening of the U.S. Dollar against otherforeign currencies would decrease the value of the forward contracts described above by$172.2 million. The fair value of these forward contracts was $85.2 million at December 31,2006. Because we hedge only a portion of our exposure, a strengthening of the U.S. Dollar asdescribed above would have a more than offsetting benefit to our financial results in futureperiods.
In addition to the foreign exchange cash flow hedges, we have entered into foreign exchangeforward contracts to manage foreign currency risk related to the translation of monetary assetsand liabilities denominated in currencies other than the relevant functional currency. Theseforward contracts mature monthly and the notional amounts are adjusted periodically to reflectchanges in net monetary asset balances. As of December 31, 2006, we had forward contractswith a notional value of $63.1 million to buy Great Britain Pounds Sterling, forward contractswith a notional value of $120.7 million to buy Euros and forward contracts with a notionalvalue of $11 million to buy Canadian Dollars.
62
Item 8. Financial Statements
INDEX TO CONSOLIDATED FINANCIAL STATEMENTS
Management’s Report on Internal Control Over Financial Reporting . . . . . . . . . . . . . . . . . . . 64Report of Independent Registered Public Accounting Firm on the Consolidated Financial
Statements . . . . . . . . . . . . . . . . . . . . . . . . . . . . . . . . . . . . . . . . . . . . . . . . . . . . . . . . . . . . . . . 65Report of Independent Registered Public Accounting Firm on Management’s Assessment
and the Effectiveness of Internal Control Over Financial Reporting . . . . . . . . . . . . . . . . . . . 66Consolidated Statement of Income for the Years Ended December 31, 2006, 2005, and
2004 . . . . . . . . . . . . . . . . . . . . . . . . . . . . . . . . . . . . . . . . . . . . . . . . . . . . . . . . . . . . . . . . . . . . 67Consolidated Balance Sheet as of December 31, 2006 and 2005 . . . . . . . . . . . . . . . . . . . . . . . 68Consolidated Statement of Cash Flows for the Years Ended December 31, 2006, 2005 and
2004 . . . . . . . . . . . . . . . . . . . . . . . . . . . . . . . . . . . . . . . . . . . . . . . . . . . . . . . . . . . . . . . . . . . . 69Consolidated Statement of Shareholders’ Equity for the Years Ended December 31, 2006,
2005 and 2004 . . . . . . . . . . . . . . . . . . . . . . . . . . . . . . . . . . . . . . . . . . . . . . . . . . . . . . . . . . . . 70Notes to Consolidated Financial Statements
Note 1 — Significant Accounting Policies . . . . . . . . . . . . . . . . . . . . . . . . . . . . . . . . . . . . . . . 71Note 2 — New Accounting Standards Not Adopted . . . . . . . . . . . . . . . . . . . . . . . . . . . . . . . 75Note 3 — Business Segment Information . . . . . . . . . . . . . . . . . . . . . . . . . . . . . . . . . . . . . . . . 76Note 4 — Restructuring and Consolidation Costs . . . . . . . . . . . . . . . . . . . . . . . . . . . . . . . . . 80Note 5 — Other Income (Expense) — Net . . . . . . . . . . . . . . . . . . . . . . . . . . . . . . . . . . . . . . . 81Note 6 — Discontinued Operations . . . . . . . . . . . . . . . . . . . . . . . . . . . . . . . . . . . . . . . . . . . . 82Note 7 — Cumulative Effect of Change in Accounting . . . . . . . . . . . . . . . . . . . . . . . . . . . . . 82Note 8 — Earnings Per Share . . . . . . . . . . . . . . . . . . . . . . . . . . . . . . . . . . . . . . . . . . . . . . . . . 84Note 9 — Sale of Receivables . . . . . . . . . . . . . . . . . . . . . . . . . . . . . . . . . . . . . . . . . . . . . . . . . 84Note 10 — Inventories . . . . . . . . . . . . . . . . . . . . . . . . . . . . . . . . . . . . . . . . . . . . . . . . . . . . . . 85Note 11 — Goodwill and Identifiable Intangible Assets . . . . . . . . . . . . . . . . . . . . . . . . . . . . 86Note 12 — Other Assets . . . . . . . . . . . . . . . . . . . . . . . . . . . . . . . . . . . . . . . . . . . . . . . . . . . . . 88Note 13 — Financing Arrangements . . . . . . . . . . . . . . . . . . . . . . . . . . . . . . . . . . . . . . . . . . . 88Note 14 — Lease Commitments . . . . . . . . . . . . . . . . . . . . . . . . . . . . . . . . . . . . . . . . . . . . . . . 91Note 15 — Pensions and Postretirement Benefits . . . . . . . . . . . . . . . . . . . . . . . . . . . . . . . . . 92Note 16 — Income Taxes. . . . . . . . . . . . . . . . . . . . . . . . . . . . . . . . . . . . . . . . . . . . . . . . . . . . . 102Note 17 — Supplemental Balance Sheet Information . . . . . . . . . . . . . . . . . . . . . . . . . . . . . . 105Note 18 — Contingencies . . . . . . . . . . . . . . . . . . . . . . . . . . . . . . . . . . . . . . . . . . . . . . . . . . . . 108Note 19 — Derivatives and Hedging Activities. . . . . . . . . . . . . . . . . . . . . . . . . . . . . . . . . . . . 114Note 20 — Supplemental Cash Flow Information . . . . . . . . . . . . . . . . . . . . . . . . . . . . . . . . . 116Note 21 — Preferred Stock . . . . . . . . . . . . . . . . . . . . . . . . . . . . . . . . . . . . . . . . . . . . . . . . . . . 116Note 22 — Common Stock. . . . . . . . . . . . . . . . . . . . . . . . . . . . . . . . . . . . . . . . . . . . . . . . . . . 117Note 23 — Share-Based Compensation . . . . . . . . . . . . . . . . . . . . . . . . . . . . . . . . . . . . . . . . . 118
Quarterly Financial Data (unaudited) . . . . . . . . . . . . . . . . . . . . . . . . . . . . . . . . . . . . . . . . . . . . 125
63
MANAGEMENT’S REPORT ON INTERNAL CONTROL OVER FINANCIAL REPORTING
The management of Goodrich Corporation (Goodrich) is responsible for establishing and main-taining adequate internal control over financial reporting as defined in Rules 13a-15(f) and15d-15(f) under the Securities Exchange Act of 1934. Goodrich’s internal control system overfinancial reporting is designed to provide reasonable assurance regarding the reliability offinancial reporting and the preparation of financial statements for external purposes in accor-dance with generally accepted accounting principles. The Company’s internal control overfinancial reporting includes those policies and procedures that:
(i) pertain to the maintenance of records that, in reasonable detail, accurately andfairly reflect the transactions and dispositions of the assets of the company;
(ii) provide reasonable assurance that transactions are recorded as necessary to permitpreparation of financial statements in accordance with U.S. generally accepted account-ing principles, and that receipts and expenditures of the company are being made onlyin accordance with authorizations of management and directors of the company; and
(iii) provide reasonable assurance regarding prevention or timely detection of unautho-rized acquisition, use or disposition of the company’s assets that could have amaterial effect on the financial statements.
Because of inherent limitations, internal control over financial reporting may not prevent ordetect misstatements. Therefore, even those systems determined to be effective can provide onlyreasonable assurance with respect to financial statement preparation and presentation. Also,projections of any evaluation of effectiveness to future periods are subject to risk that controlsmay become inadequate because of changes in condition, or that the degree of compliancewith the policies or procedures may deteriorate.
Goodrich’s management assessed the effectiveness of Goodrich’s internal control over financialreporting as of December 31, 2006. In making this assessment, management used the criteria setforth by the Committee of Sponsoring Organizations of the Treadway Commission (COSO) inInternal Control-Integrated Framework. Based on management’s assessment and those criteria,management believes that Goodrich maintained effective internal control over financial report-ing as of December 31, 2006.
Goodrich’s independent registered public accounting firm, Ernst & Young LLP, has issued anaudit report on management’s assessment and the effectiveness of Goodrich’s internal controlover financial reporting. This report appears on page 66.
/s/ MARSHALL O. LARSEN
Marshall O. LarsenChairman, President andChief Executive Officer
/s/ SCOTT E. KUECHLE
SCOTT E. KUECHLE
Senior Vice President andChief Financial Officer
/s/ SCOTT A. COTTRILL
Scott A. CottrillVice President and Controller(Principal Accounting Officer)
February 19, 2007
64
REPORT OF INDEPENDENT REGISTERED PUBLIC ACCOUNTING FIRM
To the Shareholders and Board of Directors of Goodrich Corporation
We have audited the accompanying consolidated balance sheet of Goodrich Corporation as ofDecember 31, 2006 and 2005, and the related consolidated statements of income, shareholders’equity and cash flows for each of the three years in the period ended December 31, 2006. Thesefinancial statements are the responsibility of the Company’s management. Our responsibility isto express an opinion on these financial statements based on our audits.
We conducted our audits in accordance with the standards of the Public Company AccountingOversight Board (United States). Those standards require that we plan and perform the audit toobtain reasonable assurance about whether the financial statements are free of materialmisstatement. An audit includes examining, on a test basis, evidence supporting the amountsand disclosures in the financial statements. An audit also includes assessing the accountingprinciples used and significant estimates made by management, as well as evaluating the overallfinancial statement presentation. We believe that our audits provide a reasonable basis for ouropinion.
In our opinion, the financial statements referred to above present fairly, in all material respects,the consolidated financial position of Goodrich Corporation at December 31, 2006 and 2005,and the consolidated results of its operations and its cash flows for each of the three years inthe period ended December 31, 2006, in conformity with U.S. generally accepted accountingprinciples.
As discussed in Note 7 to the consolidated financial statements, in 2004 the Company changedits method of accounting for certain aspects of the application of contract accounting. Asdiscussed in Notes 15 and 23, in 2006 the Company adopted Statement of Financial AccountingStandards No. 158, Employers’ Accounting for Defined Benefit Pension and Other PostretirementPlans, and Statement of Financial Accounting Standards No. 123(R), Share-Based Payment.
We also have audited, in accordance with standards of the Public Company AccountingOversight Board (United States), the effectiveness of Goodrich Corporation’s internal controlover financial reporting as of December 31, 2006 based on criteria established in InternalControl-Integrated Framework issued by the Committee of Sponsoring Organizations of theTreadway Commission and our report dated February 19, 2007 expressed an unqualified opinionthereon.
/s/ ERNST & YOUNG LLP
Charlotte, North CarolinaFebruary 19, 2007
65
REPORT OF INDEPENDENT REGISTERED PUBLIC ACCOUNTING FIRM
To the Shareholders and Board of Directors of Goodrich Corporation
We have audited management’s assessment, included in the accompanying Management’sReport on Internal Control Over Financial Reporting, that Goodrich Corporation maintainedeffective internal control over financial reporting as of December 31, 2006, based on criteriaestablished in Internal Control — Integrated Framework issued by the Committee of SponsoringOrganizations of the Treadway Commission (the COSO criteria). Goodrich Corporation’s manage-ment is responsible for maintaining effective internal control over financial reporting and for itsassessment of the effectiveness of internal control over financial reporting. Our responsibility isto express an opinion on management’s assessment and an opinion on the effectiveness of theCompany’s internal control over financial reporting based on our audit.
We conducted our audit in accordance with the standards of the Public Company AccountingOversight Board (United States). Those standards require that we plan and perform the audit toobtain reasonable assurance about whether effective internal control over financial reportingwas maintained in all material respects. Our audit included obtaining an understanding ofinternal control over financial reporting, evaluating management’s assessment, testing andevaluating the design and operating effectiveness of internal control, and performing suchother procedures as we considered necessary in the circumstances. We believe that our auditprovides a reasonable basis for our opinion.
A company’s internal control over financial reporting is a process designed to provide reason-able assurance regarding the reliability of financial reporting and the preparation of financialstatements for external purposes in accordance with generally accepted accounting principles. Acompany’s internal control over financial reporting includes those policies and procedures that(1) pertain to the maintenance of records that, in reasonable detail, accurately and fairly reflectthe transactions and dispositions of the assets of the company; (2) provide reasonable assurancethat transactions are recorded as necessary to permit preparation of financial statements inaccordance with generally accepted accounting principles, and that receipts and expenditures ofthe company are being made only in accordance with authorizations of management anddirectors of the company; and (3) provide reasonable assurance regarding prevention or timelydetection of unauthorized acquisition, use, or disposition of the company’s assets that couldhave a material effect on the financial statements.
Because of its inherent limitations, internal control over financial reporting may not prevent ordetect misstatements. Also, projections of any evaluation of effectiveness to future periods aresubject to the risk that controls may become inadequate because of changes in conditions, orthat the degree of compliance with the policies or procedures may deteriorate.
In our opinion, management’s assessment that Goodrich Corporation maintained effectiveinternal control over financial reporting as of December 31, 2006, is fairly stated, in all materialrespects, based on the COSO criteria. Also, in our opinion, Goodrich Corporation maintained, inall material respects, effective internal control over financial reporting as of December 31, 2006,based on the COSO criteria.
We also have audited, in accordance with the standards of the Public Company AccountingOversight Board (United States), the consolidated balance sheet as of December 31, 2006 and2005 and the related consolidated statements of income, shareholders’ equity and cash flows foreach of the three years in the period ended December 31, 2006 of Goodrich Corporation andour report dated February 19, 2007 expressed an unqualified opinion thereon.
/s/ ERNST & YOUNG LLP
Charlotte, North CarolinaFebruary 19, 2007
66
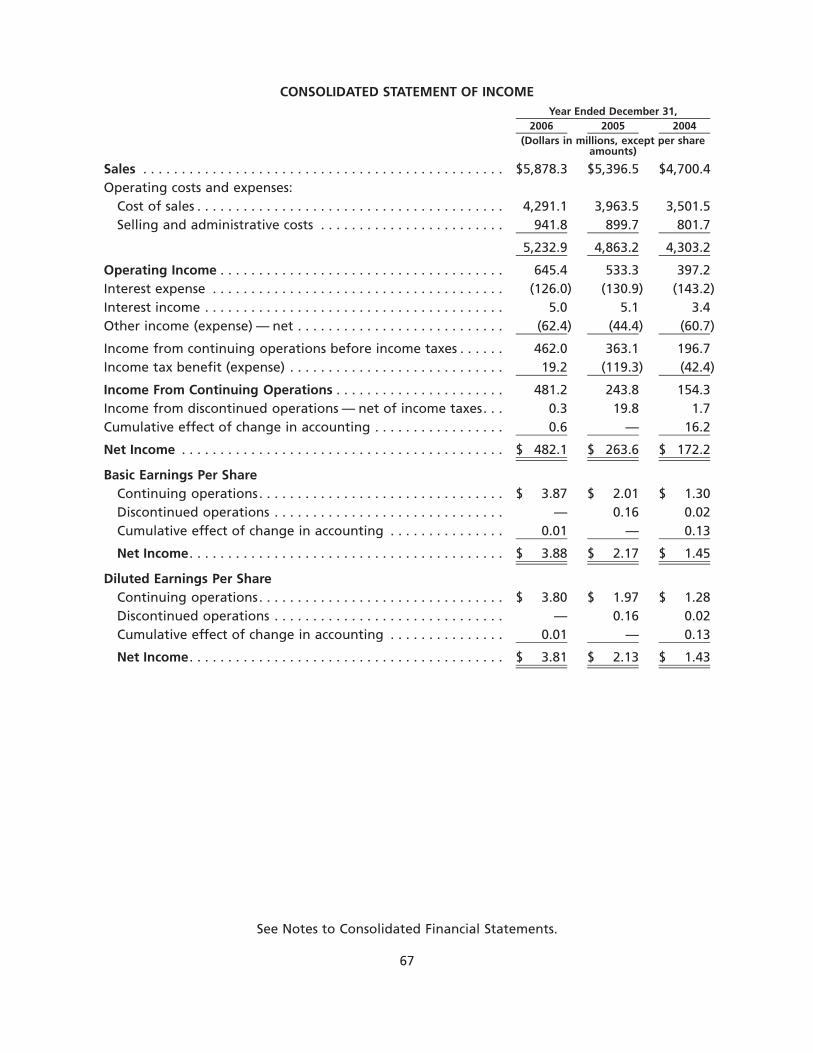
CONSOLIDATED STATEMENT OF INCOME
2006 2005 2004Year Ended December 31,
(Dollars in millions, except per shareamounts)
Sales . . . . . . . . . . . . . . . . . . . . . . . . . . . . . . . . . . . . . . . . . . . . . . . $5,878.3 $5,396.5 $4,700.4Operating costs and expenses:
Cost of sales . . . . . . . . . . . . . . . . . . . . . . . . . . . . . . . . . . . . . . . . 4,291.1 3,963.5 3,501.5Selling and administrative costs . . . . . . . . . . . . . . . . . . . . . . . . 941.8 899.7 801.7
5,232.9 4,863.2 4,303.2
Operating Income . . . . . . . . . . . . . . . . . . . . . . . . . . . . . . . . . . . . . 645.4 533.3 397.2Interest expense . . . . . . . . . . . . . . . . . . . . . . . . . . . . . . . . . . . . . . (126.0) (130.9) (143.2)Interest income . . . . . . . . . . . . . . . . . . . . . . . . . . . . . . . . . . . . . . . 5.0 5.1 3.4Other income (expense) — net . . . . . . . . . . . . . . . . . . . . . . . . . . . (62.4) (44.4) (60.7)
Income from continuing operations before income taxes . . . . . . 462.0 363.1 196.7Income tax benefit (expense) . . . . . . . . . . . . . . . . . . . . . . . . . . . . 19.2 (119.3) (42.4)
Income From Continuing Operations . . . . . . . . . . . . . . . . . . . . . . 481.2 243.8 154.3Income from discontinued operations — net of income taxes. . . 0.3 19.8 1.7Cumulative effect of change in accounting . . . . . . . . . . . . . . . . . 0.6 — 16.2
Net Income . . . . . . . . . . . . . . . . . . . . . . . . . . . . . . . . . . . . . . . . . . $ 482.1 $ 263.6 $ 172.2
Basic Earnings Per ShareContinuing operations. . . . . . . . . . . . . . . . . . . . . . . . . . . . . . . . $ 3.87 $ 2.01 $ 1.30Discontinued operations . . . . . . . . . . . . . . . . . . . . . . . . . . . . . . — 0.16 0.02Cumulative effect of change in accounting . . . . . . . . . . . . . . . 0.01 — 0.13
Net Income. . . . . . . . . . . . . . . . . . . . . . . . . . . . . . . . . . . . . . . . . $ 3.88 $ 2.17 $ 1.45
Diluted Earnings Per ShareContinuing operations. . . . . . . . . . . . . . . . . . . . . . . . . . . . . . . . $ 3.80 $ 1.97 $ 1.28Discontinued operations . . . . . . . . . . . . . . . . . . . . . . . . . . . . . . — 0.16 0.02Cumulative effect of change in accounting . . . . . . . . . . . . . . . 0.01 — 0.13
Net Income. . . . . . . . . . . . . . . . . . . . . . . . . . . . . . . . . . . . . . . . . $ 3.81 $ 2.13 $ 1.43
See Notes to Consolidated Financial Statements.
67
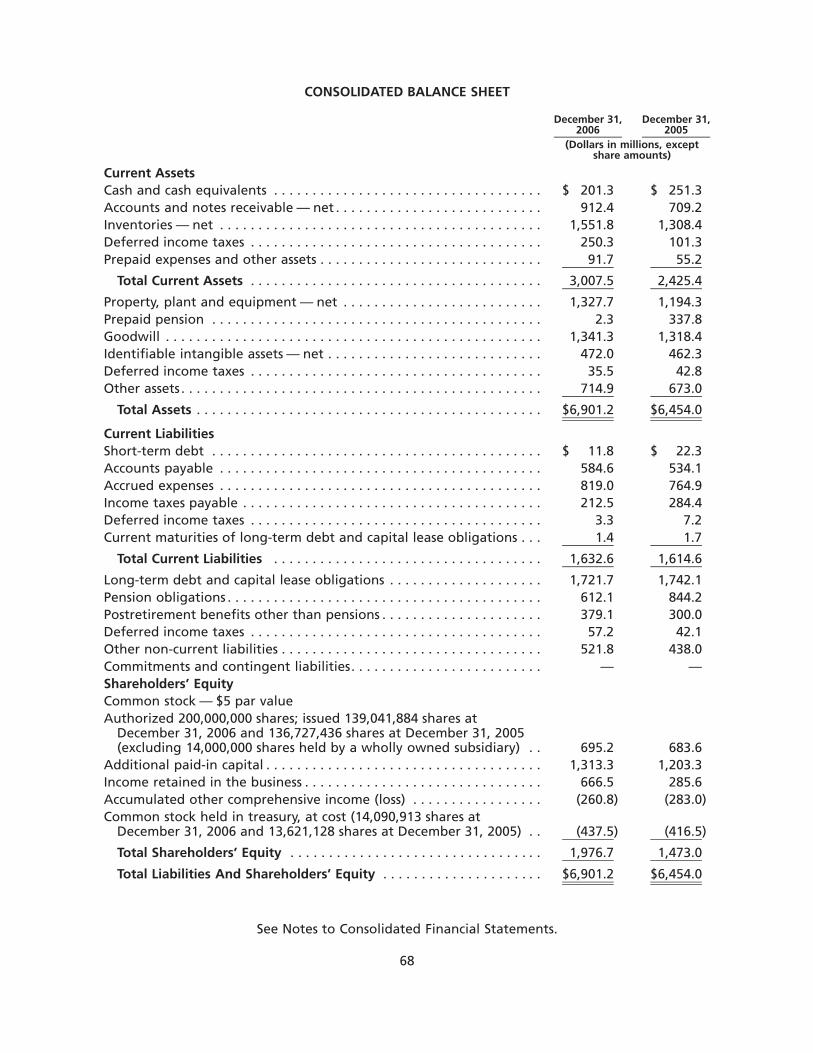
CONSOLIDATED BALANCE SHEET
December 31,2006
December 31,2005
(Dollars in millions, exceptshare amounts)
Current AssetsCash and cash equivalents . . . . . . . . . . . . . . . . . . . . . . . . . . . . . . . . . . . $ 201.3 $ 251.3Accounts and notes receivable — net . . . . . . . . . . . . . . . . . . . . . . . . . . . 912.4 709.2Inventories — net . . . . . . . . . . . . . . . . . . . . . . . . . . . . . . . . . . . . . . . . . . 1,551.8 1,308.4Deferred income taxes . . . . . . . . . . . . . . . . . . . . . . . . . . . . . . . . . . . . . . 250.3 101.3Prepaid expenses and other assets . . . . . . . . . . . . . . . . . . . . . . . . . . . . . 91.7 55.2
Total Current Assets . . . . . . . . . . . . . . . . . . . . . . . . . . . . . . . . . . . . . . 3,007.5 2,425.4
Property, plant and equipment — net . . . . . . . . . . . . . . . . . . . . . . . . . . 1,327.7 1,194.3Prepaid pension . . . . . . . . . . . . . . . . . . . . . . . . . . . . . . . . . . . . . . . . . . . 2.3 337.8Goodwill . . . . . . . . . . . . . . . . . . . . . . . . . . . . . . . . . . . . . . . . . . . . . . . . . 1,341.3 1,318.4Identifiable intangible assets — net . . . . . . . . . . . . . . . . . . . . . . . . . . . . 472.0 462.3Deferred income taxes . . . . . . . . . . . . . . . . . . . . . . . . . . . . . . . . . . . . . . 35.5 42.8Other assets . . . . . . . . . . . . . . . . . . . . . . . . . . . . . . . . . . . . . . . . . . . . . . . 714.9 673.0
Total Assets . . . . . . . . . . . . . . . . . . . . . . . . . . . . . . . . . . . . . . . . . . . . . $6,901.2 $6,454.0
Current LiabilitiesShort-term debt . . . . . . . . . . . . . . . . . . . . . . . . . . . . . . . . . . . . . . . . . . . $ 11.8 $ 22.3Accounts payable . . . . . . . . . . . . . . . . . . . . . . . . . . . . . . . . . . . . . . . . . . 584.6 534.1Accrued expenses . . . . . . . . . . . . . . . . . . . . . . . . . . . . . . . . . . . . . . . . . . 819.0 764.9Income taxes payable . . . . . . . . . . . . . . . . . . . . . . . . . . . . . . . . . . . . . . . 212.5 284.4Deferred income taxes . . . . . . . . . . . . . . . . . . . . . . . . . . . . . . . . . . . . . . 3.3 7.2Current maturities of long-term debt and capital lease obligations . . . 1.4 1.7
Total Current Liabilities . . . . . . . . . . . . . . . . . . . . . . . . . . . . . . . . . . . 1,632.6 1,614.6
Long-term debt and capital lease obligations . . . . . . . . . . . . . . . . . . . . 1,721.7 1,742.1Pension obligations . . . . . . . . . . . . . . . . . . . . . . . . . . . . . . . . . . . . . . . . . 612.1 844.2Postretirement benefits other than pensions . . . . . . . . . . . . . . . . . . . . . 379.1 300.0Deferred income taxes . . . . . . . . . . . . . . . . . . . . . . . . . . . . . . . . . . . . . . 57.2 42.1Other non-current liabilities . . . . . . . . . . . . . . . . . . . . . . . . . . . . . . . . . . 521.8 438.0Commitments and contingent liabilities. . . . . . . . . . . . . . . . . . . . . . . . . — —Shareholders’ EquityCommon stock — $5 par valueAuthorized 200,000,000 shares; issued 139,041,884 shares at
December 31, 2006 and 136,727,436 shares at December 31, 2005(excluding 14,000,000 shares held by a wholly owned subsidiary) . . 695.2 683.6
Additional paid-in capital . . . . . . . . . . . . . . . . . . . . . . . . . . . . . . . . . . . . 1,313.3 1,203.3Income retained in the business . . . . . . . . . . . . . . . . . . . . . . . . . . . . . . . 666.5 285.6Accumulated other comprehensive income (loss) . . . . . . . . . . . . . . . . . (260.8) (283.0)Common stock held in treasury, at cost (14,090,913 shares at
December 31, 2006 and 13,621,128 shares at December 31, 2005) . . (437.5) (416.5)
Total Shareholders’ Equity . . . . . . . . . . . . . . . . . . . . . . . . . . . . . . . . . 1,976.7 1,473.0
Total Liabilities And Shareholders’ Equity . . . . . . . . . . . . . . . . . . . . . $6,901.2 $6,454.0
See Notes to Consolidated Financial Statements.
68
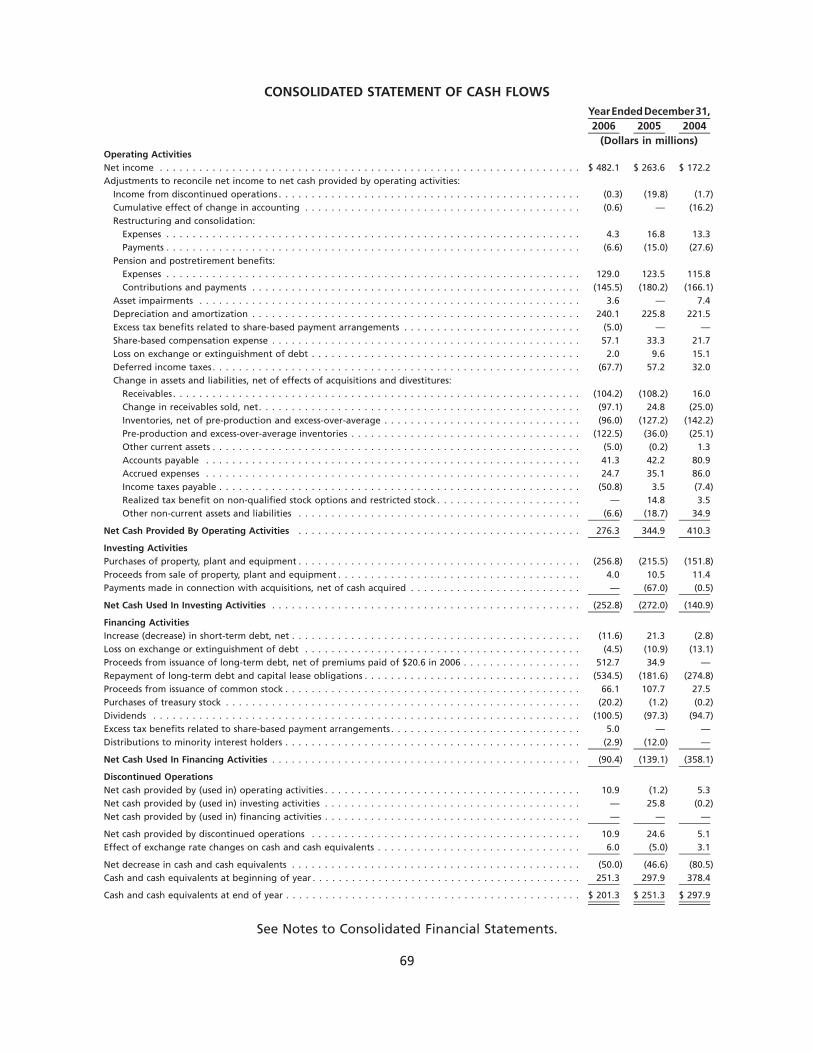
CONSOLIDATED STATEMENT OF CASH FLOWS
2006 2005 2004YearEndedDecember31,
(Dollars in millions)Operating ActivitiesNet income . . . . . . . . . . . . . . . . . . . . . . . . . . . . . . . . . . . . . . . . . . . . . . . . . . . . . . . . . . . . . . . . $ 482.1 $ 263.6 $ 172.2Adjustments to reconcile net income to net cash provided by operating activities:
Income from discontinued operations . . . . . . . . . . . . . . . . . . . . . . . . . . . . . . . . . . . . . . . . . . . . . . (0.3) (19.8) (1.7)Cumulative effect of change in accounting . . . . . . . . . . . . . . . . . . . . . . . . . . . . . . . . . . . . . . . . . . (0.6) — (16.2)Restructuring and consolidation:
Expenses . . . . . . . . . . . . . . . . . . . . . . . . . . . . . . . . . . . . . . . . . . . . . . . . . . . . . . . . . . . . . . . 4.3 16.8 13.3Payments . . . . . . . . . . . . . . . . . . . . . . . . . . . . . . . . . . . . . . . . . . . . . . . . . . . . . . . . . . . . . . . (6.6) (15.0) (27.6)
Pension and postretirement benefits:Expenses . . . . . . . . . . . . . . . . . . . . . . . . . . . . . . . . . . . . . . . . . . . . . . . . . . . . . . . . . . . . . . . 129.0 123.5 115.8Contributions and payments . . . . . . . . . . . . . . . . . . . . . . . . . . . . . . . . . . . . . . . . . . . . . . . . . . (145.5) (180.2) (166.1)
Asset impairments . . . . . . . . . . . . . . . . . . . . . . . . . . . . . . . . . . . . . . . . . . . . . . . . . . . . . . . . . . 3.6 — 7.4Depreciation and amortization . . . . . . . . . . . . . . . . . . . . . . . . . . . . . . . . . . . . . . . . . . . . . . . . . . 240.1 225.8 221.5Excess tax benefits related to share-based payment arrangements . . . . . . . . . . . . . . . . . . . . . . . . . . . (5.0) — —Share-based compensation expense . . . . . . . . . . . . . . . . . . . . . . . . . . . . . . . . . . . . . . . . . . . . . . . 57.1 33.3 21.7Loss on exchange or extinguishment of debt . . . . . . . . . . . . . . . . . . . . . . . . . . . . . . . . . . . . . . . . . 2.0 9.6 15.1Deferred income taxes . . . . . . . . . . . . . . . . . . . . . . . . . . . . . . . . . . . . . . . . . . . . . . . . . . . . . . . . (67.7) 57.2 32.0Change in assets and liabilities, net of effects of acquisitions and divestitures:
Receivables. . . . . . . . . . . . . . . . . . . . . . . . . . . . . . . . . . . . . . . . . . . . . . . . . . . . . . . . . . . . . . (104.2) (108.2) 16.0Change in receivables sold, net. . . . . . . . . . . . . . . . . . . . . . . . . . . . . . . . . . . . . . . . . . . . . . . . . (97.1) 24.8 (25.0)Inventories, net of pre-production and excess-over-average . . . . . . . . . . . . . . . . . . . . . . . . . . . . . . (96.0) (127.2) (142.2)Pre-production and excess-over-average inventories . . . . . . . . . . . . . . . . . . . . . . . . . . . . . . . . . . . (122.5) (36.0) (25.1)Other current assets . . . . . . . . . . . . . . . . . . . . . . . . . . . . . . . . . . . . . . . . . . . . . . . . . . . . . . . . (5.0) (0.2) 1.3Accounts payable . . . . . . . . . . . . . . . . . . . . . . . . . . . . . . . . . . . . . . . . . . . . . . . . . . . . . . . . . 41.3 42.2 80.9Accrued expenses . . . . . . . . . . . . . . . . . . . . . . . . . . . . . . . . . . . . . . . . . . . . . . . . . . . . . . . . . 24.7 35.1 86.0Income taxes payable . . . . . . . . . . . . . . . . . . . . . . . . . . . . . . . . . . . . . . . . . . . . . . . . . . . . . . . (50.8) 3.5 (7.4)Realized tax benefit on non-qualified stock options and restricted stock . . . . . . . . . . . . . . . . . . . . . . — 14.8 3.5Other non-current assets and liabilities . . . . . . . . . . . . . . . . . . . . . . . . . . . . . . . . . . . . . . . . . . . (6.6) (18.7) 34.9
Net Cash Provided By Operating Activities . . . . . . . . . . . . . . . . . . . . . . . . . . . . . . . . . . . . . . . . . . . 276.3 344.9 410.3
Investing ActivitiesPurchases of property, plant and equipment . . . . . . . . . . . . . . . . . . . . . . . . . . . . . . . . . . . . . . . . . . . (256.8) (215.5) (151.8)Proceeds from sale of property, plant and equipment . . . . . . . . . . . . . . . . . . . . . . . . . . . . . . . . . . . . . 4.0 10.5 11.4Payments made in connection with acquisitions, net of cash acquired . . . . . . . . . . . . . . . . . . . . . . . . . . — (67.0) (0.5)
Net Cash Used In Investing Activities . . . . . . . . . . . . . . . . . . . . . . . . . . . . . . . . . . . . . . . . . . . . . . . (252.8) (272.0) (140.9)
Financing ActivitiesIncrease (decrease) in short-term debt, net . . . . . . . . . . . . . . . . . . . . . . . . . . . . . . . . . . . . . . . . . . . . (11.6) 21.3 (2.8)Loss on exchange or extinguishment of debt . . . . . . . . . . . . . . . . . . . . . . . . . . . . . . . . . . . . . . . . . . (4.5) (10.9) (13.1)Proceeds from issuance of long-term debt, net of premiums paid of $20.6 in 2006 . . . . . . . . . . . . . . . . . . 512.7 34.9 —Repayment of long-term debt and capital lease obligations . . . . . . . . . . . . . . . . . . . . . . . . . . . . . . . . . (534.5) (181.6) (274.8)Proceeds from issuance of common stock . . . . . . . . . . . . . . . . . . . . . . . . . . . . . . . . . . . . . . . . . . . . . 66.1 107.7 27.5Purchases of treasury stock . . . . . . . . . . . . . . . . . . . . . . . . . . . . . . . . . . . . . . . . . . . . . . . . . . . . . . (20.2) (1.2) (0.2)Dividends . . . . . . . . . . . . . . . . . . . . . . . . . . . . . . . . . . . . . . . . . . . . . . . . . . . . . . . . . . . . . . . . . (100.5) (97.3) (94.7)Excess tax benefits related to share-based payment arrangements . . . . . . . . . . . . . . . . . . . . . . . . . . . . . 5.0 — —Distributions to minority interest holders . . . . . . . . . . . . . . . . . . . . . . . . . . . . . . . . . . . . . . . . . . . . . (2.9) (12.0) —
Net Cash Used In Financing Activities . . . . . . . . . . . . . . . . . . . . . . . . . . . . . . . . . . . . . . . . . . . . . . . (90.4) (139.1) (358.1)
Discontinued OperationsNet cash provided by (used in) operating activities . . . . . . . . . . . . . . . . . . . . . . . . . . . . . . . . . . . . . . . 10.9 (1.2) 5.3Net cash provided by (used in) investing activities . . . . . . . . . . . . . . . . . . . . . . . . . . . . . . . . . . . . . . . — 25.8 (0.2)Net cash provided by (used in) financing activities . . . . . . . . . . . . . . . . . . . . . . . . . . . . . . . . . . . . . . . — — —
Net cash provided by discontinued operations . . . . . . . . . . . . . . . . . . . . . . . . . . . . . . . . . . . . . . . . . 10.9 24.6 5.1Effect of exchange rate changes on cash and cash equivalents . . . . . . . . . . . . . . . . . . . . . . . . . . . . . . . 6.0 (5.0) 3.1
Net decrease in cash and cash equivalents . . . . . . . . . . . . . . . . . . . . . . . . . . . . . . . . . . . . . . . . . . . . (50.0) (46.6) (80.5)Cash and cash equivalents at beginning of year . . . . . . . . . . . . . . . . . . . . . . . . . . . . . . . . . . . . . . . . . 251.3 297.9 378.4
Cash and cash equivalents at end of year . . . . . . . . . . . . . . . . . . . . . . . . . . . . . . . . . . . . . . . . . . . . . $ 201.3 $ 251.3 $ 297.9
See Notes to Consolidated Financial Statements.
69
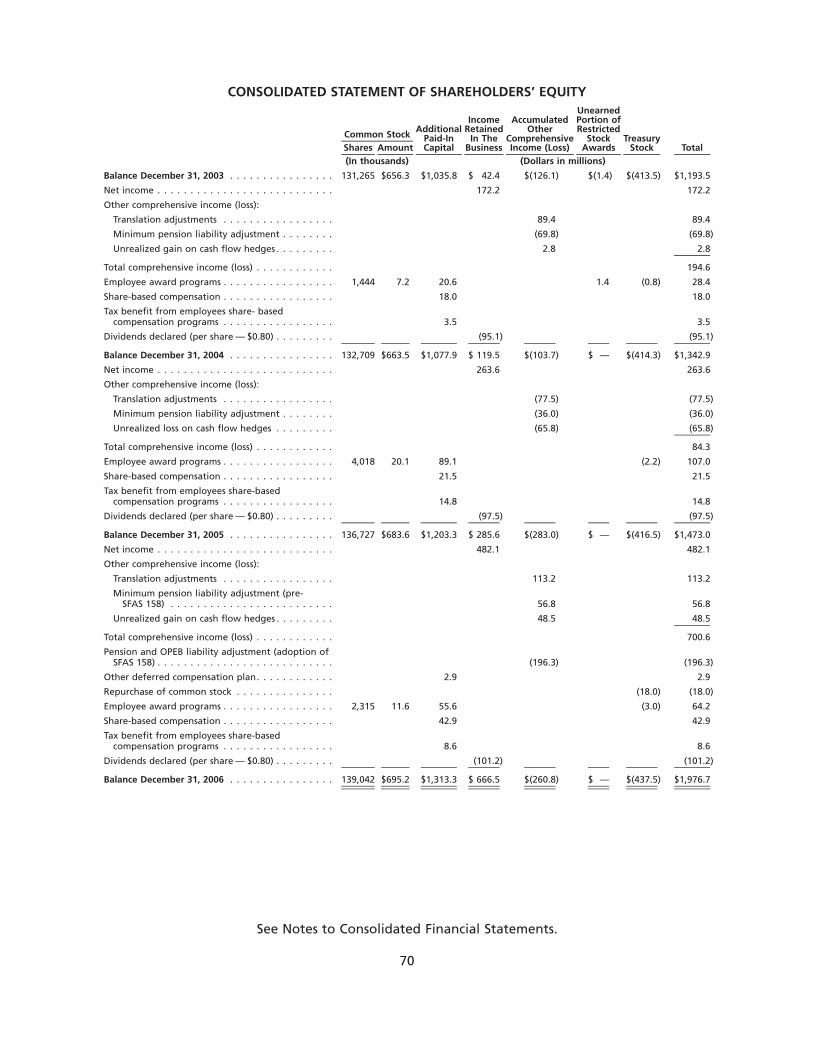
CONSOLIDATED STATEMENT OF SHAREHOLDERS’ EQUITY
Shares Amount
AdditionalPaid-InCapital
IncomeRetained
In TheBusiness
AccumulatedOther
ComprehensiveIncome (Loss)
UnearnedPortion ofRestricted
StockAwards
TreasuryStock Total
Common Stock
(In thousands) (Dollars in millions)
Balance December 31, 2003 . . . . . . . . . . . . . . . . 131,265 $656.3 $1,035.8 $ 42.4 $(126.1) $(1.4) $(413.5) $1,193.5
Net income . . . . . . . . . . . . . . . . . . . . . . . . . . . 172.2 172.2
Other comprehensive income (loss):
Translation adjustments . . . . . . . . . . . . . . . . . 89.4 89.4
Minimum pension liability adjustment . . . . . . . . (69.8) (69.8)
Unrealized gain on cash flow hedges . . . . . . . . . 2.8 2.8
Total comprehensive income (loss) . . . . . . . . . . . . 194.6
Employee award programs . . . . . . . . . . . . . . . . . 1,444 7.2 20.6 1.4 (0.8) 28.4
Share-based compensation . . . . . . . . . . . . . . . . . 18.0 18.0
Tax benefit from employees share- basedcompensation programs . . . . . . . . . . . . . . . . . 3.5 3.5
Dividends declared (per share — $0.80) . . . . . . . . . (95.1) (95.1)
Balance December 31, 2004 . . . . . . . . . . . . . . . . 132,709 $663.5 $1,077.9 $ 119.5 $(103.7) $ — $(414.3) $1,342.9
Net income . . . . . . . . . . . . . . . . . . . . . . . . . . . 263.6 263.6
Other comprehensive income (loss):
Translation adjustments . . . . . . . . . . . . . . . . . (77.5) (77.5)
Minimum pension liability adjustment . . . . . . . . (36.0) (36.0)
Unrealized loss on cash flow hedges . . . . . . . . . (65.8) (65.8)
Total comprehensive income (loss) . . . . . . . . . . . . 84.3
Employee award programs . . . . . . . . . . . . . . . . . 4,018 20.1 89.1 (2.2) 107.0
Share-based compensation . . . . . . . . . . . . . . . . . 21.5 21.5
Tax benefit from employees share-basedcompensation programs . . . . . . . . . . . . . . . . . 14.8 14.8
Dividends declared (per share — $0.80) . . . . . . . . . (97.5) (97.5)
Balance December 31, 2005 . . . . . . . . . . . . . . . . 136,727 $683.6 $1,203.3 $ 285.6 $(283.0) $ — $(416.5) $1,473.0
Net income . . . . . . . . . . . . . . . . . . . . . . . . . . . 482.1 482.1
Other comprehensive income (loss):
Translation adjustments . . . . . . . . . . . . . . . . . 113.2 113.2
Minimum pension liability adjustment (pre-SFAS 158) . . . . . . . . . . . . . . . . . . . . . . . . . 56.8 56.8
Unrealized gain on cash flow hedges . . . . . . . . . 48.5 48.5
Total comprehensive income (loss) . . . . . . . . . . . . 700.6
Pension and OPEB liability adjustment (adoption ofSFAS 158) . . . . . . . . . . . . . . . . . . . . . . . . . . . (196.3) (196.3)
Other deferred compensation plan. . . . . . . . . . . . 2.9 2.9
Repurchase of common stock . . . . . . . . . . . . . . . (18.0) (18.0)
Employee award programs . . . . . . . . . . . . . . . . . 2,315 11.6 55.6 (3.0) 64.2
Share-based compensation . . . . . . . . . . . . . . . . . 42.9 42.9
Tax benefit from employees share-basedcompensation programs . . . . . . . . . . . . . . . . . 8.6 8.6
Dividends declared (per share — $0.80) . . . . . . . . . (101.2) (101.2)
Balance December 31, 2006 . . . . . . . . . . . . . . . . 139,042 $695.2 $1,313.3 $ 666.5 $(260.8) $ — $(437.5) $1,976.7
See Notes to Consolidated Financial Statements.
70
NOTES TO CONSOLIDATED FINANCIAL STATEMENTS
Note 1. Significant Accounting Policies
Basis of Presentation. The Consolidated Financial Statements reflect the accounts of GoodrichCorporation and its majority-owned subsidiaries (“the Company” or “Goodrich”). Investments in20 to 50 percent-owned affiliates are accounted for using the equity method. Equity in earnings(losses) from these businesses is included in other income (expense) — net. Intercompanyaccounts and transactions are eliminated.
As discussed in Note 6, “Discontinued Operations”, the Company’s Test Systems business hasbeen accounted for as a discontinued operation. Unless otherwise noted, disclosures hereinpertain to the Company’s continuing operations.
Cash Equivalents. Cash equivalents consist of highly liquid investments with a maturity ofthree months or less at the time of purchase.
Allowance for Doubtful Accounts. The Company evaluates the collectibility of trade receivablesbased on a combination of factors. The Company regularly analyzes significant customeraccounts and, when the Company becomes aware of a specific customer’s inability to meet itsfinancial obligations to the Company, which may occur in the case of bankruptcy filings ordeterioration in the customer’s operating results or financial position, the Company records aspecific reserve for bad debt to reduce the related receivable to the amount the Companyreasonably believes is collectible. The Company also records reserves for bad debts for all othercustomers based on a variety of factors including the length of time the receivables are pastdue, the financial health of the customer, macroeconomic considerations and historical experi-ence. If circumstances related to specific customers change, the Company’s estimates of therecoverability of receivables could be further adjusted.
Inventories. Inventories, other than inventoried costs relating to long-term contracts, arestated at the lower of cost or market. Certain domestic inventories are valued by the last-in,first-out (LIFO) cost method. Inventories not valued by the LIFO method are valued principallyby the average cost method.
Inventoried costs on long-term contracts include certain pre-production costs, consisting prima-rily of tooling and engineering design costs and production costs, including applicable over-head. The costs attributed to units delivered under long-term commercial contracts are based onthe estimated average cost of all units expected to be produced and are determined under thelearning curve concept, which anticipates a predictable decrease in unit costs as tasks andproduction techniques become more efficient through repetition. This usually results in anincrease in inventory (referred to as “excess-over average”) during the early years of a contract.If in-process inventory plus estimated costs to complete a specific contract exceed the antic-ipated remaining sales value of such contract, the excess is charged to cost of sales in the periodidentified.
In accordance with industry practice, costs in inventory include amounts relating to contractswith long production cycles, some of which are not expected to be realized within one year.
Long-Lived Assets. Property, plant and equipment, including amounts recorded under capitalleases, are recorded at cost. Depreciation and amortization is computed principally using thestraight-line method over the following estimated useful lives: buildings and improvements, 15to 40 years; machinery and equipment, 5 to 15 years; and internal use software, 2 to 10 years. Inthe case of capitalized lease assets, amortization is recognized over the lease term if shorter.Repairs and maintenance costs are expensed as incurred.
Goodwill. Goodwill represents the excess of the purchase price over the fair value of the netassets of acquired businesses. Under the provisions of Statement of Financial Accounting
71
Standards No. 142 (SFAS 142), “Goodwill and Intangible Assets”, intangible assets deemed tohave indefinite lives and goodwill are not subject to amortization, but are reviewed forimpairment annually, or more frequently, if indicators of potential impairment exist.
Identifiable Intangible Assets. Identifiable intangible assets are recorded at cost or, whenacquired as part of a business combination, at estimated fair value. These assets include patentsand other technology agreements, sourcing contracts, trademarks, licenses, customer relation-ships and non-compete agreements. For acquisitions completed subsequent to June 30, 2001,identifiable intangible assets are amortized over their useful life using undiscounted cash flows,a method that reflects the pattern in which the economic benefits of the intangible assets areconsumed.
Impairments of identifiable intangible assets are recognized when events or changes in circum-stances indicate that the carrying amount of the asset, or related groups of assets, may not berecoverable and the Company’s estimate of undiscounted cash flows over the assets’ remaininguseful lives is less than the carrying value of the assets. Measurement of the amount ofimpairment may be based upon an appraisal, market values of similar assets or estimateddiscounted future cash flows resulting from the use and ultimate disposition of the asset.
Revenue and Income Recognition. For revenues not recognized under the contract method ofaccounting, the Company recognizes revenues from the sale of products at the point of passageof title, which is generally at the time of shipment. Revenues earned from providing mainte-nance service are recognized when the service is complete. In multiple deliverable arrangements,the revenues for products and services are allocated based upon their relative fair value.
For revenues recognized under the contract method of accounting, the Company recognizessales and profits on each contract in accordance with the percentage-of-completion method ofaccounting, generally using the units-of-delivery method. The Company follows the require-ments of American Institute of Certified Public Accounting Statement of Position 81-1 (SOP 81-1),“Accounting for Performance of Construction-Type and Certain Production-Type Contracts” (thecontract method of accounting). The contract method of accounting involves the use of variousestimating techniques to project costs at completion and includes estimates of recoveriesasserted against the customer for changes in specifications. These estimates involve variousassumptions and projections relative to the outcome of future events, including the quantityand timing of product deliveries. Also included are assumptions relative to future labor perfor-mance and rates, and projections relative to material and overhead costs. These assumptionsinvolve various levels of expected performance improvements.
The Company re-evaluates its contract estimates periodically and reflects changes in estimates inthe current period. Effective January 1, 2004, the Company changed its method of accountingfor revisions in estimates of total revenue, total costs or extent of progress on a contract fromthe reallocation method to the cumulative catch-up method. A significant portion of theCompany’s sales in the aerostructures business in the Engines Systems segment are under long-term, fixed-priced contracts, many of which contain escalation clauses, requiring delivery ofproducts over several years and frequently providing the buyer with option pricing on follow-onorders.
Included in Accounts Receivable at December 31, 2006 and 2005, were receivable amounts undercontracts in progress of $90.6 million and $70.4 million, respectively, that represent amountsearned but not billable at the respective Balance Sheet dates. These amounts become billableaccording to their contract terms, which usually consider the passage of time, achievement ofmilestones or completion of the project. Of the $90.6 million at December 31, 2006, approxi-mately $20.8 million is expected to be collected after 2007.
72
NOTES TO CONSOLIDATED FINANCIAL STATEMENTS — (Continued)
Income Taxes. Income taxes are accounted for in accordance with Statement of FinancialAccounting Standards No. 109 (SFAS 109), “Accounting for Income Taxes”, which requires thatdeferred taxes and liabilities are based on differences between financial reporting and tax basesof assets and liabilities and are measured using enacted tax laws and rates. A valuationallowance is provided on deferred tax assets if it is determined that it is more likely than notthat the asset will not be realized. The Company records interest on potential tax contingenciesas a component of its tax expense and records the interest net of any applicable related taxbenefit. See Note 16, “Income Taxes”.
Participation Payments. Certain businesses in the Company make cash payments under long-term contractual arrangements to original equipment manufacturers (OEM) or system contrac-tors in return for a secured position on an aircraft program. Participation payments arecapitalized as other assets when a contractual liability has been incurred, and are amortized tosales or cost of sales, as appropriate. Participation payments are amortized over the estimatednumber of production units to be shipped over the program’s production life which reflects thepattern in which the economic benefits of the participation payments are consumed. Thecarrying amount of participation payments is evaluated for recovery at least annually or whenother indicators of impairment occur such as a change in the estimated number of units or theeconomics of the program. If such estimates change, amortization expense is adjusted and/or animpairment charge is recorded, as appropriate, for the effect of the revised estimates. No suchimpairment charges were recorded in 2006, 2005 or 2004. See Note 12, “Other Assets”.
Entry Fees. Certain businesses in the Company’s Engine Systems segment make cash paymentsto an OEM under long-term contractual arrangements related to new engine programs. Thepayments are referred to as entry fees and entitle the Company to a controlled access supplycontract and a percentage of total program revenue generated by the OEM. Entry fees arecapitalized in other assets and are amortized on a straight-line or the cash flow basis, whichevermore appropriately reflects the cash flow stream, to cost of sales, or as a reduction to sales, asappropriate, over the program’s estimated useful life following aircraft certification, whichtypically approximates 20 years. The carrying amount of entry fees is evaluated for recovery atleast annually or when other significant assumptions or economic conditions change. Recoveryof entry fees is assessed based on the expected cash flow from the program over the remainingprogram life as compared to the recorded amount of entry fees. If the carrying value of theentry fees exceeds the cash flow to be generated from the program, a charge would berecorded for the amount by which the carrying amount of the entry fee exceeds its fair value.No such impairment charges were recorded in 2006, 2005 or 2004. See Note 12, “Other Assets”.
Sales Incentives. The Company offers sales incentives to certain airline customers in connectionwith sales contracts. These incentives may consist of up-front cash payments, merchandise creditsand/or free products. The cost of these incentives is recognized as an expense in the periodincurred unless recovery of these costs is specifically guaranteed by the customer in the contract.If the contract contains such a guarantee, then the cost of the sales incentive is capitalized asother assets and amortized to cost of sales using the straight-line method over the remainingcontract term. The carrying amount of sales incentives is evaluated for recovery when indicatorsof potential impairment exist. The carrying value of the sales incentives is also comparedannually to the amount recoverable under the terms of the guarantee in the customer contract.If the amount of the carrying value of the sales incentives exceeds the amount recoverable inthe contract, the carrying value is reduced. No such charges were recorded in 2006, 2005 or2004. See Note 12, “Other Assets”.
Flight Certification Costs. When a supply arrangement is secured, certain businesses in theCompany may agree to supply hardware to an OEM to be used in flight certification testingand/or make cash payments to reimburse an OEM for costs incurred in testing the hardware.
73
NOTES TO CONSOLIDATED FINANCIAL STATEMENTS — (Continued)
The flight certification testing is necessary to certify aircraft systems/components for theaircraft’s airworthiness and allows the aircraft to be flown and thus sold in the countrycertifying the aircraft. Flight certification costs are capitalized in other assets and are amortizedto cost of sales over the projected number of aircraft to be manufactured. The carrying amountof flight certification costs is evaluated for recovery when indicators of impairment exist. Thecarrying value of the asset and amortization expense is adjusted when the estimated number ofunits to be manufactured changes. No such charges were recorded in 2006, 2005 or 2004. SeeNote 12, “Other Assets”.
Shipping and Handling. Shipping and handling costs are recorded in cost of sales.
Financial Instruments. The Company’s financial instruments include cash and cash equivalents,accounts and notes receivable, foreign currency forward contracts, accounts payable and debt.Because of their short maturity, the carrying amount of cash and cash equivalents, accounts andnotes receivable, accounts payable and short-term bank debt approximates fair value. Fair valueof long-term debt is based on quoted market prices or on rates available to the Company fordebt with similar terms and maturities.
The Company accounts for derivative financial instruments in accordance with Statement ofFinancial Accounting Standards No. 133, “Accounting for Derivative Instruments and HedgingActivities” (SFAS 133). Under SFAS 133, derivatives are carried on the Balance Sheet at fair value.The fair value of derivatives is based on quoted market prices.
Share-Based Compensation. Effective January 1, 2006, the Company adopted the provisions ofStatement of Financial Accounting Standards No. 123(R), “Accounting for Share-Based Compen-sation” (SFAS 123(R)). See Note 23, “Share-Based Compensation”.
Earnings Per Share. Earnings per share is computed in accordance with Statement of FinancialAccounting Standards No. 128, “Earnings per Share.”
Research and Development Expense. The Company performs research and development undercompany-funded programs for commercial products, and under contracts with others. Researchand development under contracts with others is performed on both military and commercialproducts. Total research and development expenditures from continuing operations in 2006,2005 and 2004 were approximately $360 million, $379 million and $346 million, respectively.These amounts are net of approximately $113 million, $112 million and $100 million, respec-tively, which were funded by customers.
Reclassifications. Certain amounts in prior year financial statements have been reclassified toconform to the current year presentation.
Use of Estimates. The preparation of financial statements in conformity with generallyaccepted accounting principles requires management to make estimates and assumptions thataffect the amounts reported in the financial statements and accompanying notes. Actual resultscould differ from those estimates.
Environmental Liabilities. The Company establishes a liability for environmental liabilities whenit is probable that a liability has been incurred and the Company has the ability to reasonablyestimate the liability. The Company capitalizes environmental costs only if the costs are recover-able and (1) the costs extend the life, increase the capacity, or improve the safety or efficiencyof property owned by the Company as compared with the condition of that property whenoriginally constructed or acquired; (2) the costs mitigate or prevent environmental contamina-tion that has yet to occur and that otherwise may result from future operations or activities andthe costs improve the property compared with its condition when constructed or acquired; or
74
NOTES TO CONSOLIDATED FINANCIAL STATEMENTS — (Continued)
(3) the costs are incurred in preparing the property for sale. All other environmental costs areexpensed.
Toxic Tort. The Company establishes a liability for toxic tort liabilities, including asbestos, whenit is probable that a liability has been incurred and the Company has the ability to reasonablyestimate the liability. The Company typically records a liability for toxic tort when legal actionsare in advanced stages (proximity to trial or settlement). It is the Company’s policy to expenselegal costs for toxic tort issues when they are incurred. When a liability is recorded, a claim forrecovery by insurance is evaluated and a receivable is recorded to the extent recovery isprobable.
Service and Product Warranties. The Company provides service and warranty policies oncertain of its products. The Company accrues liabilities under service and warranty policies basedupon specific claims and a review of historical warranty and service claim experience inaccordance with Statement of Financial Accounting Standards No. 5 “Accounting for Contingen-cies” (SFAS 5). Adjustments are made to accruals as claim data and historical experience change.In addition, the Company incurs discretionary costs to service its products in connection withproduct performance issues.
Deferred Settlement Credits. The Company has reached agreements with several of its insur-ance carriers that are either insolvent or are undergoing solvent schemes of arrangements toreceive negotiated payments in exchange for loss of insurance coverage for third party claimsagainst the Company. The portion of these negotiated payments related to past costs isrecognized in income immediately. The portion related to future claims is treated as a deferredsettlement credit and reported within accrued expenses and other non-current liabilities. Thedeferred settlement credits will be recognized in income in the period the applicable insurancewould have been realized. See Note 18, “Contingencies”.
Note 2. New Accounting Standards Not Adopted
Accounting for Uncertainty in Income Taxes
In July 2006, the Financial Accounting Standards Board (FASB) issued FASB Interpretation No. 48,“Accounting for Uncertainty in Income Taxes, an Interpretation of FASB Statement No. 109”(FIN 48). FIN 48 creates a single model for accounting and disclosure of uncertain tax positions.This interpretation prescribes the minimum recognition threshold a tax position is required tomeet before being recognized in the financial statements. Additionally, FIN 48 provides guid-ance on derecognition, measurement, classification, interest and penalties, and transition ofuncertain tax positions. FIN 48 is effective for fiscal years beginning after December 15, 2006.The Company will adopt FIN 48 as of January 1, 2007, with any cumulative effect of theadoption recorded as an adjustment to beginning retained earnings. The Company is currentlyfinalizing its evaluation of the impact of the adoption and has not yet determined the effect onits earnings or financial position.
Fair Value Measurement
In September 2006, the FASB issued Statement of Financial Accounting Standards No. 157, “FairValue Measurements” (SFAS 157). SFAS 157 defines fair value, establishes a framework formeasuring fair value in accordance with generally accepted accounting principles and expandsdisclosures about fair value measurements. SFAS 157 is effective for the fiscal years beginningafter November 15, 2007. The Company is currently evaluating the impact of the adoption ofSFAS 157 on the Company’s financial condition, results of operations and cash flows.
75
NOTES TO CONSOLIDATED FINANCIAL STATEMENTS — (Continued)
Accounting for Postretirement Benefits Associated with Split-Dollar Life Insurance
In September 2006, the FASB ratified Emerging Issues Task Force No. 06-4, “PostretirementBenefits Associated with Split-Dollar Life Insurance” (EITF 06-4). EITF 06-4 requires deferred-compensation or postretirement benefit aspects of an endorsement-type split-dollar life insur-ance arrangement to be recognized as a liability by the employer and the obligation is noteffectively settled by the purchase of a life insurance policy. The liability for future benefitsshould be recognized based on the substantive agreement with the employee, which may beeither to provide a future death benefit or to pay for the future cost of the life insurance. EITF06-4 is effective for fiscal years beginning after December 15, 2007. The Company is currentlyevaluating the impact of the adoption of EITF 06-4 on the Company’s financial condition, resultsof operations and cash flows.
Note 3. Business Segment Information
The Company has three business segments: Engine Systems, Airframe Systems and ElectronicSystems.
Engine Systems
The Engine Systems segment produces products associated with aircraft engines, includingcowlings and their components, fuel delivery systems, and structural and rotating components.The segment includes the following business units:
• Aerostructures, which:
– Produces nacelle systems, including thrust reversers and related engine housing compo-nents, and pylons;
– Performs maintenance, repair and overhaul services; and
– Provides complete cargo handling systems including conveyor rollers and tracks, side railguides, side and end latches and power drive control units.
• Engine control systems, which provides:
– Fuel metering controls, fuel pumping systems and afterburner fuel pump and meteringunit nozzles; and
– Electronic control software and hardware, variable geometry actuation controls andengine health monitoring systems.
• Turbomachinery products, which produces complete rotating assemblies including qualitymetallic and thermal barrier coatings for the aircraft and industrial gas turbine engineindustries.
• Turbine fuel technologies, which provides:
– Fuel nozzles, injectors, valves and manifolds for aerospace and industrial gas turbineengines; and
– Non-aerospace applications that require liquid atomization.
76
NOTES TO CONSOLIDATED FINANCIAL STATEMENTS — (Continued)
Airframe Systems
The Airframe Systems segment provides systems and components pertaining to aircraft taxi,take-off, flight control, landing and stopping, and airframe maintenance. The segment includesthe following business units:
• Actuation systems, which provides:
– Actuators for primary flight control systems that operate elevators, ailerons andrudders, and secondary flight controls systems such as flaps and slats; and
– Systems that control the movement of steering systems for missiles and electromechan-ical systems that are characterized by high power, low weight, low maintenance,resistance to extreme temperatures and vibrations and reliability.
• Landing gear, which designs, manufactures and services complete landing gear systems onboth commercial and military aircraft.
• Aircraft wheels and brakes, which provides:
– Wheel and brake systems containing durable wheels, long-lasting steel brake designs,light weight and low cost carbon brakes, one source brake control systems, andstate-of-the-art electric brake development; and
– OEM and overhauls and repairs as well as full technical and aircraft on ground supportthrough a worldwide network of wheel and brake service centers.
• Aviation technical services, which provides:
– Comprehensive heavy airframe maintenance, component repair and overhaul, aircraftpainting, engineering and certification services; and
– Aircraft modification services that include VIP interior completion and passenger tofreight conversions.
• Engineered polymer products, which provides:
– Large-scale marine composite structures and acoustic materials;
– Acoustic absorbing and reflecting materials along with vibration dampeningmaterial; and
– Fireproof composites.
Electronic Systems
The Electronic Systems segment produces a wide array of systems and components that provideflight performance measurements, flight management and control and safety data. The segmentincludes the following business units:
• Optical and space systems, which:
– Provides intelligence, surveillance and reconnaissance systems and electro-opticaldefense, scientific and commercial applications; and
– Designs and builds custom engineered electronics, optics, shortwave infrared camerasand arrays.
77
NOTES TO CONSOLIDATED FINANCIAL STATEMENTS — (Continued)
• Sensor systems, which provides:
– Numerous sensors for a wide variety of commercial and military aircraft that measuremass flow, inertia and altitude, liquid level, position, speed, and temperature; and
– Air data heading reference systems, angle of attack and stall protection systems,windshield heater controllers, ice detection systems, micro electromechanical systems,and windshield wiper and washer systems.
• Power systems, which provides:
– Constant frequency and variable frequency AC and DC electrical generating systems; and
– Rescue hoist and cargo winches.
• Aircraft interior products, which provides:
– Evacuations slides and life rafts for several types of aircraft;
– Complete aircrew escape systems primarily for military aircraft including canopyremoval, sequencing systems and ejection seats;
– Component products such as gas generators, rocket motors, linear explosives, catapultsand numerous cartridge actuated or propellant actuated devices for a wide variety ofapplications; and
– Seating systems that include cockpit crew and cabin attendant seats.
• Fuel and utility systems, which provides:
– Fuel measurement and management systems, fuel system safety devices, and fireprotection systems; and
– Health and usage management systems, motion controls and actuators, proximitysensing systems, braking and steering systems and computer interfaces.
• De-Icing and specialty systems, which provides:
– Pneumatic and electrothermal ice protection application;
– Heated aircraft components, including heated drain masts, lavatory and galley waterheaters and specialty air heaters; and
– Potable water systems and components, aerospace composites and molding resin.
• Lighting systems, which provides:
– Interior lighting systems that include cabin and compartment lights, cockpit lights andcontrollers along with information signs;
– External lighting systems that include anti-collision lights and power supplies, wing andtail strobe lights, navigation and flood lights, and external emergency lights; and
– Night vision imaging systems, covert lighting, main landing gear cables and nose gearsteering cables.
Segment operating income is total segment revenue reduced by operating expenses identifiablewith that business segment. The accounting policies of the reportable segments are the same asthose for Goodrich consolidated. The pension curtailment charge as discussed in Note 15,“Pension and Postretirement Benefits” was not allocated to the segments.
78
NOTES TO CONSOLIDATED FINANCIAL STATEMENTS — (Continued)
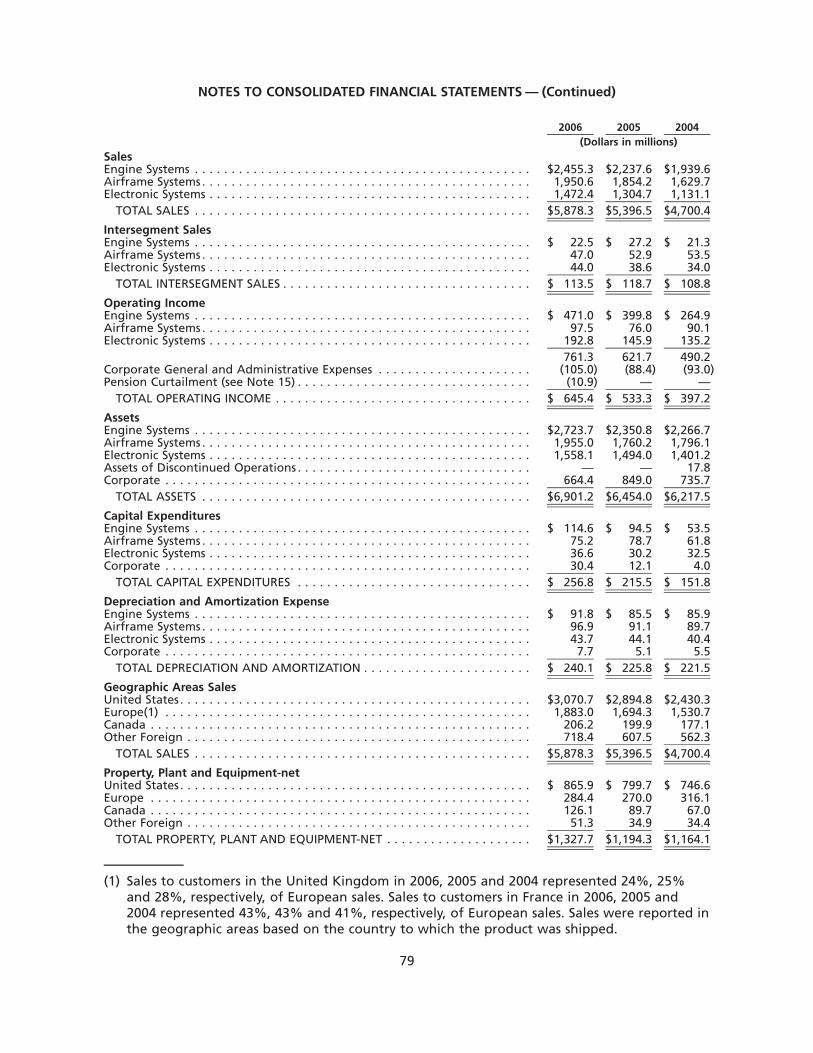
2006 2005 2004(Dollars in millions)
SalesEngine Systems . . . . . . . . . . . . . . . . . . . . . . . . . . . . . . . . . . . . . . . . . . . . . . $2,455.3 $2,237.6 $1,939.6Airframe Systems . . . . . . . . . . . . . . . . . . . . . . . . . . . . . . . . . . . . . . . . . . . . . 1,950.6 1,854.2 1,629.7Electronic Systems . . . . . . . . . . . . . . . . . . . . . . . . . . . . . . . . . . . . . . . . . . . . 1,472.4 1,304.7 1,131.1
TOTAL SALES . . . . . . . . . . . . . . . . . . . . . . . . . . . . . . . . . . . . . . . . . . . . . . $5,878.3 $5,396.5 $4,700.4
Intersegment SalesEngine Systems . . . . . . . . . . . . . . . . . . . . . . . . . . . . . . . . . . . . . . . . . . . . . . $ 22.5 $ 27.2 $ 21.3Airframe Systems . . . . . . . . . . . . . . . . . . . . . . . . . . . . . . . . . . . . . . . . . . . . . 47.0 52.9 53.5Electronic Systems . . . . . . . . . . . . . . . . . . . . . . . . . . . . . . . . . . . . . . . . . . . . 44.0 38.6 34.0
TOTAL INTERSEGMENT SALES . . . . . . . . . . . . . . . . . . . . . . . . . . . . . . . . . . $ 113.5 $ 118.7 $ 108.8
Operating IncomeEngine Systems . . . . . . . . . . . . . . . . . . . . . . . . . . . . . . . . . . . . . . . . . . . . . . $ 471.0 $ 399.8 $ 264.9Airframe Systems . . . . . . . . . . . . . . . . . . . . . . . . . . . . . . . . . . . . . . . . . . . . . 97.5 76.0 90.1Electronic Systems . . . . . . . . . . . . . . . . . . . . . . . . . . . . . . . . . . . . . . . . . . . . 192.8 145.9 135.2
761.3 621.7 490.2Corporate General and Administrative Expenses . . . . . . . . . . . . . . . . . . . . . (105.0) (88.4) (93.0)Pension Curtailment (see Note 15) . . . . . . . . . . . . . . . . . . . . . . . . . . . . . . . . (10.9) — —
TOTAL OPERATING INCOME . . . . . . . . . . . . . . . . . . . . . . . . . . . . . . . . . . . $ 645.4 $ 533.3 $ 397.2
AssetsEngine Systems . . . . . . . . . . . . . . . . . . . . . . . . . . . . . . . . . . . . . . . . . . . . . . $2,723.7 $2,350.8 $2,266.7Airframe Systems . . . . . . . . . . . . . . . . . . . . . . . . . . . . . . . . . . . . . . . . . . . . . 1,955.0 1,760.2 1,796.1Electronic Systems . . . . . . . . . . . . . . . . . . . . . . . . . . . . . . . . . . . . . . . . . . . . 1,558.1 1,494.0 1,401.2Assets of Discontinued Operations . . . . . . . . . . . . . . . . . . . . . . . . . . . . . . . . — — 17.8Corporate . . . . . . . . . . . . . . . . . . . . . . . . . . . . . . . . . . . . . . . . . . . . . . . . . . 664.4 849.0 735.7
TOTAL ASSETS . . . . . . . . . . . . . . . . . . . . . . . . . . . . . . . . . . . . . . . . . . . . . $6,901.2 $6,454.0 $6,217.5
Capital ExpendituresEngine Systems . . . . . . . . . . . . . . . . . . . . . . . . . . . . . . . . . . . . . . . . . . . . . . $ 114.6 $ 94.5 $ 53.5Airframe Systems . . . . . . . . . . . . . . . . . . . . . . . . . . . . . . . . . . . . . . . . . . . . . 75.2 78.7 61.8Electronic Systems . . . . . . . . . . . . . . . . . . . . . . . . . . . . . . . . . . . . . . . . . . . . 36.6 30.2 32.5Corporate . . . . . . . . . . . . . . . . . . . . . . . . . . . . . . . . . . . . . . . . . . . . . . . . . . 30.4 12.1 4.0
TOTAL CAPITAL EXPENDITURES . . . . . . . . . . . . . . . . . . . . . . . . . . . . . . . . $ 256.8 $ 215.5 $ 151.8
Depreciation and Amortization ExpenseEngine Systems . . . . . . . . . . . . . . . . . . . . . . . . . . . . . . . . . . . . . . . . . . . . . . $ 91.8 $ 85.5 $ 85.9Airframe Systems . . . . . . . . . . . . . . . . . . . . . . . . . . . . . . . . . . . . . . . . . . . . . 96.9 91.1 89.7Electronic Systems . . . . . . . . . . . . . . . . . . . . . . . . . . . . . . . . . . . . . . . . . . . . 43.7 44.1 40.4Corporate . . . . . . . . . . . . . . . . . . . . . . . . . . . . . . . . . . . . . . . . . . . . . . . . . . 7.7 5.1 5.5
TOTAL DEPRECIATION AND AMORTIZATION . . . . . . . . . . . . . . . . . . . . . . . $ 240.1 $ 225.8 $ 221.5
Geographic Areas SalesUnited States. . . . . . . . . . . . . . . . . . . . . . . . . . . . . . . . . . . . . . . . . . . . . . . . $3,070.7 $2,894.8 $2,430.3Europe(1) . . . . . . . . . . . . . . . . . . . . . . . . . . . . . . . . . . . . . . . . . . . . . . . . . . 1,883.0 1,694.3 1,530.7Canada . . . . . . . . . . . . . . . . . . . . . . . . . . . . . . . . . . . . . . . . . . . . . . . . . . . . 206.2 199.9 177.1Other Foreign . . . . . . . . . . . . . . . . . . . . . . . . . . . . . . . . . . . . . . . . . . . . . . . 718.4 607.5 562.3
TOTAL SALES . . . . . . . . . . . . . . . . . . . . . . . . . . . . . . . . . . . . . . . . . . . . . . $5,878.3 $5,396.5 $4,700.4
Property, Plant and Equipment-netUnited States. . . . . . . . . . . . . . . . . . . . . . . . . . . . . . . . . . . . . . . . . . . . . . . . $ 865.9 $ 799.7 $ 746.6Europe . . . . . . . . . . . . . . . . . . . . . . . . . . . . . . . . . . . . . . . . . . . . . . . . . . . . 284.4 270.0 316.1Canada . . . . . . . . . . . . . . . . . . . . . . . . . . . . . . . . . . . . . . . . . . . . . . . . . . . . 126.1 89.7 67.0Other Foreign . . . . . . . . . . . . . . . . . . . . . . . . . . . . . . . . . . . . . . . . . . . . . . . 51.3 34.9 34.4
TOTAL PROPERTY, PLANT AND EQUIPMENT-NET . . . . . . . . . . . . . . . . . . . . $1,327.7 $1,194.3 $1,164.1
(1) Sales to customers in the United Kingdom in 2006, 2005 and 2004 represented 24%, 25%and 28%, respectively, of European sales. Sales to customers in France in 2006, 2005 and2004 represented 43%, 43% and 41%, respectively, of European sales. Sales were reported inthe geographic areas based on the country to which the product was shipped.
79
NOTES TO CONSOLIDATED FINANCIAL STATEMENTS — (Continued)
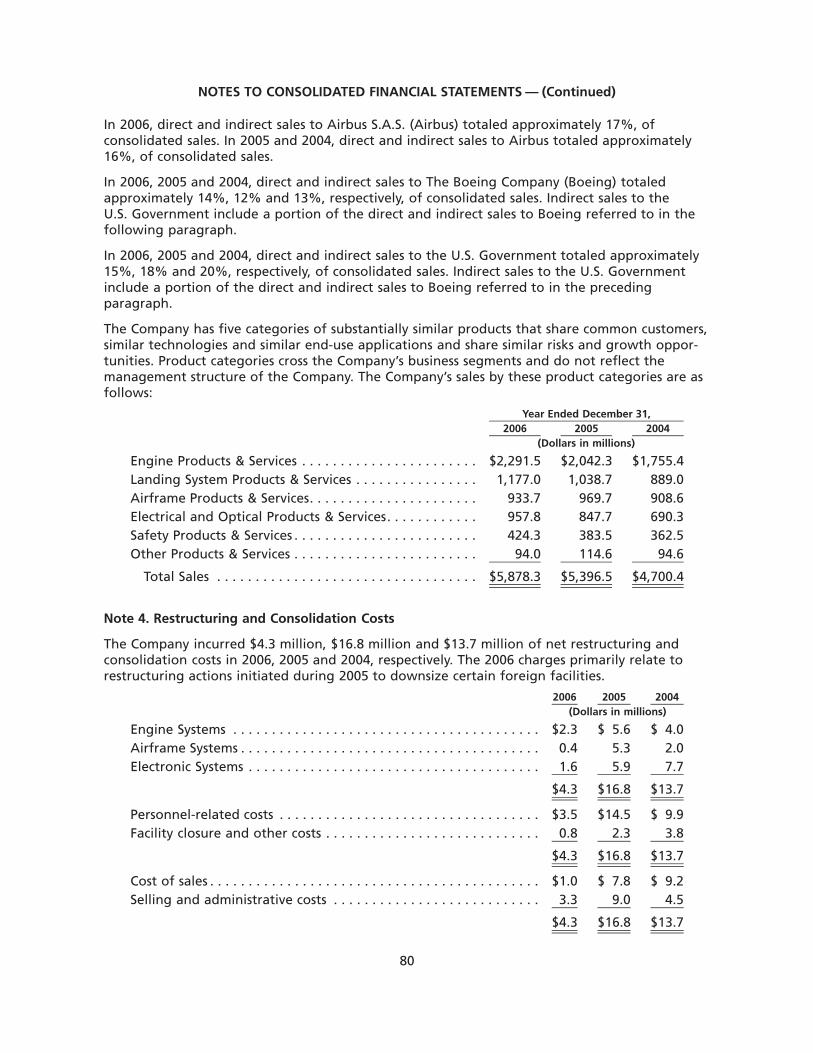
In 2006, direct and indirect sales to Airbus S.A.S. (Airbus) totaled approximately 17%, ofconsolidated sales. In 2005 and 2004, direct and indirect sales to Airbus totaled approximately16%, of consolidated sales.
In 2006, 2005 and 2004, direct and indirect sales to The Boeing Company (Boeing) totaledapproximately 14%, 12% and 13%, respectively, of consolidated sales. Indirect sales to theU.S. Government include a portion of the direct and indirect sales to Boeing referred to in thefollowing paragraph.
In 2006, 2005 and 2004, direct and indirect sales to the U.S. Government totaled approximately15%, 18% and 20%, respectively, of consolidated sales. Indirect sales to the U.S. Governmentinclude a portion of the direct and indirect sales to Boeing referred to in the precedingparagraph.
The Company has five categories of substantially similar products that share common customers,similar technologies and similar end-use applications and share similar risks and growth oppor-tunities. Product categories cross the Company’s business segments and do not reflect themanagement structure of the Company. The Company’s sales by these product categories are asfollows:
2006 2005 2004Year Ended December 31,
(Dollars in millions)
Engine Products & Services . . . . . . . . . . . . . . . . . . . . . . . $2,291.5 $2,042.3 $1,755.4Landing System Products & Services . . . . . . . . . . . . . . . . 1,177.0 1,038.7 889.0Airframe Products & Services. . . . . . . . . . . . . . . . . . . . . . 933.7 969.7 908.6Electrical and Optical Products & Services. . . . . . . . . . . . 957.8 847.7 690.3Safety Products & Services . . . . . . . . . . . . . . . . . . . . . . . . 424.3 383.5 362.5Other Products & Services . . . . . . . . . . . . . . . . . . . . . . . . 94.0 114.6 94.6
Total Sales . . . . . . . . . . . . . . . . . . . . . . . . . . . . . . . . . . $5,878.3 $5,396.5 $4,700.4
Note 4. Restructuring and Consolidation Costs
The Company incurred $4.3 million, $16.8 million and $13.7 million of net restructuring andconsolidation costs in 2006, 2005 and 2004, respectively. The 2006 charges primarily relate torestructuring actions initiated during 2005 to downsize certain foreign facilities.
2006 2005 2004(Dollars in millions)
Engine Systems . . . . . . . . . . . . . . . . . . . . . . . . . . . . . . . . . . . . . . . . $2.3 $ 5.6 $ 4.0Airframe Systems . . . . . . . . . . . . . . . . . . . . . . . . . . . . . . . . . . . . . . . 0.4 5.3 2.0Electronic Systems . . . . . . . . . . . . . . . . . . . . . . . . . . . . . . . . . . . . . . 1.6 5.9 7.7
$4.3 $16.8 $13.7
Personnel-related costs . . . . . . . . . . . . . . . . . . . . . . . . . . . . . . . . . . $3.5 $14.5 $ 9.9Facility closure and other costs . . . . . . . . . . . . . . . . . . . . . . . . . . . . 0.8 2.3 3.8
$4.3 $16.8 $13.7
Cost of sales . . . . . . . . . . . . . . . . . . . . . . . . . . . . . . . . . . . . . . . . . . . $1.0 $ 7.8 $ 9.2Selling and administrative costs . . . . . . . . . . . . . . . . . . . . . . . . . . . 3.3 9.0 4.5
$4.3 $16.8 $13.7
80
NOTES TO CONSOLIDATED FINANCIAL STATEMENTS — (Continued)
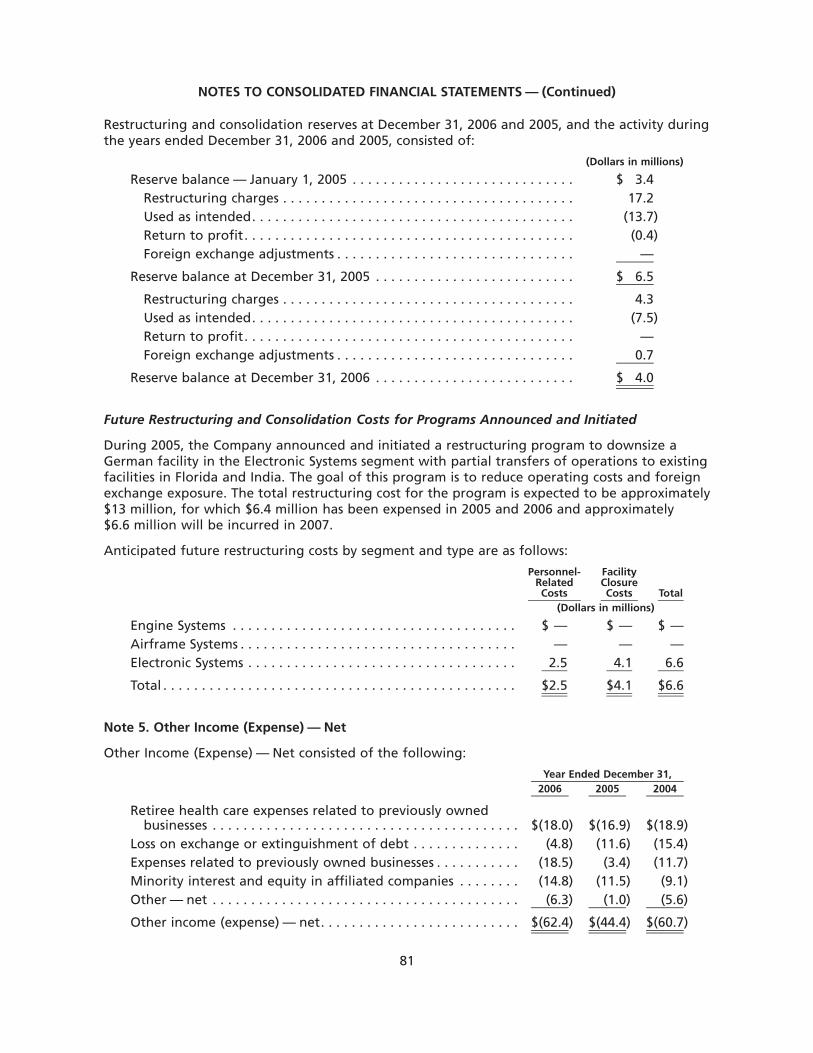
Restructuring and consolidation reserves at December 31, 2006 and 2005, and the activity duringthe years ended December 31, 2006 and 2005, consisted of:
(Dollars in millions)
Reserve balance — January 1, 2005 . . . . . . . . . . . . . . . . . . . . . . . . . . . . . $ 3.4Restructuring charges . . . . . . . . . . . . . . . . . . . . . . . . . . . . . . . . . . . . . . 17.2Used as intended. . . . . . . . . . . . . . . . . . . . . . . . . . . . . . . . . . . . . . . . . . (13.7)Return to profit. . . . . . . . . . . . . . . . . . . . . . . . . . . . . . . . . . . . . . . . . . . (0.4)Foreign exchange adjustments . . . . . . . . . . . . . . . . . . . . . . . . . . . . . . . —
Reserve balance at December 31, 2005 . . . . . . . . . . . . . . . . . . . . . . . . . . $ 6.5
Restructuring charges . . . . . . . . . . . . . . . . . . . . . . . . . . . . . . . . . . . . . . 4.3Used as intended. . . . . . . . . . . . . . . . . . . . . . . . . . . . . . . . . . . . . . . . . . (7.5)Return to profit. . . . . . . . . . . . . . . . . . . . . . . . . . . . . . . . . . . . . . . . . . . —Foreign exchange adjustments . . . . . . . . . . . . . . . . . . . . . . . . . . . . . . . 0.7
Reserve balance at December 31, 2006 . . . . . . . . . . . . . . . . . . . . . . . . . . $ 4.0
Future Restructuring and Consolidation Costs for Programs Announced and Initiated
During 2005, the Company announced and initiated a restructuring program to downsize aGerman facility in the Electronic Systems segment with partial transfers of operations to existingfacilities in Florida and India. The goal of this program is to reduce operating costs and foreignexchange exposure. The total restructuring cost for the program is expected to be approximately$13 million, for which $6.4 million has been expensed in 2005 and 2006 and approximately$6.6 million will be incurred in 2007.
Anticipated future restructuring costs by segment and type are as follows:
Personnel-RelatedCosts
FacilityClosureCosts Total
(Dollars in millions)
Engine Systems . . . . . . . . . . . . . . . . . . . . . . . . . . . . . . . . . . . . . $ — $ — $ —Airframe Systems . . . . . . . . . . . . . . . . . . . . . . . . . . . . . . . . . . . . — — —Electronic Systems . . . . . . . . . . . . . . . . . . . . . . . . . . . . . . . . . . . 2.5 4.1 6.6
Total . . . . . . . . . . . . . . . . . . . . . . . . . . . . . . . . . . . . . . . . . . . . . . $2.5 $4.1 $6.6
Note 5. Other Income (Expense) — Net
Other Income (Expense) — Net consisted of the following:
2006 2005 2004Year Ended December 31,
Retiree health care expenses related to previously ownedbusinesses . . . . . . . . . . . . . . . . . . . . . . . . . . . . . . . . . . . . . . . . $(18.0) $(16.9) $(18.9)
Loss on exchange or extinguishment of debt . . . . . . . . . . . . . . (4.8) (11.6) (15.4)Expenses related to previously owned businesses . . . . . . . . . . . (18.5) (3.4) (11.7)Minority interest and equity in affiliated companies . . . . . . . . (14.8) (11.5) (9.1)Other — net . . . . . . . . . . . . . . . . . . . . . . . . . . . . . . . . . . . . . . . . (6.3) (1.0) (5.6)
Other income (expense) — net. . . . . . . . . . . . . . . . . . . . . . . . . . $(62.4) $(44.4) $(60.7)
81
NOTES TO CONSOLIDATED FINANCIAL STATEMENTS — (Continued)
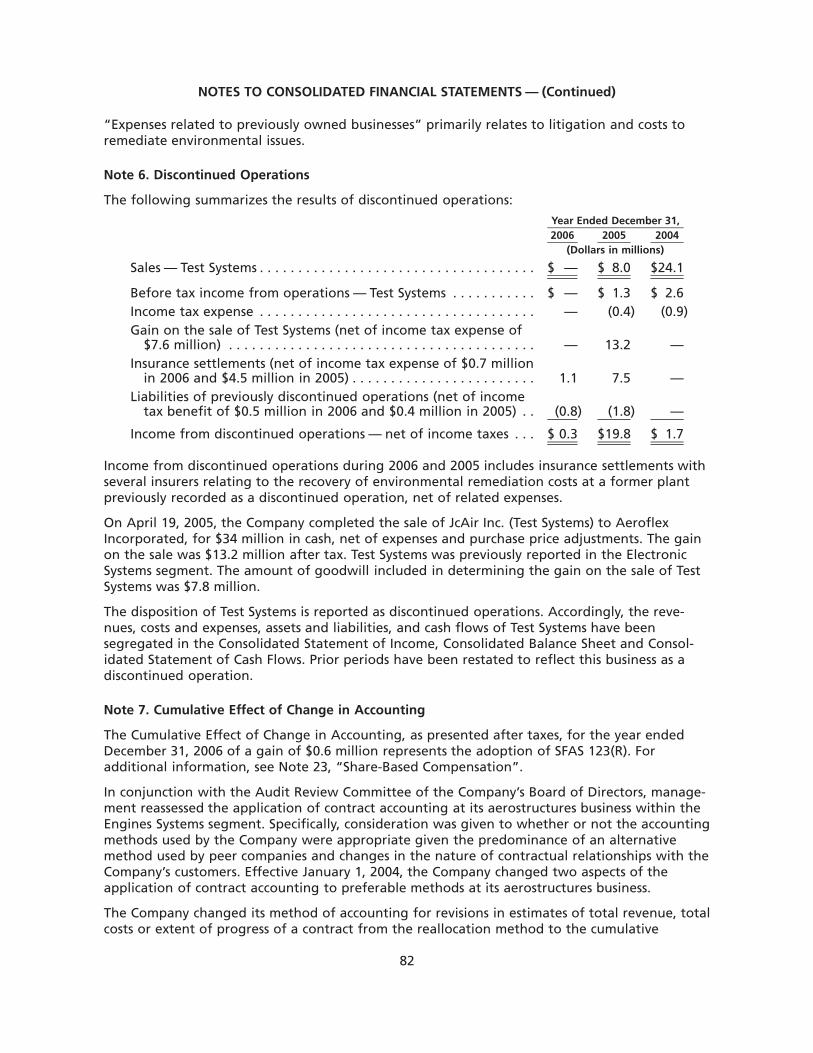
“Expenses related to previously owned businesses” primarily relates to litigation and costs toremediate environmental issues.
Note 6. Discontinued Operations
The following summarizes the results of discontinued operations:
2006 2005 2004Year Ended December 31,
(Dollars in millions)
Sales — Test Systems . . . . . . . . . . . . . . . . . . . . . . . . . . . . . . . . . . . . $ — $ 8.0 $24.1
Before tax income from operations — Test Systems . . . . . . . . . . . $ — $ 1.3 $ 2.6Income tax expense . . . . . . . . . . . . . . . . . . . . . . . . . . . . . . . . . . . . — (0.4) (0.9)Gain on the sale of Test Systems (net of income tax expense of
$7.6 million) . . . . . . . . . . . . . . . . . . . . . . . . . . . . . . . . . . . . . . . . — 13.2 —Insurance settlements (net of income tax expense of $0.7 million
in 2006 and $4.5 million in 2005) . . . . . . . . . . . . . . . . . . . . . . . . 1.1 7.5 —Liabilities of previously discontinued operations (net of income
tax benefit of $0.5 million in 2006 and $0.4 million in 2005) . . (0.8) (1.8) —
Income from discontinued operations — net of income taxes . . . $ 0.3 $19.8 $ 1.7
Income from discontinued operations during 2006 and 2005 includes insurance settlements withseveral insurers relating to the recovery of environmental remediation costs at a former plantpreviously recorded as a discontinued operation, net of related expenses.
On April 19, 2005, the Company completed the sale of JcAir Inc. (Test Systems) to AeroflexIncorporated, for $34 million in cash, net of expenses and purchase price adjustments. The gainon the sale was $13.2 million after tax. Test Systems was previously reported in the ElectronicSystems segment. The amount of goodwill included in determining the gain on the sale of TestSystems was $7.8 million.
The disposition of Test Systems is reported as discontinued operations. Accordingly, the reve-nues, costs and expenses, assets and liabilities, and cash flows of Test Systems have beensegregated in the Consolidated Statement of Income, Consolidated Balance Sheet and Consol-idated Statement of Cash Flows. Prior periods have been restated to reflect this business as adiscontinued operation.
Note 7. Cumulative Effect of Change in Accounting
The Cumulative Effect of Change in Accounting, as presented after taxes, for the year endedDecember 31, 2006 of a gain of $0.6 million represents the adoption of SFAS 123(R). Foradditional information, see Note 23, “Share-Based Compensation”.
In conjunction with the Audit Review Committee of the Company’s Board of Directors, manage-ment reassessed the application of contract accounting at its aerostructures business within theEngines Systems segment. Specifically, consideration was given to whether or not the accountingmethods used by the Company were appropriate given the predominance of an alternativemethod used by peer companies and changes in the nature of contractual relationships with theCompany’s customers. Effective January 1, 2004, the Company changed two aspects of theapplication of contract accounting to preferable methods at its aerostructures business.
The Company changed its method of accounting for revisions in estimates of total revenue, totalcosts or extent of progress of a contract from the reallocation method to the cumulative
82
NOTES TO CONSOLIDATED FINANCIAL STATEMENTS — (Continued)
catch-up method. Although both methods are used in practice to account for changes inestimates, SOP 81-1 indicates that the cumulative catch-up method is preferable. A contempora-neous review of accounting policy disclosures of peer companies in the same or similar industriesindicated that the cumulative catch-up method was the predominant method of accounting forchanges in estimates. The Company believes that consistency in financial reporting with peercompanies, as well as with less significant business units within the consolidated group whichalready use the cumulative catch-up method, will enhance the comparability of financial data.The change was effected by adjusting contract profit rates from the balance to complete grossprofit rate to the estimated gross profit rate at completion of the contract.
The Company also changed its accounting for pre-certification costs. Under the previous policy,pre-certification costs exceeding the level anticipated in the Company’s original investmentmodel used to negotiate contractual terms were expensed when determined regardless ofoverall contract profitability. This policy was appropriate in the past because aircraft and enginemanufacturers typically reimbursed component suppliers directly for pre-certification costs up toan agreed-upon level. Recently, however, aircraft and engine manufacturers have begun torequire component suppliers to participate more in the initial engineering design and certifica-tion costs for products and are no longer specifically reimbursing non-recurring costs. Instead,the component supplier now typically absorbs these non-recurring costs and recovers those costsover the contract term through the price and margin of its product sales. Under the new policy,which was adopted January 1, 2004, pre-certification costs, including those in excess of originalestimated levels, are included in total contract costs used to evaluate overall contract profitabil-ity. The Company believes the new method better reflects the substance of its current contrac-tual arrangements and is more consistent with SOP 81-1, which indicates that all direct costs andindirect costs allocable to contracts should be included in the total contract cost.
The impact of the changes in accounting methods was to record a before tax gain of $23.3 mil-lion ($16.2 million after tax) as a cumulative effect of change in accounting representing thecumulative profit that would have been recognized prior to January 1, 2004 had these methodsof accounting been in effect in prior periods.
83
NOTES TO CONSOLIDATED FINANCIAL STATEMENTS — (Continued)
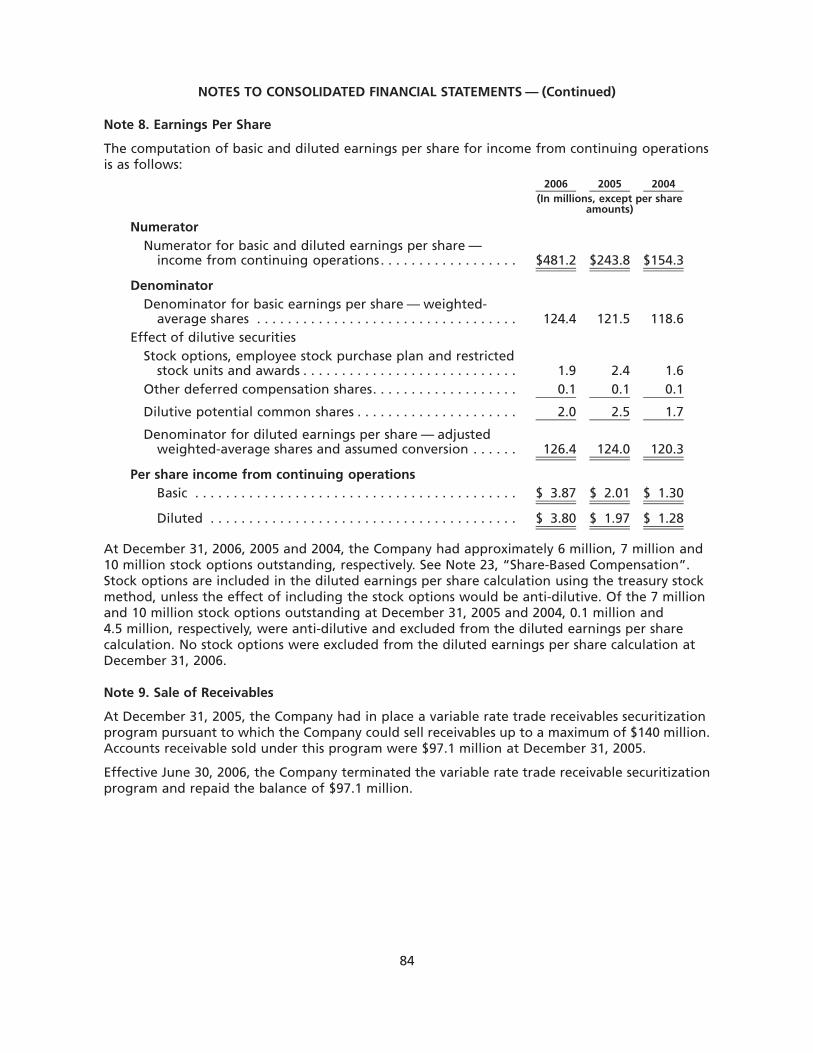
Note 8. Earnings Per Share
The computation of basic and diluted earnings per share for income from continuing operationsis as follows:
2006 2005 2004(In millions, except per share
amounts)
NumeratorNumerator for basic and diluted earnings per share —
income from continuing operations. . . . . . . . . . . . . . . . . . $481.2 $243.8 $154.3
DenominatorDenominator for basic earnings per share — weighted-
average shares . . . . . . . . . . . . . . . . . . . . . . . . . . . . . . . . . . 124.4 121.5 118.6Effect of dilutive securities
Stock options, employee stock purchase plan and restrictedstock units and awards . . . . . . . . . . . . . . . . . . . . . . . . . . . . 1.9 2.4 1.6
Other deferred compensation shares. . . . . . . . . . . . . . . . . . . 0.1 0.1 0.1
Dilutive potential common shares . . . . . . . . . . . . . . . . . . . . . 2.0 2.5 1.7
Denominator for diluted earnings per share — adjustedweighted-average shares and assumed conversion . . . . . . 126.4 124.0 120.3
Per share income from continuing operationsBasic . . . . . . . . . . . . . . . . . . . . . . . . . . . . . . . . . . . . . . . . . . $ 3.87 $ 2.01 $ 1.30
Diluted . . . . . . . . . . . . . . . . . . . . . . . . . . . . . . . . . . . . . . . . $ 3.80 $ 1.97 $ 1.28
At December 31, 2006, 2005 and 2004, the Company had approximately 6 million, 7 million and10 million stock options outstanding, respectively. See Note 23, “Share-Based Compensation”.Stock options are included in the diluted earnings per share calculation using the treasury stockmethod, unless the effect of including the stock options would be anti-dilutive. Of the 7 millionand 10 million stock options outstanding at December 31, 2005 and 2004, 0.1 million and4.5 million, respectively, were anti-dilutive and excluded from the diluted earnings per sharecalculation. No stock options were excluded from the diluted earnings per share calculation atDecember 31, 2006.
Note 9. Sale of Receivables
At December 31, 2005, the Company had in place a variable rate trade receivables securitizationprogram pursuant to which the Company could sell receivables up to a maximum of $140 million.Accounts receivable sold under this program were $97.1 million at December 31, 2005.
Effective June 30, 2006, the Company terminated the variable rate trade receivable securitizationprogram and repaid the balance of $97.1 million.
84
NOTES TO CONSOLIDATED FINANCIAL STATEMENTS — (Continued)

Note 10. Inventories
Inventories consist of the following:
2006 2005December 31,
(Dollars in millions)
FIFO or average cost (which approximates current costs):Finished products . . . . . . . . . . . . . . . . . . . . . . . . . . . . . . . . . . . . . . $ 334.9 $ 193.4In-process . . . . . . . . . . . . . . . . . . . . . . . . . . . . . . . . . . . . . . . . . . . . 880.9 814.0Raw materials and supplies . . . . . . . . . . . . . . . . . . . . . . . . . . . . . . 416.0 399.7
1,631.8 1,407.1Less:
Reserve to reduce certain inventories to LIFO basis. . . . . . . . . . . . (48.5) (43.5)Progress payments and advances . . . . . . . . . . . . . . . . . . . . . . . . . . (31.5) (55.2)
Total . . . . . . . . . . . . . . . . . . . . . . . . . . . . . . . . . . . . . . . . . . . . . . . . . . $1,551.8 $1,308.4
In-process inventory includes $399 million and $276 million as of December 31, 2006 and 2005,respectively, for the following: (1) pre-production and excess-over-average inventory accountedfor under long-term contract accounting; and (2) engineering costs recoverable under long-termcontractual arrangements. The December 31, 2006 balance of $399 million includes $212.7 mil-lion related to a Boeing 787 contract.
Approximately 10% of the inventory was valued under the LIFO method of accounting at Decem-ber 31, 2006 and 2005. Charges of approximately $5 million and $3.2 million for the year endedDecember 31, 2006 and 2005, respectively, for LIFO adjustments were recorded as cost of sales.
In-process inventories which include deferred costs, are summarized by platform as follows(dollars in millions, except quantities which are number of aircraft or number of engines if theengine is used on multiple aircraft platforms):
December 31, 2006
Deliveredto
AirlinesUnfilledOrders
UnfilledOptions
ContractQuantity
(2) Delivered
FirmUnfilled
Orders(3)Year
Complete(4) Production
Pre-Productionand Excess-
Over-Average Total
(Unaudited)Aircraft Order Status(1)
(Unaudited)Company Order Status
In-Process Inventory
Aircraft Platforms — number of aircraftEmbraer ERJ 170/190 Tailcone . . . . . 206 393 425 800 263 17 2011 $ 4.1 $ 4.3 $ 8.4A380 . . . . . . . . . . . . . . . . . . . . . . — 166 60 408 9 89 2019 1.6 — 1.67Q7 . . . . . . . . . . . . . . . . . . . . . . . — — — 19 — — 2010 0.3 21.3 21.6787 . . . . . . . . . . . . . . . . . . . . . . . — 462 241 1,812 — 12 2021 0.6 212.7 213.3A350 XWB . . . . . . . . . . . . . . . . . . — 42 20 1,645 — 42 2030 — 29.8 29.8
Engine Type — number of engines (engines are used on multiple aircraft platforms)CF34-10 . . . . . . . . . . . . . . . . . . . . 112 598 490 1,326 177 181 2013 14.4 57.8 72.2Trent 900 . . . . . . . . . . . . . . . . . . . — 264 100 918 20 244 2024 43.8 16.3 60.1V2500. . . . . . . . . . . . . . . . . . . . . . 2,516 1,336 654 2,831 2,555 200 2007 22.1 1.6 23.7Other . . . . . . . . . . . . . . . . . . . . . . 18.2 4.3 22.5
Total in-process inventory related tolong-term contracts underSOP 81-1 . . . . . . . . . . . . . . . . . . 105.1 348.1 453.2
A380 production and pre-production inventory . . . . . . . . . 2.5 40.6 43.1
Other in-process inventory . . . . . . . 374.3 10.3 384.6
Total . . . . . . . . . . . . . . . . . . . . . . 376.8 50.9 427.7
Balance at December 31, 2006 . . . . $481.9 $399.0 $880.9
85
NOTES TO CONSOLIDATED FINANCIAL STATEMENTS — (Continued)

December 31, 2005
Deliveredto
AirlinesUnfilledOrders
UnfilledOptions
ContractQuantity(2) Delivered
FirmUnfilled
Orders(3)Year
Complete(4) Production
Pre-Productionand Excess-
Over-Average Total
(Unaudited)Aircraft Order Status(1)
(Unaudited)Company Order Status
In-Process Inventory
Aircraft Platforms — number of aircraft717-200 . . . . . . . . . . . . . . . . . . . 151 5 — 156 153 3 2006 $ 2.6 $ 22.3 $ 24.9Embraer ERJ 170/190 Tailcone . . . 118 310 417 800 164 27 2012 3.1 7.2 10.3A380 . . . . . . . . . . . . . . . . . . . . . — 159 62 408 5 35 2018 — — —7Q7 . . . . . . . . . . . . . . . . . . . . . . — — — 19 — — 2012 0.3 21.3 21.6787 . . . . . . . . . . . . . . . . . . . . . . — 291 113 1,335 — — 2021 — 57.1 57.1A350 XWB . . . . . . . . . . . . . . . . . — 62 11 1,200 — — 2024 — 10.5 10.5
Engine Type — number of engines (engines are used on multiple aircraft platforms)CF34-10 . . . . . . . . . . . . . . . . . . . 24 416 442 1,326 37 75 2018 16.8 62.8 79.6Trent 900 . . . . . . . . . . . . . . . . . . — 232 132 918 23 201 2018 36.7 13.4 50.1V2500 . . . . . . . . . . . . . . . . . . . . 2,222 1,356 676 2,718 2,271 184 2007 29.7 21.3 51.0Other. . . . . . . . . . . . . . . . . . . . . 26.4 3.5 29.9
Total in-process inventory relatedto long-term contracts underSOP 81-1 . . . . . . . . . . . . . . . . . 115.6 219.4 335.0
A380 production and pre-production inventory . . . . . . . . 24.4 40.0 64.4
Other in-process inventory . . . . . . 398.0 16.6 414.6
Total . . . . . . . . . . . . . . . . . . . . . 422.4 56.6 479.0
Balance at December 31, 2005 . . . $538.0 $276.0 $814.0
(1) Represents the aircraft order status as reported by independent sources for options of therelated number of aircraft or the number of engines as noted.
(2) Represents the number of aircraft or the number of engines as noted used to obtain averageunit cost.
(3) Represents the number of aircraft or the number of engines as noted for which the Com-pany has firm unfilled orders.
(4) The year presented represents the year in which the final production units included in thecontract quantity are expected to be delivered. The contract may continue in effect beyondthis date.
Note 11. Goodwill and Identifiable Intangible Assets
The changes in the carrying amount of goodwill by segment are as follows:
BalanceDecember 31,
2004
BusinessCombinationsCompleted or
Finalized
ForeignCurrency
Translation/Other
BalanceDecember 31,
2005
BusinessCombinationsCompleted or
Finalized
ForeignCurrency
Translation/Other
BalanceDecember 31,
2006(Dollars in millions)
Engine Systems . . . $ 509.4 $ — $(26.3) $ 483.1 $(0.3) $ 33.1 $ 515.9Airframe Systems. . 260.2 — (20.6) 239.6 (0.1) 21.4 260.9Electronic Systems. . 488.9 48.3(a) 58.5(b) 595.7 (2.6) (28.6) 564.5
$1,258.5 $48.3 $ 11.6 $1,318.4 $(3.0)(c) $ 25.9 $1,341.3
(a) During the year ended December 31, 2005, the Company completed its acquisition of theremaining 5% interest in Goodrich Hella Aerospace Lighting Systems Holding GmbH fromHella Hueck & Co. KG. At the time of the transaction, the Company increased goodwill by$8.8 million. On October 31, 2005, the Company acquired Sensors Unlimited, Inc. (SUI) for
86
NOTES TO CONSOLIDATED FINANCIAL STATEMENTS — (Continued)
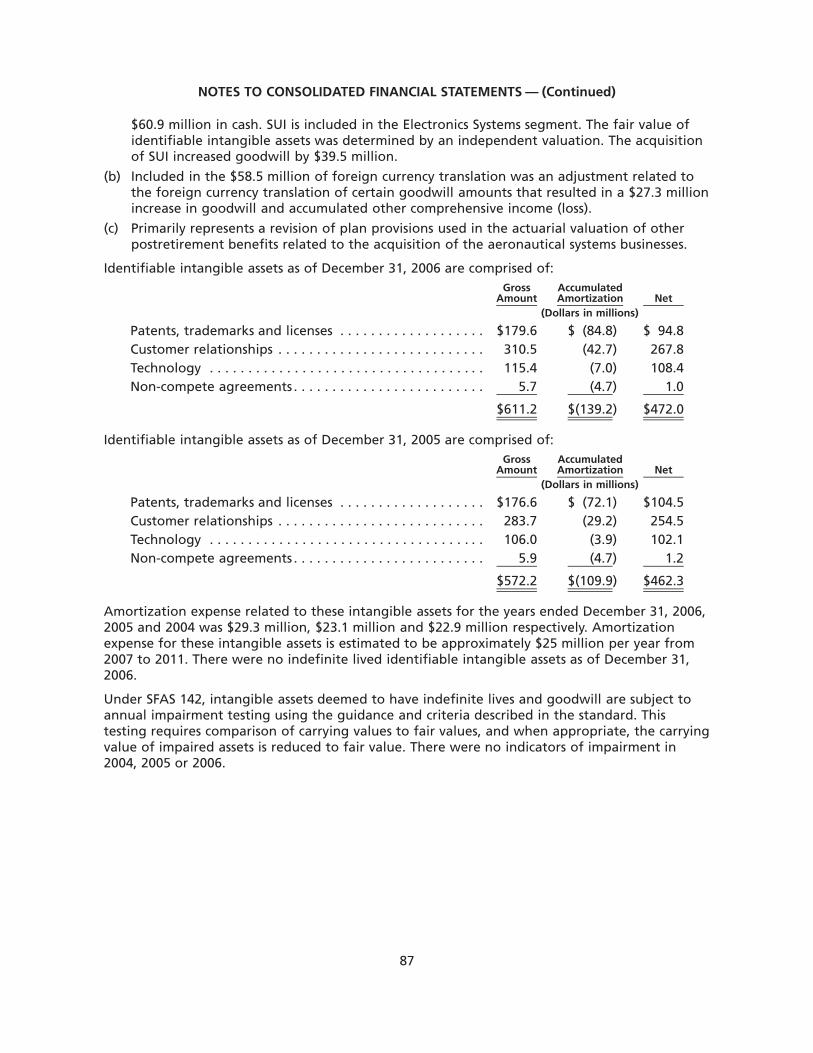
$60.9 million in cash. SUI is included in the Electronics Systems segment. The fair value ofidentifiable intangible assets was determined by an independent valuation. The acquisitionof SUI increased goodwill by $39.5 million.
(b) Included in the $58.5 million of foreign currency translation was an adjustment related tothe foreign currency translation of certain goodwill amounts that resulted in a $27.3 millionincrease in goodwill and accumulated other comprehensive income (loss).
(c) Primarily represents a revision of plan provisions used in the actuarial valuation of otherpostretirement benefits related to the acquisition of the aeronautical systems businesses.
Identifiable intangible assets as of December 31, 2006 are comprised of:Gross
AmountAccumulatedAmortization Net
(Dollars in millions)
Patents, trademarks and licenses . . . . . . . . . . . . . . . . . . . $179.6 $ (84.8) $ 94.8Customer relationships . . . . . . . . . . . . . . . . . . . . . . . . . . . 310.5 (42.7) 267.8Technology . . . . . . . . . . . . . . . . . . . . . . . . . . . . . . . . . . . . 115.4 (7.0) 108.4Non-compete agreements . . . . . . . . . . . . . . . . . . . . . . . . . 5.7 (4.7) 1.0
$611.2 $(139.2) $472.0
Identifiable intangible assets as of December 31, 2005 are comprised of:Gross
AmountAccumulatedAmortization Net
(Dollars in millions)
Patents, trademarks and licenses . . . . . . . . . . . . . . . . . . . $176.6 $ (72.1) $104.5Customer relationships . . . . . . . . . . . . . . . . . . . . . . . . . . . 283.7 (29.2) 254.5Technology . . . . . . . . . . . . . . . . . . . . . . . . . . . . . . . . . . . . 106.0 (3.9) 102.1Non-compete agreements . . . . . . . . . . . . . . . . . . . . . . . . . 5.9 (4.7) 1.2
$572.2 $(109.9) $462.3
Amortization expense related to these intangible assets for the years ended December 31, 2006,2005 and 2004 was $29.3 million, $23.1 million and $22.9 million respectively. Amortizationexpense for these intangible assets is estimated to be approximately $25 million per year from2007 to 2011. There were no indefinite lived identifiable intangible assets as of December 31,2006.
Under SFAS 142, intangible assets deemed to have indefinite lives and goodwill are subject toannual impairment testing using the guidance and criteria described in the standard. Thistesting requires comparison of carrying values to fair values, and when appropriate, the carryingvalue of impaired assets is reduced to fair value. There were no indicators of impairment in2004, 2005 or 2006.
87
NOTES TO CONSOLIDATED FINANCIAL STATEMENTS — (Continued)
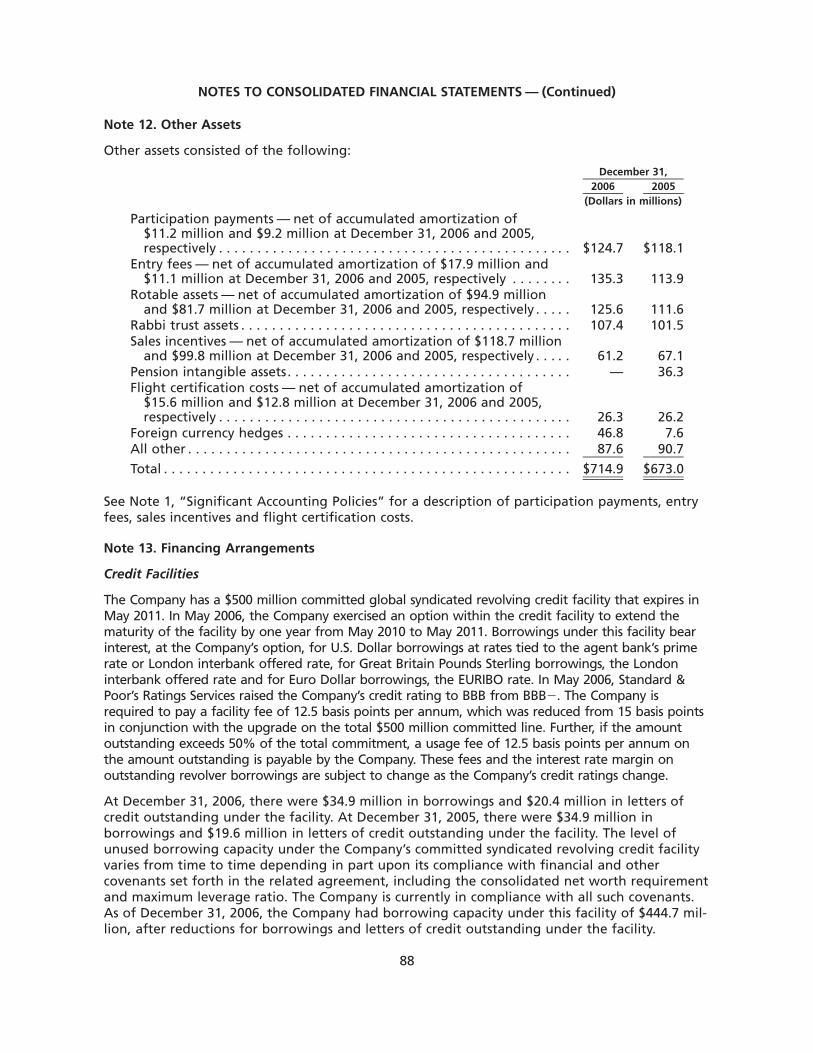
Note 12. Other Assets
Other assets consisted of the following:
2006 2005December 31,
(Dollars in millions)
Participation payments — net of accumulated amortization of$11.2 million and $9.2 million at December 31, 2006 and 2005,respectively . . . . . . . . . . . . . . . . . . . . . . . . . . . . . . . . . . . . . . . . . . . . . . $124.7 $118.1
Entry fees — net of accumulated amortization of $17.9 million and$11.1 million at December 31, 2006 and 2005, respectively . . . . . . . . 135.3 113.9
Rotable assets — net of accumulated amortization of $94.9 millionand $81.7 million at December 31, 2006 and 2005, respectively . . . . . 125.6 111.6
Rabbi trust assets . . . . . . . . . . . . . . . . . . . . . . . . . . . . . . . . . . . . . . . . . . . 107.4 101.5Sales incentives — net of accumulated amortization of $118.7 million
and $99.8 million at December 31, 2006 and 2005, respectively . . . . . 61.2 67.1Pension intangible assets. . . . . . . . . . . . . . . . . . . . . . . . . . . . . . . . . . . . . — 36.3Flight certification costs — net of accumulated amortization of
$15.6 million and $12.8 million at December 31, 2006 and 2005,respectively . . . . . . . . . . . . . . . . . . . . . . . . . . . . . . . . . . . . . . . . . . . . . . 26.3 26.2
Foreign currency hedges . . . . . . . . . . . . . . . . . . . . . . . . . . . . . . . . . . . . . 46.8 7.6All other . . . . . . . . . . . . . . . . . . . . . . . . . . . . . . . . . . . . . . . . . . . . . . . . . . 87.6 90.7
Total . . . . . . . . . . . . . . . . . . . . . . . . . . . . . . . . . . . . . . . . . . . . . . . . . . . . . $714.9 $673.0
See Note 1, “Significant Accounting Policies” for a description of participation payments, entryfees, sales incentives and flight certification costs.
Note 13. Financing Arrangements
Credit Facilities
The Company has a $500 million committed global syndicated revolving credit facility that expires inMay 2011. In May 2006, the Company exercised an option within the credit facility to extend thematurity of the facility by one year from May 2010 to May 2011. Borrowings under this facility bearinterest, at the Company’s option, for U.S. Dollar borrowings at rates tied to the agent bank’s primerate or London interbank offered rate, for Great Britain Pounds Sterling borrowings, the Londoninterbank offered rate and for Euro Dollar borrowings, the EURIBO rate. In May 2006, Standard &Poor’s Ratings Services raised the Company’s credit rating to BBB from BBB�. The Company isrequired to pay a facility fee of 12.5 basis points per annum, which was reduced from 15 basis pointsin conjunction with the upgrade on the total $500 million committed line. Further, if the amountoutstanding exceeds 50% of the total commitment, a usage fee of 12.5 basis points per annum onthe amount outstanding is payable by the Company. These fees and the interest rate margin onoutstanding revolver borrowings are subject to change as the Company’s credit ratings change.
At December 31, 2006, there were $34.9 million in borrowings and $20.4 million in letters ofcredit outstanding under the facility. At December 31, 2005, there were $34.9 million inborrowings and $19.6 million in letters of credit outstanding under the facility. The level ofunused borrowing capacity under the Company’s committed syndicated revolving credit facilityvaries from time to time depending in part upon its compliance with financial and othercovenants set forth in the related agreement, including the consolidated net worth requirementand maximum leverage ratio. The Company is currently in compliance with all such covenants.As of December 31, 2006, the Company had borrowing capacity under this facility of $444.7 mil-lion, after reductions for borrowings and letters of credit outstanding under the facility.
88
NOTES TO CONSOLIDATED FINANCIAL STATEMENTS — (Continued)
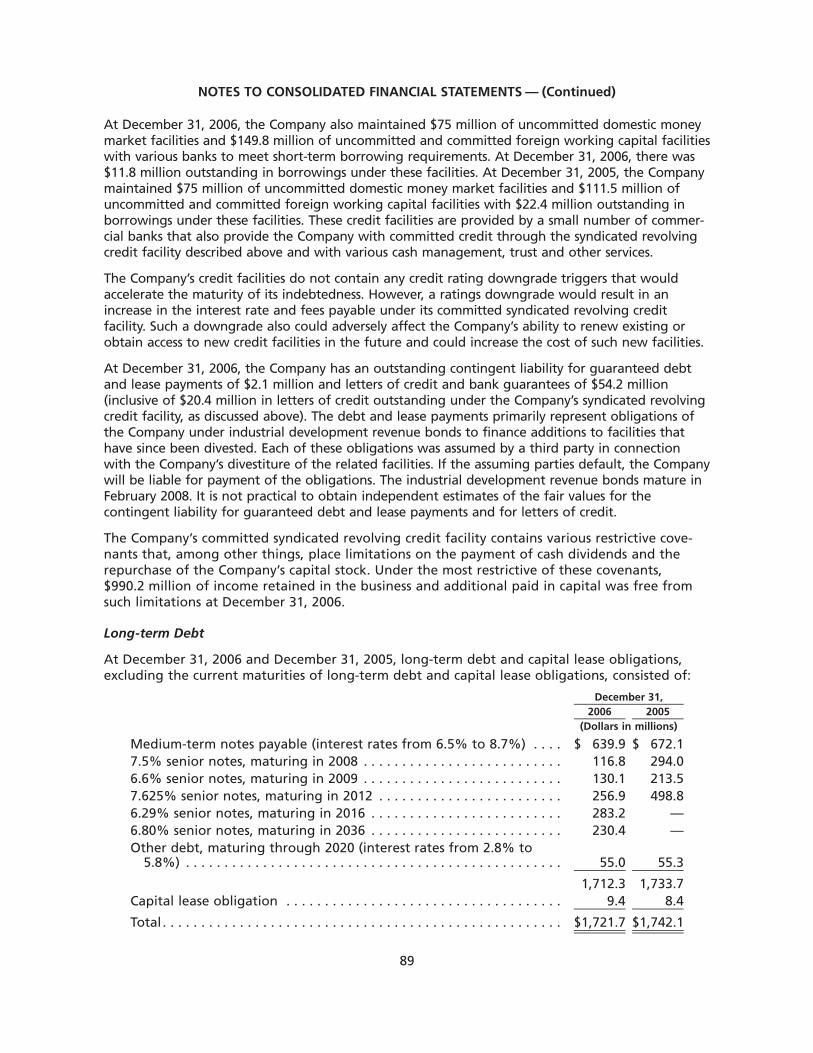
At December 31, 2006, the Company also maintained $75 million of uncommitted domestic moneymarket facilities and $149.8 million of uncommitted and committed foreign working capital facilitieswith various banks to meet short-term borrowing requirements. At December 31, 2006, there was$11.8 million outstanding in borrowings under these facilities. At December 31, 2005, the Companymaintained $75 million of uncommitted domestic money market facilities and $111.5 million ofuncommitted and committed foreign working capital facilities with $22.4 million outstanding inborrowings under these facilities. These credit facilities are provided by a small number of commer-cial banks that also provide the Company with committed credit through the syndicated revolvingcredit facility described above and with various cash management, trust and other services.
The Company’s credit facilities do not contain any credit rating downgrade triggers that wouldaccelerate the maturity of its indebtedness. However, a ratings downgrade would result in anincrease in the interest rate and fees payable under its committed syndicated revolving creditfacility. Such a downgrade also could adversely affect the Company’s ability to renew existing orobtain access to new credit facilities in the future and could increase the cost of such new facilities.
At December 31, 2006, the Company has an outstanding contingent liability for guaranteed debtand lease payments of $2.1 million and letters of credit and bank guarantees of $54.2 million(inclusive of $20.4 million in letters of credit outstanding under the Company’s syndicated revolvingcredit facility, as discussed above). The debt and lease payments primarily represent obligations ofthe Company under industrial development revenue bonds to finance additions to facilities thathave since been divested. Each of these obligations was assumed by a third party in connectionwith the Company’s divestiture of the related facilities. If the assuming parties default, the Companywill be liable for payment of the obligations. The industrial development revenue bonds mature inFebruary 2008. It is not practical to obtain independent estimates of the fair values for thecontingent liability for guaranteed debt and lease payments and for letters of credit.
The Company’s committed syndicated revolving credit facility contains various restrictive cove-nants that, among other things, place limitations on the payment of cash dividends and therepurchase of the Company’s capital stock. Under the most restrictive of these covenants,$990.2 million of income retained in the business and additional paid in capital was free fromsuch limitations at December 31, 2006.
Long-term Debt
At December 31, 2006 and December 31, 2005, long-term debt and capital lease obligations,excluding the current maturities of long-term debt and capital lease obligations, consisted of:
2006 2005December 31,
(Dollars in millions)
Medium-term notes payable (interest rates from 6.5% to 8.7%) . . . . $ 639.9 $ 672.17.5% senior notes, maturing in 2008 . . . . . . . . . . . . . . . . . . . . . . . . . . 116.8 294.06.6% senior notes, maturing in 2009 . . . . . . . . . . . . . . . . . . . . . . . . . . 130.1 213.57.625% senior notes, maturing in 2012 . . . . . . . . . . . . . . . . . . . . . . . . 256.9 498.86.29% senior notes, maturing in 2016 . . . . . . . . . . . . . . . . . . . . . . . . . 283.2 —6.80% senior notes, maturing in 2036 . . . . . . . . . . . . . . . . . . . . . . . . . 230.4 —Other debt, maturing through 2020 (interest rates from 2.8% to
5.8%) . . . . . . . . . . . . . . . . . . . . . . . . . . . . . . . . . . . . . . . . . . . . . . . . . 55.0 55.3
1,712.3 1,733.7Capital lease obligation . . . . . . . . . . . . . . . . . . . . . . . . . . . . . . . . . . . . 9.4 8.4
Total . . . . . . . . . . . . . . . . . . . . . . . . . . . . . . . . . . . . . . . . . . . . . . . . . . . . $1,721.7 $1,742.1
89
NOTES TO CONSOLIDATED FINANCIAL STATEMENTS — (Continued)
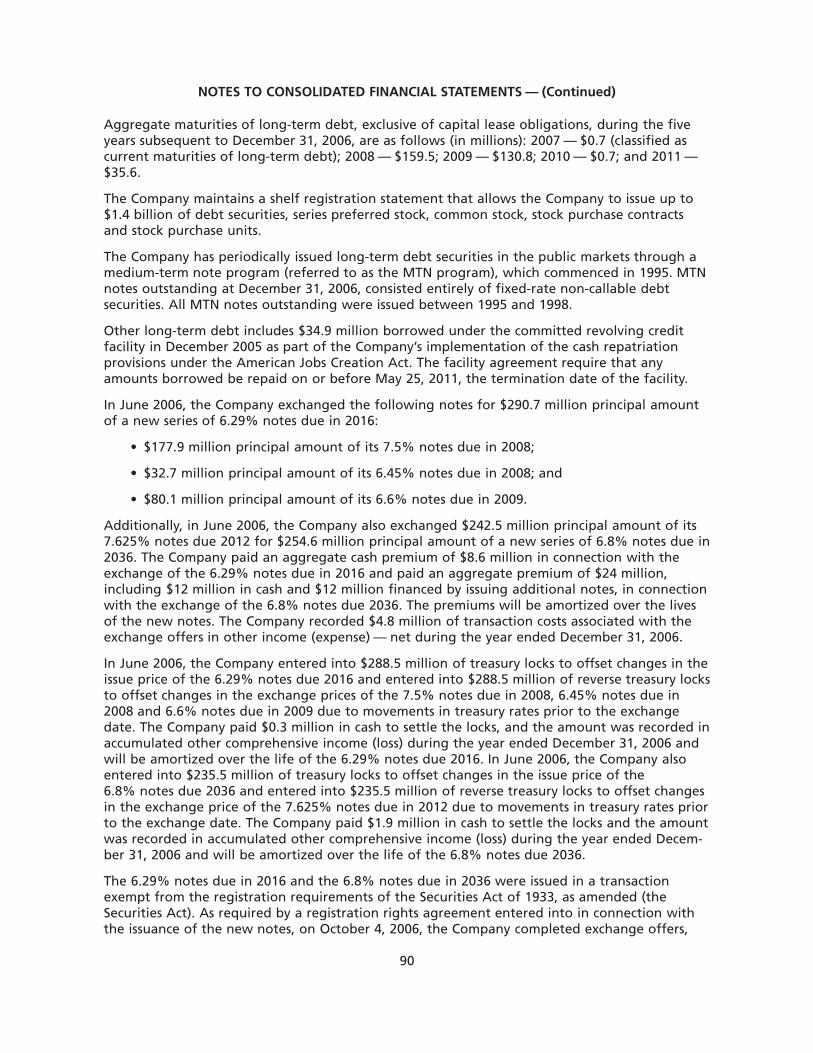
Aggregate maturities of long-term debt, exclusive of capital lease obligations, during the fiveyears subsequent to December 31, 2006, are as follows (in millions): 2007 — $0.7 (classified ascurrent maturities of long-term debt); 2008 — $159.5; 2009 — $130.8; 2010 — $0.7; and 2011 —$35.6.
The Company maintains a shelf registration statement that allows the Company to issue up to$1.4 billion of debt securities, series preferred stock, common stock, stock purchase contractsand stock purchase units.
The Company has periodically issued long-term debt securities in the public markets through amedium-term note program (referred to as the MTN program), which commenced in 1995. MTNnotes outstanding at December 31, 2006, consisted entirely of fixed-rate non-callable debtsecurities. All MTN notes outstanding were issued between 1995 and 1998.
Other long-term debt includes $34.9 million borrowed under the committed revolving creditfacility in December 2005 as part of the Company’s implementation of the cash repatriationprovisions under the American Jobs Creation Act. The facility agreement require that anyamounts borrowed be repaid on or before May 25, 2011, the termination date of the facility.
In June 2006, the Company exchanged the following notes for $290.7 million principal amountof a new series of 6.29% notes due in 2016:
• $177.9 million principal amount of its 7.5% notes due in 2008;
• $32.7 million principal amount of its 6.45% notes due in 2008; and
• $80.1 million principal amount of its 6.6% notes due in 2009.
Additionally, in June 2006, the Company also exchanged $242.5 million principal amount of its7.625% notes due 2012 for $254.6 million principal amount of a new series of 6.8% notes due in2036. The Company paid an aggregate cash premium of $8.6 million in connection with theexchange of the 6.29% notes due in 2016 and paid an aggregate premium of $24 million,including $12 million in cash and $12 million financed by issuing additional notes, in connectionwith the exchange of the 6.8% notes due 2036. The premiums will be amortized over the livesof the new notes. The Company recorded $4.8 million of transaction costs associated with theexchange offers in other income (expense) — net during the year ended December 31, 2006.
In June 2006, the Company entered into $288.5 million of treasury locks to offset changes in theissue price of the 6.29% notes due 2016 and entered into $288.5 million of reverse treasury locksto offset changes in the exchange prices of the 7.5% notes due in 2008, 6.45% notes due in2008 and 6.6% notes due in 2009 due to movements in treasury rates prior to the exchangedate. The Company paid $0.3 million in cash to settle the locks, and the amount was recorded inaccumulated other comprehensive income (loss) during the year ended December 31, 2006 andwill be amortized over the life of the 6.29% notes due 2016. In June 2006, the Company alsoentered into $235.5 million of treasury locks to offset changes in the issue price of the6.8% notes due 2036 and entered into $235.5 million of reverse treasury locks to offset changesin the exchange price of the 7.625% notes due in 2012 due to movements in treasury rates priorto the exchange date. The Company paid $1.9 million in cash to settle the locks and the amountwas recorded in accumulated other comprehensive income (loss) during the year ended Decem-ber 31, 2006 and will be amortized over the life of the 6.8% notes due 2036.
The 6.29% notes due in 2016 and the 6.8% notes due in 2036 were issued in a transactionexempt from the registration requirements of the Securities Act of 1933, as amended (theSecurities Act). As required by a registration rights agreement entered into in connection withthe issuance of the new notes, on October 4, 2006, the Company completed exchange offers,
90
NOTES TO CONSOLIDATED FINANCIAL STATEMENTS — (Continued)
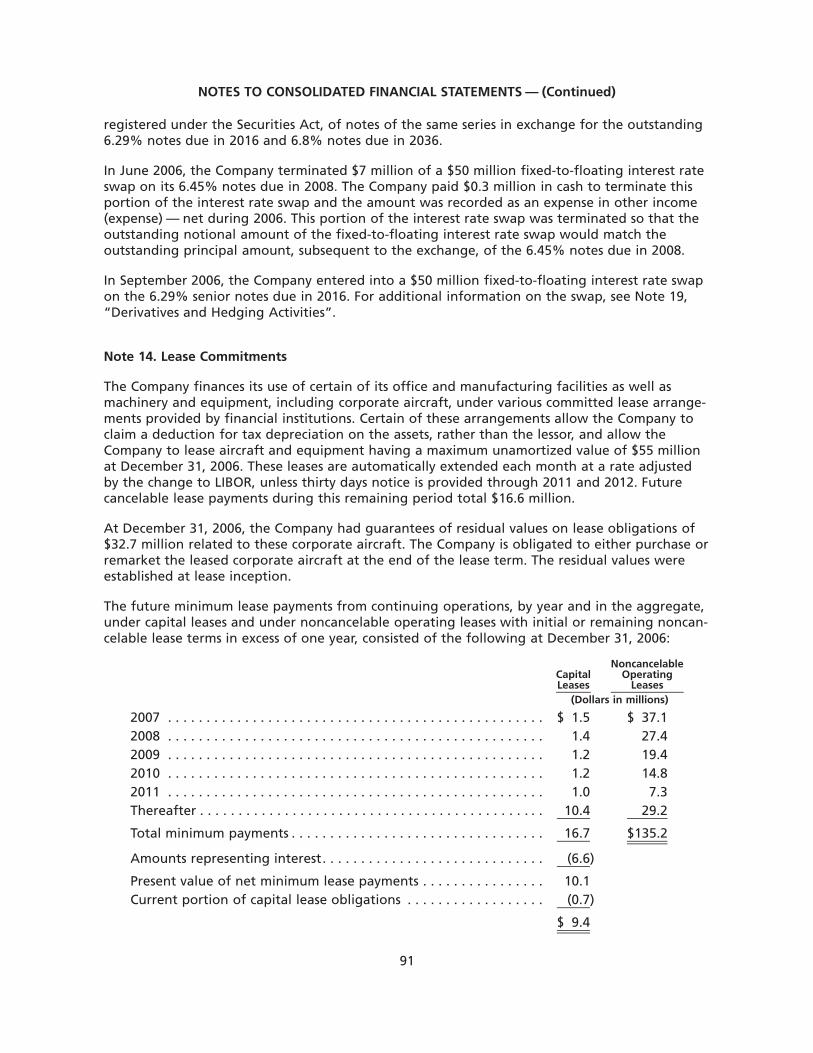
registered under the Securities Act, of notes of the same series in exchange for the outstanding6.29% notes due in 2016 and 6.8% notes due in 2036.
In June 2006, the Company terminated $7 million of a $50 million fixed-to-floating interest rateswap on its 6.45% notes due in 2008. The Company paid $0.3 million in cash to terminate thisportion of the interest rate swap and the amount was recorded as an expense in other income(expense) — net during 2006. This portion of the interest rate swap was terminated so that theoutstanding notional amount of the fixed-to-floating interest rate swap would match theoutstanding principal amount, subsequent to the exchange, of the 6.45% notes due in 2008.
In September 2006, the Company entered into a $50 million fixed-to-floating interest rate swapon the 6.29% senior notes due in 2016. For additional information on the swap, see Note 19,“Derivatives and Hedging Activities”.
Note 14. Lease Commitments
The Company finances its use of certain of its office and manufacturing facilities as well asmachinery and equipment, including corporate aircraft, under various committed lease arrange-ments provided by financial institutions. Certain of these arrangements allow the Company toclaim a deduction for tax depreciation on the assets, rather than the lessor, and allow theCompany to lease aircraft and equipment having a maximum unamortized value of $55 millionat December 31, 2006. These leases are automatically extended each month at a rate adjustedby the change to LIBOR, unless thirty days notice is provided through 2011 and 2012. Futurecancelable lease payments during this remaining period total $16.6 million.
At December 31, 2006, the Company had guarantees of residual values on lease obligations of$32.7 million related to these corporate aircraft. The Company is obligated to either purchase orremarket the leased corporate aircraft at the end of the lease term. The residual values wereestablished at lease inception.
The future minimum lease payments from continuing operations, by year and in the aggregate,under capital leases and under noncancelable operating leases with initial or remaining noncan-celable lease terms in excess of one year, consisted of the following at December 31, 2006:
CapitalLeases
NoncancelableOperating
Leases(Dollars in millions)
2007 . . . . . . . . . . . . . . . . . . . . . . . . . . . . . . . . . . . . . . . . . . . . . . . . . $ 1.5 $ 37.12008 . . . . . . . . . . . . . . . . . . . . . . . . . . . . . . . . . . . . . . . . . . . . . . . . . 1.4 27.42009 . . . . . . . . . . . . . . . . . . . . . . . . . . . . . . . . . . . . . . . . . . . . . . . . . 1.2 19.42010 . . . . . . . . . . . . . . . . . . . . . . . . . . . . . . . . . . . . . . . . . . . . . . . . . 1.2 14.82011 . . . . . . . . . . . . . . . . . . . . . . . . . . . . . . . . . . . . . . . . . . . . . . . . . 1.0 7.3Thereafter . . . . . . . . . . . . . . . . . . . . . . . . . . . . . . . . . . . . . . . . . . . . . 10.4 29.2
Total minimum payments . . . . . . . . . . . . . . . . . . . . . . . . . . . . . . . . . 16.7 $135.2
Amounts representing interest. . . . . . . . . . . . . . . . . . . . . . . . . . . . . (6.6)
Present value of net minimum lease payments . . . . . . . . . . . . . . . . 10.1Current portion of capital lease obligations . . . . . . . . . . . . . . . . . . (0.7)
$ 9.4
91
NOTES TO CONSOLIDATED FINANCIAL STATEMENTS — (Continued)
Net rent expense from continuing operations consisted of the following:
2006 2005 2004Year Ended December 31,
(Dollars in millions)
Minimum rentals . . . . . . . . . . . . . . . . . . . . . . . . . . . . . . . . . . . . . . $46.6 $48.7 $45.4Contingent rentals . . . . . . . . . . . . . . . . . . . . . . . . . . . . . . . . . . . . . 1.0 1.6 1.6Sublease rentals . . . . . . . . . . . . . . . . . . . . . . . . . . . . . . . . . . . . . . . (0.1) (0.3) (0.5)
TOTAL. . . . . . . . . . . . . . . . . . . . . . . . . . . . . . . . . . . . . . . . . . . . . . . $47.5 $50.0 $46.5
In December 2005, the Company terminated a production equipment lease that was maturing inJanuary 2006 and purchased the leased assets for $26.2 million.
Note 15. Pensions and Postretirement Benefits
The Company has several defined benefit pension plans covering eligible employees. U.S. planscovering salaried and non-union hourly employees generally provide benefit payments using aformula that is based on an employee’s compensation and length of service. Plans coveringunion employees generally provide benefit payments of stated amounts for each year of service.Plans outside of the U.S. generally provide benefit payments to eligible employees that relate toan employee’s compensation and length of service. The Company also sponsors severalunfunded defined benefit postretirement plans that provide certain health care and lifeinsurance benefits to eligible employees in the U.S. and Canada. The health care plans are bothcontributory, with retiree contributions adjusted periodically, and non-contributory and cancontain other cost-sharing features, such as deductibles and coinsurance. The life insurance plansare generally noncontributory.
Amortization of prior service cost is recognized on a straight-line basis over the averageremaining service period of active employees. Amortization of gains and losses are recognizedusing the “corridor approach”, which is the minimum amortization required by Statement ofFinancial Accounting Standards No. 87 “Employers’ Accounting for Pension” (SFAS 87). Underthe corridor approach, the net gain or loss in excess of 10% of the greater of the projectedbenefit obligation or the market-related value of the assets is amortized on a straight-line basisover the average remaining service period of the active employees.
Adoption of Statement of Financial Accounting Standards No. 158
On December 31, 2006, the Company adopted the recognition and disclosure provisions ofStatement of Financial Accounting Standards No. 158, “Employers’ Accounting for DefinedBenefit Pension and Other Postretirement Plans” (SFAS 158). SFAS 158 required the Company torecognize the funded status (i.e., the difference between the fair value of plan assets and theprojected benefit obligations) of the Company’s pension plans and postretirement benefits plansother than pension (OPEB) on the Company’s December 31, 2006 Consolidated Balance Sheet,with a corresponding adjustment to accumulated other comprehensive income (loss), net of tax.The adjustment to accumulated other comprehensive income (loss) at adoption represents thenet unrecognized actuarial gains/(losses), unrecognized prior service costs and unrecognizedtransition obligation remaining from the initial adoption of SFAS 87, all of which werepreviously netted against the plan’s funded status in the Company’s Consolidated Balance Sheet.These amounts will be subsequently recognized as net periodic benefit cost. Further, actuarialgains and losses that arise in subsequent periods and are not recognized as net periodic benefitcost in the same periods will be recognized as a component of accumulated other comprehen-sive income (loss). Those amounts will be subsequently recognized as a component of net
92
NOTES TO CONSOLIDATED FINANCIAL STATEMENTS — (Continued)
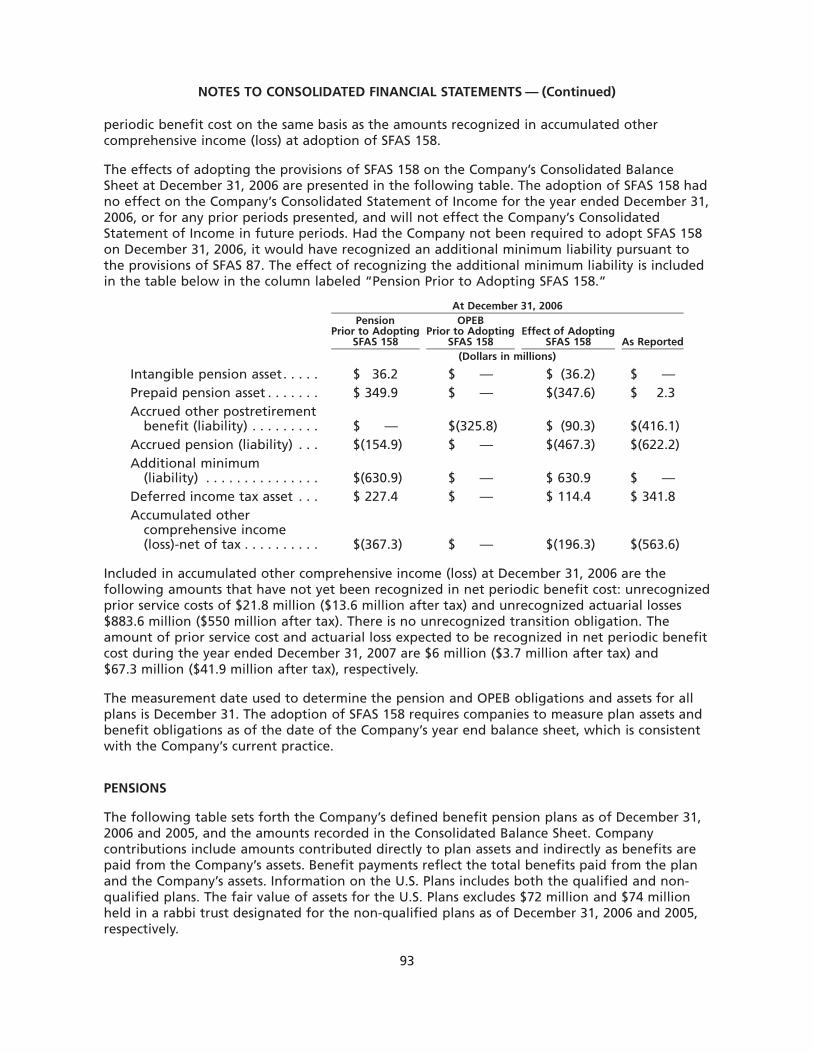
periodic benefit cost on the same basis as the amounts recognized in accumulated othercomprehensive income (loss) at adoption of SFAS 158.
The effects of adopting the provisions of SFAS 158 on the Company’s Consolidated BalanceSheet at December 31, 2006 are presented in the following table. The adoption of SFAS 158 hadno effect on the Company’s Consolidated Statement of Income for the year ended December 31,2006, or for any prior periods presented, and will not effect the Company’s ConsolidatedStatement of Income in future periods. Had the Company not been required to adopt SFAS 158on December 31, 2006, it would have recognized an additional minimum liability pursuant tothe provisions of SFAS 87. The effect of recognizing the additional minimum liability is includedin the table below in the column labeled “Pension Prior to Adopting SFAS 158.”
PensionPrior to Adopting
SFAS 158
OPEBPrior to Adopting
SFAS 158Effect of Adopting
SFAS 158 As Reported
At December 31, 2006
(Dollars in millions)
Intangible pension asset. . . . . $ 36.2 $ — $ (36.2) $ —Prepaid pension asset . . . . . . . $ 349.9 $ — $(347.6) $ 2.3Accrued other postretirement
benefit (liability) . . . . . . . . . $ — $(325.8) $ (90.3) $(416.1)Accrued pension (liability) . . . $(154.9) $ — $(467.3) $(622.2)Additional minimum
(liability) . . . . . . . . . . . . . . . $(630.9) $ — $ 630.9 $ —Deferred income tax asset . . . $ 227.4 $ — $ 114.4 $ 341.8Accumulated other
comprehensive income(loss)-net of tax . . . . . . . . . . $(367.3) $ — $(196.3) $(563.6)
Included in accumulated other comprehensive income (loss) at December 31, 2006 are thefollowing amounts that have not yet been recognized in net periodic benefit cost: unrecognizedprior service costs of $21.8 million ($13.6 million after tax) and unrecognized actuarial losses$883.6 million ($550 million after tax). There is no unrecognized transition obligation. Theamount of prior service cost and actuarial loss expected to be recognized in net periodic benefitcost during the year ended December 31, 2007 are $6 million ($3.7 million after tax) and$67.3 million ($41.9 million after tax), respectively.
The measurement date used to determine the pension and OPEB obligations and assets for allplans is December 31. The adoption of SFAS 158 requires companies to measure plan assets andbenefit obligations as of the date of the Company’s year end balance sheet, which is consistentwith the Company’s current practice.
PENSIONS
The following table sets forth the Company’s defined benefit pension plans as of December 31,2006 and 2005, and the amounts recorded in the Consolidated Balance Sheet. Companycontributions include amounts contributed directly to plan assets and indirectly as benefits arepaid from the Company’s assets. Benefit payments reflect the total benefits paid from the planand the Company’s assets. Information on the U.S. Plans includes both the qualified and non-qualified plans. The fair value of assets for the U.S. Plans excludes $72 million and $74 millionheld in a rabbi trust designated for the non-qualified plans as of December 31, 2006 and 2005,respectively.
93
NOTES TO CONSOLIDATED FINANCIAL STATEMENTS — (Continued)
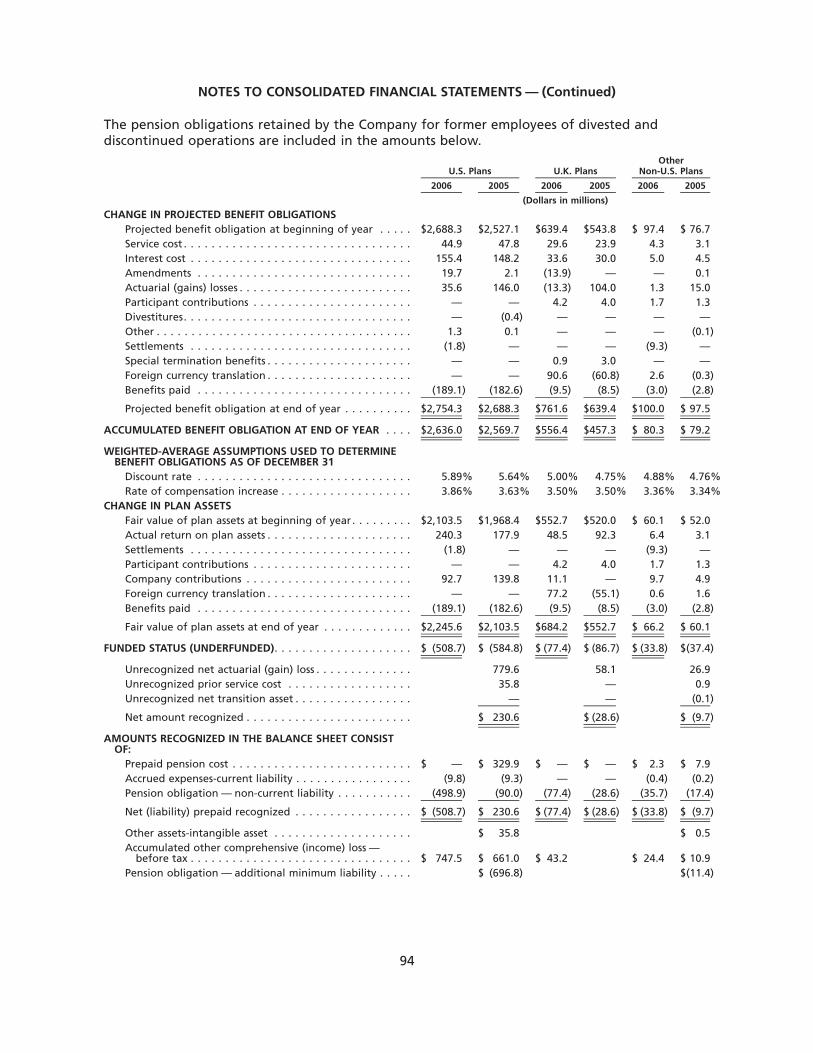
The pension obligations retained by the Company for former employees of divested anddiscontinued operations are included in the amounts below.
2006 2005 2006 2005 2006 2005
U.S. Plans U.K. PlansOther
Non-U.S. Plans
(Dollars in millions)
CHANGE IN PROJECTED BENEFIT OBLIGATIONSProjected benefit obligation at beginning of year . . . . . $2,688.3 $2,527.1 $639.4 $543.8 $ 97.4 $ 76.7Service cost . . . . . . . . . . . . . . . . . . . . . . . . . . . . . . . . . 44.9 47.8 29.6 23.9 4.3 3.1Interest cost . . . . . . . . . . . . . . . . . . . . . . . . . . . . . . . . 155.4 148.2 33.6 30.0 5.0 4.5Amendments . . . . . . . . . . . . . . . . . . . . . . . . . . . . . . . 19.7 2.1 (13.9) — — 0.1Actuarial (gains) losses . . . . . . . . . . . . . . . . . . . . . . . . . 35.6 146.0 (13.3) 104.0 1.3 15.0Participant contributions . . . . . . . . . . . . . . . . . . . . . . . — — 4.2 4.0 1.7 1.3Divestitures. . . . . . . . . . . . . . . . . . . . . . . . . . . . . . . . . — (0.4) — — — —Other . . . . . . . . . . . . . . . . . . . . . . . . . . . . . . . . . . . . . 1.3 0.1 — — — (0.1)Settlements . . . . . . . . . . . . . . . . . . . . . . . . . . . . . . . . (1.8) — — — (9.3) —Special termination benefits . . . . . . . . . . . . . . . . . . . . . — — 0.9 3.0 — —Foreign currency translation . . . . . . . . . . . . . . . . . . . . . — — 90.6 (60.8) 2.6 (0.3)Benefits paid . . . . . . . . . . . . . . . . . . . . . . . . . . . . . . . (189.1) (182.6) (9.5) (8.5) (3.0) (2.8)
Projected benefit obligation at end of year . . . . . . . . . . $2,754.3 $2,688.3 $761.6 $639.4 $100.0 $ 97.5
ACCUMULATED BENEFIT OBLIGATION AT END OF YEAR . . . . $2,636.0 $2,569.7 $556.4 $457.3 $ 80.3 $ 79.2
WEIGHTED-AVERAGE ASSUMPTIONS USED TO DETERMINEBENEFIT OBLIGATIONS AS OF DECEMBER 31
Discount rate . . . . . . . . . . . . . . . . . . . . . . . . . . . . . . . 5.89% 5.64% 5.00% 4.75% 4.88% 4.76%Rate of compensation increase . . . . . . . . . . . . . . . . . . . 3.86% 3.63% 3.50% 3.50% 3.36% 3.34%
CHANGE IN PLAN ASSETSFair value of plan assets at beginning of year . . . . . . . . . $2,103.5 $1,968.4 $552.7 $520.0 $ 60.1 $ 52.0Actual return on plan assets . . . . . . . . . . . . . . . . . . . . . 240.3 177.9 48.5 92.3 6.4 3.1Settlements . . . . . . . . . . . . . . . . . . . . . . . . . . . . . . . . (1.8) — — — (9.3) —Participant contributions . . . . . . . . . . . . . . . . . . . . . . . — — 4.2 4.0 1.7 1.3Company contributions . . . . . . . . . . . . . . . . . . . . . . . . 92.7 139.8 11.1 — 9.7 4.9Foreign currency translation . . . . . . . . . . . . . . . . . . . . . — — 77.2 (55.1) 0.6 1.6Benefits paid . . . . . . . . . . . . . . . . . . . . . . . . . . . . . . . (189.1) (182.6) (9.5) (8.5) (3.0) (2.8)
Fair value of plan assets at end of year . . . . . . . . . . . . . $2,245.6 $2,103.5 $684.2 $552.7 $ 66.2 $ 60.1
FUNDED STATUS (UNDERFUNDED). . . . . . . . . . . . . . . . . . . . $ (508.7) $ (584.8) $ (77.4) $ (86.7) $ (33.8) $(37.4)
Unrecognized net actuarial (gain) loss . . . . . . . . . . . . . . 779.6 58.1 26.9Unrecognized prior service cost . . . . . . . . . . . . . . . . . . 35.8 — 0.9Unrecognized net transition asset . . . . . . . . . . . . . . . . . — — (0.1)
Net amount recognized . . . . . . . . . . . . . . . . . . . . . . . . $ 230.6 $ (28.6) $ (9.7)
AMOUNTS RECOGNIZED IN THE BALANCE SHEET CONSISTOF:
Prepaid pension cost . . . . . . . . . . . . . . . . . . . . . . . . . . $ — $ 329.9 $ — $ — $ 2.3 $ 7.9Accrued expenses-current liability . . . . . . . . . . . . . . . . . (9.8) (9.3) — — (0.4) (0.2)Pension obligation — non-current liability . . . . . . . . . . . (498.9) (90.0) (77.4) (28.6) (35.7) (17.4)
Net (liability) prepaid recognized . . . . . . . . . . . . . . . . . $ (508.7) $ 230.6 $ (77.4) $ (28.6) $ (33.8) $ (9.7)
Other assets-intangible asset . . . . . . . . . . . . . . . . . . . . $ 35.8 $ 0.5Accumulated other comprehensive (income) loss —
before tax . . . . . . . . . . . . . . . . . . . . . . . . . . . . . . . . $ 747.5 $ 661.0 $ 43.2 $ 24.4 $ 10.9Pension obligation — additional minimum liability . . . . . $ (696.8) $(11.4)
94
NOTES TO CONSOLIDATED FINANCIAL STATEMENTS — (Continued)
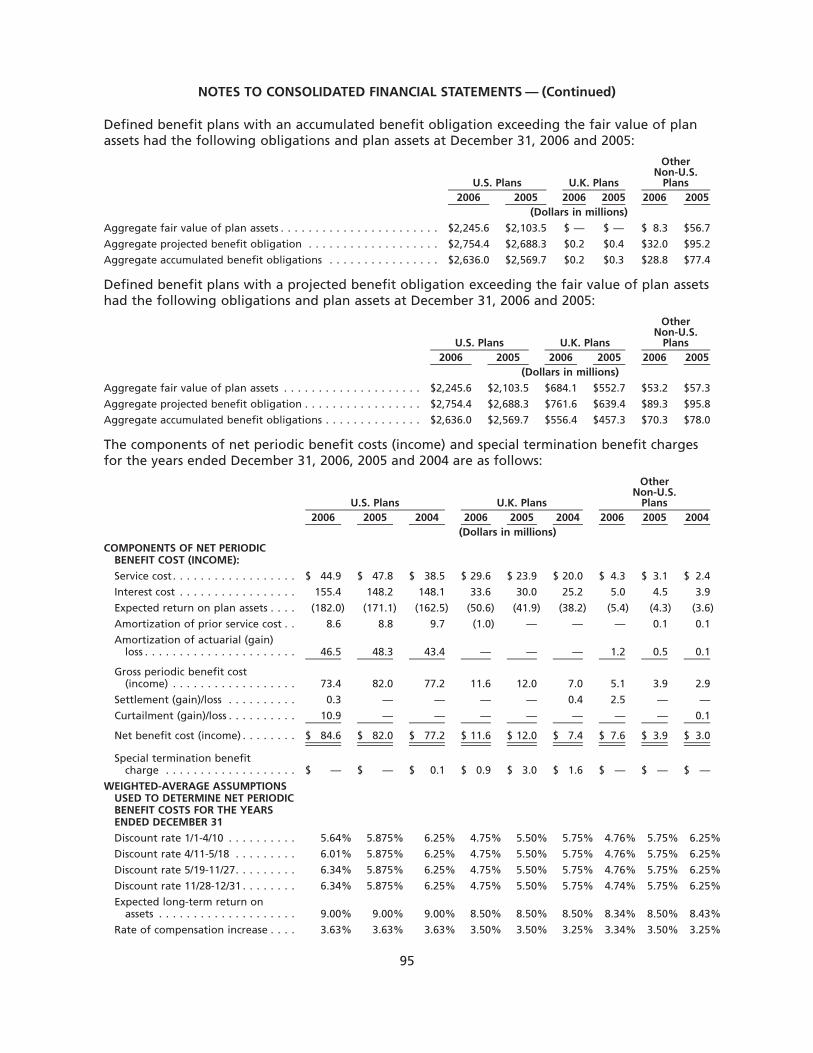
Defined benefit plans with an accumulated benefit obligation exceeding the fair value of planassets had the following obligations and plan assets at December 31, 2006 and 2005:
2006 2005 2006 2005 2006 2005U.S. Plans U.K. Plans
OtherNon-U.S.
Plans
(Dollars in millions)
Aggregate fair value of plan assets . . . . . . . . . . . . . . . . . . . . . . . $2,245.6 $2,103.5 $ — $ — $ 8.3 $56.7
Aggregate projected benefit obligation . . . . . . . . . . . . . . . . . . . $2,754.4 $2,688.3 $0.2 $0.4 $32.0 $95.2
Aggregate accumulated benefit obligations . . . . . . . . . . . . . . . . $2,636.0 $2,569.7 $0.2 $0.3 $28.8 $77.4
Defined benefit plans with a projected benefit obligation exceeding the fair value of plan assetshad the following obligations and plan assets at December 31, 2006 and 2005:
2006 2005 2006 2005 2006 2005U.S. Plans U.K. Plans
OtherNon-U.S.
Plans
(Dollars in millions)
Aggregate fair value of plan assets . . . . . . . . . . . . . . . . . . . . $2,245.6 $2,103.5 $684.1 $552.7 $53.2 $57.3
Aggregate projected benefit obligation . . . . . . . . . . . . . . . . . $2,754.4 $2,688.3 $761.6 $639.4 $89.3 $95.8
Aggregate accumulated benefit obligations . . . . . . . . . . . . . . $2,636.0 $2,569.7 $556.4 $457.3 $70.3 $78.0
The components of net periodic benefit costs (income) and special termination benefit chargesfor the years ended December 31, 2006, 2005 and 2004 are as follows:
2006 2005 2004 2006 2005 2004 2006 2005 2004U.S. Plans U.K. Plans
OtherNon-U.S.
Plans
(Dollars in millions)
COMPONENTS OF NET PERIODICBENEFIT COST (INCOME):
Service cost . . . . . . . . . . . . . . . . . . $ 44.9 $ 47.8 $ 38.5 $ 29.6 $ 23.9 $ 20.0 $ 4.3 $ 3.1 $ 2.4
Interest cost . . . . . . . . . . . . . . . . . 155.4 148.2 148.1 33.6 30.0 25.2 5.0 4.5 3.9
Expected return on plan assets . . . . (182.0) (171.1) (162.5) (50.6) (41.9) (38.2) (5.4) (4.3) (3.6)
Amortization of prior service cost . . 8.6 8.8 9.7 (1.0) — — — 0.1 0.1
Amortization of actuarial (gain)loss . . . . . . . . . . . . . . . . . . . . . . 46.5 48.3 43.4 — — — 1.2 0.5 0.1
Gross periodic benefit cost(income) . . . . . . . . . . . . . . . . . . 73.4 82.0 77.2 11.6 12.0 7.0 5.1 3.9 2.9
Settlement (gain)/loss . . . . . . . . . . 0.3 — — — — 0.4 2.5 — —
Curtailment (gain)/loss . . . . . . . . . . 10.9 — — — — — — — 0.1
Net benefit cost (income) . . . . . . . . $ 84.6 $ 82.0 $ 77.2 $ 11.6 $ 12.0 $ 7.4 $ 7.6 $ 3.9 $ 3.0
Special termination benefitcharge . . . . . . . . . . . . . . . . . . . $ — $ — $ 0.1 $ 0.9 $ 3.0 $ 1.6 $ — $ — $ —
WEIGHTED-AVERAGE ASSUMPTIONSUSED TO DETERMINE NET PERIODICBENEFIT COSTS FOR THE YEARSENDED DECEMBER 31
Discount rate 1/1-4/10 . . . . . . . . . . 5.64% 5.875% 6.25% 4.75% 5.50% 5.75% 4.76% 5.75% 6.25%
Discount rate 4/11-5/18 . . . . . . . . . 6.01% 5.875% 6.25% 4.75% 5.50% 5.75% 4.76% 5.75% 6.25%
Discount rate 5/19-11/27. . . . . . . . . 6.34% 5.875% 6.25% 4.75% 5.50% 5.75% 4.76% 5.75% 6.25%
Discount rate 11/28-12/31 . . . . . . . . 6.34% 5.875% 6.25% 4.75% 5.50% 5.75% 4.74% 5.75% 6.25%
Expected long-term return onassets . . . . . . . . . . . . . . . . . . . . 9.00% 9.00% 9.00% 8.50% 8.50% 8.50% 8.34% 8.50% 8.43%
Rate of compensation increase . . . . 3.63% 3.63% 3.63% 3.50% 3.50% 3.25% 3.34% 3.50% 3.25%
95
NOTES TO CONSOLIDATED FINANCIAL STATEMENTS — (Continued)
Two significant events occurred in the second quarter of 2006 which required remeasurement ofplan obligations and assets for the U.S. pension plans. Assumptions were reevaluated at April 11,2006 to remeasure plan obligations and assets in connection with the Company’s definitiveagreement to divest the turbomachinery products business (which agreement was subsequentlyterminated). On May 19, 2006, pension assumptions were again reevaluated to remeasure planobligations and assets due to the closure of the election period for the Retirement ChoiceProgram as described below. This change in retirement benefits resulted in a curtailment chargeof $10.9 million. The curtailment charge was based on the unrecognized prior service costattributable to the employees who elected the new arrangement.
Additionally in the U.S. non-qualified pension plans, normal lump sums retirement paymentswere made resulting in a settlement charge of $0.3 million.
In one of the Company’s Canadian pension plans, the Company completed a partial wind-up ofthe plan on November 28, 2006. This wind-up included the settlement of a portion of theobligation and resulted in a settlement charge of $2.5 million.
The special termination benefit charge in the year ended December 31, 2004 relates primarily tothe announced closure of a facility in the U.K. The special termination benefit charge in theyears ended December 31, 2006 and 2005 related primarily to reductions in force in severalbusinesses in the U.K.
U.S. Retirement Plan Changes in 2006
In the fourth quarter of 2005, the Company changed certain aspects of its U.S. qualified definedbenefit pension plan and U.S. qualified defined contribution plan. Employees hired on and afterJanuary 1, 2006, would not participate in the Company’s qualified defined benefit plan(Goodrich Employees’ Pension Plan). These new employees received a higher level of companycontribution in the Company’s qualified defined contribution plan (Goodrich Employees’ SavingsPlan). New employees will receive a dollar for dollar match on the first 6% of pay contributed,plus an automatic annual employer contribution of 2% of pay. However, this 2% employercontribution is subject to a 3-year vesting requirement.
During the second quarter of 2006, persons employed by the Company as of December 31, 2005and continuously thereafter employed, elected whether they wanted to continue with theircurrent benefits in the defined benefit and defined contribution plans or freeze pension benefitservice as of June 30, 2006 and receive a higher level of company contributions in the definedcontribution plans. For those employees choosing the latter option, eligible pay after June 30,2006 continued to be included in their final average earnings used to calculate their pensionbenefits. The Retirement Choice Program election period closed on May 19, 2006 and approx-imately 41% of the eligible employees chose the latter option with the enhanced companycontribution to the defined contribution plans.
U.K. Pension Plan Funding
A new pension funding requirement became effective in the U.K. in April 2006, although it didnot impact the Company’s contributions to the plan during 2006. Under the new requirement,the Trustees of the plan must reach agreement with the Company with respect to assumptionsused to measure plan liabilities and the period of time over which to fund deficits. TheCompany and the Trustees of the Goodrich U.K. Pension Plan have reached agreement and thefirst valuation under this new requirement will be completed in early 2007. As with thelegislative change in the U.S., the Company does not expect a material impact on the level ofcontributions that will be required to be made to the plan, other than to reduce someflexibility.
96
NOTES TO CONSOLIDATED FINANCIAL STATEMENTS — (Continued)
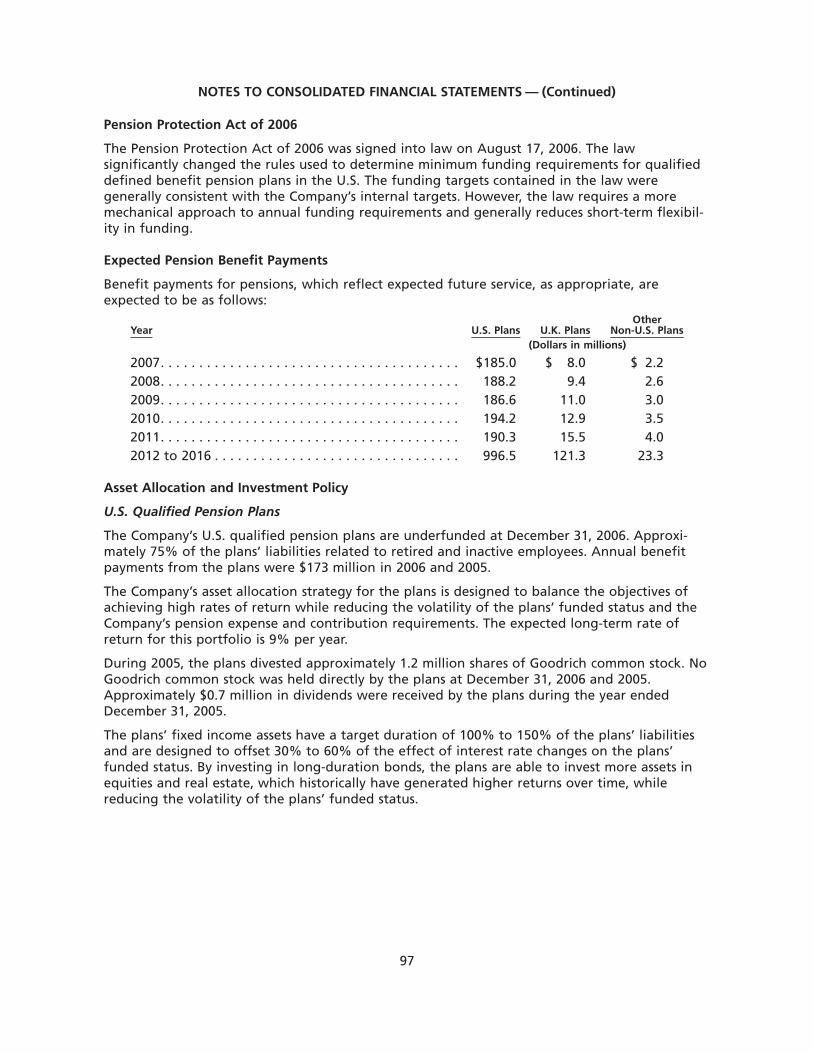
Pension Protection Act of 2006
The Pension Protection Act of 2006 was signed into law on August 17, 2006. The lawsignificantly changed the rules used to determine minimum funding requirements for qualifieddefined benefit pension plans in the U.S. The funding targets contained in the law weregenerally consistent with the Company’s internal targets. However, the law requires a moremechanical approach to annual funding requirements and generally reduces short-term flexibil-ity in funding.
Expected Pension Benefit Payments
Benefit payments for pensions, which reflect expected future service, as appropriate, areexpected to be as follows:
Year U.S. Plans U.K. PlansOther
Non-U.S. Plans(Dollars in millions)
2007. . . . . . . . . . . . . . . . . . . . . . . . . . . . . . . . . . . . . . . $185.0 $ 8.0 $ 2.22008. . . . . . . . . . . . . . . . . . . . . . . . . . . . . . . . . . . . . . . 188.2 9.4 2.62009. . . . . . . . . . . . . . . . . . . . . . . . . . . . . . . . . . . . . . . 186.6 11.0 3.02010. . . . . . . . . . . . . . . . . . . . . . . . . . . . . . . . . . . . . . . 194.2 12.9 3.52011. . . . . . . . . . . . . . . . . . . . . . . . . . . . . . . . . . . . . . . 190.3 15.5 4.02012 to 2016 . . . . . . . . . . . . . . . . . . . . . . . . . . . . . . . . 996.5 121.3 23.3
Asset Allocation and Investment Policy
U.S. Qualified Pension Plans
The Company’s U.S. qualified pension plans are underfunded at December 31, 2006. Approxi-mately 75% of the plans’ liabilities related to retired and inactive employees. Annual benefitpayments from the plans were $173 million in 2006 and 2005.
The Company’s asset allocation strategy for the plans is designed to balance the objectives ofachieving high rates of return while reducing the volatility of the plans’ funded status and theCompany’s pension expense and contribution requirements. The expected long-term rate ofreturn for this portfolio is 9% per year.
During 2005, the plans divested approximately 1.2 million shares of Goodrich common stock. NoGoodrich common stock was held directly by the plans at December 31, 2006 and 2005.Approximately $0.7 million in dividends were received by the plans during the year endedDecember 31, 2005.
The plans’ fixed income assets have a target duration of 100% to 150% of the plans’ liabilitiesand are designed to offset 30% to 60% of the effect of interest rate changes on the plans’funded status. By investing in long-duration bonds, the plans are able to invest more assets inequities and real estate, which historically have generated higher returns over time, whilereducing the volatility of the plans’ funded status.
97
NOTES TO CONSOLIDATED FINANCIAL STATEMENTS — (Continued)
The table below sets forth the U.S. Trust’s target asset allocation for 2007 and the actual assetallocations at December 31, 2006 and 2005.
Asset CategoryTarget Allocation
2007Actual Allocation
At December 31, 2006Actual Allocation
At December 31, 2005
Equities – U.S. Large Cap . . . . . 30-40% 36% 40%Equities – U.S. Mid Cap. . . . . . . 3-5% 4% 5%Equities – U.S. Small Cap . . . . . 3-5% 3% 4%Equities – International . . . . . . 10-15% 13% 14%Equities – Total . . . . . . . . . . . . . 50-60% 56% 63%Fixed Income – U.S. . . . . . . . . . 30-40% 35% 29%Real Estate . . . . . . . . . . . . . . . . 5-10% 9% 8%Cash . . . . . . . . . . . . . . . . . . . . . 0-1% 0% 0%Total . . . . . . . . . . . . . . . . . . . . . 100% 100% 100%
The majority of the assets of the portfolio are invested in U.S. and international equities, fixedincome securities and real estate, consistent with the target asset allocation, and this portion ofthe portfolio is rebalanced to the target on a periodic basis. A portion of the assets, typicallybetween 10% to 15%, is actively managed in a global tactical asset allocation strategy, whereday-to-day allocation decisions are made by the investment manager based on relative expectedreturns of stocks, bonds and cash in the U.S. and various international markets. This globaltactical asset allocation strategy also has a currency management component that is unrelatedto the asset allocation positioning of the portfolio.
Tactical changes to the duration of the fixed income portfolio are also made periodically. Theactual duration of the fixed income portfolio was approximately 13 years and 10 years atDecember 31, 2006 and 2005, respectively.
U.K. Pension Plan
The Company’s United Kingdom defined benefit pension plan consists almost entirely of activeemployees. Consequently, the primary asset allocation objective is to generate returns that, overtime, will meet the future payment obligations of the plan without requiring material levels ofcash contributions.
Since the plan’s obligations are paid in British Pounds Sterling, the plan invests approximately62% of its assets in U.K.-denominated securities. Fixed income assets have a duration of about14 years and are designed to offset approximately 10% to 15% of the effect of interest ratechanges on the plan’s funded status. The assets of the plan are rebalanced to the target on aperiodic basis.
The table below sets forth the plan’s target asset allocation for 2007 and the actual assetallocations at December 31, 2006 and 2005.
Asset CategoryTarget Allocation
2007Actual Allocation
At December 31, 2006Actual Allocation
At December 31, 2005
Equities – U.K . . . . . . . . . . . . . . 35-37.5% 43% 40%Equities – non-U.K . . . . . . . . . . 35-37.5% 37% 38%Equities – Total . . . . . . . . . . . . . 70-75% 80% 78%Fixed Income – U.K . . . . . . . . . . 25-30% 20% 22%Total . . . . . . . . . . . . . . . . . . . . . 100% 100% 100%
98
NOTES TO CONSOLIDATED FINANCIAL STATEMENTS — (Continued)
Assumptions
U.S. Qualified Pension Plans
The U.S. discount rate determined at December 31, 2006 and 2005 was based on a customizedyield curve approach. The Company’s pension and postretirement benefit payment cash flowswere each plotted against a U.S. yield curve composed of a large, diverse group of Aa-ratedcorporate bonds. The resulting discount rates were used to determine the benefit obligations asof December 31, 2006 and 2005.
The long-term asset return assumption for the U.S. plans is 9%. This assumption is based on ananalysis of historical returns for equity, fixed income and real estate markets and the Company’sportfolio allocation as of December 31, 2006. Equity returns were determined by analysis ofhistorical benchmark market data through 2005. Returns in each class of equity were developedfrom up to 79 years of historical data. The weighted average return of all equity classes was11.2%. Real estate returns were determined using the ten year historical average returns for theprimary real estate fund in the U.S. Trust. The resulting return was 13.4%. The return estimatefor the fixed income portion of the trust portfolio is based on the average yield to maturity ofthe assets as of December 1, 2006 and was 5.3%. The fixed income portion of the portfolio isbased on a long duration strategy. As a result, the yield on this portfolio may be higher thanthat of the typical fixed income portfolio in a normal yield curve environment.
The RP2000 mortality table with projected improvements for life expectancy through the year2015 was used for determination of the benefit obligations as of December 31, 2006. The RP2000mortality table was used for determination of the benefit obligations as of December 31, 2005.
U.K. Pension Plan
The Company has changed from a discount rate benchmarked to the iBoxx AA long-term highquality bond rate, which was used to determine the benefit obligations as of December 31,2005. For December 31, 2006 the discount rate was determined based on cash flows from abenchmark plan with similar duration plotted against a yield curve. The Company’s U.K. pensioncash flows were each plotted against a yield curve composed of a large, diverse group of Aa-rated corporate bonds.
The long-term asset return assumption for the plan is 8.5%. This assumption is based on ananalysis of historical returns for equity and fixed income securities denominated in BritishPounds Sterling. Equity returns were determined by analysis of historical benchmark marketdata through 2005 based on 18 years of historical data. The weighted average return wasapproximately 10.9%. The return estimate for the fixed income portion of the portfolio is basedon the average yield to maturity of the assets as of December 1, 2006 of approximately 4.4%.
Anticipated Contributions to Defined Benefit Plans and Trusts
During 2007, the Company expects to contribute $100 million to $125 million to its worldwidequalified and non-qualified pension plans.
U.S. Non-Qualified Pension Plan Funding
The Company maintains non-qualified pension plans in the U.S. to accrue retirement benefits inexcess of Internal Revenue Code limitations and other contractual obligations. As of December 31,2006 and December 31, 2005, respectively, $72 million and $74 million fair market value of assetswere held in a rabbi trust for payment of future non-qualified pension benefits for certain retired,terminated and active employees. The assets consist of the cash surrender value of split dollar lifeinsurance policies, equities, fixed income securities and cash. The assets of the rabbi trust, which donot qualify as plan assets and, therefore, are not included in the tables in this note, are available topay pension benefits to these individuals but are otherwise unavailable to the Company. The assets,
99
NOTES TO CONSOLIDATED FINANCIAL STATEMENTS — (Continued)

other than approximately $32 million and $33 million as of December 31, 2006 and December 31,2005, respectively, which are assigned to certain individuals if benefit payments to these individualsare not made when due, are available to the Company’s general creditors in the event of insolvency.
Defined Contribution Plans
In the U.S., the Company also maintains voluntary U.S. retirement savings plans for salaried andwage employees. Refer to “U.S. Retirement Plan Changes in 2006.” For the years ended Decem-ber 31, 2006, 2005 and 2004, the cost was $31.9 million, $21.9 million and $20.1 million respectively.Company contributions include amounts related to employees of discontinued operations.
The Company also maintains defined contribution retirement plans for certain non-U.S. subsidiar-ies. For the years ended December 31, 2006, 2005 and 2004 the Company’s contributions were$2.8 million, $2.5 million and $2.4 million, respectively.
Postretirement Benefits Other Than Pensions
The following table sets forth the status of the Company’s defined benefit postretirement plansas of December 31, 2006 and 2005, and the amounts recorded in the Company’s ConsolidatedBalance Sheet. The postretirement benefits related to divested and discontinued operationsretained by the Company are included in the amounts below.
2006 2005(Dollars in millions)
Change in Projected Benefit ObligationsProjected benefit obligation at beginning of year . . . . . . . . . . . . . . $ 404.1 $ 431.2Service cost . . . . . . . . . . . . . . . . . . . . . . . . . . . . . . . . . . . . . . . . . . . . . 1.8 1.7Interest cost . . . . . . . . . . . . . . . . . . . . . . . . . . . . . . . . . . . . . . . . . . . . 20.8 22.7Amendments . . . . . . . . . . . . . . . . . . . . . . . . . . . . . . . . . . . . . . . . . . . 0.1 —Actuarial (gains) losses . . . . . . . . . . . . . . . . . . . . . . . . . . . . . . . . . . . . 25.5 (16.0)Other(1) . . . . . . . . . . . . . . . . . . . . . . . . . . . . . . . . . . . . . . . . . . . . . . . (4.2) —Benefits paid . . . . . . . . . . . . . . . . . . . . . . . . . . . . . . . . . . . . . . . . . . . (32.0) (35.5)
Projected benefit obligation at end of year . . . . . . . . . . . . . . . . . . . $ 416.1 $ 404.1
Weighted-Average Assumptions used to Determine BenefitObligations as of December 31Discount rate . . . . . . . . . . . . . . . . . . . . . . . . . . . . . . . . . . . . . . . . . . . 5.79% 5.55%
Change in Plan AssetsFair value of plan assets at beginning of year. . . . . . . . . . . . . . . . . . $ — $ —Company contributions . . . . . . . . . . . . . . . . . . . . . . . . . . . . . . . . . . . 32.0 35.5Benefits paid . . . . . . . . . . . . . . . . . . . . . . . . . . . . . . . . . . . . . . . . . . . (32.0) (35.5)
Fair value of plan assets at end of year . . . . . . . . . . . . . . . . . . . . . . . $ — $ —
Funded Status (Underfunded) . . . . . . . . . . . . . . . . . . . . . . . . . . . . . . . $(416.1) $ 404.1
Unrecognized net actuarial (gain)/loss . . . . . . . . . . . . . . . . . . . . . . . 67.8Unrecognized prior service cost. . . . . . . . . . . . . . . . . . . . . . . . . . . . . (0.5)
Net amount recognized . . . . . . . . . . . . . . . . . . . . . . . . . . . . . . . . . . . $(336.8)
Amounts Recognized in the Balance Sheet Consist of:Accrued expenses — current liability . . . . . . . . . . . . . . . . . . . . . . . . . $ (37.0) $ (36.8)Postretirement benefits other than pensions — non-current
liability . . . . . . . . . . . . . . . . . . . . . . . . . . . . . . . . . . . . . . . . . . . . . . (379.1) (300.0)
Net liability recognized . . . . . . . . . . . . . . . . . . . . . . . . . . . . . . . . . . . $(416.1) $(336.8)
Accumulated other comprehensive (income) loss — before tax . . . . $ 90.3
100
NOTES TO CONSOLIDATED FINANCIAL STATEMENTS — (Continued)
For measurement purposes, a 9% annual rate of increase in the per capita cost of coveredhealth care benefits was assumed for 2007. The rate was assumed to decrease gradually to 5%in 2013 and remain at that level thereafter.
2006 2005 2004
For the Year EndedDecember 31,
(Dollars in millions)
Components of Net Periodic Benefit Cost (Income):Service cost . . . . . . . . . . . . . . . . . . . . . . . . . . . . . . . . . . . . . . . . $ 1.8 $ 1.7 $ 1.4Interest cost . . . . . . . . . . . . . . . . . . . . . . . . . . . . . . . . . . . . . . . 20.9 22.7 25.0Amortization of prior service cost . . . . . . . . . . . . . . . . . . . . . . (0.2) (0.2) (0.1)Recognized net actuarial (gain) Loss . . . . . . . . . . . . . . . . . . . . 2.7 1.4 1.9
Periodic benefit cost (income) . . . . . . . . . . . . . . . . . . . . . . . . . 25.2 25.6 28.2Settlement (gain)/loss . . . . . . . . . . . . . . . . . . . . . . . . . . . . . . . . — — —Curtailment (gain)/loss . . . . . . . . . . . . . . . . . . . . . . . . . . . . . . . — — —
Net benefit cost (income)(1). . . . . . . . . . . . . . . . . . . . . . . . . . . $25.2 $ 25.6 $28.2
Weighted-Average Assumptions used to Determine NetPeriodic Benefit CostDiscount rate . . . . . . . . . . . . . . . . . . . . . . . . . . . . . . . . . . . . . . 5.55% 5.875% 6.25%
(1) The “Other” line item of $4.2 million in the change in projected benefit obligation includesrevisions in the plan provisions used in the actuarial valuation of other postretirement bene-fits related to the acquisition of the aeronautical systems business. The net periodic benefitcost for the year ended December 31, 2006 includes a non-recurring reduction of $3.2 millionfor the revision. The $3.2 million reduction of net periodic benefit cost consists of $0.4 mil-lion reduction to service cost, $1.2 million reduction to interest cost and $1.6 million reduc-tion to the amortization of actuarial (gains) losses.
The table below quantifies the impact of a one-percentage point change in the assumed healthcare cost trend rate.
One PercentagePoint
Increase
One PercentagePoint
Decrease(Dollars in millions)
Increase (Decrease) inTotal of service and interest cost components in 2006 . . . . $ 1.6 $ (1.4)Accumulated postretirement benefit obligation as of
December 31, 2006. . . . . . . . . . . . . . . . . . . . . . . . . . . . . . $29.5 $(26.0)
101
NOTES TO CONSOLIDATED FINANCIAL STATEMENTS — (Continued)
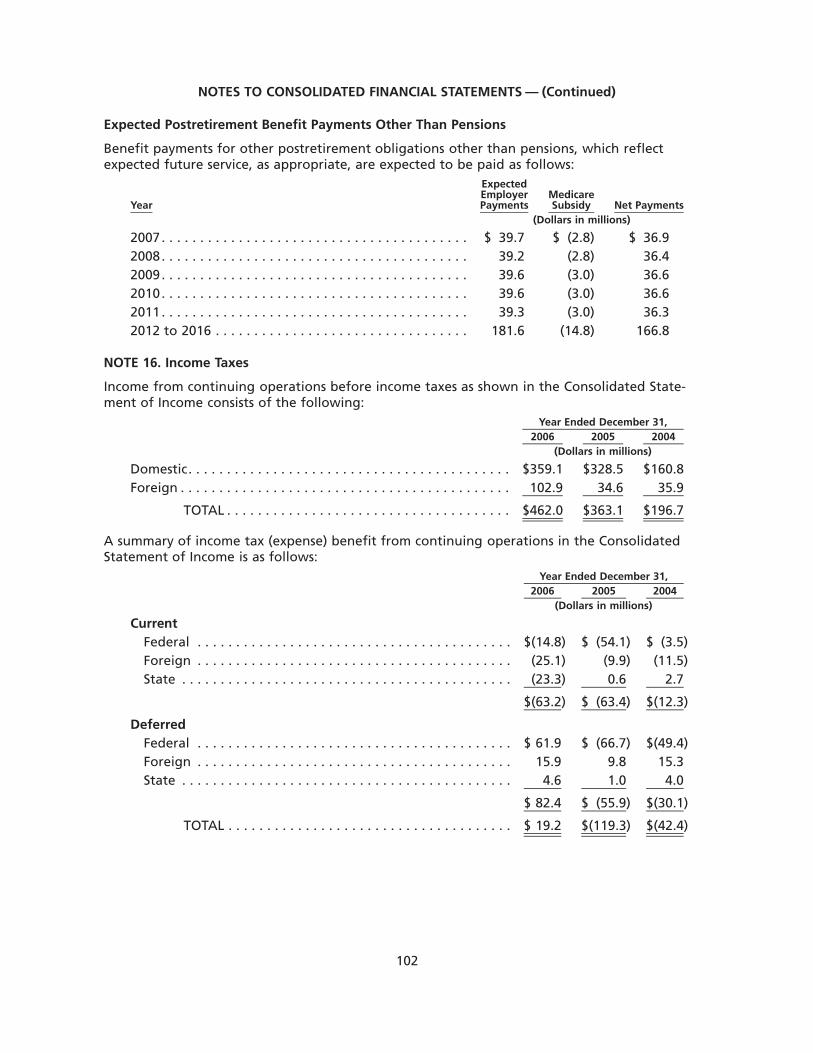
Expected Postretirement Benefit Payments Other Than Pensions
Benefit payments for other postretirement obligations other than pensions, which reflectexpected future service, as appropriate, are expected to be paid as follows:
Year
ExpectedEmployerPayments
MedicareSubsidy Net Payments
(Dollars in millions)
2007. . . . . . . . . . . . . . . . . . . . . . . . . . . . . . . . . . . . . . . . $ 39.7 $ (2.8) $ 36.92008. . . . . . . . . . . . . . . . . . . . . . . . . . . . . . . . . . . . . . . . 39.2 (2.8) 36.42009. . . . . . . . . . . . . . . . . . . . . . . . . . . . . . . . . . . . . . . . 39.6 (3.0) 36.62010. . . . . . . . . . . . . . . . . . . . . . . . . . . . . . . . . . . . . . . . 39.6 (3.0) 36.62011. . . . . . . . . . . . . . . . . . . . . . . . . . . . . . . . . . . . . . . . 39.3 (3.0) 36.32012 to 2016 . . . . . . . . . . . . . . . . . . . . . . . . . . . . . . . . . 181.6 (14.8) 166.8
NOTE 16. Income Taxes
Income from continuing operations before income taxes as shown in the Consolidated State-ment of Income consists of the following:
2006 2005 2004Year Ended December 31,
(Dollars in millions)
Domestic. . . . . . . . . . . . . . . . . . . . . . . . . . . . . . . . . . . . . . . . . . $359.1 $328.5 $160.8Foreign . . . . . . . . . . . . . . . . . . . . . . . . . . . . . . . . . . . . . . . . . . . 102.9 34.6 35.9
TOTAL . . . . . . . . . . . . . . . . . . . . . . . . . . . . . . . . . . . . . $462.0 $363.1 $196.7
A summary of income tax (expense) benefit from continuing operations in the ConsolidatedStatement of Income is as follows:
2006 2005 2004Year Ended December 31,
(Dollars in millions)
CurrentFederal . . . . . . . . . . . . . . . . . . . . . . . . . . . . . . . . . . . . . . . . . $(14.8) $ (54.1) $ (3.5)Foreign . . . . . . . . . . . . . . . . . . . . . . . . . . . . . . . . . . . . . . . . . (25.1) (9.9) (11.5)State . . . . . . . . . . . . . . . . . . . . . . . . . . . . . . . . . . . . . . . . . . . (23.3) 0.6 2.7
$(63.2) $ (63.4) $(12.3)
DeferredFederal . . . . . . . . . . . . . . . . . . . . . . . . . . . . . . . . . . . . . . . . . $ 61.9 $ (66.7) $(49.4)Foreign . . . . . . . . . . . . . . . . . . . . . . . . . . . . . . . . . . . . . . . . . 15.9 9.8 15.3State . . . . . . . . . . . . . . . . . . . . . . . . . . . . . . . . . . . . . . . . . . . 4.6 1.0 4.0
$ 82.4 $ (55.9) $(30.1)
TOTAL . . . . . . . . . . . . . . . . . . . . . . . . . . . . . . . . . . . . . $ 19.2 $(119.3) $(42.4)
102
NOTES TO CONSOLIDATED FINANCIAL STATEMENTS — (Continued)
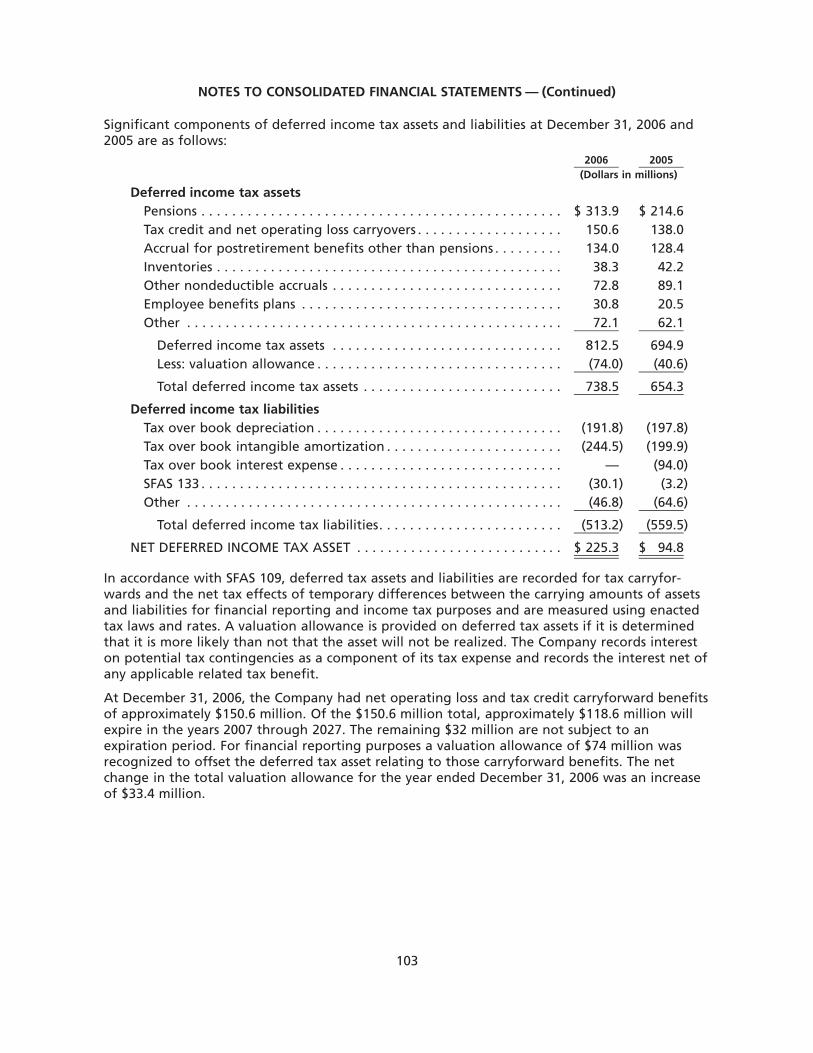
Significant components of deferred income tax assets and liabilities at December 31, 2006 and2005 are as follows:
2006 2005(Dollars in millions)
Deferred income tax assetsPensions . . . . . . . . . . . . . . . . . . . . . . . . . . . . . . . . . . . . . . . . . . . . . . . $ 313.9 $ 214.6Tax credit and net operating loss carryovers . . . . . . . . . . . . . . . . . . . 150.6 138.0Accrual for postretirement benefits other than pensions . . . . . . . . . 134.0 128.4Inventories . . . . . . . . . . . . . . . . . . . . . . . . . . . . . . . . . . . . . . . . . . . . . 38.3 42.2Other nondeductible accruals . . . . . . . . . . . . . . . . . . . . . . . . . . . . . . 72.8 89.1Employee benefits plans . . . . . . . . . . . . . . . . . . . . . . . . . . . . . . . . . . 30.8 20.5Other . . . . . . . . . . . . . . . . . . . . . . . . . . . . . . . . . . . . . . . . . . . . . . . . . 72.1 62.1
Deferred income tax assets . . . . . . . . . . . . . . . . . . . . . . . . . . . . . . 812.5 694.9Less: valuation allowance . . . . . . . . . . . . . . . . . . . . . . . . . . . . . . . . (74.0) (40.6)
Total deferred income tax assets . . . . . . . . . . . . . . . . . . . . . . . . . . 738.5 654.3
Deferred income tax liabilitiesTax over book depreciation . . . . . . . . . . . . . . . . . . . . . . . . . . . . . . . . (191.8) (197.8)Tax over book intangible amortization . . . . . . . . . . . . . . . . . . . . . . . (244.5) (199.9)Tax over book interest expense . . . . . . . . . . . . . . . . . . . . . . . . . . . . . — (94.0)SFAS 133 . . . . . . . . . . . . . . . . . . . . . . . . . . . . . . . . . . . . . . . . . . . . . . . (30.1) (3.2)Other . . . . . . . . . . . . . . . . . . . . . . . . . . . . . . . . . . . . . . . . . . . . . . . . . (46.8) (64.6)
Total deferred income tax liabilities. . . . . . . . . . . . . . . . . . . . . . . . (513.2) (559.5)
NET DEFERRED INCOME TAX ASSET . . . . . . . . . . . . . . . . . . . . . . . . . . . $ 225.3 $ 94.8
In accordance with SFAS 109, deferred tax assets and liabilities are recorded for tax carryfor-wards and the net tax effects of temporary differences between the carrying amounts of assetsand liabilities for financial reporting and income tax purposes and are measured using enactedtax laws and rates. A valuation allowance is provided on deferred tax assets if it is determinedthat it is more likely than not that the asset will not be realized. The Company records intereston potential tax contingencies as a component of its tax expense and records the interest net ofany applicable related tax benefit.
At December 31, 2006, the Company had net operating loss and tax credit carryforward benefitsof approximately $150.6 million. Of the $150.6 million total, approximately $118.6 million willexpire in the years 2007 through 2027. The remaining $32 million are not subject to anexpiration period. For financial reporting purposes a valuation allowance of $74 million wasrecognized to offset the deferred tax asset relating to those carryforward benefits. The netchange in the total valuation allowance for the year ended December 31, 2006 was an increaseof $33.4 million.
103
NOTES TO CONSOLIDATED FINANCIAL STATEMENTS — (Continued)
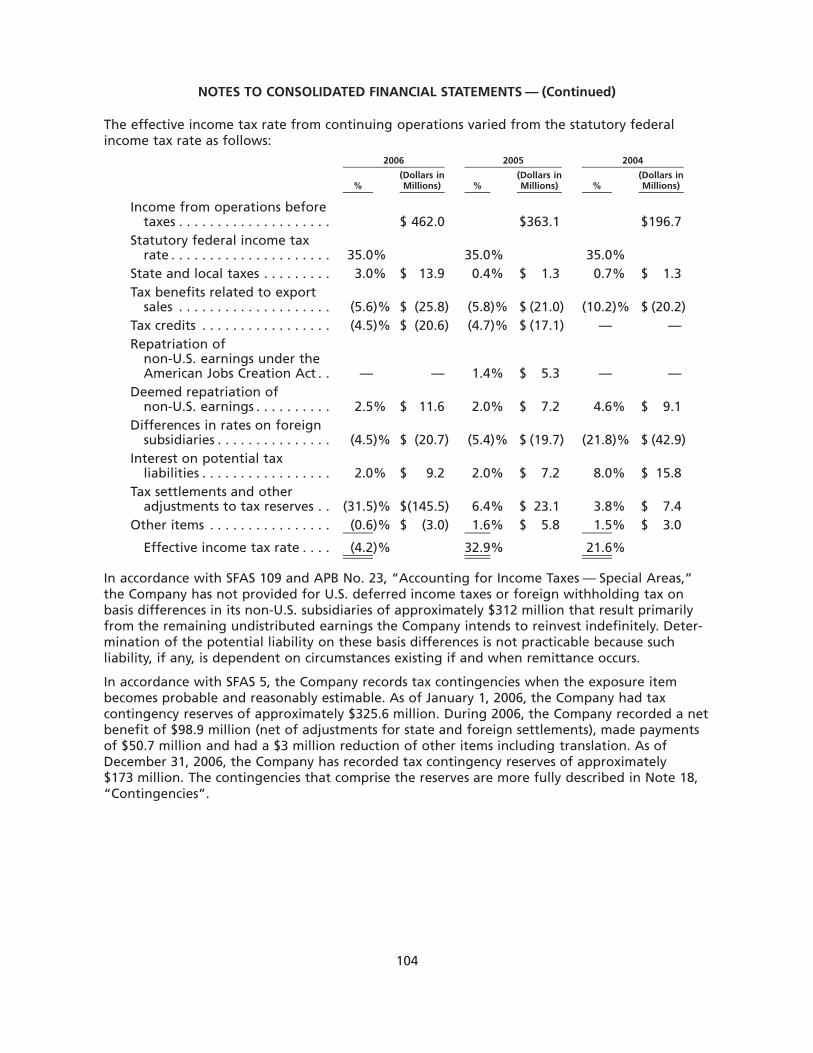
The effective income tax rate from continuing operations varied from the statutory federalincome tax rate as follows:
%(Dollars inMillions) %
(Dollars inMillions) %
(Dollars inMillions)
2006 2005 2004
Income from operations beforetaxes . . . . . . . . . . . . . . . . . . . . $ 462.0 $363.1 $196.7
Statutory federal income taxrate . . . . . . . . . . . . . . . . . . . . . 35.0% 35.0% 35.0%
State and local taxes . . . . . . . . . 3.0% $ 13.9 0.4% $ 1.3 0.7% $ 1.3Tax benefits related to export
sales . . . . . . . . . . . . . . . . . . . . (5.6)% $ (25.8) (5.8)% $ (21.0) (10.2)% $ (20.2)Tax credits . . . . . . . . . . . . . . . . . (4.5)% $ (20.6) (4.7)% $ (17.1) — —Repatriation of
non-U.S. earnings under theAmerican Jobs Creation Act . . — — 1.4% $ 5.3 — —
Deemed repatriation ofnon-U.S. earnings . . . . . . . . . . 2.5% $ 11.6 2.0% $ 7.2 4.6% $ 9.1
Differences in rates on foreignsubsidiaries . . . . . . . . . . . . . . . (4.5)% $ (20.7) (5.4)% $ (19.7) (21.8)% $ (42.9)
Interest on potential taxliabilities . . . . . . . . . . . . . . . . . 2.0% $ 9.2 2.0% $ 7.2 8.0% $ 15.8
Tax settlements and otheradjustments to tax reserves . . (31.5)% $(145.5) 6.4% $ 23.1 3.8% $ 7.4
Other items . . . . . . . . . . . . . . . . (0.6)% $ (3.0) 1.6% $ 5.8 1.5% $ 3.0
Effective income tax rate . . . . (4.2)% 32.9% 21.6%
In accordance with SFAS 109 and APB No. 23, “Accounting for Income Taxes — Special Areas,”the Company has not provided for U.S. deferred income taxes or foreign withholding tax onbasis differences in its non-U.S. subsidiaries of approximately $312 million that result primarilyfrom the remaining undistributed earnings the Company intends to reinvest indefinitely. Deter-mination of the potential liability on these basis differences is not practicable because suchliability, if any, is dependent on circumstances existing if and when remittance occurs.
In accordance with SFAS 5, the Company records tax contingencies when the exposure itembecomes probable and reasonably estimable. As of January 1, 2006, the Company had taxcontingency reserves of approximately $325.6 million. During 2006, the Company recorded a netbenefit of $98.9 million (net of adjustments for state and foreign settlements), made paymentsof $50.7 million and had a $3 million reduction of other items including translation. As ofDecember 31, 2006, the Company has recorded tax contingency reserves of approximately$173 million. The contingencies that comprise the reserves are more fully described in Note 18,“Contingencies”.
104
NOTES TO CONSOLIDATED FINANCIAL STATEMENTS — (Continued)

Note 17. Supplemental Balance Sheet Information
As of December 31, balances for the accounts receivable allowance for doubtful accounts wereas follows:
BalanceBeginning
of Year
Chargedto
Expense
ForeignCurrency
Translationand Other
Write-Offof Doubtful
Accounts
Balanceat endof Year
(Dollars in millions)
Receivable AllowanceShort-Term . . . . . . . . . . . . . . . . . . . $23.5 $1.9 $ 0.6 $ (6.2) $19.8Long-Term(1) . . . . . . . . . . . . . . . . . 30.9 — — (1.7) 29.2
Year ended December 31, 2006 . . $54.4 $1.9 $ 0.6 $ (7.9) $49.0
Short-Term . . . . . . . . . . . . . . . . . . . $21.8 $6.2 $(0.2) $ (4.3) $23.5Long-Term(1) . . . . . . . . . . . . . . . . . 30.9 — — — 30.9
Year ended December 31, 2005 . . $52.7 $6.2 $(0.2) $ (4.3) $54.4
Short-Term . . . . . . . . . . . . . . . . . . . $27.9 $5.7 $ — $(11.8) $21.8Long-Term(1) . . . . . . . . . . . . . . . . . 65.7 — — (34.8) 30.9
Year ended December 31, 2004 . . $93.6 $5.7 $ — $(46.6) $52.7
(1) Long-term allowance is related to the Company’s notes receivable in other assets from areceivable obligor.
As of December 31, balances for property, plant and equipment and allowances for depreciationwere as follows:
2006 2005(Dollars in millions)
Property, Plant and Equipment-netLand . . . . . . . . . . . . . . . . . . . . . . . . . . . . . . . . . . . . . . . . . . . . . . . . . $ 72.9 $ 70.0Buildings and improvements . . . . . . . . . . . . . . . . . . . . . . . . . . . . . . 737.5 690.0Machinery and equipment . . . . . . . . . . . . . . . . . . . . . . . . . . . . . . . 1,819.8 1,591.4Construction in progress . . . . . . . . . . . . . . . . . . . . . . . . . . . . . . . . . 168.5 178.9
2,798.7 2,530.3Less allowances for depreciation. . . . . . . . . . . . . . . . . . . . . . . . . . . (1,471.0) (1,336.0)
TOTAL . . . . . . . . . . . . . . . . . . . . . . . . . . . . . . . . . . . . . . . . . . . . . . . $ 1,327.7 $ 1,194.3
Property included assets acquired under capital leases, principally buildings, machinery andequipment of $23.1 million and $21.9 million at December 31, 2006 and 2005, respectively.Related allowances for depreciation were $8.5 million and $7.2 million at December 31, 2006and 2005, respectively. Depreciation expense totaled $167.9 million, $158.7 million and$162.3 million during the years ended December 31, 2006, 2005 and 2004, respectively. Interestcosts capitalized during 2006, 2005 and 2004 from continuing operations totaled $4.6 million,$1.4 million and $0.5 million, respectively.
105
NOTES TO CONSOLIDATED FINANCIAL STATEMENTS — (Continued)
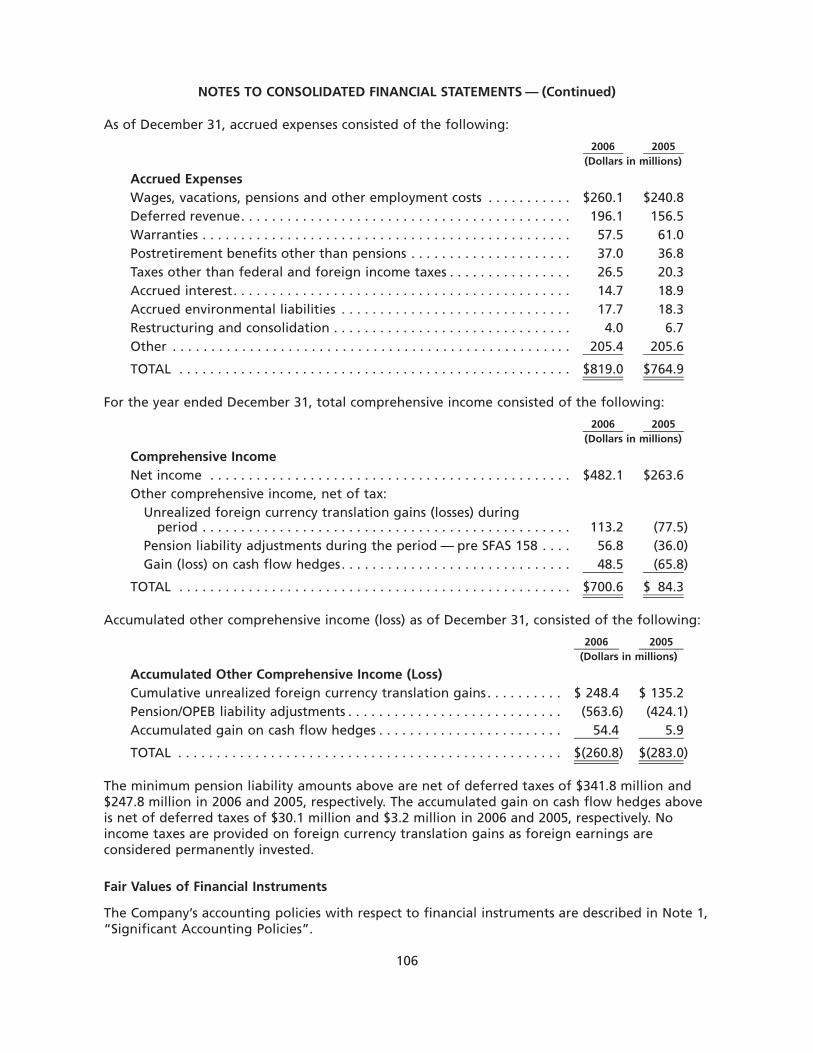
As of December 31, accrued expenses consisted of the following:
2006 2005(Dollars in millions)
Accrued ExpensesWages, vacations, pensions and other employment costs . . . . . . . . . . . $260.1 $240.8Deferred revenue. . . . . . . . . . . . . . . . . . . . . . . . . . . . . . . . . . . . . . . . . . . 196.1 156.5Warranties . . . . . . . . . . . . . . . . . . . . . . . . . . . . . . . . . . . . . . . . . . . . . . . . 57.5 61.0Postretirement benefits other than pensions . . . . . . . . . . . . . . . . . . . . . 37.0 36.8Taxes other than federal and foreign income taxes . . . . . . . . . . . . . . . . 26.5 20.3Accrued interest. . . . . . . . . . . . . . . . . . . . . . . . . . . . . . . . . . . . . . . . . . . . 14.7 18.9Accrued environmental liabilities . . . . . . . . . . . . . . . . . . . . . . . . . . . . . . 17.7 18.3Restructuring and consolidation . . . . . . . . . . . . . . . . . . . . . . . . . . . . . . . 4.0 6.7Other . . . . . . . . . . . . . . . . . . . . . . . . . . . . . . . . . . . . . . . . . . . . . . . . . . . . 205.4 205.6
TOTAL . . . . . . . . . . . . . . . . . . . . . . . . . . . . . . . . . . . . . . . . . . . . . . . . . . . $819.0 $764.9
For the year ended December 31, total comprehensive income consisted of the following:
2006 2005(Dollars in millions)
Comprehensive IncomeNet income . . . . . . . . . . . . . . . . . . . . . . . . . . . . . . . . . . . . . . . . . . . . . . . $482.1 $263.6Other comprehensive income, net of tax:
Unrealized foreign currency translation gains (losses) duringperiod . . . . . . . . . . . . . . . . . . . . . . . . . . . . . . . . . . . . . . . . . . . . . . . . 113.2 (77.5)
Pension liability adjustments during the period — pre SFAS 158 . . . . 56.8 (36.0)Gain (loss) on cash flow hedges. . . . . . . . . . . . . . . . . . . . . . . . . . . . . . 48.5 (65.8)
TOTAL . . . . . . . . . . . . . . . . . . . . . . . . . . . . . . . . . . . . . . . . . . . . . . . . . . . $700.6 $ 84.3
Accumulated other comprehensive income (loss) as of December 31, consisted of the following:
2006 2005(Dollars in millions)
Accumulated Other Comprehensive Income (Loss)Cumulative unrealized foreign currency translation gains. . . . . . . . . . $ 248.4 $ 135.2Pension/OPEB liability adjustments . . . . . . . . . . . . . . . . . . . . . . . . . . . . (563.6) (424.1)Accumulated gain on cash flow hedges . . . . . . . . . . . . . . . . . . . . . . . . 54.4 5.9
TOTAL . . . . . . . . . . . . . . . . . . . . . . . . . . . . . . . . . . . . . . . . . . . . . . . . . . $(260.8) $(283.0)
The minimum pension liability amounts above are net of deferred taxes of $341.8 million and$247.8 million in 2006 and 2005, respectively. The accumulated gain on cash flow hedges aboveis net of deferred taxes of $30.1 million and $3.2 million in 2006 and 2005, respectively. Noincome taxes are provided on foreign currency translation gains as foreign earnings areconsidered permanently invested.
Fair Values of Financial Instruments
The Company’s accounting policies with respect to financial instruments are described in Note 1,“Significant Accounting Policies”.
106
NOTES TO CONSOLIDATED FINANCIAL STATEMENTS — (Continued)
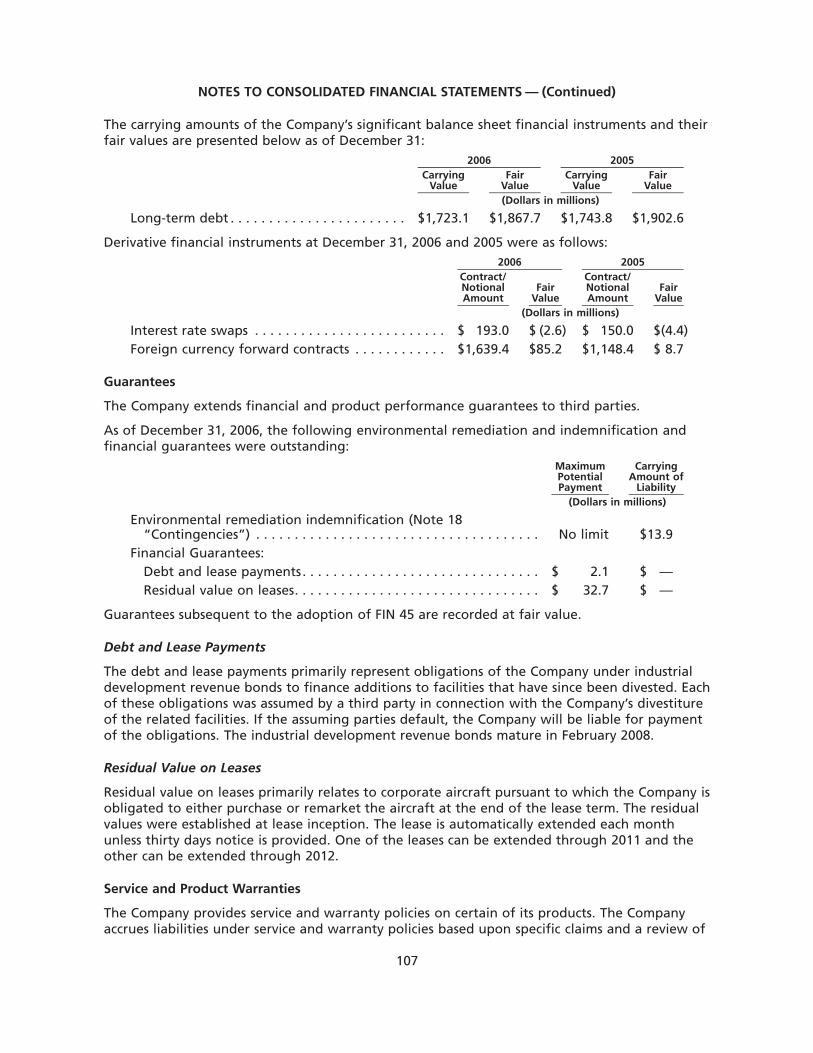
The carrying amounts of the Company’s significant balance sheet financial instruments and theirfair values are presented below as of December 31:
CarryingValue
FairValue
CarryingValue
FairValue
2006 2005
(Dollars in millions)
Long-term debt . . . . . . . . . . . . . . . . . . . . . . . $1,723.1 $1,867.7 $1,743.8 $1,902.6
Derivative financial instruments at December 31, 2006 and 2005 were as follows:
Contract/NotionalAmount
FairValue
Contract/NotionalAmount
FairValue
2006 2005
(Dollars in millions)
Interest rate swaps . . . . . . . . . . . . . . . . . . . . . . . . . $ 193.0 $ (2.6) $ 150.0 $(4.4)Foreign currency forward contracts . . . . . . . . . . . . $1,639.4 $85.2 $1,148.4 $ 8.7
Guarantees
The Company extends financial and product performance guarantees to third parties.
As of December 31, 2006, the following environmental remediation and indemnification andfinancial guarantees were outstanding:
MaximumPotentialPayment
CarryingAmount of
Liability(Dollars in millions)
Environmental remediation indemnification (Note 18“Contingencies”) . . . . . . . . . . . . . . . . . . . . . . . . . . . . . . . . . . . . . No limit $13.9
Financial Guarantees:Debt and lease payments. . . . . . . . . . . . . . . . . . . . . . . . . . . . . . . $ 2.1 $ —Residual value on leases. . . . . . . . . . . . . . . . . . . . . . . . . . . . . . . . $ 32.7 $ —
Guarantees subsequent to the adoption of FIN 45 are recorded at fair value.
Debt and Lease Payments
The debt and lease payments primarily represent obligations of the Company under industrialdevelopment revenue bonds to finance additions to facilities that have since been divested. Eachof these obligations was assumed by a third party in connection with the Company’s divestitureof the related facilities. If the assuming parties default, the Company will be liable for paymentof the obligations. The industrial development revenue bonds mature in February 2008.
Residual Value on Leases
Residual value on leases primarily relates to corporate aircraft pursuant to which the Company isobligated to either purchase or remarket the aircraft at the end of the lease term. The residualvalues were established at lease inception. The lease is automatically extended each monthunless thirty days notice is provided. One of the leases can be extended through 2011 and theother can be extended through 2012.
Service and Product Warranties
The Company provides service and warranty policies on certain of its products. The Companyaccrues liabilities under service and warranty policies based upon specific claims and a review of
107
NOTES TO CONSOLIDATED FINANCIAL STATEMENTS — (Continued)

historical warranty and service claim experience in accordance with SFAS 5. Adjustments aremade to accruals as claim data and historical experience change. In addition, the Companyincurs discretionary costs to service its products in connection with product performance issues.
The changes in the carrying amount of service and product warranties, in millions of dollars, areas follows:
Balance at December 31, 2004 . . . . . . . . . . . . . . . . . . . . . . . . . . . . . . . . . . . . . . . . $165.8Net provisions for warranties issued during the year . . . . . . . . . . . . . . . . . . . . . 58.1Net provisions for warranties existing at the beginning of the year . . . . . . . . . 0.6Payments . . . . . . . . . . . . . . . . . . . . . . . . . . . . . . . . . . . . . . . . . . . . . . . . . . . . . . . (54.4)Foreign currency translation . . . . . . . . . . . . . . . . . . . . . . . . . . . . . . . . . . . . . . . . (7.7)
Balance at December 31, 2005 . . . . . . . . . . . . . . . . . . . . . . . . . . . . . . . . . . . . . . . . 162.4Net provisions for warranties issued during the year . . . . . . . . . . . . . . . . . . . . . 49.5Net (benefit) provisions for warranties existing at the beginning of the year. . (1.5)Payments . . . . . . . . . . . . . . . . . . . . . . . . . . . . . . . . . . . . . . . . . . . . . . . . . . . . . . . (60.3)Foreign currency translation . . . . . . . . . . . . . . . . . . . . . . . . . . . . . . . . . . . . . . . . 10.2
Balance at December 31, 2006 . . . . . . . . . . . . . . . . . . . . . . . . . . . . . . . . . . . . . . . . $160.3
As of December 31, the current and long-term portions of service and product warranties wereas follows:
2006 2005(Dollars in millions)
Short-term liabilities . . . . . . . . . . . . . . . . . . . . . . . . . . . . . . . . . . . . . . . . $ 57.5 $ 61.0Long-term liabilities . . . . . . . . . . . . . . . . . . . . . . . . . . . . . . . . . . . . . . . . . 102.8 101.4
TOTAL . . . . . . . . . . . . . . . . . . . . . . . . . . . . . . . . . . . . . . . . . . . . . . . . . . . $160.3 $162.4
Note 18. Contingencies
General
There are pending or threatened against the Company or its subsidiaries various claims, lawsuitsand administrative proceedings, arising from the ordinary course of business, including commer-cial, product liability, asbestos and environmental matters, which seek remedies or damages.Although no assurance can be given with respect to the ultimate outcome of these matters, theCompany believes that any liability that may finally be determined with respect to commercialand non-asbestos product liability claims should not have a material effect on its consolidatedfinancial position, results of operations or cash flow. From time to time, the Company is alsoinvolved in legal proceedings as a plaintiff involving tax, contract, patent protection, environ-mental and other matters. Gain contingencies, if any, are recognized when they are realized.Legal costs are generally expensed as incurred.
Environmental
The Company is subject to various domestic and international environmental laws and regula-tions which may require that we investigate and remediate the effects of the release or disposalof materials at sites associated with past and present operations, including divested sites forwhich the Company has contractual obligations relating to the environmental conditions of suchsite. At certain sites, the Company has been identified as a potentially responsible party under
108
NOTES TO CONSOLIDATED FINANCIAL STATEMENTS — (Continued)
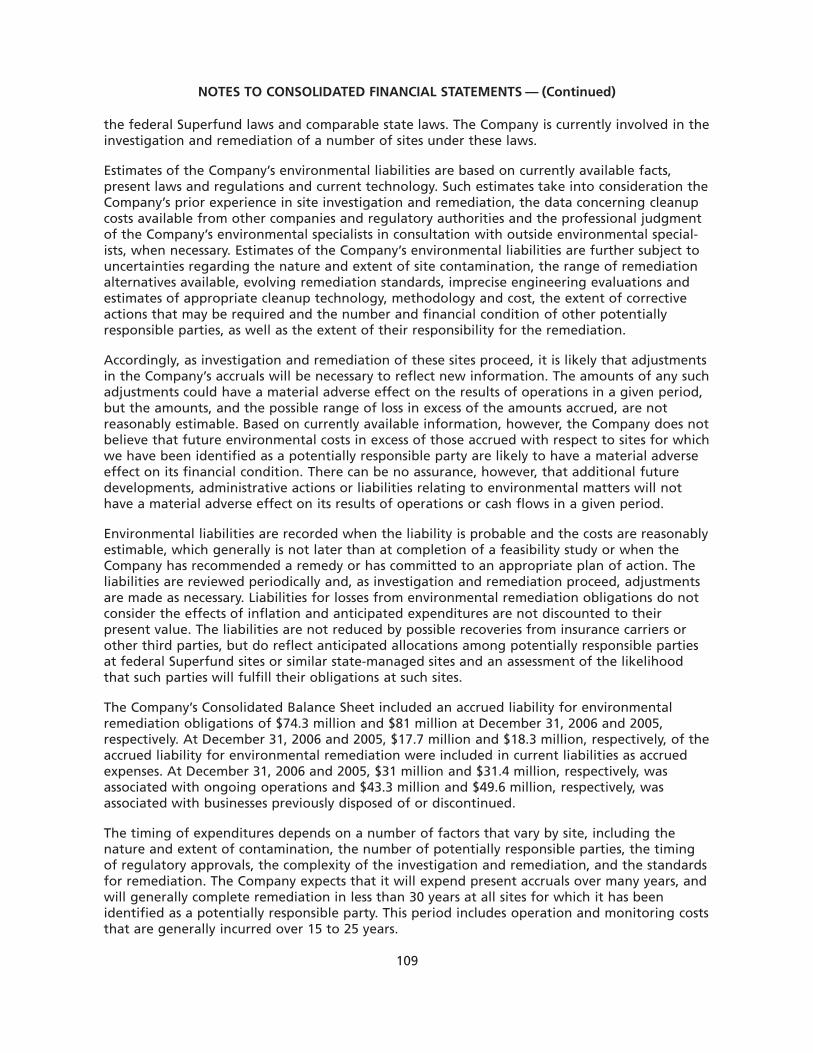
the federal Superfund laws and comparable state laws. The Company is currently involved in theinvestigation and remediation of a number of sites under these laws.
Estimates of the Company’s environmental liabilities are based on currently available facts,present laws and regulations and current technology. Such estimates take into consideration theCompany’s prior experience in site investigation and remediation, the data concerning cleanupcosts available from other companies and regulatory authorities and the professional judgmentof the Company’s environmental specialists in consultation with outside environmental special-ists, when necessary. Estimates of the Company’s environmental liabilities are further subject touncertainties regarding the nature and extent of site contamination, the range of remediationalternatives available, evolving remediation standards, imprecise engineering evaluations andestimates of appropriate cleanup technology, methodology and cost, the extent of correctiveactions that may be required and the number and financial condition of other potentiallyresponsible parties, as well as the extent of their responsibility for the remediation.
Accordingly, as investigation and remediation of these sites proceed, it is likely that adjustmentsin the Company’s accruals will be necessary to reflect new information. The amounts of any suchadjustments could have a material adverse effect on the results of operations in a given period,but the amounts, and the possible range of loss in excess of the amounts accrued, are notreasonably estimable. Based on currently available information, however, the Company does notbelieve that future environmental costs in excess of those accrued with respect to sites for whichwe have been identified as a potentially responsible party are likely to have a material adverseeffect on its financial condition. There can be no assurance, however, that additional futuredevelopments, administrative actions or liabilities relating to environmental matters will nothave a material adverse effect on its results of operations or cash flows in a given period.
Environmental liabilities are recorded when the liability is probable and the costs are reasonablyestimable, which generally is not later than at completion of a feasibility study or when theCompany has recommended a remedy or has committed to an appropriate plan of action. Theliabilities are reviewed periodically and, as investigation and remediation proceed, adjustmentsare made as necessary. Liabilities for losses from environmental remediation obligations do notconsider the effects of inflation and anticipated expenditures are not discounted to theirpresent value. The liabilities are not reduced by possible recoveries from insurance carriers orother third parties, but do reflect anticipated allocations among potentially responsible partiesat federal Superfund sites or similar state-managed sites and an assessment of the likelihoodthat such parties will fulfill their obligations at such sites.
The Company’s Consolidated Balance Sheet included an accrued liability for environmentalremediation obligations of $74.3 million and $81 million at December 31, 2006 and 2005,respectively. At December 31, 2006 and 2005, $17.7 million and $18.3 million, respectively, of theaccrued liability for environmental remediation were included in current liabilities as accruedexpenses. At December 31, 2006 and 2005, $31 million and $31.4 million, respectively, wasassociated with ongoing operations and $43.3 million and $49.6 million, respectively, wasassociated with businesses previously disposed of or discontinued.
The timing of expenditures depends on a number of factors that vary by site, including thenature and extent of contamination, the number of potentially responsible parties, the timingof regulatory approvals, the complexity of the investigation and remediation, and the standardsfor remediation. The Company expects that it will expend present accruals over many years, andwill generally complete remediation in less than 30 years at all sites for which it has beenidentified as a potentially responsible party. This period includes operation and monitoring coststhat are generally incurred over 15 to 25 years.
109
NOTES TO CONSOLIDATED FINANCIAL STATEMENTS — (Continued)
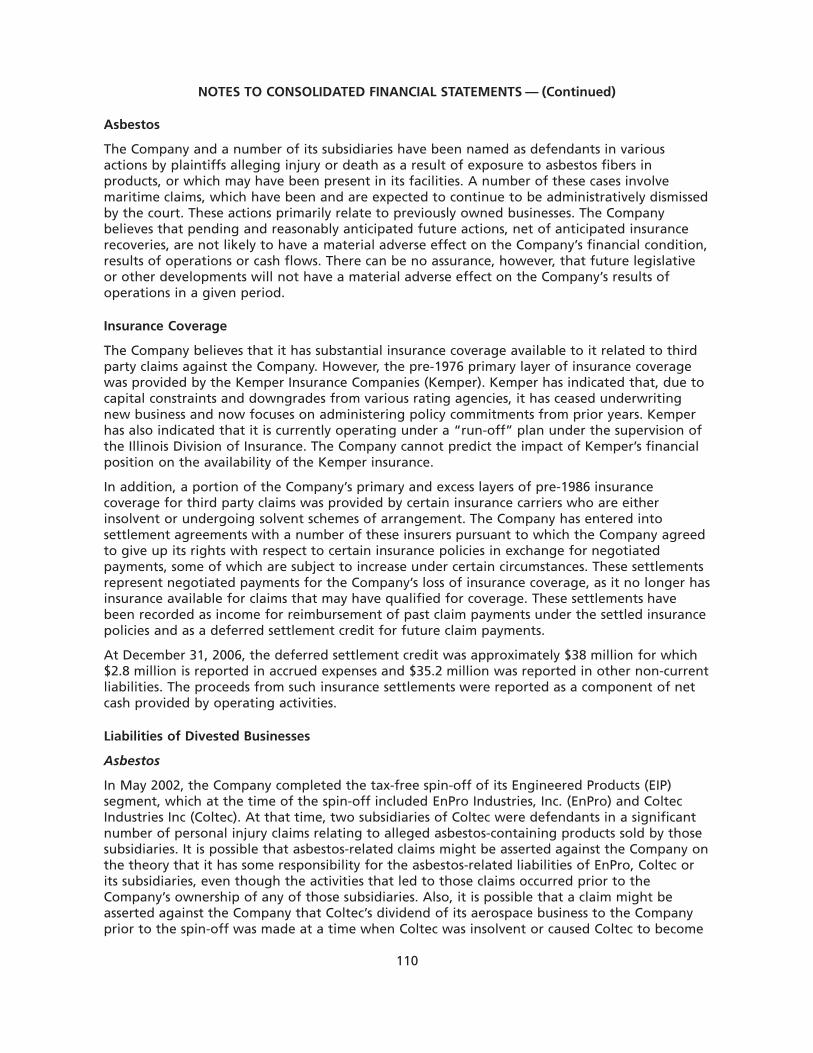
Asbestos
The Company and a number of its subsidiaries have been named as defendants in variousactions by plaintiffs alleging injury or death as a result of exposure to asbestos fibers inproducts, or which may have been present in its facilities. A number of these cases involvemaritime claims, which have been and are expected to continue to be administratively dismissedby the court. These actions primarily relate to previously owned businesses. The Companybelieves that pending and reasonably anticipated future actions, net of anticipated insurancerecoveries, are not likely to have a material adverse effect on the Company’s financial condition,results of operations or cash flows. There can be no assurance, however, that future legislativeor other developments will not have a material adverse effect on the Company’s results ofoperations in a given period.
Insurance Coverage
The Company believes that it has substantial insurance coverage available to it related to thirdparty claims against the Company. However, the pre-1976 primary layer of insurance coveragewas provided by the Kemper Insurance Companies (Kemper). Kemper has indicated that, due tocapital constraints and downgrades from various rating agencies, it has ceased underwritingnew business and now focuses on administering policy commitments from prior years. Kemperhas also indicated that it is currently operating under a “run-off” plan under the supervision ofthe Illinois Division of Insurance. The Company cannot predict the impact of Kemper’s financialposition on the availability of the Kemper insurance.
In addition, a portion of the Company’s primary and excess layers of pre-1986 insurancecoverage for third party claims was provided by certain insurance carriers who are eitherinsolvent or undergoing solvent schemes of arrangement. The Company has entered intosettlement agreements with a number of these insurers pursuant to which the Company agreedto give up its rights with respect to certain insurance policies in exchange for negotiatedpayments, some of which are subject to increase under certain circumstances. These settlementsrepresent negotiated payments for the Company’s loss of insurance coverage, as it no longer hasinsurance available for claims that may have qualified for coverage. These settlements havebeen recorded as income for reimbursement of past claim payments under the settled insurancepolicies and as a deferred settlement credit for future claim payments.
At December 31, 2006, the deferred settlement credit was approximately $38 million for which$2.8 million is reported in accrued expenses and $35.2 million was reported in other non-currentliabilities. The proceeds from such insurance settlements were reported as a component of netcash provided by operating activities.
Liabilities of Divested Businesses
Asbestos
In May 2002, the Company completed the tax-free spin-off of its Engineered Products (EIP)segment, which at the time of the spin-off included EnPro Industries, Inc. (EnPro) and ColtecIndustries Inc (Coltec). At that time, two subsidiaries of Coltec were defendants in a significantnumber of personal injury claims relating to alleged asbestos-containing products sold by thosesubsidiaries. It is possible that asbestos-related claims might be asserted against the Company onthe theory that it has some responsibility for the asbestos-related liabilities of EnPro, Coltec orits subsidiaries, even though the activities that led to those claims occurred prior to theCompany’s ownership of any of those subsidiaries. Also, it is possible that a claim might beasserted against the Company that Coltec’s dividend of its aerospace business to the Companyprior to the spin-off was made at a time when Coltec was insolvent or caused Coltec to become
110
NOTES TO CONSOLIDATED FINANCIAL STATEMENTS — (Continued)

insolvent. Such a claim could seek recovery from the Company on behalf of Coltec of the fairmarket value of the dividend.
A limited number of asbestos-related claims have been asserted against the Company as“successor” to Coltec or one of its subsidiaries. The Company believes that it has substantiallegal defenses against these claims, as well as against any other claims that may be assertedagainst the Company on the theories described above. In addition, the agreement betweenEnPro and the Company that was used to effectuate the spin-off provides the Company with anindemnification from EnPro covering, among other things, these liabilities. The success of anysuch asbestos-related claims would likely require, as a practical matter, that Coltec’s subsidiarieswere unable to satisfy their asbestos-related liabilities and that Coltec was found to beresponsible for these liabilities and was unable to meet its financial obligations. The Companybelieves any such claims would be without merit and that Coltec was solvent both before andafter the dividend of its aerospace business to the Company. If the Company is ultimately foundto be responsible for the asbestos-related liabilities of Coltec’s subsidiaries, it believes suchfinding would not have a material adverse effect on its financial condition, but could have amaterial adverse effect on its results of operations and cash flows in a particular period.However, because of the uncertainty as to the number, timing and payments related to futureasbestos-related claims, there can be no assurance that any such claims will not have a materialadverse effect on the Company’s financial condition, results of operations and cash flows. If aclaim related to the dividend of Coltec’s aerospace business were successful, it could have amaterial adverse impact on the Company’s financial condition, results of operations and cashflows.
Other
In connection with the divestiture of the Company’s tire, vinyl and other businesses, theCompany has received contractual rights of indemnification from third parties for environmentaland other claims arising out of the divested businesses. Failure of these third parties to honortheir indemnification obligations could have a material adverse effect on the Company’sfinancial condition, results of operations and cash flows.
Guarantees
At December 31, 2006, the Company had an outstanding contingent liability for guarantees ofdebt and lease payments of $2.1 million, letters of credit and bank guarantees of $54.2 millionand residual value of lease obligations of $32.7 million. See Note 14, “Lease Commitments” andNote 13, “Financing Arrangements”.
Aerostructures Long-Term Contracts
The aerostructures business has several long-term contracts in the pre-production and earlyproduction phases (e.g., Boeing 787, Airbus A380 and A350 XWB). The pre-production phaseincludes design of the product to meet customer specifications as well as design of themanufacturing processes to manufacture the product. Also involved in this phase is securingsupply of material and subcomponents produced by third party suppliers that are generallyaccomplished through long-term supply agreements. In addition to these factors, contracts inthe early production phase include excess-over-average inventories, which represent the excessof current manufactured cost over the estimated average manufactured cost over the life of thecontract. Cost estimates over the life of the contract are affected by estimates of future costreductions including learning curve. Because these contracts cover periods of up to 20 years ormore, there is risk that estimates of future costs made during the pre-production and earlyproduction phases will be different from actual costs and that difference could be significant.
111
NOTES TO CONSOLIDATED FINANCIAL STATEMENTS — (Continued)
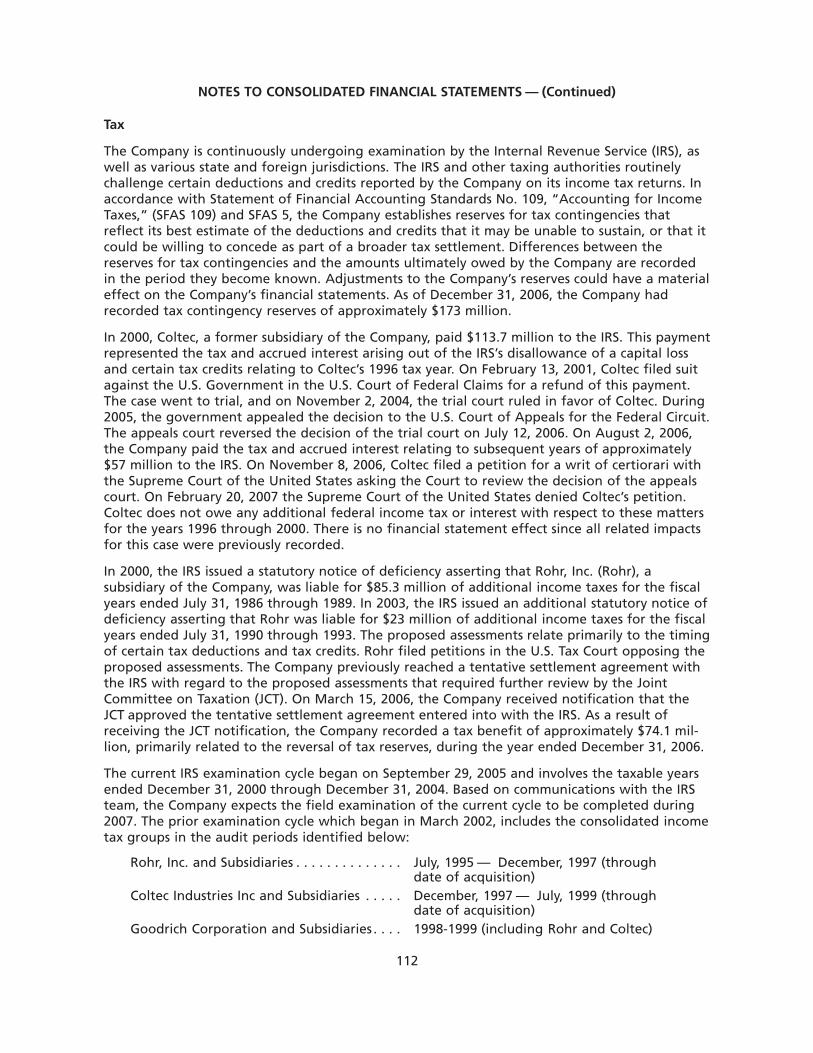
Tax
The Company is continuously undergoing examination by the Internal Revenue Service (IRS), aswell as various state and foreign jurisdictions. The IRS and other taxing authorities routinelychallenge certain deductions and credits reported by the Company on its income tax returns. Inaccordance with Statement of Financial Accounting Standards No. 109, “Accounting for IncomeTaxes,” (SFAS 109) and SFAS 5, the Company establishes reserves for tax contingencies thatreflect its best estimate of the deductions and credits that it may be unable to sustain, or that itcould be willing to concede as part of a broader tax settlement. Differences between thereserves for tax contingencies and the amounts ultimately owed by the Company are recordedin the period they become known. Adjustments to the Company’s reserves could have a materialeffect on the Company’s financial statements. As of December 31, 2006, the Company hadrecorded tax contingency reserves of approximately $173 million.
In 2000, Coltec, a former subsidiary of the Company, paid $113.7 million to the IRS. This paymentrepresented the tax and accrued interest arising out of the IRS’s disallowance of a capital lossand certain tax credits relating to Coltec’s 1996 tax year. On February 13, 2001, Coltec filed suitagainst the U.S. Government in the U.S. Court of Federal Claims for a refund of this payment.The case went to trial, and on November 2, 2004, the trial court ruled in favor of Coltec. During2005, the government appealed the decision to the U.S. Court of Appeals for the Federal Circuit.The appeals court reversed the decision of the trial court on July 12, 2006. On August 2, 2006,the Company paid the tax and accrued interest relating to subsequent years of approximately$57 million to the IRS. On November 8, 2006, Coltec filed a petition for a writ of certiorari withthe Supreme Court of the United States asking the Court to review the decision of the appealscourt. On February 20, 2007 the Supreme Court of the United States denied Coltec’s petition.Coltec does not owe any additional federal income tax or interest with respect to these mattersfor the years 1996 through 2000. There is no financial statement effect since all related impactsfor this case were previously recorded.
In 2000, the IRS issued a statutory notice of deficiency asserting that Rohr, Inc. (Rohr), asubsidiary of the Company, was liable for $85.3 million of additional income taxes for the fiscalyears ended July 31, 1986 through 1989. In 2003, the IRS issued an additional statutory notice ofdeficiency asserting that Rohr was liable for $23 million of additional income taxes for the fiscalyears ended July 31, 1990 through 1993. The proposed assessments relate primarily to the timingof certain tax deductions and tax credits. Rohr filed petitions in the U.S. Tax Court opposing theproposed assessments. The Company previously reached a tentative settlement agreement withthe IRS with regard to the proposed assessments that required further review by the JointCommittee on Taxation (JCT). On March 15, 2006, the Company received notification that theJCT approved the tentative settlement agreement entered into with the IRS. As a result ofreceiving the JCT notification, the Company recorded a tax benefit of approximately $74.1 mil-lion, primarily related to the reversal of tax reserves, during the year ended December 31, 2006.
The current IRS examination cycle began on September 29, 2005 and involves the taxable yearsended December 31, 2000 through December 31, 2004. Based on communications with the IRSteam, the Company expects the field examination of the current cycle to be completed during2007. The prior examination cycle which began in March 2002, includes the consolidated incometax groups in the audit periods identified below:
Rohr, Inc. and Subsidiaries . . . . . . . . . . . . . . July, 1995 — December, 1997 (throughdate of acquisition)
Coltec Industries Inc and Subsidiaries . . . . . December, 1997 — July, 1999 (throughdate of acquisition)
Goodrich Corporation and Subsidiaries . . . . 1998-1999 (including Rohr and Coltec)
112
NOTES TO CONSOLIDATED FINANCIAL STATEMENTS — (Continued)
There were numerous tax issues that had been raised by the IRS as part of the priorexamination, including, but not limited to, transfer pricing, research and development credits,foreign tax credits, tax accounting for long-term contracts, tax accounting for inventory, taxaccounting for stock options, depreciation, amortization and the proper timing for certain otherdeductions for income tax purposes. The IRS and the Company previously reached tentativesettlement agreements on substantially all of the issues raised with respect to the priorexamination cycle. Due to the amount of tax involved, certain portions of the tentativesettlement agreements were required to be reviewed by the JCT. The Company receivednotification on April 25, 2006 that the JCT approved the tentative settlement agreement enteredinto with the IRS with regard to Rohr, Inc. and Subsidiaries (for the period from July, 1995through December, 1997). As a result of receiving the JCT notification, the Company recorded atax benefit of approximately $14.9 million, primarily related to the reversal of tax reserves,during the year ended December 31, 2006. In addition to the JCT approvals with regard to Rohr,the Company reached agreement with the IRS regarding most of the issues with respect toColtec Industries Inc and Subsidiaries (for the period from December, 1997 through July, 1999).Consequently, the Company recorded a tax benefit of approximately $44.4 million, primarilyrelated to the reversal of tax reserves, during the year ended December 31, 2006. During theyear ended December 31, 2006, the Company reached final settlement with the IRS on substan-tially all of the issues relating to the Goodrich Corporation and Subsidiaries 1998-1999 examina-tion cycle. As a result, the Company recorded a benefit of approximately $13.5 million, primarilyrelated to the reversal of tax reserves. The Company anticipates filing a petition with the U.S. TaxCourt to contest the remaining unresolved issues which involve the proper timing of certaindeductions. The amount of the estimated tax liability if the IRS were to prevail is fully reserved.The Company cannot predict the timing or ultimate outcome of the remaining issues.
Rohr has been under examination by the State of California for the tax years ended July 31,1985, 1986 and 1987. The State of California has disallowed certain expenses incurred by one ofRohr’s subsidiaries in connection with the lease of certain tangible property. California’sFranchise Tax Board held that the deductions associated with the leased equipment were non-business deductions. The additional tax associated with the Franchise Tax Board’s position isapproximately $4.5 million. The amount of accrued interest associated with the additional tax isapproximately $20 million as of December 31, 2006. In addition, the State of California enactedan amnesty provision that imposes nondeductible penalty interest equal to 50% of the unpaidinterest amounts relating to taxable years ended before 2003. The penalty interest is approx-imately $10 million as of December 31, 2006. The tax and interest amounts continue to becontested by Rohr. The Company believes that it is adequately reserved for this contingency.During 2005, Rohr made payments of approximately $3.9 million ($0.6 million for tax and$3.3 million for interest) related to items that were not being contested and approximately$4.5 million related to items that are being contested. No payment has been made for the$20 million of interest or $10 million of penalty interest. Under California law, Rohr may berequired to pay the full amount of interest prior to filing any suit for refund. If required, Rohrexpects to make this payment and file suit for a refund in late 2007 or early 2008.
113
NOTES TO CONSOLIDATED FINANCIAL STATEMENTS — (Continued)
Note 19. Derivatives and Hedging Activities
Cash Flow Hedges
The Company has subsidiaries that conduct a substantial portion of their business in Euros,Great Britain Pounds Sterling, Canadian Dollars and Polish Zlotys but have significant salescontracts that are denominated in U.S. Dollars. Periodically, the Company enters into forwardcontracts to exchange U.S. Dollars for Euros, Great Britain Pounds Sterling, Canadian Dollars andPolish Zlotys to hedge a portion of the Company’s exposure from U.S. Dollar sales.
The forward contracts described above are used to mitigate the potential volatility to earningsand cash flow arising from changes in currency exchange rates that impact the Company’sU.S. Dollar sales for certain foreign operations. The forward contracts are accounted for as cashflow hedges. The forward contracts are recorded in the Company’s Consolidated Balance Sheetat fair value with the offset reflected in accumulated other comprehensive income (loss), net ofdeferred taxes. The notional value of the forward contracts at December 31, 2006 was$1,639.4 million. The fair value of the forward contracts at December 31, 2006, was a net assetof $85.2 million, including:
• $50.7 million recorded as a current asset in prepaid expenses and other assets; and
• $46.2 million recorded as a non-current asset in other assets; partially offset by,
• $3.8 million recorded as a current liability in accrued expenses; and
• $7.9 million recorded as a non-current liability in other non-current liabilities.
The total fair value of the Company’s forward contracts of $85.2 million (before deferred taxesof $29.9 million) at December 31, 2006, combined with $0.9 million of gains on previouslymatured hedges of intercompany sales and gains from forward contracts terminated prior tothe original maturity dates, is recorded in accumulated other comprehensive income (loss) andwill be reflected in income as earnings are affected by the hedged items. As of December 31,2006, the portion of the $86.1 million that would be reclassified into earnings as an increase insales to offset the effect of the hedged item in the next 12 months is a gain of $46.9 million.These forward contracts mature on a monthly basis with maturity dates that range fromJanuary 2007 to December 2010. During the year ended December 31, 2006, hedge ineffective-ness of $0.6 million was recorded in other income (expense) — net. There was a negligibleamount of ineffectiveness during the year ended December 31, 2005.
In June 2006, the Company entered into treasury locks and reverse treasury locks in connectionwith its long-term debt exchange offers. In accordance with Statement of Financial AccountingStandards No. 133, “Accounting for Derivative Instruments and Hedging Activities” (SFAS 133),the treasury locks were accounted for as cash flow hedges. The Company entered into$288.5 million of treasury locks to offset changes in the issue price of the 6.29% notes due 2016and entered into $288.5 million of reverse treasury locks to offset changes in the exchangeprices of the 7.5% notes due in 2008, 6.45% notes due in 2008 and 6.6% notes due in 2009 dueto movements in treasury rates prior to the exchange date. The Company paid $0.3 million incash to settle the locks, and the amount was recorded in accumulated other comprehensiveincome during the year ended December 31, 2006 and will be amortized over the life of the6.29% notes due 2016. In June 2006, the Company also entered into $235.5 million of treasurylocks to offset changes in the issue price of the 6.8% notes due 2036 and entered into$235.5 million of reverse treasury locks to offset changes in the exchange price of the7.625% notes due in 2012 due to movements in treasury rates prior to the exchange date. TheCompany paid $1.9 million in cash to settle the locks, and the amount was recorded inaccumulated other comprehensive income during the year ended December 31, 2006 and willbe amortized over the life of the 6.8% notes due 2036.
114
NOTES TO CONSOLIDATED FINANCIAL STATEMENTS — (Continued)

Fair Value Hedges
The Company enters into interest rate swaps to increase the Company’s exposure to variableinterest rates. The Company has the following interest rate swaps outstanding as of Decem-ber 31, 2006:
• A $43 million fixed-to-floating interest rate swap on the 6.45% notes due in 2008;
• Two $50 million fixed-to-floating interest rate swaps on the 7.5% notes due in 2008; and
• A $50 million fixed-to-floating interest rate swap on the 6.29% notes due in 2016.
In September 2006, the Company entered into a $50 million fixed to floating interest rate swapon the 6.29% senior notes due in 2016. The purpose of entering into this swap was to increasethe exposure to variable interest rates. The settlement and maturity dates on the swap are thesame as those on the referenced notes. In accordance with SFAS 133, the interest rate swap wasaccounted for as a fair value hedge and the carrying value of the notes has been adjusted toreflect the fair value of the interest rate swap.
In June 2006, the Company terminated $7 million of a $50 million fixed-to-floating interest rateswap on its 6.45% notes due in 2008 in connection with its long-term debt exchange offers. TheCompany paid $0.3 million in cash to terminate this portion of the interest rate swap, whichwas recorded as an expense in other income (expense) — net during the year ended Decem-ber 31, 2006. This portion of the interest rate swap was terminated so that the outstandingnotional amount of the fixed-to-floating interest rate swap would match the outstandingprincipal amount, subsequent to the exchange, of the 6.45% notes due in 2008.
The settlement and maturity dates on each swap are the same as those on the referenced notes.In accordance with SFAS 133, the interest rate swaps were accounted for as fair value hedgesand the carrying value of the notes were adjusted to reflect the fair values of the interest rateswaps. The fair value of the interest rate swaps was a net liability/(loss) of $2.6 million atDecember 31, 2006.
Other Forward Contracts
As a supplement to the foreign exchange cash flow hedging program, the Company enters intoforward contracts to manage its foreign currency risk related to the translation of monetaryassets and liabilities denominated in currencies other than the relevant functional currency.These forward contracts mature monthly and the notional amounts are adjusted periodically toreflect changes in net monetary asset balances. Since these contracts are not designated ashedges, the gains or losses on these forward contracts are recorded in cost of sales. Thesecontracts are utilized to mitigate the earnings impact of the translation of net monetary assetsand liabilities. Under this program, as of December 31, 2006, the Company had forwardcontracts with a notional value of $63.1 million to buy Great Britain Pounds Sterling, forwardcontracts with a notional value of $120.7 million to buy Euros and forward contracts with anotional value of $11 million to buy Canadian Dollars.
During the year ended December 31, 2006, the Company recorded a transaction loss on itsmonetary assets of approximately $19 million, which was partially offset by gains on the forwardcontracts described above of approximately $6 million. During the year ended December 31,2005, the Company recorded a transaction gain on its monetary assets of approximately$21 million, which was partially offset by losses on the forward contracts described above ofapproximately $17 million.
115
NOTES TO CONSOLIDATED FINANCIAL STATEMENTS — (Continued)
Note 20. Supplemental Cash Flow Information
The following table sets forth other cash flow information including acquisitions accounted forunder the purchase method.
2006 2005 2004For the Year Ended December 31,
(Dollars in millions)
Estimated fair value of tangible assets acquired . . . . . . . . . . . $ — $ 31.3 $ —Goodwill and identifiable intangible assets acquired . . . . . . . — 48.3 —Cash paid . . . . . . . . . . . . . . . . . . . . . . . . . . . . . . . . . . . . . . . . . — (67.0) (0.5)
Liabilities assumed (extinguished) . . . . . . . . . . . . . . . . . . . . . . $ — $ 12.6 (0.5)
Interest paid (net of amount capitalized) . . . . . . . . . . . . . . . . $129.9 $129.4 $142.8Income taxes paid (refunds received), net. . . . . . . . . . . . . . . . $113.8 $ 52.1 $ 31.7
Interest and income taxes paid include amounts related to discontinued operations.
Note 21. Preferred Stock
There are 10,000,000 authorized shares of Series Preferred Stock — $1 par value. Shares ofSeries Preferred Stock that have been redeemed are deemed retired and extinguished and maynot be reissued. As of December 31, 2006, 2,401,673 shares of Series Preferred Stock have beenredeemed, and no shares of Series Preferred Stock were outstanding. The Board of Directorsestablishes and designates the series and fixes the number of shares and the relative rights,preferences and limitations of the respective series of the Series Preferred Stock.
Cumulative Participating Preferred Stock — Series F
The Company has 200,000 shares of Junior Participating Preferred Stock — Series F — $1 parvalue Series F Stock authorized at December 31, 2006. Series F Stock has preferential voting,dividend and liquidation rights over the Company’s common stock. At December 31, 2006, noSeries F Stock was issued or outstanding.
Shareholder Rights Plan
Each outstanding share of the Company’s common stock carries with it one preferred sharepurchase right which allows the registered holder to purchase directly from the Company oneone-thousandth of a share of Series F Stock for a purchase price of $200 (subject to adjustment).The terms of the rights are described in a rights agreement, dated as of June 2, 1997, betweenthe Company and The Bank of New York, as rights agent. Each share of Series F Stock generallyhas voting and dividend rights that are intended to be equivalent to one thousand shares of theCompany’s common stock.
The preferred share purchase rights are generally not exercisable or transferable until the earlierof ten business days after a public announcement that a person has become an acquiringperson, or ten business days after the commencement of, or announcement of an intention tocommence, a tender or exchange offer that would result in a person becoming an acquiringperson. Under the plan, a person (other than the Company or any of the Company’s employeebenefit plans) will become an acquiring person if that person, together with any affiliated orassociated persons, acquires, or obtains the right to acquire or vote, 20% or more of theCompany’s outstanding common stock, subject to certain exceptions described in the plan.
If a person becomes an acquiring person, the holder of each right (other than the acquiringperson and its affiliates and associates) may exercise the right into a number of shares of the
116
NOTES TO CONSOLIDATED FINANCIAL STATEMENTS — (Continued)
Company’s common stock having a then current market value of two times the purchase priceof the right. If there are an insufficient number of shares of common stock to permit theexercise of the rights in full, the Company will substitute shares of Series F Stock or fractionsthereof that have the same market value as the shares of common stock that would otherwisebe issued upon exercise of the rights. In addition, if the Company is acquired in a merger orother business combination transaction or 50% or more of the Company’s consolidated assets orearning power is sold after a person has become an acquiring person, arrangements will bemade so that the holder of each right may exercise the right into a number of shares ofcommon stock of the acquiring company that have a then current market value of two timesthe purchase price of the right.
If a person has become an acquiring person but has not acquired beneficial ownership of 50%or more of the Company’s outstanding common stock, the Company may exchange the rights inwhole or in part for shares of the Company’s common stock at an exchange ratio of one shareof common stock per right, or if the Company does not have a sufficient number of shares ofthe Company’s common stock to permit the exchange, shares of Series F Stock or fractionthereof having a market value equal to one share of common stock.
Until a person has become an acquiring person, the Company may redeem the rights in whole,but not in part, at a price of $0.01 per right, and supplement or amend the rights agreementwithout the approval of the holders of the rights. After a person has become an acquiringperson, the Company may not amend the rights agreement in any manner that would adverselyaffect the holders of the rights.
The rights will expire at the close of business on August 2, 2007, or earlier if the Companyredeems them, or the Company exchanges them for shares of the Company’s common stock orSeries F Stock.
Note 22. Common Stock
During 2006, 2005 and 2004, 2.314 million, 4.018 million and 1.444 million shares, respectively,of authorized but unissued shares of common stock were issued under the 2001 EquityCompensation (Plan) and other employee share-based compensation plans.
The Company acquired 0.469 million, 0.055 million and 0.026 million shares of treasury stock in2006, 2005, and 2004, respectively.
As of December 31, 2006, there were 12.4 million shares of common stock reserved for issuanceunder outstanding and future awards pursuant to the 2001 Stock Option Plan and otheremployee share-based compensation plans.
During 2006, the Board of Directors of the Company approved a program that authorizes theCompany to repurchase up to $300 million of the Company’s common stock. The primarypurpose of the program is to reduce dilution to existing shareholders from the Company’s share-based compensation plans. While no time limit was set for completion of the program, theCompany expects repurchases to occur over a three year period. Repurchases under theprogram, which could aggregate to approximately 6% of the Company’s outstanding commonstock, may be made through open market or privately negotiated transactions at times and insuch amounts as management deems appropriate, subject to market conditions, regulatoryrequirements and other factors. The program does not obligate the Company to repurchase anyparticular amount of common stock, and may be suspended or discontinued at any time withoutnotice. During 2006, the Company repurchased 400,000 shares of the Company’s common stockunder the program for approximately $18 million.
117
NOTES TO CONSOLIDATED FINANCIAL STATEMENTS — (Continued)

Note 23. Share-Based Compensation
SFAS 123(R) was issued on December 16, 2004, which is a revision of Statement of FinancialAccounting Standards No. 123, “Accounting for Stock-Based Compensation” (SFAS 123).SFAS 123(R) supersedes APB Opinion No. 25, “Accounting for Stock Issued to Employees” andamends Statement of Financial Accounting Standards No. 95, “Statement of Cash Flows”. TheCompany adopted the SFAS 123 fair value-based method of accounting for share-based pay-ments effective January 1, 2004 using the “modified prospective method” described in State-ment of Financial Accounting Standards No. 148, “Accounting for Stock-Based Compensation-Transition and Disclosure”. The Company adopted SFAS 123(R) on January 1, 2006 using themodified-prospective transition method.
At December 31, 2006, the Company has seven types of share-based compensation awards,which are described below. Because the Company adopted the accounting provisions of SFAS 123effective January 1, 2004, the compensation cost recognized in accordance with SFAS 123 duringthe years ended December 31, 2004 and 2005 was consistent with the cost that would have beenrecorded under SFAS 123(R), except for the following differences:
• SFAS 123(R) requires entities to apply the same attribution method to all awards subjectto graded vesting. The Company has two types of share-based compensation awards thatare subject to graded vesting: stock options and restricted stock units. In the years priorto January 1, 2006, stock options were accounted for under the straight-line attributionmethod and restricted stock units were accounted for under the accelerated attributionmethod. Effective upon the adoption of SFAS 123(R), the Company made a policy electionto apply the straight-line method to all share-based awards that are subject to gradedvesting. During the year ended December 31, 2005, expense of $10.7 million wasrecognized on restricted stock units as compared to $7.6 million if the straight-linemethod was used. The incremental expense recorded in 2005 as compared to the straight-line method was $3.1 million ($1.9 million after tax, or $0.02 per diluted share). Duringthe year ended December 31, 2004, expense of $4.4 million was recognized on restrictedstock units as compared to $3.2 million if the straight-line method was used. Theincremental expense recorded in 2004 compared to the straight-line method was $1.2 mil-lion ($0.7 million after tax, or $0.01 per diluted share).
• The Company previously accounted for forfeitures as they occurred. In accordance withSFAS 123(R), the Company is required to estimate forfeitures at the grant date andrecognize compensation cost only for those awards expected to vest. Effective January 1,2006, the Company recorded income of $1.8 million ($1.1 million after tax, or $0.01 perdiluted share) to adjust previously recognized compensation cost as a cumulative effect ofa change in accounting on unvested awards to the amount of compensation costrecognized had forfeitures been estimated.
• In accordance with SFAS 123, the Company previously recorded compensation cost onperformance unit awards using the intrinsic-value method. However, SFAS 123(R) requiresliability awards to be accounted for using the fair value method. One-half of theCompany’s performance unit awards have a market condition, which must be consideredin the determination of fair value. Effective January 1, 2006, the Company recordedexpense of $0.9 million ($0.5 million after tax) to adjust previously recognized compensa-tion cost on vested performance unit awards to the amount of compensation recognizedhad the fair value of the awards been recorded prior to the adoption of SFAS 123(R). Thisamount was recorded as a cumulative effect of a change in accounting.
• During the years ended December 31, 2005 and 2004, $14.8 million and $3.5 million,respectively, of realized tax benefits on non-qualified options and restricted shares were
118
NOTES TO CONSOLIDATED FINANCIAL STATEMENTS — (Continued)
reported in net cash provided by operating activities. These amounts represent the nettax benefits that were in excess of recorded compensation expense, which are recorded inadditional paid-in capital. In accordance with SFAS 123(R), the tax benefits in excess ofpro forma compensation expense are reclassified to net cash used in financing activities.Pro forma compensation expense is calculated using the fair value of options as if theaccounting provisions of SFAS 123 had been applied since the January 1, 1995 effectivedate. Accordingly, $5 million is now recorded in net cash used in financing activitiesduring the year ended December 31, 2006. The realized net tax benefit that was recordedin additional paid-in capital and based on actual compensation expense, totaled $8.6 mil-lion during the year ended December 31, 2006.
• In accordance with SFAS 123(R), recognition of compensation expense on grants madesubsequent to January 1, 2006 to retirement eligible individuals begins on the date thegrants are approved since no future substantive service is required. Grants to individualswho will become retirement eligible prior to the normal vesting date will be expensedover the requisite service period (i.e., from the grant date through date of retirementeligibility). Compensation expense related to grants prior to the adoption of SFAS 123(R)will continue to be recognized over the explicit vesting period, which is generally three orfive years, with acceleration of any remaining unrecognized compensation cost when anemployee actually retires. As a result of applying these provisions of SFAS 123(R), compen-sation expense of approximately $22 million ($14 million after tax, or $0.11 per dilutedshare) was recognized during the year ended December 31, 2006, which was comprised ofthe following:
– Approximately $12 million ($8 million after tax, or $0.06 per diluted share) related toaccelerated expense for 2006 grants to individuals who were retirement eligible on thegrant date or who will become retirement eligible in advance of the normal vestingdate. This compares to approximately $4 million of expense ($2 million after tax, or$0.02 per diluted share) if the previous method was used.
– Approximately $10 million ($6 million after tax, or $0.05 per diluted share) related toaccelerated expense for 2007 grants to individuals who were retirement eligible on theDecember 2006 approval date. Under SFAS 123, this expense would have been recog-nized beginning in 2007.
The compensation cost recorded for share-based compensation plans during the year endedDecember 31, 2006 totaled $57.1 million ($35.8 million after tax, or $0.28 per diluted share) ascompared to $33.3 million ($21.7 million after tax, or $0.18 per diluted share) during the yearended December 31, 2005 and $21.7 million ($15.8 million after tax, or $0.13 per diluted share)during the year ended December 31, 2004. The increase of $23.8 million from 2005 to 2006 wasprimarily driven by approximately $18 million of incremental compensation expense during 2006as a result of recognizing an accelerated portion of the total compensation expense on awardsgranted to employees who are retirement eligible or will become retirement eligible prior tothe normal vesting date.
The total income tax benefit recognized in the income statement for share-based compensationawards was $21.3 million, $11.6 million and $5.9 million for the years ended December 31, 2006,2005 and 2004, respectively. There was no compensation cost related to share-based planscapitalized as part of inventory and fixed assets during the years ended December 31, 2006,2005 and 2004. As of December 31, 2006, total compensation cost related to nonvested share-based compensation awards not yet recognized totaled $36.9 million, which is expected to berecognized over a weighted-average period of 1.5 years.
119
NOTES TO CONSOLIDATED FINANCIAL STATEMENTS — (Continued)
The Company administers the Goodrich Equity Compensation Plan (the Plan) as part of its long-term incentive compensation program. The Plan, as approved by the Company’s shareholders,permits the Company to issue stock options, performance shares, restricted stock awards,restricted stock units and several other equity-based compensation awards. Currently, the Plan,which will expire on April 17, 2011, unless renewed, makes 11,000,000 shares of common stockof the Company available for grant, together with shares of common stock available as ofApril 17, 2001 for future awards under the Company’s 1999 Stock Option Plan, and any shares ofcommon stock representing outstanding 1999 Stock Option Plan awards as of April 17, 2001 thatare not issued or otherwise are returned to the Company after that date. Historically, theCompany has issued shares upon exercise of options or vesting of other share-based compensa-tion awards. During the year ended December 31, 2006, the Company only repurchased sharesto the extent required to meet the minimum statutory tax withholding requirements.
Stock Options
Generally, options granted on or after January 1, 2004 are exercisable at the rate of 331⁄3% afterone year, 662⁄3% after two years and 100% after three years. Expense related to options grantedto retirement eligible individuals begins on the date the grants are approved since no futuresubstantive service is required. Options granted to employees who will become retirementeligible prior to the end of the vesting term are expensed over the period through which theemployee will become retirement eligible because the awards are earned upon retirement fromthe Company. Compensation expense for options granted to employees who are not retirementeligible is recognized on a straight-line basis over three years. The term of each stock optioncannot exceed 10 years from the date of grant. All options granted under the Plan have anexercise price that is not less than 100% of the market value of the stock on the date of grant,as determined pursuant to the plan. Dividends are not paid or earned on stock options.
The fair value of each option award is estimated on the date of grant using the Black-Scholes-Merton formula. The expected term of the options represents the estimated period of time untilexercise and is based on historical experience of similar options giving consideration to thecontractual terms, vesting schedules and expectations of future employee exercise behavior. TheCompany does not issue traded options. Accordingly, the Company uses historical volatilityinstead of implied volatility. The historical volatility is calculated over a term commensurate withthe expected term of the options. The risk-free rate during the option term is based on theU.S. Treasury yield curve in effect at the time of grant. The dividend yield is based on theexpected annual dividends during the term of the options divided by the fair value of the stockon the grant date. The fair value for options issued during the years ended December 31, 2006,2005 and 2004 was based upon the following weighted-average assumptions:
2006 2005 2004
Risk-free interest rate (%) . . . . . . . . . . . . . . . . . . . . . . . . . . . . . . . . . . 4.3 4.0 4.1Dividend yield (%) . . . . . . . . . . . . . . . . . . . . . . . . . . . . . . . . . . . . . . . . 2.0 2.6 3.3Volatility factor (%) . . . . . . . . . . . . . . . . . . . . . . . . . . . . . . . . . . . . . . . 36.1 40.6 44.5Weighted-average expected life of the options (years) . . . . . . . . . . . 5.5 7.0 7.0
120
NOTES TO CONSOLIDATED FINANCIAL STATEMENTS — (Continued)
A summary of option activity during the year ended December 31, 2006 is presented below:
Shares
Weighted-AverageExercise
Price
Weighted-Average
RemainingContractual
Term
AggregateIntrinsic
Value(In thousands) (In millions)
Outstanding at January 1, 2006 . . . . . 6,951.7 $30.85Granted . . . . . . . . . . . . . . . . . . . . . . . . 711.9 40.21Exercised . . . . . . . . . . . . . . . . . . . . . . . (1,949.3) 30.75Forfeited or expired. . . . . . . . . . . . . . . (38.7) 35.54
Outstanding at December 31, 2006. . . 5,675.6 $32.02 5.2 years $77.1
Vested or expected to vest(1) . . . . . . . 5,675.2 $32.00 5.2 years $76.9
Exercisable at December 31, 2006 . . . . 4,358.9 $30.73 4.3 years $64.8
(1) Represents outstanding options reduced by expected forfeitures.
As of December 31, 2006, the compensation expense related to nonvested options not yetrecognized totaled $6.2 million. The weighted-average grant date fair value of options grantedwas $13.44, $11.79 and $11.06 per option during the years ended December 31, 2006, 2005 and2004, respectively.
During the year ended December 31, 2006, the amount of cash received from exercise of stockoptions totaled $59.2 million and the tax benefit realized from stock options exercised totaled$8.9 million. The total intrinsic value of options exercised during the year ended December 31,2006, 2005 and 2004 was $26.7 million, $48.7 million and $9.8 million, respectively.
Restricted Stock Units
Generally, 50% of the Company’s restricted stock units vest and are converted to stock at theend of the third year, an additional 25% at the end of the fourth year and the remaining 25%at the end of the fifth year. In certain circumstances, the vesting term is three years. Expenserelated to restricted stock units granted to retirement eligible individuals begins on the date thegrants are approved since no future substantive service is required. Restricted stock unitsgranted to employees who will become retirement eligible prior to the end of the vesting termare expensed over the period through which the employee will become retirement eligiblebecause the awards vest immediately upon retirement. Compensation expense for restrictedstock units granted to employees who are not retirement eligible is recognized on a straight-line basis over the vesting period. Cash dividend equivalents are paid to participants eachquarter. Dividend equivalents paid on units expected to vest are recognized as a reduction inretained earnings.
The fair value of the restricted stock units is determined based upon the average of the highand low grant date fair value. The weighted-average grant date fair value during 2006, 2005and 2004 was $40.49, $32.46 and $30.67 per unit, respectively.
121
NOTES TO CONSOLIDATED FINANCIAL STATEMENTS — (Continued)
A summary of the status of the Company’s restricted stock units as of December 31, 2006 andchanges during the year then ended is presented below:
Shares
Weighted-Average
Grant dateFair Value
(In thousands)
Nonvested at January 1, 2006 . . . . . . . . . . . . . . . . . . . . . . . . . . . 1,095.1 $31.55Granted . . . . . . . . . . . . . . . . . . . . . . . . . . . . . . . . . . . . . . . . . . . . 595.4 40.48Vested . . . . . . . . . . . . . . . . . . . . . . . . . . . . . . . . . . . . . . . . . . . . . (92.6) 33.49Forfeited. . . . . . . . . . . . . . . . . . . . . . . . . . . . . . . . . . . . . . . . . . . . (40.6) 33.86
Nonvested at December 31, 2006 . . . . . . . . . . . . . . . . . . . . . . . . 1,557.3 34.78
As of December 31, 2006, there was $21.5 million of total unrecognized compensation costrelated to nonvested restricted stock units, which is expected to be recognized over a weighted-average period of 1.8 years. The total fair value of units vested during the years endedDecember 31, 2006 and 2005 was $3.6 million and $2.1 million, respectively. No units vestedduring the year ended December 31, 2004. The tax benefit realized from vested restricted stockunits totaled $1.4 million during the year ended December 31, 2006.
Restricted Stock Awards
Restricted stock awards have not been granted since the year ended December 31, 2004. As ofDecember 31, 2006, 4,200 awards were nonvested. There is a negligible amount of unrecognizedcompensation expense related to these shares. The total fair value of shares vested during theyears ended December 31, 2006 and 2005 was $2.3 million and $1.7 million, respectively. Thetotal fair value of shares vested during the year ended December 31, 2004 was negligible. Thetax benefit realized from vested restricted stock awards totaled $0.9 million during the yearended December 31, 2006.
Performance Units
Performance share units awarded to the Company’s senior management are paid in cash. Sincethe awards will be paid in cash, they are recorded as a liability award in accordance withSFAS 123(R). The value of each award is determined based upon the fair value of the Company’sstock at the end of the three-year term, as adjusted for either a performance condition or amarket condition.
The performance condition is applied to one-half of the awards and is based upon theCompany’s actual return on invested capital (ROIC) as compared to a target ROIC, which isapproved by the Compensation Committee of the Board of Directors. At each reporting period,the fair value represents the fair market value of the Company’s stock as adjusted by expecta-tions regarding the achievement of the ROIC target. Changes in expectations are recognized asadjustments to compensation expense each reporting period.
The market condition is applied to the other half of the awards and is based on the Company’srelative total shareholder return (RTSR) as compared to the RTSR of a peer group of companies,which is approved by the Compensation Committee of the Board of Directors. Because theawards have a market condition, it must be considered in the calculation of the fair value. Thefair value of each award is estimated each reporting period using a Monte Carlo Simulationapproach in a risk-neutral framework based upon historical volatility, risk free rates andcorrelation matrix. Because the award is recorded as a liability, the fair value is updated at eachreporting period until settlement.
122
NOTES TO CONSOLIDATED FINANCIAL STATEMENTS — (Continued)
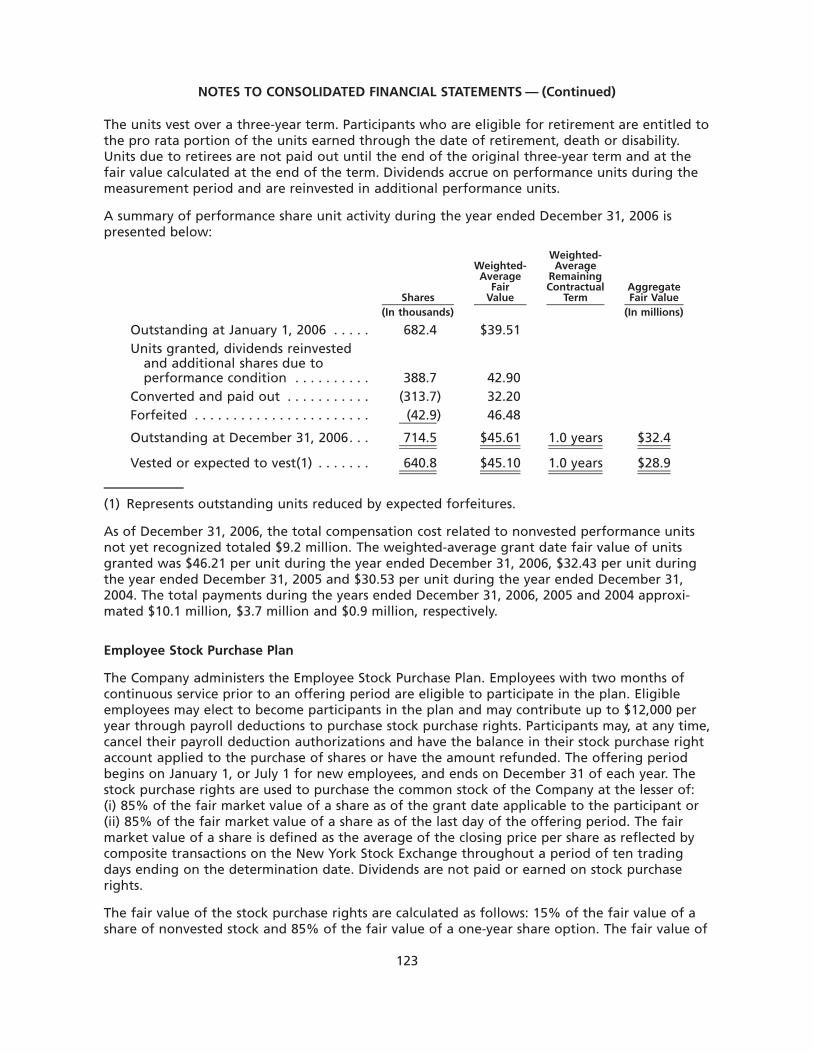
The units vest over a three-year term. Participants who are eligible for retirement are entitled tothe pro rata portion of the units earned through the date of retirement, death or disability.Units due to retirees are not paid out until the end of the original three-year term and at thefair value calculated at the end of the term. Dividends accrue on performance units during themeasurement period and are reinvested in additional performance units.
A summary of performance share unit activity during the year ended December 31, 2006 ispresented below:
Shares
Weighted-Average
FairValue
Weighted-Average
RemainingContractual
TermAggregateFair Value
(In thousands) (In millions)
Outstanding at January 1, 2006 . . . . . 682.4 $39.51Units granted, dividends reinvested
and additional shares due toperformance condition . . . . . . . . . . 388.7 42.90
Converted and paid out . . . . . . . . . . . (313.7) 32.20Forfeited . . . . . . . . . . . . . . . . . . . . . . . (42.9) 46.48
Outstanding at December 31, 2006. . . 714.5 $45.61 1.0 years $32.4
Vested or expected to vest(1) . . . . . . . 640.8 $45.10 1.0 years $28.9
(1) Represents outstanding units reduced by expected forfeitures.
As of December 31, 2006, the total compensation cost related to nonvested performance unitsnot yet recognized totaled $9.2 million. The weighted-average grant date fair value of unitsgranted was $46.21 per unit during the year ended December 31, 2006, $32.43 per unit duringthe year ended December 31, 2005 and $30.53 per unit during the year ended December 31,2004. The total payments during the years ended December 31, 2006, 2005 and 2004 approxi-mated $10.1 million, $3.7 million and $0.9 million, respectively.
Employee Stock Purchase Plan
The Company administers the Employee Stock Purchase Plan. Employees with two months ofcontinuous service prior to an offering period are eligible to participate in the plan. Eligibleemployees may elect to become participants in the plan and may contribute up to $12,000 peryear through payroll deductions to purchase stock purchase rights. Participants may, at any time,cancel their payroll deduction authorizations and have the balance in their stock purchase rightaccount applied to the purchase of shares or have the amount refunded. The offering periodbegins on January 1, or July 1 for new employees, and ends on December 31 of each year. Thestock purchase rights are used to purchase the common stock of the Company at the lesser of:(i) 85% of the fair market value of a share as of the grant date applicable to the participant or(ii) 85% of the fair market value of a share as of the last day of the offering period. The fairmarket value of a share is defined as the average of the closing price per share as reflected bycomposite transactions on the New York Stock Exchange throughout a period of ten tradingdays ending on the determination date. Dividends are not paid or earned on stock purchaserights.
The fair value of the stock purchase rights are calculated as follows: 15% of the fair value of ashare of nonvested stock and 85% of the fair value of a one-year share option. The fair value of
123
NOTES TO CONSOLIDATED FINANCIAL STATEMENTS — (Continued)
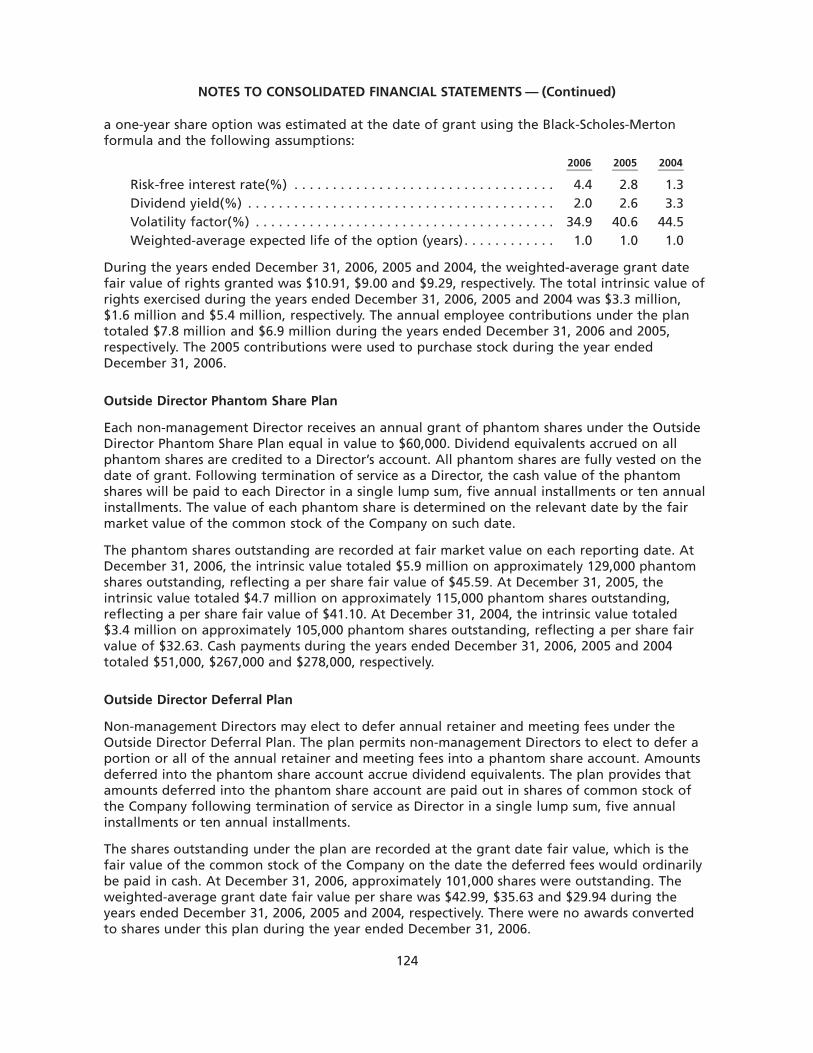
a one-year share option was estimated at the date of grant using the Black-Scholes-Mertonformula and the following assumptions:
2006 2005 2004
Risk-free interest rate(%) . . . . . . . . . . . . . . . . . . . . . . . . . . . . . . . . . . 4.4 2.8 1.3Dividend yield(%) . . . . . . . . . . . . . . . . . . . . . . . . . . . . . . . . . . . . . . . . 2.0 2.6 3.3Volatility factor(%) . . . . . . . . . . . . . . . . . . . . . . . . . . . . . . . . . . . . . . . 34.9 40.6 44.5Weighted-average expected life of the option (years) . . . . . . . . . . . . 1.0 1.0 1.0
During the years ended December 31, 2006, 2005 and 2004, the weighted-average grant datefair value of rights granted was $10.91, $9.00 and $9.29, respectively. The total intrinsic value ofrights exercised during the years ended December 31, 2006, 2005 and 2004 was $3.3 million,$1.6 million and $5.4 million, respectively. The annual employee contributions under the plantotaled $7.8 million and $6.9 million during the years ended December 31, 2006 and 2005,respectively. The 2005 contributions were used to purchase stock during the year endedDecember 31, 2006.
Outside Director Phantom Share Plan
Each non-management Director receives an annual grant of phantom shares under the OutsideDirector Phantom Share Plan equal in value to $60,000. Dividend equivalents accrued on allphantom shares are credited to a Director’s account. All phantom shares are fully vested on thedate of grant. Following termination of service as a Director, the cash value of the phantomshares will be paid to each Director in a single lump sum, five annual installments or ten annualinstallments. The value of each phantom share is determined on the relevant date by the fairmarket value of the common stock of the Company on such date.
The phantom shares outstanding are recorded at fair market value on each reporting date. AtDecember 31, 2006, the intrinsic value totaled $5.9 million on approximately 129,000 phantomshares outstanding, reflecting a per share fair value of $45.59. At December 31, 2005, theintrinsic value totaled $4.7 million on approximately 115,000 phantom shares outstanding,reflecting a per share fair value of $41.10. At December 31, 2004, the intrinsic value totaled$3.4 million on approximately 105,000 phantom shares outstanding, reflecting a per share fairvalue of $32.63. Cash payments during the years ended December 31, 2006, 2005 and 2004totaled $51,000, $267,000 and $278,000, respectively.
Outside Director Deferral Plan
Non-management Directors may elect to defer annual retainer and meeting fees under theOutside Director Deferral Plan. The plan permits non-management Directors to elect to defer aportion or all of the annual retainer and meeting fees into a phantom share account. Amountsdeferred into the phantom share account accrue dividend equivalents. The plan provides thatamounts deferred into the phantom share account are paid out in shares of common stock ofthe Company following termination of service as Director in a single lump sum, five annualinstallments or ten annual installments.
The shares outstanding under the plan are recorded at the grant date fair value, which is thefair value of the common stock of the Company on the date the deferred fees would ordinarilybe paid in cash. At December 31, 2006, approximately 101,000 shares were outstanding. Theweighted-average grant date fair value per share was $42.99, $35.63 and $29.94 during theyears ended December 31, 2006, 2005 and 2004, respectively. There were no awards convertedto shares under this plan during the year ended December 31, 2006.
124
NOTES TO CONSOLIDATED FINANCIAL STATEMENTS — (Continued)

QUARTERLY FINANCIAL DATA (UNAUDITED)(1)
First Second Third Fourth First Second Third Fourth
2006 Quarters 2005 Quarters
(Dollars in millions, except per share amounts)
BUSINESS SEGMENT SALES
Engine Systems . . . . . . . . . . $ 610.5 $ 634.6 $ 582.5 $ 627.7 $ 528.1 $ 565.8 $ 567.3 $ 576.4
Airframe Systems . . . . . . . . 470.3 488.6 481.1 510.6 442.7 464.0 475.2 472.3
Electronic Systems . . . . . . . . 343.0 360.0 372.4 397.0 304.7 322.9 328.0 349.1
TOTAL SALES . . . . . . . . . . $1,423.8 $1,483.2 $1,436.0 $1,535.3 $1,275.5 $1,352.7 $1,370.5 $1,397.8
GROSS PROFIT(2) . . . . . . . . . . $ 379.9 $ 395.2 $ 393.1 $ 419.0 $ 345.8 $ 362.2 $ 360.6 $ 364.4
OPERATING INCOME
Engine Systems . . . . . . . . . . $ 118.7 $ 128.9 $ 116.2 $ 107.2 $ 90.5 $ 108.8 $ 104.1 $ 96.4
Airframe Systems . . . . . . . . 14.3 28.0 30.8 24.4 27.8 10.8 16.1 21.3
Electronic Systems . . . . . . . . 36.9 45.8 50.4 59.7 32.3 37.7 37.2 38.7
Corporate . . . . . . . . . . . . . (27.2) (34.8) (23.0) (30.9) (20.5) (21.2) (22.0) (24.7)
TOTAL OPERATING INCOME . . $ 142.7 $ 167.9 $ 174.4 $ 160.4 $ 130.1 $ 136.1 $ 135.4 $ 131.7
INCOME FROM
Continuing Operations . . . . $ 200.3 $ 81.1 $ 100.8 $ 99.0 $ 56.8 $ 62.4 $ 60.6 $ 64.0
Discontinued Operations . . . 0.6 (0.1) (0.1) (0.1) 0.7 13.3 0.2 5.6
Cumulative Effect ofChange in Accounting . . . 0.6 — — — — — — —
NET INCOME . . . . . . . . . . . . . $ 201.5 $ 81.0 $ 100.7 $ 98.9 $ 57.5 $ 75.7 $ 60.8 $ 69.6
Basic Earnings Per Share(3)
Continuing Operations . . . . $ 1.62 $ 0.65 $ 0.81 $ 0.79 $ 0.47 $ 0.52 $ 0.50 $ 0.52
Discontinued Operations . . . — — — — 0.01 0.11 — 0.05
Cumulative Effect ofChange in Accounting . . . 0.01 — — — — — — —
Net Income . . . . . . . . . . . . $ 1.63 $ 0.65 $ 0.81 $ 0.79 $ 0.48 $ 0.63 $ 0.50 $ 0.57
Diluted Earnings Per Share(3)
Continuing Operations . . . . $ 1.59 $ 0.64 $ 0.80 $ 0.78 $ 0.46 $ 0.51 $ 0.49 $ 0.51
Discontinued Operations . . . — — — — 0.01 0.10 — 0.05
Cumulative Effect ofChange in Accounting . . . 0.01 — — — — — — —
Net Income . . . . . . . . . . . . $ 1.60 $ 0.64 $ 0.80 $ 0.78 $ 0.47 $ 0.61 $ 0.49 $ 0.56
(1) The historical amounts presented above have been restated to present the Company’s formerTest Systems business as discontinued operations.
(2) Gross profit represents sales less cost of sales.
(3) The sum of the earnings per share for the four quarters in a year does not necessarily equalthe total year earnings per share due to rounding.
125
First Quarter 2006
The first quarter of 2006 included $22.4 million for share-based compensation including anaccelerated portion on 2006 awards granted to employees who are or will become retirementeligible before the normal vesting period. The effective tax rate from continuing operationsduring the first quarter of 2006 included a tax benefit of $131.5 million primarily from thereversal of tax reserves in connection with the settlements of the IRS examinations of Rohr, Inc.and subsidiaries (for the period July, 1986 through December, 1997), and Coltec Industries Incand subsidiaries (for the period December, 1997 through July, 1999). Income from discontinuedoperations, after tax, was $0.6 million during the first quarter of 2006, which primarily reflects again recognized as a result of the Company’s settlement with several insurers relating to therecovery of environmental remediation costs at a former chemical plant. The cumulative effectfrom the change in accounting from the adoption of SFAS 123(R) on January 1, 2006 resulted ina gain of $0.6 million for the first quarter of 2006.
Second Quarter 2006
The second quarter of 2006 included a $10.9 million before tax charge for a pension curtailmentrelated to the implementation of changes to the Company’s pension and retirement savingsplans. In addition, the Company exchanged approximately $533 million of its long-term notesfor similar notes of longer duration and recorded a charge of $4.8 million for costs associatedwith the transaction.
Third Quarter 2006
The third quarter of 2006 included a tax benefit of $13.5 million for a settlement with the IRS ofsubstantially all issues related to the 1998 to 1999 examination period for the Company.
Fourth Quarter 2006
The fourth quarter of 2006 included a $9.6 million before tax charge associated with certain ofthe Company’s 2007 share-based compensation awards that were authorized in 2006. The fourthquarter of 2006 included a tax benefit of approximately $24 million primarily for the R&D taxcredit, which was renewed by Congress in the fourth quarter of 2006 retroactive to thebeginning of 2006. The fourth quarter 2006 also included a before tax charge of $3.2 millionfrom cumulative catch-up adjustments recorded by the Company’s aerostructures business.
First Quarter 2005
The first quarter of 2005 included a $3.2 million before tax charge for restructuring andconsolidation costs and a $5.1 million before tax charge from the cumulative catch-up adjust-ments recorded by the Company’s aerostructures business. The first quarter of 2005 included$11.4 million of share-based compensation expense.
Second Quarter 2005
The second quarter of 2005 included a $15 million before tax charge for the retrofit ofredesigned parts, obsolete inventory, supplier claims and impaired assets for the A380 actuationsystem, a $6 million before tax charge for premiums and other associated debt retirement costs,a $1.7 million before tax gain from the cumulative catch-up adjustments recorded by theCompany’s aerostructures business and a $0.5 million before tax charge for restructuring andconsolidation costs. Income from discontinued operations during the second quarter includedprimarily the $13.2 million after tax gain on the sale of Test Systems.
126
Third Quarter 2005
The third quarter of 2005 included a $5.6 million before tax charge for premiums and otherassociated debt retirement costs, a $0.7 million before tax gain from cumulative catch-upadjustments recorded by the Company’s aerostructures business and a $3.7 million before taxcharge for restructuring and consolidation costs.
Fourth Quarter 2005
The fourth quarter of 2005 included a $14.6 million before tax charge from cumulative catch-upadjustments recorded by the Company’s aerostructures business, and a $7.3 million before taxcharge related to the termination of the Boeing 737NG spoilers contract and a $9.4 millionbefore tax charge for restructuring and consolidation costs. Income from discontinued opera-tions during the fourth quarter included primarily the $7.5 million after tax gain from thesettlement with several insurers relating to the recovery of past costs to remediate environmen-tal issues at a former chemical plant.
127
Item 9. Changes in and Disagreements with Accountants on Accounting and FinancialDisclosure
Not applicable.
Item 9A. Controls and Procedures
Evaluation of Disclosure Controls and Procedures
We maintain disclosure controls and procedures that are designed to provide reasonableassurance that information required to be disclosed in our Exchange Act reports is recorded,processed, summarized and reported within the time periods specified in the SEC’s rules andforms, and that such information is accumulated and communicated to our management,including our Chairman, President and Chief Executive Officer and Senior Vice President andChief Financial Officer, as appropriate, to allow timely decisions regarding required disclosure.Management necessarily applied its judgment in assessing the costs and benefits of such controlsand procedures, which, by their nature, can provide only reasonable assurance regardingmanagement’s disclosure control objectives.
We have carried out an evaluation, under the supervision and with the participation of ourmanagement, including our Chairman, President and Chief Executive Officer and Senior VicePresident and Chief Financial Officer, of the effectiveness of the design and operation of ourdisclosure controls and procedures as of the end of the period covered by this Annual Report(the Evaluation Date). Based upon that evaluation, our Chairman, President and Chief ExecutiveOfficer and Senior Vice President and Chief Financial Officer concluded that our disclosurecontrols and procedures were effective as of the Evaluation Date to provide reasonableassurance regarding management’s disclosure control objectives.
Evaluation of Internal Control Over Financial Reporting
Management’s report on internal control over financial reporting as of December 31, 2006appears on page 64 and is incorporated herein by reference. The report of Ernst & Young LLPon management’s assessment and the effectiveness of internal control over financial reportingappear on page 66 and is incorporated herein by reference.
Changes in Internal Control
In December 2005, our Board of Directors authorized the purchase and implementation of asingle, integrated ERP system across all of our strategic business units. We purchased the ERPsystem in the fourth quarter 2005 and expect to implement the system over 7 years between2006 and 2012. During 2006, we implemented the ERP system at 2 of our businesses.
There were no other changes in our internal control over financial reporting that occurredduring our most recent fiscal quarter that materially affected, or are reasonably likely tomaterially affect, our internal control over financial reporting.
Item 9B. Other Information
Not applicable.
128
PART III
Item 10. Directors and Executive Officers of the Registrant
Biographical information concerning our Directors appearing under the caption “Proposals toShareholders — 1. Election of Directors — Nominees for Election” and information under thecaptions “Governance of the Company — Business Code of Conduct”, “Governance of theCompany — Director Independence; Audit Committee Financial Expert”, “Governance of theCompany — Board Committees” and “Section 16(a) Beneficial Ownership Reporting Compli-ance” in our 2007 proxy statement are incorporated herein by reference. Biographical informa-tion concerning our Executive Officers is contained in Part I of this Form 10-K under the caption“Executive Officers of the Registrant.”
Item 11. Executive Compensation
Information concerning executive and director compensation appearing under the captions“Executive Compensation”, “Governance of the Company — Compensation of Directors” and“Governance of the Company — Indemnification; Insurance” in our 2007 proxy statement isincorporated herein by reference.
Item 12. Security Ownership of Certain Beneficial Owners and Management and RelatedStockholder Matters
Security Ownership of Certain Beneficial Owners and Management
Security ownership data appearing under the captions “Holdings of Company Equity Securitiesby Directors and Executive Officers” and “Beneficial Ownership of Securities” in our 2007 proxystatement are incorporated herein by reference.
Securities Authorized for Issuance under Equity Compensation Plans
We have five compensation plans approved by shareholders (excluding plans we assumed inacquisitions) under which our equity securities are authorized for issuance to employees or directorsin exchange for goods or services: The B.F.Goodrich Key Employees’ Stock Option Plan (effectiveApril 15, 1991) (the 1991 Plan); The B.F.Goodrich Company Stock Option Plan (effective April 15,1996) (the 1996 Plan); The B.F.Goodrich Company Stock Option Plan (effective April 15, 1999) (the1999 Plan); the Goodrich Corporation 2001 Equity Compensation Plan (the 2001 Plan); and theGoodrich Corporation Employee Stock Purchase Plan (the ESPP).
We have two compensation plans (the Goodrich Corporation Outside Directors’ Deferral Planand the Goodrich Corporation Directors’ Deferred Compensation Plan) that were not approvedby shareholders (excluding plans we assumed in acquisitions) under which our equity securitiesare authorized for issuance to employees or directors in exchange for goods or services.
129
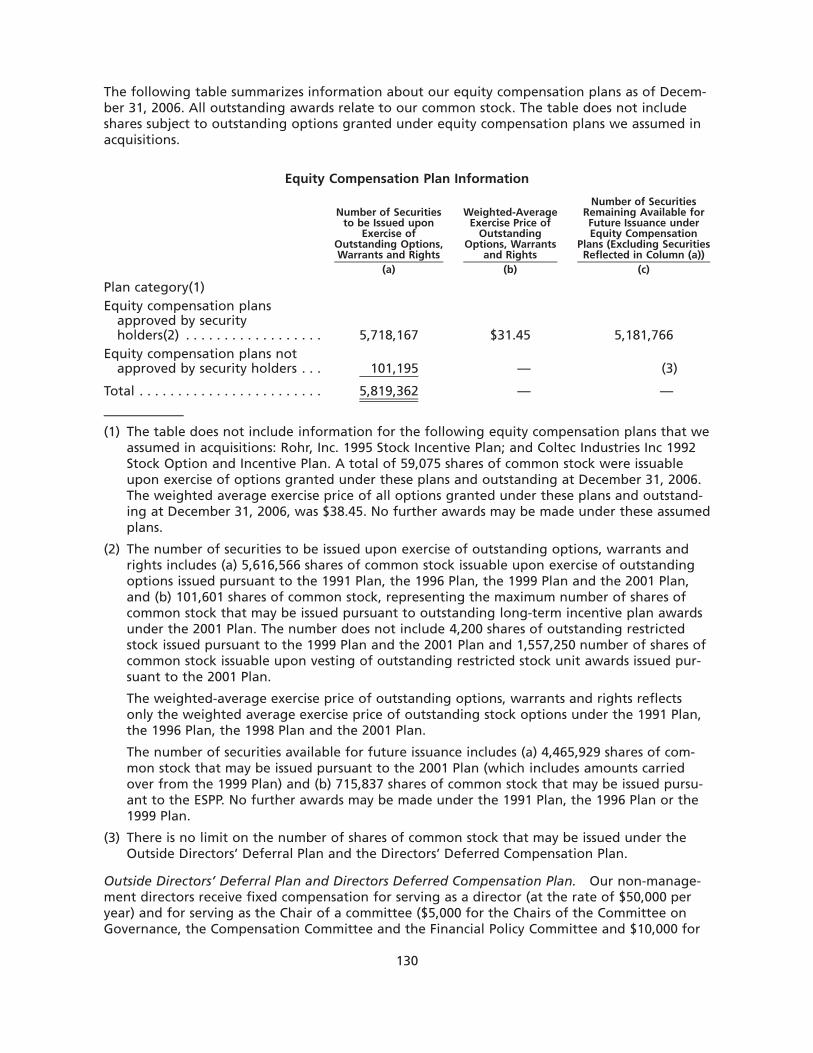
The following table summarizes information about our equity compensation plans as of Decem-ber 31, 2006. All outstanding awards relate to our common stock. The table does not includeshares subject to outstanding options granted under equity compensation plans we assumed inacquisitions.
Equity Compensation Plan Information
Number of Securitiesto be Issued upon
Exercise ofOutstanding Options,Warrants and Rights
Weighted-AverageExercise Price of
OutstandingOptions, Warrants
and Rights
Number of SecuritiesRemaining Available forFuture Issuance underEquity Compensation
Plans (Excluding SecuritiesReflected in Column (a))
(a) (b) (c)
Plan category(1)Equity compensation plans
approved by securityholders(2) . . . . . . . . . . . . . . . . . . 5,718,167 $31.45 5,181,766
Equity compensation plans notapproved by security holders . . . 101,195 — (3)
Total . . . . . . . . . . . . . . . . . . . . . . . . 5,819,362 — —
(1) The table does not include information for the following equity compensation plans that weassumed in acquisitions: Rohr, Inc. 1995 Stock Incentive Plan; and Coltec Industries Inc 1992Stock Option and Incentive Plan. A total of 59,075 shares of common stock were issuableupon exercise of options granted under these plans and outstanding at December 31, 2006.The weighted average exercise price of all options granted under these plans and outstand-ing at December 31, 2006, was $38.45. No further awards may be made under these assumedplans.
(2) The number of securities to be issued upon exercise of outstanding options, warrants andrights includes (a) 5,616,566 shares of common stock issuable upon exercise of outstandingoptions issued pursuant to the 1991 Plan, the 1996 Plan, the 1999 Plan and the 2001 Plan,and (b) 101,601 shares of common stock, representing the maximum number of shares ofcommon stock that may be issued pursuant to outstanding long-term incentive plan awardsunder the 2001 Plan. The number does not include 4,200 shares of outstanding restrictedstock issued pursuant to the 1999 Plan and the 2001 Plan and 1,557,250 number of shares ofcommon stock issuable upon vesting of outstanding restricted stock unit awards issued pur-suant to the 2001 Plan.
The weighted-average exercise price of outstanding options, warrants and rights reflectsonly the weighted average exercise price of outstanding stock options under the 1991 Plan,the 1996 Plan, the 1998 Plan and the 2001 Plan.
The number of securities available for future issuance includes (a) 4,465,929 shares of com-mon stock that may be issued pursuant to the 2001 Plan (which includes amounts carriedover from the 1999 Plan) and (b) 715,837 shares of common stock that may be issued pursu-ant to the ESPP. No further awards may be made under the 1991 Plan, the 1996 Plan or the1999 Plan.
(3) There is no limit on the number of shares of common stock that may be issued under theOutside Directors’ Deferral Plan and the Directors’ Deferred Compensation Plan.
Outside Directors’ Deferral Plan and Directors Deferred Compensation Plan. Our non-manage-ment directors receive fixed compensation for serving as a director (at the rate of $50,000 peryear) and for serving as the Chair of a committee ($5,000 for the Chairs of the Committee onGovernance, the Compensation Committee and the Financial Policy Committee and $10,000 for
130
the Chair of the Audit Review Committee) plus $1,500 for each Board and Board committeemeeting attended.
Pursuant to the Outside Directors’ Deferral Plan, non-management Directors may elect to defera portion or all of the annual retainer and meeting fees into either a phantom Goodrich shareaccount or a cash account. Amounts deferred into the phantom share account accrue dividendequivalents, and amounts deferred into the cash account accrue interest at the prime rate. Theplan provides that amounts deferred into the phantom share account are paid out in shares ofCommon Stock, and amounts deferred into the cash account are paid out in cash, in each casefollowing termination of service as a Director in either a single lump sum, five annualinstallments or ten annual installments.
Prior to 2005, non-management Directors could elect to defer a portion or all of the annualretainer and meeting fees into a phantom Goodrich share account pursuant to the Directors’Deferred Compensation Plan. The plan provides that amounts deferred into the account arepaid out in shares of Common Stock following termination of service as a Director. Dividendequivalents accrue on all phantom shares credited to a Director’s account.
Item 13. Certain Relationships and Related Transactions, and Director Independence
Information appearing under the captions “Governance of the Company-Policy on Related PartyTransactions” and “Governance of the Company-Director Independence; Audit CommitteeExpert” in our 2007 proxy statement is incorporated herein by reference.
Item 14. Principal Accounting Fees and Services
Information appearing under the captions “Proposals to Shareholders-2. Ratification of Appoint-ment of Independent Auditors — Fees to Independent Auditors for 2006 and 2005” and“Appointment of Independent Auditors — Audit Review Committee Pre-Approval Policy” in our2007 proxy statement is incorporated by reference herein.
Item 15. Exhibits and Financial Statement Schedules
(a) Documents filed as part of this report:
(1) Consolidated Financial Statements.
The consolidated financial statements filed as part of this report are listed in Part II,Item 8 in the Index to Consolidated Financial Statements.
(2) Consolidated Financial Statement Schedules: Schedules have been omitted because theyare not applicable or the required information is shown in the Consolidated FinancialStatements or the Notes to the Consolidated Financial Statements.
(3) Listing of Exhibits: A listing of exhibits is on pages 133 to 136 of this Form 10-K.
(b) Exhibits. See the Exhibit Index beginning at page 133 of this report. For a listing of allmanagement contracts and compensatory plans or arrangements required to be filed asexhibits to this report, see the exhibits listed under Exhibit Nos. 10.8 through 10.55.
(c) Not applicable.
131

SIGNATURES
PURSUANT TO THE REQUIREMENTS OF SECTION 13 OR 15(d) OF THE SECURITIES EXCHANGE ACTOF 1934, THE REGISTRANT HAS DULY CAUSED THIS REPORT TO BE SIGNED ON ITS BEHALF BYTHE UNDERSIGNED, THEREUNTO DULY AUTHORIZED ON FEBRUARY 20, 2007
GOODRICH CORPORATION
(Registrant)
By: /s/ MARSHALL O. LARSEN
Marshall O. Larsen,Chairman, President and Chief Executive
Officer
PURSUANT TO THE REQUIREMENTS OF THE SECURITIES EXCHANGE ACT OF 1934, THIS REPORTHAS BEEN SIGNED BELOW ON FEBRUARY 20, 2007 BY THE FOLLOWING PERSONS ON BEHALF OFTHE REGISTRANT AND IN THE CAPACITIES INDICATED.
/s/ MARSHALL O. LARSEN
Marshall O. LarsenChairman, President and ChiefExecutive Officer and Director
(Principal Executive Officer)
/s/ WILLIAM R. HOLLAND
William R. HollandDirector
/s/ SCOTT E. KUECHLE
Scott E. KuechleSenior Vice President and Chief
Financial Officer(Principal Financial Officer)
/s/ JOHN P. JUMPER
John P. JumperDirector
/s/ SCOTT A. COTTRILL
Scott A. CottrillVice President and Controller(Principal Accounting Officer)
/s/ LLOYD W. NEWTON
Lloyd W. NewtonDirector
/s/ DIANE C. CREEL
Diane C. CreelDirector
/s/ DOUGLAS E. OLESEN
Douglas E. OlesenDirector
/s/ GEORGE A. DAVIDSON, JR
George A. Davidson, JrDirector
/s/ ALFRED M. RANKIN, JR.Alfred M. Rankin, Jr.
Director
/s/ HARRIS E. DELOACH, JR
Harris E. DeLoach, JrDirector
/s/ JAMES R. WILSON
James R. WilsonDirector
/s/ JAMES W. GRIFFITH
James W. GriffithDirector
/s/ A. THOMAS YOUNG
A. Thomas YoungDirector
132
EXHIBIT INDEXExhibitNumber Description
2.1 — Agreement for Sale and Purchase of Assets Between The B.F.Goodrich Company andPMD Group Inc., dated as of November 28, 2000, filed as Exhibit 2(A) to the Company’sAnnual Report on Form 10-K for the year ended December 31, 2000, is incorporatedherein by reference.
2.2 — Distribution Agreement dated as of May 31, 2002 by and among GoodrichCorporation, EnPro Industries, Inc. and Coltec Industries Inc., filed as Exhibit 2(A) toGoodrich Corporation’s Quarterly Report on Form 10-Q for the quarter ended June 30,2002, is incorporated herein by reference.
2.3 — Master Agreement of Purchase and Sale dated as of June 18, 2002 between GoodrichCorporation and TRW Inc., filed as Exhibit 2(B) to Goodrich Corporation’s QuarterlyReport on Form 10-Q for the quarter ended June 30, 2002, is incorporated herein byreference.
2.4 — Amendment No. 1 dated as of October 1, 2002 to Master Agreement of Purchase andSale dated as of June 18, 2002 between Goodrich Corporation and TRW Inc., filed asExhibit 2.2 to Goodrich Corporation’s Current Report on Form 8-K filed October 16,2002, is incorporated herein by reference.
2.5 — Settlement Agreement effective as of December 27, 2004 by and between NorthropGrumman Space & Mission Systems Corp., as successor by merger to TRW, Inc., andGoodrich Corporation, filed as Exhibit 2(E) to the Company’s Annual Report onForm 10-K for the year ended December 31, 2004, is incorporated by reference herein.
3.1 — Restated Certificate of Incorporation of Goodrich Corporation, filed as Exhibit 3.1 toGoodrich Corporation’s Quarterly Report on Form 10-Q for the quarter endedSeptember 30, 2003, is incorporated herein by reference.
3.2 — By-Laws of Goodrich Corporation, as amended, filed as Exhibit 4(B) to GoodrichCorporation’s Registration Statement on Form S-3 (File No. 333-98165), is incorporatedherein by reference.
4.1 — Rights Agreement, dated as of June 2, 1997, between The B.F.Goodrich Company andThe Bank of New York which includes the form of Certificate of Amendment settingforth the terms of the Junior Participating Preferred Stock, Series F, par value $1 pershare, as Exhibit A, the form of Right Certificate as Exhibit B and the Summary ofRights to Purchase Preferred Shares as Exhibit C, filed as Exhibit 1 to the Company’sRegistration Statement on Form 8-A filed June 19, 1997, is incorporated herein byreference.
4.2 — Indenture dated as of May 1, 1991 between Goodrich Corporation and The Bank ofNew York, as successor to Harris Trust and Savings Bank, as Trustee, filed as Exhibit 4 toGoodrich Corporation’s Registration Statement on Form S-3 (File No. 33-40127), isincorporated herein by reference.
4.3 — Agreement of Resignation, Appointment and Acceptance effective February 4, 2005 byand among Goodrich Corporation, The Bank of New York and The Bank of New YorkTrust Company, N.A., filed as Exhibit 4(C) to the Company’s Annual Report onForm 10-K for the year ended December 31, 2004, is incorporated by reference herein.Information relating to the Company’s long-term debt is set forth in Note 13 —’Financing Arrangements’ to the Company’s financial statements, which are filed aspart of this Annual Report on Form 10-K. Except for Exhibit 4.2, instruments definingthe rights of holders of such long-term debt are not filed herewith since no singleitem exceeds 10% of consolidated assets. Copies of such instruments will be furnishedto the Commission upon request.
10.1 — Amended and Restated Assumption of Liabilities and Indemnification Agreementbetween the Company and The Geon Company, filed as Exhibit 10.3 to theRegistration Statement on Form S-1 (No. 33-70998) of The Geon Company, isincorporated herein by reference.
133
ExhibitNumber Description
10.2 — Tax Matters Arrangements dated as of May 31, 2002 between Goodrich Corporationand EnPro Industries, Inc., filed as Exhibit 10(LL) to Goodrich Corporation’s QuarterlyReport on Form 10-Q for the quarter ended June 30, 2002, is incorporated herein byreference.
10.3 — Transition Services Agreement dated as of May 31, 2002 between GoodrichCorporation and EnPro Industries, Inc., filed as Exhibit 10(MM) to GoodrichCorporation’s Quarterly Report on Form 10-Q for the quarter ended June 30, 2002, isincorporated herein by reference.
10.4 — Employee Matters Agreement dated as of May 31, 2002 between GoodrichCorporation and EnPro Industries, Inc., filed as Exhibit 10(NN) to GoodrichCorporation’s Quarterly Report on Form 10-Q for the quarter ended June 30, 2002, isincorporated herein by reference.
10.5 — Indemnification Agreement dated as of May 31, 2002 among Goodrich Corporation,EnPro Industries, Inc., Coltec Industries Inc and Coltec Capital Trust, filed asExhibit 10(OO) to Goodrich Corporation’s Quarterly Report on Form 10-Q for thequarter ended June 30, 2002, is incorporated herein by reference.
10.6 — Five Year Credit Agreement dated as of May 25, 2005 among Goodrich Corporation,the lenders parties thereto and Citibank, N.A., as agent for such lenders, filed asExhibit 10.1 to Goodrich Corporation’s Current Report on Form 8-K filed June 1, 2005,is incorporated herein by reference.
10.7 — Letter Amendment to Five Year Credit Agreement dated as of December 1, 2006, filedas Exhibit 10.1 to the Company’s Current Report on Form 8-K filed December 5, 2006,is incorporated by reference herein.
10.8 — Key Employees’ Stock Option Plan (effective April 15, 1991), filed as Exhibit 10(K) tothe Company’s Annual Report on Form 10-K for the year ended December 31, 2002, isincorporated herein by reference.
10.9 — Stock Option Plan (effective April 15, 1996), filed as Exhibit 10(A) to the Company’sAnnual Report on Form 10-K for the year ended December 31, 1998, is incorporatedherein by reference.
10.10 — Stock Option Plan (effective April 19, 1999), filed as Appendix B to the Company’sdefinitive proxy statement filed March 4, 1999, is incorporated herein by reference.
10.11 — Goodrich Corporation 2001 Equity Compensation Plan, filed as Appendix B toGoodrich Corporation’s 2005 proxy statement dated March 7, 2005, is incorporatedherein by reference.
10.12 — Amendment Number One to the Goodrich Corporation 2001 Equity CompensationPlan.*
10.13 — Form of nonqualified stock option award agreement, filed as Exhibit 10.1 to theCompany’s Quarterly Report on Form 10-Q for the quarter ended September 30, 2005,is incorporated herein by reference.
10.14 — Form of restricted stock award agreement, filed as Exhibit 10.2 to the Company’sQuarterly Report on Form 10-Q for the quarter ended September 30, 2005, isincorporated herein by reference.
10.15 — Form of restricted stock unit award agreement, filed as Exhibit 10.3 to the Company’sQuarterly Report on Form 10-Q for the quarter ended September 30, 2005, isincorporated herein by reference.
10.16 — Form of restricted stock unit special award agreement, filed as Exhibit 10.4 to theCompany’s Quarterly Report on Form 10-Q for the quarter ended September 30, 2005,is incorporated by reference herein.
10.17 — Form of performance unit award agreement, filed as Exhibit 10.5 to the Company’sQuarterly Report on Form 10-Q for the quarter ended September 30, 2005, isincorporated herein by reference.
134
ExhibitNumber Description
10.18 — Form of stock option award agreement.*10.19 — Form of restricted stock unit award agreement.*10.20 — Form of performance unit award agreement.*10.21 — Form of restricted stock award agreement.*10.22 — Form of restricted stock unit special award agreement.*10.23 — Form of stock option special award agreement.*10.24 — Form of award letter for 2004 stock-based compensation awards to executive officers,
filed as Exhibit 10.1 to the Company’s Quarterly Report on Form 10-Q for the quarterended June 30, 2004, is incorporated by reference herein.
10.25 — Performance Share Deferred Compensation Plan Summary Plan Description, filed asExhibit 10(LL) to the Company’s Quarterly Report on Form 10-Q for the quarter endedMarch 31, 2000, is incorporated herein by reference.
10.26 — Goodrich Corporation Management Incentive Program.*10.27 — Goodrich Corporation Senior Executive Management Incentive Plan, filed as
Appendix C to the Company’s 2005 Proxy Statement dated March 7, 2005, isincorporated herein by reference.
10.28 — Amendment Number One to the Goodrich Corporation Senior Management IncentivePlan.*
10.29 — Form of Disability Benefit Agreement, filed as Exhibit 10(U) to the Company’s AnnualReport on Form 10-K for the year ended December 31, 2003, is incorporated byreference herein.
10.30 — Form of Supplemental Executive Retirement Plan Agreement, filed as Exhibit 10(w) tothe Company’s Annual Report on Form 10-K for the year ended December 31, 2005, isincorporated herein by reference.
10.31 — Goodrich Corporation Benefit Restoration Plan (amended and restated effectiveJanuary 1, 2002), filed as Exhibit 10.6 to the Company’s Quarterly Report on Form 10-Qfor the quarter ended September 30, 2005, is incorporated herein by reference.
10.32 — Goodrich Corporation Savings Benefit Restoration Plan (amended and restatedeffective January 1, 2002), filed as Exhibit 10.7 to the Company’s Quarterly Report onForm 10-Q for the quarter ended September 30, 2005, is incorporated herein byreference.
10.33 — Goodrich Corporation Severance Plan (amended and restated effective February 21,2006), filed as Exhibit 10(1) to the Company’s Quarterly Report on Form 10-Q for thequarter ended March 31, 2006, is incorporated herein by reference.
10.34 — Amendment Number 1 to the Goodrich Corporation Severance Program, filed asExhibit 10.1 to the Company’s Quarterly Report on Form 10-Q for the quarter endedSeptember 30, 2006, is incorporated herein by reference.
10.35 — Amendment Number 2 to the Goodrich Corporation Severance Plan.*10.36 — Form of Management Continuity Agreement entered into by Goodrich Corporation
and certain of its employees, filed as Exhibit 10(BB) to the Company’s Annual Reporton Form 10-K for the year ended December 31, 2004, is incorporated by referenceherein.
10.37 — Form of Director and Officer Indemnification Agreement between GoodrichCorporation and certain of its directors, officers and employees, filed as Exhibit 10(AA)to the Company’s Annual Report on Form 10-K for the year ended December 31, 2003,is incorporated by reference herein.
10.38 — Coltec Industries Inc 1992 Stock Option and Incentive Plan (as amended through May 7,1998), filed as Exhibit 10(EE) to the Company’s Annual Report on Form 10-K for theyear ended December 31, 2002, is incorporated herein by reference.
135
ExhibitNumber Description
10.39 — Rohr, Inc. 1995 Stock Incentive Plan, filed as Exhibit 10(FF) to the Company’s AnnualReport on Form 10-K for the year ended December 31, 2002, is incorporated herein byreference.
10.40 — First Amendment to the Rohr, Inc. 1995 Stock Incentive Plan, filed as Exhibit 10(GG) tothe Company’s Annual Report on Form 10-K for the year ended December 31, 2002, isincorporated herein by reference.
10.41 — Second Amendment to the Rohr, Inc. 1995 Stock Incentive Plan, filed as Exhibit 10(HH)to the Company’s Annual Report on Form 10-K for the year ended December 31, 2002,is incorporated herein by reference.
10.42 — Employee Stock Purchase Plan, filed as Exhibit E to the Company’s 2001 ProxyStatement dated March 5, 2001, is incorporated herein by reference.
10.43 — Amendment Number One to the Employee Stock Purchase Plan, filed as Exhibit 10(KK)to the Company’s Quarterly Report on Form 10-Q for the quarter ended September 30,2001, is incorporated herein by reference.
10.44 — Goodrich Corporation Directors’ Phantom Share Plan, as filed as Exhibit 10(II) to theCompany’s Annual Report on Form 10-K for the year ended December 31, 2003, isincorporated by reference herein.
10.45 — Goodrich Corporation Directors’ Deferred Compensation Plan, filed as Exhibit 10.2 tothe Company’s Quarterly Report on Form 10-Q for the quarter ended June 30, 2004, isincorporated herein by reference.
10.46 — Goodrich Corporation Outside Director Deferral Plan, filed as Exhibit 10(MM) to theCompany’s Annual Report on Form 10-K for the year ended December 31, 2004, isincorporated by reference herein.
10.47 — Amendment Number One to the Goodrich Corporation Outside Director Deferral Plan.*10.48 — Goodrich Corporation Outside Director Phantom Share Plan, filed as Exhibit 10(NN) to
the Company’s Annual Report on Form 10-K for the year ended December 31, 2004, isincorporated by reference herein.
10.49 — Amendment Number One to the Goodrich Corporation Outside Director PhantomShare Plan.*
10.50 — Employment Arrangements for the Named Executive Officers.*10.51 — Compensation Arrangements for Non-Management Directors.*10.52 — Executive Life Insurance Agreement between the Company and Terrence G. Linnert
dated December 28, 2006, filed as Exhibit 10.1 to the Company’s Current Report onForm 8-K filed December 29, 2006, is incorporated herein by reference.
10.53 — Executive Life Insurance Agreement between the Company and John J. Carmola datedDecember 28, 2006, filed as Exhibit 10.2 to the Company’s Current Report on Form 8-Kfiled December 29, 2006, is incorporated herein by reference.
10.54 — Executive Life Insurance Agreement between the Company and John J. Grisik datedDecember 28, 2006, filed as Exhibit 10.3 to the Company’s Current Report on Form 8-Kfiled December 29, 2006, is incorporated herein by reference.
10.55 — Form of Executive Life Insurance Agreement between the Company and certain of itsemployees dated December 28, 2006, filed as Exhibit 10.4 to the Company’s CurrentReport on Form 8-K filed December 29, 2006, is incorporated herein by reference.
21 — Subsidiaries.*23 — Consent of Independent Registered Public Accounting Firm — Ernst & Young LLP.*31 — Rule 13a-14(a)/15d-14(a) Certifications.*32 — Section 1350 Certifications.*
* Submitted electronically herewith
136

an
nu
al R
epo
rt 2
00
6
CORPORaTE OFFiCERS
BOaRD OF DiRECTORS
diane c. creelChairman, Chief Executive Officer and President Ecovation, inc., a waste water management systems company.Director since 1997. (2,5)
george a. davidson, Jr.Retired Chairman Dominion Resources, inc., a natural gas and electric power holding company.Director since 1991. (2,5)
harris e. deLoach, Jr.Chairman, President and Chief Executive Officer Sonoco Products Company, a worldwide, vertically integrated packaging company.Director since 2001. (1,3,4)
James W. griffithPresident and Chief Executive Officer The Timken Company, an international manufacturer of highly engineered bearings, alloy and specialty steels and components.Director since 2002. (2,4)
alfred M. rankin, Jr.Chairman, President and Chief Executive Officer NaCCO industries, inc., an operating holding company with interests in lignite coal, forklift trucks and small household electric appliances.Director since 1988. (1,3,4)
James r. WilsonRetired Chairman, President and Chief Executive Officer Cordant Technologies inc., a manufacturer of aerospace and industrial products.Director since 1997. (2,5)
a. thomas Young Retired Executive Vice President, Lockheed Martin Corporation, an aerospace and defense company.Director since 1995. (2,3)
Committees of the Board(1) Executive Committee (2) Compensation Committee (3) Audit Review Committee (4) Committee on Governance (5) Financial Policy Committee
William r. hollandRetired Chairman United Dominion industries, a diversified manufacturing company.Director since 1999. (4,5)
John p. JumperGeneral, United States air Force (Ret.)Director since 2005. (3,5)
Marshall O. LarsenChairman, President and Chief Executive Officer Goodrich CorporationDirector since 2002. (1)
Lloyd W. newtonGeneral, United States air Force (Ret.)Director since 2006. (2,5)
douglas e. OlesenRetired President and Chief Executive Officer Battelle Memorial institute, a worldwide technology organization working for government and industry.Director since 1996. (3,5)
Marshall O. LarsenChairman, President and Chief Executive Officer
segMent presidents
John J. carmolaVice President and Segment President, actuation and Landing Systems
cynthia M. egnotovichVice President and Segment President, Nacelles and interior Systems
gerald t. WitowskiVice President and Segment President, Electronic Systems
eXecutive vice presidents
John J. grisikExecutive Vice President, Operational Excellence and Technology
terrence g. LinnertExecutive Vice President, administration and General Counsel
seniOr vice presidents
scott e. kuechleSenior Vice President and Chief Financial Officer
Jennifer pollinoSenior Vice President, human Resources
vice presidents
Joseph f. andolinoVice President, Business Development and Tax
scott a. cottrillVice President and Controller
sally L. geibVice President, associate General Counsel and Secretary
houghton LewisVice President and Treasurer
William g. stiehlVice President, internal audit
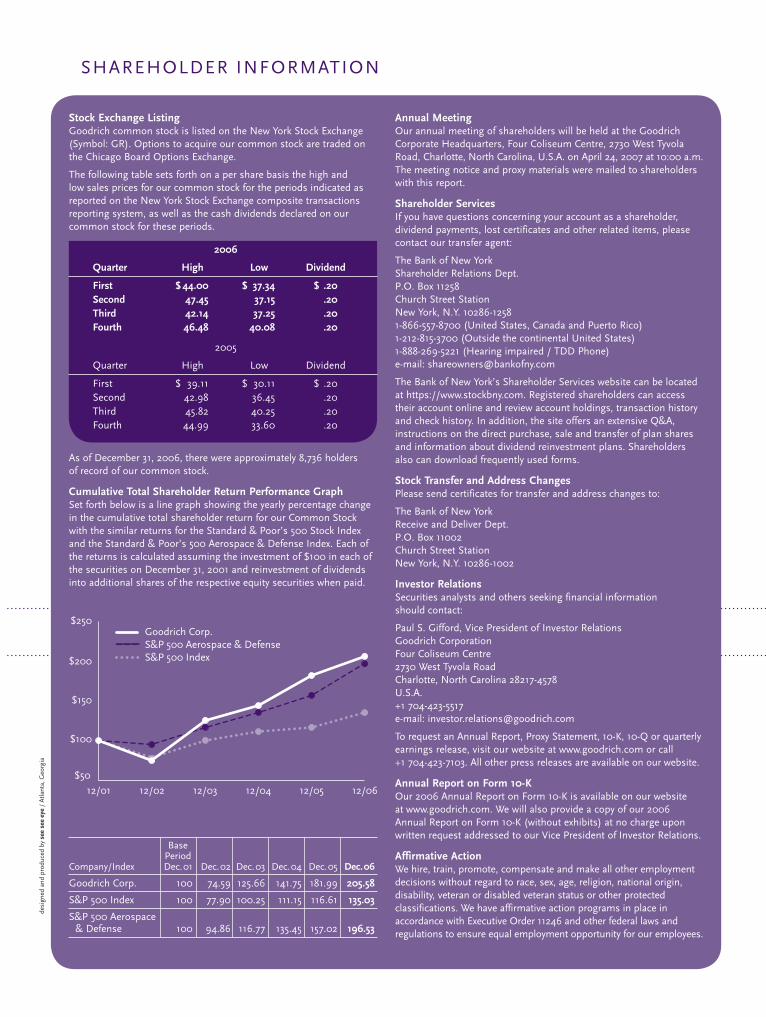
BUildiNG SUSTAiNABle loNG-TeRm VAlUegoodrich is making excellent progress on its three strategic imperatives of balanced
growth, leveraging the enterprise and operational excellence. From winning new positions
on key strategic commercial aerospace and defense platforms to adding global aftermarket
capacity, as well as a relentless focus on operational excellence, we’re well-positioned
to deliver sustainable long-term value to our customers and shareholders.
Commercial and general 36% aviation aftermarket
Commercial and general 33% aviation original equipment
defense and space 25%
other 6%
% of 2006 sales04
Sal
es i
n b
illi
on
s
$4.7
$5.4
05
$5.9
06 04
Seg
men
t o
per
atin
g in
com
e
as %
of
sale
s
10.4%
11.5%
05
13.0%
06
desi
gned
and
pro
duce
d by
see
see
eye
/ A
tlant
a, G
eorg
ia
annual Meetingour annual meeting of shareholders will be held at the Goodrich Corporate Headquarters, Four Coliseum Centre, 2730 West Tyvola Road, Charlotte, North Carolina, U.S.A. on April 24, 2007 at 10:00 a.m. The meeting notice and proxy materials were mailed to shareholders with this report.
shareholder servicesif you have questions concerning your account as a shareholder, dividend payments, lost certificates and other related items, please contact our transfer agent:
The Bank of New York Shareholder Relations dept. P.o. Box 11258 Church Street Station New York, N.Y. 10286-1258 1-866-557-8700 (United States, Canada and Puerto Rico) 1-212-815-3700 (outside the continental United States) 1-888-269-5221 (Hearing impaired / Tdd Phone) e-mail: [email protected]
The Bank of New York’s Shareholder Services website can be located at https://www.stockbny.com. Registered shareholders can access their account online and review account holdings, transaction history and check history. in addition, the site offers an extensive Q&A, instructions on the direct purchase, sale and transfer of plan shares and information about dividend reinvestment plans. Shareholders also can download frequently used forms.
stock transfer and address changesPlease send certificates for transfer and address changes to:
The Bank of New York Receive and deliver dept. P.o. Box 11002 Church Street Station New York, N.Y. 10286-1002
investor relationsSecurities analysts and others seeking financial information should contact:
Paul S. Gifford, Vice President of investor Relations Goodrich Corporation Four Coliseum Centre 2730 West Tyvola Road Charlotte, North Carolina 28217-4578 U.S.A. +1 704-423-5517 e-mail: [email protected]
To request an Annual Report, Proxy Statement, 10-K, 10-Q or quarterly earnings release, visit our website at www.goodrich.com or call +1 704-423-7103. All other press releases are available on our website.
annual report on Form 10-Kour 2006 Annual Report on Form 10-K is available on our website at www.goodrich.com. We will also provide a copy of our 2006 Annual Report on Form 10-K (without exhibits) at no charge upon written request addressed to our Vice President of investor Relations.
affirmative actionWe hire, train, promote, compensate and make all other employment decisions without regard to race, sex, age, religion, national origin, disability, veteran or disabled veteran status or other protected classifications. We have affirmative action programs in place in accordance with executive order 11246 and other federal laws and regulations to ensure equal employment opportunity for our employees.
SHAReHoldeR iNFoRmATioN
stock exchange listingGoodrich common stock is listed on the New York Stock exchange (Symbol: GR). options to acquire our common stock are traded on the Chicago Board options exchange.
The following table sets forth on a per share basis the high and low sales prices for our common stock for the periods indicated as reported on the New York Stock exchange composite transactions reporting system, as well as the cash dividends declared on our common stock for these periods.
2006
Quarter high low dividend
First $ 44.00 $ 37.34 $ .20second 47.45 37.15 .20third 42.14 37.25 .20Fourth 46.48 40.08 .20
2005
Quarter High low dividend
First $ 39.11 $ 30.11 $ .20Second 42.98 36.45 .20Third 45.82 40.25 .20Fourth 44.99 33.60 .20
As of december 31, 2006, there were approximately 8,736 holders of record of our common stock.
cumulative total shareholder return performance graphSet forth below is a line graph showing the yearly percentage change in the cumulative total shareholder return for our Common Stock with the similar returns for the Standard & Poor’s 500 Stock index and the Standard & Poor’s 500 Aerospace & defense index. each of the returns is calculated assuming the investment of $100 in each of the securities on december 31, 2001 and reinvestment of dividends into additional shares of the respective equity securities when paid.
Margins MarKet balancesales
operational excellence
leveraging the enterprise
balanced growth
people
prod
ucts
customers
processes
$50
$100
$150
$200
$250Goodrich Corp.S&P 500 Aerospace & DefenseS&P 500 Index
12/0612/0512/0412/0312/0212/01
Base PeriodCompany/index dec. 01 dec. 02 dec. 03 dec. 04 dec. 05 dec. 06
Goodrich Corp. 100 74.59 125.66 141.75 181.99 205.58
S&P 500 index 100 77.90 100.25 111.15 116.61 135.03
S&P 500 Aerospace & defense 100 94.86 116.77 135.45 157.02 196.53

Four Coliseum Centre 2730 West Tyvola Road
Charlotte, NC 28217-4578 USA
+1 704-423-7000 | www.goodrich.com
Goodrich C
orporation Annual R
eport 200
6
Goodrich Corporation Annual Report 2006
right attitude.right approach.right alongside. We’re on it.™