Embed Size (px)
Citation preview

0
January 2015
Multi-caps: Synergies of Scale & Scope (Scale of Large Caps + Scope of Midcaps)
Outline
1
Improving Fundamentals 1
Multi-Caps: Advantages Galore
3
How to participate in equities 2
Franklin Templeton Multi-cap Offerings: A snapshot
4
CLICK HERE TO INVEST NOW
Outline
2
Multi-Caps: Advantages Galore
3
How can one participate in equities
2
Franklin Templeton Multi-cap Offerings: A snapshot
4
Improving Fundamentals 1
CLICK HERE TO INVEST NOW
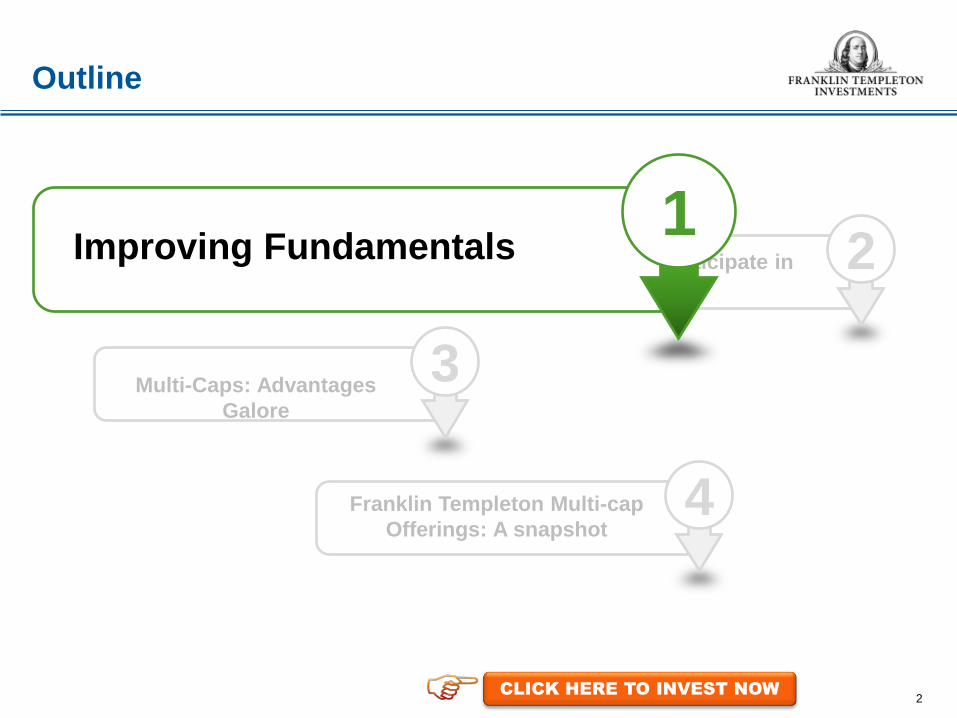
Reducing twin deficits and rising inflows
3
Source: Budget Documents, Citi Research, November‟ and December „14,
*Estimated Fiscal Deficit by RBI and Estimated CAD by Citi Research
Fiscal Deficit and Current Account Deficit – likely to be kept under control FII Flows robust ($16.1 bn in 2014 )and DIIs return (Aug’14, Oct’14 & Dec ‘14)
Source: RBI, Citi Research, December‟ 14
Trend in Fiscal Deficit and Current account Deficit (% of GDP)
FII & DII Investments
2.3 2.8 2.7
4.2 4.8
1.7 1.6
6 6.5
4.8
5.7
4.8 4.5
4.1
0
1
2
3
4
5
6
7
FY09 FY10 FY11 FY12 FY13 FY14 FY15E*
Current Account Deficit Fiscal Deficit
-3,000
-2,000
-1,000
0
1,000
2,000
3,000
4,000
No
v-13
De
c-13
Jan-
14
Feb
-14
Ma
r-1
4
Apr
-14
Ma
y-1
4
Jun-
14
Jul-1
4
Aug
-14
Sep
-14
Oct
-14
No
v-14
De
c-14
Net FII (USD Million) Net DII (USD Million)
CLICK HERE TO INVEST NOW

Growth – inflation dynamics
4
Based on historical data, low growth, low inflation – seem supportive for lower interest rates
WPI & CPI Inflation: GDP: Repo Rate:
CPI Inflation: WPI Inflation:
GDP: Repo Rate:
CPI Inflation: WPI Inflation:
GDP: Repo Rate:
Source(latest available data): As on December „14. RBI. *Jan-2002 to Dec-2011: Consumer Price Index (CPI) – Industrial Workers, while Jan-2012 onwards: Consumer Price Index (CPI) combined data (new series). For CPI – Industrial Workers, inflation data is not available for the months of Jan 2006 to Dec 2006, as the base year 2001 index series started from Jan 2006, and therefore YoY comparison is not possible for the mentioned months. ^ WPI = Wholesale Price Index
-2
0
2
4
6
8
10
12
-
2.00
4.00
6.00
8.00
10.00
12.00
14.00
16.00
18.00
Jan-
02
Jun-
02
No
v-02
Apr
-03
Sep
-03
Feb
-04
Jul-0
4
De
c-04
Ma
y-0
5
Oct
-05
Ma
r-0
6
Aug
-06
Jan-
07
Jun-
07
No
v-07
Apr
-08
Sep
-08
Feb
-09
Jul-0
9
De
c-09
Ma
y-1
0
Oct
-10
Ma
r-1
1
Aug
-11
Jan-
12
Jun-
12
No
v-12
Apr
-13
Sep
-13
Feb
-14
Jul-1
4
De
c-14
GDP Growth (%) - RHS CPI Inflation* (YoY %) - LHS WPI Inflation^ (YoY %) - RHS Repo Rate - RHS
CLICK HERE TO INVEST NOW
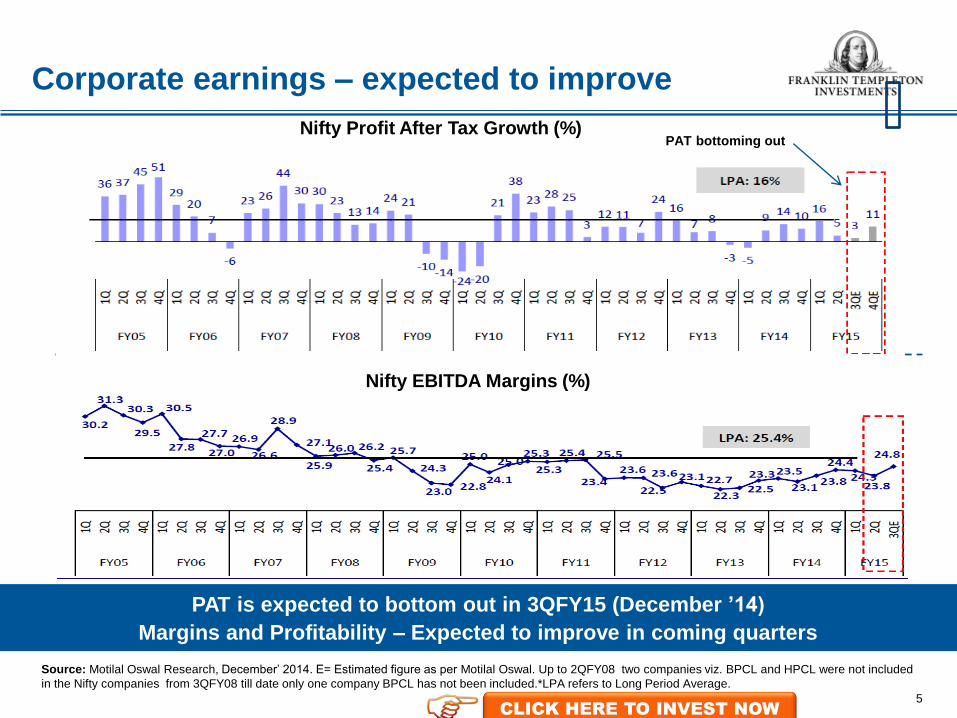
Corporate earnings – expected to improve
Nifty Profit After Tax Growth (%)
Source: Motilal Oswal Research, December‟ 2014. E= Estimated figure as per Motilal Oswal. Up to 2QFY08 two companies viz. BPCL and HPCL were not included in the Nifty companies from 3QFY08 till date only one company BPCL has not been included.*LPA refers to Long Period Average.
Nifty EBITDA Margins (%)
PAT is expected to bottom out in 3QFY15 (December ’14) Margins and Profitability – Expected to improve in coming quarters
5
PAT bottoming out
CLICK HERE TO INVEST NOW

Supportive structural factors
6
Source(latest available data): @ Economic Census 2011, $RBI statistics for FY13 and ^Ministry of Urban Development, RBI, Barclays Research estimates as on March „14.
Political stability Stable government at centre
Demographic dividend 65%@of population below 35 years
Saver’s nation Savings to GDP ratio at 30%$
Urbanisation Urban India to contribute ~70% -75% of India’s GDP by 2020^
India appears well placed
CLICK HERE TO INVEST NOW
Improving Fundamentals 1
z Risks 3
4 Franklin Templeton Multi-cap Offerings: A snapshot
Outline
7
How to participate in equities 2
CLICK HERE TO INVEST NOW
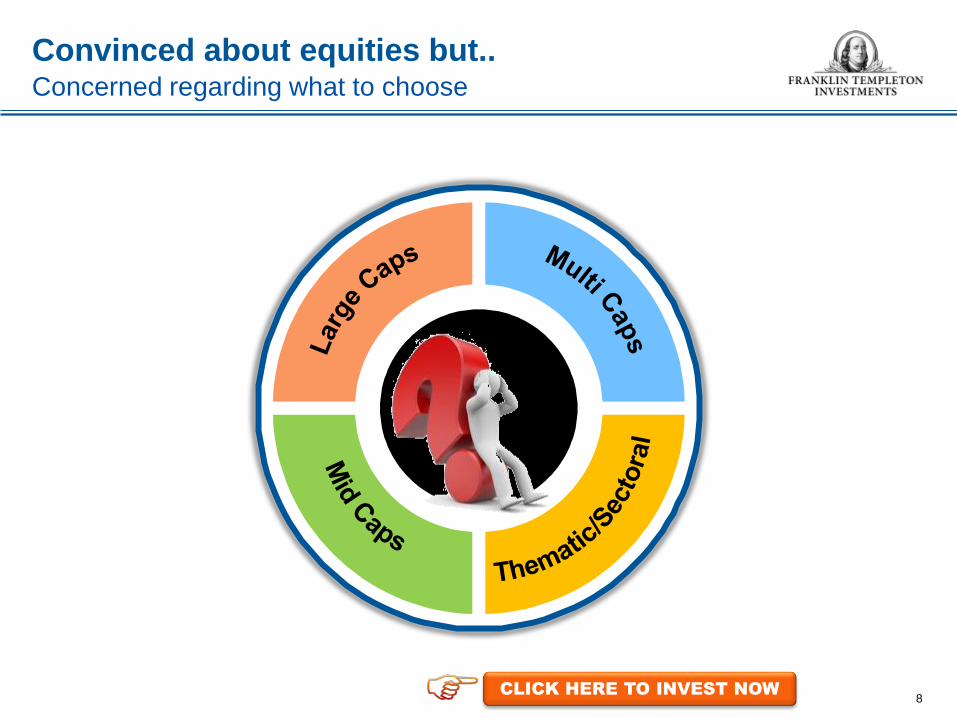
Convinced about equities but.. Concerned regarding what to choose
8 CLICK HERE TO INVEST NOW

Large Caps are essential
Capital efficiency
Leverage at competitive costs
Large scale operations Low marginal cost
Large balance sheets
Exposure to capital intensive businesses
Matured businesses Stability and visibility
High floating stock High liquidity
Diversified shareholder base Resilience during extreme
market movements
Generally have good corporate governance Trustworthy managements
Well researched Less surprises
Large Caps
9 CLICK HERE TO INVEST NOW

10
What do Large Caps Offer
Characteristic Large Caps
Diversification
Stock Level 50 stocks
Sector Level* 12 sectors
Market Cap Range** (INR) 13k crs – 501k crs
Return Potential^ Bull Market Moderate
Downside Risk^ Bear Market Relatively Lower
Volatility^ As per standard deviation Relatively Lower
Source: Large Caps are represented by CNX Nifty. *http://www.nseindia.com/content/indices/ind_cnx_nifty.pdf, **Market Cap for CNX Nifty taken as on December‟14. ̂ Return potential, downside risk and volatility is given in comparison to other market caps.
CLICK HERE TO INVEST NOW
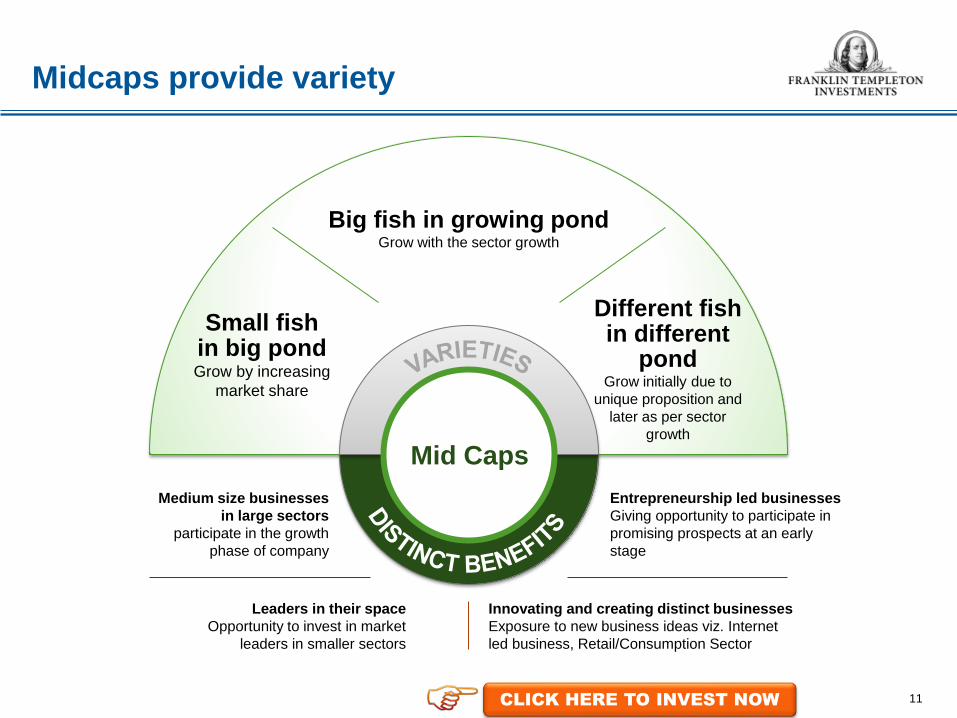
Midcaps provide variety
Small fish in big pond Grow by increasing
market share
Big fish in growing pond Grow with the sector growth
Different fish in different
pond Grow initially due to
unique proposition and later as per sector
growth
Medium size businesses in large sectors
participate in the growth phase of company
Leaders in their space Opportunity to invest in market
leaders in smaller sectors
Entrepreneurship led businesses Giving opportunity to participate in promising prospects at an early stage
Innovating and creating distinct businesses Exposure to new business ideas viz. Internet led business, Retail/Consumption Sector
Mid Caps
11 CLICK HERE TO INVEST NOW
12
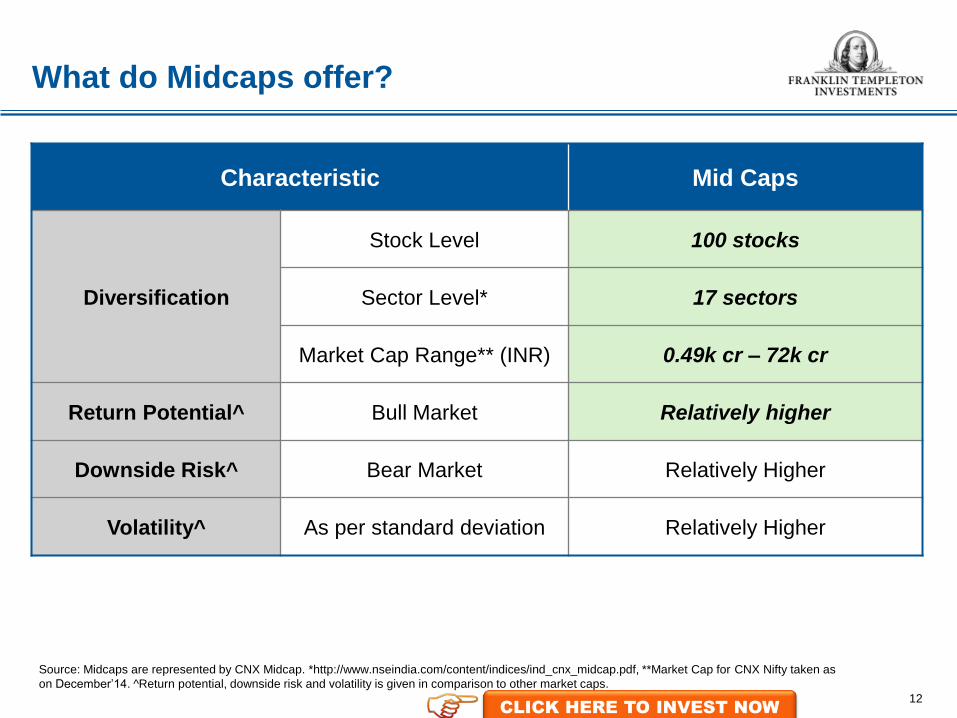
What do Midcaps offer?
Characteristic Mid Caps
Diversification
Stock Level 100 stocks
Sector Level* 17 sectors
Market Cap Range** (INR) 0.49k cr – 72k cr
Return Potential^ Bull Market Relatively higher
Downside Risk^ Bear Market Relatively Higher
Volatility^ As per standard deviation Relatively Higher
Source: Midcaps are represented by CNX Midcap. *http://www.nseindia.com/content/indices/ind_cnx_midcap.pdf, **Market Cap for CNX Nifty taken as on December‟14. ^Return potential, downside risk and volatility is given in comparison to other market caps.
CLICK HERE TO INVEST NOW

Thematic/Sectoral Investing
Concentrated bets
Focus on specific sectors/stocks
Time sensitive Identifying the trend at right time is important
Function of fundamental
change Led by changing
landscape of economy/sector
Take high conviction bets
by investing in the appropriate theme/sector
Certain themes can be direct beneficiaries of economic landscape changes
Possibility of higher potential returns if the opportunity is explored at the right time
Thematic/ Sectoral
13 CLICK HERE TO INVEST NOW

14
What do thematics offer?
Characteristic Thematic/Sector based
Diversification
Stock Level
Different Indices have different characteristics
Sector Level
Market Cap Range (INR)
Return Potential^ Bull Market Relatively higher
Downside Risk^ Bear Market Relatively Higher
Volatility^ As per standard deviation Relatively Higher
Source: ^Return potential, downside risk and volatility is given in comparison to other market caps.
CLICK HERE TO INVEST NOW

15
Weighing all the options available
Characteristic Large Caps (CNX Nifty)
Mid Caps (CNX Midcap)
Thematic/Sector based
Diversification
Stock Level 50 stocks 100 stocks
Different Indices have different characteristics
Sector Level 12 sectors 17 sectors
Market Cap Level
13K cr – 501k cr 0.49K cr – 72K cr
Return Potential^ Bull Market Moderate Relatively higher Relatively higher
Downside Risk^ Bear Market Relatively lower Relatively higher Relatively higher
Volatility^ As per standard deviation
Relatively lower Relatively higher Relatively higher
How about a combination to benefit from all characteristics? Source: ^Return potential, downside risk and volatility of large caps, midcaps and thematics/sectoral is given as compared to other market caps excluding the respective category.
CLICK HERE TO INVEST NOW
16
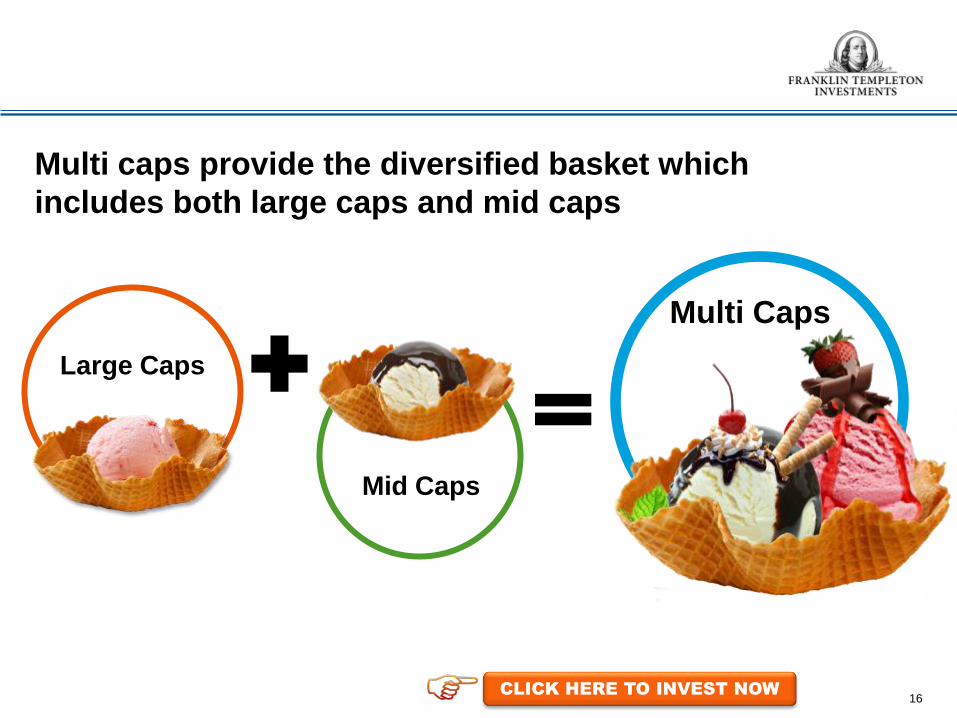
Multi caps provide the diversified basket which includes both large caps and mid caps
Large Caps
Mid Caps
Multi Caps
CLICK HERE TO INVEST NOW

How to participate in equities? 2 Improving Fundamentals 1
4 Franklin Templeton Multi-cap Offerings: A snapshot
Outline
17
Multi-caps: Advantages Galore 3
CLICK HERE TO INVEST NOW

18
Multi-caps: largest equity category as per AUM*
% of Share in Total Equity AUM as on December 2014
Source: Crisil Fund Analyser. *AUM taken is as on December 2014. AUM includes all equity mutual funds. The classification of large, mid, multi –cap and other equity is done as per internal criteria. ^Other equity includes thematic, sectoral, index based funds and ETFs. Historic data is provided and the same is subject to change in future.
Well accepted equity fund category across investors segments
15%
18%
50%
16%
Large Cap Midcaps Multi-Caps Other Equity
CLICK HERE TO INVEST NOW
19
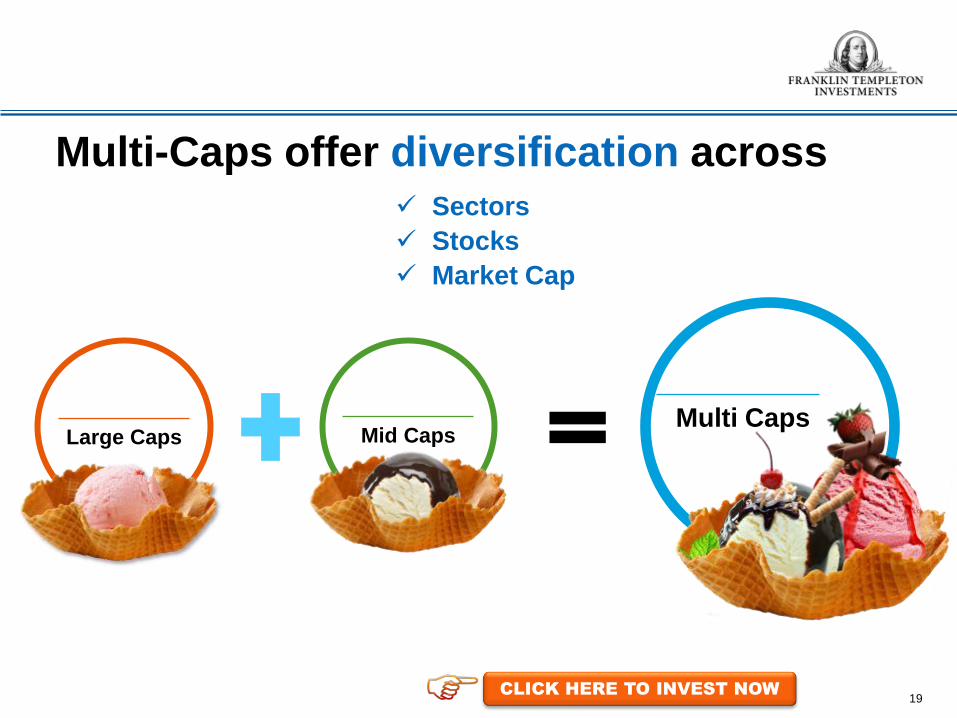
Multi-Caps offer diversification across
Mid Caps Large Caps Multi Caps
Sectors Stocks Market Cap
CLICK HERE TO INVEST NOW
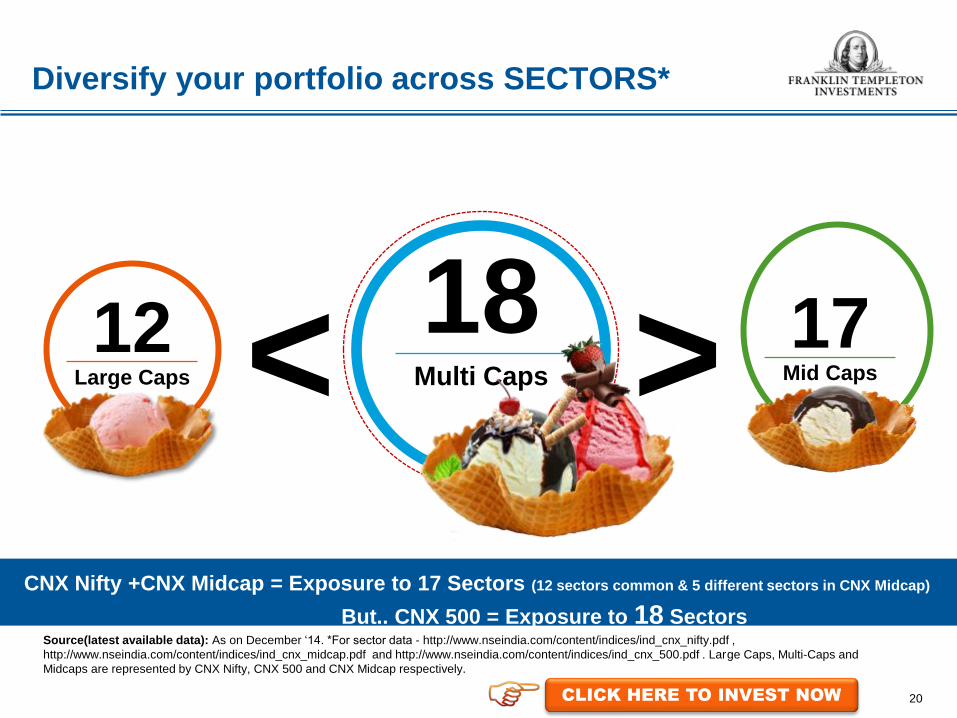
Diversify your portfolio across SECTORS*
Multi Caps Mid Caps Large Caps
CNX Nifty +CNX Midcap = Exposure to 17 Sectors (12 sectors common & 5 different sectors in CNX Midcap)
But.. CNX 500 = Exposure to 18 Sectors Source(latest available data): As on December „14. *For sector data - http://www.nseindia.com/content/indices/ind_cnx_nifty.pdf , http://www.nseindia.com/content/indices/ind_cnx_midcap.pdf and http://www.nseindia.com/content/indices/ind_cnx_500.pdf . Large Caps, Multi-Caps and Midcaps are represented by CNX Nifty, CNX 500 and CNX Midcap respectively.
> < 12 17 18
20 CLICK HERE TO INVEST NOW
21
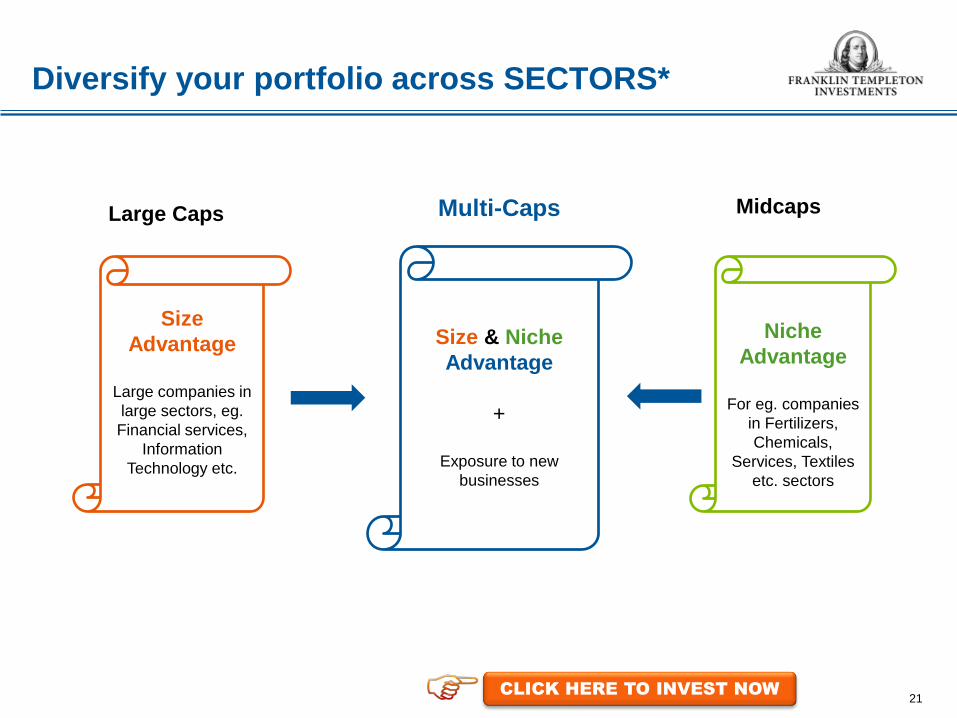
Diversify your portfolio across SECTORS*
Niche
Advantage
For eg. companies in Fertilizers, Chemicals,
Services, Textiles etc. sectors
Size Advantage
Large companies in large sectors, eg. Financial services,
Information Technology etc.
Size & Niche Advantage
+
Exposure to new businesses
Large Caps Multi-Caps Midcaps
CLICK HERE TO INVEST NOW
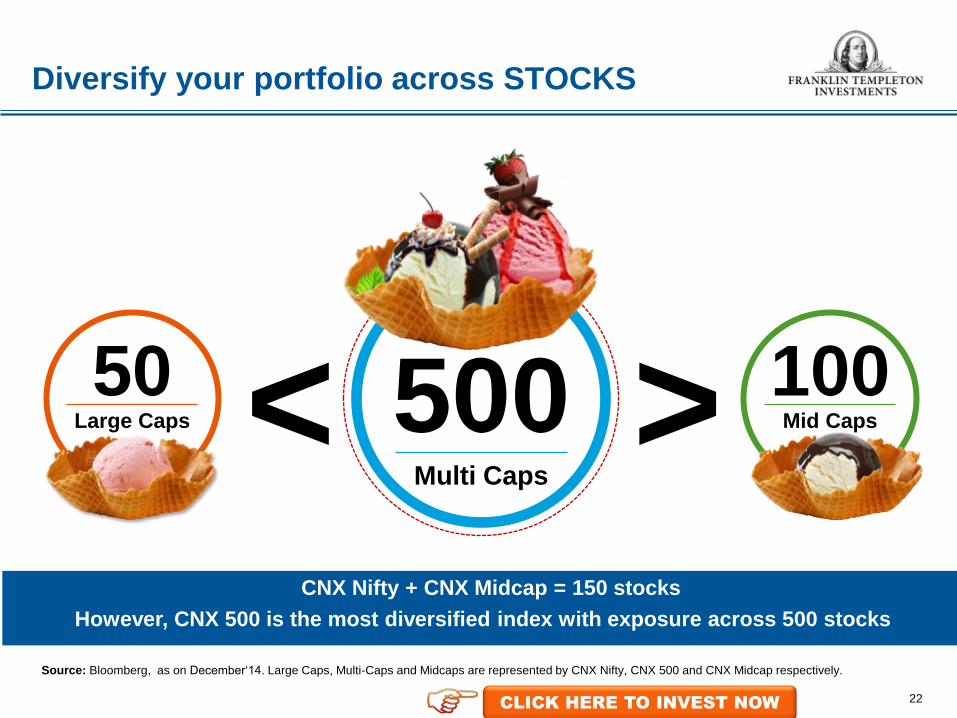
However, CNX 500 is the most diversified index with exposure across 500 stocks
CNX Nifty + CNX Midcap = 150 stocks
Source: Bloomberg, as on December„14. Large Caps, Multi-Caps and Midcaps are represented by CNX Nifty, CNX 500 and CNX Midcap respectively.
> <
22
Multi Caps
Mid Caps Large Caps
50 100 500
Diversify your portfolio across STOCKS
CLICK HERE TO INVEST NOW

Diversify your portfolio across MARKET CAP
Multi –caps cover a very wide market cap range
Source: Bloomberg for Market Cap range. Data is as on December „14. Large Caps, Multi-Caps and Midcaps are represented by CNX Nifty, CNX 500 and CNX Midcap respectively. 23
Large Caps
20 30 40 50 60 70 80 90 100 520 10
Market Cap in INR Thousand Crores (K Crs)
510
13K cr – 501K cr
Multi-Caps
20 30 40 50 60 70 80 90 100 520 10
Market Cap in INR Thousand Crores (K Crs)
510
0.11K cr – 501K cr
Midcaps
20 30 40 50 60 70 80 90 100 520 10
Market Cap in INR Thousand Crores (K Crs)
510
0.49K cr – 72K cr
Market Cap range as on December 2014
CLICK HERE TO INVEST NOW
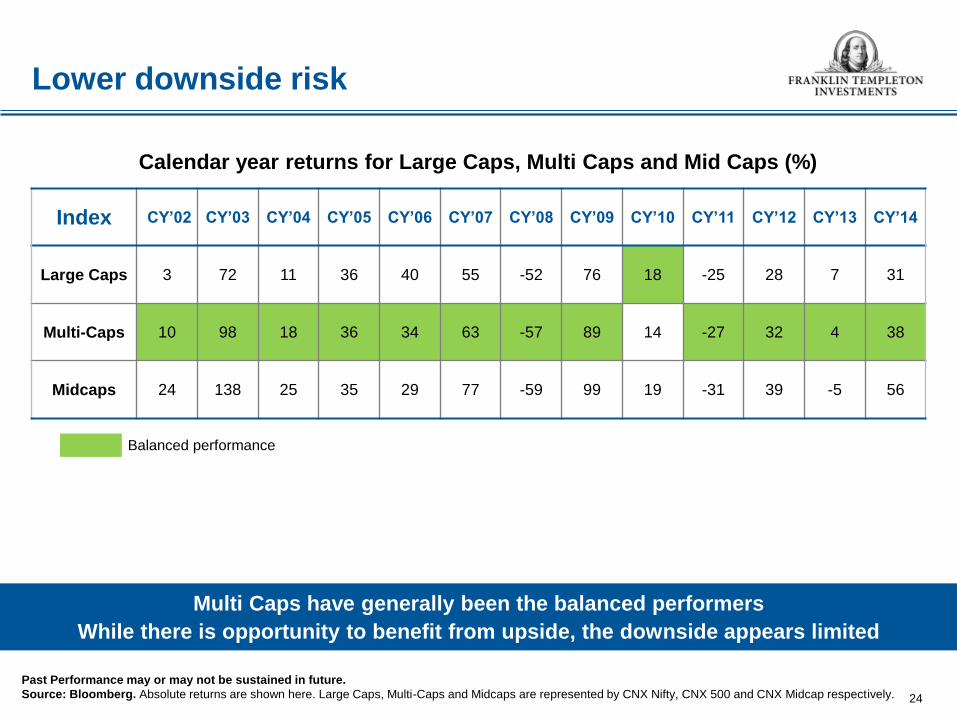
Lower downside risk
Index CY’02 CY’03 CY’04 CY’05 CY’06 CY’07 CY’08 CY’09 CY’10 CY’11 CY’12 CY’13 CY’14
Large Caps 3 72 11 36 40 55 -52 76 18 -25 28 7 31
Multi-Caps 10 98 18 36 34 63 -57 89 14 -27 32 4 38
Midcaps 24 138 25 35 29 77 -59 99 19 -31 39 -5 56
Calendar year returns for Large Caps, Multi Caps and Mid Caps (%)
Past Performance may or may not be sustained in future. Source: Bloomberg. Absolute returns are shown here. Large Caps, Multi-Caps and Midcaps are represented by CNX Nifty, CNX 500 and CNX Midcap respectively.
Balanced performance
Multi Caps have generally been the balanced performers While there is opportunity to benefit from upside, the downside appears limited
24
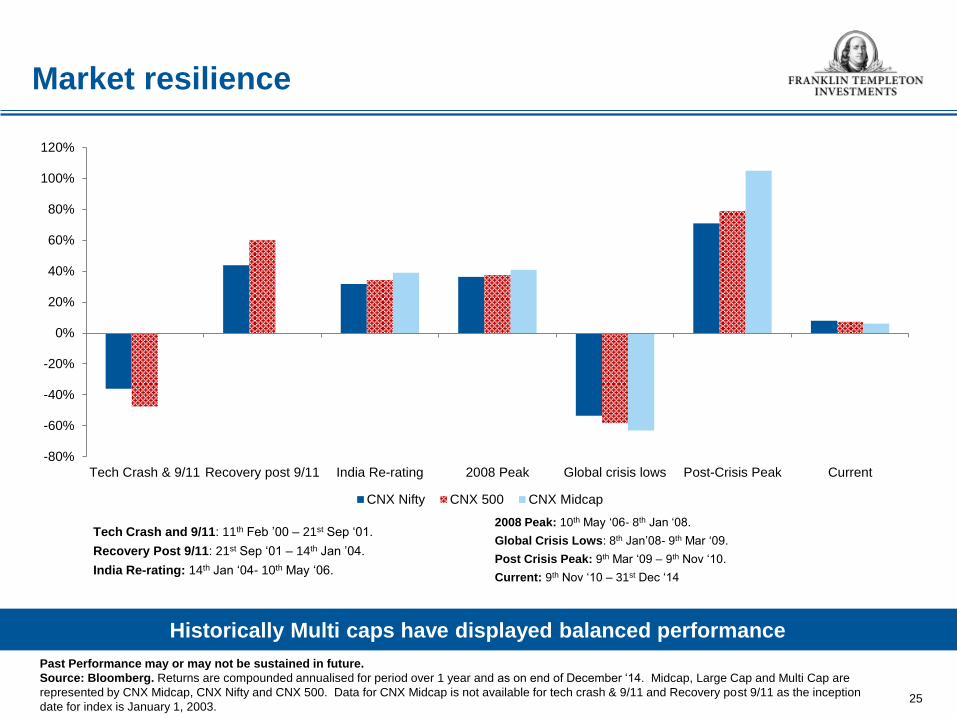
Market resilience
Past Performance may or may not be sustained in future. Source: Bloomberg. Returns are compounded annualised for period over 1 year and as on end of December „14. Midcap, Large Cap and Multi Cap are represented by CNX Midcap, CNX Nifty and CNX 500. Data for CNX Midcap is not available for tech crash & 9/11 and Recovery post 9/11 as the inception date for index is January 1, 2003.
Historically Multi caps have displayed balanced performance
25
Tech Crash and 9/11: 11th Feb ‟00 – 21st Sep „01.
Recovery Post 9/11: 21st Sep „01 – 14th Jan ‟04.
India Re-rating: 14th Jan „04- 10th May „06.
2008 Peak: 10th May „06- 8th Jan „08.
Global Crisis Lows: 8th Jan‟08- 9th Mar „09.
Post Crisis Peak: 9th Mar „09 – 9th Nov „10.
Current: 9th Nov „10 – 31st Dec „14
-80%
-60%
-40%
-20%
0%
20%
40%
60%
80%
100%
120%
Tech Crash & 9/11 Recovery post 9/11 India Re-rating 2008 Peak Global crisis lows Post-Crisis Peak Current
CNX Nifty CNX 500 CNX Midcap
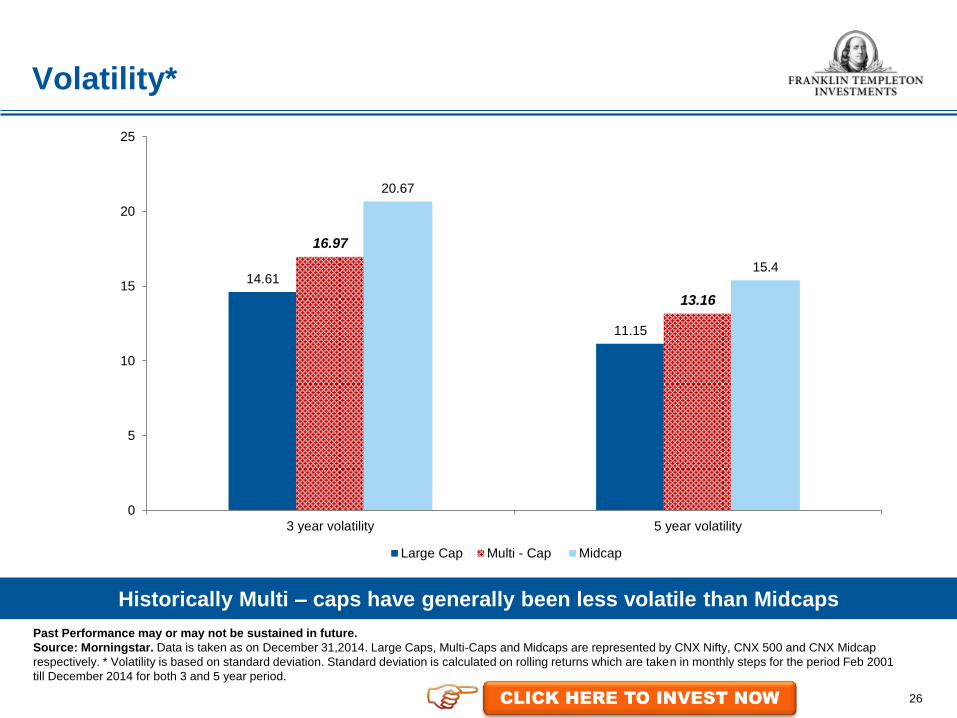
Volatility*
Past Performance may or may not be sustained in future. Source: Morningstar. Data is taken as on December 31,2014. Large Caps, Multi-Caps and Midcaps are represented by CNX Nifty, CNX 500 and CNX Midcap respectively. * Volatility is based on standard deviation. Standard deviation is calculated on rolling returns which are taken in monthly steps for the period Feb 2001 till December 2014 for both 3 and 5 year period.
Historically Multi – caps have generally been less volatile than Midcaps
26
14.61
11.15
16.97
13.16
20.67
15.4
0
5
10
15
20
25
3 year volatility 5 year volatility
Large Cap Multi - Cap Midcap
CLICK HERE TO INVEST NOW
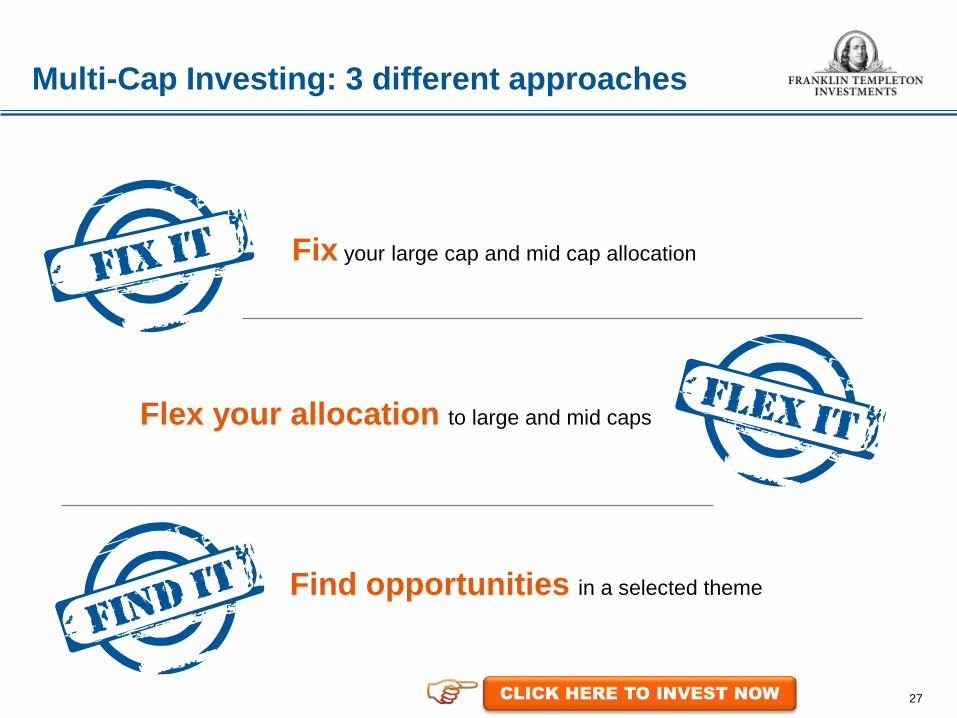
Multi-Cap Investing: 3 different approaches
Fix your large cap and mid cap allocation
Flex your allocation to large and mid caps
Find opportunities in a selected theme
27 CLICK HERE TO INVEST NOW
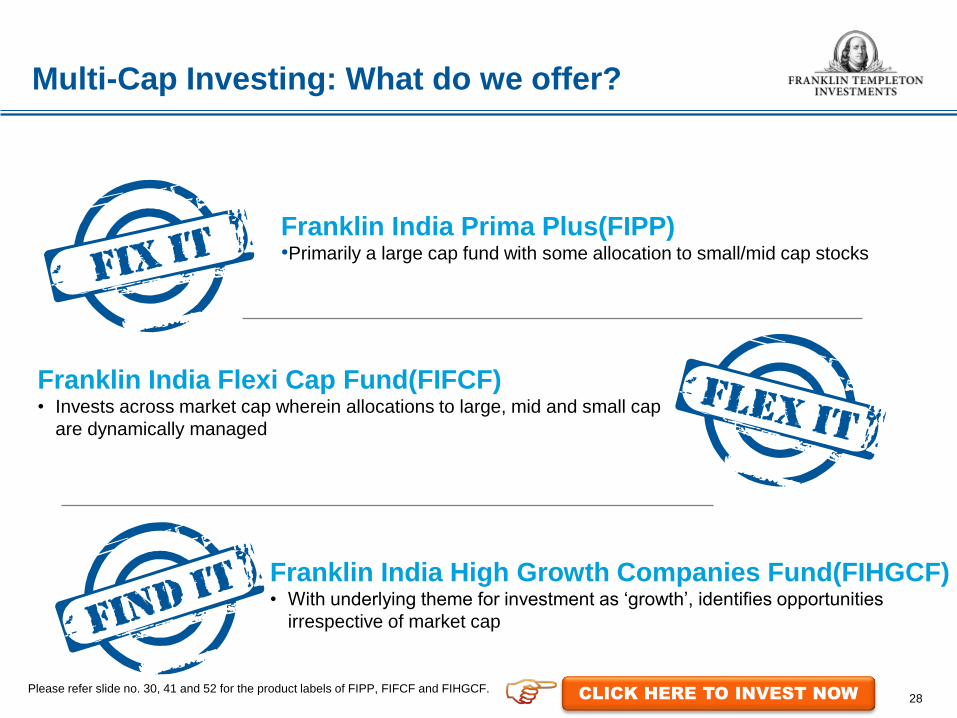
Multi-Cap Investing: What do we offer?
Franklin India Prima Plus(FIPP) •Primarily a large cap fund with some allocation to small/mid cap stocks
Franklin India Flexi Cap Fund(FIFCF) • Invests across market cap wherein allocations to large, mid and small cap
are dynamically managed
Franklin India High Growth Companies Fund(FIHGCF) • With underlying theme for investment as „growth‟, identifies opportunities
irrespective of market cap
28 Please refer slide no. 30, 41 and 52 for the product labels of FIPP, FIFCF and FIHGCF.
CLICK HERE TO INVEST NOW

Outline
29
How to participate in equities 2 Improving Fundamentals 1
Multi-Caps: Advantages Galore
3
Franklin Templeton Multi-cap Offerings: A snapshot
4
CLICK HERE TO INVEST NOW

Presenting Franklin India Prima Plus
Benefit from FIX IT approach
Product Label
This product is suitable for investors who are seeking*
• Long term capital appreciation
• Primarily a large cap fund with some allocation to small/mid cap stocks
*Investors should consult their financial advisors if in doubt about whether the product is suitable for them. ** Note: Risk may be represented as:
BROWN: Investors understand that their principal will be at high risk
YELLOW: Investors understand that their principal will be at medium risk
BLUE: Investors understand that their principal will be at low risk
(BROWN)
High Risk**
30 CLICK HERE TO INVEST NOW
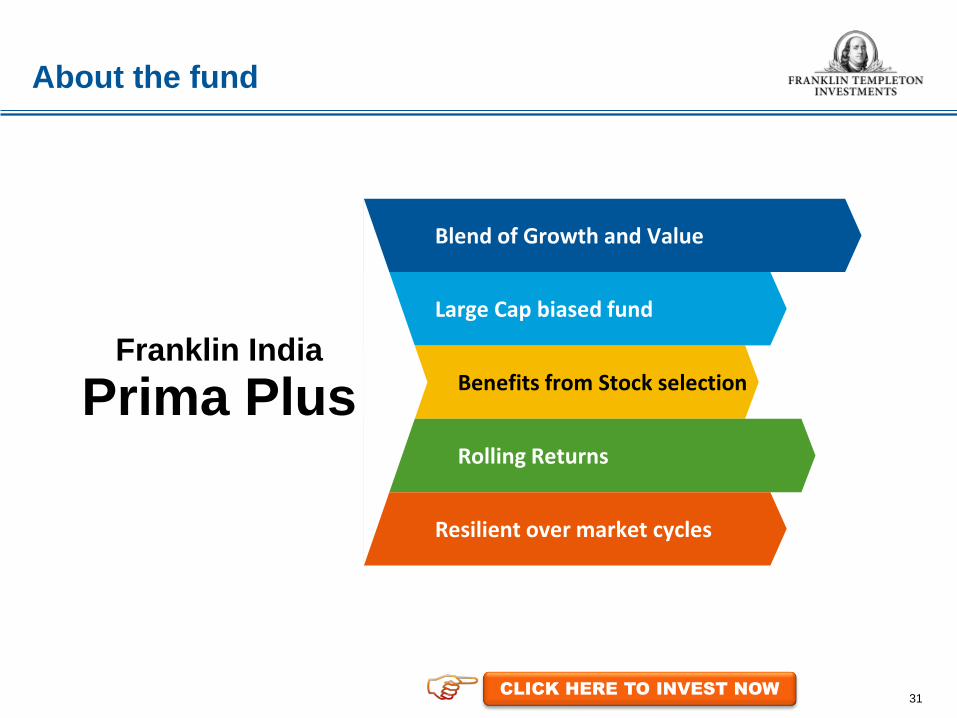
About the fund
31
Benefits from Stock selection
Blend of Growth and Value
Large Cap biased fund
Rolling Returns
Resilient over market cycles
Franklin India
Prima Plus
CLICK HERE TO INVEST NOW
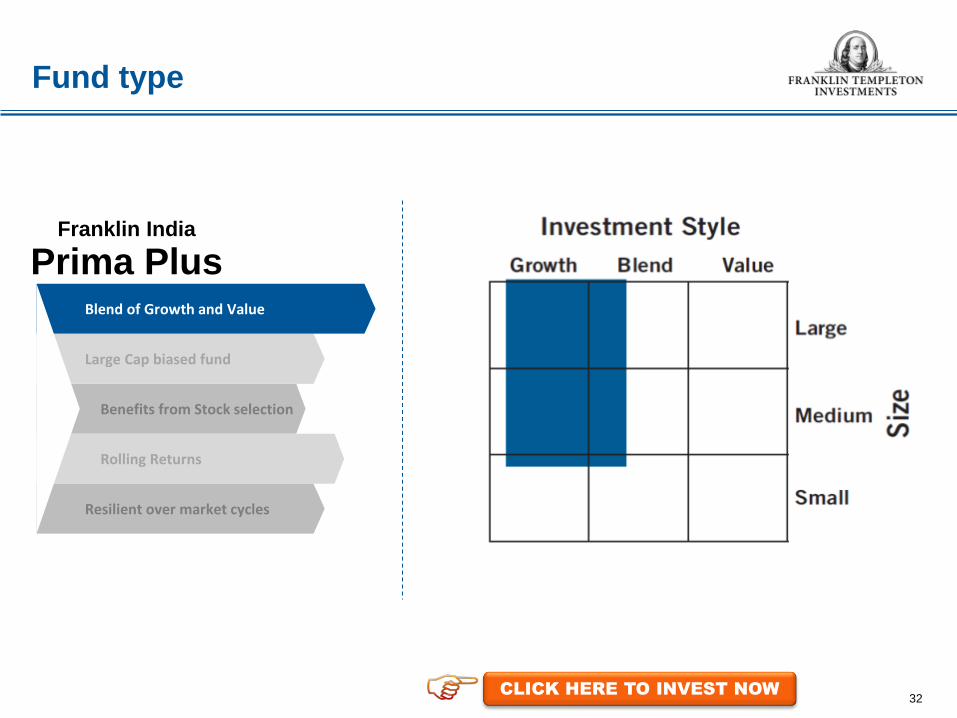
Fund type
32
Benefits from Stock selection
Blend of Growth and Value
Large Cap biased fund
Rolling Returns
Resilient over market cycles
Franklin India
Prima Plus
CLICK HERE TO INVEST NOW

True to the label
33
Franklin India Prima Plus(FIPP)- (Allocation to Large Cap, Mid Cap & Small Cap)
Average Allocation to large caps on a monthly basis
has been over 64% for last 10 years
Source: Internal calculations for large, mid and small cap classification. Data is as on December 31, 2014. Information is historical and may not reflect current or future portfolio characteristics. Portfolio holdings are subject to change.
Benefits from Stock selection
Blend of Growth and Value
Large Cap biased fund
Rolling Returns
Resilient over market cycles
Franklin India
Prima Plus
0%10%20%30%40%50%60%70%80%90%
100%
Jun-
05
De
c-05
Jun-
06
De
c-06
Jun-
07
De
c-07
Jun-
08
De
c-08
Jun-
09
De
c-09
Jun-
10
De
c-10
Jun-
11
De
c-11
Jun-
12
De
c-12
Jun-
13
De
c-13
Jun-
14
De
c-14
Large Cap Mid Cap Small Cap
CLICK HERE TO INVEST NOW

Stock selection is the key
34
5 Years (ending Dec 31, ‘14) Attribution Analysis
Allocation Effect
(A)
Selection Effect
(B)
Interaction Effect (C )
Total Alpha
(A+B+C)
Franklin India Prima Plus 2.21 10.80 -1.92 11.08
Stock selection clearly the key contributor to performance
Stock picking ability has ensured performance holds up well over the medium to long term, irrespective of how allocation decisions fared
Allocation Effect: Sectoral overweight or underweight position in the fund with respect to benchmark. Selection Effect: Within the selected sectors, the fund manager‟s endeavour would be to buy/sell securities that may optimize return compared to the benchmark. Interaction Effect: It measures the combined impact of the fund manager‟s stock selection and asset allocation decisions.
Past performance may or may not be sustained in future Source: Factset.
Benefits from Stock selection
Blend of Growth and Value
Large Cap biased fund
Rolling Returns
Resilient over market cycles
Franklin India
Prima Plus
CLICK HERE TO INVEST NOW
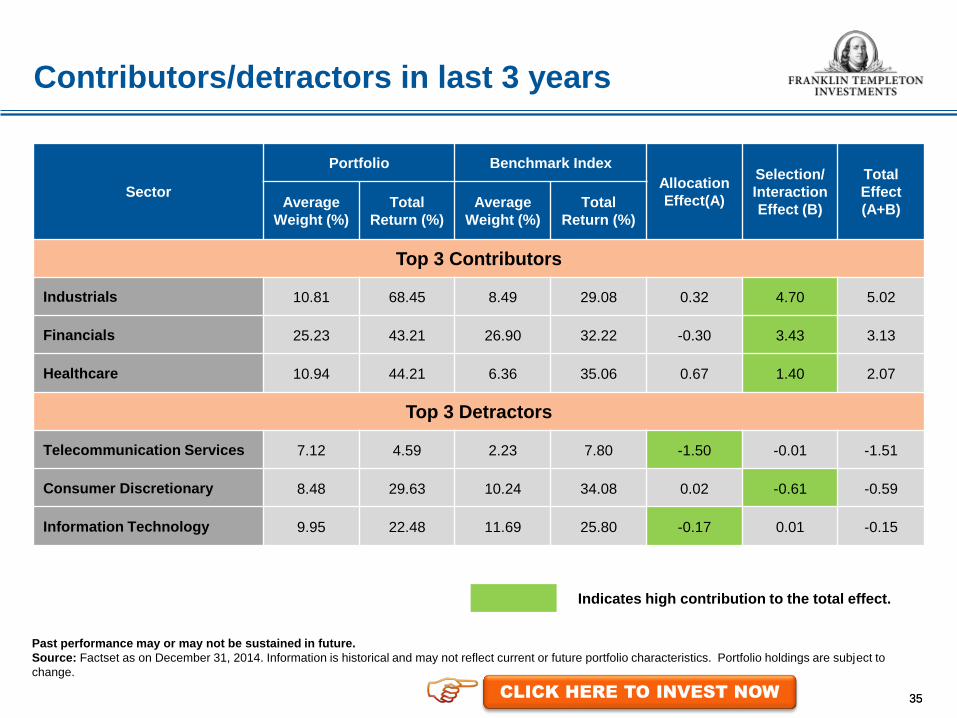
Contributors/detractors in last 3 years
35
Sector
Portfolio Benchmark Index Allocation Effect(A)
Selection/ Interaction Effect (B)
Total Effect (A+B) Average
Weight (%) Total
Return (%) Average
Weight (%) Total
Return (%)
Top 3 Contributors
Industrials 10.81 68.45 8.49 29.08 0.32 4.70 5.02
Financials 25.23 43.21 26.90 32.22 -0.30 3.43 3.13
Healthcare 10.94 44.21 6.36 35.06 0.67 1.40 2.07
Top 3 Detractors
Telecommunication Services 7.12 4.59 2.23 7.80 -1.50 -0.01 -1.51
Consumer Discretionary 8.48 29.63 10.24 34.08 0.02 -0.61 -0.59
Information Technology 9.95 22.48 11.69 25.80 -0.17 0.01 -0.15
Past performance may or may not be sustained in future. Source: Factset as on December 31, 2014. Information is historical and may not reflect current or future portfolio characteristics. Portfolio holdings are subject to change.
Indicates high contribution to the total effect.
35 CLICK HERE TO INVEST NOW
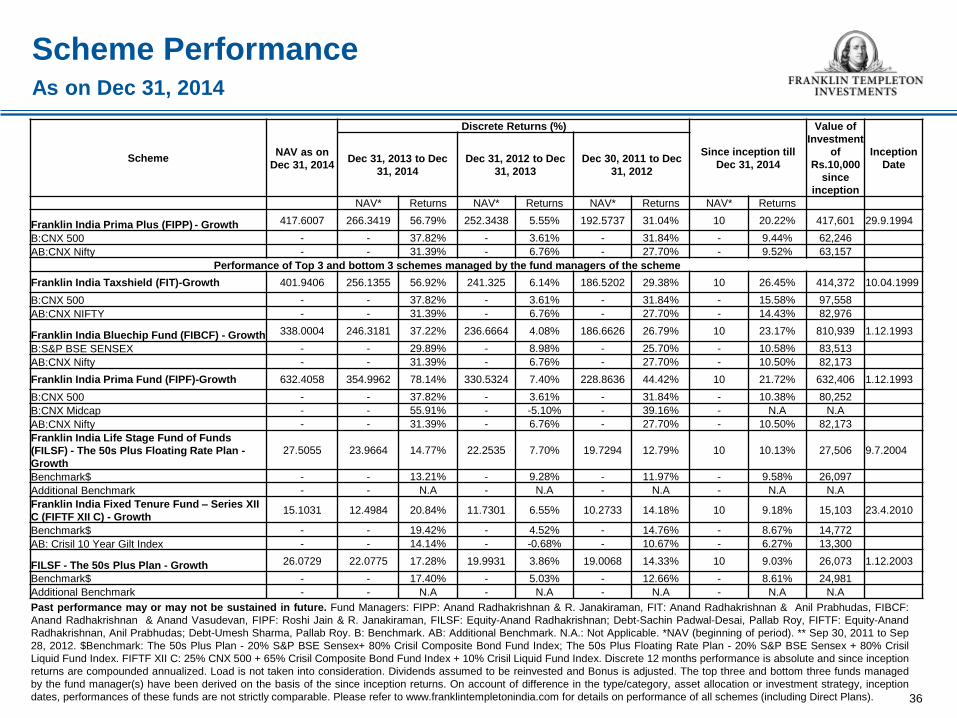
36
Scheme Performance As on Dec 31, 2014
Scheme
NAV as on Dec 31, 2014
Discrete Returns (%)
Since inception till Dec 31, 2014
Value of Investment
of Rs.10,000
since inception
Inception Date
Dec 31, 2013 to Dec 31, 2014
Dec 31, 2012 to Dec 31, 2013
Dec 30, 2011 to Dec 31, 2012
NAV* Returns NAV* Returns NAV* Returns NAV* Returns
Franklin India Prima Plus (FIPP) - Growth 417.6007 266.3419 56.79% 252.3438 5.55% 192.5737 31.04% 10 20.22% 417,601 29.9.1994
B:CNX 500 - - 37.82% - 3.61% - 31.84% - 9.44% 62,246 AB:CNX Nifty - - 31.39% - 6.76% - 27.70% - 9.52% 63,157
Performance of Top 3 and bottom 3 schemes managed by the fund managers of the scheme
Franklin India Taxshield (FIT)-Growth 401.9406 256.1355 56.92% 241.325 6.14% 186.5202 29.38% 10 26.45% 414,372 10.04.1999
B:CNX 500 - - 37.82% - 3.61% - 31.84% - 15.58% 97,558 AB:CNX NIFTY - - 31.39% - 6.76% - 27.70% - 14.43% 82,976
Franklin India Bluechip Fund (FIBCF) - Growth 338.0004 246.3181 37.22% 236.6664 4.08% 186.6626 26.79% 10 23.17% 810,939 1.12.1993
B:S&P BSE SENSEX - - 29.89% - 8.98% - 25.70% - 10.58% 83,513 AB:CNX Nifty - - 31.39% - 6.76% - 27.70% - 10.50% 82,173
Franklin India Prima Fund (FIPF)-Growth 632.4058 354.9962 78.14% 330.5324 7.40% 228.8636 44.42% 10 21.72% 632,406 1.12.1993
B:CNX 500 - - 37.82% - 3.61% - 31.84% - 10.38% 80,252 B:CNX Midcap - - 55.91% - -5.10% - 39.16% - N.A N.A AB:CNX Nifty - - 31.39% - 6.76% - 27.70% - 10.50% 82,173 Franklin India Life Stage Fund of Funds (FILSF) - The 50s Plus Floating Rate Plan - Growth
27.5055 23.9664 14.77% 22.2535 7.70% 19.7294 12.79% 10 10.13% 27,506 9.7.2004
Benchmark$ - - 13.21% - 9.28% - 11.97% - 9.58% 26,097 Additional Benchmark - - N.A - N.A - N.A - N.A N.A Franklin India Fixed Tenure Fund – Series XII C (FIFTF XII C) - Growth
15.1031 12.4984 20.84% 11.7301 6.55% 10.2733 14.18% 10 9.18% 15,103 23.4.2010
Benchmark$ - - 19.42% - 4.52% - 14.76% - 8.67% 14,772 AB: Crisil 10 Year Gilt Index - - 14.14% - -0.68% - 10.67% - 6.27% 13,300
FILSF - The 50s Plus Plan - Growth 26.0729 22.0775 17.28% 19.9931 3.86% 19.0068 14.33% 10 9.03% 26,073 1.12.2003
Benchmark$ - - 17.40% - 5.03% - 12.66% - 8.61% 24,981 Additional Benchmark - - N.A - N.A - N.A - N.A N.A
Past performance may or may not be sustained in future. Fund Managers: FIPP: Anand Radhakrishnan & R. Janakiraman, FIT: Anand Radhakrishnan & Anil Prabhudas, FIBCF: Anand Radhakrishnan & Anand Vasudevan, FIPF: Roshi Jain & R. Janakiraman, FILSF: Equity-Anand Radhakrishnan; Debt-Sachin Padwal-Desai, Pallab Roy, FIFTF: Equity-Anand Radhakrishnan, Anil Prabhudas; Debt-Umesh Sharma, Pallab Roy. B: Benchmark. AB: Additional Benchmark. N.A.: Not Applicable. *NAV (beginning of period). ** Sep 30, 2011 to Sep 28, 2012. $Benchmark: The 50s Plus Plan - 20% S&P BSE Sensex+ 80% Crisil Composite Bond Fund Index; The 50s Plus Floating Rate Plan - 20% S&P BSE Sensex + 80% Crisil Liquid Fund Index. FIFTF XII C: 25% CNX 500 + 65% Crisil Composite Bond Fund Index + 10% Crisil Liquid Fund Index. Discrete 12 months performance is absolute and since inception returns are compounded annualized. Load is not taken into consideration. Dividends assumed to be reinvested and Bonus is adjusted. The top three and bottom three funds managed by the fund manager(s) have been derived on the basis of the since inception returns. On account of difference in the type/category, asset allocation or investment strategy, inception dates, performances of these funds are not strictly comparable. Please refer to www.franklintempletonindia.com for details on performance of all schemes (including Direct Plans).

The advantage of long term investing
37
Franklin India Prima Plus – Growth Option
Past performance may or may not be sustained in future. Period – 29.9.1994 to 31.12.2014. Load is not taken into consideration. Dividends assumed to be reinvested and Bonus is adjusted. Returns greater than 1 year period are compounded annualized.
Note: The above graph shows the performance on a daily rolling return basis to compute returns for respective periods (3,5,7 and 10 years). Please turn overleaf for performance data of Benchmark and Additional Benchmark
76.9%
56.8%
39.9% 41.1%
-14.0%
3.2% 6.9%
17.5%
24.5% 24.9% 25.0% 26.8%
-20.0%
0.0%
20.0%
40.0%
60.0%
80.0%
100.0%
3 Year 5 Year 7 Year 10 Year
Maximum Returns Minimum Returns Average Returns
93.7%
6.3%
100%
0%
100%
0%
100%
0%
Historical instances of +ve performance
Historical instances of –ve performance
CLICK HERE TO INVEST NOW
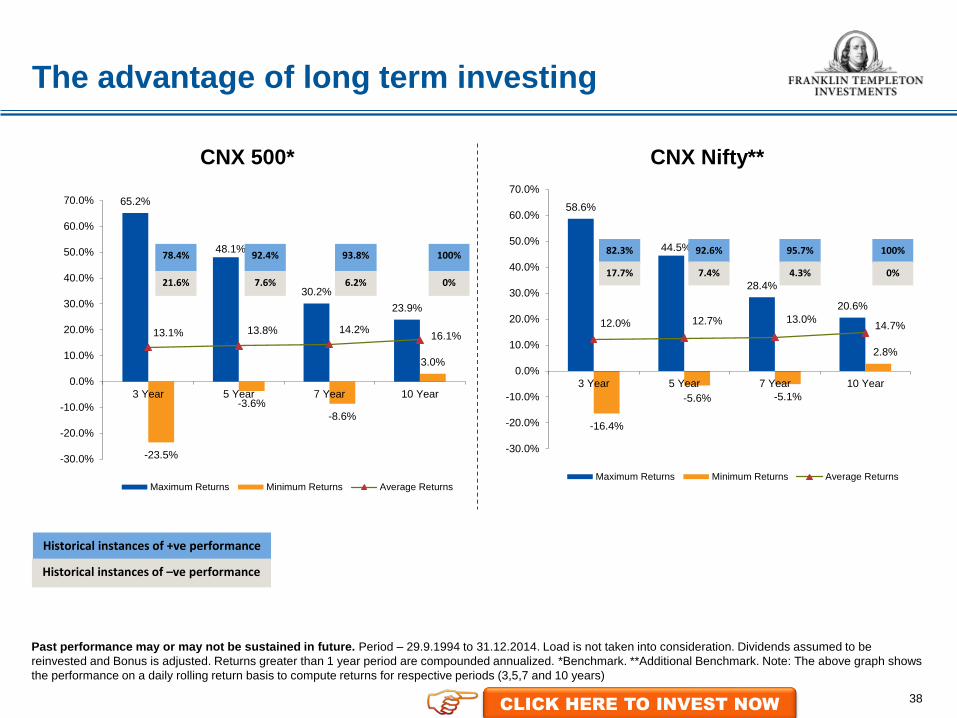
The advantage of long term investing
38
Past performance may or may not be sustained in future. Period – 29.9.1994 to 31.12.2014. Load is not taken into consideration. Dividends assumed to be reinvested and Bonus is adjusted. Returns greater than 1 year period are compounded annualized. *Benchmark. **Additional Benchmark. Note: The above graph shows the performance on a daily rolling return basis to compute returns for respective periods (3,5,7 and 10 years)
CNX 500* CNX Nifty**
Historical instances of +ve performance
Historical instances of –ve performance
65.2%
48.1%
30.2%
23.9%
-23.5%
-3.6% -8.6%
3.0%
13.1% 13.8% 14.2% 16.1%
-30.0%
-20.0%
-10.0%
0.0%
10.0%
20.0%
30.0%
40.0%
50.0%
60.0%
70.0%
3 Year 5 Year 7 Year 10 Year
Maximum Returns Minimum Returns Average Returns
78.4%
21.6%
92.4%
7.6%
93.8%
6.2%
100%
0%
58.6%
44.5%
28.4%
20.6%
-16.4%
-5.6% -5.1%
2.8%
12.0% 12.7% 13.0% 14.7%
-30.0%
-20.0%
-10.0%
0.0%
10.0%
20.0%
30.0%
40.0%
50.0%
60.0%
70.0%
3 Year 5 Year 7 Year 10 Year
Maximum Returns Minimum Returns Average Returns
82.3%
17.7%
92.6%
7.4%
95.7%
4.3%
100%
0%
CLICK HERE TO INVEST NOW

Market resilience
39
Past performance may or may not be sustained in future. FIPP – growth option is taken for calculations. Returns are compounded and annualized for more than 1 year period. Inception Date: September 29,1994. Dividends are assumed to be reinvested and bonus is adjusted. Load is not taken into consideration. B: Benchmark, AB: Additional Benchmark.
Market resilience (as of Dec 31, 2014)
Mid 90s Crash: 29th Sep‟94-4th Dec‟96.
Tech Bubble Peak: 4th Dec ‟96 – 11th Feb „00.
Tech Crash and 9/11: 11th Feb ‟00 – 21st Sep „01.
Post Crisis Peak: 9th Mar „09 – 9th Nov „10.
Current: 9th Nov „10 – 31st Dec „14.
Recovery Post 9/11: 21st Sep „01 – 14th Jan ‟04.
India Re-rating: 14th Jan „04- 10th May „06.
2008 Peak: 10th May „06- 8th Jan „08.
Global Crisis Lows: 8th Jan‟08- 9th Mar „09.
-80%
-60%
-40%
-20%
0%
20%
40%
60%
80%
100%
Mid-90scrash
Tech bubblepeak
Tech Crash& 9/11
Recoverypost 9/11
India Re-rating
2008 Peak Global crisislows
Post-CrisisPeak
Current Returnssince
inception
FIPP B: CNX 500 AB: CNX Nifty
CLICK HERE TO INVEST NOW

Over 20 years of wealth creation
40
Past performance may or may not be sustained in future. The graph shows the movement of Rs. 10,000 invested in FIPP – Growth option , CNX 500 and CNX Nifty since inception of the fund. B: Benchmark and AB: Additional Benchmark. Inception Date: September 29,1994. Period: Sep 29, 1994 to Dec 31, 2014. Dividends are assumed to be reinvested and bonus is adjusted. Load is not taken into consideration.
Movement of Rs. 10,000 invested in FIPP – Growth option, CNX 500 & CNX Nifty
FIPP: Rs. 417,601
Ru
pee
s
B:CNX 500: Rs.62,246
AB:CNX Nifty: Rs.63,157
0
50,000
100,000
150,000
200,000
250,000
300,000
350,000
400,000
450,000
Dec
-94
Dec
-95
Dec
-96
Dec
-97
Dec
-98
Dec
-99
Dec
-00
Dec
-01
Dec
-02
Dec
-03
Dec
-04
Dec
-05
Dec
-06
Dec
-07
Dec
-08
Dec
-09
Dec
-10
Dec
-11
Dec
-12
Dec
-13
Dec
-14
FIPP B: CNX 500 AB: CNX Nifty
CLICK HERE TO INVEST NOW
Presenting Franklin India Flexi Cap Fund
Benefit from FLEX IT approach
Product Label
This product is suitable for investors who are seeking*
• Long term capital appreciation
• A fund that invests in stocks of companies across the market cap range
*Investors should consult their financial advisors if in doubt about whether the product is suitable for them. ** Note: Risk may be represented as:
BROWN: Investors understand that their principal will be at high risk
YELLOW: Investors understand that their principal will be at medium risk
BLUE: Investors understand that their principal will be at low risk
(BROWN)
High Risk**
41 CLICK HERE TO INVEST NOW
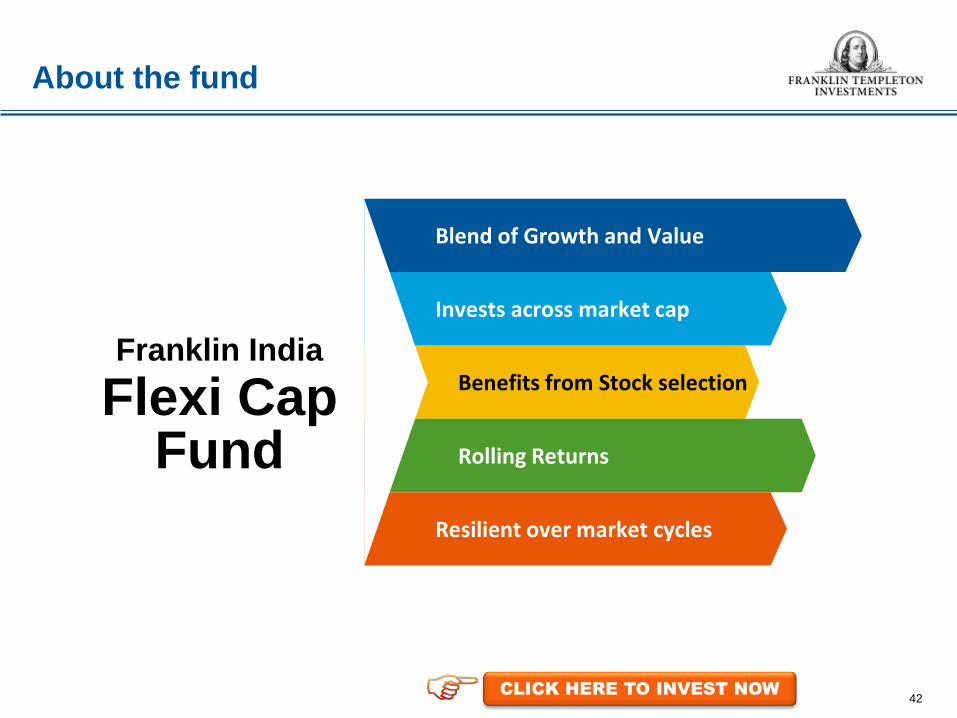
About the fund
42
Benefits from Stock selection
Blend of Growth and Value
Invests across market cap
Rolling Returns
Resilient over market cycles
Franklin India
Flexi Cap Fund
CLICK HERE TO INVEST NOW
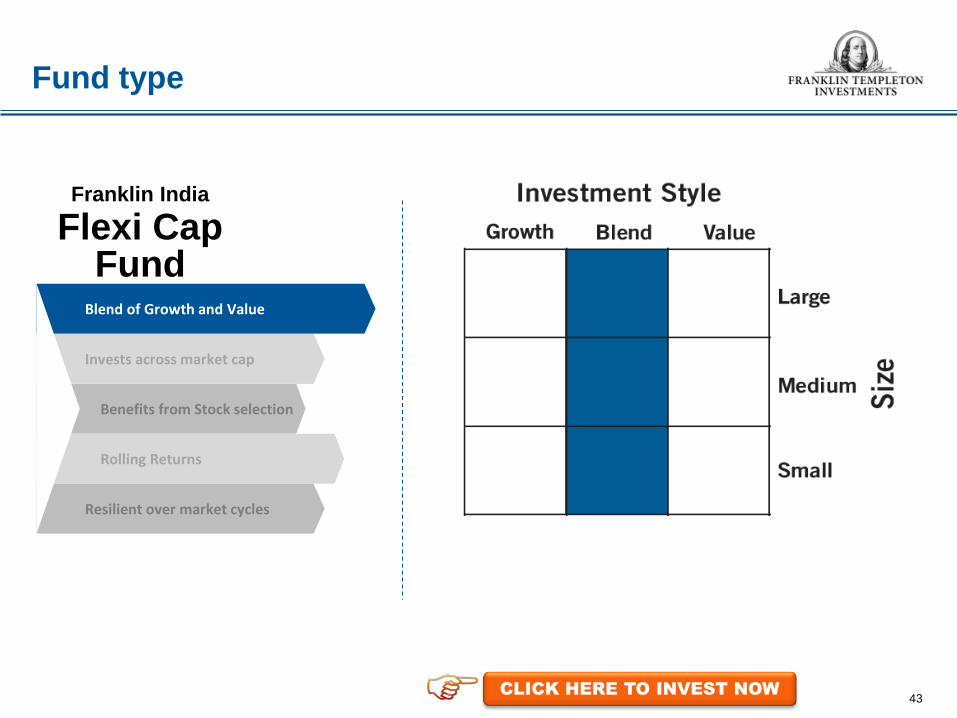
Fund type
43
Benefits from Stock selection
Blend of Growth and Value
Invests across market cap
Rolling Returns
Resilient over market cycles
Franklin India
Flexi Cap Fund
CLICK HERE TO INVEST NOW
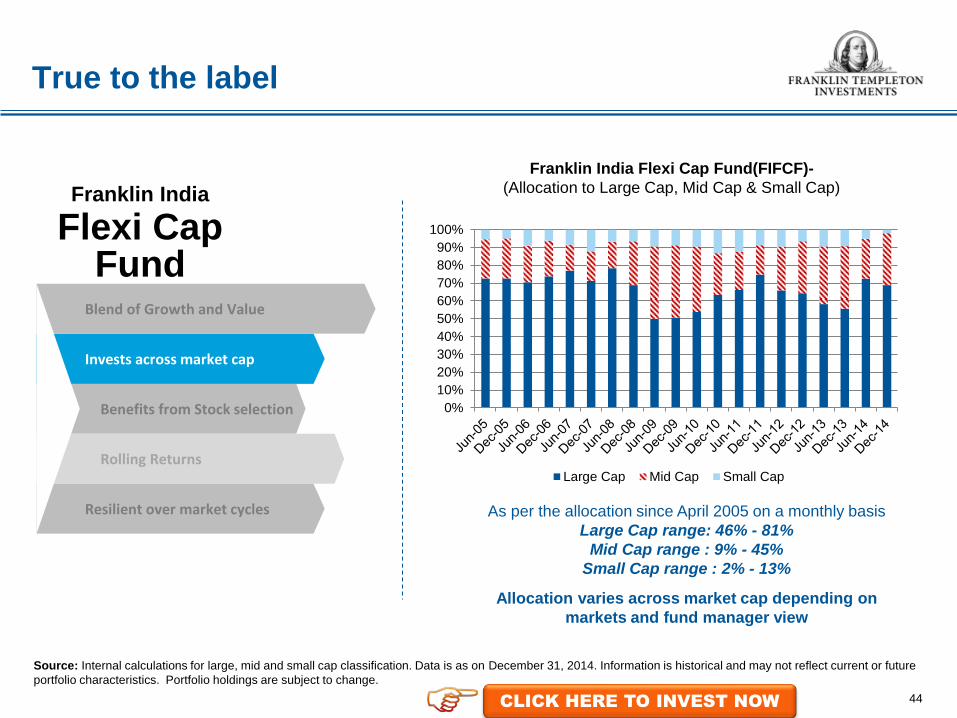
True to the label
44
Franklin India Flexi Cap Fund(FIFCF)- (Allocation to Large Cap, Mid Cap & Small Cap)
As per the allocation since April 2005 on a monthly basis Large Cap range: 46% - 81%
Mid Cap range : 9% - 45% Small Cap range : 2% - 13%
Source: Internal calculations for large, mid and small cap classification. Data is as on December 31, 2014. Information is historical and may not reflect current or future portfolio characteristics. Portfolio holdings are subject to change.
Allocation varies across market cap depending on markets and fund manager view
Benefits from Stock selection
Blend of Growth and Value
Invests across market cap
Rolling Returns
Resilient over market cycles
Franklin India
Flexi Cap Fund
0%10%20%30%40%50%60%70%80%90%
100%
Large Cap Mid Cap Small Cap
CLICK HERE TO INVEST NOW
Stock Selection is the key
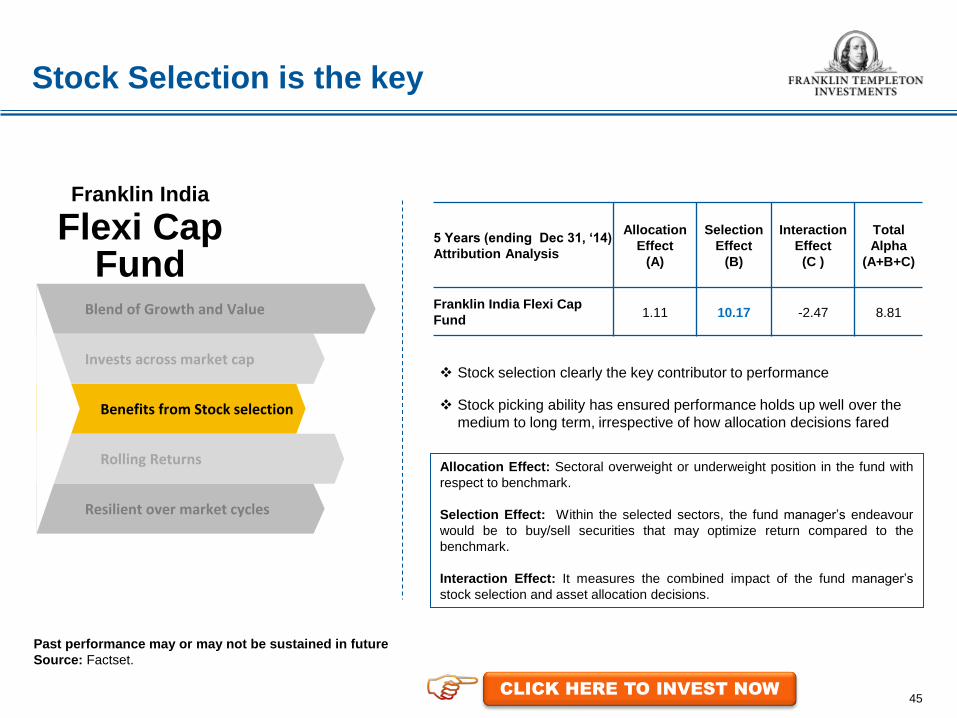
45
5 Years (ending Dec 31, ‘14) Attribution Analysis
Allocation Effect
(A)
Selection Effect
(B)
Interaction Effect (C )
Total Alpha
(A+B+C)
Franklin India Flexi Cap Fund
1.11 10.17 -2.47 8.81
Stock selection clearly the key contributor to performance
Stock picking ability has ensured performance holds up well over the medium to long term, irrespective of how allocation decisions fared
Allocation Effect: Sectoral overweight or underweight position in the fund with respect to benchmark. Selection Effect: Within the selected sectors, the fund manager‟s endeavour would be to buy/sell securities that may optimize return compared to the benchmark. Interaction Effect: It measures the combined impact of the fund manager‟s stock selection and asset allocation decisions.
Past performance may or may not be sustained in future Source: Factset.
Benefits from Stock selection
Blend of Growth and Value
Invests across market cap
Rolling Returns
Resilient over market cycles
Franklin India
Flexi Cap Fund
CLICK HERE TO INVEST NOW

Contributors/detractors in last 3 years
46
Sector
Portfolio Benchmark Index Allocation Effect(A)
Selection/ Interaction Effect (B)
Total Effect (A+B) Average
Weight (%) Total
Return (%) Average
Weight (%) Total
Return (%)
Top 3 Contributors
Industrials 10.82 60.08 8.49 29.08 0.93 3.34 4.27
Financials 23.96 42.15 26.90 32.22 -0.12 3.56 3.44
Healthcare 11.77 48.16 6.36 35.06 1.15 1.77 2.92
Detractors
Telecommunication Services 8.77 4.72 2.23 7.80 -1.24 -0.16 -1.40
Utilities 6.73 9.71 4.11 6.79 -0.76 0.11 -0.65
Past performance may or may not be sustained in future. Source: Factset as on December 31, 2014. Information is historical and may not reflect current or future portfolio characteristics. Portfolio holdings are subject to change.
Indicates high contribution to the total effect.
46 CLICK HERE TO INVEST NOW
47
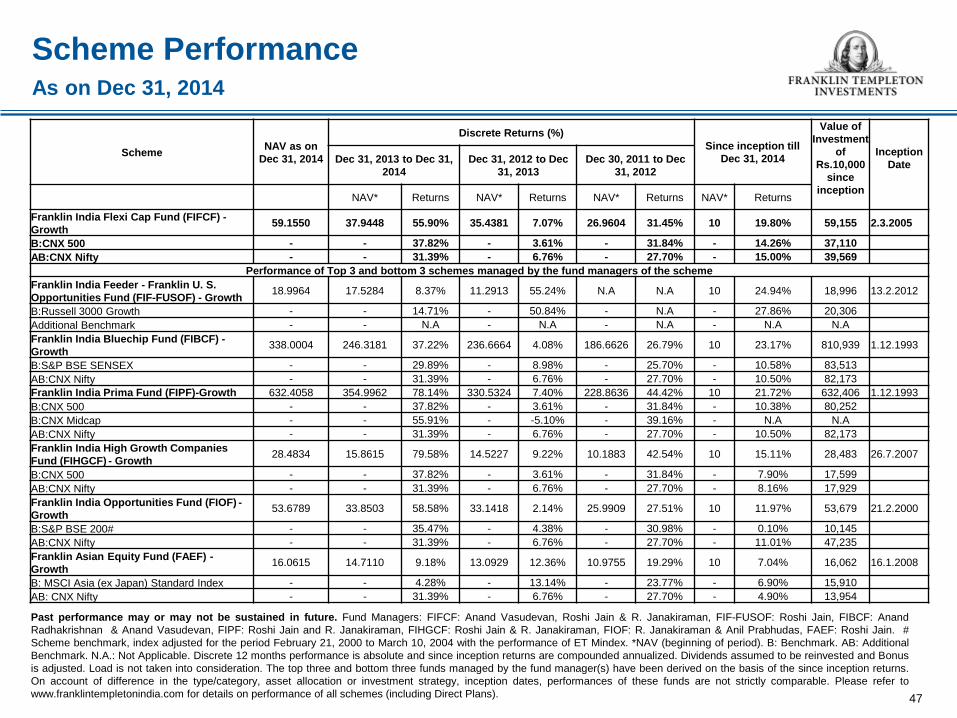
Scheme Performance As on Dec 31, 2014
Scheme
NAV as on Dec 31, 2014
Discrete Returns (%) Since inception till
Dec 31, 2014
Value of Investment
of Rs.10,000
since inception
Inception Date
Dec 31, 2013 to Dec 31, 2014
Dec 31, 2012 to Dec 31, 2013
Dec 30, 2011 to Dec 31, 2012
NAV* Returns NAV* Returns NAV* Returns NAV* Returns
Franklin India Flexi Cap Fund (FIFCF) - Growth
59.1550 37.9448 55.90% 35.4381 7.07% 26.9604 31.45% 10 19.80% 59,155 2.3.2005
B:CNX 500 - - 37.82% - 3.61% - 31.84% - 14.26% 37,110 AB:CNX Nifty - - 31.39% - 6.76% - 27.70% - 15.00% 39,569
Performance of Top 3 and bottom 3 schemes managed by the fund managers of the scheme Franklin India Feeder - Franklin U. S. Opportunities Fund (FIF-FUSOF) - Growth
18.9964 17.5284 8.37% 11.2913 55.24% N.A N.A 10 24.94% 18,996 13.2.2012
B:Russell 3000 Growth - - 14.71% - 50.84% - N.A - 27.86% 20,306 Additional Benchmark - - N.A - N.A - N.A - N.A N.A Franklin India Bluechip Fund (FIBCF) - Growth
338.0004 246.3181 37.22% 236.6664 4.08% 186.6626 26.79% 10 23.17% 810,939 1.12.1993
B:S&P BSE SENSEX - - 29.89% - 8.98% - 25.70% - 10.58% 83,513 AB:CNX Nifty - - 31.39% - 6.76% - 27.70% - 10.50% 82,173 Franklin India Prima Fund (FIPF)-Growth 632.4058 354.9962 78.14% 330.5324 7.40% 228.8636 44.42% 10 21.72% 632,406 1.12.1993 B:CNX 500 - - 37.82% - 3.61% - 31.84% - 10.38% 80,252 B:CNX Midcap - - 55.91% - -5.10% - 39.16% - N.A N.A AB:CNX Nifty - - 31.39% - 6.76% - 27.70% - 10.50% 82,173 Franklin India High Growth Companies Fund (FIHGCF) - Growth
28.4834 15.8615 79.58% 14.5227 9.22% 10.1883 42.54% 10 15.11% 28,483 26.7.2007
B:CNX 500 - - 37.82% - 3.61% - 31.84% - 7.90% 17,599 AB:CNX Nifty - - 31.39% - 6.76% - 27.70% - 8.16% 17,929 Franklin India Opportunities Fund (FIOF) - Growth
53.6789 33.8503 58.58% 33.1418 2.14% 25.9909 27.51% 10 11.97% 53,679 21.2.2000
B:S&P BSE 200# - - 35.47% - 4.38% - 30.98% - 0.10% 10,145 AB:CNX Nifty - - 31.39% - 6.76% - 27.70% - 11.01% 47,235 Franklin Asian Equity Fund (FAEF) - Growth
16.0615 14.7110 9.18% 13.0929 12.36% 10.9755 19.29% 10 7.04% 16,062 16.1.2008
B: MSCI Asia (ex Japan) Standard Index - - 4.28% - 13.14% - 23.77% - 6.90% 15,910 AB: CNX Nifty - - 31.39% - 6.76% - 27.70% - 4.90% 13,954
Past performance may or may not be sustained in future. Fund Managers: FIFCF: Anand Vasudevan, Roshi Jain & R. Janakiraman, FIF-FUSOF: Roshi Jain, FIBCF: Anand Radhakrishnan & Anand Vasudevan, FIPF: Roshi Jain and R. Janakiraman, FIHGCF: Roshi Jain & R. Janakiraman, FIOF: R. Janakiraman & Anil Prabhudas, FAEF: Roshi Jain. # Scheme benchmark, index adjusted for the period February 21, 2000 to March 10, 2004 with the performance of ET Mindex. *NAV (beginning of period). B: Benchmark. AB: Additional Benchmark. N.A.: Not Applicable. Discrete 12 months performance is absolute and since inception returns are compounded annualized. Dividends assumed to be reinvested and Bonus is adjusted. Load is not taken into consideration. The top three and bottom three funds managed by the fund manager(s) have been derived on the basis of the since inception returns. On account of difference in the type/category, asset allocation or investment strategy, inception dates, performances of these funds are not strictly comparable. Please refer to www.franklintempletonindia.com for details on performance of all schemes (including Direct Plans).

The advantage of long term investing
48
Franklin India Flexi Cap Fund – Growth Option
Past performance may or may not be sustained in future. Period – 2.3.2005 to 31.12.2014. Load is not taken into consideration. Dividends assumed to be reinvested and Bonus is adjusted. Returns greater than 1 year period are compounded annualized.
Note: The above graph shows the performance on a daily rolling return basis to compute returns for respective periods (3,5 and 7 years). Please turn overleaf for performance data of Benchmark and Additional Benchmark
Historical instances of +ve performance
Historical instances of –ve performance
37.9%
26.2%
18.8%
-10.4%
2.2%
7.5%
11.7% 13.6%
11.7%
-20.0%
-10.0%
0.0%
10.0%
20.0%
30.0%
40.0%
50.0%
3 Year 5 Year 7 Year
Maximum Returns Minimum Returns Average Returns
91.9%
8.1%
100%
0%
100%
0%
CLICK HERE TO INVEST NOW
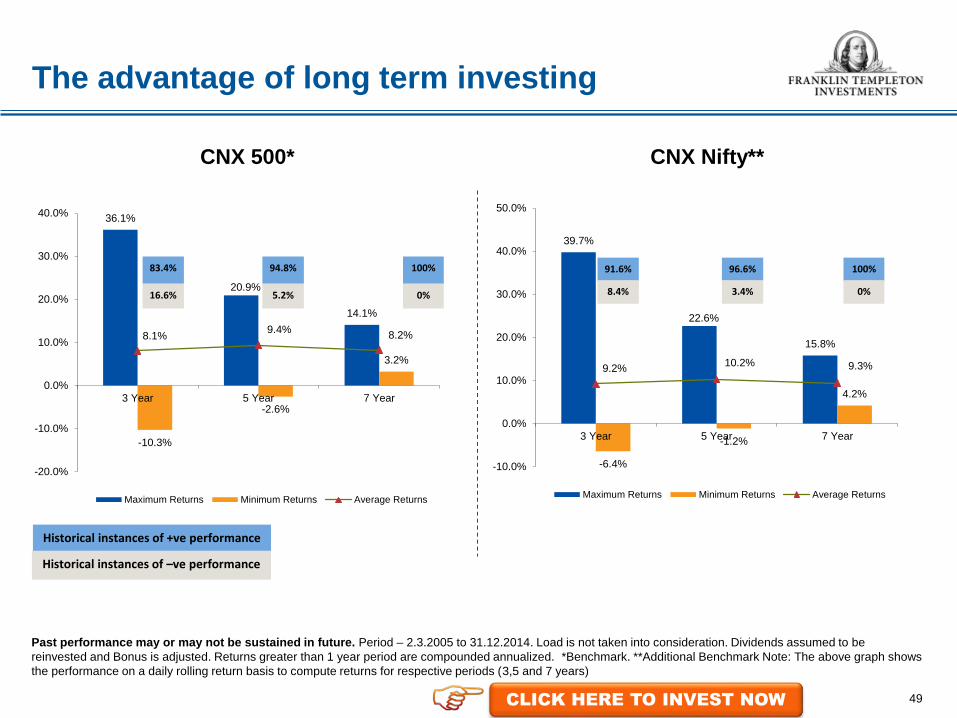
The advantage of long term investing
49
Past performance may or may not be sustained in future. Period – 2.3.2005 to 31.12.2014. Load is not taken into consideration. Dividends assumed to be reinvested and Bonus is adjusted. Returns greater than 1 year period are compounded annualized. *Benchmark. **Additional Benchmark Note: The above graph shows the performance on a daily rolling return basis to compute returns for respective periods (3,5 and 7 years)
CNX 500* CNX Nifty**
Historical instances of +ve performance
Historical instances of –ve performance
36.1%
20.9%
14.1%
-10.3%
-2.6%
3.2%
8.1% 9.4% 8.2%
-20.0%
-10.0%
0.0%
10.0%
20.0%
30.0%
40.0%
3 Year 5 Year 7 Year
Maximum Returns Minimum Returns Average Returns
83.4%
16.6%
94.8%
5.2%
100%
0%
39.7%
22.6%
15.8%
-6.4%
-1.2%
4.2%
9.2% 10.2% 9.3%
-10.0%
0.0%
10.0%
20.0%
30.0%
40.0%
50.0%
3 Year 5 Year 7 Year
Maximum Returns Minimum Returns Average Returns
91.6%
8.4%
96.6%
3.4%
100%
0%
CLICK HERE TO INVEST NOW
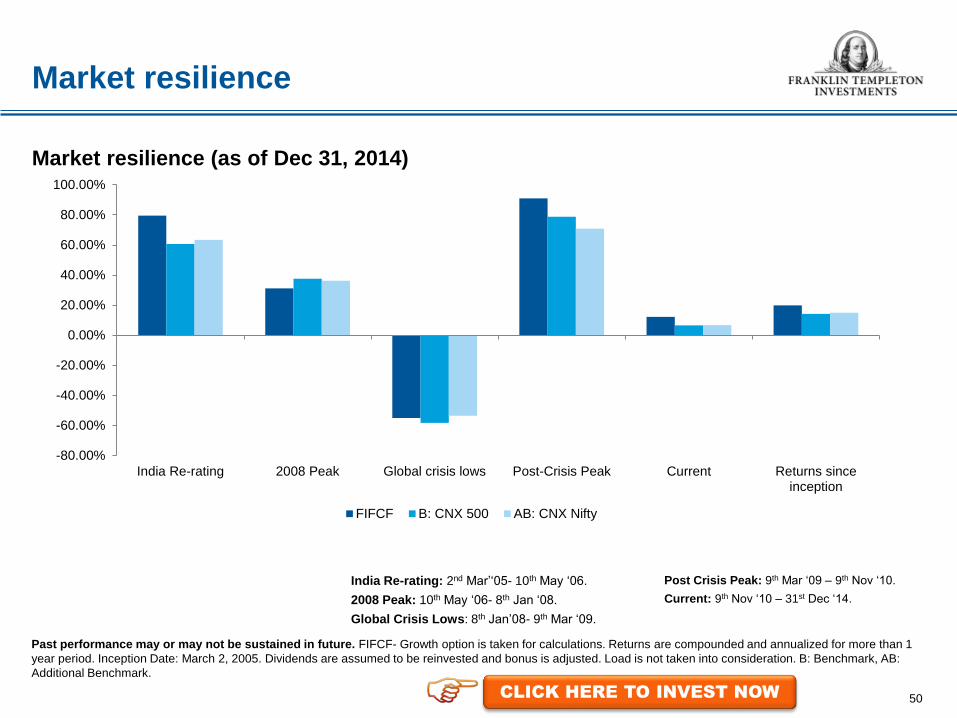
Market resilience
50
Past performance may or may not be sustained in future. FIFCF- Growth option is taken for calculations. Returns are compounded and annualized for more than 1 year period. Inception Date: March 2, 2005. Dividends are assumed to be reinvested and bonus is adjusted. Load is not taken into consideration. B: Benchmark, AB: Additional Benchmark.
Market resilience (as of Dec 31, 2014)
Post Crisis Peak: 9th Mar „09 – 9th Nov „10.
Current: 9th Nov „10 – 31st Dec „14.
India Re-rating: 2nd Mar‟„05- 10th May „06.
2008 Peak: 10th May „06- 8th Jan „08.
Global Crisis Lows: 8th Jan‟08- 9th Mar „09.
-80.00%
-60.00%
-40.00%
-20.00%
0.00%
20.00%
40.00%
60.00%
80.00%
100.00%
India Re-rating 2008 Peak Global crisis lows Post-Crisis Peak Current Returns sinceinception
FIFCF B: CNX 500 AB: CNX Nifty
CLICK HERE TO INVEST NOW
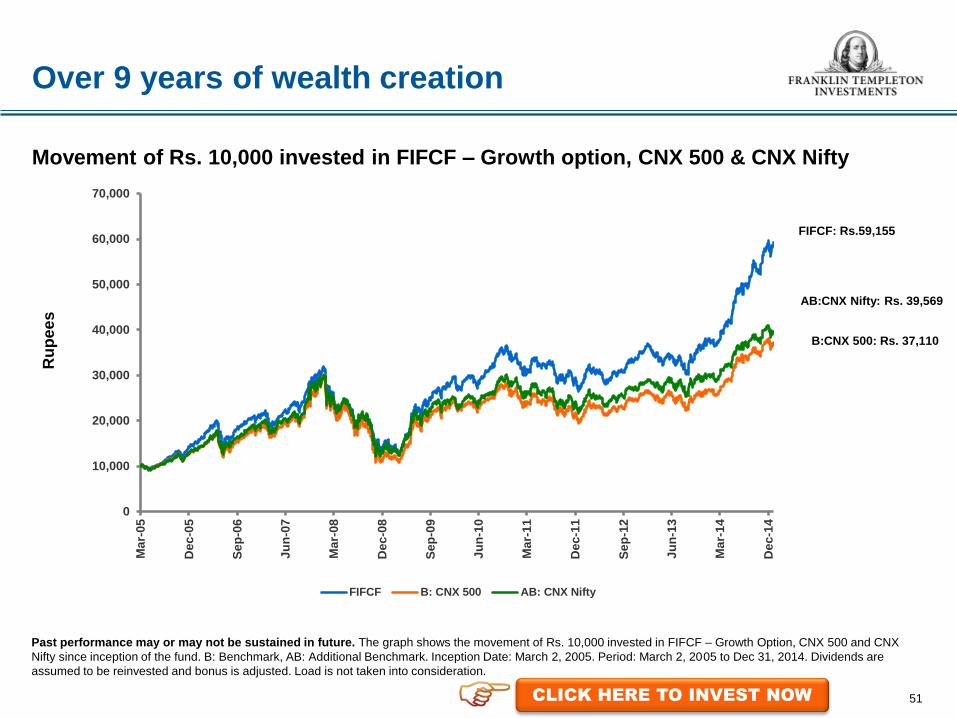
Over 9 years of wealth creation
51
Past performance may or may not be sustained in future. The graph shows the movement of Rs. 10,000 invested in FIFCF – Growth Option, CNX 500 and CNX Nifty since inception of the fund. B: Benchmark, AB: Additional Benchmark. Inception Date: March 2, 2005. Period: March 2, 2005 to Dec 31, 2014. Dividends are assumed to be reinvested and bonus is adjusted. Load is not taken into consideration.
Movement of Rs. 10,000 invested in FIFCF – Growth option, CNX 500 & CNX Nifty
FIFCF: Rs.59,155
Ru
pe
es
B:CNX 500: Rs. 37,110
AB:CNX Nifty: Rs. 39,569
0
10,000
20,000
30,000
40,000
50,000
60,000
70,000
Mar
-05
Dec
-05
Sep
-06
Jun
-07
Mar
-08
Dec
-08
Sep
-09
Jun
-10
Mar
-11
Dec
-11
Sep
-12
Jun
-13
Mar
-14
Dec
-14
FIFCF B: CNX 500 AB: CNX Nifty
CLICK HERE TO INVEST NOW

Presenting
Franklin India High Growth Companies Fund
Benefit from FIND IT approach
Product Label
This product is suitable for investors who are seeking*
• Long term capital appreciation
• A fund that invests in stocks of companies/sectors with high growth rates or above average potential
*Investors should consult their financial advisors if in doubt about whether the product is suitable for them. ** Note: Risk may be represented as:
BROWN: Investors understand that their principal will be at high risk
YELLOW: Investors understand that their principal will be at medium risk
BLUE: Investors understand that their principal will be at low risk
(BROWN)
High Risk**
52 CLICK HERE TO INVEST NOW
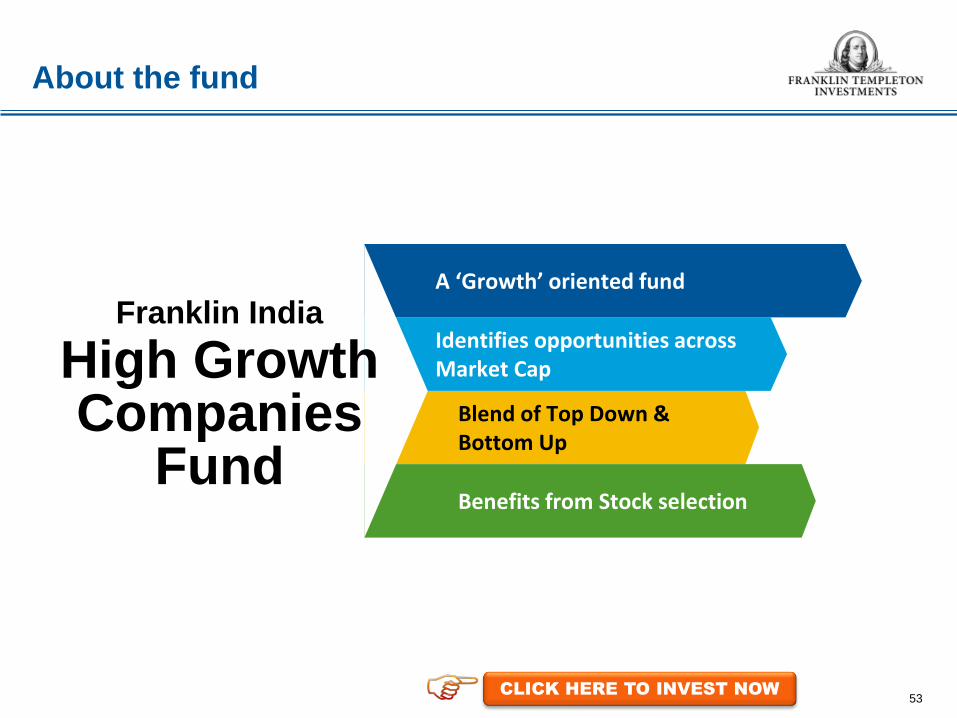
About the fund
53
Blend of Top Down & Bottom Up
A ‘Growth’ oriented fund
Identifies opportunities across Market Cap
Benefits from Stock selection
Franklin India
High Growth Companies
Fund
CLICK HERE TO INVEST NOW
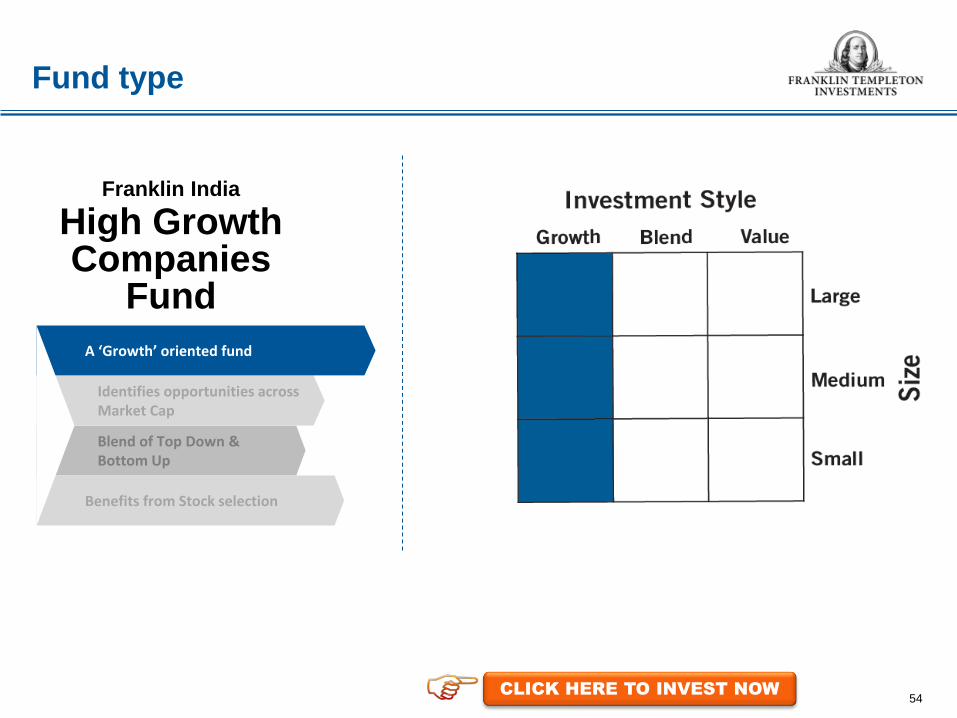
Fund type
54
Blend of Top Down & Bottom Up
A ‘Growth’ oriented fund
Identifies opportunities across Market Cap
Benefits from Stock selection
Franklin India
High Growth Companies
Fund
CLICK HERE TO INVEST NOW
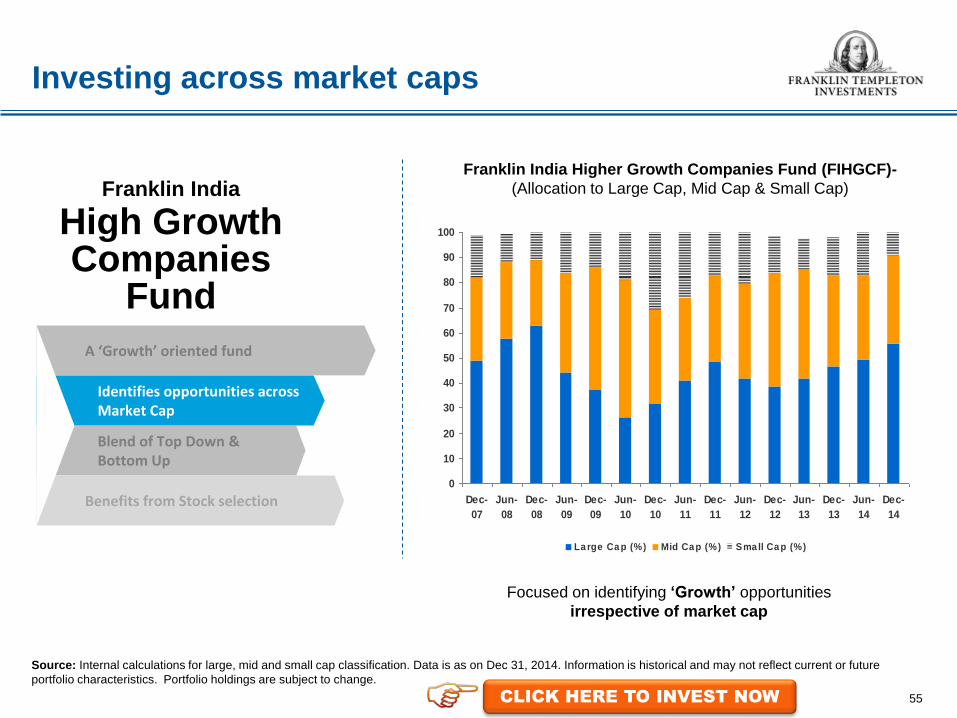
Investing across market caps
55
Source: Internal calculations for large, mid and small cap classification. Data is as on Dec 31, 2014. Information is historical and may not reflect current or future portfolio characteristics. Portfolio holdings are subject to change.
Franklin India Higher Growth Companies Fund (FIHGCF)- (Allocation to Large Cap, Mid Cap & Small Cap)
Focused on identifying ‘Growth’ opportunities irrespective of market cap
Blend of Top Down & Bottom Up
A ‘Growth’ oriented fund
Identifies opportunities across Market Cap
Benefits from Stock selection
Franklin India
High Growth Companies
Fund
0
10
20
30
40
50
60
70
80
90
100
Dec-07
Jun-08
Dec-08
Jun-09
Dec-09
Jun-10
Dec-10
Jun-11
Dec-11
Jun-12
Dec-12
Jun-13
Dec-13
Jun-14
Dec-14
La rge Ca p (%) Mid Ca p (%) Sma ll Ca p (%)
CLICK HERE TO INVEST NOW
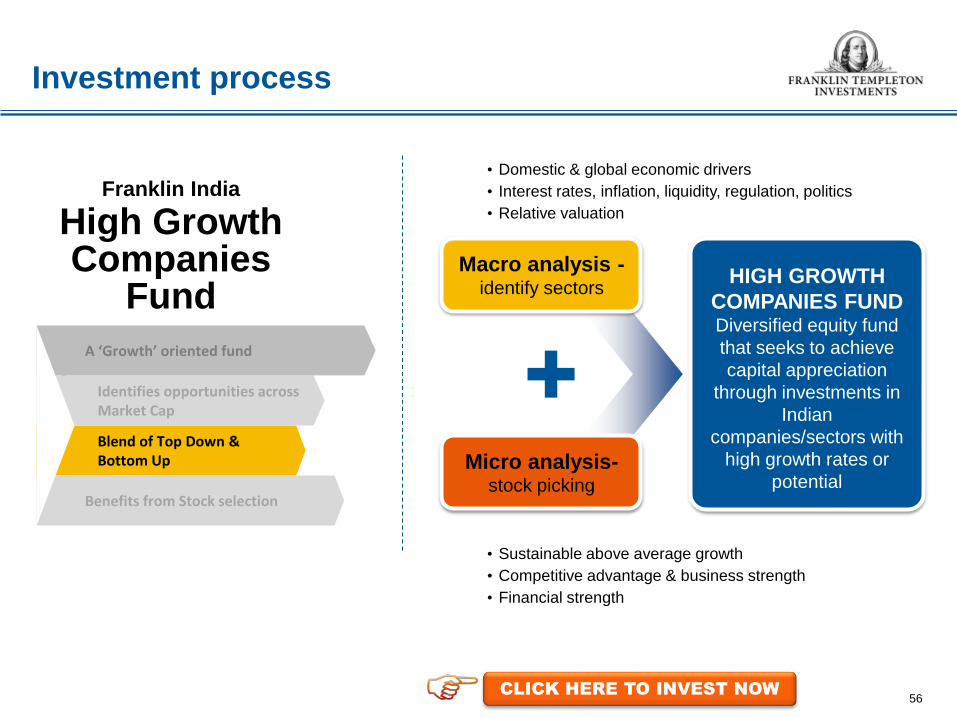
Investment process
56
• Domestic & global economic drivers • Interest rates, inflation, liquidity, regulation, politics • Relative valuation
• Sustainable above average growth • Competitive advantage & business strength • Financial strength
Macro analysis - identify sectors
HIGH GROWTH COMPANIES FUND Diversified equity fund that seeks to achieve capital appreciation
through investments in Indian
companies/sectors with high growth rates or
potential Micro analysis-
stock picking
Blend of Top Down & Bottom Up
A ‘Growth’ oriented fund
Identifies opportunities across Market Cap
Benefits from Stock selection
Franklin India
High Growth Companies
Fund
CLICK HERE TO INVEST NOW

57
Max Underweight (UW)
Max UW as on Sectors Max Overweight
(OW) Max OW as on
-12.71 Jun-11 Financials 14.09 Jan-09
-2.16 Feb-14 Industrials 21.55 Oct-07
-13.89 Oct-07 Materials 7.57 Mar-11
-8.49 Feb-14 Information Technology 5.18 Sep-07
-2.40 Nov-10 Health Care 10.90 Apr-13
-3.90 Aug-13 Consumer Discretionary 10.36 Sep-09
-1.34 Jul-09 Telecommunication Services 10.78 Jul-11
-16.06 Apr-08 Energy -4.42* Mar-14
-10.96 May-13 Consumer Staples 1.40 Apr-09
-10.44 Feb-09 Utilities 1.13 May-12
Top Down Approach Active management through sector allocation
Past performance may or may not be sustained in future
Source: FactSet as on December,2014. The data is taken from Sep „07 to Dec ‟14 (as on month ends ).The overweight and underweight position is taken with respect to the index CNX 500 and the maximum underweight and maximum overweight position has been highlighted for the given period. Information is historical. Portfolio holdings and sector allocation are subject to change. * Shows net underweight position.
The above table indicates the active sector allocation followed by the fund manager. There can be times when the fund manager might be significantly underweight/overweight on a particular sector, based on macroeconomic conditions coupled with her/his views.
CLICK HERE TO INVEST NOW
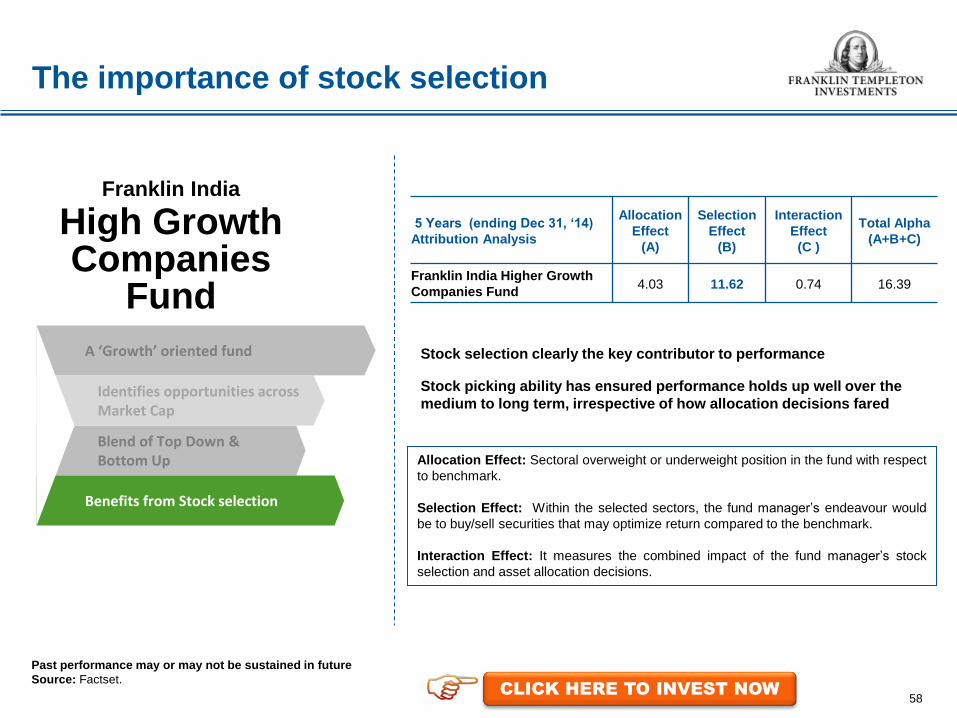
The importance of stock selection
58
5 Years (ending Dec 31, ‘14) Attribution Analysis
Allocation Effect
(A)
Selection Effect
(B)
Interaction Effect (C )
Total Alpha (A+B+C)
Franklin India Higher Growth Companies Fund
4.03 11.62 0.74 16.39
Stock selection clearly the key contributor to performance
Stock picking ability has ensured performance holds up well over the medium to long term, irrespective of how allocation decisions fared
Past performance may or may not be sustained in future Source: Factset.
Allocation Effect: Sectoral overweight or underweight position in the fund with respect to benchmark. Selection Effect: Within the selected sectors, the fund manager‟s endeavour would be to buy/sell securities that may optimize return compared to the benchmark. Interaction Effect: It measures the combined impact of the fund manager‟s stock selection and asset allocation decisions.
Blend of Top Down & Bottom Up
A ‘Growth’ oriented fund
Identifies opportunities across Market Cap
Benefits from Stock selection
Franklin India
High Growth Companies
Fund
CLICK HERE TO INVEST NOW

Contributors/detractors in last 3 years
59
Sector
Portfolio Benchmark Index Allocation Effect(A)
Selection/ Interaction Effect (B)
Total Effect (A+B) Average
Weight (%) Total
Return (%) Average
Weight (%) Total
Return (%)
Top 3 Contributors
Materials 12.02 76.37 9.53 16.86 0.23 8.24 8.47
Industrials 11.94 69.17 8.49 29.08 0.12 6.14 6.26
Information Technology 10.33 50.11 11.69 25.80 0.36 3.96 4.32
Detractor
Telecommunication Services 7.85 7.26 2.23 7.80 -0.94 0.64 -0.30
Past performance may or may not be sustained in future. Source: Factset as on December 31, 2014. Information is historical and may not reflect current or future portfolio characteristics. Portfolio holdings are subject to change.
Indicates high contribution to the total effect.
59 CLICK HERE TO INVEST NOW

60
Scheme Performance As on Dec 31, 2014
Scheme
NAV as on Dec 31,
2014
Discrete Returns (%) Since inception till
Dec 31, 2014
Value of Investment of Rs.10,000 since
inception
Inception Date
Dec 31, 2013 to Dec 31,
2014 Dec 31, 2012 to Dec
31, 2013 Dec 30, 2011 to Dec
31, 2012
NAV* Returns NAV* Returns NAV* Returns NAV* Returns Franklin India High Growth Companies Fund (FIHGCF) – Growth
28.4834 15.8615 79.58% 14.5227 9.22% 10.1883 42.54% 10 15.11% 28,483 26.7.2007
B:CNX 500 - - 37.82% - 3.61% - 31.84% - 7.90% 17,599 AB:CNX NIFTY - - 31.39% - 6.76% - 27.70% - 8.16% 17,929
Performance of Top 3 and bottom 3 schemes managed by the fund managers of the scheme Franklin India Feeder - Franklin U. S. Opportunities Fund (FIF-FUSOF) - Growth
18.9964 17.5284 8.37% 11.2913 55.24% N.A N.A 10 24.94% 18,996 13.2.2012
B:Russell 3000 Growth - - 14.71% - 50.84% - N.A - 27.86% 20,306
Additional Benchmark - - N.A - N.A - N.A - N.A N.A
Franklin India Prima Fund (FIPF)-Growth 632.4058 354.9962 78.14% 330.5324 7.40% 228.8636 44.42% 10 21.72% 632,406 1.12.1993
B:CNX 500 - - 37.82% - 3.61% - 31.84% - 10.38% 80,252 B:CNX Midcap - - 55.91% - -5.10% - 39.16% - N.A N.A AB:CNX Nifty - - 31.39% - 6.76% - 27.70% - 10.50% 82,173 Franklin Build India Fund (FBIF) - Growth
27.8689 14.3806 93.80% 13.5587 6.06% 9.6912 39.91% 10 21.22% 27,869 4.9.2009
B:CNX 500 - - 37.82% - 3.61% - 31.84% - 11.26% 17,650 AB:CNX NIFTY - - 31.39% - 6.76% - 27.70% - 11.31% 17,697 Franklin India Smaller Companies Fund (FISCF) - Growth
36.6957 19.3219 89.92% 17.0651 13.22% 11.2492 51.70% 10 15.60% 36,696 13.1.2006
B:CNX Midcap - - 55.91% - -5.10% - 39.16% - 12.98% 29,875 AB:CNX Nifty - - 31.39% - 6.76% - 27.70% - 12.63% 29,056 Franklin India Opportunities Fund (FIOF)
- Growth 53.6789 33.8503 58.58% 33.1418 2.14% 25.9909 27.51% 10 11.97% 53,679 21.2.2000
B:S&P BSE 200# - - 35.47% - 4.38% - 30.98% - 0.10% 10,145
AB:CNX Nifty - - 31.39% - 6.76% - 27.70% - 11.01% 47,235 Franklin Asian Equity Fund (FAEF) - Growth
16.0615 14.7110 9.18% 13.0929 12.36% 10.9755 19.29% 10 7.04% 16,062 16.1.2008
B: MSCI Asia (ex Japan) Standard Index - - 4.28% - 13.14% - 23.77% - 6.90% 15,910 AB: CNX Nifty - - 31.39% - 6.76% - 27.70% - 4.90% 13,954
Past performance may or may not be sustained in future. Fund Managers: FIHGCF: Roshi Jain & R. Janakiraman, FIPF: Roshi Jain and R. Janakiraman, FIF-FUSOF: Roshi Jain, FIPP: Anand Radhakrishnan & R. Janakiraman, FISCF: Roshi Jain & R. Janakiraman, FAEF: Roshi Jain, FIOF: R. Janakiraman, Anil Prabhudas. # Scheme benchmark, index adjusted for the period February 21, 2000 to March 10, 2004 with the performance of ET Mindex. *NAV(beginning of period). B: Benchmark, AB: Additional Benchmark, N.A.: Not Applicable. Dividends assumed to be reinvested and Bonus is adjusted. Discrete 12 months performance is absolute and since inception returns are compounded annualized. Dividends assumed to be reinvested and Bonus is adjusted. Load is not taken into consideration. The top three and bottom three funds managed by the fund manager(s) have been derived on the basis of the since inception returns. On account of difference in the type/category, asset allocation or investment strategy, inception dates, performances of these funds are not strictly comparable. Please refer to www.franklintempletonindia.com for details on performance of all schemes (including Direct Plans).

61
Past performance may or may not be sustained in future. The graph shows the movement of Rs. 10,000 invested in FIHGCF – Growth Plan, CNX 500 and CNX Nifty since inception of the fund. B: Benchmark and AB: Additional Benchmark. Inception Date: July 26, 2007. Period July 26,2007 – December 31,2014.Dividends are assumed to be reinvested and bonus is adjusted. Load is not taken into consideration.
Movement of Rs. 10,000 invested in FIHGCF, CNX 500 & CNX Nifty
FIHGCF: Rs. 28,483
B: CNX 500 - Rs. 17,599
AB: CNX Nifty - Rs. 17,929
Rup
ees
Calendar year
0
5,000
10,000
15,000
20,000
25,000
30,000J
ul-
07
No
v-0
7
Ma
r-0
8
Ju
l-0
8
No
v-0
8
Ma
r-0
9
Ju
l-0
9
No
v-0
9
Ma
r-1
0
Ju
l-1
0
No
v-1
0
Ma
r-1
1
Ju
l-1
1
No
v-1
1
Ma
r-1
2
Ju
l-1
2
No
v-1
2
Ma
r-1
3
Ju
l-1
3
No
v-1
3
Ma
r-1
4
Ju
l-1
4
No
v-1
4
FIHGCF B: CNX 500 AB: CNX Nifty
Over 7 years of wealth creation
CLICK HERE TO INVEST NOW
The information contained in this presentation is not a complete representation of every material fact regarding any industry, security or the fund. This communication is meant for use by the recipient and not for circulation/reproduction without prior approval. The views expressed by the portfolio managers are based on current market conditions and information available to them.
Risk Factors
62
Scheme Classification and Objective: Franklin India Prima Plus(FIPP): An open-end growth scheme with an objective to provide growth of capital plus regular dividend through a diversified portfolio of equities, fixed income securities and money market instruments. Franklin India Flexi Cap Fund(FIFCF): An open-end diversified equity fund that seeks to provide medium to long term capital appreciation by investing in stocks across the market capitalisation range. Franklin India High Growth Companies Fund(FIHGCF): An open-end diversified equity fund that seeks to achieve capital appreciation through investment in Indian companies/sectors with high growth potential. Please refer to website for latest load structure of respective schemes. Risk Factors: Mutual Fund investments are subject to market risks, read all scheme related documents carefully. The NAVs of the schemes may go up or down depending upon the factors and forces affecting the securities market. The Mutual Fund is not guaranteeing or assuring any dividend under any of the schemes and the same is subject to the availability and adequacy of distributable surplus. The past performance of the mutual funds managed by the Franklin Templeton Group and its affiliates is not necessarily indicative of future performance of the schemes. Investors are requested to review the prospectus carefully and obtain expert professional advice with regard to specific legal, tax and financial implications of the investment/participation in the scheme.
Statements / opinions / recommendations in this document, which contain words, or phrases such as “will”, “expect”, “should”, “believe” and similar expressions or variations of such expressions, are “forward looking statements”. Actual results may differ materially from those suggested by the forward looking statements due to risk or uncertainties associated with our expectations with respect to, but not limited to, exposure to market risks, general economic and political conditions in India and other countries globally, which have an impact on our services and / or investments.
© 2014 Franklin Templeton Investments. All rights reserved.
Franklin Templeton Asset Management (India) Pvt. Ltd. Indiabulls Finance Centre, Tower 2, 12th and 13th floor, Senapati Bapat Marg, Elphinstone (W) Mumbai 400013 Tel (91-22) 6751 9100 Fax (91-22) 6639 1281 www.franklintempletonindia.com
63