Embed Size (px)
DESCRIPTION
Citation preview
2 0 0 0 A N N U A L R E P O R T
OPENING DOORS
charts not to scale
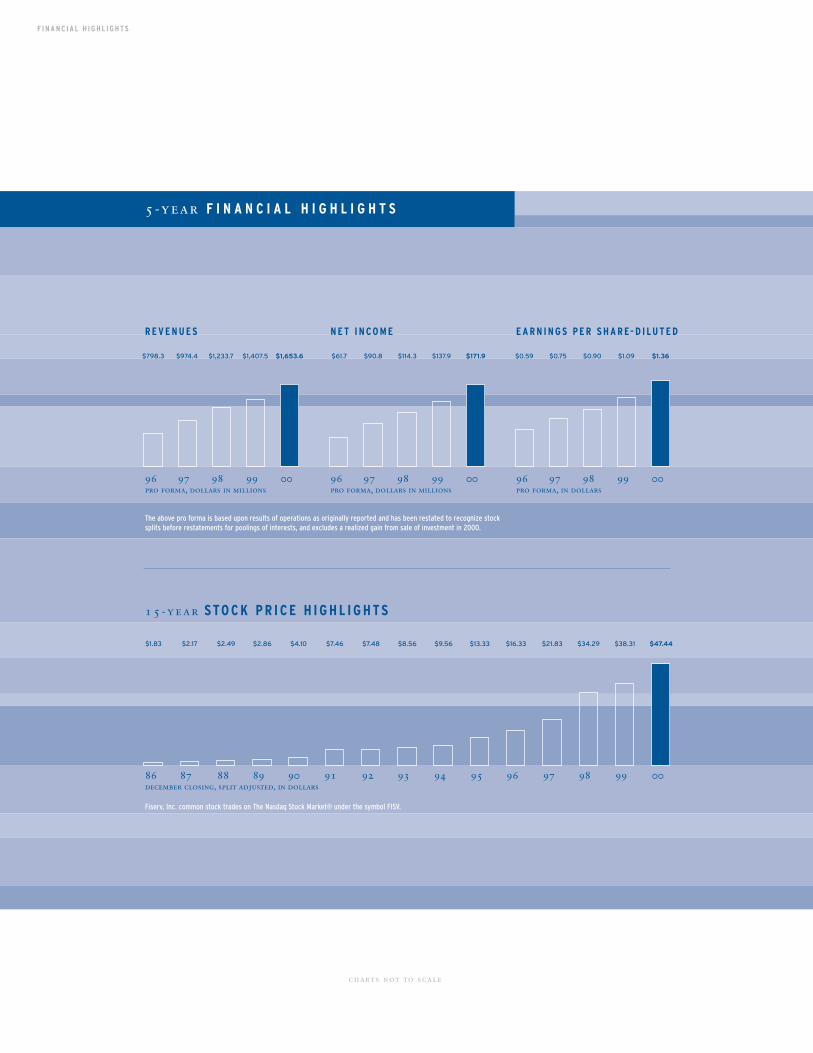
5-year F I N A N C I A L H I G H L I G H T S
R E V E N U E S N E T I N C O M E E A R N I N G S P E R S H A R E- D I LU T E D
15 -year S TO C K P R I C E H I G H L I G H T S
Fiserv, Inc. common stock trades on The Nasdaq Stock Market® under the symbol FISV.
86 87 88 89 90 91 92 93 94 95 96 97 98 99 00december closing, split adjusted, in dollars
96 97 98 99 00pro forma, dollars in millions
96 97 98 99 00pro forma, dollars in millions
96 97 98 99 00pro forma, in dollars
F I N A N C I A L H I G H L I G H T S
$1.83 $2.17 $2.49 $2.86 $4.10 $7.46 $7.48 $8.56 $9.56 $13.33 $16.33 $21.83 $34.29 $38.31 $47.44
$798.3 $974.4 $1,233.7 $1,407.5 $1,653.6 $61.7 $90.8 $114.3 $137.9 $171.9 $0.59 $0.75 $0.90 $1.09 $1.36
The above pro forma is based upon results of operations as originally reported and has been restated to recognize stock splits before restatements for poolings of interests, and excludes a realized gain from sale of investment in 2000.
PAGE 2 LETTER TO SHAREHOLDERSOur business is meeting the demand for new information technology services.
PAGE 4 OPENING THE DOORS TO OPPORTUNITYWe provide advanced solutions designed specifically forthe financial industry.
PAGE 6 SERVICE DIMENSIONSFiserv technology solutions are defined by industryfocus, allowing us to target our resources.
PAGE 8 CROSSING THE THRESHOLDFiserv clients are using our technology to overcomechallenges and expand opportunities.
PAGE 23 FINANCIAL DETAILSThe consolidated financial statements, notes, and management’s discussion and analysis for our Company.
PAGE 45 LEADERSHIP TEAMSOur strength has always been in our people, with Fiservmanagement leading the way.
TA B L E O F C O N T E N T S
T H E F I S E R V V I S I O N To be the leading information services provider for the
financial industry worldwide.
T H E F I S E R V M I S S I O N To deliver products and services that help our clients
grow their businesses and enhance service to their customers; to enable our people
to achieve outstanding job performance and personal growth; and to produce a
favorable level of earnings and consistent earnings growth for our Company, and
increased value for our shareholders.
table of C O N T E N T S
2000
financial
1 2 | 3 4 5 6 7 8 9 10 11 12 13 14 15 16 17 18 19 20 21 22 23 24 25 26 27 28 29 30 31 32 33 34 35 36 37 38 39 40 41 42 43 44 45 46 47
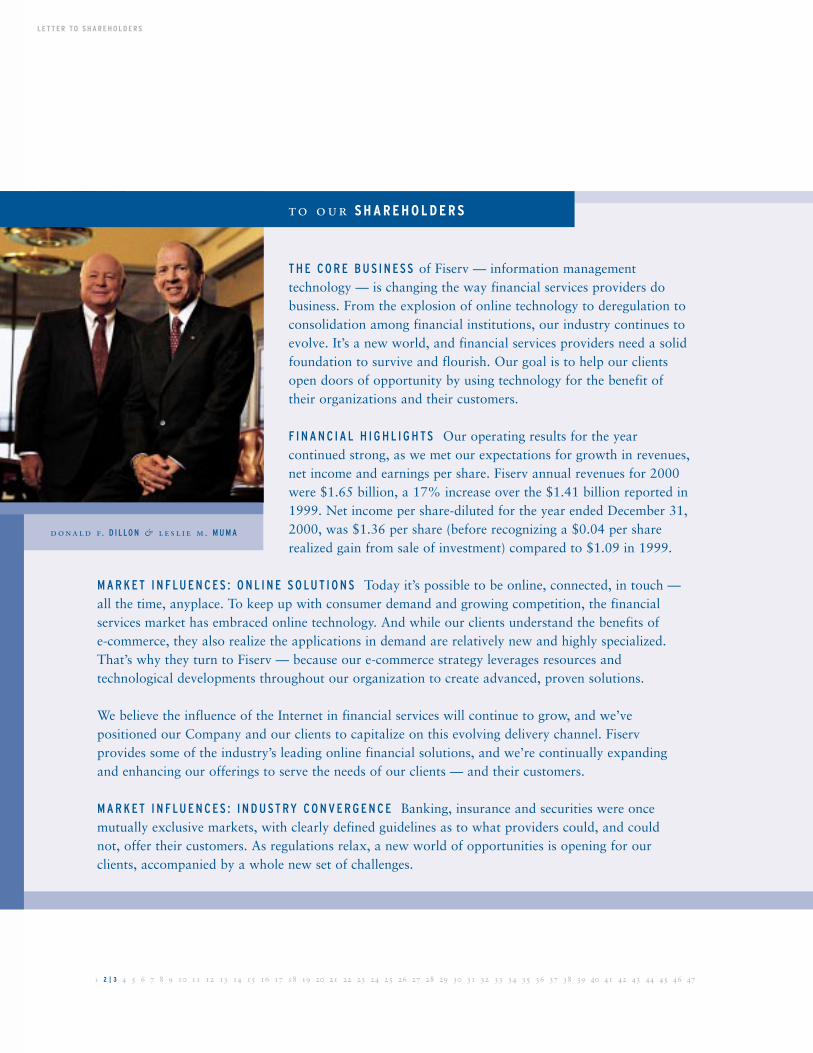
T H E CO R E B U S I N E S S of Fiserv — information management technology — is changing the way financial services providers dobusiness. From the explosion of online technology to deregulation toconsolidation among financial institutions, our industry continues toevolve. It’s a new world, and financial services providers need a solidfoundation to survive and flourish. Our goal is to help our clientsopen doors of opportunity by using technology for the benefit oftheir organizations and their customers.
F I N A N C I A L H I G H L I G H TS Our operating results for the year continued strong, as we met our expectations for growth in revenues,net income and earnings per share. Fiserv annual revenues for 2000were $1.65 billion, a 17% increase over the $1.41 billion reported in1999. Net income per share-diluted for the year ended December 31,2000, was $1.36 per share (before recognizing a $0.04 per share realized gain from sale of investment) compared to $1.09 in 1999.
M A R K E T I N F LU E N C E S : O N L I N E S O LU T I O N S Today it’s possible to be online, connected, in touch —all the time, anyplace. To keep up with consumer demand and growing competition, the financial services market has embraced online technology. And while our clients understand the benefits of e-commerce, they also realize the applications in demand are relatively new and highly specialized.That’s why they turn to Fiserv — because our e-commerce strategy leverages resources and technological developments throughout our organization to create advanced, proven solutions.
We believe the influence of the Internet in financial services will continue to grow, and we’ve positioned our Company and our clients to capitalize on this evolving delivery channel. Fiserv provides some of the industry’s leading online financial solutions, and we’re continually expanding and enhancing our offerings to serve the needs of our clients — and their customers.
M A R K E T I N F LU E N C E S : I N D U ST RY CO N V E R G E N C E Banking, insurance and securities were once mutually exclusive markets, with clearly defined guidelines as to what providers could, and could not, offer their customers. As regulations relax, a new world of opportunities is opening for ourclients, accompanied by a whole new set of challenges.
donald f. D I L LO N & lesl i e m . M U M A
L E T T E R TO S H A R E H O L D E R S
to our S H A R E H O L D E R S
L E T T E R TO S H A R E H O L D E R S
We have strategically enhanced our securities and insurance product offerings to serve this increasinglyimportant market segment. We’re continuing to bolster our presence in these key markets throughproduct development, growth in number of clients served (which has a positive impact on our resource efficiencies and development costs) and complementary acquisitions.
Fiserv is focused on helping our clients explore new and profitable markets by providing the resourcesthat allow them to offer the financial services most in demand by today’s consumers. We will continueto enhance our service capabilities in response to the needs of our industry.
M A R K E T I N F LU E N C E S : E VO LV I N G T R E N D S The financial services industry is dynamic, to say the least. Financial institutions today face new challenges on a daily basis — from increased competition to demand for new products and services. To stay competitive, they must enhance customer satisfaction while improving efficiencies in all aspects of their businesses. For most, the key is effective use of technology.
Trends show that financial institutions are looking to outsource more, offer additional online servicesand take advantage of diverse delivery channels. This means they need a strong technology partnerwith the resources, expertise and foresight to navigate an industry full of changing expectations.
At Fiserv, our primary business is providing information technology services. We believe the market potential for our products and services remains strong, and we will continue to focus on thesolutions that enable our clients to better serve their customers. We will adhere to our business strategy, utilize our ability to recognize and capitalize on industry trends, and never compromise our dedication to service excellence.
I N A P P R EC I AT I O N We thank you for your investment and confidence in our Company. We will workhard to continue providing the results that you, our owners, expect and deserve.
D O N A L D F. D I L LO N Chairman of the Board
February 27, 2001
L E S L I E M . M U M A President and Chief Executive Officer
M A R K E T O P P O R T U N I T I E S
1 2 3 4 | 5 6 7 8 9 10 11 12 13 14 15 16 17 18 19 20 21 22 23 24 25 26 27 28 29 30 31 32 33 34 35 36 37 38 39 40 41 42 43 44 45 46 47
“Our goal is to help our clients open doors of opportunity by using technology for
the benefit of their organizations and their customers.” - Les Muma, President & CEO
F I N A N C I A L S E RV I C E S P R OV I D E R S today face a dynamic business environment.There’s a continual demand for new products and services, for better and faster service, for broader access through new delivery channels. Financial institutions are facing a whole new set of market challenges, including both traditional and non-traditional competitors. As always, there is the need to add new customers while expanding existing relationships. Keeping service quality high and customers satisfied are vital to success.
Technology offers financial services providers the means to meet — and exceed — all of their varying business requirements. Providers can enhance their service levels, meet changing consumer needs quickly and easily, expand their marketsthrough competitive products and services, and overcome operating and deliverychallenges. With Fiserv as their partner, financial institutions are free to focus ontheir core business.
Financial institutions can reach new heights through our proven technology systemsthat are designed specifically for the requirements of the financial industry. WithFiserv solutions, clients can help their customers get connected with anywhere, anytime, anyway financial services. Through advanced technology backed by industry-specific knowledge, Fiserv clients can streamline operations to improve their businessefficiencies. As a comprehensive solutions provider, we offer the products and servicesthat enable our clients to distinguish themselves in the marketplace and be differentfrom the competition. In other words, Fiserv provides the right tools for today’sfinancial services providers to open the doors of opportunity.
S T R AT EG I C A C Q U I S I T I O N S
1 2 3 4 5 6 7 8 9 10 11 12 13 14 15 16 17 18 19 20 21 22 23 24 25 26 27 28 29 30 31 32 33 34 35 36 37 38 39 40 41 42 43 44 45
During 2000, we continued to enhance ourcapabilities through strategic acquisitions. Weadded to our plastic card processing and printingcapabilities, expanded our trust administrationservices and added a new line of business to ourinsurance offerings.
PATTERSON PRESS has been providing specializedprinting and plastic card manufacturing servicesto the financial industry since 1983. As part ofour Personix business, which is one of thenation’s leading providers of card personalizationand mailing services, Patterson Press continuesto apply its proven reputation for technologicalcapability, reliability and product quality to thebenefit of Fiserv clients nationwide.
RESOURCES TRUST COMPANY specializes in theadministration of self-directed retirement planaccounts and custodial investment accounts.Resources Trust enhances our capability to meet the growing needs of the financial representatives we serve, while expanding ourlevel of expertise and product lines within theself-directed retirement plan market. ResourcesTrust Company was formed in 1982.
NATIONAL FLOOD SERVICES, INC. is a specializedprovider of flood policy administration servicesto insurance companies and their agents. Formedin 1986, the company serves as a third-partyadministrator for companies participating in theNational Flood Insurance Program. With theaddition of National Flood Services, we continueto broaden our solutions to meet another specialized need within the insurance industry.
NEW SERVICE OPPORTUNITIES THROUGH ENHANCED OFFERINGS
F I S E R V D I M E N S I O N S
1 2 3 4 5 6 | 7 8 9 10 11 12 13 14 15 16 17 18 19 20 21 22 23 24 25 26 27 28 29 30 31 32 33 34 35 36 37 38 39 40 41 42 43 44 45 46 47
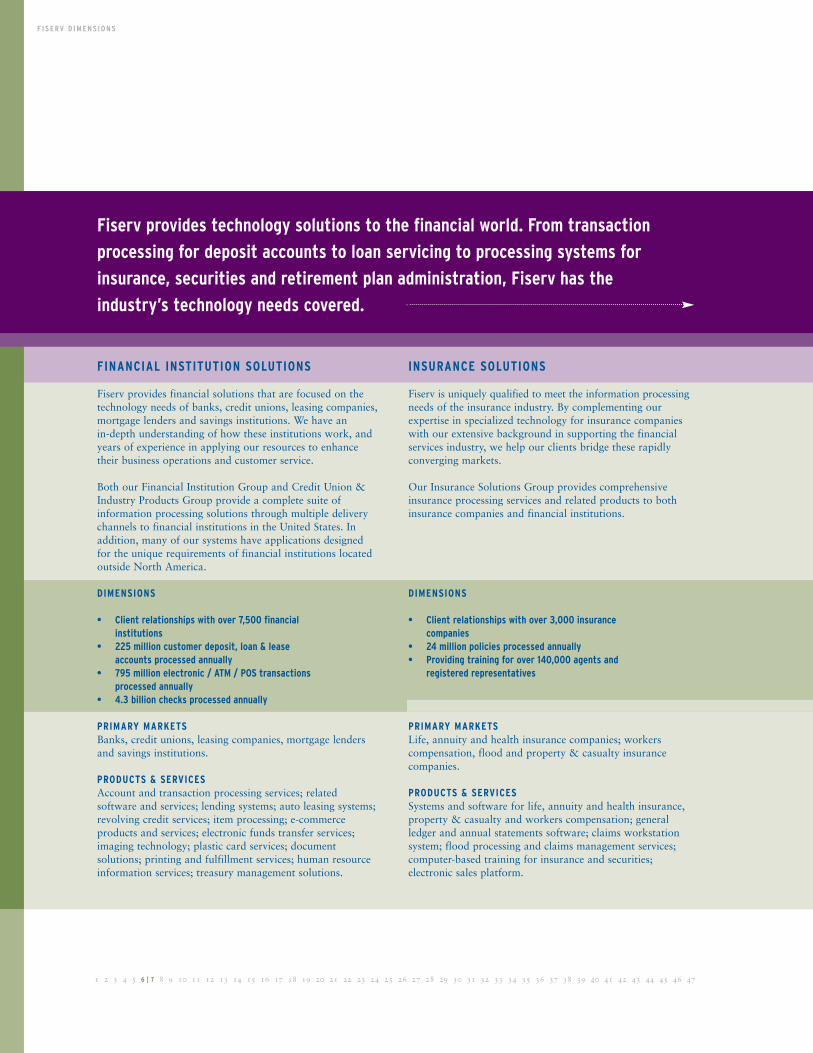
FINANCIAL INSTITUTION SOLUTIONS
Fiserv provides financial solutions that are focused on the technology needs of banks, credit unions, leasing companies,mortgage lenders and savings institutions. We have an in-depth understanding of how these institutions work, andyears of experience in applying our resources to enhancetheir business operations and customer service.
Both our Financial Institution Group and Credit Union &Industry Products Group provide a complete suite of information processing solutions through multiple deliverychannels to financial institutions in the United States. Inaddition, many of our systems have applications designed for the unique requirements of financial institutions locatedoutside North America.
DIMENSIONS
• Client relationships with over 7,500 financial institutions
• 225 million customer deposit, loan & leaseaccounts processed annually
• 795 million electronic / ATM / POS transactions processed annually
• 4.3 billion checks processed annually
PRIMARY MARKETSBanks, credit unions, leasing companies, mortgage lendersand savings institutions.
PRODUCTS & SERVICESAccount and transaction processing services; related software and services; lending systems; auto leasing systems;revolving credit services; item processing; e-commerce products and services; electronic funds transfer services;imaging technology; plastic card services; document solutions; printing and fulfillment services; human resourceinformation services; treasury management solutions.
INSURANCE SOLUTIONS
Fiserv is uniquely qualified to meet the information processingneeds of the insurance industry. By complementing ourexpertise in specialized technology for insurance companieswith our extensive background in supporting the financialservices industry, we help our clients bridge these rapidlyconverging markets.
Our Insurance Solutions Group provides comprehensiveinsurance processing services and related products to bothinsurance companies and financial institutions.
DIMENSIONS
• Client relationships with over 3,000 insurance companies
• 24 million policies processed annually• Providing training for over 140,000 agents and
registered representatives
PRIMARY MARKETSLife, annuity and health insurance companies; workers compensation, flood and property & casualty insurance companies.
PRODUCTS & SERVICESSystems and software for life, annuity and health insurance,property & casualty and workers compensation; general ledger and annual statements software; claims workstationsystem; flood processing and claims management services;computer-based training for insurance and securities; electronic sales platform.
Fiserv provides technology solutions to the financial world. From transaction
processing for deposit accounts to loan servicing to processing systems for
insurance, securities and retirement plan administration, Fiserv has the
industry’s technology needs covered.
F I S E R V D I M E N S I O N S
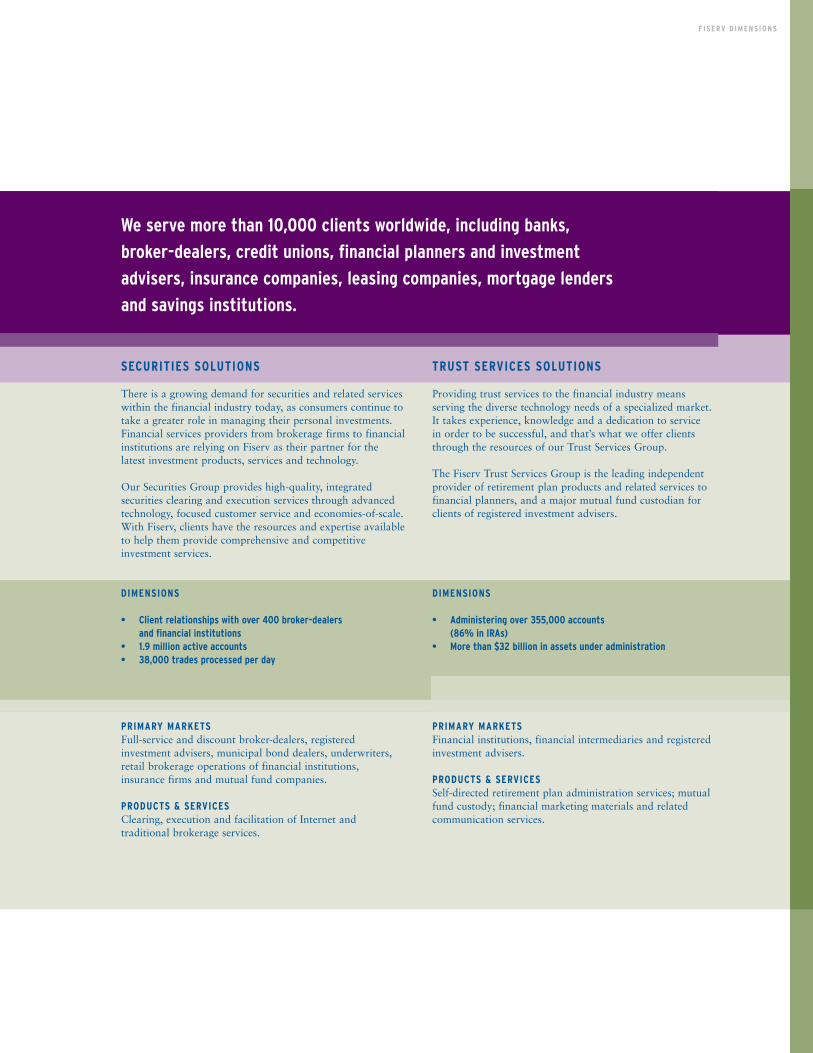
SECURITIES SOLUTIONS
There is a growing demand for securities and related serviceswithin the financial industry today, as consumers continue totake a greater role in managing their personal investments.Financial services providers from brokerage firms to financialinstitutions are relying on Fiserv as their partner for the latest investment products, services and technology.
Our Securities Group provides high-quality, integrated securities clearing and execution services through advancedtechnology, focused customer service and economies-of-scale.With Fiserv, clients have the resources and expertise availableto help them provide comprehensive and competitive investment services.
DIMENSIONS
• Client relationships with over 400 broker-dealers and financial institutions
• 1.9 million active accounts• 38,000 trades processed per day
PRIMARY MARKETSFull-service and discount broker-dealers, registered investment advisers, municipal bond dealers, underwriters,retail brokerage operations of financial institutions, insurance firms and mutual fund companies.
PRODUCTS & SERVICESClearing, execution and facilitation of Internet and traditional brokerage services.
TRUST SERVICES SOLUTIONS
Providing trust services to the financial industry means serving the diverse technology needs of a specialized market.It takes experience, knowledge and a dedication to service in order to be successful, and that’s what we offer clientsthrough the resources of our Trust Services Group.
The Fiserv Trust Services Group is the leading independentprovider of retirement plan products and related services tofinancial planners, and a major mutual fund custodian forclients of registered investment advisers.
DIMENSIONS
• Administering over 355,000 accounts(86% in IRAs)
• More than $32 billion in assets under administration
PRIMARY MARKETSFinancial institutions, financial intermediaries and registeredinvestment advisers.
PRODUCTS & SERVICESSelf-directed retirement plan administration services; mutualfund custody; financial marketing materials and related communication services.
We serve more than 10,000 clients worldwide, including banks,
broker-dealers, credit unions, financial planners and investment
advisers, insurance companies, leasing companies, mortgage lenders
and savings institutions.

F I N A N C I A L I N S T I T U T I O N P R O F I L E
1 2 3 4 5 6 7 8 9 10 11 12 13 14 15 16 17 18 19 20 21 22 23 24 25 26 27 28 29 30 31 32 33 34 35 36 37 38 39 40 41 42 43 44 45 client profile: S OV E R E I G N B A N C O R P, I N C . , W YO M I S S I N G, P E N N SY LVA N I A
REACH NEW HEIGHTS
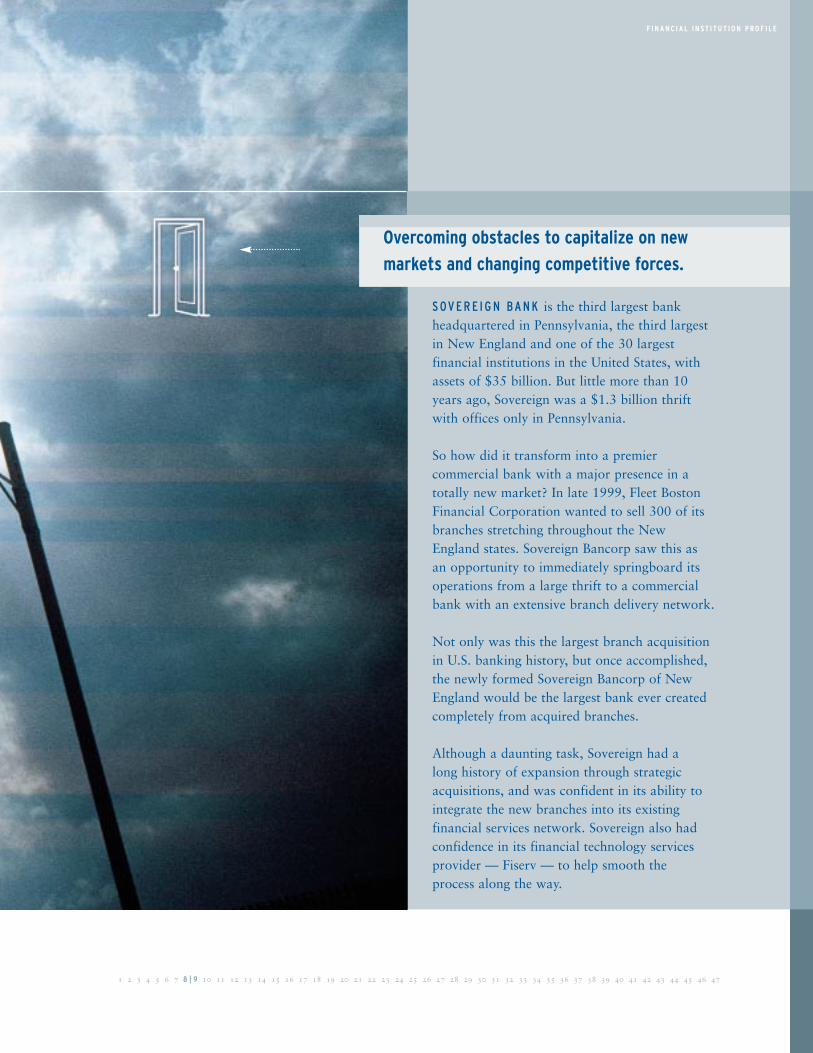
Overcoming obstacles to capitalize on new
markets and changing competitive forces.
F I N A N C I A L I N S T I T U T I O N P R O F I L E
1 2 3 4 5 6 7 8 | 9 10 11 12 13 14 15 16 17 18 19 20 21 22 23 24 25 26 27 28 29 30 31 32 33 34 35 36 37 38 39 40 41 42 43 44 45 46 47
S OV E R E I G N BA N K is the third largest bankheadquartered in Pennsylvania, the third largestin New England and one of the 30 largest financial institutions in the United States, withassets of $35 billion. But little more than 10years ago, Sovereign was a $1.3 billion thriftwith offices only in Pennsylvania.
So how did it transform into a premier commercial bank with a major presence in atotally new market? In late 1999, Fleet BostonFinancial Corporation wanted to sell 300 of itsbranches stretching throughout the NewEngland states. Sovereign Bancorp saw this as an opportunity to immediately springboard its operations from a large thrift to a commercialbank with an extensive branch delivery network.
Not only was this the largest branch acquisitionin U.S. banking history, but once accomplished,the newly formed Sovereign Bancorp of NewEngland would be the largest bank ever createdcompletely from acquired branches.
Although a daunting task, Sovereign had a long history of expansion through strategicacquisitions, and was confident in its ability tointegrate the new branches into its existingfinancial services network. Sovereign also hadconfidence in its financial technology servicesprovider — Fiserv — to help smooth the process along the way.
F I N A N C I A L I N S T I T U T I O N P R O F I L E
1 2 3 4 5 6 7 8 9 10 | 11 12 13 14 15 16 17 18 19 20 21 22 23 24 25 26 27 28 29 30 31 32 33 34 35 36 37 38 39 40 41 42 43 44 45 46 47
Not only was this the largest branch acquisition in U.S. banking history, but once
accomplished, the newly formed Sovereign Bancorp of New England would be the
largest bank ever created completely from acquired branches.
SOVEREIGN BANCORP, INC. — CONTINUED
The logistics of such an undertaking were challenging, especially with the aggressive timeline established by the bank. Sovereign’smanagement wanted the entire acquisition andconversion process to be completed in just oversix months. The project needed dedication, targeted resources and flexibility to meet rapidlychanging requirements that resulted from theimmovable deadlines. Which is why Sovereignturned to Fiserv for the technical expertise andcomprehensive support to make the transition a success.
Mobilizing a project team of experienced personnel from throughout the United States,Fiserv worked closely with Sovereign Bank tobuild the technology infrastructure that wouldsupport the new bank. Our objective was to takewhatever steps were necessary to ensure thatSovereign met its schedule. We remodeled facilities, hired and trained additional personnel,and installed new equipment. When operationaland technical challenges arose, we rallied ourresources to help Sovereign overcome them. The result was a smooth conversion in just fourmonths — well within the planned timeline.
But our relationship with Sovereign Bank didn’tbegin and end with support for this major acquisition. The bank is a longtime client ofFiserv, and we are meeting the technologyrequirements of their expanded network on adaily basis. Sovereign Bank relies on Fiserv toprovide the systems and solutions that fulfill themany information management and technologyneeds of a large financial institution. In additionto core processing services, we supply the bankwith advanced solutions for data warehousing;item processing and imaging services; electronicbanking and bill payment; cash and treasurymanagement solutions; risk management; andback-office automation.
Fiserv has the flexibility and breadth of productsto meet the needs of a growing financial institution, no matter what its size. We have along history of helping institutions overcomechallenges so they can capitalize on new marketsand changing competitive forces. Workingtogether, we help our clients reach their goalsand thrive in a dynamic environment.
client profile: F I R S T F E D E R A L S AV I N G S B A N K O F A M E R I C A , S WA N S E A , M A S S A C H U S E T T S
F I N A N C I A L I N S T I T U T I O N P R O F I L E
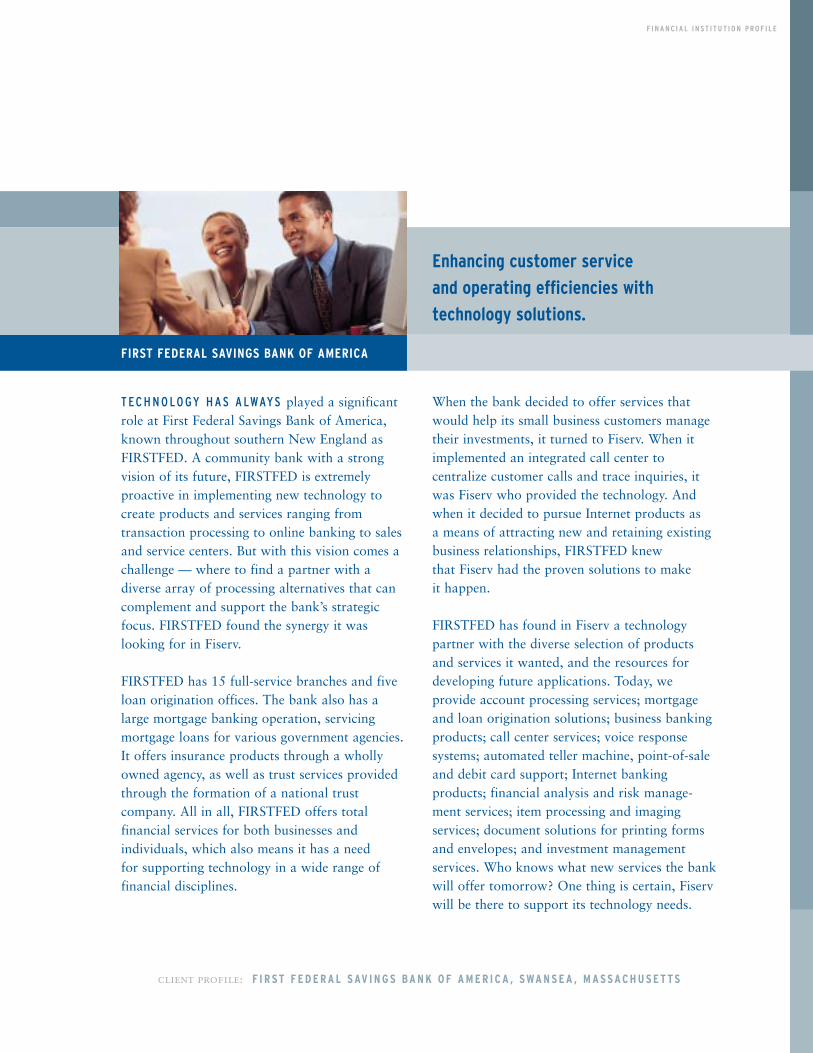
Enhancing customer service
and operating efficiencies with
technology solutions.
FIRST FEDERAL SAVINGS BANK OF AMERICA
T EC H N O LO GY H A S A LWAYS played a significantrole at First Federal Savings Bank of America,known throughout southern New England asFIRSTFED. A community bank with a strongvision of its future, FIRSTFED is extremelyproactive in implementing new technology tocreate products and services ranging from transaction processing to online banking to salesand service centers. But with this vision comes achallenge — where to find a partner with adiverse array of processing alternatives that cancomplement and support the bank’s strategicfocus. FIRSTFED found the synergy it was looking for in Fiserv.
FIRSTFED has 15 full-service branches and fiveloan origination offices. The bank also has alarge mortgage banking operation, servicingmortgage loans for various government agencies.It offers insurance products through a whollyowned agency, as well as trust services providedthrough the formation of a national trust company. All in all, FIRSTFED offers totalfinancial services for both businesses and individuals, which also means it has a need for supporting technology in a wide range offinancial disciplines.
When the bank decided to offer services thatwould help its small business customers managetheir investments, it turned to Fiserv. When it implemented an integrated call center to centralize customer calls and trace inquiries, itwas Fiserv who provided the technology. Andwhen it decided to pursue Internet products as a means of attracting new and retaining existingbusiness relationships, FIRSTFED knew that Fiserv had the proven solutions to make it happen.
FIRSTFED has found in Fiserv a technologypartner with the diverse selection of productsand services it wanted, and the resources fordeveloping future applications. Today, we provide account processing services; mortgageand loan origination solutions; business bankingproducts; call center services; voice response systems; automated teller machine, point-of-saleand debit card support; Internet banking products; financial analysis and risk manage-ment services; item processing and imaging services; document solutions for printing formsand envelopes; and investment managementservices. Who knows what new services the bankwill offer tomorrow? One thing is certain, Fiservwill be there to support its technology needs.
F I N A N C I A L I N S T I T U T I O N P R O F I L E
client profile: A M E R I C A N A I R L I N E S F E D E R A L C R E D I T U N I O N , DA L L A S , T E X A S
GET CONNECTED
A M E R I C A N A I R L I N E S F E D E R A L C R E D I T U N I O N ( A A FC U ) must move fast to keep up with its members. As the nation’s eighth largest credit union with assets approaching $2.7 billion, AAFCUboasts a worldwide membership of 190,000. The key word in that phrase is worldwide. Serving the employees of American Airlines since 1936, the credit union works daily to stay ahead of a membership that not only travels constantly, but lives in every corner of the world.
How do you meet the needs of such a dynamic and widespread membership? What’s the tie that keeps everything and everyone connected? AAFCU found its answer in combining outstandingemployees with great technology solutions. Specifically, in Fiserv technology for credit unions.
The most critical challenge for AAFCU was to go beyond a mere physical presence to keep up with itsconstantly moving member base. The credit union realized the impact the Internet would have on itsunique business challenges, so using a suite of online transaction solutions from Fiserv, it developed itsown Web site: www.aacreditunion.org. Now, it can provide anywhere, anytime access to financialservices, allowing members to pay bills, transfer funds between accounts, apply for loans, even locateand finance new vehicles — all online.
Fueling real-time transactions and continuous
support for anywhere, anytime, anyway service.
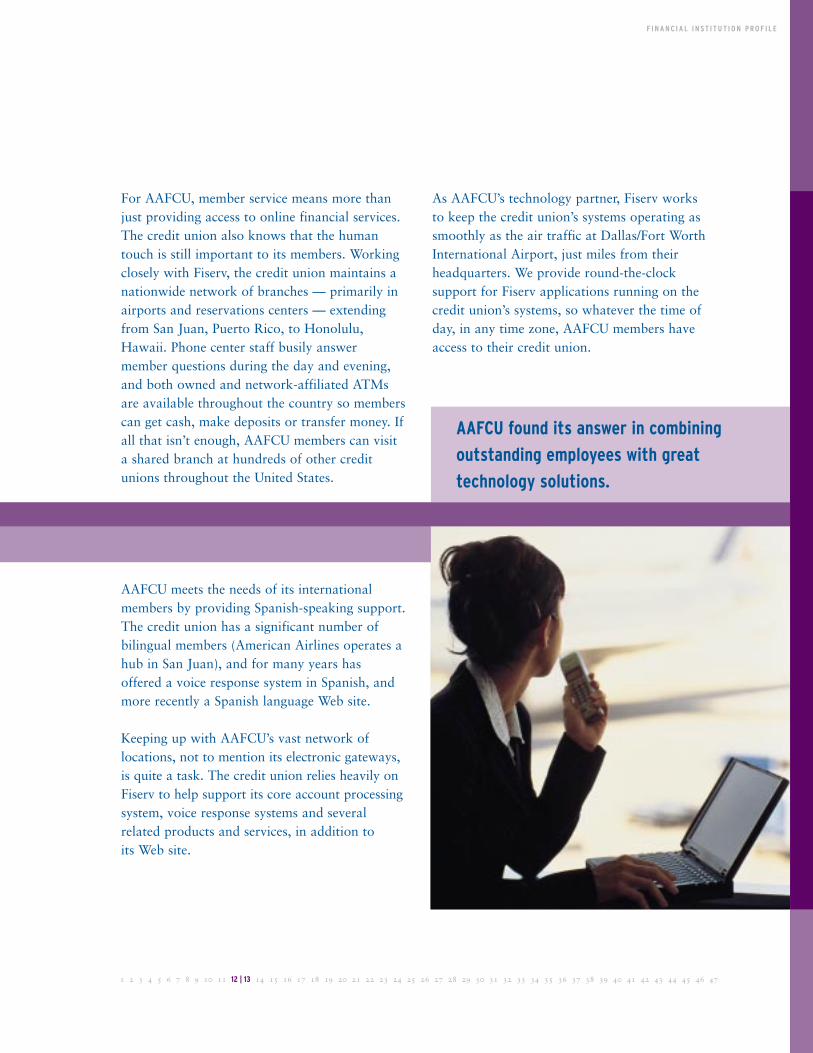
For AAFCU, member service means more thanjust providing access to online financial services.The credit union also knows that the humantouch is still important to its members. Workingclosely with Fiserv, the credit union maintains anationwide network of branches — primarily inairports and reservations centers — extendingfrom San Juan, Puerto Rico, to Honolulu,Hawaii. Phone center staff busily answer member questions during the day and evening,and both owned and network-affiliated ATMsare available throughout the country so memberscan get cash, make deposits or transfer money. Ifall that isn’t enough, AAFCU members can visita shared branch at hundreds of other creditunions throughout the United States.
AAFCU meets the needs of its internationalmembers by providing Spanish-speaking support.The credit union has a significant number ofbilingual members (American Airlines operates ahub in San Juan), and for many years hasoffered a voice response system in Spanish, andmore recently a Spanish language Web site.
Keeping up with AAFCU’s vast network of locations, not to mention its electronic gateways,is quite a task. The credit union relies heavily onFiserv to help support its core account processingsystem, voice response systems and several related products and services, in addition to its Web site.
As AAFCU’s technology partner, Fiserv works to keep the credit union’s systems operating assmoothly as the air traffic at Dallas/Fort WorthInternational Airport, just miles from their headquarters. We provide round-the-clock support for Fiserv applications running on thecredit union’s systems, so whatever the time ofday, in any time zone, AAFCU members haveaccess to their credit union.
F I N A N C I A L I N S T I T U T I O N P R O F I L E
1 2 3 4 5 6 7 8 9 10 11 12 | 13 14 15 16 17 18 19 20 21 22 23 24 25 26 27 28 29 30 31 32 33 34 35 36 37 38 39 40 41 42 43 44 45 46 47
AAFCU found its answer in combining
outstanding employees with great
technology solutions.
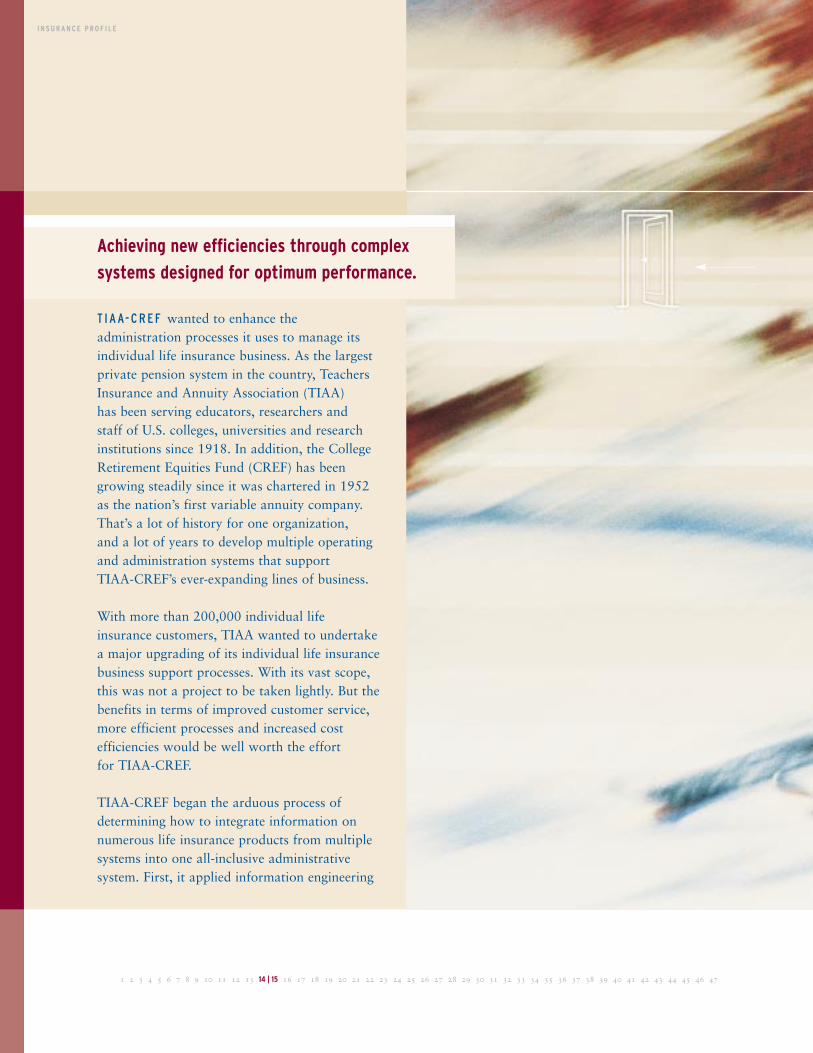
Achieving new efficiencies through complex
systems designed for optimum performance.
1 2 3 4 5 6 7 8 9 10 11 12 13 14 | 15 16 17 18 19 20 21 22 23 24 25 26 27 28 29 30 31 32 33 34 35 36 37 38 39 40 41 42 43 44 45 46 47
I N S U R A N C E P R O F I L E
T I A A- C R E F wanted to enhance the administration processes it uses to manage itsindividual life insurance business. As the largestprivate pension system in the country, TeachersInsurance and Annuity Association (TIAA) has been serving educators, researchers and staff of U.S. colleges, universities and researchinstitutions since 1918. In addition, the CollegeRetirement Equities Fund (CREF) has beengrowing steadily since it was chartered in 1952as the nation’s first variable annuity company.That’s a lot of history for one organization, and a lot of years to develop multiple operatingand administration systems that support TIAA-CREF’s ever-expanding lines of business.
With more than 200,000 individual life insurance customers, TIAA wanted to undertakea major upgrading of its individual life insurancebusiness support processes. With its vast scope,this was not a project to be taken lightly. But thebenefits in terms of improved customer service,more efficient processes and increased cost efficiencies would be well worth the effort for TIAA-CREF.
TIAA-CREF began the arduous process of determining how to integrate information onnumerous life insurance products from multiplesystems into one all-inclusive administrative system. First, it applied information engineering
I N S U R A N C E P R O F I L E
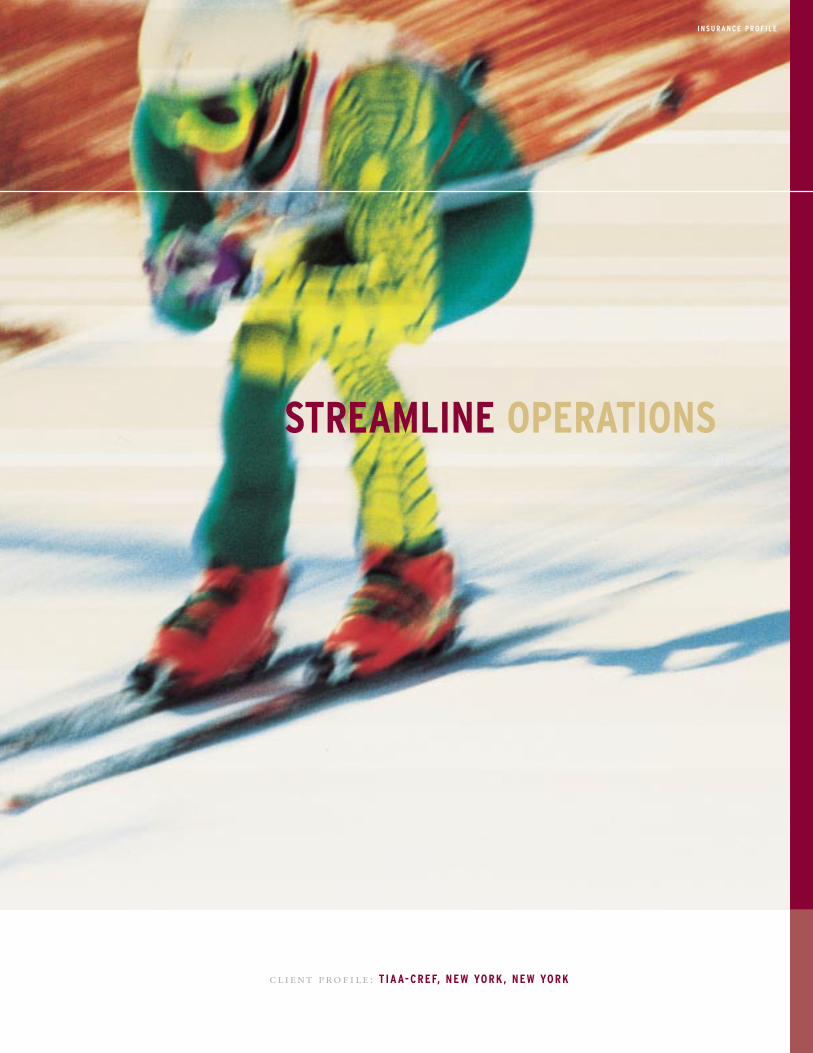
client profile: TIAA-CREF, NEW YORK, NEW YORK
STREAMLINE OPERATIONS
I N S U R A N C E P R O F I L E
1 2 3 4 5 6 7 8 9 10 11 12 13 14 15 16 | 17 18 19 20 21 22 23 24 25 26 27 28 29 30 31 32 33 34 35 36 37 38 39 40 41 42 43 44 45 46 47
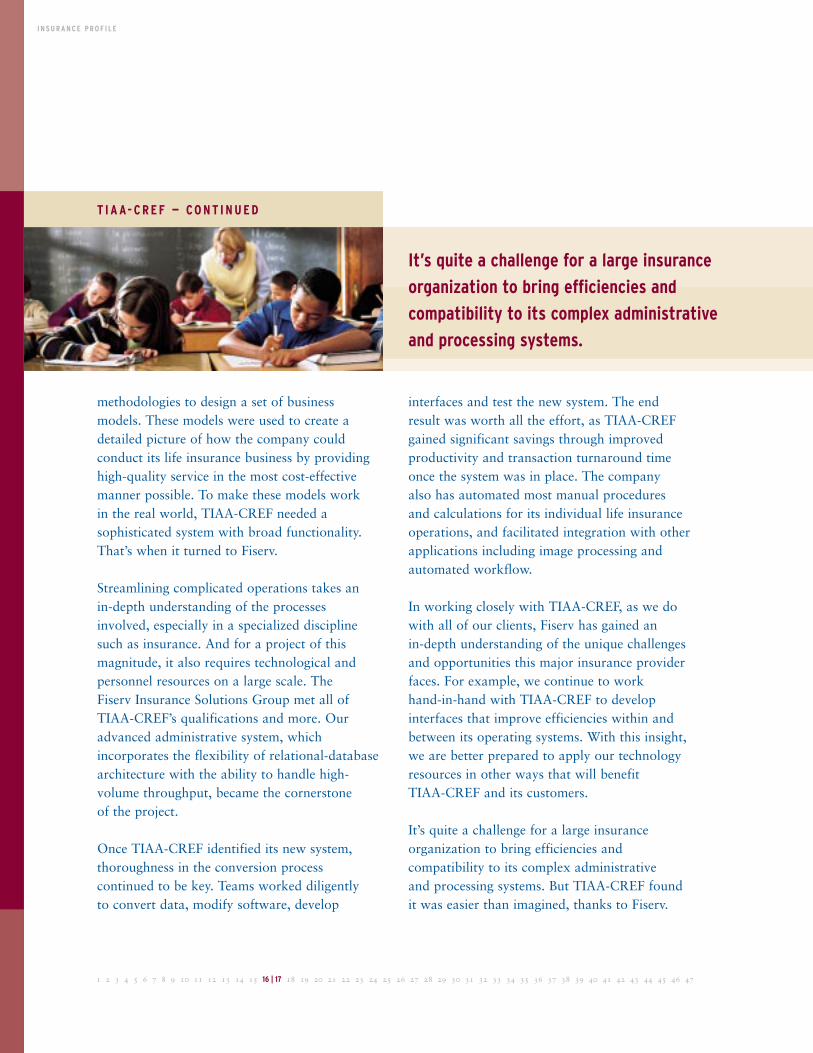
It’s quite a challenge for a large insurance
organization to bring efficiencies and
compatibility to its complex administrative
and processing systems.
T I A A- C R E F — C O N T I N U E D
methodologies to design a set of business models. These models were used to create adetailed picture of how the company could conduct its life insurance business by providinghigh-quality service in the most cost-effectivemanner possible. To make these models work in the real world, TIAA-CREF needed a sophisticated system with broad functionality.That’s when it turned to Fiserv.
Streamlining complicated operations takes an in-depth understanding of the processesinvolved, especially in a specialized disciplinesuch as insurance. And for a project of this magnitude, it also requires technological andpersonnel resources on a large scale. The Fiserv Insurance Solutions Group met all ofTIAA-CREF’s qualifications and more. Ouradvanced administrative system, whichincorporates the flexibility of relational-databasearchitecture with the ability to handle high-volume throughput, became the cornerstone of the project.
Once TIAA-CREF identified its new system,thoroughness in the conversion process continued to be key. Teams worked diligently to convert data, modify software, develop
interfaces and test the new system. The endresult was worth all the effort, as TIAA-CREFgained significant savings through improved productivity and transaction turnaround timeonce the system was in place. The company also has automated most manual procedures and calculations for its individual life insuranceoperations, and facilitated integration with otherapplications including image processing andautomated workflow.
In working closely with TIAA-CREF, as we dowith all of our clients, Fiserv has gained an in-depth understanding of the unique challengesand opportunities this major insurance providerfaces. For example, we continue to work hand-in-hand with TIAA-CREF to develop interfaces that improve efficiencies within andbetween its operating systems. With this insight,we are better prepared to apply our technologyresources in other ways that will benefit TIAA-CREF and its customers.
It’s quite a challenge for a large insurance organization to bring efficiencies and compatibility to its complex administrative and processing systems. But TIAA-CREF foundit was easier than imagined, thanks to Fiserv.

S EC U R I T I E S P R O F I L E
client profile: ARVEST ASSET MANAGEMENT, ROGERS, ARKANSAS
BE DIFFERENT

A RV E ST A S S E T M A N A G E M E N T is thriving in theInternet age through a decidedly old-fashionedidea: personal, local service. Not that Arvest, theinvestment subsidiary of Arvest Bank Group,Inc., isn’t committed to the future of onlinefinancial services. The company’s Web site offerssome of the most advanced services around,including real-time trading, research, access toafter-hours markets, daily tracking of a regionalstock index, even commentary from the vicechairman of a mutual fund company.
Arvest believes that its personal, local service ismaking the difference in gaining and keepingcustomers — whether the company is competingagainst the national discount online brokers, thebig wire houses or the regional firm down the street. Since it was founded in 1985 as ArvestInvestments, the company has emphasized
personal, local service. But the scope of its business has changed dramatically. Traditionally,Arvest had made its money by selling bonds andother bank-friendly investments. Arvest’s clientadvisers were primarily order takers, fulfillingrequests to buy municipal bonds and similarinvestments at banks in the company’s homestates of Arkansas, Missouri and Oklahoma. As a result, the company gained a reputation as a local discount brokerage.
Arvest decided to change things in 1997. Thebrokerage hired experienced client advisers towork in bank buildings in cities such as Rogers,Little Rock and Fort Smith, Arkansas;Oklahoma City, Shawnee and Tulsa, Oklahoma;and Joplin, Missouri. It also implemented specialized securities technology from Fiserv thatallowed it to differentiate its product delivery.
S EC U R I T I E S P R O F I L E
client profile: ARVEST ASSET MANAGEMENT, ROGERS, ARKANSAS
Seizing new opportunities for
business growth by quickly
adapting to market conditions.
ARVEST ASSET MANAGEMENT
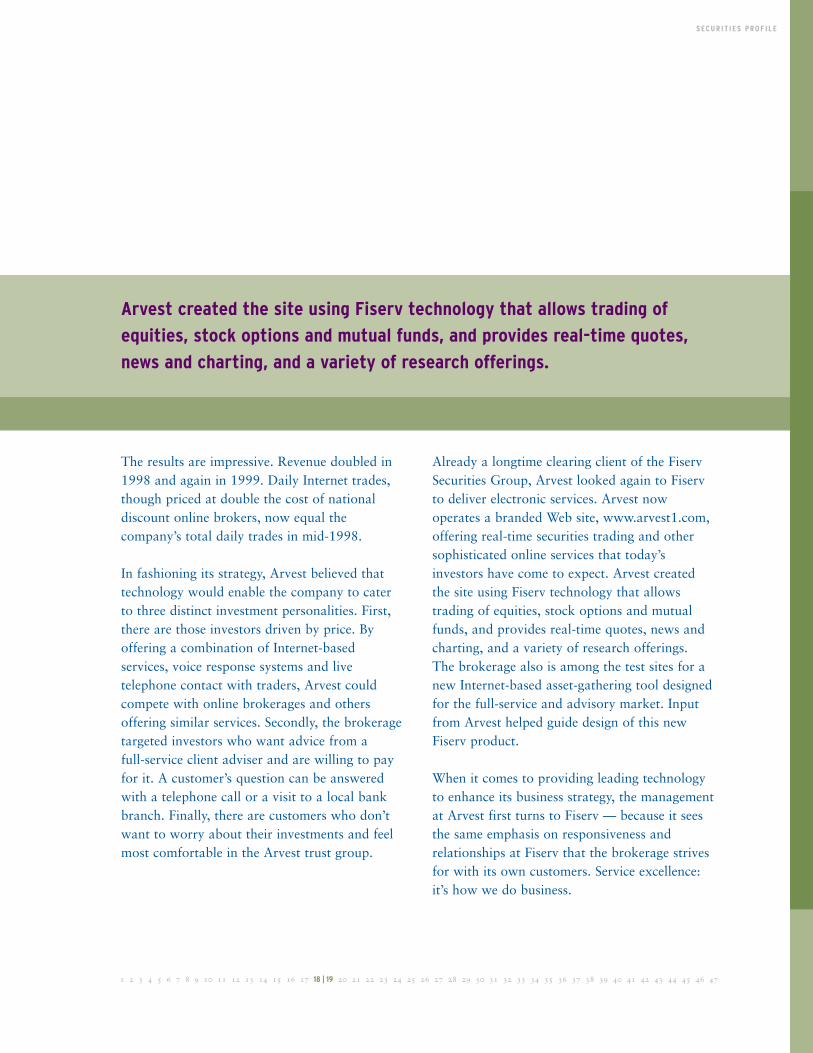
The results are impressive. Revenue doubled in1998 and again in 1999. Daily Internet trades,though priced at double the cost of national discount online brokers, now equal the company’s total daily trades in mid-1998.
In fashioning its strategy, Arvest believed thattechnology would enable the company to caterto three distinct investment personalities. First,there are those investors driven by price. Byoffering a combination of Internet-based services, voice response systems and live telephone contact with traders, Arvest couldcompete with online brokerages and othersoffering similar services. Secondly, the brokeragetargeted investors who want advice from a full-service client adviser and are willing to payfor it. A customer’s question can be answeredwith a telephone call or a visit to a local bankbranch. Finally, there are customers who don’twant to worry about their investments and feelmost comfortable in the Arvest trust group.
Already a longtime clearing client of the FiservSecurities Group, Arvest looked again to Fiservto deliver electronic services. Arvest now operates a branded Web site, www.arvest1.com,offering real-time securities trading and othersophisticated online services that today’sinvestors have come to expect. Arvest createdthe site using Fiserv technology that allows trading of equities, stock options and mutualfunds, and provides real-time quotes, news andcharting, and a variety of research offerings. The brokerage also is among the test sites for anew Internet-based asset-gathering tool designedfor the full-service and advisory market. Inputfrom Arvest helped guide design of this newFiserv product.
When it comes to providing leading technologyto enhance its business strategy, the managementat Arvest first turns to Fiserv — because it sees the same emphasis on responsiveness and relationships at Fiserv that the brokerage strivesfor with its own customers. Service excellence:it’s how we do business.
S EC U R I T I E S P R O F I L E
1 2 3 4 5 6 7 8 9 10 11 12 13 14 15 16 17 18 | 19 20 21 22 23 24 25 26 27 28 29 30 31 32 33 34 35 36 37 38 39 40 41 42 43 44 45 46 47
Arvest created the site using Fiserv technology that allows trading of
equities, stock options and mutual funds, and provides real-time quotes,
news and charting, and a variety of research offerings.

T R U S T S E R V I C E S P R O F I L E
client profile: A X A F I N A N C I A L , I N C . , PA R I S , F R A N C E
THE RIGHT TOOLS
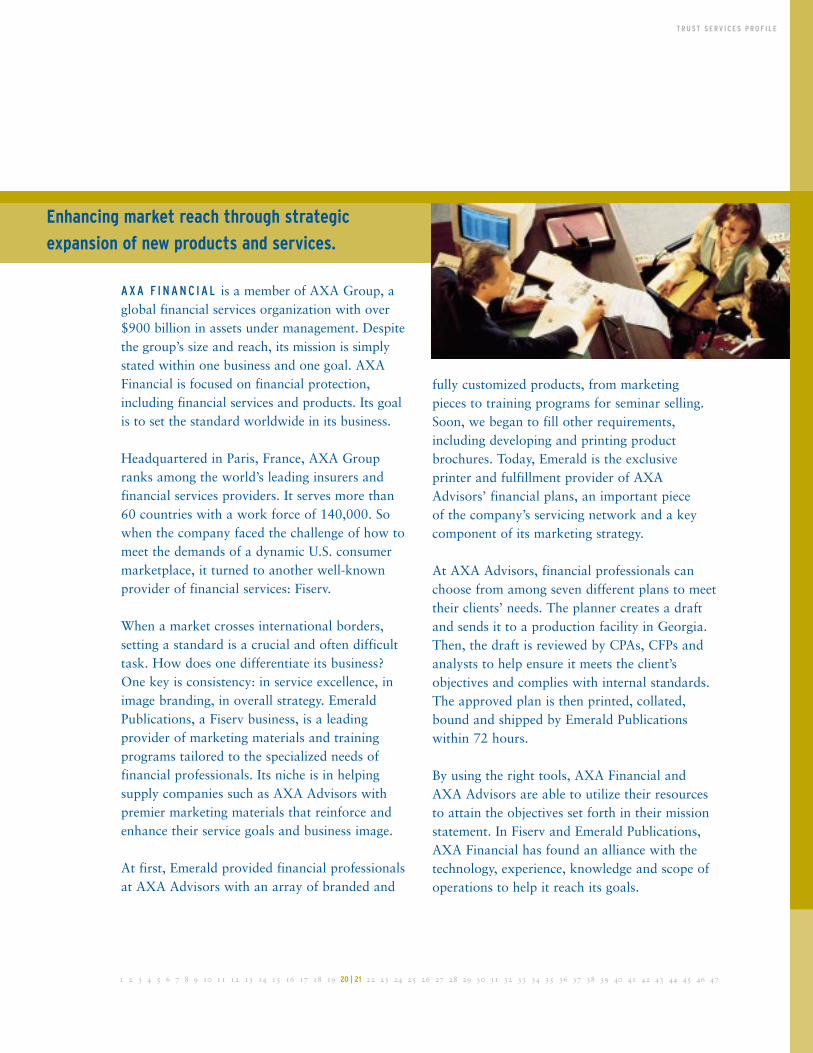
A X A F I N A N C I A L is a member of AXA Group, aglobal financial services organization with over$900 billion in assets under management. Despitethe group’s size and reach, its mission is simplystated within one business and one goal. AXAFinancial is focused on financial protection,including financial services and products. Its goalis to set the standard worldwide in its business.
Headquartered in Paris, France, AXA Groupranks among the world’s leading insurers andfinancial services providers. It serves more than60 countries with a work force of 140,000. Sowhen the company faced the challenge of how tomeet the demands of a dynamic U.S. consumermarketplace, it turned to another well-knownprovider of financial services: Fiserv.
When a market crosses international borders,setting a standard is a crucial and often difficulttask. How does one differentiate its business?One key is consistency: in service excellence, inimage branding, in overall strategy. EmeraldPublications, a Fiserv business, is a leadingprovider of marketing materials and trainingprograms tailored to the specialized needs offinancial professionals. Its niche is in helpingsupply companies such as AXA Advisors withpremier marketing materials that reinforce andenhance their service goals and business image.
At first, Emerald provided financial professionalsat AXA Advisors with an array of branded and
fully customized products, from marketingpieces to training programs for seminar selling.Soon, we began to fill other requirements,including developing and printing productbrochures. Today, Emerald is the exclusive printer and fulfillment provider of AXAAdvisors’ financial plans, an important piece of the company’s servicing network and a keycomponent of its marketing strategy.
At AXA Advisors, financial professionals canchoose from among seven different plans to meettheir clients’ needs. The planner creates a draftand sends it to a production facility in Georgia.Then, the draft is reviewed by CPAs, CFPs andanalysts to help ensure it meets the client’s objectives and complies with internal standards.The approved plan is then printed, collated,bound and shipped by Emerald Publicationswithin 72 hours.
By using the right tools, AXA Financial andAXA Advisors are able to utilize their resourcesto attain the objectives set forth in their missionstatement. In Fiserv and Emerald Publications,AXA Financial has found an alliance with thetechnology, experience, knowledge and scope ofoperations to help it reach its goals.
T R U S T S E R V I C E S P R O F I L E
1 2 3 4 5 6 7 8 9 10 11 12 13 14 15 16 17 18 19 20 | 21 22 23 24 25 26 27 28 29 30 31 32 33 34 35 36 37 38 39 40 41 42 43 44 45 46 47
Enhancing market reach through strategic
expansion of new products and services.
TO DAY ’S F I N A N C I A L S E RV I C E S P R OV I D E R S are feeling the pressure from consumers for new products, new services and new delivery channels. The competitive landscape is expanding, as moreand more non-traditional providers move into the financial industry. At the same time, ongoing consolidation among financial services providers continues to influence the market. Underlying allthese factors is the emerging trend toward the virtual financial institution, as online services and theInternet drive the industry toward anywhere, anytime, anyway financial services.
The result is a dynamic business environment, bolstered by an accelerating demand for informationtechnology and related services. In a highly specialized world that changes almost daily, financial services providers are quickly accepting that by outsourcing their technology requirements they gainan edge in the market. In order to use resources effectively and efficiently, financial institutions are entrusting technology to those who know it best and focusing on their own core business activities.
When it comes to information technology, Fiserv is the leading provider of choice for today’s financialindustry. We have a proven reputation for meeting the unique requirements of financial servicesproviders, and years of experience in helping our clients achieve their business goals. Our strategy is toprovide advanced information technology services that open the doors of opportunity for our clients,our employees and our shareholders. It’s simple, focused and successful.
C O N C LU S I O N
1 2 3 4 5 6 7 8 9 10 11 12 13 14 15 16 17 18 19 20 21 22 | 23 24 25 26 27 28 29 30 31 32 33 34 35 36 37 38 39 40 41 42 43 44 45 46 47
I N C O N C LU S I O N
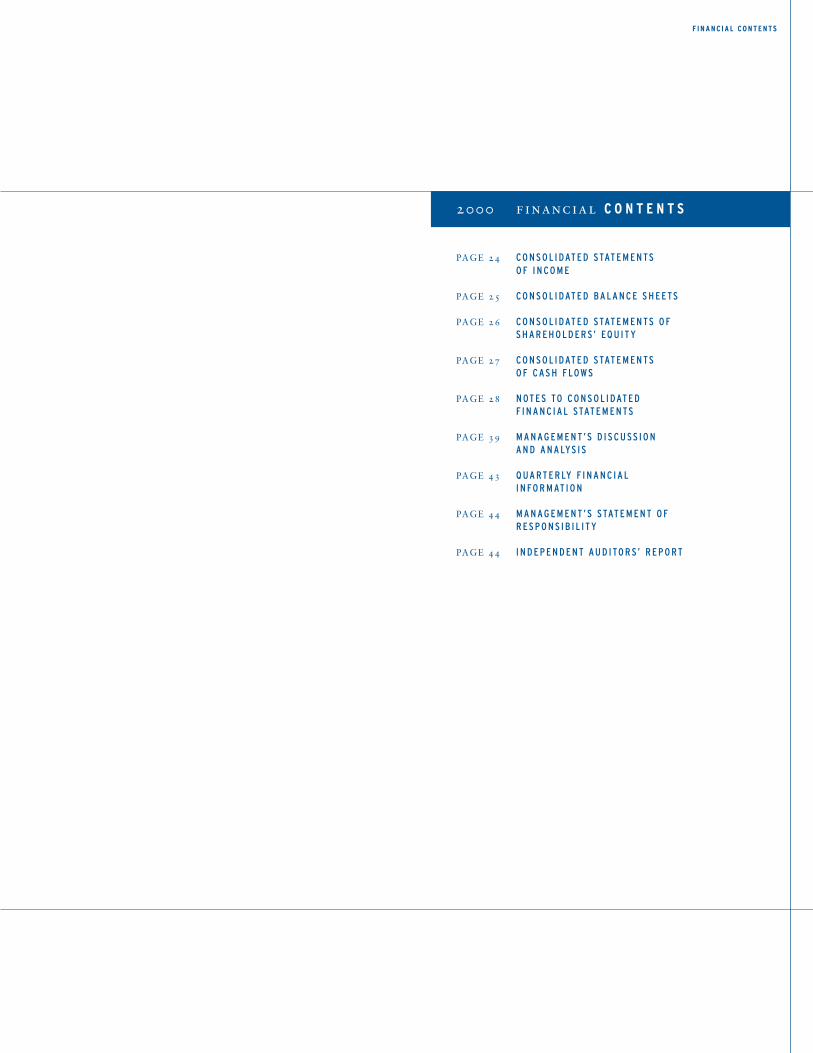
PAGE 24 CO N S O L I DAT E D STAT E M E N TS O F I N CO M E
PAGE 25 CO N S O L I DAT E D BA L A N C E S H E E TS
PAGE 26 CO N S O L I DAT E D STAT E M E N TS O F S H A R E H O L D E R S’ EQ U I T Y
PAGE 27 CO N S O L I DAT E D STAT E M E N TS O F C A S H F LOW S
PAGE 28 N OT E S TO CO N S O L I DAT E D F I N A N C I A L STAT E M E N TS
PAGE 39 M A N A G E M E N T ’S D I S C U S S I O N A N D A N A LYS I S
PAGE 43 Q UA RT E R LY F I N A N C I A LI N FO R M AT I O N
PAGE 44 M A N A G E M E N T ’S STAT E M E N T O F R E S P O N S I B I L I T Y
PAGE 44 I N D E P E N D E N T AU D I TO R S’ R E P O RT
2000 financial C O N T E N T S
F I N A N C I A L C O N T E N T S
F I S E R V, I N C . & S U B S I D I A R I E S
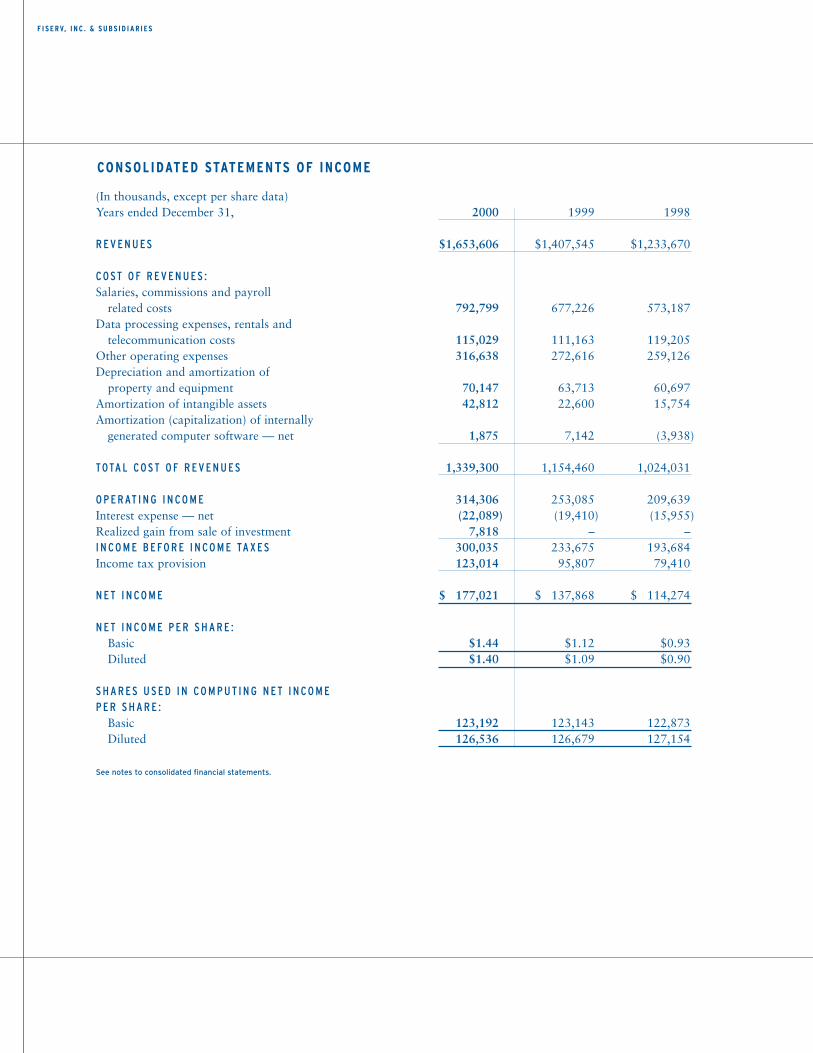
CONSOLIDATED STATEMENTS OF INCOME
(In thousands, except per share data)Years ended December 31, 2000 1999 1998
R E V E N U E S $1,653,606 $1,407,545 $1,233,670
CO ST O F R E V E N U E S :Salaries, commissions and payroll
related costs 792,799 677,226 573,187Data processing expenses, rentals and
telecommunication costs 115,029 111,163 119,205Other operating expenses 316,638 272,616 259,126Depreciation and amortization of
property and equipment 70,147 63,713 60,697Amortization of intangible assets 42,812 22,600 15,754Amortization (capitalization) of internally
generated computer software — net 1,875 7,142 (3,938)
TOTA L CO ST O F R E V E N U E S 1,339,300 1,154,460 1,024,031
O P E R AT I N G I N CO M E 314,306 253,085 209,639Interest expense — net (22,089) (19,410) (15,955)Realized gain from sale of investment 7,818 – –I N CO M E B E FO R E I N CO M E TA X E S 300,035 233,675 193,684Income tax provision 123,014 95,807 79,410
N E T I N CO M E $ 177,021 $ 137,868 $ 114,274
N E T I N CO M E P E R S H A R E :Basic $1.44 $1.12 $0.93 Diluted $1.40 $1.09 $0.90
S H A R E S U S E D I N CO M P U T I N G N E T I N CO M EP E R S H A R E :
Basic 123,192 123,143 122,873Diluted 126,536 126,679 127,154
See notes to consolidated financial statements.
1 2 3 4 5 6 7 8 9 10 11 12 13 14 15 16 17 18 19 20 21 22 23 24 | 25 26 27 28 29 30 31 32 33 34 35 36 37 38 39 40 41 42 43 44 45 46 47
F I S E R V, I N C . & S U B S I D I A R I E S
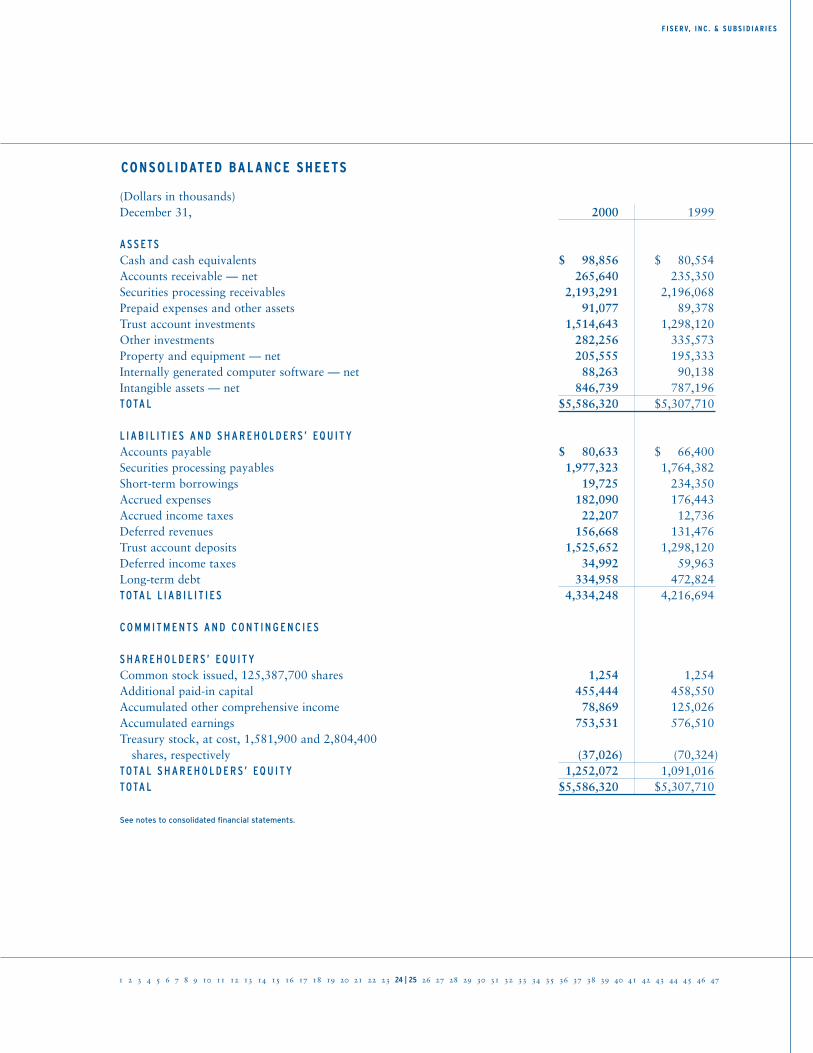
CONSOLIDATED BALANCE SHEETS
(Dollars in thousands)December 31, 2000 1999
A S S E TSCash and cash equivalents $ 98,856 $ 80,554Accounts receivable — net 265,640 235,350Securities processing receivables 2,193,291 2,196,068Prepaid expenses and other assets 91,077 89,378Trust account investments 1,514,643 1,298,120Other investments 282,256 335,573Property and equipment — net 205,555 195,333Internally generated computer software — net 88,263 90,138Intangible assets — net 846,739 787,196TOTA L $5,586,320 $5,307,710
L I A B I L I T I E S A N D S H A R E H O L D E R S’ EQ U I T YAccounts payable $ 80,633 $ 66,400Securities processing payables 1,977,323 1,764,382Short-term borrowings 19,725 234,350Accrued expenses 182,090 176,443Accrued income taxes 22,207 12,736Deferred revenues 156,668 131,476Trust account deposits 1,525,652 1,298,120Deferred income taxes 34,992 59,963Long-term debt 334,958 472,824TOTA L L I A B I L I T I E S 4,334,248 4,216,694
CO M M I T M E N TS A N D CO N T I N G E N C I E S
S H A R E H O L D E R S’ EQ U I T YCommon stock issued, 125,387,700 shares 1,254 1,254Additional paid-in capital 455,444 458,550Accumulated other comprehensive income 78,869 125,026Accumulated earnings 753,531 576,510Treasury stock, at cost, 1,581,900 and 2,804,400
shares, respectively (37,026) (70,324)TOTA L S H A R E H O L D E R S’ EQ U I T Y 1,252,072 1,091,016TOTA L $5,586,320 $5,307,710
See notes to consolidated financial statements.
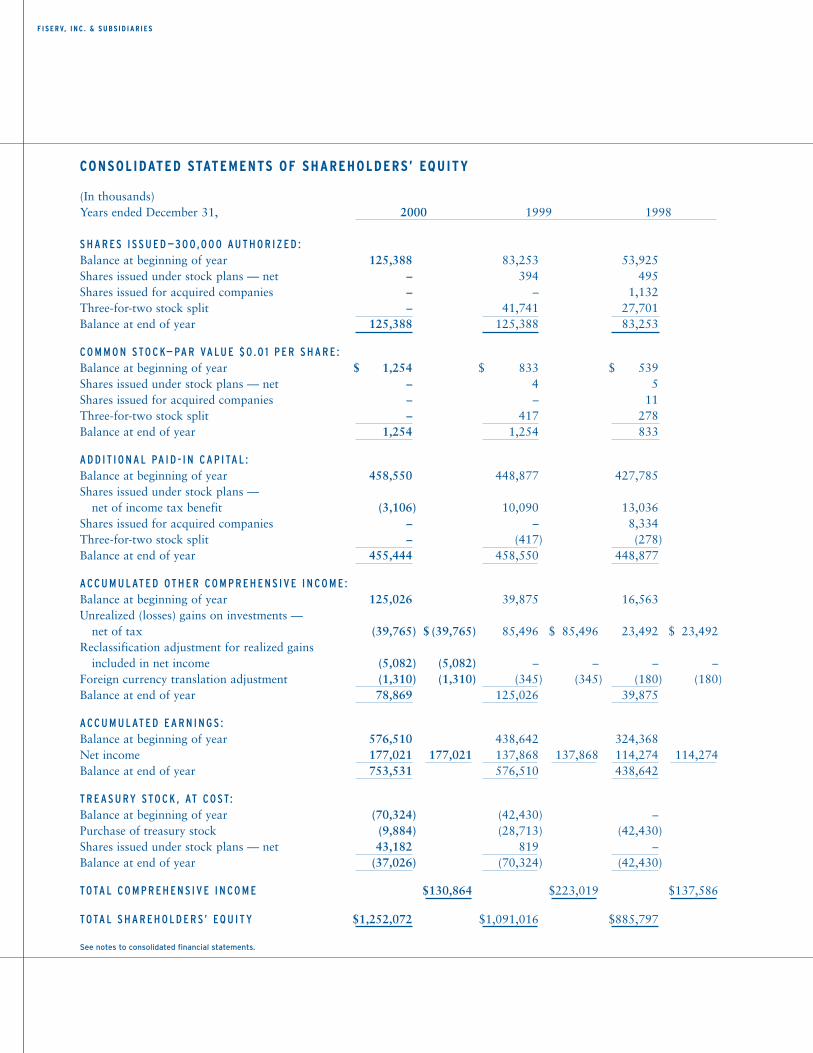
(In thousands)Years ended December 31, 2000 1999 1998
S H A R E S I S S U E D —3 0 0,0 0 0 AU T H O R I Z E D :Balance at beginning of year 125,388 83,253 53,925Shares issued under stock plans — net – 394 495Shares issued for acquired companies – – 1,132Three-for-two stock split – 41,741 27,701Balance at end of year 125,388 125,388 83,253
CO M M O N STO C K— PA R VA LU E $ 0 .0 1 P E R S H A R E :Balance at beginning of year $ 1,254 $ 833 $ 539Shares issued under stock plans — net – 4 5Shares issued for acquired companies – – 11Three-for-two stock split – 417 278Balance at end of year 1,254 1,254 833
A D D I T I O N A L PA I D - I N C A P I TA L :Balance at beginning of year 458,550 448,877 427,785Shares issued under stock plans —
net of income tax benefit (3,106) 10,090 13,036Shares issued for acquired companies – – 8,334Three-for-two stock split – (417) (278)Balance at end of year 455,444 458,550 448,877
A CC U M U L AT E D OT H E R CO M P R E H E N S I V E I N CO M E :Balance at beginning of year 125,026 39,875 16,563Unrealized (losses) gains on investments —
net of tax (39,765) $ (39,765) 85,496 $085,496 23,492 $023,492Reclassification adjustment for realized gains
included in net income (5,082) (5,082) – – – –Foreign currency translation adjustment (1,310) (1,310) (345) (345) (180) (180)Balance at end of year 78,869 125,026 39,875
A CC U M U L AT E D E A R N I N G S :Balance at beginning of year 576,510 438,642 324,368Net income 177,021 177,021 137,868 137,868 114,274 114,274Balance at end of year 753,531 576,510 438,642
T R E A S U RY STO C K , AT CO ST:Balance at beginning of year (70,324) (42,430) –Purchase of treasury stock (9,884) (28,713) (42,430)Shares issued under stock plans — net 43,182 819 –Balance at end of year (37,026) (70,324) (42,430)
TOTA L CO M P R E H E N S I V E I N CO M E $130,864 $223,019 $137,586
TOTA L S H A R E H O L D E R S’ EQ U I T Y $1,252,072 $1,091,016 $885,797
See notes to consolidated financial statements.
F I S E R V, I N C . & S U B S I D I A R I E S
CONSOLIDATED STATEMENTS OF SHAREHOLDERS’ EQUITY
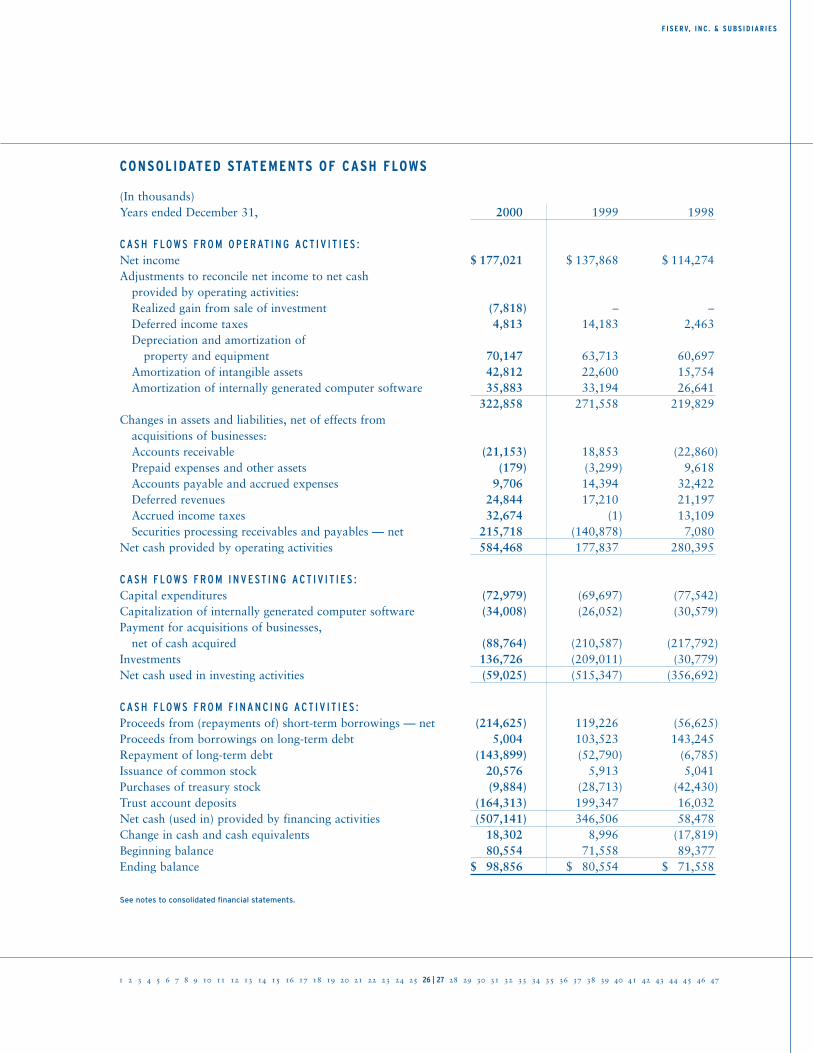
CONSOLIDATED STATEMENTS OF CASH FLOWS
1 2 3 4 5 6 7 8 9 10 11 12 13 14 15 16 17 18 19 20 21 22 23 24 25 26 | 27 28 29 30 31 32 33 34 35 36 37 38 39 40 41 42 43 44 45 46 47
(In thousands)Years ended December 31, 2000 1999 1998
C A S H F LOW S F R O M O P E R AT I N G A C T I V I T I E S :Net income $ 177,021 $ 137,868 $ 114,274Adjustments to reconcile net income to net cash
provided by operating activities:Realized gain from sale of investment (7,818) – –Deferred income taxes 4,813 14,183 2,463Depreciation and amortization of
property and equipment 70,147 63,713 60,697Amortization of intangible assets 42,812 22,600 15,754Amortization of internally generated computer software 35,883 33,194 26,641
322,858 271,558 219,829Changes in assets and liabilities, net of effects from
acquisitions of businesses:Accounts receivable (21,153) 18,853 (22,860)Prepaid expenses and other assets (179) (3,299) 9,618Accounts payable and accrued expenses 9,706 14,394 32,422Deferred revenues 24,844 17,210 21,197Accrued income taxes 32,674 (1) 13,109Securities processing receivables and payables — net 215,718 (140,878) 7,080
Net cash provided by operating activities 584,468 177,837 280,395
C A S H F LOW S F R O M I N V E ST I N G A C T I V I T I E S :Capital expenditures (72,979) (69,697) (77,542)Capitalization of internally generated computer software (34,008) (26,052) (30,579)Payment for acquisitions of businesses,
net of cash acquired (88,764) (210,587) (217,792)Investments 136,726 (209,011) (30,779)Net cash used in investing activities (59,025) (515,347) (356,692)
C A S H F LOW S F R O M F I N A N C I N G A C T I V I T I E S :Proceeds from (repayments of) short-term borrowings — net (214,625) 119,226 (56,625)Proceeds from borrowings on long-term debt 5,004 103,523 143,245Repayment of long-term debt (143,899) (52,790) (6,785)Issuance of common stock 20,576 5,913 5,041Purchases of treasury stock (9,884) (28,713) (42,430)Trust account deposits (164,313) 199,347 16,032Net cash (used in) provided by financing activities (507,141) 346,506 58,478Change in cash and cash equivalents 18,302 8,996 (17,819)Beginning balance 80,554 71,558 89,377Ending balance $ 98,856 $ 80,554 $ 71,558
See notes to consolidated financial statements.
F I S E R V, I N C . & S U B S I D I A R I E S
F I S E R V, I N C . & S U B S I D I A R I E S
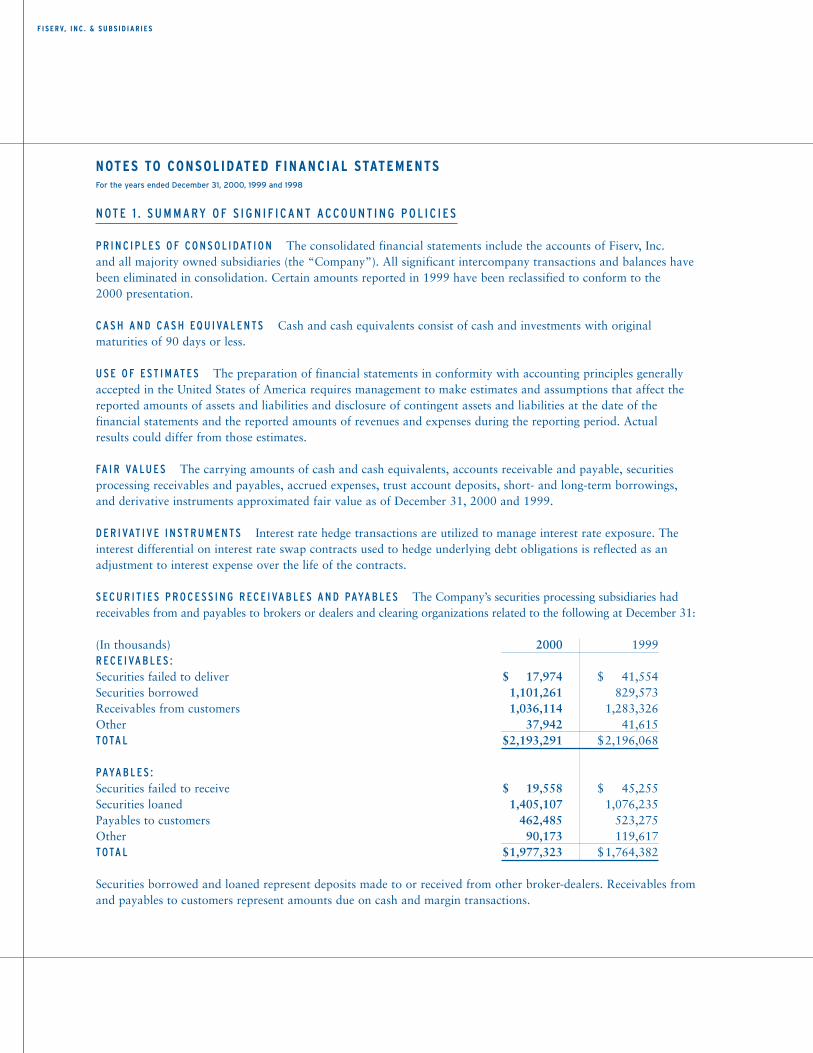
N OT E 1 . S U M M A RY O F S I G N I F I C A N T A CCO U N T I N G P O L I C I E S
P R I N C I P L E S O F CO N S O L I DAT I O N The consolidated financial statements include the accounts of Fiserv, Inc. and all majority owned subsidiaries (the “Company”). All significant intercompany transactions and balances havebeen eliminated in consolidation. Certain amounts reported in 1999 have been reclassified to conform to the 2000 presentation.
C A S H A N D C A S H EQ U I VA L E N TS Cash and cash equivalents consist of cash and investments with original maturities of 90 days or less.
U S E O F E ST I M AT E S The preparation of financial statements in conformity with accounting principles generallyaccepted in the United States of America requires management to make estimates and assumptions that affect thereported amounts of assets and liabilities and disclosure of contingent assets and liabilities at the date of the financial statements and the reported amounts of revenues and expenses during the reporting period. Actual results could differ from those estimates.
FA I R VA LU E S The carrying amounts of cash and cash equivalents, accounts receivable and payable, securities processing receivables and payables, accrued expenses, trust account deposits, short- and long-term borrowings, and derivative instruments approximated fair value as of December 31, 2000 and 1999.
D E R I VAT I V E I N ST R U M E N TS Interest rate hedge transactions are utilized to manage interest rate exposure. Theinterest differential on interest rate swap contracts used to hedge underlying debt obligations is reflected as anadjustment to interest expense over the life of the contracts.
S EC U R I T I E S P R O C E S S I N G R EC E I VA B L E S A N D PAYA B L E S The Company’s securities processing subsidiaries hadreceivables from and payables to brokers or dealers and clearing organizations related to the following at December 31:
(In thousands) 2000 1999 R EC E I VA B L E S : Securities failed to deliver $ 17,974 $ 41,554Securities borrowed 1,101,261 829,573Receivables from customers 1,036,114 1,283,326Other 37,942 41,615TOTA L $2,193,291 $2,196,068
PAYA B L E S :Securities failed to receive $ 19,558 $ 45,255Securities loaned 1,405,107 1,076,235Payables to customers 462,485 523,275Other 90,173 119,617TOTA L $1,977,323 $1,764,382
Securities borrowed and loaned represent deposits made to or received from other broker-dealers. Receivables fromand payables to customers represent amounts due on cash and margin transactions.
NOTES TO CONSOLIDATED F INANCIAL STATEMENTSFor the years ended December 31, 2000, 1999 and 1998
1 2 3 4 5 6 7 8 9 10 11 12 13 14 15 16 17 18 19 20 21 22 23 24 25 26 27 28 | 29 30 31 32 33 34 35 36 37 38 39 40 41 42 43 44 45 46 47
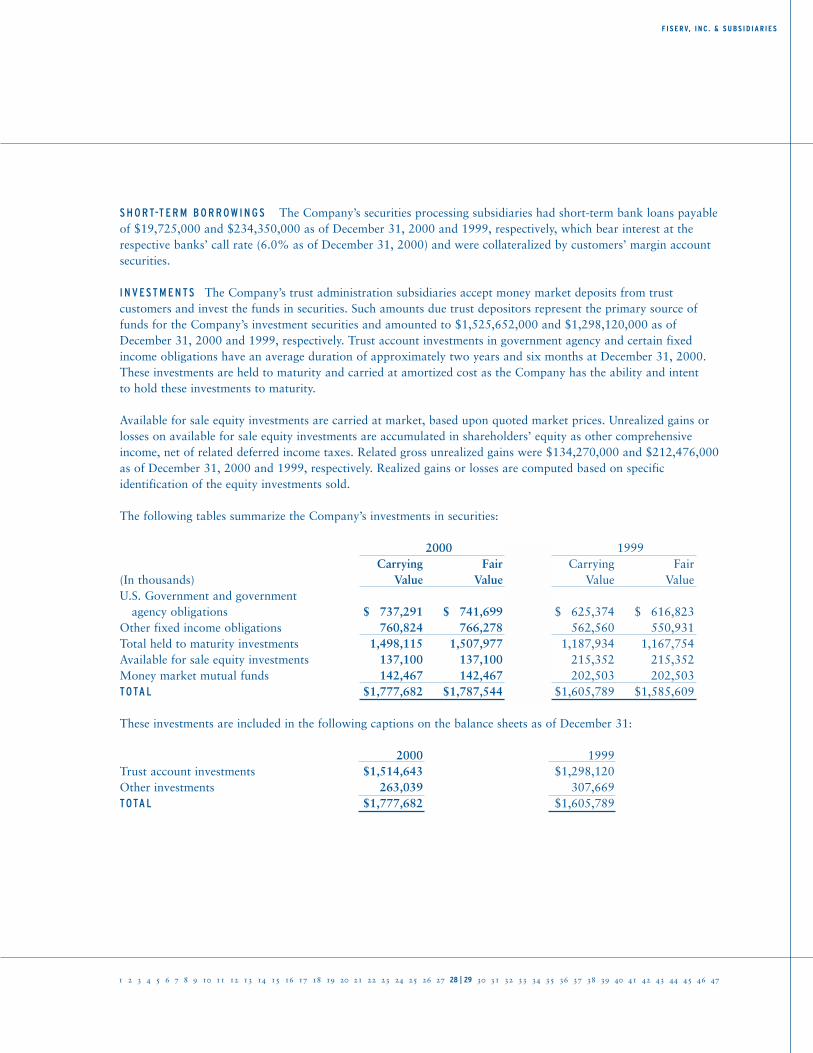
S H O RT-T E R M B O R R OW I N G S The Company’s securities processing subsidiaries had short-term bank loans payableof $19,725,000 and $234,350,000 as of December 31, 2000 and 1999, respectively, which bear interest at therespective banks’ call rate (6.0% as of December 31, 2000) and were collateralized by customers’ margin accountsecurities.
I N V E ST M E N TS The Company’s trust administration subsidiaries accept money market deposits from trust customers and invest the funds in securities. Such amounts due trust depositors represent the primary source offunds for the Company’s investment securities and amounted to $1,525,652,000 and $1,298,120,000 as ofDecember 31, 2000 and 1999, respectively. Trust account investments in government agency and certain fixedincome obligations have an average duration of approximately two years and six months at December 31, 2000.These investments are held to maturity and carried at amortized cost as the Company has the ability and intent to hold these investments to maturity.
Available for sale equity investments are carried at market, based upon quoted market prices. Unrealized gains orlosses on available for sale equity investments are accumulated in shareholders’ equity as other comprehensiveincome, net of related deferred income taxes. Related gross unrealized gains were $134,270,000 and $212,476,000as of December 31, 2000 and 1999, respectively. Realized gains or losses are computed based on specific identification of the equity investments sold.
The following tables summarize the Company’s investments in securities:
2000 1999Carrying Fair Carrying Fair
(In thousands) Value Value Value Value U.S. Government and government
agency obligations $0,737,291 $0,741,699 $0,625,374 $0,616,823Other fixed income obligations 760,824 766,278 562,560 550,931Total held to maturity investments 1,498,115 1,507,977 1,187,934 1,167,754Available for sale equity investments 137,100 137,100 215,352 215,352Money market mutual funds 142,467 142,467 202,503 202,503TOTA L $1,777,682 $1,787,544 $1,605,789 $1,585,609
These investments are included in the following captions on the balance sheets as of December 31:
2000 1999Trust account investments $1,514,643 $1,298,120Other investments 263,039 307,669TOTA L $1,777,682 $1,605,789
F I S E R V, I N C . & S U B S I D I A R I E S
F I S E R V, I N C . & S U B S I D I A R I E S
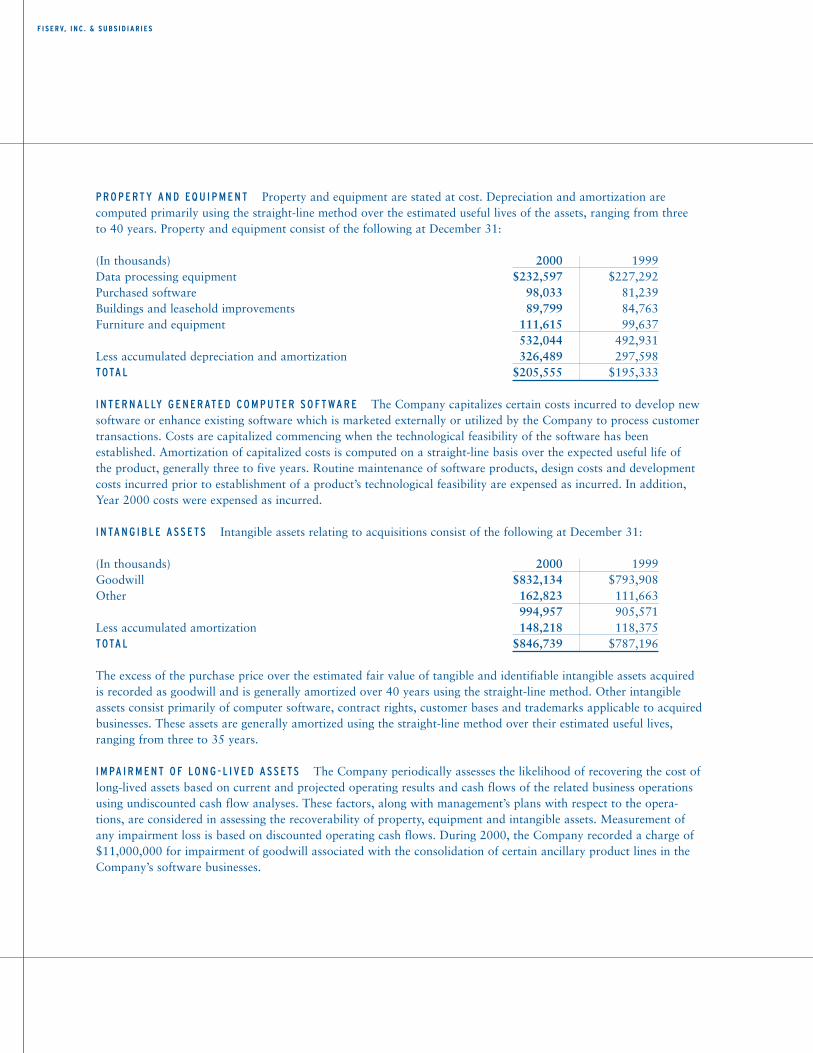
P R O P E RT Y A N D EQ U I P M E N T Property and equipment are stated at cost. Depreciation and amortization are computed primarily using the straight-line method over the estimated useful lives of the assets, ranging from threeto 40 years. Property and equipment consist of the following at December 31:
(In thousands) 2000 1999 Data processing equipment $232,597 $227,292 Purchased software 98,033 81,239 Buildings and leasehold improvements 89,799 84,763 Furniture and equipment 111,615 99,637
532,044 492,931 Less accumulated depreciation and amortization 326,489 297,598 TOTA L $205,555 $195,333
I N T E R N A L LY G E N E R AT E D CO M P U T E R S O F T WA R E The Company capitalizes certain costs incurred to develop newsoftware or enhance existing software which is marketed externally or utilized by the Company to process customertransactions. Costs are capitalized commencing when the technological feasibility of the software has been established. Amortization of capitalized costs is computed on a straight-line basis over the expected useful life of the product, generally three to five years. Routine maintenance of software products, design costs and developmentcosts incurred prior to establishment of a product’s technological feasibility are expensed as incurred. In addition,Year 2000 costs were expensed as incurred.
I N TA N G I B L E A S S E TS Intangible assets relating to acquisitions consist of the following at December 31:
(In thousands) 2000 1999 Goodwill $832,134 $793,908 Other 162,823 111,663
994,957 905,571 Less accumulated amortization 148,218 118,375 TOTA L $846,739 $787,196
The excess of the purchase price over the estimated fair value of tangible and identifiable intangible assets acquiredis recorded as goodwill and is generally amortized over 40 years using the straight-line method. Other intangibleassets consist primarily of computer software, contract rights, customer bases and trademarks applicable to acquiredbusinesses. These assets are generally amortized using the straight-line method over their estimated useful lives,ranging from three to 35 years.
I M PA I R M E N T O F LO N G - L I V E D A S S E TS The Company periodically assesses the likelihood of recovering the cost oflong-lived assets based on current and projected operating results and cash flows of the related business operationsusing undiscounted cash flow analyses. These factors, along with management’s plans with respect to the opera-tions, are considered in assessing the recoverability of property, equipment and intangible assets. Measurement ofany impairment loss is based on discounted operating cash flows. During 2000, the Company recorded a charge of$11,000,000 for impairment of goodwill associated with the consolidation of certain ancillary product lines in theCompany’s software businesses.
1 2 3 4 5 6 7 8 9 10 11 12 13 14 15 16 17 18 19 20 21 22 23 24 25 26 27 28 29 30 | 31 32 33 34 35 36 37 38 39 40 41 42 43 44 45 46 47
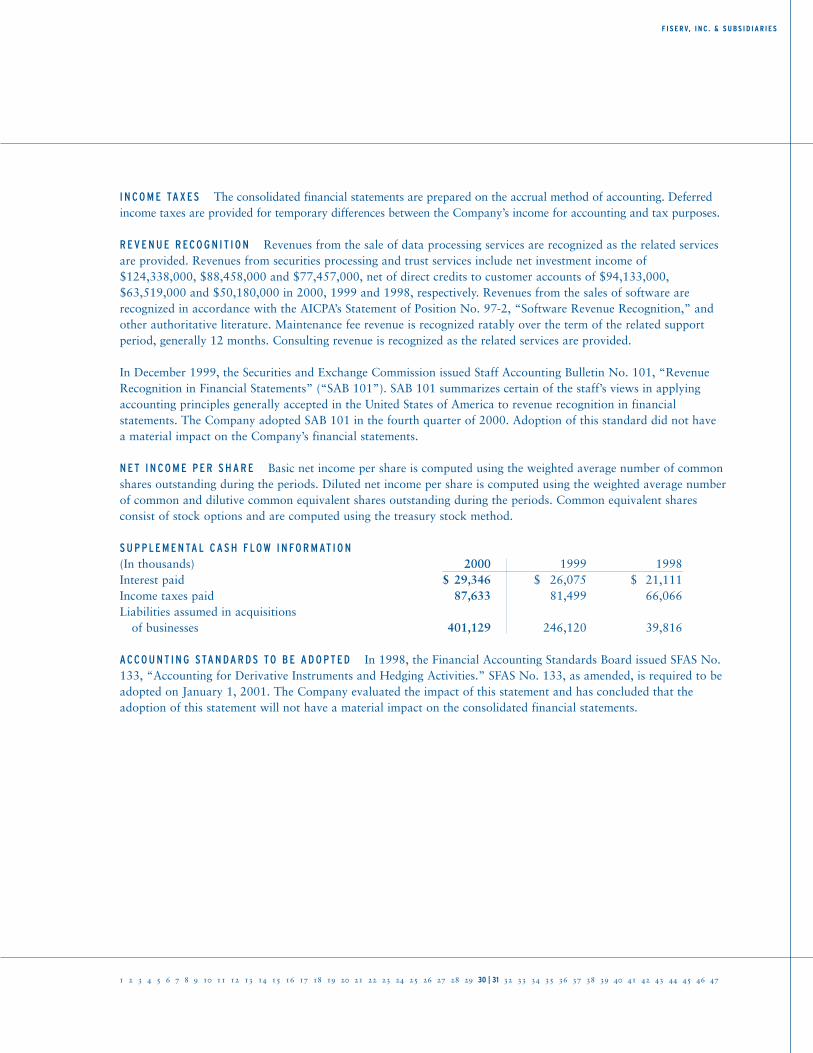
I N CO M E TA X E S The consolidated financial statements are prepared on the accrual method of accounting. Deferredincome taxes are provided for temporary differences between the Company’s income for accounting and tax purposes.
R E V E N U E R ECO G N I T I O N Revenues from the sale of data processing services are recognized as the related servicesare provided. Revenues from securities processing and trust services include net investment income of$124,338,000, $88,458,000 and $77,457,000, net of direct credits to customer accounts of $94,133,000,$63,519,000 and $50,180,000 in 2000, 1999 and 1998, respectively. Revenues from the sales of software are recognized in accordance with the AICPA’s Statement of Position No. 97-2, “Software Revenue Recognition,” andother authoritative literature. Maintenance fee revenue is recognized ratably over the term of the related supportperiod, generally 12 months. Consulting revenue is recognized as the related services are provided.
In December 1999, the Securities and Exchange Commission issued Staff Accounting Bulletin No. 101, “RevenueRecognition in Financial Statements” (“SAB 101”). SAB 101 summarizes certain of the staff’s views in applyingaccounting principles generally accepted in the United States of America to revenue recognition in financial statements. The Company adopted SAB 101 in the fourth quarter of 2000. Adoption of this standard did not have a material impact on the Company’s financial statements.
N E T I N CO M E P E R S H A R E Basic net income per share is computed using the weighted average number of commonshares outstanding during the periods. Diluted net income per share is computed using the weighted average numberof common and dilutive common equivalent shares outstanding during the periods. Common equivalent shares consist of stock options and are computed using the treasury stock method.
S U P P L E M E N TA L C A S H F LOW I N FO R M AT I O N (In thousands) 2000 1999 1998 Interest paid $ 29,346 $ 26,075 $ 21,111Income taxes paid 87,633 81,499 66,066Liabilities assumed in acquisitions
of businesses 401,129 246,120 39,816
A CCO U N T I N G STA N DA R D S TO B E A D O P T E D In 1998, the Financial Accounting Standards Board issued SFAS No.133, “Accounting for Derivative Instruments and Hedging Activities.” SFAS No. 133, as amended, is required to beadopted on January 1, 2001. The Company evaluated the impact of this statement and has concluded that theadoption of this statement will not have a material impact on the consolidated financial statements.
F I S E R V, I N C . & S U B S I D I A R I E S
F I S E R V, I N C . & S U B S I D I A R I E S
N OT E 2 . A CQ U I S I T I O N S
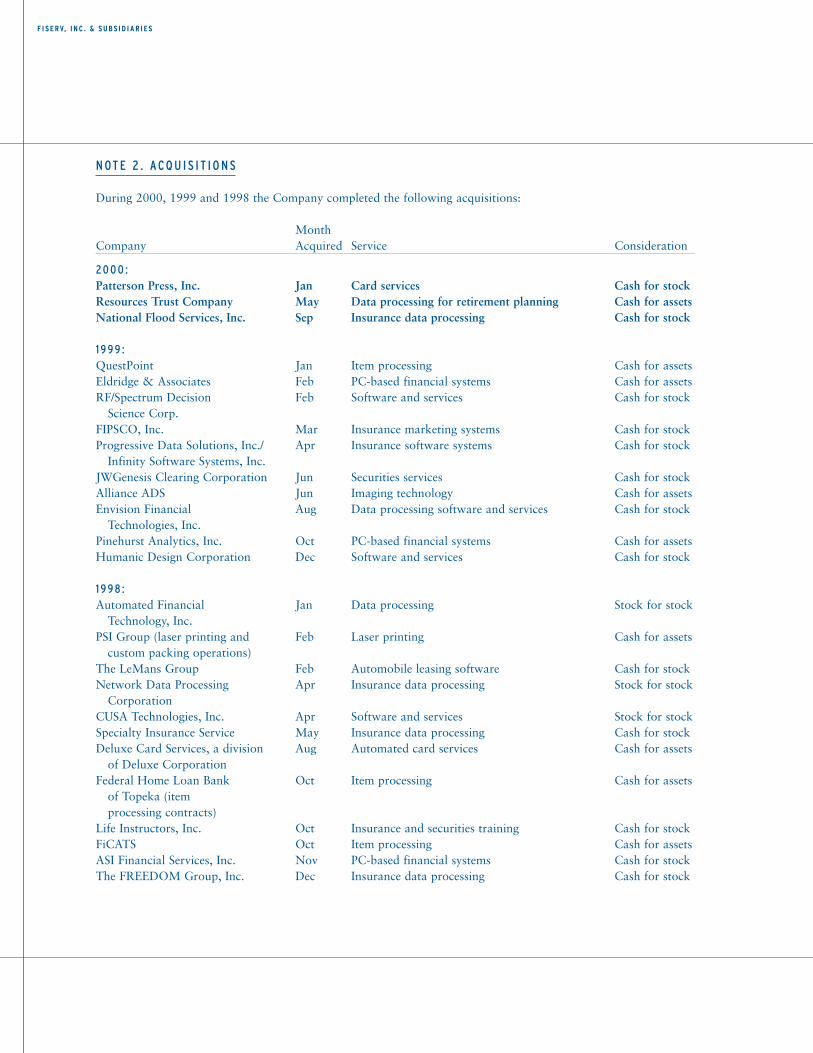
During 2000, 1999 and 1998 the Company completed the following acquisitions:
Month Company Acquired Service Consideration
2 0 0 0 : Patterson Press, Inc. Jan Card services Cash for stockResources Trust Company May Data processing for retirement planning Cash for assets National Flood Services, Inc. Sep Insurance data processing Cash for stock
1 9 9 9 : QuestPoint Jan Item processing Cash for assetsEldridge & Associates Feb PC-based financial systems Cash for assetsRF/Spectrum Decision Feb Software and services Cash for stock
Science Corp.FIPSCO, Inc. Mar Insurance marketing systems Cash for stockProgressive Data Solutions, Inc./ Apr Insurance software systems Cash for stock
Infinity Software Systems, Inc. JWGenesis Clearing Corporation Jun Securities services Cash for stockAlliance ADS Jun Imaging technology Cash for assetsEnvision Financial Aug Data processing software and services Cash for stock
Technologies, Inc.Pinehurst Analytics, Inc. Oct PC-based financial systems Cash for assetsHumanic Design Corporation Dec Software and services Cash for stock
1 9 9 8 : Automated Financial Jan Data processing Stock for stock
Technology, Inc.PSI Group (laser printing and Feb Laser printing Cash for assets
custom packing operations) The LeMans Group Feb Automobile leasing software Cash for stockNetwork Data Processing Apr Insurance data processing Stock for stock
CorporationCUSA Technologies, Inc. Apr Software and services Stock for stockSpecialty Insurance Service May Insurance data processing Cash for stockDeluxe Card Services, a division Aug Automated card services Cash for assets
of Deluxe Corporation Federal Home Loan Bank Oct Item processing Cash for assets
of Topeka (itemprocessing contracts)
Life Instructors, Inc. Oct Insurance and securities training Cash for stockFiCATS Oct Item processing Cash for assets ASI Financial Services, Inc. Nov PC-based financial systems Cash for stock The FREEDOM Group, Inc. Dec Insurance data processing Cash for stock
1 2 3 4 5 6 7 8 9 10 11 12 13 14 15 16 17 18 19 20 21 22 23 24 25 26 27 28 29 30 31 32 | 33 34 35 36 37 38 39 40 41 42 43 44 45 46 47
Generally, the acquisitions were accounted for as purchases and, accordingly, the operations of the acquired companies were included in the consolidated financial statements since their respective dates of acquisition as setforth above. Net cash paid in connection with these acquisitions was $88,764,000, $210,587,000, and$217,792,000 in 2000, 1999 and 1998, respectively, subject to certain adjustments. The Company does not anticipate any significant adjustments to the purchase price allocations. Pro forma information for acquisitionsaccounted for as purchases is not presented as the impact was not material.
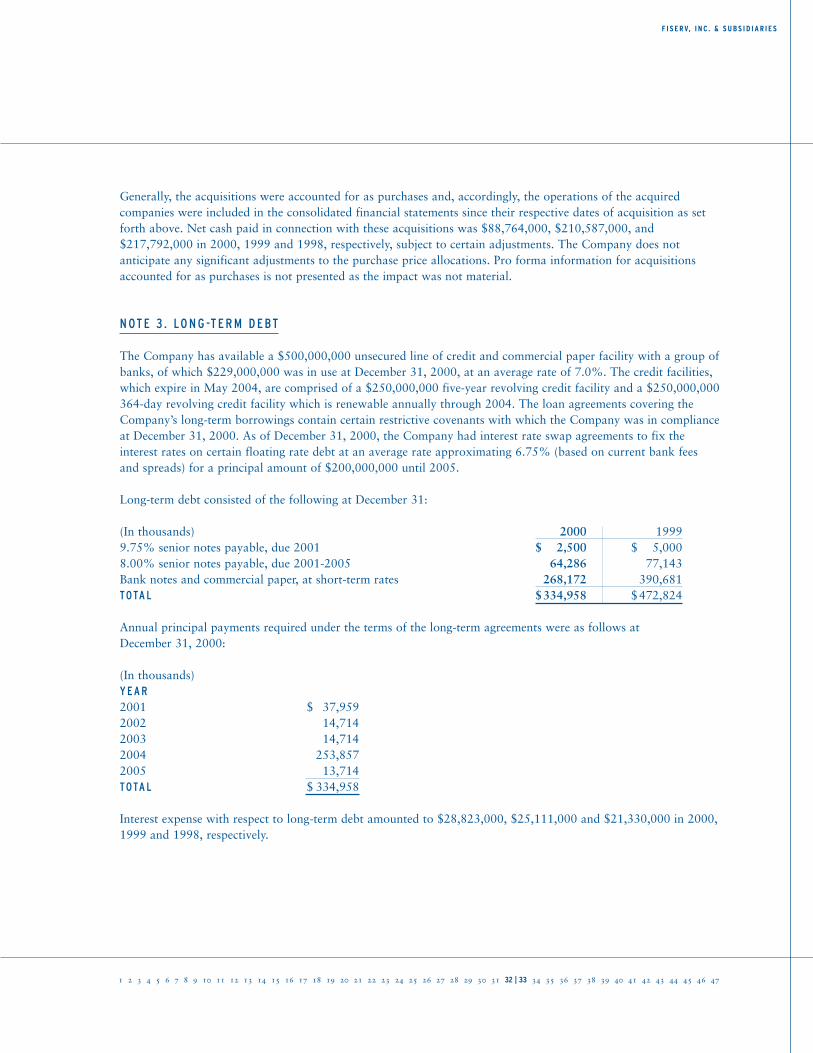
N OT E 3 . LO N G -T E R M D E BT
The Company has available a $500,000,000 unsecured line of credit and commercial paper facility with a group ofbanks, of which $229,000,000 was in use at December 31, 2000, at an average rate of 7.0%. The credit facilities,which expire in May 2004, are comprised of a $250,000,000 five-year revolving credit facility and a $250,000,000364-day revolving credit facility which is renewable annually through 2004. The loan agreements covering theCompany’s long-term borrowings contain certain restrictive covenants with which the Company was in complianceat December 31, 2000. As of December 31, 2000, the Company had interest rate swap agreements to fix the interest rates on certain floating rate debt at an average rate approximating 6.75% (based on current bank fees and spreads) for a principal amount of $200,000,000 until 2005.
Long-term debt consisted of the following at December 31:
(In thousands) 2000 1999 9.75% senior notes payable, due 2001 $ 2,500 $ 5,000 8.00% senior notes payable, due 2001-2005 64,286 77,143 Bank notes and commercial paper, at short-term rates 268,172 390,681 TOTA L $334,958 $472,824
Annual principal payments required under the terms of the long-term agreements were as follows at December 31, 2000:
(In thousands) Y E A R 2001 $ 37,9592002 14,7142003 14,7142004 253,8572005 13,714TOTA L $ 334,958
Interest expense with respect to long-term debt amounted to $28,823,000, $25,111,000 and $21,330,000 in 2000,1999 and 1998, respectively.
F I S E R V, I N C . & S U B S I D I A R I E S
F I S E R V, I N C . & S U B S I D I A R I E S
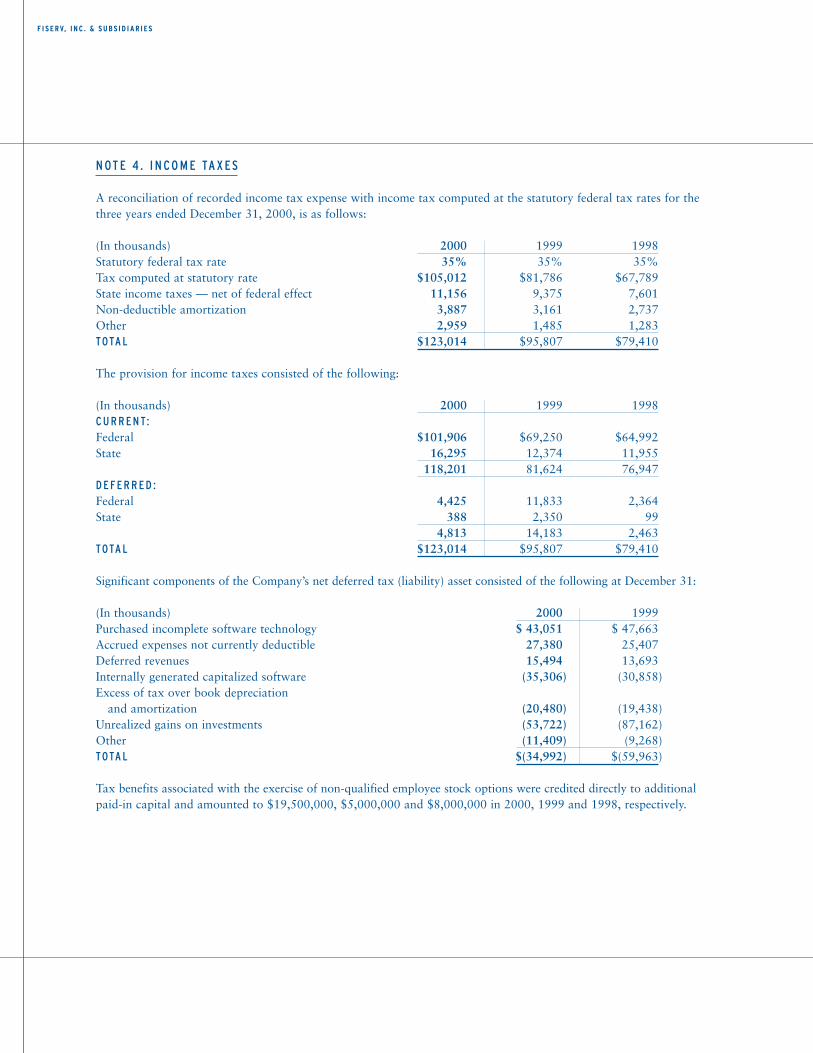
N OT E 4 . I N CO M E TA X E S
A reconciliation of recorded income tax expense with income tax computed at the statutory federal tax rates for thethree years ended December 31, 2000, is as follows:
(In thousands) 2000 1999 1998 Statutory federal tax rate 35% 35% 35% Tax computed at statutory rate $105,012 $81,786 $67,789 State income taxes — net of federal effect 11,156 9,375 7,601 Non-deductible amortization 3,887 3,161 2,737Other 2,959 1,485 1,283TOTA L $123,014 $95,807 $79,410
The provision for income taxes consisted of the following:
(In thousands) 2000 1999 1998 C U R R E N T:Federal $101,906 $69,250 $64,992State 16,295 12,374 11,955
118,201 81,624 76,947 D E F E R R E D :Federal 4,425 11,833 2,364State 388 2,350 99
4,813 14,183 2,463 TOTA L $123,014 $95,807 $79,410
Significant components of the Company’s net deferred tax (liability) asset consisted of the following at December 31:
(In thousands) 2000 1999 Purchased incomplete software technology $ 43,051 $ 47,663Accrued expenses not currently deductible 27,380 25,407Deferred revenues 15,494 13,693Internally generated capitalized software (35,306) (30,858) Excess of tax over book depreciation
and amortization (20,480) (19,438)Unrealized gains on investments (53,722) (87,162) Other (11,409) (9,268) TOTA L $(34,992) $(59,963)
Tax benefits associated with the exercise of non-qualified employee stock options were credited directly to additionalpaid-in capital and amounted to $19,500,000, $5,000,000 and $8,000,000 in 2000, 1999 and 1998, respectively.
1 2 3 4 5 6 7 8 9 10 11 12 13 14 15 16 17 18 19 20 21 22 23 24 25 26 27 28 29 30 31 32 33 34 | 35 36 37 38 39 40 41 42 43 44 45 46 47
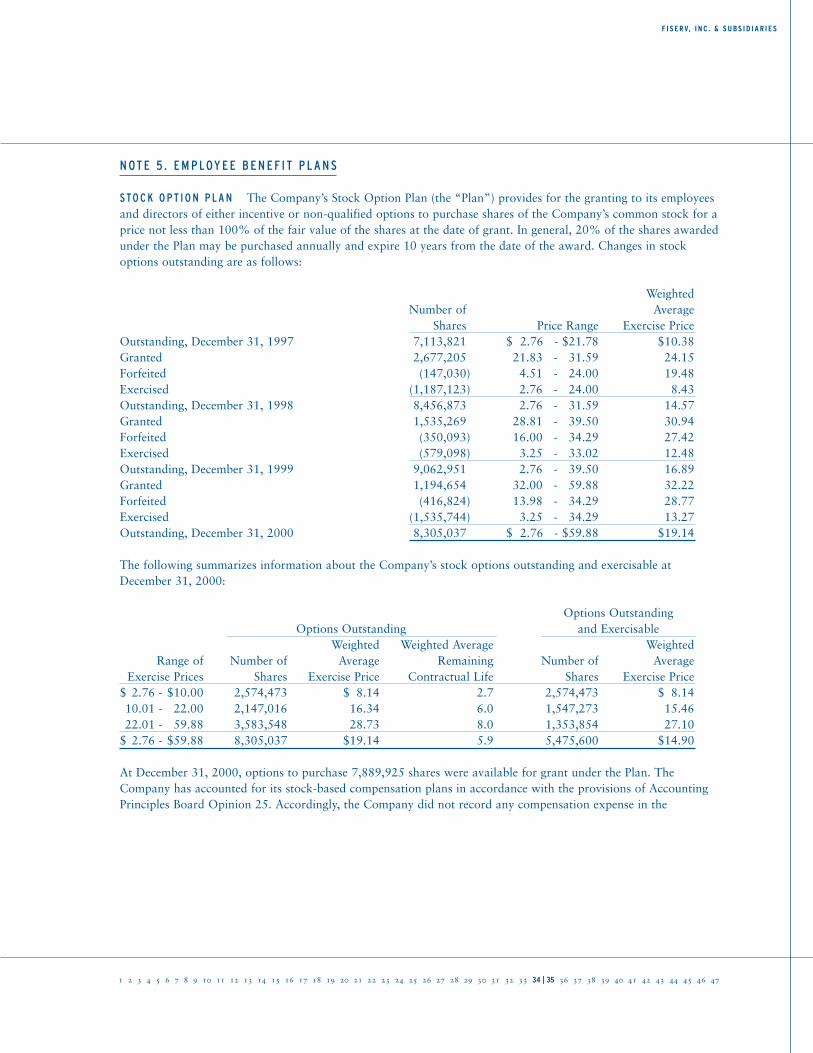
N OT E 5 . E M P LOY E E B E N E F I T P L A N S
STO C K O P T I O N P L A N The Company’s Stock Option Plan (the “Plan”) provides for the granting to its employeesand directors of either incentive or non-qualified options to purchase shares of the Company’s common stock for aprice not less than 100% of the fair value of the shares at the date of grant. In general, 20% of the shares awardedunder the Plan may be purchased annually and expire 10 years from the date of the award. Changes in stockoptions outstanding are as follows:
WeightedNumber of Average
Shares Price Range Exercise Price Outstanding, December 31, 1997 7,113,821 $ 2.76 - $21.78 $10.38 Granted 2,677,205 21.83 - 31.59 24.15 Forfeited (147,030) 4.51 - 24.00 19.48 Exercised (1,187,123) 2.76 - 24.00 8.43 Outstanding, December 31, 1998 8,456,873 2.76 - 31.59 14.57 Granted 1,535,269 28.81 - 39.50 30.94Forfeited (350,093) 16.00 - 34.29 27.42Exercised (579,098) 3.25 - 33.02 12.48Outstanding, December 31, 1999 9,062,951 2.76 - 39.50 16.89Granted 1,194,654 32.00 - 59.88 32.22Forfeited (416,824) 13.98 - 34.29 28.77Exercised (1,535,744) 3.25 - 34.29 13.27Outstanding, December 31, 2000 8,305,037 $ 2.76 - $59.88 $19.14
The following summarizes information about the Company’s stock options outstanding and exercisable atDecember 31, 2000:
Options OutstandingOptions Outstanding and Exercisable
Weighted Weighted Average Weighted Range of Number of Average Remaining Number of Average
Exercise Prices Shares Exercise Price Contractual Life Shares Exercise Price$ 2.76 - $10.00 2,574,473 $ 8.14 2.7 2,574,473 $ 8.14 10.01 - 22.00 2,147,016 16.34 6.0 1,547,273 15.46 22.01 - 59.88 3,583,548 28.73 8.0 1,353,854 27.10
$ 2.76 - $59.88 8,305,037 $19.14 5.9 5,475,600 $14.90
At December 31, 2000, options to purchase 7,889,925 shares were available for grant under the Plan. TheCompany has accounted for its stock-based compensation plans in accordance with the provisions of AccountingPrinciples Board Opinion 25. Accordingly, the Company did not record any compensation expense in the
F I S E R V, I N C . & S U B S I D I A R I E S
F I S E R V, I N C . & S U B S I D I A R I E S
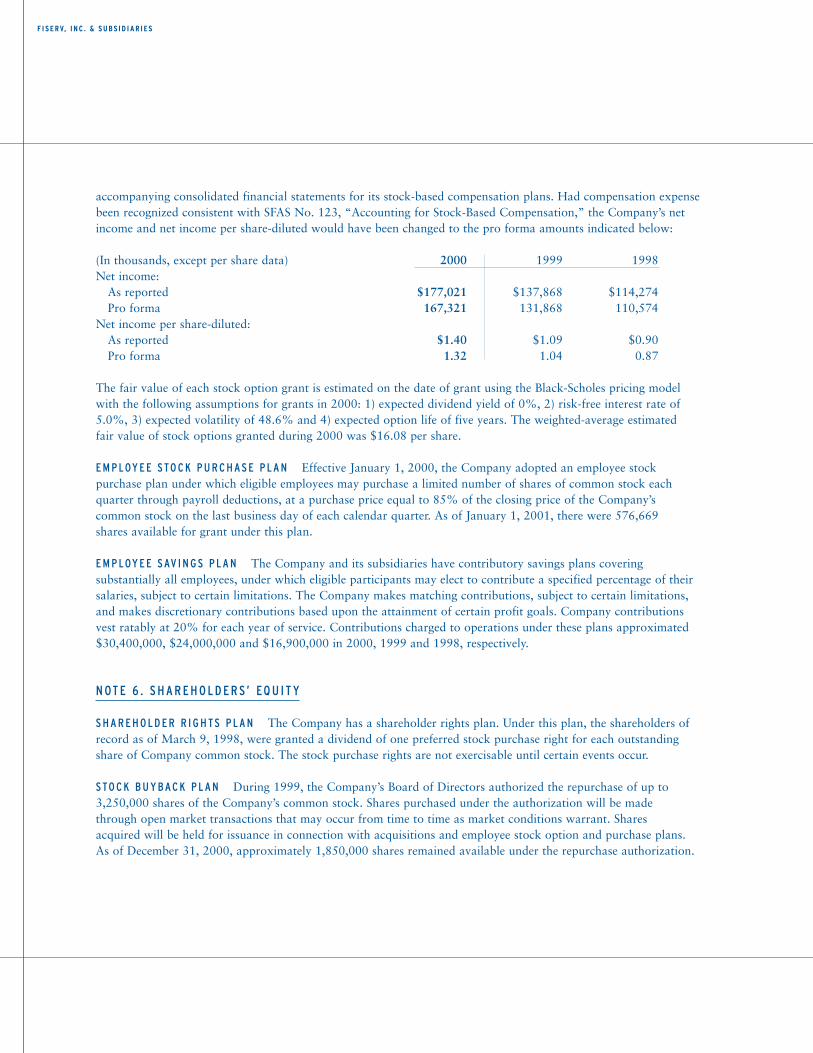
accompanying consolidated financial statements for its stock-based compensation plans. Had compensation expensebeen recognized consistent with SFAS No. 123, “Accounting for Stock-Based Compensation,” the Company’s netincome and net income per share-diluted would have been changed to the pro forma amounts indicated below:
(In thousands, except per share data) 2000 1999 1998 Net income:
As reported $177,021 $137,868 $114,274Pro forma 167,321 131,868 110,574
Net income per share-diluted:As reported $1.40 $1.09 $0.90Pro forma 1.32 1.04 0.87
The fair value of each stock option grant is estimated on the date of grant using the Black-Scholes pricing modelwith the following assumptions for grants in 2000: 1) expected dividend yield of 0%, 2) risk-free interest rate of5.0%, 3) expected volatility of 48.6% and 4) expected option life of five years. The weighted-average estimated fair value of stock options granted during 2000 was $16.08 per share.
E M P LOY E E STO C K P U R C H A S E P L A N Effective January 1, 2000, the Company adopted an employee stock purchase plan under which eligible employees may purchase a limited number of shares of common stock eachquarter through payroll deductions, at a purchase price equal to 85% of the closing price of the Company’s common stock on the last business day of each calendar quarter. As of January 1, 2001, there were 576,669 shares available for grant under this plan.
E M P LOY E E S AV I N G S P L A N The Company and its subsidiaries have contributory savings plans covering substantially all employees, under which eligible participants may elect to contribute a specified percentage of theirsalaries, subject to certain limitations. The Company makes matching contributions, subject to certain limitations,and makes discretionary contributions based upon the attainment of certain profit goals. Company contributionsvest ratably at 20% for each year of service. Contributions charged to operations under these plans approximated$30,400,000, $24,000,000 and $16,900,000 in 2000, 1999 and 1998, respectively.
N OT E 6 . S H A R E H O L D E R S’ EQ U I T Y
S H A R E H O L D E R R I G H TS P L A N The Company has a shareholder rights plan. Under this plan, the shareholders ofrecord as of March 9, 1998, were granted a dividend of one preferred stock purchase right for each outstandingshare of Company common stock. The stock purchase rights are not exercisable until certain events occur.
STO C K B U Y BA C K P L A N During 1999, the Company’s Board of Directors authorized the repurchase of up to3,250,000 shares of the Company’s common stock. Shares purchased under the authorization will be made through open market transactions that may occur from time to time as market conditions warrant. Shares acquired will be held for issuance in connection with acquisitions and employee stock option and purchase plans.As of December 31, 2000, approximately 1,850,000 shares remained available under the repurchase authorization.
1 2 3 4 5 6 7 8 9 10 11 12 13 14 15 16 17 18 19 20 21 22 23 24 25 26 27 28 29 30 31 32 33 34 35 36 | 37 38 39 40 41 42 43 44 45 46 47
N OT E 7. L E A S E S , OT H E R CO M M I T M E N TS A N D CO N T I N G E N C I E S
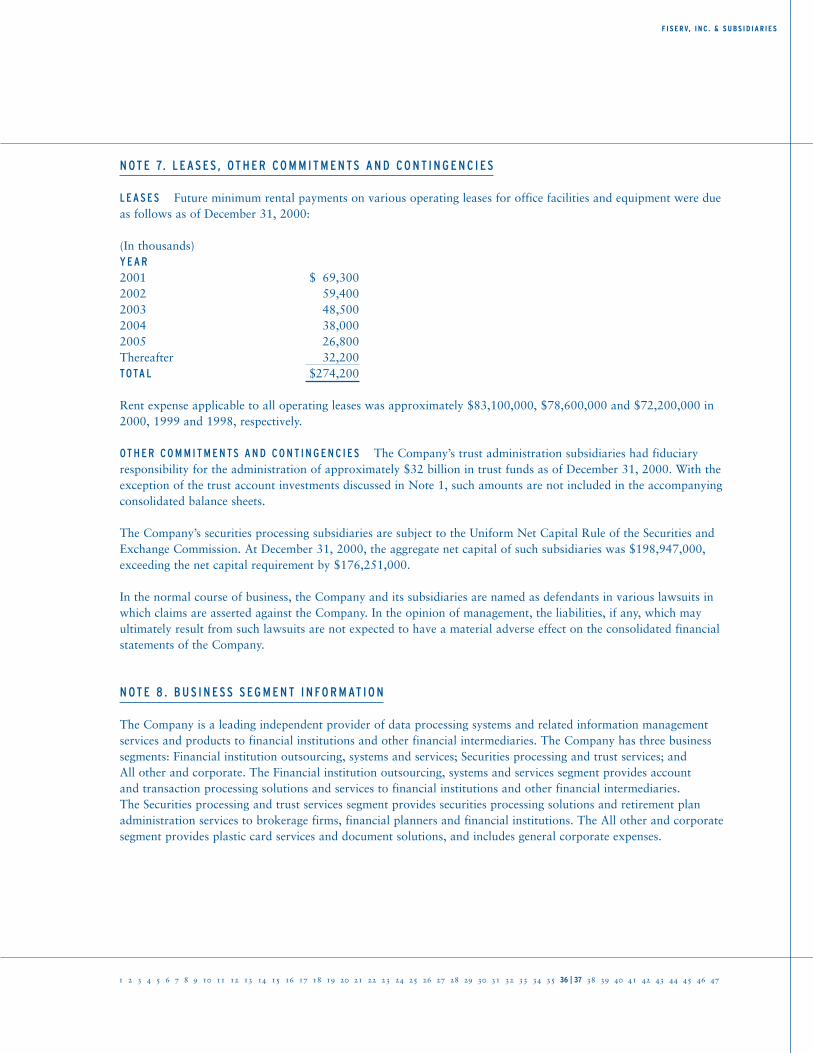
L E A S E S Future minimum rental payments on various operating leases for office facilities and equipment were dueas follows as of December 31, 2000:
(In thousands) Y E A R 2001 $ 69,3002002 59,4002003 48,500 2004 38,0002005 26,800Thereafter 32,200TOTA L $274,200
Rent expense applicable to all operating leases was approximately $83,100,000, $78,600,000 and $72,200,000 in2000, 1999 and 1998, respectively.
OT H E R CO M M I T M E N TS A N D CO N T I N G E N C I E S The Company’s trust administration subsidiaries had fiduciaryresponsibility for the administration of approximately $32 billion in trust funds as of December 31, 2000. With theexception of the trust account investments discussed in Note 1, such amounts are not included in the accompanyingconsolidated balance sheets.
The Company’s securities processing subsidiaries are subject to the Uniform Net Capital Rule of the Securities andExchange Commission. At December 31, 2000, the aggregate net capital of such subsidiaries was $198,947,000,exceeding the net capital requirement by $176,251,000.
In the normal course of business, the Company and its subsidiaries are named as defendants in various lawsuits inwhich claims are asserted against the Company. In the opinion of management, the liabilities, if any, which mayultimately result from such lawsuits are not expected to have a material adverse effect on the consolidated financialstatements of the Company.
N OT E 8 . B U S I N E S S S EG M E N T I N FO R M AT I O N
The Company is a leading independent provider of data processing systems and related information managementservices and products to financial institutions and other financial intermediaries. The Company has three businesssegments: Financial institution outsourcing, systems and services; Securities processing and trust services; and All other and corporate. The Financial institution outsourcing, systems and services segment provides account and transaction processing solutions and services to financial institutions and other financial intermediaries. The Securities processing and trust services segment provides securities processing solutions and retirement plan administration services to brokerage firms, financial planners and financial institutions. The All other and corporatesegment provides plastic card services and document solutions, and includes general corporate expenses.
F I S E R V, I N C . & S U B S I D I A R I E S
F I S E R V, I N C . & S U B S I D I A R I E S
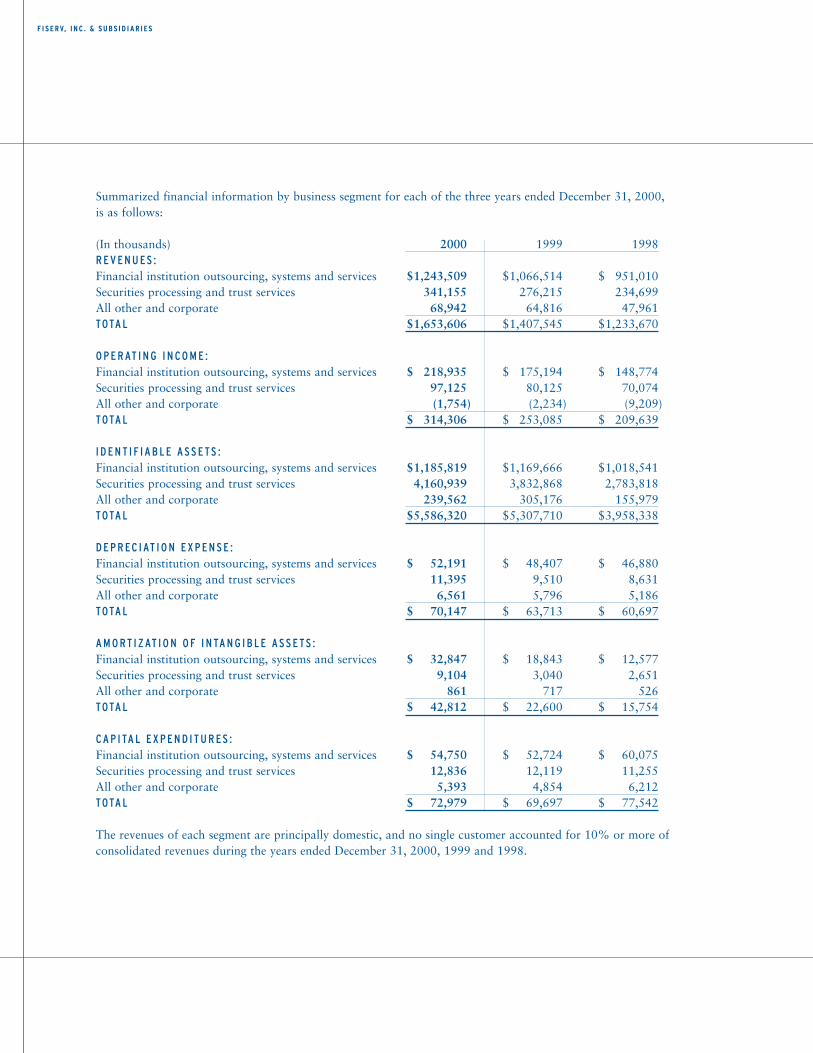
Summarized financial information by business segment for each of the three years ended December 31, 2000, is as follows:
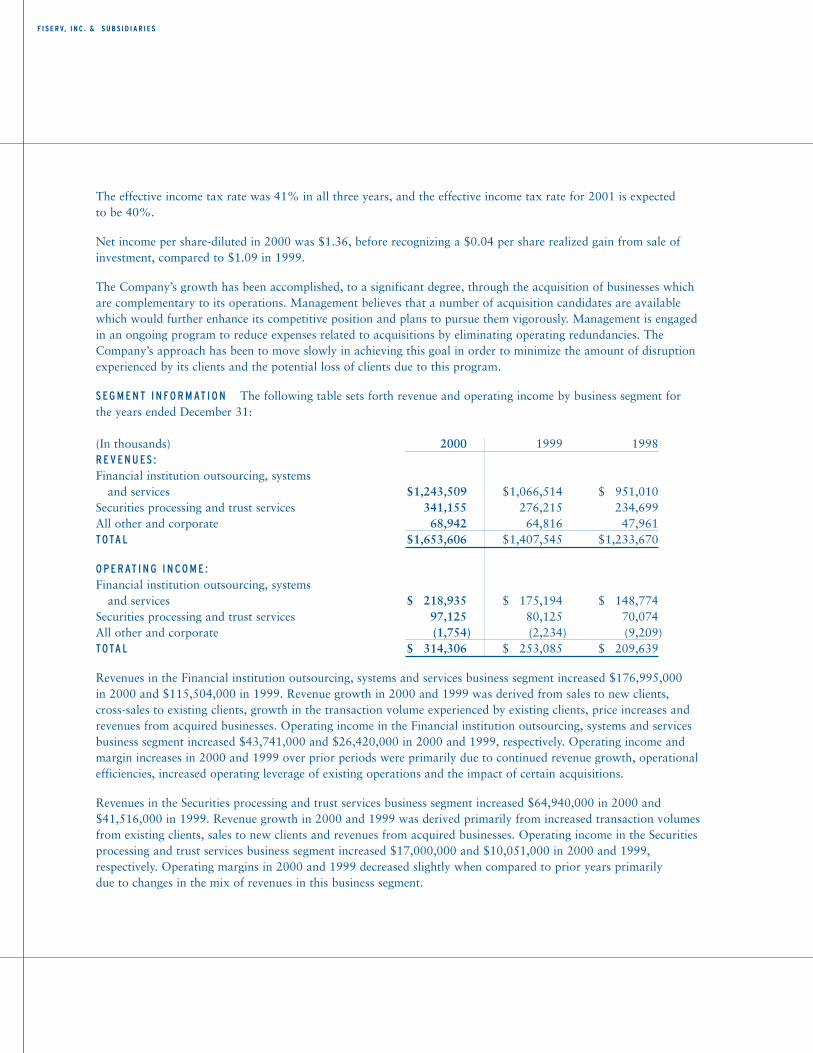
(In thousands) 2000 1999 1998 R E V E N U E S : Financial institution outsourcing, systems and services $1,243,509 $1,066,514 $ 951,010Securities processing and trust services 341,155 276,215 234,699All other and corporate 68,942 64,816 47,961TOTA L $1,653,606 $1,407,545 $1,233,670
O P E R AT I N G I N CO M E :Financial institution outsourcing, systems and services $ 218,935 $ 175,194 $ 148,774Securities processing and trust services 97,125 80,125 70,074 All other and corporate (1,754) (2,234) (9,209)TOTA L $ 314,306 $ 253,085 $ 209,639
I D E N T I F I A B L E A S S E TS : Financial institution outsourcing, systems and services $1,185,819 $1,169,666 $1,018,541Securities processing and trust services 4,160,939 3,832,868 2,783,818All other and corporate 239,562 305,176 155,979 TOTA L $5,586,320 $5,307,710 $3,958,338
D E P R EC I AT I O N E X P E N S E : Financial institution outsourcing, systems and services $ 52,191 $ 48,407 $ 46,880 Securities processing and trust services 11,395 9,510 8,631All other and corporate 6,561 5,796 5,186TOTA L $ 70,147 $ 63,713 $ 60,697
A M O RT I Z AT I O N O F I N TA N G I B L E A S S E TS : Financial institution outsourcing, systems and services $ 32,847 $ 18,843 $ 12,577Securities processing and trust services 9,104 3,040 2,651All other and corporate 861 717 526TOTA L $ 42,812 $ 22,600 $ 15,754
C A P I TA L E X P E N D I T U R E S :Financial institution outsourcing, systems and services $ 54,750 $ 52,724 $ 60,075Securities processing and trust services 12,836 12,119 11,255All other and corporate 5,393 4,854 6,212TOTA L $ 72,979 $ 69,697 $ 77,542
The revenues of each segment are principally domestic, and no single customer accounted for 10% or more of consolidated revenues during the years ended December 31, 2000, 1999 and 1998.
MANAGEMENT’S D ISCUSSION AND ANALYSIS OF F INANCIAL CONDIT ION AND RESULTS OF OPERATIONS
1 2 3 4 5 6 7 8 9 10 11 12 13 14 15 16 17 18 19 20 21 22 23 24 25 26 27 28 29 30 31 32 33 34 35 36 37 38 | 39 40 41 42 43 44 45 46 47
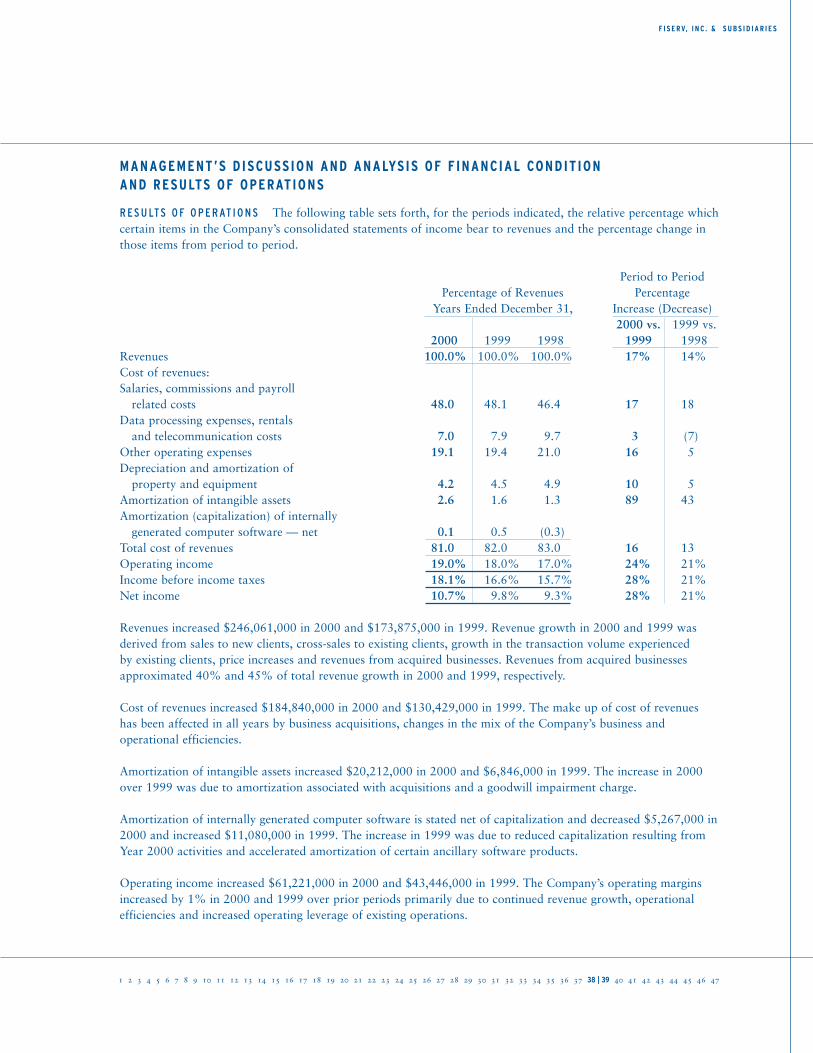
R E S U LTS O F O P E R AT I O N S The following table sets forth, for the periods indicated, the relative percentage whichcertain items in the Company’s consolidated statements of income bear to revenues and the percentage change inthose items from period to period.
Period to PeriodPercentage of Revenues Percentage
Years Ended December 31, Increase (Decrease)2000 vs. 1999 vs.
2000 1999 1998 1999 1998Revenues 100.0% 100.0% 100.0% 17% 14%Cost of revenues:Salaries, commissions and payroll
related costs 48.0 48.1 46.4 17 18 Data processing expenses, rentals
and telecommunication costs 7.0 7.9 9.7 3 (7) Other operating expenses 19.1 19.4 21.0 16 5 Depreciation and amortization of
property and equipment 4.2 4.5 4.9 10 5 Amortization of intangible assets 2.6 1.6 1.3 89 43 Amortization (capitalization) of internally
generated computer software — net 0.1 0.5 (0.3)Total cost of revenues 81.0 82.0 83.0 16 13 Operating income 19.0% 18.0% 17.0% 24% 21%Income before income taxes 18.1% 16.6% 15.7% 28% 21%Net income 10.7% 9.8% 9.3% 28% 21%
Revenues increased $246,061,000 in 2000 and $173,875,000 in 1999. Revenue growth in 2000 and 1999 wasderived from sales to new clients, cross-sales to existing clients, growth in the transaction volume experienced by existing clients, price increases and revenues from acquired businesses. Revenues from acquired businessesapproximated 40% and 45% of total revenue growth in 2000 and 1999, respectively.
Cost of revenues increased $184,840,000 in 2000 and $130,429,000 in 1999. The make up of cost of revenues has been affected in all years by business acquisitions, changes in the mix of the Company’s business and operational efficiencies.
Amortization of intangible assets increased $20,212,000 in 2000 and $6,846,000 in 1999. The increase in 2000over 1999 was due to amortization associated with acquisitions and a goodwill impairment charge.
Amortization of internally generated computer software is stated net of capitalization and decreased $5,267,000 in2000 and increased $11,080,000 in 1999. The increase in 1999 was due to reduced capitalization resulting fromYear 2000 activities and accelerated amortization of certain ancillary software products.
Operating income increased $61,221,000 in 2000 and $43,446,000 in 1999. The Company’s operating marginsincreased by 1% in 2000 and 1999 over prior periods primarily due to continued revenue growth, operational efficiencies and increased operating leverage of existing operations.
F I S E R V, I N C . & S U B S I D I A R I E S
F I S E R V, I N C . & S U B S I D I A R I E S
The effective income tax rate was 41% in all three years, and the effective income tax rate for 2001 is expected to be 40%.
Net income per share-diluted in 2000 was $1.36, before recognizing a $0.04 per share realized gain from sale ofinvestment, compared to $1.09 in 1999.
The Company’s growth has been accomplished, to a significant degree, through the acquisition of businesses whichare complementary to its operations. Management believes that a number of acquisition candidates are availablewhich would further enhance its competitive position and plans to pursue them vigorously. Management is engagedin an ongoing program to reduce expenses related to acquisitions by eliminating operating redundancies. TheCompany’s approach has been to move slowly in achieving this goal in order to minimize the amount of disruptionexperienced by its clients and the potential loss of clients due to this program.
S EG M E N T I N FO R M AT I O N The following table sets forth revenue and operating income by business segment for the years ended December 31:
(In thousands) 2000 1999 1998R E V E N U E S :Financial institution outsourcing, systems
and services $1,243,509 $1,066,514 $ 951,010 Securities processing and trust services 341,155 276,215 234,699 All other and corporate 68,942 64,816 47,961 TOTA L $1,653,606 $1,407,545 $1,233,670
O P E R AT I N G I N CO M E :Financial institution outsourcing, systems
and services $ 218,935 $ 175,194 $ 148,774 Securities processing and trust services 97,125 80,125 70,074 All other and corporate (1,754) (2,234) (9,209)TOTA L $ 314,306 $ 253,085 $ 209,639
Revenues in the Financial institution outsourcing, systems and services business segment increased $176,995,000 in 2000 and $115,504,000 in 1999. Revenue growth in 2000 and 1999 was derived from sales to new clients,cross-sales to existing clients, growth in the transaction volume experienced by existing clients, price increases andrevenues from acquired businesses. Operating income in the Financial institution outsourcing, systems and servicesbusiness segment increased $43,741,000 and $26,420,000 in 2000 and 1999, respectively. Operating income andmargin increases in 2000 and 1999 over prior periods were primarily due to continued revenue growth, operationalefficiencies, increased operating leverage of existing operations and the impact of certain acquisitions.
Revenues in the Securities processing and trust services business segment increased $64,940,000 in 2000 and$41,516,000 in 1999. Revenue growth in 2000 and 1999 was derived primarily from increased transaction volumesfrom existing clients, sales to new clients and revenues from acquired businesses. Operating income in the Securitiesprocessing and trust services business segment increased $17,000,000 and $10,051,000 in 2000 and 1999, respectively. Operating margins in 2000 and 1999 decreased slightly when compared to prior years primarily due to changes in the mix of revenues in this business segment.
1 2 3 4 5 6 7 8 9 10 11 12 13 14 15 16 17 18 19 20 21 22 23 24 25 26 27 28 29 30 31 32 33 34 35 36 37 38 39 40 | 41 42 43 44 45 46 47
F I S E R V, I N C . & S U B S I D I A R I E S
Revenues in the All other and corporate business segment increased $4,126,000 in 2000 and $16,855,000 in 1999.Operating income in this business segment increased $480,000 and $6,975,000 in 2000 and 1999, respectively. The increase in operating income in 1999 over 1998 was due to an acquisition and increased profitability in theCompany’s plastic card operations.
L I Q U I D I T Y A N D C A P I TA L R E S O U R C E S The following table summarizes the Company’s primary sources (uses) offunds during the years ended December 31:
(In thousands) 2000 1999 1998Cash provided by operating activities before changes in
securities processing receivables and payables — net $ 368,750 $ 318,715 $ 273,315 Securities processing receivables and payables — net 215,718 (140,878) 7,080 Cash provided by operating activities 584,468 177,837 280,395 Increase (decrease) in net borrowings (353,520) 169,959 79,835 TOTA L $ 230,948 $ 347,796 $ 360,230
The Company has used a significant portion of its cash flow from operations for acquisitions and capital expenditures with any remainder used to reduce long-term debt.
The Company believes that its cash flow from operations together with other available sources of funds will be adequate to meet its funding requirements. In the event that the Company makes significant future acquisitions,however, it may raise funds through additional borrowings or issuances of securities.
M A R K E T R I S K FA C TO R S Market risk refers to the risk that a change in the level of one or more market prices,interest rates, indices, correlations or other market factors, such as liquidity, will result in losses for a certain financial instrument or group of financial instruments. The Company is exposed primarily to interest rate risk oninvestments and borrowings. The Company actively monitors these risks through a variety of control proceduresinvolving senior management.
The Company’s trust administration subsidiaries accept money market account deposits from trust customers and invest those funds in marketable securities. Substantially all of the investments are rated within the highestinvestment grade categories for securities. The Company’s trust administration subsidiaries utilize simulation models for measuring and monitoring interest rate risk and market value of portfolio equities. A formal AssetLiability Committee of the Company meets quarterly to review interest rate risks, capital ratios, liquidity levels,portfolio diversification, credit risk ratings and adherence to investment policies and guidelines.
The Company manages its debt structure and interest rate risk through the use of fixed- and floating-rate debt andthrough the use of derivatives. The Company uses interest rate swaps to hedge its exposure to interest rate changes,and to lower its financing costs. Generally, under these swaps, the Company agrees with a counterparty to exchangethe difference between fixed-rate and floating-rate interest amounts based on an agreed principal amount. As ofDecember 31, 2000, the carrying amount of interest rate swap agreements approximated fair value.
Based on the controls in place, management believes the risk associated with these instruments at December 31,2000, will not have a material effect on the Company’s consolidated financial position or results of operations.
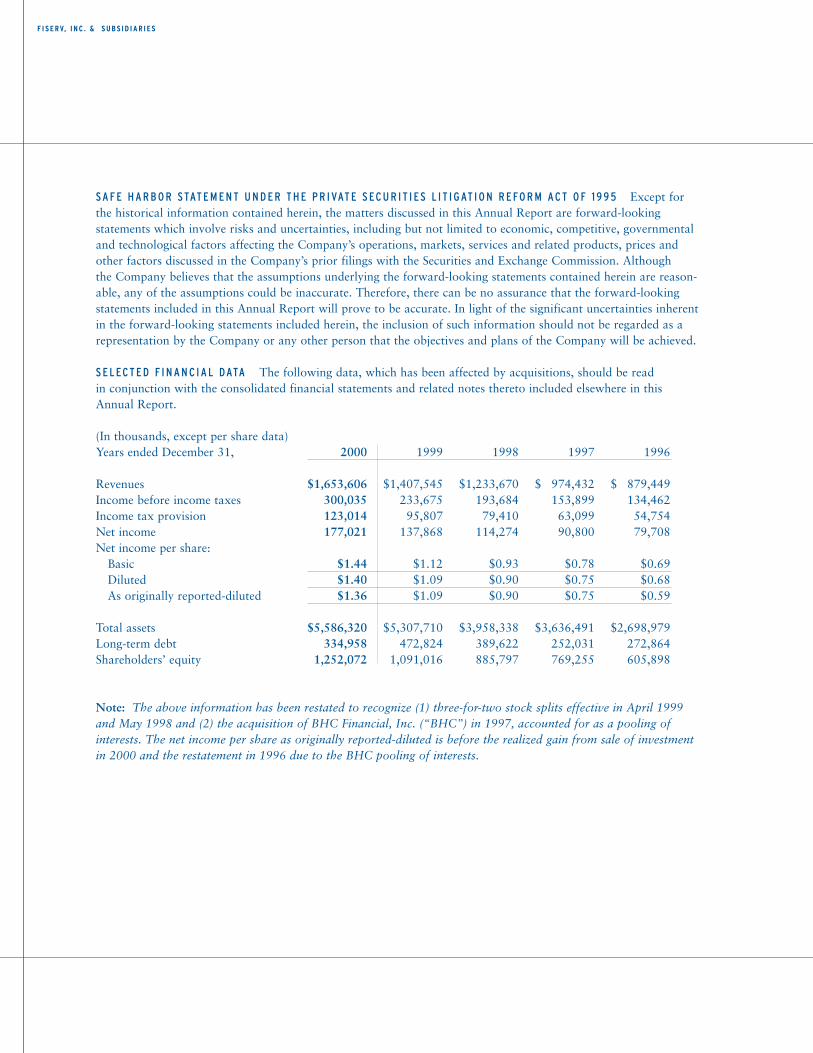
F I S E R V, I N C . & S U B S I D I A R I E S
S A F E H A R B O R STAT E M E N T U N D E R T H E P R I VAT E S EC U R I T I E S L I T I G AT I O N R E FO R M A C T O F 1 9 9 5 Except forthe historical information contained herein, the matters discussed in this Annual Report are forward-looking statements which involve risks and uncertainties, including but not limited to economic, competitive, governmentaland technological factors affecting the Company’s operations, markets, services and related products, prices andother factors discussed in the Company’s prior filings with the Securities and Exchange Commission. Although the Company believes that the assumptions underlying the forward-looking statements contained herein are reason-able, any of the assumptions could be inaccurate. Therefore, there can be no assurance that the forward-lookingstatements included in this Annual Report will prove to be accurate. In light of the significant uncertainties inherentin the forward-looking statements included herein, the inclusion of such information should not be regarded as arepresentation by the Company or any other person that the objectives and plans of the Company will be achieved.
S E L EC T E D F I N A N C I A L DATA The following data, which has been affected by acquisitions, should be read in conjunction with the consolidated financial statements and related notes thereto included elsewhere in thisAnnual Report.
(In thousands, except per share data)Years ended December 31, 2000 1999 1998 1997 1996
Revenues $1,653,606 $1,407,545 $1,233,670 $0,974,432 $0,879,449Income before income taxes 300,035 233,675 193,684 153,899 134,462Income tax provision 123,014 95,807 79,410 63,099 54,754Net income 177,021 137,868 114,274 90,800 79,708Net income per share:
Basic $1.44 $1.12 $0.93 $0.78 $0.69Diluted $1.40 $1.09 $0.90 $0.75 $0.68As originally reported-diluted $1.36 $1.09 $0.90 $0.75 $0.59
Total assets $5,586,320 $5,307,710 $3,958,338 $3,636,491 $2,698,979Long-term debt 334,958 472,824 389,622 252,031 272,864Shareholders’ equity 1,252,072 1,091,016 885,797 769,255 605,898
Note: The above information has been restated to recognize (1) three-for-two stock splits effective in April 1999and May 1998 and (2) the acquisition of BHC Financial, Inc. (“BHC”) in 1997, accounted for as a pooling of interests. The net income per share as originally reported-diluted is before the realized gain from sale of investmentin 2000 and the restatement in 1996 due to the BHC pooling of interests.

1 2 3 4 5 6 7 8 9 10 11 12 13 14 15 16 17 18 19 20 21 22 23 24 25 26 27 28 29 30 31 32 33 34 35 36 37 38 39 40 41 42 | 43 44 45 46 47
F I S E R V, I N C . & S U B S I D I A R I E S
QUARTERLY F INANCIAL INFORMATION (Unaudited)
(In thousands, except per share data) Quarters2 0 0 0 First Second Third Fourth TotalRevenues $396,402 $416,434 $406,189 $434,581 $1,653,606Cost of revenues 317,448 337,046 327,966 356,840 1,339,300Operating income 78,954 79,388 78,223 77,741 314,306Interest expense — net (5,806) (6,000) (5,295) (4,988) (22,089)Realized gain from sale of investment – 2,928 2,907 1,983 7,818Income before income taxes 73,148 76,316 75,835 74,736 300,035Income tax provision 29,991 31,289 31,093 30,641 123,014Net income $ 43,157 $ 45,027 $ 44,742 $ 44,095 $ 177,021
Net income per share:Basic $0.35 $0.37 $0.36 $0.36 $1.44Diluted $0.34 $0.36 $0.35 $0.35 $1.40Diluted (before realized gain
from sale of investment) $0.34 $0.34 $0.34 $0.34 $1.36
1 9 9 9Revenues $337,129 $343,252 $352,663 $374,501 $1,407,545Cost of revenues 276,506 280,738 288,094 309,122 1,154,460Operating income 60,623 62,514 64,569 65,379 253,085Interest expense — net (3,985) (4,315) (4,913) (6,197) (19,410)Income before income taxes 56,638 58,199 59,656 59,182 233,675Income tax provision 23,222 23,861 24,459 24,265 95,807Net income $ 33,416 $ 34,338 $ 35,197 $ 34,917 $ 137,868
Net income per share:Basic $0.27 $0.28 $0.29 $0.28 $1.12Diluted $0.26 $0.27 $0.28 $0.28 $1.09
M A R K E T P R I C E I N FO R M AT I O N The following information relates to the closing price of the Company’s $0.01 parvalue common stock, which is traded on the NASDAQ Stock Market® under the symbol FISV. Information hasbeen adjusted (to the nearest 1/32) to recognize the three-for-two stock split effective April 1999.
2000 1999Quarter Ended High Low High LowMarch 31 38 1/2 24 5/16 37 19/32 30June 30 50 3/8 33 11/16 40 31 5/16
September 30 64 1/8 42 11/16 34 1/8 27 1/4
December 31 62 5/8 43 7/16 39 3/16 24 3/4
At December 31, 2000, the Company’s common stock was held by 2,859 shareholders of record. It is estimatedthat an additional 38,000 shareholders own the Company’s stock through nominee or street name accounts withbrokers. The closing sale price for the Company’s stock on January 23, 2001, was $52.19 per share.
The Company’s present policy is to retain earnings to support future business opportunities, rather than to pay dividends.
F I S E R V, I N C . & S U B S I D I A R I E S
MANAGEMENT’S STATEMENT OF RESPONSIBIL ITY
The management of Fiserv, Inc. assumes responsibility for the integrity and objectivity of the information appearingin the 2000 Annual Report. This information was prepared in conformity with accounting principles generallyaccepted in the United States of America and necessarily reflects the best estimates and judgment of management.
To provide reasonable assurance that transactions authorized by management are recorded and reported properlyand that assets are safeguarded, the Company maintains a system of internal controls. The concept of reasonableassurance implies that the cost of such a system is weighed against the benefits to be derived therefrom.
The control environment is complemented by the Company’s internal audit function, which evaluates the adequacyof the controls, policies and procedures in place, as well as adherence to them, and recommends improvements forimplementation when applicable. In addition, Deloitte & Touche LLP, certified public accountants, audits the financial statements of the Company in accordance with auditing standards generally accepted in the United Statesof America. Their audit includes a review of the internal control system, and improvements are made to the systembased upon their recommendations.
The Audit Committee ensures that management and the independent auditors are properly discharging their financial reporting responsibilities. In performing this function, the Committee meets with management and theindependent auditors throughout the year. Additional access to the Committee is provided to Deloitte & ToucheLLP on an unrestricted basis, allowing discussion of audit results and opinions on the adequacy of internal accounting controls and the quality of financial reporting.
L E S L I E M . M U M A President and Chief Executive Officer
INDEPENDENT AUDITORS’ REPORT
Shareholders and Directors of Fiserv, Inc.We have audited the accompanying consolidated balance sheets of Fiserv, Inc. and subsidiaries as of December 31,2000 and 1999, and the related consolidated statements of income, shareholders’ equity and cash flows for each of thethree years in the period ended December 31, 2000. These financial statements are the responsibility of the Company’smanagement. Our responsibility is to express an opinion on these financial statements based on our audits.
We conducted our audits in accordance with auditing standards generally accepted in the United States of America.Those standards require that we plan and perform the audit to obtain reasonable assurance about whether thefinancial statements are free of material misstatement. An audit includes examining, on a test basis, evidence supporting the amounts and disclosures in the financial statements. An audit also includes assessing the accountingprinciples used and significant estimates made by management, as well as evaluating the overall financial statementpresentation. We believe that our audits provide a reasonable basis for our opinion.
In our opinion, such consolidated financial statements present fairly, in all material respects, the financial positionof Fiserv, Inc. and subsidiaries at December 31, 2000 and 1999, and the results of their operations and their cashflows for each of the three years in the period ended December 31, 2000 in conformity with accounting principlesgenerally accepted in the United States of America.
D E LO I T T E & TO U C H E L L P Milwaukee, Wisconsin January 26, 2001
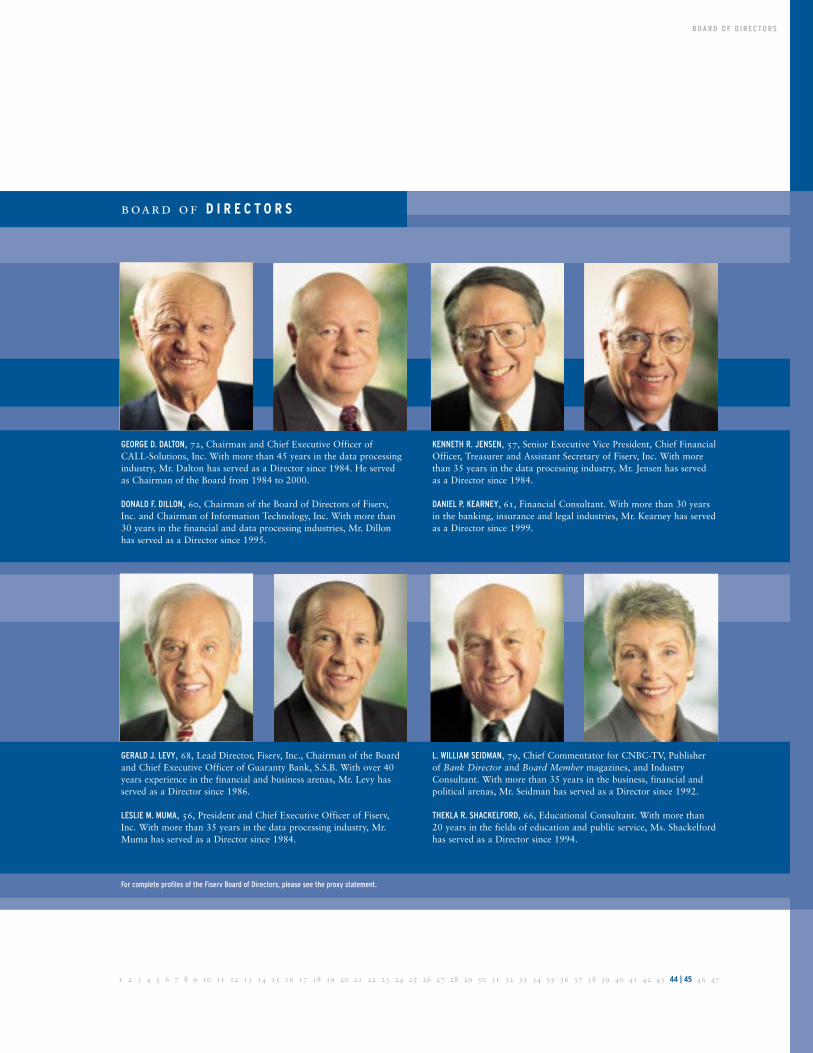
board of D I R E C T O R S
GEORGE D. DALTON, 72, Chairman and Chief Executive Officer of CALL-Solutions, Inc. With more than 45 years in the data processingindustry, Mr. Dalton has served as a Director since 1984. He servedas Chairman of the Board from 1984 to 2000.
DONALD F. DILLON, 60, Chairman of the Board of Directors of Fiserv,Inc. and Chairman of Information Technology, Inc. With more than30 years in the financial and data processing industries, Mr. Dillonhas served as a Director since 1995.
KENNETH R. JENSEN, 57, Senior Executive Vice President, Chief FinancialOfficer, Treasurer and Assistant Secretary of Fiserv, Inc. With morethan 35 years in the data processing industry, Mr. Jensen has servedas a Director since 1984.
DANIEL P. KEARNEY, 61, Financial Consultant. With more than 30 yearsin the banking, insurance and legal industries, Mr. Kearney has servedas a Director since 1999.
GERALD J. LEVY, 68, Lead Director, Fiserv, Inc., Chairman of the Boardand Chief Executive Officer of Guaranty Bank, S.S.B. With over 40years experience in the financial and business arenas, Mr. Levy hasserved as a Director since 1986.
LESLIE M. MUMA, 56, President and Chief Executive Officer of Fiserv,Inc. With more than 35 years in the data processing industry, Mr.Muma has served as a Director since 1984.
For complete profiles of the Fiserv Board of Directors, please see the proxy statement.
L. WILLIAM SEIDMAN, 79, Chief Commentator for CNBC-TV, Publisherof Bank Director and Board Member magazines, and IndustryConsultant. With more than 35 years in the business, financial andpolitical arenas, Mr. Seidman has served as a Director since 1992.
THEKLA R. SHACKELFORD, 66, Educational Consultant. With more than20 years in the fields of education and public service, Ms. Shackelfordhas served as a Director since 1994.
B O A R D O F D I R EC TO R S
1 2 3 4 5 6 7 8 9 10 11 12 13 14 15 16 17 18 19 20 21 22 23 24 25 26 27 28 29 30 31 32 33 34 35 36 37 38 39 40 41 42 43 44 | 45 46 47
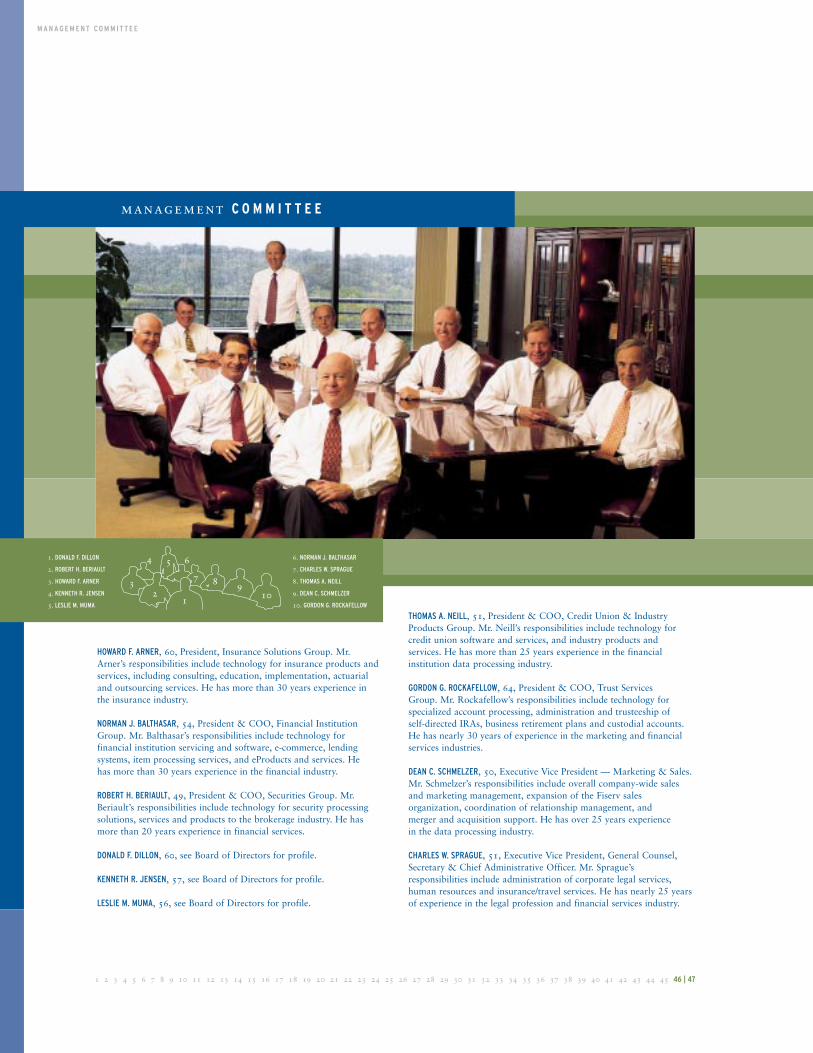
HOWARD F. ARNER, 60, President, Insurance Solutions Group. Mr.Arner’s responsibilities include technology for insurance products andservices, including consulting, education, implementation, actuarialand outsourcing services. He has more than 30 years experience inthe insurance industry.
NORMAN J. BALTHASAR, 54, President & COO, Financial InstitutionGroup. Mr. Balthasar’s responsibilities include technology for financial institution servicing and software, e-commerce, lending systems, item processing services, and eProducts and services. He has more than 30 years experience in the financial industry.
ROBERT H. BERIAULT, 49, President & COO, Securities Group. Mr.Beriault’s responsibilities include technology for security processingsolutions, services and products to the brokerage industry. He hasmore than 20 years experience in financial services.
DONALD F. DILLON, 60, see Board of Directors for profile.
KENNETH R. JENSEN, 57, see Board of Directors for profile.
LESLIE M. MUMA, 56, see Board of Directors for profile.
THOMAS A. NEILL, 51, President & COO, Credit Union & IndustryProducts Group. Mr. Neill’s responsibilities include technology forcredit union software and services, and industry products and services. He has more than 25 years experience in the financial institution data processing industry.
GORDON G. ROCKAFELLOW, 64, President & COO, Trust Services Group. Mr. Rockafellow’s responsibilities include technology for specialized account processing, administration and trusteeship of self-directed IRAs, business retirement plans and custodial accounts.He has nearly 30 years of experience in the marketing and financialservices industries.
DEAN C. SCHMELZER, 50, Executive Vice President — Marketing & Sales.Mr. Schmelzer’s responsibilities include overall company-wide salesand marketing management, expansion of the Fiserv sales organization, coordination of relationship management, and merger and acquisition support. He has over 25 years experience in the data processing industry.
CHARLES W. SPRAGUE, 51, Executive Vice President, General Counsel,Secretary & Chief Administrative Officer. Mr. Sprague’s responsibilities include administration of corporate legal services,human resources and insurance/travel services. He has nearly 25 yearsof experience in the legal profession and financial services industry.
M A N A G E M E N T C O M M I T T E E
1 2 3 4 5 6 7 8 9 10 11 12 13 14 15 16 17 18 19 20 21 22 23 24 25 26 27 28 29 30 31 32 33 34 35 36 37 38 39 40 41 42 43 44 45 46 | 47
management C O M M I T T E E
654
21
3 7 8 910
1. DONALD F. DILLON
2. ROBERT H. BERIAULT
3. HOWARD F. ARNER
4. KENNETH R. JENSEN
5. LESLIE M. MUMA
6. NORMAN J. BALTHASAR
7. CHARLES W. SPRAGUE
8. THOMAS A. NEILL
9. DEAN C. SCHMELZER
10. GORDON G. ROCKAFELLOW
executive O F F I C E R S
FINANCIAL INSTITUTION GROUP
NORMAN J. BALTHASAR, 54President & COO
KENNETH R. ACHESON, 52President,Item Processing Division
MARK J. DAMICO, 32President,Fiserv Solutions of Canada
DAVID G. KRYSTOWIAK, 51President,Bank Servicing Division I
RODNEY D. POSKOCHIL, 48President,Bank Systems & eProductsDivision
JAMES C. PUZNIAK, 54President,Bank Servicing Division II
FRANK M. SMEAL, 58President,Bank Servicing Division III
CREDIT UNION & INDUSTRY PRODUCTS GROUP
THOMAS A. NEILL, 51President & COO
JOSEPH A. BARRY, 47President,USERS
WILLIAM R. COLBORN, 56President,Document Solutions
JORGE M. DIAZ, 36President,Personix
ROGER L. KUHNS, 53President,Credit UnionWestern Region
ROBERT L. MIOTKE, 63President,GalaxyPlus
PHILIP E. SATTLER, 56President,HRIS
JOSEPH F. SERMARINI, 59President,AFTECH
INSURANCE SOLUTIONS GROUP
HOWARD F. ARNER, 60President
STEPHEN F. ABBOTT, 46President,Fiserv SIS
THOMAS L. BITTENBENDER, 42President,Progressive Data Solutions
MICHAEL D. GANTT, 49Executive Vice President & COO,Insurance Solutions Group
JAY D. GREGORY, 51President,Life Instructors, Inc.
LARRY J. KANE, 55President,The FREEDOM Group
CURTIS M. LUND, 60President,National Flood Services
ANTHONY T. PERDICHEZZI, 53President,Fiserv Life Insurance Solutions
BARRY W. WATKINS, 53President,FIPSCO
SECURITIES GROUP
ROBERT H. BERIAULT, 49President & COO
HENRY H. CLINES, 59CEO,Fiserv InvestorServices, Inc.
LAWRENCE E. DONATO, 52President,Fiserv Securities, Inc.
GEORGE A. JOHNSON, 51President,Fiserv CorrespondentServices, Inc.
TRUST SERVICES GROUP
GORDON G. ROCKAFELLOW, 64President & COO
WARD A. ANDERSON, 48Senior Vice President,Lincoln Trust Company
CRAIG J. FAULKNER, 47President,Emerald Publications
JOAN K. MANNING, 48President,Resources Trust Company
D. TERRY REITAN, 54President,First Trust Corporation
CORPORATE MANAGEMENT GROUP
JACK P. BUCALO, 62Senior Vice President,Human Resources
CHRISTINA SLEMON-DOKOS, 45Senior Vice President,Marketing
THOMAS J. HIRSCH, 37Vice President & Controller
DANIEL F. MURPHY, 51Senior Vice President,Director of Audit
E X EC U T I V E O F F I C E R S
CO R P O R AT E O F F I C E S255 Fiserv DriveBrookfield, Wisconsin 53045(262) 879-5000
WO R L D W I D E W E Bfiserv.com
I N V E STO R R E L AT I O N S(800) 425-FISV
T R A N S F E R A G E N TEquiServeThe First Chicago Trust DivisionP.O. Box 2500Jersey City, New York 07303-2500 (800) 446-2617
2 0 0 1 A N N UA LS H A R E H O L D E R S’ M E E T I N GThursday, March 29, 2001Fiserv Corporate OfficesBrookfield, Wisconsin
Fiserv is a registered trademark of Fiserv, Inc.All product and brand names mentioned arethe property of their respective companies.
© 2001 Fiserv, Inc. All rights reserved.
D E S I G N A N D P R O D U C T I O NCommunications Design, another resource from Fiserv