Embed Size (px)
Citation preview

Market PerspectivesDecember 2016
Dec. 9th, 2016
www.finlightresearch.com
Don’t call me Trump. Just call me the Wizard of Oz!

“Buying bonds amounts to picking up pennies in front of a
steamroller…” – An anonymous hedge fund manager
2FinLight Research | www.finlightresearch.com

Executive Summary: Global Asset Allocation
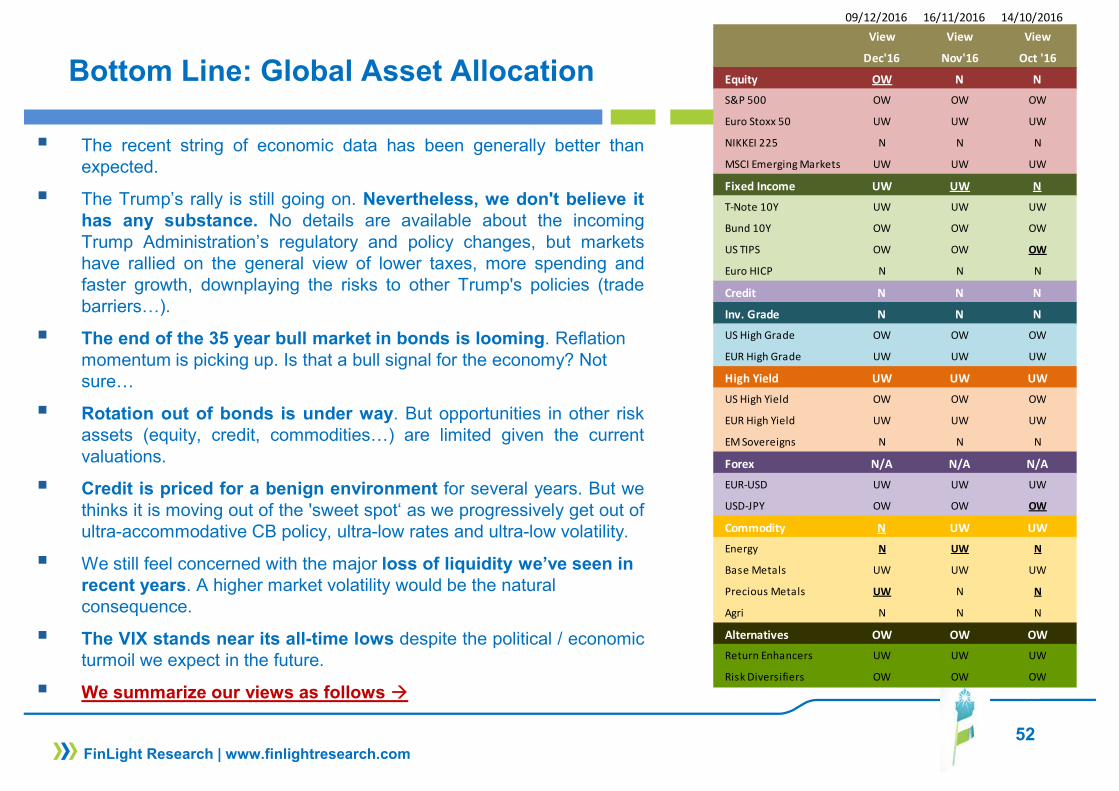
� The recent string of economic data has been generally better thanexpected.
� The Trump’s rally is still going on. Nevertheless, we don't believe ithas any substance. No details are available about the incomingTrump Administration’s regulatory and policy changes, but marketshave rallied on the general view of lower taxes, more spending andfaster growth, downplaying the risks to other Trump's policies (tradebarriers…).
� The end of the 35 year bull market in bonds is looming. Reflation momentum is picking up. Is that a bull signal for the economy? Not sure…
� Rotation out of bonds is under way. But opportunities in other riskassets (equity, credit, commodities…) are limited given the currentvaluations.
� Credit is priced for a benign environment for several years. But wethinks it is moving out of the 'sweet spot‘ as we progressively get out ofultra-accommodative CB policy, ultra-low rates and ultra-low volatility.
� We still feel concerned with the major loss of liquidity we’ve seen in recent years. A higher market volatility would be the natural consequence.
� The VIX stands near its all-time lows despite the political / economicturmoil we expect in the future.
� We summarize our views as follows �
3FinLight Research | www.finlightresearch.com
09/12/2016 16/11/2016 14/10/2016
View View View
Dec'16 Nov'16 Oct '16
Equity OW N N
S&P 500 OW OW OW
Euro Stoxx 50 UW UW UW
NIKKEI 225 N N N
MSCI Emerging Markets UW UW UW
Fixed Income UW UW N
T-Note 10Y UW UW UW
Bund 10Y OW OW OW
US TIPS OW OW OW
Euro HICP N N N
Credit N N N
Inv. Grade N N N
US High Grade OW OW OW
EUR High Grade UW UW UW
High Yield UW UW UW
US High Yield OW OW OW
EUR High Yield UW UW UW
EM Sovereigns N N N
Forex N/A N/A N/A
EUR-USD UW UW UW
USD-JPY OW OW OW
Commodity N UW UW
Energy N UW N
Base Metals UW UW UW
Precious Metals UW N N
Agri N N N
Alternatives OW OW OW
Return Enhancers UW UW UW
Risk Diversifiers OW OW OW
MACRO VIEW
� The Good� November picture looks strong. At 53.2, ISM Manufacturing recorded its best levels since Feb.
‘15. ISM non-Manufacturing strengthened to 57.2.� 3Q US GDP was revised upward to 3.2%. � At 107.1, the Conference Board consumer confidence index for November is at a new cycle high
� The Bad� According to the Fed's Senior Loan Officer Opinion Survey, Commercial Real Estate lending
standards tighten for the 5th quarter in a row. This is usually a leading indicator of lower CRE property prices.
� Subprime auto loans deteriorates: During the Q3, delinquencies of 90-plus days jumped up to 3.6% of total auto loan balances.
� The Ugly � Main systemic risk resides in China: Chinese debt bomb is ticking. Debt is used to create the
illusion of growth. The Chinese banking sector is going to end up needing a bailout. A yuan devaluation seems unavoidable and would impose a strong deflationary shock on the world economy.
� The risk of a hard Brexit should be monitored closely
4FinLight Research | www.finlightresearch.com
5FinLight Research | www.finlightresearch.com
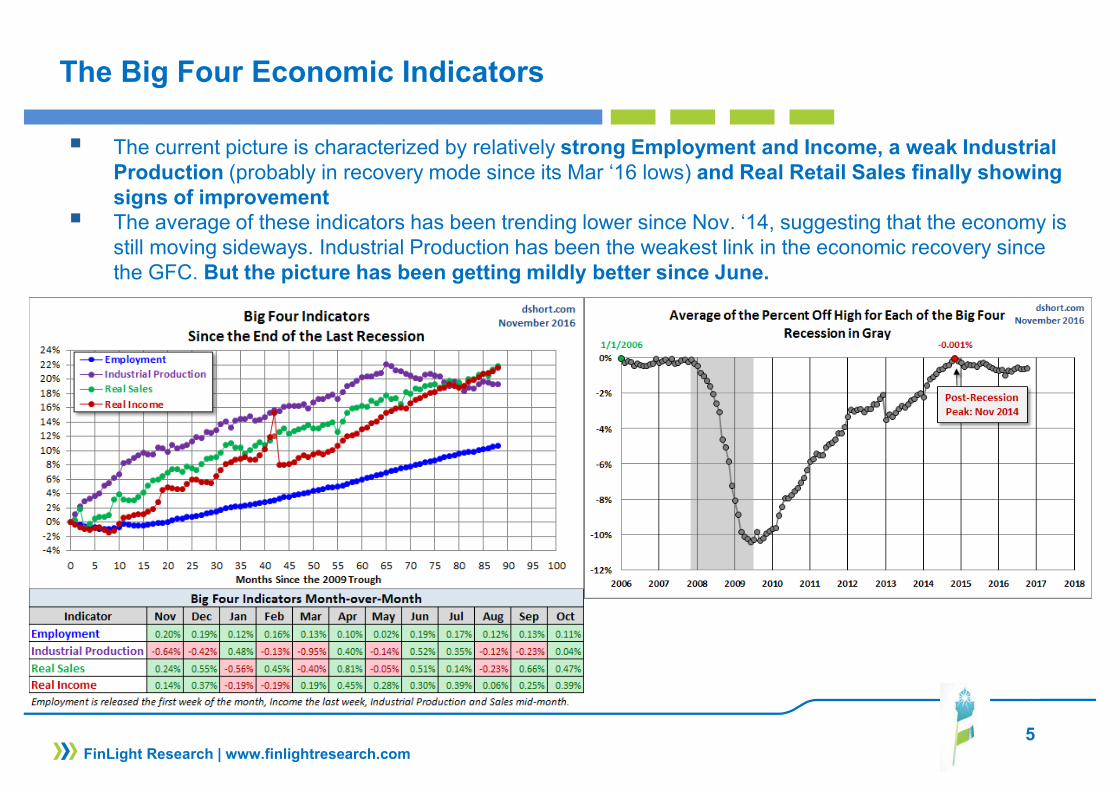
The Big Four Economic Indicators
� The current picture is characterized by relatively strong Employment and Income, a weak Industrial Production (probably in recovery mode since its Mar ‘16 lows) and Real Retail Sales finally showingsigns of improvement
� The average of these indicators has been trending lower since Nov. ‘14, suggesting that the economy is still moving sideways. Industrial Production has been the weakest link in the economic recovery since the GFC. But the picture has been getting mildly better since June.

6FinLight Research | www.finlightresearch.com
GS – Global Leading Indicator (GLI)
� The GLI picture looks bettersince mid-2016.
� The November Final GLIcame in at 3.5% yoy (upfrom 3.0% in October). ItsMoM momentum came at0.39% (up from its lastmonth’s 0.29%)
� Seven of the ten underlying components of the GLI improved, with minor declines in the 3 others.
� Despite the better shape ofGLI momentum, wecontinue to think that theacceleration we’ve beenwitnessing since Jan. ‘15is quite modest for atypical expansion phase
7FinLight Research | www.finlightresearch.com
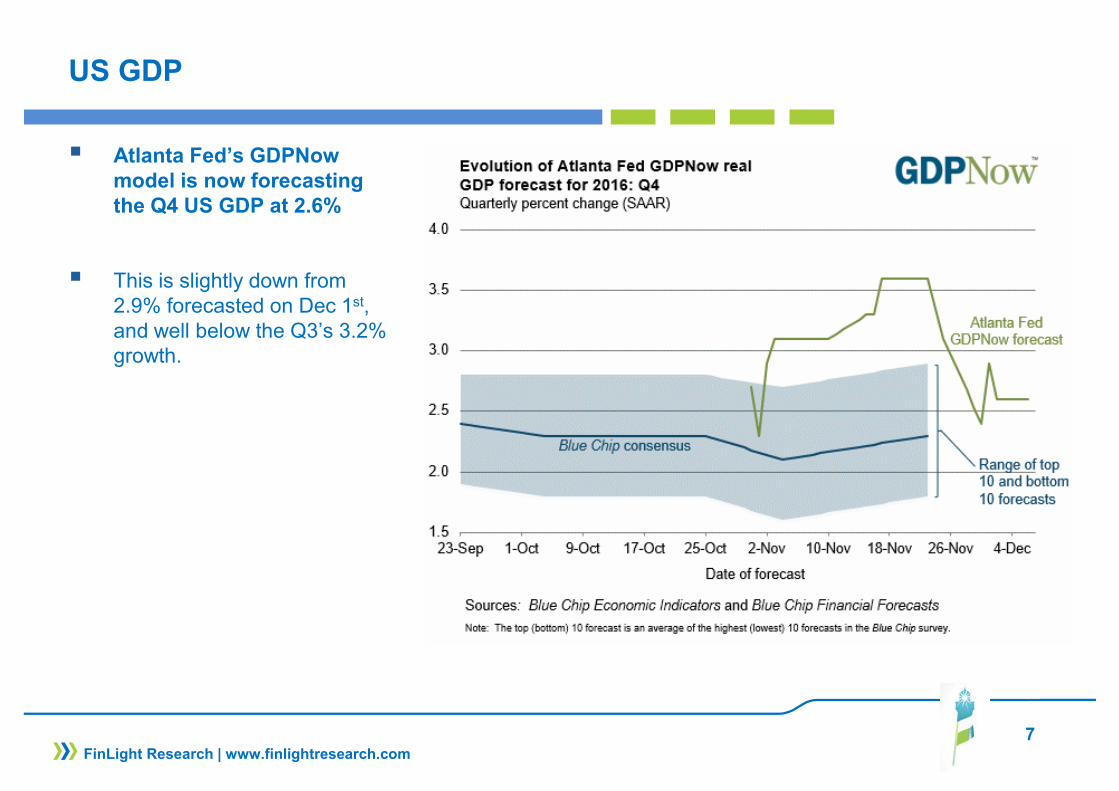
US GDP
� Atlanta Fed’s GDPNowmodel is now forecasting the Q4 US GDP at 2.6%
� This is slightly down from 2.9% forecasted on Dec 1st, and well below the Q3’s 3.2% growth.
8FinLight Research | www.finlightresearch.com
Auto Loans – The next issue to deal with?
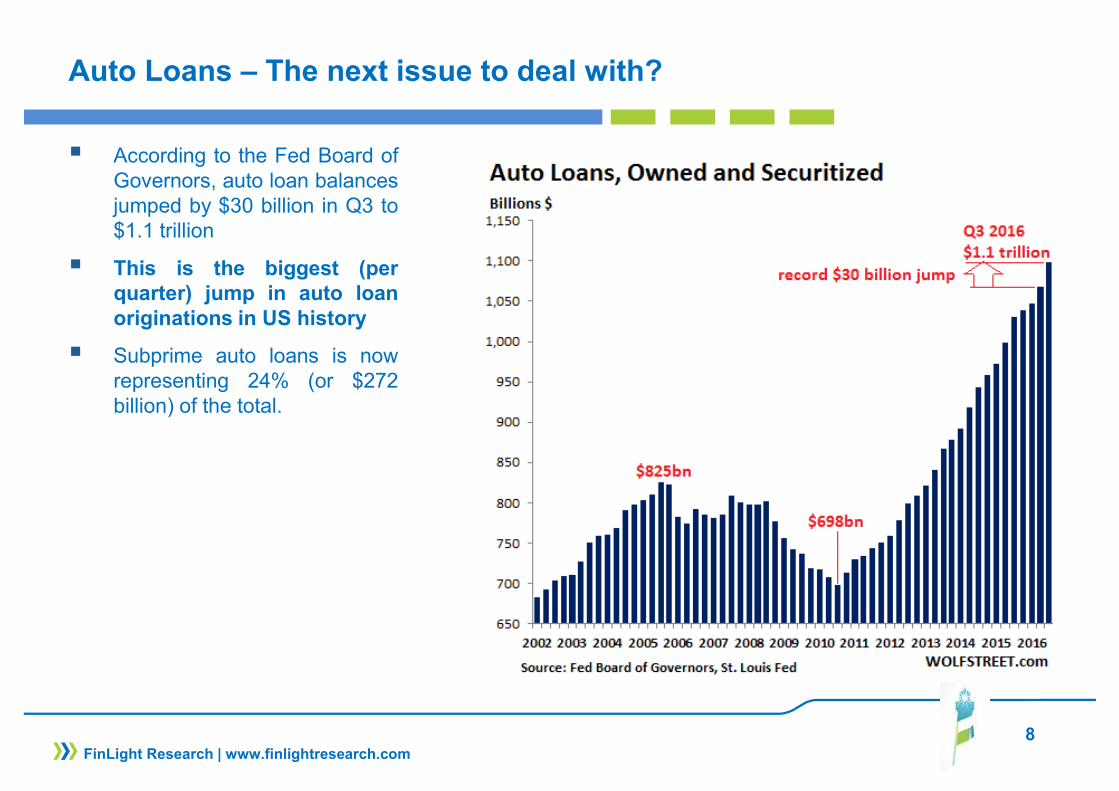
� According to the Fed Board ofGovernors, auto loan balancesjumped by $30 billion in Q3 to$1.1 trillion
� This is the biggest (perquarter) jump in auto loanoriginations in US history
� Subprime auto loans is nowrepresenting 24% (or $272billion) of the total.
9FinLight Research | www.finlightresearch.com
Auto Loans – The next issue to deal with?
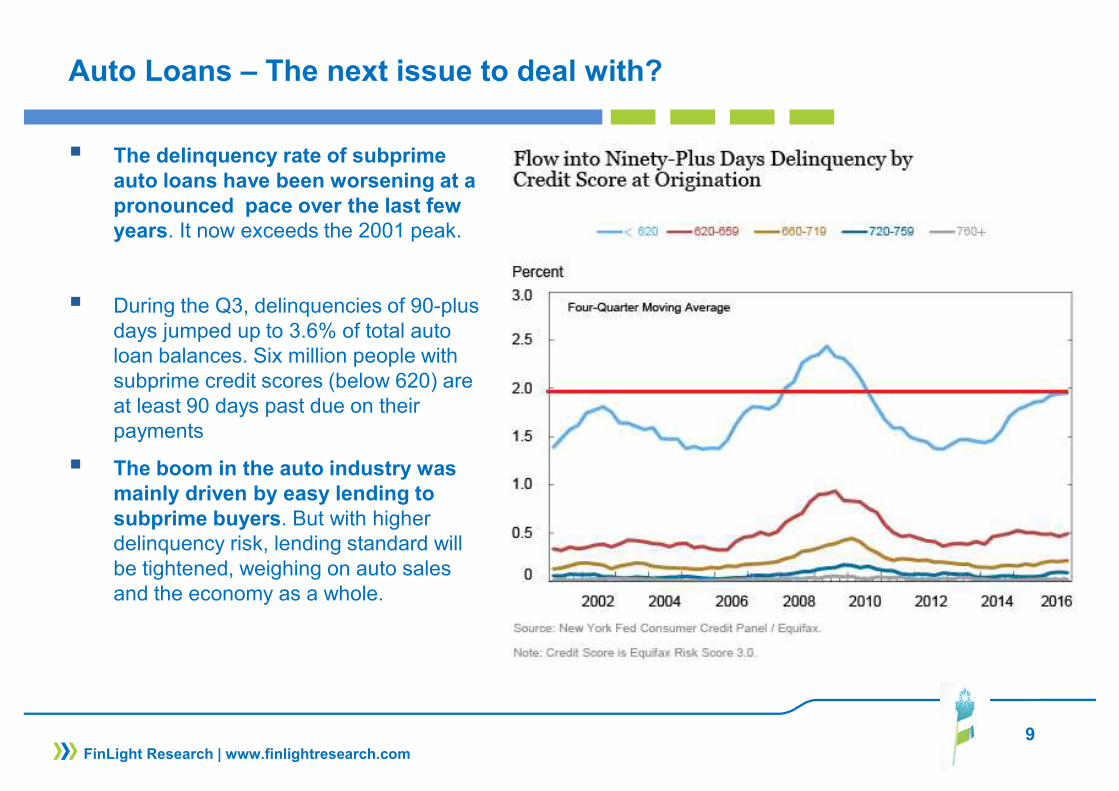
� The delinquency rate of subprime auto loans have been worsening at a pronounced pace over the last few years. It now exceeds the 2001 peak.
� During the Q3, delinquencies of 90-plus days jumped up to 3.6% of total auto loan balances. Six million people with subprime credit scores (below 620) are at least 90 days past due on their payments
� The boom in the auto industry was mainly driven by easy lending to subprime buyers. But with higher delinquency risk, lending standard will be tightened, weighing on auto sales and the economy as a whole.
10FinLight Research | www.finlightresearch.com
Inflation Risk: Money Supply & GDP
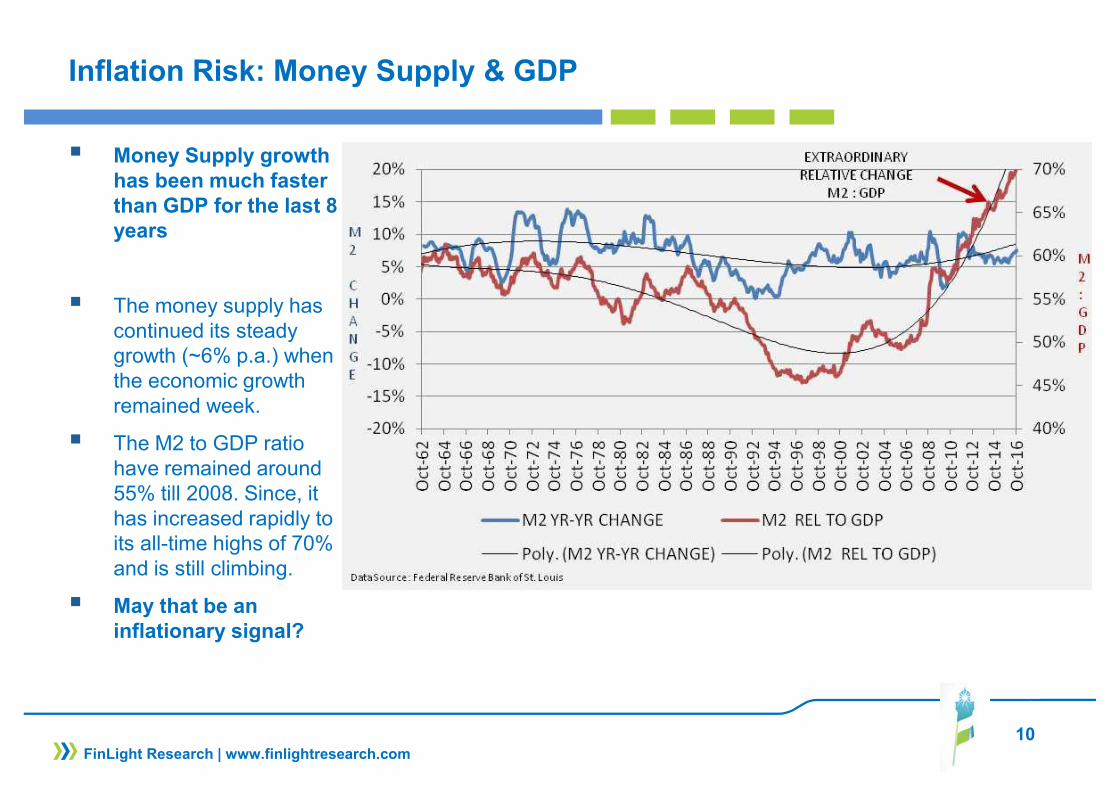
� Money Supply growth has been much faster than GDP for the last 8 years
� The money supply has continued its steady growth (~6% p.a.) when the economic growth remained week.
� The M2 to GDP ratio have remained around 55% till 2008. Since, it has increased rapidly to its all-time highs of 70% and is still climbing.
� May that be an inflationary signal?
11FinLight Research | www.finlightresearch.com
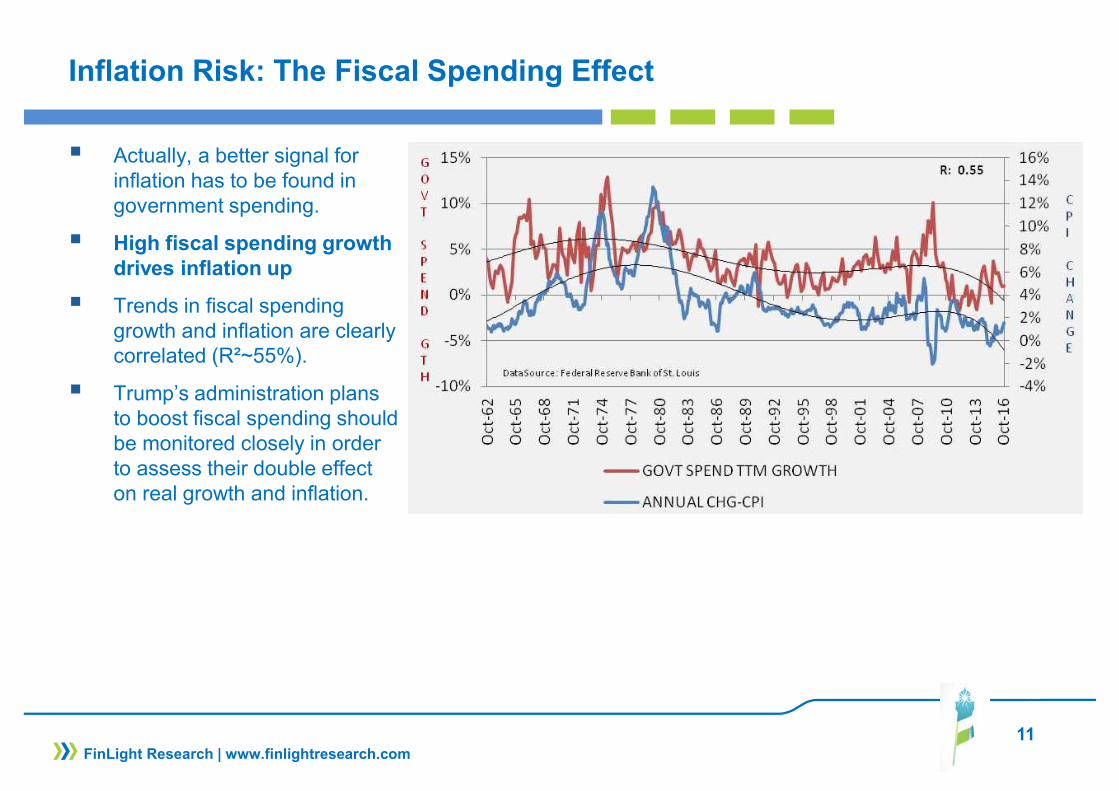
Inflation Risk: The Fiscal Spending Effect
� Actually, a better signal for inflation has to be found in government spending.
� High fiscal spending growth drives inflation up
� Trends in fiscal spending growth and inflation are clearly correlated (R²~55%).
� Trump’s administration plans to boost fiscal spending should be monitored closely in order to assess their double effect on real growth and inflation.
12FinLight Research | www.finlightresearch.com
EQUITY
� The Trump’s rally is still going on. We have to recognize its surprising strength and to cope with.
� According to our positioning rules (please see our previous reports), we turned (tactically) OW on the S&P500 as the index broke above the 2070-2090 range.
� With the clean break of the S&P500 above 2200-2225, we have to recognize that our alternative scenario is in.
� Nevertheless, we don't believe the Trump rally has any substance. No details are available about the incoming Trump Administration’s regulatory and policy changes, but markets have rallied on the general view of lower taxes, more spending and faster growth, downplaying the risks to other Trump's policies (trade barriers…). Markets seem to see in Trump the new Wonderful Wizard of Oz.
� We do not expect more concrete details about Trump’s policies (tax reform, fiscal stimulus, trade, deregulation) to be available before end of Q1-2017.
� Over the last few years, the sluggishness of growth and inflation expectations has induced anoutperformance of defensives vs cyclicals, of growth vs value stocks, as well as of low volatility stocks.
� All these trends have reversed in mid-2016 with the increase in bond yields and inflation expectations.
� It’s always nice to catch a momentum, but avoiding to be caught up in it is nicer.

13FinLight Research | www.finlightresearch.com
EQUITY
� Our equity outlook remains cautious as we see headwinds from the resumption of the Fed ratehike cycle and a strong Dollar.
� The US equity valuation picture has hardly changed since last quarter. Whatever metrics we consider, US stocks look expensive, making the pressure to deliver a positive earnings growth very substantial
� US equities seem priced for a rebound in earnings growth, but hardly for a stronger dollar, nor for higher treasury yields…
� The question is how far can bond yields and/or inflation expectations rise without damagingequities. In our view, this will depend on the pace of the move. At some level, we expect thecorrelation between bonds and stocks to become positive enough to weigh on equity prices.
14FinLight Research | www.finlightresearch.com
EQUITY
� Bottom line :� De-risking should continue. A higher allocation to cash is sensible, especially as bonds loose
some of their diversification role. We believe equities are likely to outperform bonds over the next 12 months
� We adjust our positioning rules on the S&P 500 as follows: � We will turn Neutral again after a clean break below the uptrend through the lows since
Feb.’16 (~2210)� We will switch to UW as soon as the 2170 level is materially broken to the downside. � Any clean break below the ‘09 trend would make us move massively short
� We like the low US beta. We remain Neutral Japan and UW Europe vs. US. � We remain UW Europe because of elevated political uncertainty and uncertainty on ECB policy
� We remain UW in US small caps vs large caps. � We remain Neutral value vs growth stocks, and OW defensives vs cyclicals� Given the new configuration of yields and inflation expectations, we prefer stocks with strong
balance sheets and low inflation sensitivity � In our previous reports, we expressed the view that low vol/min vol stocks are increasingly
vulnerable. We maintain this view.
� A stronger USD, rising yields and a potential headwind to global trade (with more protectionism) are expected to lead to renewed pressure on EMs. LatAm is the most vulnerable EM region to these factors, specially US dollar strengthening. We remain UW EMs vs DMs.
15FinLight Research | www.finlightresearch.com
US Earnings
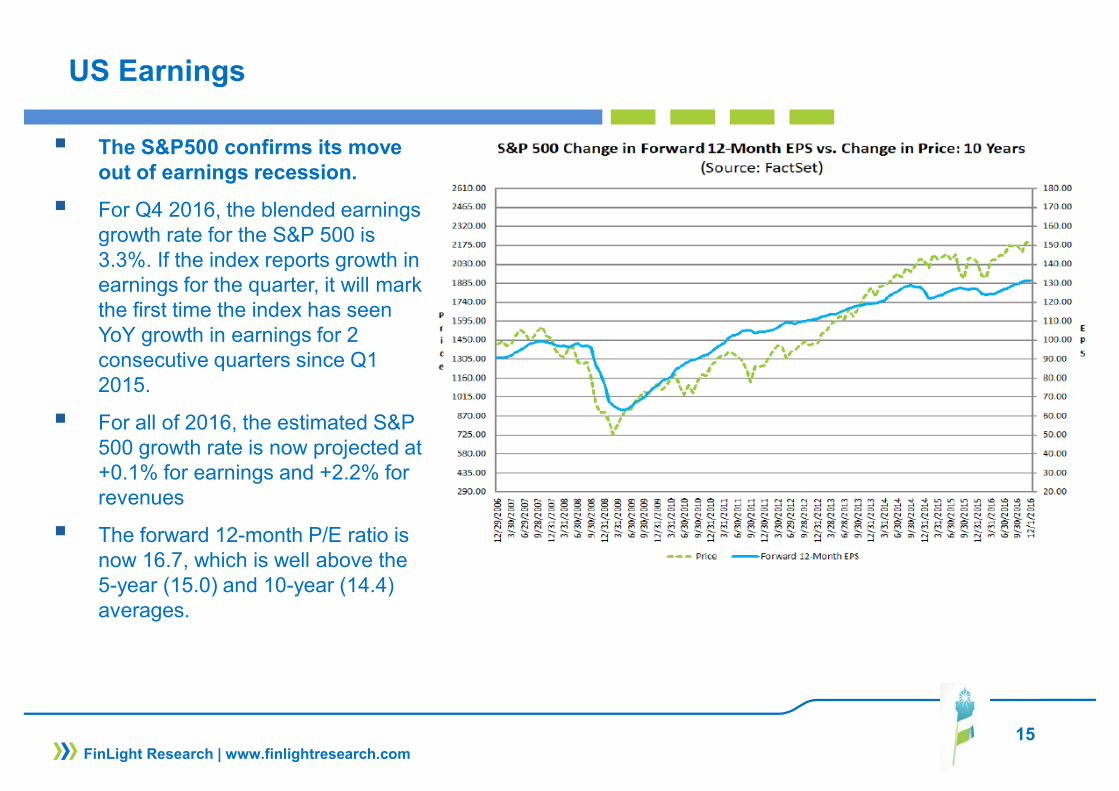
� The S&P500 confirms its move out of earnings recession.
� For Q4 2016, the blended earnings growth rate for the S&P 500 is 3.3%. If the index reports growth in earnings for the quarter, it will mark the first time the index has seen YoY growth in earnings for 2 consecutive quarters since Q1 2015.
� For all of 2016, the estimated S&P 500 growth rate is now projected at +0.1% for earnings and +2.2% for revenues
� The forward 12-month P/E ratio is now 16.7, which is well above the 5-year (15.0) and 10-year (14.4) averages.

16FinLight Research | www.finlightresearch.com
US Earnings
� Currently, the gap between the earnings yield (E/P) and bond yield stands at 3.5%
� The gap is above the above the long-term average of 2.5%, but still below the 10-year average of 4.5%
� With UST yields moving up, we expect the yield gap to continue its narrowing.

17FinLight Research | www.finlightresearch.com
US Equity – The Credit Balance View
� The Credit Balance is the sum of Free Credit Cash Accounts and Credit Balances in Margin Accounts minus Margin Debt.
� As margin debt decreased, the credit balance diverged from the market index.
� The divergence has been notable since the start of the year and may be the precursor to a major market decline like in 2000 and 2007.
� But the picture remains biased by the CB interventions and massive QEs
18FinLight Research | www.finlightresearch.com
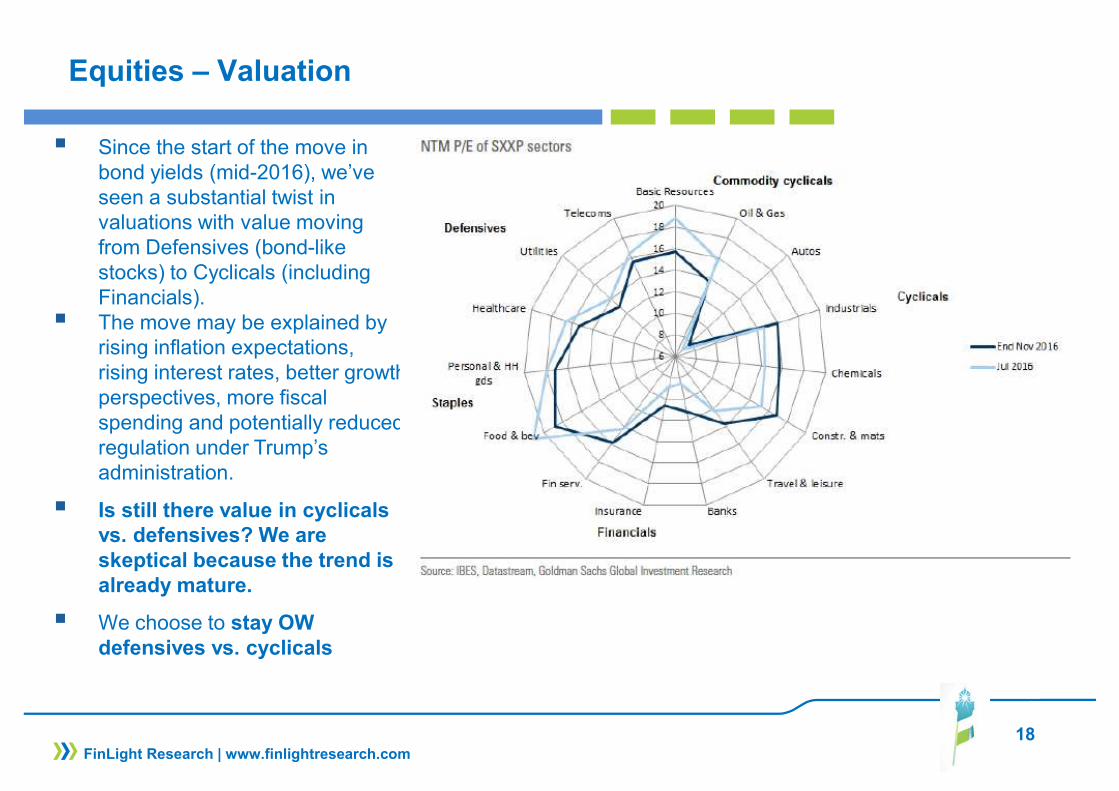
Equities – Valuation
� Since the start of the move in bond yields (mid-2016), we’ve seen a substantial twist in valuations with value moving from Defensives (bond-like stocks) to Cyclicals (including Financials).
� The move may be explained by rising inflation expectations, rising interest rates, better growth perspectives, more fiscal spending and potentially reduced regulation under Trump’s administration.
� Is still there value in cyclicals vs. defensives? We are skeptical because the trend is already mature.
� We choose to stay OW defensives vs. cyclicals

19FinLight Research | www.finlightresearch.com
S&P500 – A Long-Term Perspective
� Equity markets still appear at lofty valuations on virtually any and every historical valuation metric
� At the end of November, the average of the 43indicators we use stands at 71%, not far below its interim peak of 78% in Feb. ‘15
� All these indicators suggest a cautious long-term outlook and weak long-term return expectations � These measures are consistent with flat (0%) 12 year S&P 500 nominal total returns

20FinLight Research | www.finlightresearch.com
S&P500 – A Medium-Term Perspective
� The SPX has been through the 2219 resistance, reintegrating the uptrend through the lows since Feb ’16.
� The move was impulsive enough to breach the following resistance at 2250.
� The market seems able to have another impulse towards 2390 – 2450.
� According to our positioning rules, we’ve turned OW as the index broke above the 2170 –2190 range.
� We will turn Neutral again after a clean break below the uptrend through the lows since Feb.’16 (~2210)
� We will switch to UW as soon as the 2170 level is materially broken to the downside.
21FinLight Research | www.finlightresearch.com
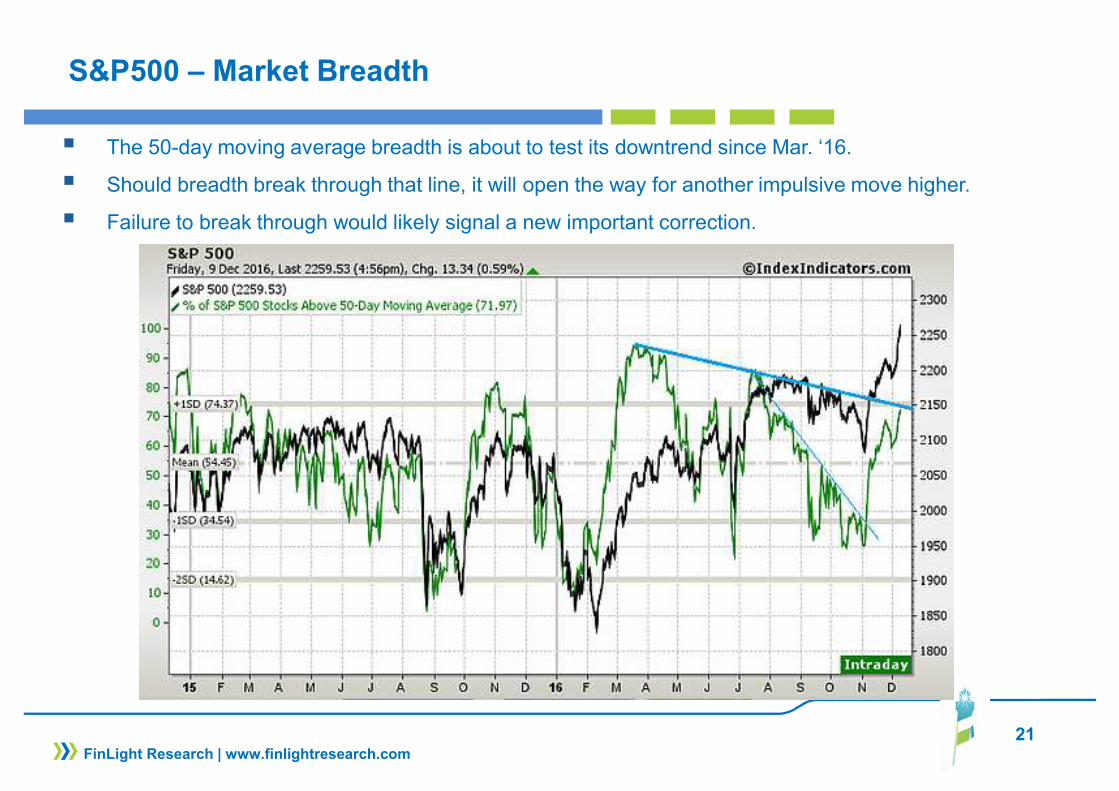
S&P500 – Market Breadth
� The 50-day moving average breadth is about to test its downtrend since Mar. ‘16.
� Should breadth break through that line, it will open the way for another impulsive move higher.
� Failure to break through would likely signal a new important correction.
22FinLight Research | www.finlightresearch.com
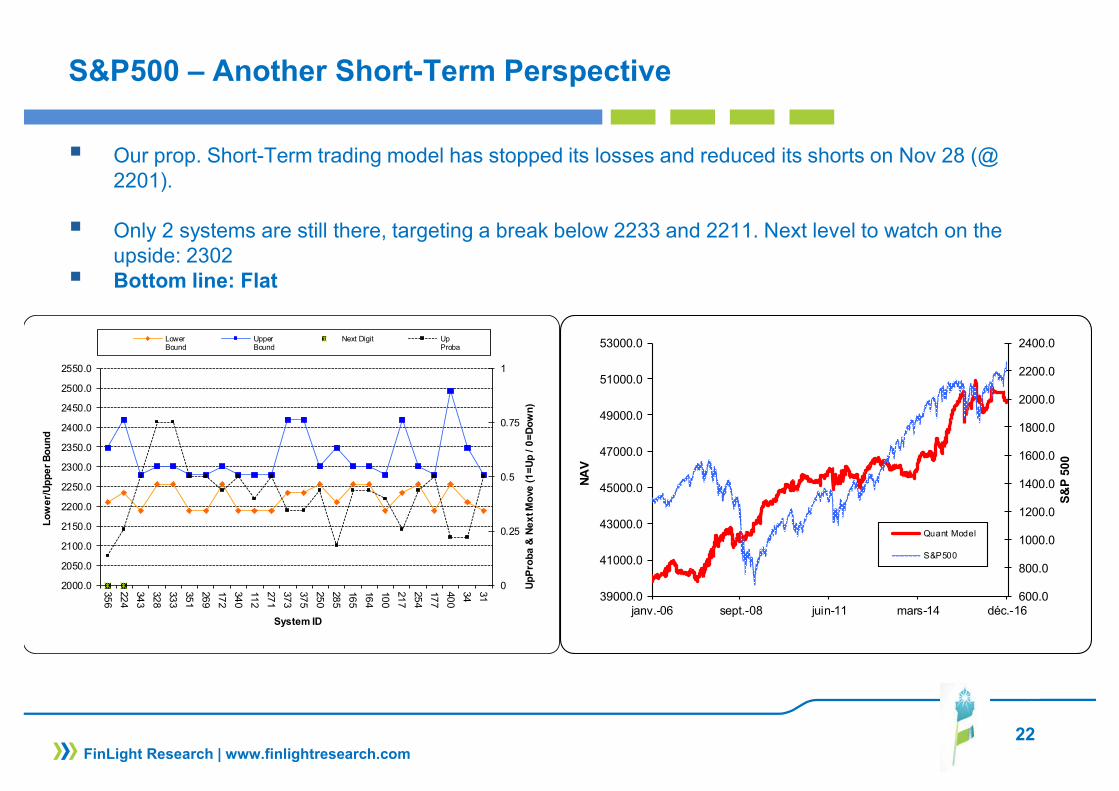
S&P500 – Another Short-Term Perspective
� Our prop. Short-Term trading model has stopped its losses and reduced its shorts on Nov 28 (@ 2201).
� Only 2 systems are still there, targeting a break below 2233 and 2211. Next level to watch on the upside: 2302
� Bottom line: Flat
0
0.25
0.5
0.75
1
2000.0
2050.0
2100.0
2150.0
2200.0
2250.0
2300.0
2350.0
2400.0
2450.0
2500.0
2550.0
35
6
22
4
34
3
32
8
33
3
35
1
26
9
17
2
34
0
11
2
27
1
37
3
37
5
25
0
28
5
16
5
16
4
10
0
21
7
25
4
17
7
40
0
34
31
Up
Pro
ba
& N
ex
t M
ove
(1
=U
p / 0
=D
ow
n)
Lo
we
r/U
pp
er
Bo
un
d
System ID
LowerBound
UpperBound
Next Digit UpProba
600.0
800.0
1000.0
1200.0
1400.0
1600.0
1800.0
2000.0
2200.0
2400.0
39000.0
41000.0
43000.0
45000.0
47000.0
49000.0
51000.0
53000.0
janv.-06 sept.-08 juin-11 mars-14 déc.-16
S&
P 5
00
NA
V
Quant Model
S&P500
23
FIXED INCOME & CREDIT
GOVIES
� Global sovereign bond yields bottomed in early July and have been on a steadily increasing trend since then. The yield curve has been steepening globally over the last several weeks.
� The bond market has started to price in a macroeconomic landscape of higher inflation and interest rates.
� The end of the 35 year bull market in bonds is looming. Reflation momentum is picking up.
� We expect the Fed will hike interest rates in December and three additional times in 2017, probably pushing the 10-year US Treasury yields to 2.65%. – 2.75%
� The dramatic move in bond yields (in terms of level and slope) is coming from reduced recession risks and higher inflation expectations. Is that a bull signal for the economy?
� We’ve turned to UW on 10y-USTs since the 1.85 resistance was breached.
� We keep our long steepeners position.
� We expect the rise in the US to exert upward pressure on other European yields.
� We remain Underweight US 10-year bonds vs. Germany as reflation pressures are much more focused on the US.
FinLight Research | www.finlightresearch.com
24
FIXED INCOME & CREDIT
INFLATION-LINKED
� Like Treasury yields, implied inflation have taken a sharp turn higher in recent weeks
� The transition from a deflation-prone world to a more inflationary world seems underway. The Trump election victory just strengthens these trends
� We like being long breakeven inflation in the US, given the supportive macroeconomic backdrop and record retail demand for TIPS. We remain OW 10y-TIPS.
� We remain Neutral HICP Inflation as we see breakevens trading sideways
FinLight Research | www.finlightresearch.com
25
FIXED INCOME & CREDIT
CORPORATE CREDIT
� Corporate credit total returns have been surprisingly strong in H2-2016, particularly in High Yield in both Europe and the US. But credit investors should be more cautious going forward.
� IG spreads adjusted for leverage and HY default-adjusted spreads have rarely been tighter
� We are cautious on credit, despite the fact that it may continue to outperform from here on a more favorable macro and earning backdrop.
� The risk of an inflation upside surprise pushing both spreads and rates higher has increased. Higher Treasury yields would make the “search for yield” argument for credit less attractive.
� Credit is expensive relative to the fundamentals. the only way to rationalize current valuations is to assume a benign default environment for several years, which seems improbable.
� Furthermore, fundamentals are clearly showing signs of deterioration in the credit cycle: Lending conditions have tightened and leverage is very high
� We still see significant demand for US spread products given the differential between USD fixed income markets and the rest of the G10 complex. As a confirmation, EUR spreads have sharply underperformed their USD counterparts since early November,
� Despite the fact that fundamentals appear weaker in the US than in Europe, we remain overweight US vs EUR credit (more on IG than HY) because of (1) our perception of European credit as being riskier, (2) the substantial relative carry advantage of USD vs EUR and (3) the fact that the re-leveraging cycle looks more mature in the US..
FinLight Research | www.finlightresearch.com
26
FIXED INCOME & CREDIT
� In high yield, we keep our bias towards higher quality as we don’t think this is the point in the cycle to reach for yield. Any unpriced rate hike (and/or dollar strengthening) would weigh on low quality bonds (High Yield and EM debt). We remain UW on HY and Neutral on IG.
EM DEBT
� The dollar strengthening is on track and would weigh on EM debt
� We remain Neutral on EM bonds, because of all the macro challenges facing the EM economies at a time when the Fed is likely to be more hawkish
� Bottom line : We change nothing to our views: UW Govies, UW US vs Eurozone Govies, long steepeners on the US yield curve, remain short duration in 2y USTs, UW credit mainly through HY and Neutral on IG (duration hedged), UW Eurozone vs US in IG & HY credit, OW 10y-TIPS breakevens and Neutral HICP Inflation, UW High Yield vs High Grade, Neutral on EM sovereigns with a little preference for hard currencies bonds.
FinLight Research | www.finlightresearch.com

27
US Govies – 10y UST
� According to our positioningrules, we’ve moved fromNeutral to UW 10y USTs asthe 10y yield breached 1.80.
� Despite the recent stagnation,the underlying trend in yields isstill intact. 2.30 is the level towatch closely.
� We remain UW 10y USTs.
� Our positioning rules areadjusted as follows:� Remain UW above 2.30,
targeting 2.65� Neutral between 1.65 and
2.30� OW below 1.65� Move to Neutral again
around 1.25
FinLight Research | www.finlightresearch.com

28
US Govies – Curve Slope
� End of September, we’ve decided to get out of our long flatteners on the US yield curve, a position we’ve been in since Dec. ’14
� A month later, we switched to a long steepeners positioning.
� Since then, the 10y/2y spread has surged in an impulsive way, gaining 50bps in just two weeks following the US election
� The curve has steepened despite the fact the short part of the curve is trading at the highest levels in more than five years.
� We keep our long steepeners for the moment.
FinLight Research | www.finlightresearch.com

29
US Govies – 10y TIPS
� The 10-year nominal UST yield jumped by 50 bp in just a few weeks.
� The move in UST yields was mainly driven by higher inflation expectations.
� It’s worth noting that with output and employment almost at full capacity, the inflationary risk is no more negligible.
� Like Treasury yields, implied inflation have taken a sharp turn higher.
� The 10-year breakeven inflation rose by 20 bps to 1.9% in few days, which marks the highest level since Apr. ‘15.
FinLight Research | www.finlightresearch.com

30
US Credit
� The macro environment remains supportive for credit.
� Nevertheless, we expect any further credit spread compression from here (in the US, like in the Eurozone) to be modest
� Credit spreads should be able to digest higher rates as far as the move is not too sharp.
� The risk to this benign view is that of an inflationary shock and a bonds sell-off.
FinLight Research | www.finlightresearch.com

31
US Credit - Fundamentals
� The macro environment remains supportive for credit. But the micro environment less…
� The balance sheets for S&P500 firms have deteriorated over the past two years.
� The median net debt to EBITDA ratio has risen to its highest level since the 90s.
� Interest coverage ratio remains high, but has been declining over the past two years.
FinLight Research | www.finlightresearch.com
32
US vs EUR Credit
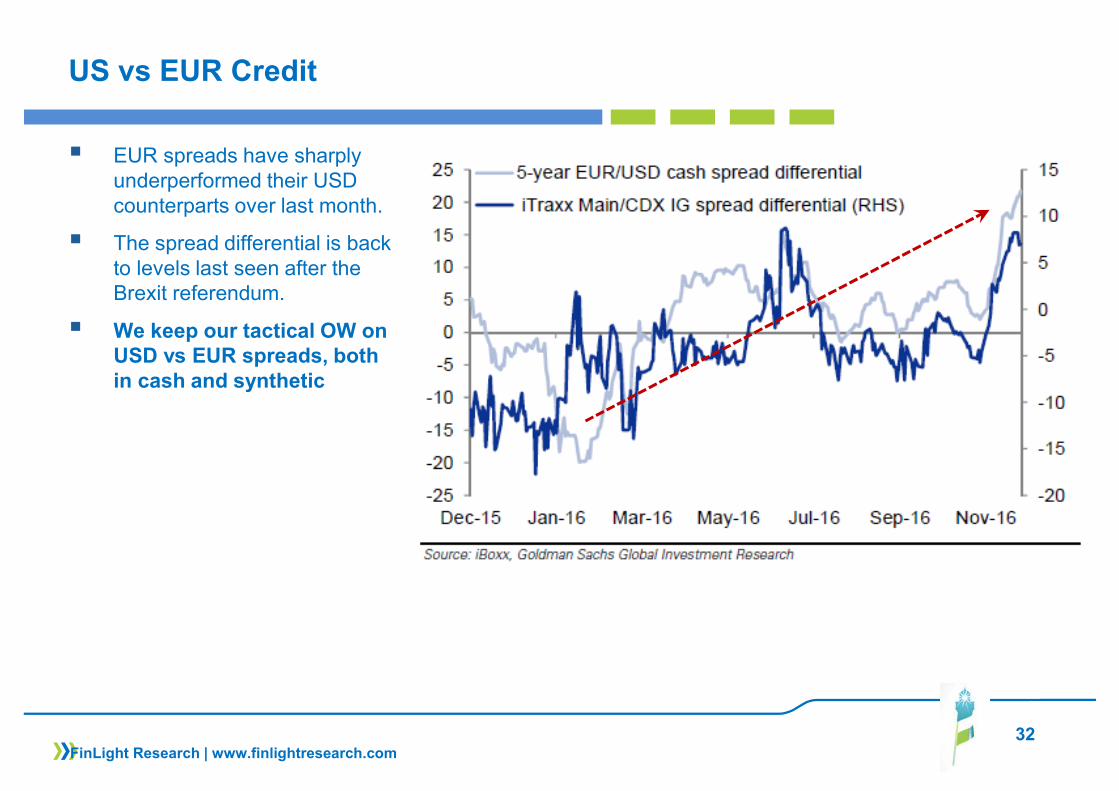
� EUR spreads have sharply underperformed their USD counterparts over last month.
� The spread differential is back to levels last seen after the Brexit referendum.
� We keep our tactical OW on USD vs EUR spreads, both in cash and synthetic
FinLight Research | www.finlightresearch.com

33
EXCHANGE RATES
� Central banks remain the key driver of foreign exchange,
� We have remained Dollar bulls since early 2014. Our rationale was based on the divergence ingrowth / inflation and its ability to move rate differentials in favor of the Dollar.
� The technical and fundamental pictures favor a continuation of the dollar rally.� Trump’s planed tax cuts on offshore profits could, if implemented, provide an additional support to the
Dollar by encouraging the repatriation of these profits .
� The dollar index (DXY) remains bullish. As expected, its break above the previous highs and the majorresistance at 100 has opened the way towards 103-103.50
� EUR-USD remains under pressure. We keep our UW positioning for the moment, and maintain our downside projections towards 1.04-parity.
� For that, we need to break throughout the successive supports at 1.0530 (critical), 1.0460 (Mar ’15 lows) and 1.0360
� Our positioning rules are adjusted as follows:� Remain UW below the 1.09 level� Move to Neutral within the 1.09 - 1.14 range� Move to OW if the spot breaks above the 1.14 resistance to target 1.18
FinLight Research | www.finlightresearch.com
34
EXCHANGE RATES
� The core driver for USD-JPY continues to be the relationship between US and Japanese real yields� On USD-JPY, we’ve been OW since the spot broke above 104 (Oct. 11th). All our targets (108, 111,
113) was reached.
� We adjust our positioning rules on USD-JPY as follows:� Remain OW above 111.60 and target 116.30 and 118.60� Move to Neutral below� Only a break below the downtrend from Jan. ‘16 and bearish momentum, would make us move to
UW
� EM currencies have weakened since the middle of August as Fed risks have been repriced. � We maintain our view that pressure on EM currencies will resume and continue until we see a more
constructive / fundamental improvement for global growth and commodities supply/demand imbalances.
� We remain UW EM and Commodity FX. We keep a bullish bias on the USD-CNY (targeting 7.00-7.20) as we expect China to fix (progressively) the RMB lower to keep its competiveness.
FinLight Research | www.finlightresearch.com

35
US Dollar
� As expected, the break above the previous highs and the significant resistance of 100 has opened the way towards 103-103.50.
� The Dollar Index was boosted by the jump in UST yields and the induced USD-G3 spread widening
FinLight Research | www.finlightresearch.com

36
EUR-USD
� Technically, EUR-USD remains under pressure.
� We keep our UW positioningfor the moment, and maintainour downside projections towards1.04-parity.
� For that, we need to breakthroughout the successivesupports at 1.0530 (major),1.0460 (Mar ’15 lows) and 1.0360
FinLight Research | www.finlightresearch.com

37
USD-JPY
� The USD-JPY Yen hassoared since the USelection.
� We’ve been OW since thespot broke above 104 (Oct.11th). All our targets (108,111, 113) was reached.
� We adjust our positioningrules on USD-JPY asfollows:� Remain OW above
111.60 and target116.30 and 118.60
� Move to Neutral below� Only a break below the
downtrend from Jan.‘16 and bearishmomentum, wouldmake us move to UW
FinLight Research | www.finlightresearch.com
38
COMMODITY
� We continue to view upward moves since Jan. ‘16 more as technical adjustments than as a fundamentally-driven ones.
� Furthermore, the contango curve structure has weighed on total returns over the whole year;
� But the current move to backwardation (implying positive roll returns) makes commodities more attractive from an asset-allocation perspective. Thus, we decide to turn (tactically) Neutral on the asset class as a whole, and wait for a better view on growth/inflation to move the cursor.
� In order to be more constructive on commos, we would need a weaker US dollar, a higher global growth, and stronger investment flows (rather than hot money).
� We don’t see any sustainable recovery without a pick-up in global growth or a material tightening on the supply side. It is likely that supply destruction (due to pull-back in capital investment) will be the main catalyst for the next sustainable recovery in prices.
� We also expect a considerable volatility along the way
� We remain UW commodities over a 6 months horizon� The supply side has adjusted but still has a way to go in many commodities before erasing
current imbalances. In order to get more cuts in supply, we think there needs another legdown in prices to force capitulation
� US dollar strengthening should weigh on prices. Dollar will dictate both direction and velocityin commos. We expect the stronger dollar to put downward pressure on commodities despitesupportive fundamentals for some of them
FinLight Research | www.finlightresearch.com

39
COMMODITY
� Bottom Line :Energy:
� The short squeeze in oil continues with the OPEC’s deal in Vienna. But prices seem capped as many producers have increased their hedging activities.
� While supporting oil prices, OPEC’s agreement could encourage unconventional oil producers to rump up investments and increase production, pushing prices lower again.
� $40-$50 per barrel remains the range for WTI over the short-term. Only an unexpected exogenous event could cause oil to break out of it, on one side or the other..
� We actually expect the spot to test again the 30 level before putting in a permanent rebound. At this stage, we watch a few key levels ($52, $40, $36, $31). We need to see how the price behaves around these levels to make our projections.
� Our bearish bias is still intact. Only a material break above 52.5 would open scope for a rally.
� According to our positioning rules, we’ve turned from Neutral to UW as the spot broke bellow the $49.8-$50 area (end of October), and then to Neutral again as the spot reintegrated the triangle formedsince June.
� Our tactical rules are adjusted as follows:� Move to OW above $52.5 (to target 60 – 65) or below $29 (to play the rebound).� Remain Neutral as long as the spot stays in the triangle formed since June� Move to UW if the triangle is broken to the downside.
FinLight Research | www.finlightresearch.com
40
COMMODITY
Precious Metals:
Outlook for precious metals continues to be dominated by Fed rhetoric, macroeconomic and political uncertainties and the subsequent impact on US dollar, real yields and sovereign credit.
� Our baseline outlook for gold / silver prices has not changed. We are bullish precious metals over the long-term , no matter what happens (on US dollar, China, growth…)!
� But, we still think that lower lows can be seen before the next bullish phase takes place.
� In November, we saw massive flows out of precious metals funds / ETFs, weighing on prices. Fed’s clear message for a December hike has accentuated the move.
� Over the short-term, we expect the precious metal to trade lower over the next months as US dollar rates go higher. We are not far from the target range of $1,100-1,150 that we’ve mentioned one month ago.
� The risk to our view is that the Trump’s Administration decides to implement its trade protectionist plans,inducing trade conflicts and threatening global growth.
� Applying our positioning rules (please have a look to our previous Monthly Reports), we’ve switched toUW as the spot broke below 1210 (on Nov 22)
� Our positioning rules are adjusted :� Go Neutral between 1180 and 1300� Go OW above 1300, targeting 1380 and even 1430� Go OW below 1070
FinLight Research | www.finlightresearch.com

41
COMMODITY
Base Metals: .
� The rally in industrial metals was much stronger than anticipated. The S&P GSCI Industrial Index is back to its Jan. ‘15 level, on a TR basis.
� Our UW positioning has proved dramatically wrong. But it is too late to change it, as we missed the November move.
� During November, we’ve already seen a major re-basing in metals prices on hopes of growth and reflationary-driven exuberance. But we feel skeptical about the ability of Trump’s announced fiscal / infrastructure spending to be a fundamental game changer to industrial metals. We still think these announced plans will be of limited impact on US growth over the next two years.
� Considering a more realistic growth outlook for both China and the US, we see a lot of risks to this ambient bullishness, especially on oversupplied markets like copper and aluminum.
� We believe that lower prices are still needed to induce more supply adjustments, even with stronger Chinese demand forecasts.
� We remain UW on base metals and avoid Copper in particular.
FinLight Research | www.finlightresearch.com
42
COMMODITY
Agriculture:
� As said in our previous reports, and despite more evidence of consumption growth (supported by an improving global growth), sizable inventories should keep grain prices in a low trading range through the winter.
� Furthermore, the US harvest ended up the largest on record for both corn and soybeans, which may go back to their respective costs of production.
� We think that grains prices are nearing a floor. But we choose to remain Neutral, with an UW bias on corn and soybeans.
FinLight Research | www.finlightresearch.com
43
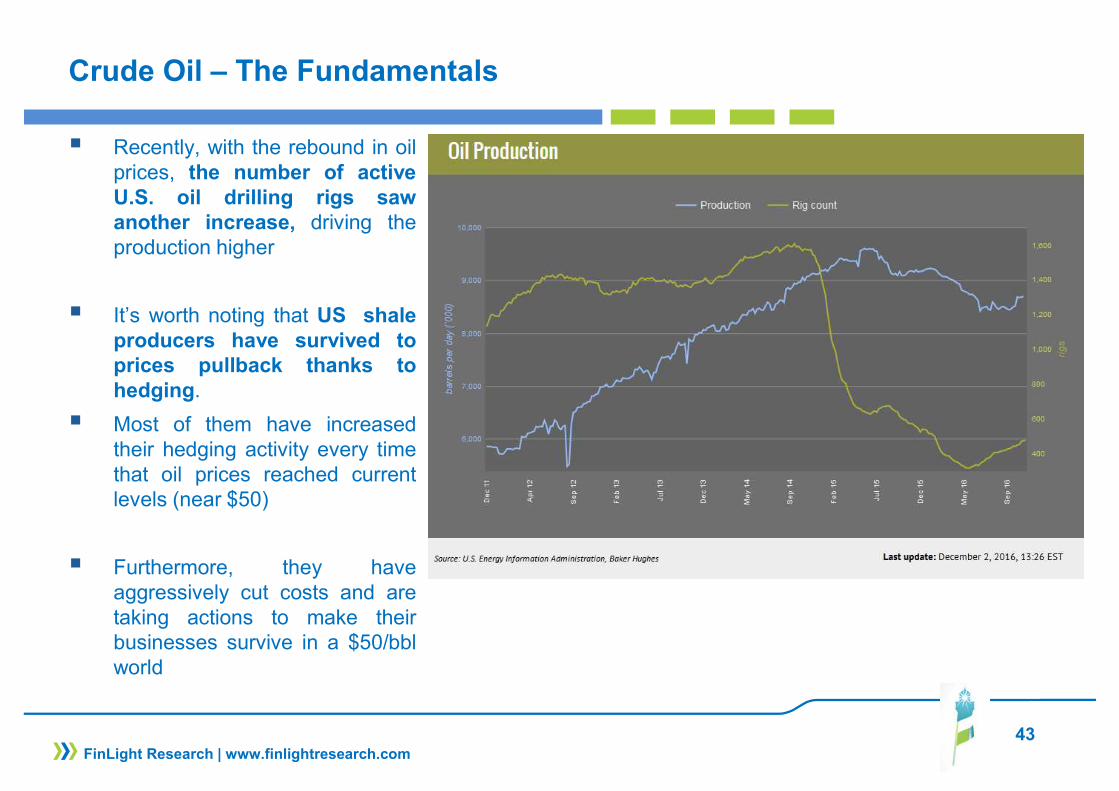
Crude Oil – The Fundamentals
� Recently, with the rebound in oilprices, the number of activeU.S. oil drilling rigs sawanother increase, driving theproduction higher
� It’s worth noting that US shaleproducers have survived toprices pullback thanks tohedging.
� Most of them have increasedtheir hedging activity every timethat oil prices reached currentlevels (near $50)
� Furthermore, they haveaggressively cut costs and aretaking actions to make theirbusinesses survive in a $50/bblworld
FinLight Research | www.finlightresearch.com
44
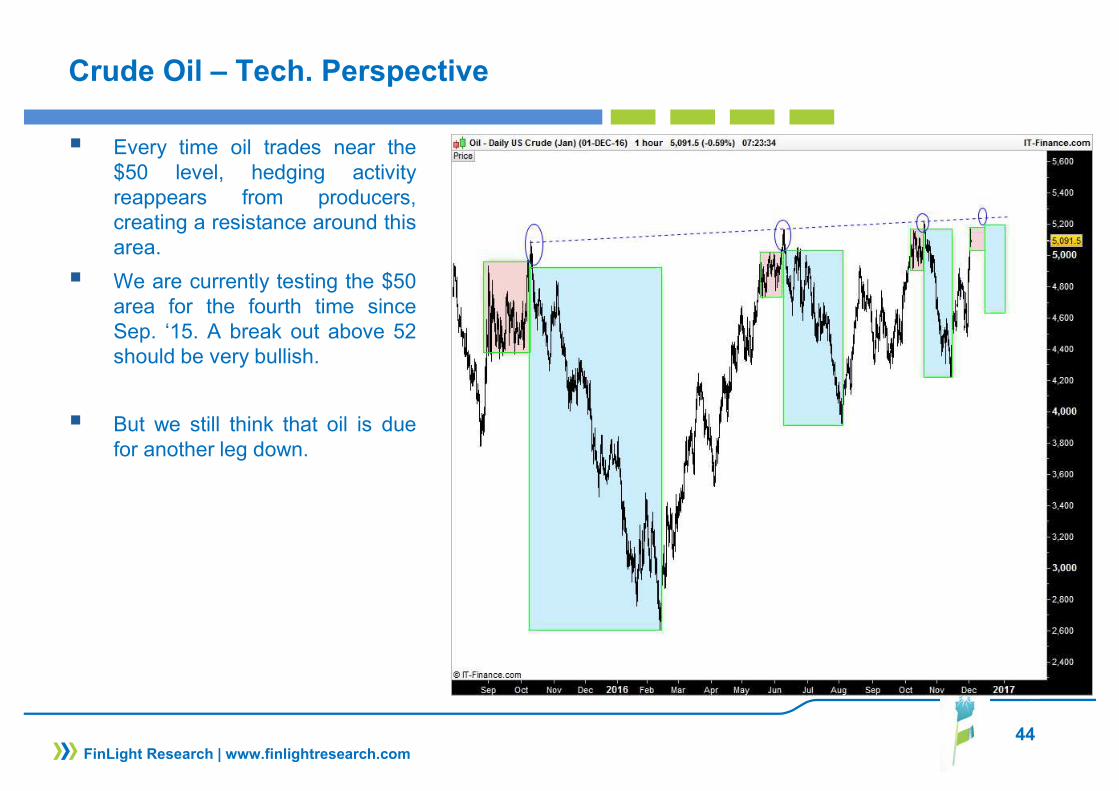
Crude Oil – Tech. Perspective
� Every time oil trades near the$50 level, hedging activityreappears from producers,creating a resistance around thisarea.
� We are currently testing the $50area for the fourth time sinceSep. ‘15. A break out above 52should be very bullish.
� But we still think that oil is duefor another leg down.
FinLight Research | www.finlightresearch.com
45
Crude – Tech. Perspective
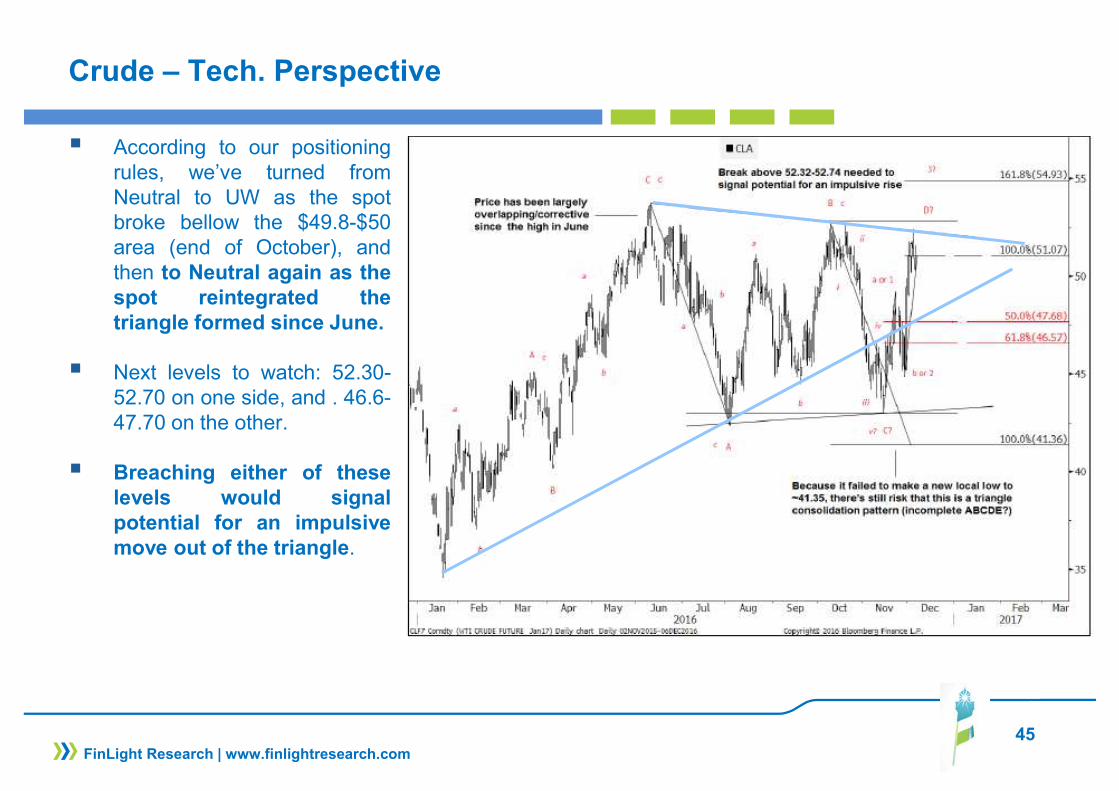
� According to our positioningrules, we’ve turned fromNeutral to UW as the spotbroke bellow the $49.8-$50area (end of October), andthen to Neutral again as thespot reintegrated thetriangle formed since June.
� Next levels to watch: 52.30-52.70 on one side, and . 46.6-47.70 on the other.
� Breaching either of theselevels would signalpotential for an impulsivemove out of the triangle.
FinLight Research | www.finlightresearch.com

46
Crude Oil – The USD Effect
� Over the past few month, we’ve seen the oil breaking its historical correlation to the US dollar.
� With our bullish view on the dollar, we expect the correlation to rebuild again, pushing the oil down to $30-$35/bbl
FinLight Research | www.finlightresearch.com

47
Gold – Market Flows
� November saw massive fundflows out of precious metalfunds
� ETFs have liquidated over 4.5Mounces of gold in the past 6weeks
� Almost $6 billion dollars werepulled out precious metals fundsin November, a number lastseen in 2013
FinLight Research | www.finlightresearch.com
48
Gold – Market Flows
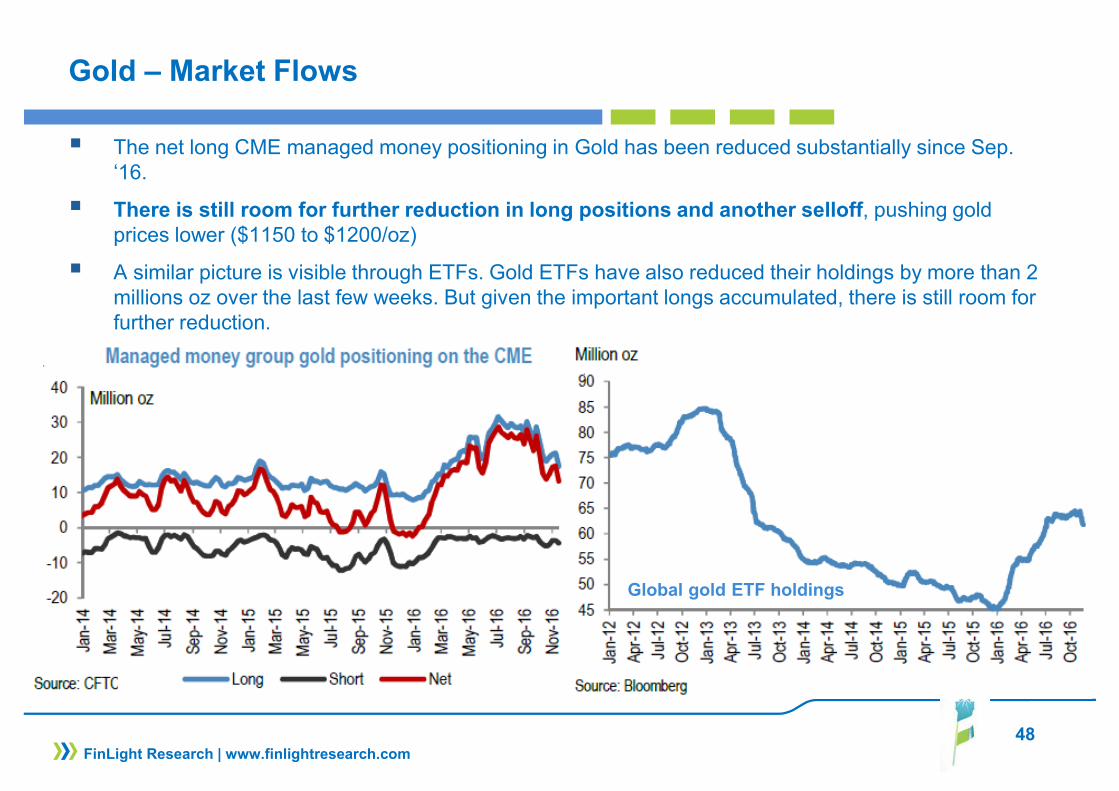
� The net long CME managed money positioning in Gold has been reduced substantially since Sep. ‘16.
� There is still room for further reduction in long positions and another selloff, pushing gold prices lower ($1150 to $1200/oz)
� A similar picture is visible through ETFs. Gold ETFs have also reduced their holdings by more than 2 millions oz over the last few weeks. But given the important longs accumulated, there is still room for further reduction.
FinLight Research | www.finlightresearch.com
Global gold ETF holdings
49
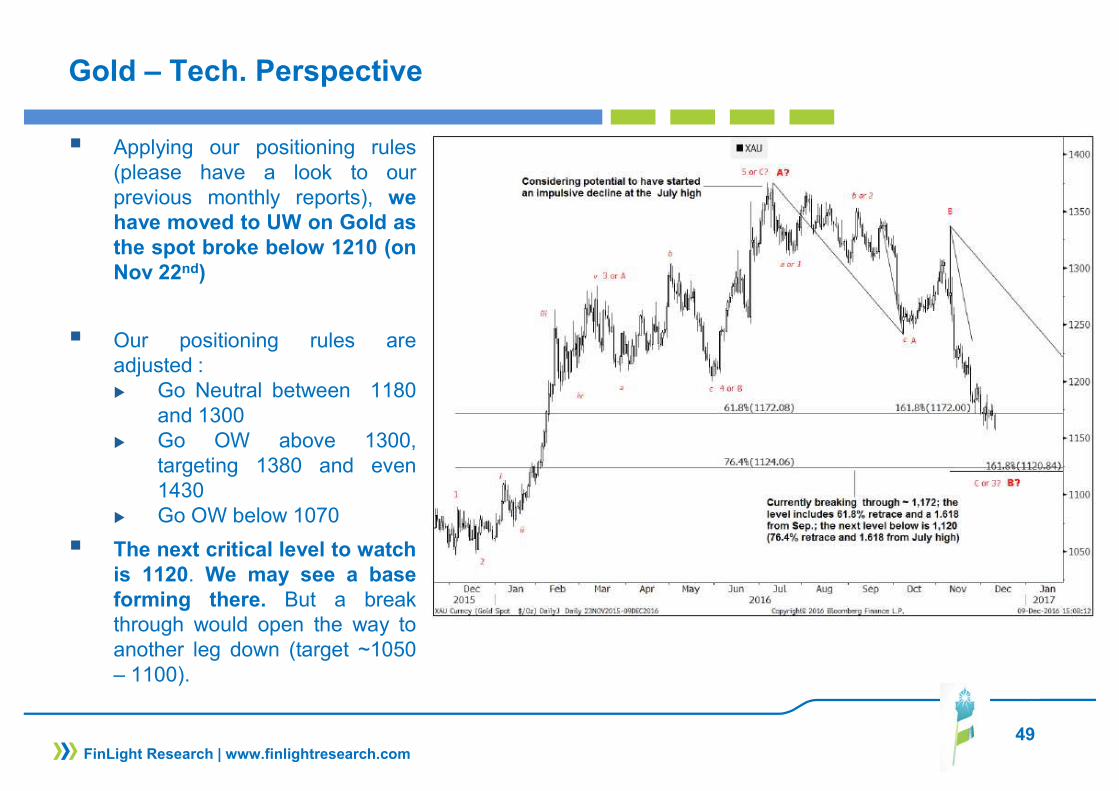
Gold – Tech. Perspective
� Applying our positioning rules(please have a look to ourprevious monthly reports), wehave moved to UW on Gold asthe spot broke below 1210 (onNov 22nd)
� Our positioning rules areadjusted :� Go Neutral between 1180
and 1300� Go OW above 1300,
targeting 1380 and even1430
� Go OW below 1070
� The next critical level to watchis 1120. We may see a baseforming there. But a breakthrough would open the way toanother leg down (target ~1050– 1100).
FinLight Research | www.finlightresearch.com
50
ALTERNATIVE STRATEGIES
� In November, the Trump’s victory-driven expectations for better growth, more fiscal/infrastructure spending and reduced regulation has helped The HFRI Fund Weighted Composite Index to post gains of +0.9% MoM (+4.6% Ytd). The index is back to its May ‘15 level.
� Gains were lead Event-Driven strategy (+2.2% MoM, +9.4% Ytd) and Equity Hedge (+1.5% MoM)
� Macro hedge funds posted declines (HFRI Discretionary Thematic Index : -1.7% MoM, -1.8% Ytd) due to their short equities and long US bonds. They made money on their long Energy futures.
� CTAs were also off -0.5% MoM (-2.1% Ytd). CTAs’ exposures shifted dramatically over the recent weeks. They are now long Equities, short US bonds, long Energy and long Metals.
� We believe that diversifying portfolios with an increased allocation to alternatives is particularly attractive at this stage of the cycle, given the current macroeconomic and interest rate uncertainties.
� Within the hedge fund universe, we continue to prefer strategies with moderate market directionality (“risk diversifiers” type) such as L/S Equity Market Neutral, Global Macro and CTAs. The reason for that is: (1)Traditional asset classes look richly valued, (2) a risk-off environment could not be excluded at this stage of the cycle.
FinLight Research | www.finlightresearch.com
51
Equity Hedges & Dispersion
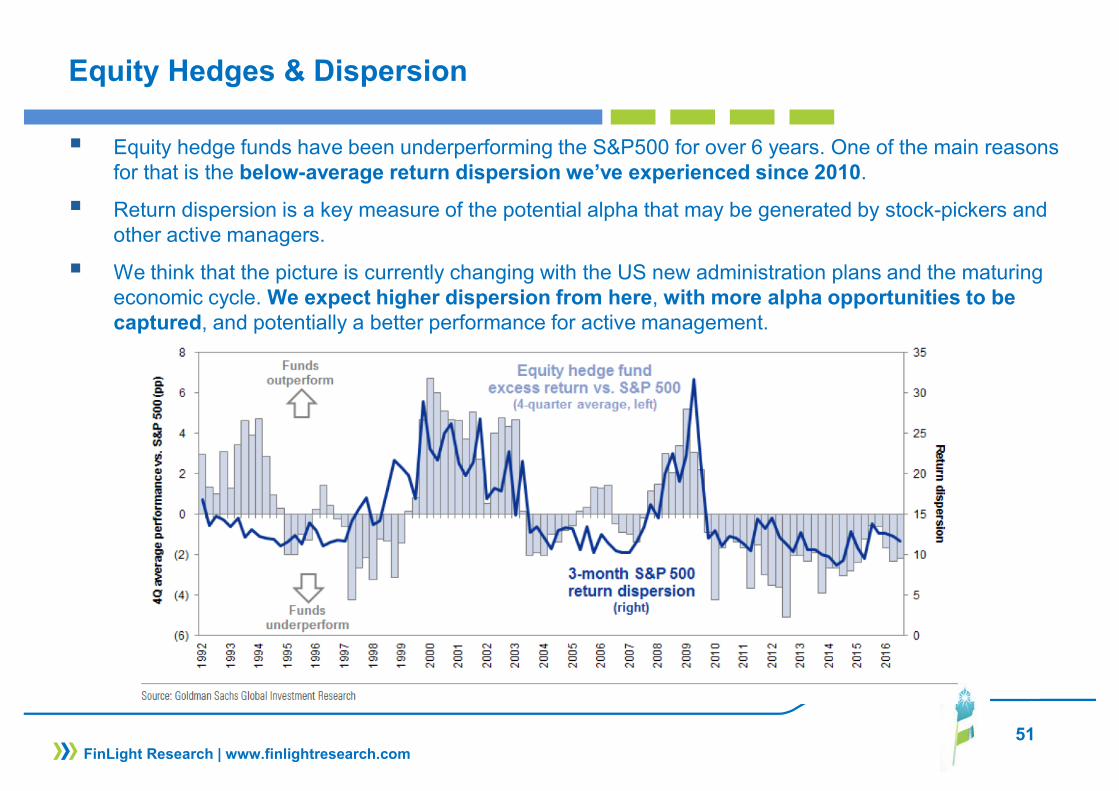
� Equity hedge funds have been underperforming the S&P500 for over 6 years. One of the main reasons for that is the below-average return dispersion we’ve experienced since 2010.
� Return dispersion is a key measure of the potential alpha that may be generated by stock-pickers and other active managers.
� We think that the picture is currently changing with the US new administration plans and the maturing economic cycle. We expect higher dispersion from here, with more alpha opportunities to be captured, and potentially a better performance for active management.
FinLight Research | www.finlightresearch.com
Bottom Line: Global Asset Allocation
� The recent string of economic data has been generally better thanexpected.
� The Trump’s rally is still going on. Nevertheless, we don't believe ithas any substance. No details are available about the incomingTrump Administration’s regulatory and policy changes, but marketshave rallied on the general view of lower taxes, more spending andfaster growth, downplaying the risks to other Trump's policies (tradebarriers…).
� The end of the 35 year bull market in bonds is looming. Reflation momentum is picking up. Is that a bull signal for the economy? Not sure…
� Rotation out of bonds is under way. But opportunities in other riskassets (equity, credit, commodities…) are limited given the currentvaluations.
� Credit is priced for a benign environment for several years. But wethinks it is moving out of the 'sweet spot‘ as we progressively get out ofultra-accommodative CB policy, ultra-low rates and ultra-low volatility.
� We still feel concerned with the major loss of liquidity we’ve seen in recent years. A higher market volatility would be the natural consequence.
� The VIX stands near its all-time lows despite the political / economicturmoil we expect in the future.
� We summarize our views as follows �
52FinLight Research | www.finlightresearch.com
09/12/2016 16/11/2016 14/10/2016
View View View
Dec'16 Nov'16 Oct '16
Equity OW N N
S&P 500 OW OW OW
Euro Stoxx 50 UW UW UW
NIKKEI 225 N N N
MSCI Emerging Markets UW UW UW
Fixed Income UW UW N
T-Note 10Y UW UW UW
Bund 10Y OW OW OW
US TIPS OW OW OW
Euro HICP N N N
Credit N N N
Inv. Grade N N N
US High Grade OW OW OW
EUR High Grade UW UW UW
High Yield UW UW UW
US High Yield OW OW OW
EUR High Yield UW UW UW
EM Sovereigns N N N
Forex N/A N/A N/A
EUR-USD UW UW UW
USD-JPY OW OW OW
Commodity N UW UW
Energy N UW N
Base Metals UW UW UW
Precious Metals UW N N
Agri N N N
Alternatives OW OW OW
Return Enhancers UW UW UW
Risk Diversifiers OW OW OW

53
Disclaimer
FinLight Research | www.finlightresearch.com
This writing is for informational purposes only and does not constitute an
offer to sell, a solicitation to buy, or a recommendation regarding any
securities transaction, or as an offer to provide advisory or other services
by FinLight Research in any jurisdiction in which such offer, solicitation,
purchase or sale would be unlawful under the securities laws of such
jurisdiction. The information contained in this writing should not be
construed as financial or investment advice on any subject matter.
FinLight Research expressly disclaims all liability in respect to actions
taken based on any or all of the information on this writing.

About Us…
� FinLight Research is a research-centric company focused on Asset Allocation from a top-down perspective, on Portfolio Construction, and all related quantitative aspects and risk management issues.
� Our expertise expands along 3 axes:
� Asset Allocation with risk control and/or risk budgeting techniques
� Allocation to alternative investments : Hedge funds, rule-based strategies (momentum, value, carry, volatility), real assets (real estate, infrastructure, farmland, timberland and natural resources). Private equity and venture capital should be the next step…
� Allocation with a factorial approach built on the understanding (profiling) of the risk/return drivers of the different asset classes
� FinLight Research is an innovation-oriented company. We target to fill the gap between the academic research and the investment community, especially on real assets and alternatives. We survey on a continuous basis the academic literature for interesting published and working papers related to quantitative investing, non-linear profiling, asset allocation, real assets...
54FinLight Research | www.finlightresearch.com
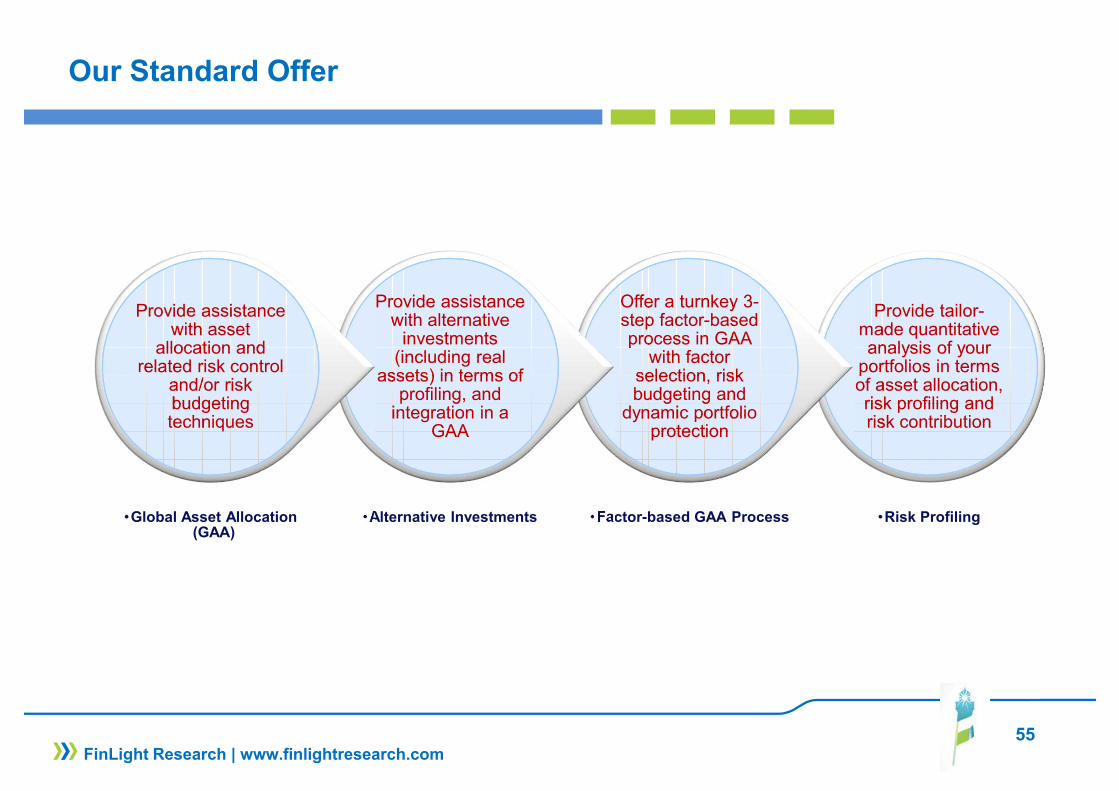
Our Standard Offer
Provide tailor-made quantitative analysis of your
portfolios in terms of asset allocation, risk profiling and risk contribution
Provide tailor-made quantitative analysis of your
portfolios in terms of asset allocation, risk profiling and risk contribution
•Risk Profiling
Offer a turnkey 3-step factor-based process in GAA
with factor selection, risk budgeting and
dynamic portfolio protection
Offer a turnkey 3-step factor-based process in GAA
with factor selection, risk budgeting and
dynamic portfolio protection
•Factor-based GAA Process
Provide assistance with alternative
investments (including real
assets) in terms of profiling, and
integration in a GAA
Provide assistance with alternative
investments (including real
assets) in terms of profiling, and
integration in a GAA
•Alternative Investments
Provide assistance with asset
allocation and related risk control
and/or risk budgeting techniques
Provide assistance with asset
allocation and related risk control
and/or risk budgeting techniques
•Global Asset Allocation (GAA)
55FinLight Research | www.finlightresearch.com