Embed Size (px)
Citation preview

A Krafty CombinationFebruary 3, 2010
Pershing Square Capital Management, L.P.
Disclaimer
The analyses and conclusions of Pershing Square Capital Management, L.P. ("Pershing Square") contained in this presentation are based on publicly available information. Pershing Square recognizes that there may be confidential information in the possession of the companies discussed in the presentation that could lead these companies to disagree with Pershing Square’s conclusions. This presentation and the information contained herein is not a recommendation or solicitation to buy or sell any securities.
The analyses provided may include certain statements, estimates and projections prepared with respect to, among other things, the historical and anticipated operating performance of the companies, access to capital markets and the values of assets and liabilities. Such statements, estimates, and projections reflect various assumptions by Pershing Square concerning anticipated results that are inherently subject to significant economic, competitive, and other uncertainties and contingencies and have been included solely for illustrative purposes. No representations, express or implied, are made as to the accuracy or completeness of such statements, estimates or projections or with respect to any other materials herein. Actual results may vary materially from the estimates and projected results contained herein. Accordingly, no party should purchase or sell securities on the basis of the information contained in this presentation. Pershing Square expressly disclaims liability on account of any party’s reliance on the information contained herein with respect to any such purchases or sales.
Funds managed by Pershing Square and its affiliates have invested in the equity of Kraft Foods. Pershing Square manages funds that are in the business of trading - buying and selling – securities and financial instruments. It is possible that there will be developments in the future that cause Pershing Square to change its position regarding the companies discussed in this presentation. Pershing Square may buy, sell, cover or otherwise change the form of its investment regarding such companies for any reason. Pershing Square hereby disclaims any duty to provide any updates or changes to the analyses contained here including, without limitation, the manner or type of any Pershing Square investment.
1

Kraft Foods
2
World’s 2nd largest food company
Recently acquired Cadbury (closing pending) at an attractive price
We believe the transaction will be transformational
Significantly improves Kraft’s business quality and organic growth profile
Investment thesis
Attractively priced business standalone…
…with a transformative event, catalyzing margin improvement and leading to earnings accretion and multiple re-rating
“Pro Forma Kraft/Cadbury” (or “PF Kraft”) currently trades at under 10x 2012 EPS
Recent stock price: $28
4% dividend yield
PF Kraft Market Cap:~$49bn
Assumes GBP / USD= 1.60 throughout presentation

Cadbury: Great Asset at a Good Price

Cadbury is an Attractive Asset
One of the great businesses of the world
Confectionary is a resilient food category
Good pricing power, very limited private label threat
Attractive competitive “moat”
Strong long-term global growth
Iconic brands (Dentyne, Trident, Cadbury, Halls)
Cadbury is extremely well positioned in emerging markets
>40% of sales in fast growing emerging markets
Distribution in emerging markets is difficult to greenfield
As a 186-year-old UK company, Cadbury has greatly benefited from UK’s colonial presence in parts of the emerging world
4

Cadbury is Currently Under-Earning
Cadbury’s current EBIT margins are only ~13.5%
Given the mix of categories (chocolate, gum and candy), we believe appropriate EBIT margins for CBRY should be in the mid-to-high teens
CBRY management has invested significantly in the companyIncreased marketing spend and built new R&D facilities
New plants in low-cost labor countries (only now coming on line) which should cut enormous waste out of the supply chain
Developed technologies which have not yet benefited the entire global portfolio (center-filled gum, candy-layered gum)
Recently launched core brands in “white spaces” (i.e., Trident in the U.K.)
These investments are currently pressuring Cadbury margins, but will lead to margin improvement and strong organic growth
Kraft should be the beneficiary of these investments, given the timing of its hostile takeover
5
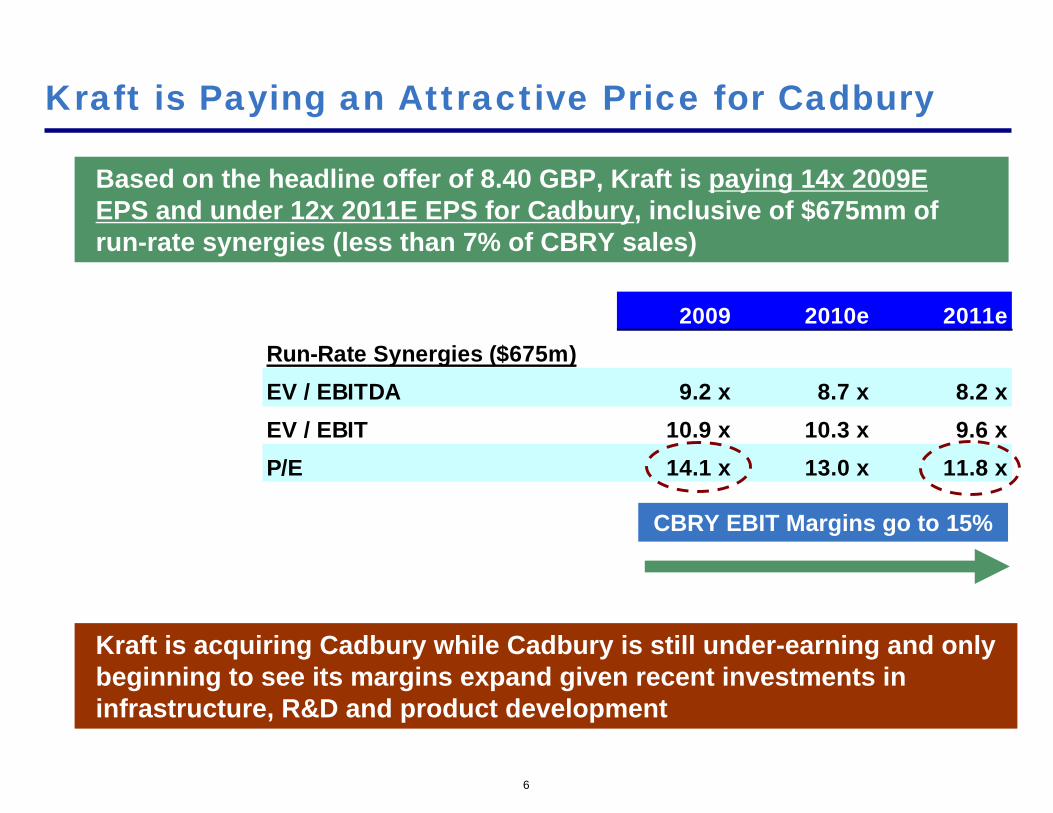
2009 2010e 2011eRun-Rate Synergies ($675m)EV / EBITDA 9.2 x 8.7 x 8.2 xEV / EBIT 10.9 x 10.3 x 9.6 xP/E 14.1 x 13.0 x 11.8 x
Kraft is Paying an Attractive Price for Cadbury
6
Based on the headline offer of 8.40 GBP, Kraft is paying 14x 2009E EPS and under 12x 2011E EPS for Cadbury, inclusive of $675mm of run-rate synergies (less than 7% of CBRY sales)
Kraft is acquiring Cadbury while Cadbury is still under-earning and only beginning to see its margins expand given recent investments in infrastructure, R&D and product development
CBRY EBIT Margins go to 15%
Kraft Standalone: SignificantMargin Opportunity

Kraft (Standalone)
8
United States: ~50% rev
Snacks (cookies, crackers)
Cheese
Beverages (coffee, drinks)
Grocery (mac & cheese, dressing, desserts, condiments)
Meals (cold cuts, lunchables)
Canada(1): ~10% Rev
Europe: ~20% Rev
Developing Markets: ~20%
1) Includes N.A. Foodservice revenues

Kraft Standalone: More Attractive Than Perceived
~40% of portfolio is Snacks (cookies, crackers, chocolate)
More than 80% of portfolio is from #1 share positions
Strong scale in US
~40% of revenue outside North America
More than 50% from categories where its marketplace position is twice the size of nearest competitor
Strong DSD distribution capabilities creates a significant competitive advantage versus other U.S. food companies
9
(Cookies, crackers, chocolate)
Note: Includes the N.A. Frozen Pizza business which was sold to Nestle
Snacks, 38.0%
Beverages, 20.0%
Cheese, 18.0%
Meals, 15.0%
Grocery, 10.0%

Kraft: Turnaround Opportunity
Yes, Kraft has been a turnaround story for years…In 2004 KFT started a major restructuring program focused on decentralizing its business and reducing overhead
Despite cost cuts, severe commodity inflation and the need for significant “catch up”R&D/marketing spend pressured margins down
Private brands pressured KFT’s pricing in many categories eroding margins even further
KFT today: Pershing Square view — Turnaround is achievableFixing a company like KFT (many brands, regions) often takes five+ years
Witness Cadbury, Unilever—only now seeing impact of several years of restructuring
Investors have lost patience –-hence why the turnaround is discounted in the stock price
Not just about cost cuts, but innovating and improving the brands through R&D and marketing
New CEO has made smart decisions regarding brand investment and portfolio M&A
Brands are better positioned today, given improved price/value equation and improved product quality
Significant opportunities still remain in COGS and overhead—however some of it should be reinvested in the business to strengthen brands
Clearly, MARGINS SHOULD BE MUCH HIGHER—we believe it’s a matter of time…
10

16.4 %15.3 % 14.8 %
13.2 % 12.8 %
14.3 %
19.1 %21.0 %
13.6 %
15.0 %
0.0 %
5.0 %
10.0 %
15.0 %
20.0 %
25.0 %
2002 2003 2004 2005 2006 2007 2008 2009e 2010e 2011e
Historical EBIT Margins
11
Kraft’s EBIT margins have dramatically fallen from 21% in ’02 to a low of 12.8% in ’08 due to misplaced investments, lack of marketing, pricing erosion, required catch-up R&D and commodity headwinds
Kraft’s target is for mid-teen (~15%) margins by 2011, driven by improved product quality/value, mix shift, supply chain efficiencies, SKU rationalization, and overhead productivity efficiencies. We believe this goal is achievable
11

17.7 % 17.7 %
14.6 %
16.4 %14.9 %16.2 %
17.5 %
14.8 %15.6 %
13.6 % 13.5 %
0.0 %
2.0 %
4.0 %
6.0 %
8.0 %
10.0 %
12.0 %
14.0 %
16.0 %
18.0 %
20.0 %
Kraft Cadbury GeneralMills
J.M.Smucker
Campbell Kellogg Hershey Danone Heinz Unilever Nestlé
EBIT Margins Relative to Comparables
Kraft currently has low EBIT margins relative to its peers, despite being the largest food company in North America and participating in high gross margin categories
Note: Kraft, Cadbury and Nestle are based on Pershing estimates for 2009, except Nestle, which is LTM. Nestle data is food and beverage only (ex-Alcon) adjusted to deduct trade promotions from revenue (assumed 12% of revenue) to be comparable. Campbell, Heinz, Unilever, Danone and Kellogg’s are per Wall Street research and are LTM, except Unilever, Danone, and Kellogg’s which are 2009e. General Mills is per company filings and excludes mark-to-market gains / losses on commodities derivatives and is LTM. J.M. Smucker is PF for Folger’s, so 2010e margin used, per Wall Street research.
12
Food & Beverage

Appropriate EBIT Margins Based on Categories
Based on our global category analysis, KFT should have EBIT margins in the mid-to-high teens
We believe that Snacks and Beverages are the categories where KFT is materially under-earning
Memo:
13
AppropriateEst. Revenue Mix EBIT Margin Reference Margin
SnacksCookies / crackers 75% 17% Kellogg's consolidated margins (including G&A)European Chocolate 25% 15% Nestle confectionary (GAAP Adjusted)
Est. Margin 16.5%
BeveragesCoffee 50% 22% Folgers (pre G&A, before Smuckers acquisition)RTD 25% 12% Typical RTDPowders 25% 35% Dr. Pepper concentrate / Coca Cola consolidated
Based on peers 23%Discount for KFT 20%
(1) Includes NA Frozen Pizza. Based on current EBIT margins(2) Based on US Cheese segment 3-year average(3) Based on US Grocery segment 3-year average
Estimate forEst. % of Appropriate
Global category Global Revenues EBIT marginSnacks (see memo) 38% 16%Beverages (see memo) 20% 20%Meals (1) 15% 11%Cheese (2) 18% 16%Grocery (3) 10% 32%Less corporate (0.8)%Appropriate KFT EBIT Margin 17%KFT current 2009E EBIT Margin (1) 13.6%
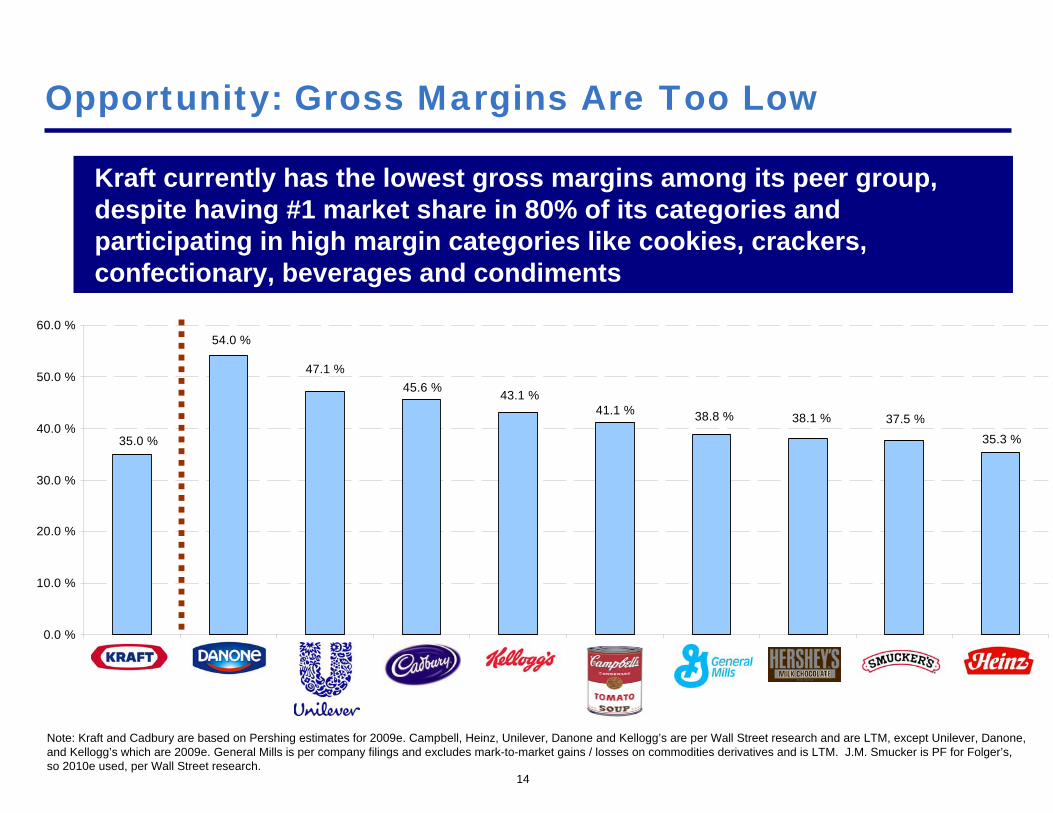
41.1 %
47.1 %
54.0 %
35.0 %
38.1 %
35.3 %
43.1 %
38.8 % 37.5 %
45.6 %
0.0 %
10.0 %
20.0 %
30.0 %
40.0 %
50.0 %
60.0 %
Kraft Danone Unilever Cadbury Kellogg Campbell General Mills Hershey J.M. Smucker Heinz
Opportunity: Gross Margins Are Too Low
Kraft currently has the lowest gross margins among its peer group, despite having #1 market share in 80% of its categories and participating in high margin categories like cookies, crackers, confectionary, beverages and condiments
14
Note: Kraft and Cadbury are based on Pershing estimates for 2009e. Campbell, Heinz, Unilever, Danone and Kellogg’s are per Wall Street research and are LTM, except Unilever, Danone, and Kellogg’s which are 2009e. General Mills is per company filings and excludes mark-to-market gains / losses on commodities derivatives and is LTM. J.M. Smucker is PF for Folger’s, so 2010e used, per Wall Street research.
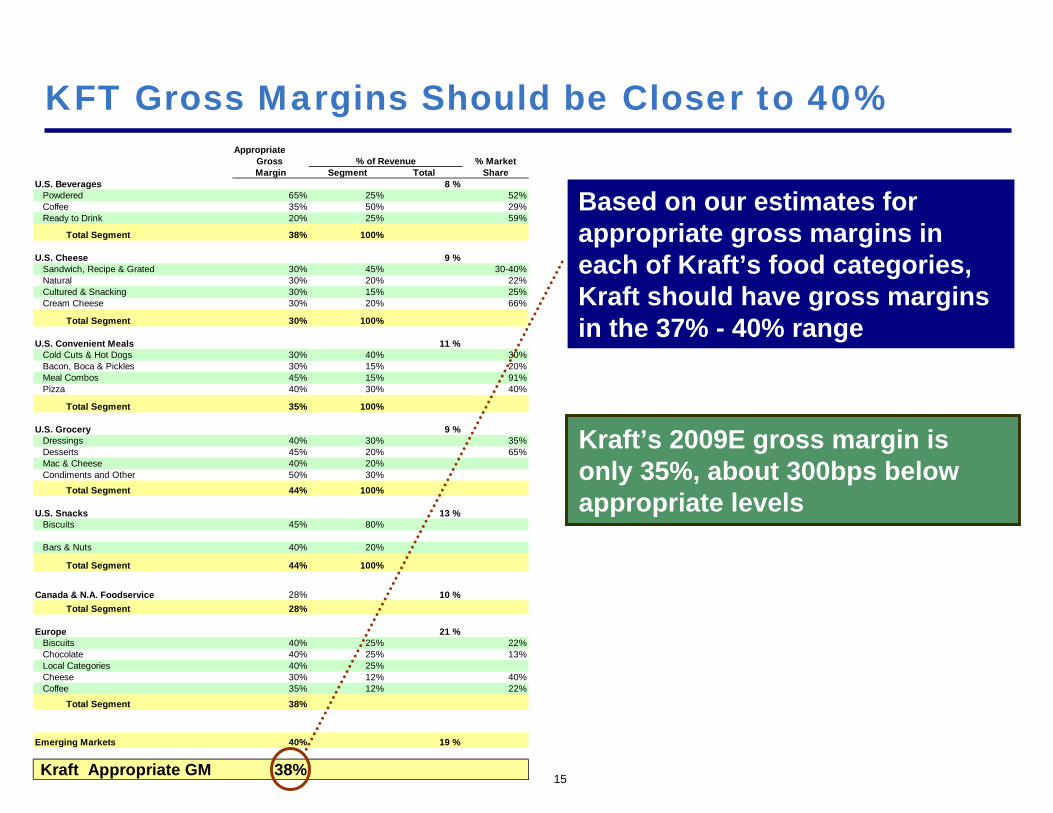
AppropriateGross % of Revenue % MarketMargin Segment Total Share
U.S. Beverages 8 %Powdered 65% 25% 52%Coffee 35% 50% 29%Ready to Drink 20% 25% 59%
Total Segment 38% 100%
U.S. Cheese 9 %Sandwich, Recipe & Grated 30% 45% 30-40%Natural 30% 20% 22%Cultured & Snacking 30% 15% 25%Cream Cheese 30% 20% 66%
Total Segment 30% 100%
U.S. Convenient Meals 11 %Cold Cuts & Hot Dogs 30% 40% 30%Bacon, Boca & Pickles 30% 15% 20%Meal Combos 45% 15% 91%Pizza 40% 30% 40%
Total Segment 35% 100%
U.S. Grocery 9 %Dressings 40% 30% 35%Desserts 45% 20% 65%Mac & Cheese 40% 20%Condiments and Other 50% 30%
Total Segment 44% 100%
U.S. Snacks 13 %Biscuits 45% 80%
Bars & Nuts 40% 20%
Total Segment 44% 100%
Canada & N.A. Foodservice 28% 10 %Total Segment 28%
Europe 21 %Biscuits 40% 25% 22%Chocolate 40% 25% 13%Local Categories 40% 25%Cheese 30% 12% 40%Coffee 35% 12% 22%
Total Segment 38%
Emerging Markets 40% 19 %
Kraft Appropriate GM 38%
KFT Gross Margins Should be Closer to 40%
Based on our estimates for appropriate gross margins in each of Kraft’s food categories, Kraft should have gross margins in the 37% - 40% range
Kraft’s 2009E gross margin is only 35%, about 300bps below appropriate levels
15

% of EBIT 2006 2007 2008 LTMNorth America 69 % 17.5 % 16.1 % 15.7 % 16.8 %
Y-o-Y Change (bps) (136) (47) 110
Europe 14 % 10.8 % 8.8 % 8.7 % 9.4 %Y-o-Y Change (bps) (195) (10) 67
Developing Markets 17 % 11.5 % 10.5 % 12.2 % 12.8 %Y-o-Y Change (bps) (93) 165 59
Segment EBIT 15.4 % 13.8 % 13.4 % 14.4 %Y-o-Y Change (bps) (160) (40) 105
Less: Corporate Costs (0.6)% (0.6)% (0.6)% (1.0)%Y-o-Y Change (bps) (2) (1) (40)
EBIT 14.8 % 13.2 % 12.8 % 13.4 %Y-o-Y Change (bps) (162) (41) 65
Observations: Europe EBIT Margins Too Low
16
Opportunity
On a regional basis, Kraft’s Europe business has been materially under-earning, despite an attractive portfolio of food products. Increased scale from the 2007 LU acquisition should help improvemargins
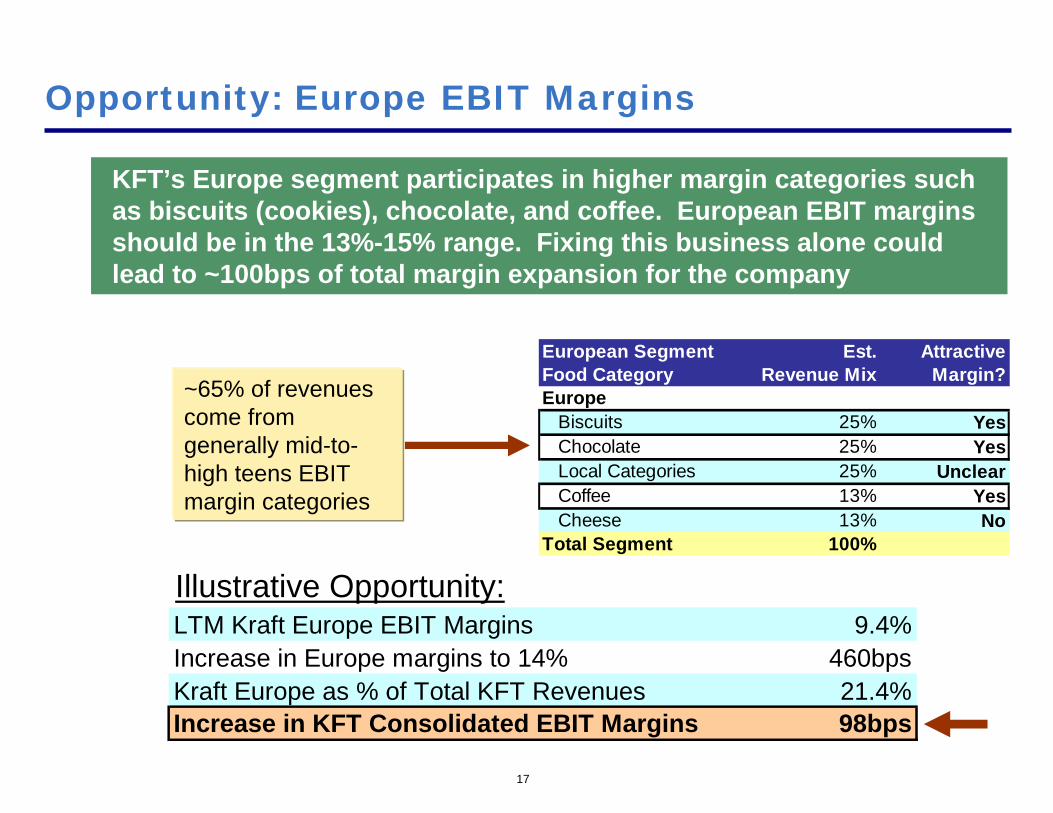
Opportunity: Europe EBIT Margins
KFT’s Europe segment participates in higher margin categories such as biscuits (cookies), chocolate, and coffee. European EBIT margins should be in the 13%-15% range. Fixing this business alone could lead to ~100bps of total margin expansion for the company
~65% of revenues come from generally mid-to-high teens EBIT margin categories
17
LTM Kraft Europe EBIT Margins 9.4%Increase in Europe margins to 14% 460bpsKraft Europe as % of Total KFT Revenues 21.4%Increase in KFT Consolidated EBIT Margins 98bps
Illustrative Opportunity:
European Segment Est. AttractiveFood Category Revenue Mix Margin?Europe
Biscuits 25% YesChocolate 25% YesLocal Categories 25% UnclearCoffee 13% YesCheese 13% No
Total Segment 100%
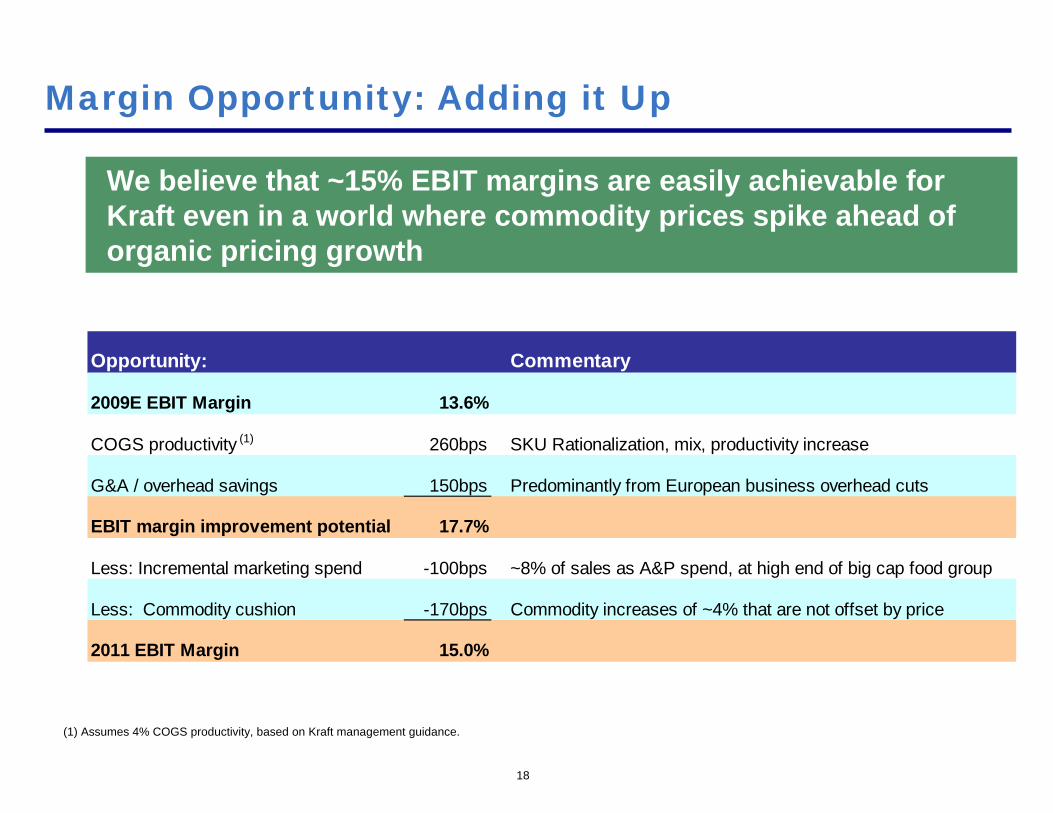
Margin Opportunity: Adding it Up
18
We believe that ~15% EBIT margins are easily achievable for Kraft even in a world where commodity prices spike ahead of organic pricing growth
(1) Assumes 4% COGS productivity, based on Kraft management guidance.
Opportunity: Commentary
2009E EBIT Margin 13.6%
COGS productivity (1) 260bps SKU Rationalization, mix, productivity increase
G&A / overhead savings 150bps Predominantly from European business overhead cuts
EBIT margin improvement potential 17.7%
Less: Incremental marketing spend -100bps ~8% of sales as A&P spend, at high end of big cap food group
Less: Commodity cushion -170bps Commodity increases of ~4% that are not offset by price
2011 EBIT Margin 15.0%

Pro Forma KFT + Cadbury: A Great Company

Pro Forma Kraft is a Great Company and Stock
Higher organic growth profile
Improved category mix and overall business quality
Increased emerging markets scale and distribution
Improved access to instant consumption channels
Margin improvement opportunity at both Kraft and CadburyBoth companies materially under-earning with EBIT margins at ~13.5%, far below peers
$675mm of stated cost synergies (over 10% of PF Kraft’s 2009 EBIT)
Strong revenue synergies (mgmt has not yet stated a target)
Lower effective tax rate
The new Kraft is a better company than the old Kraft
Many opportunities to significantly increase earnings
20

PF Kraft: Leading Global Confectionary Business
PF Kraft: Strong Stable of Confectionary Brands
PF KFT would be the world’s leading confectionary business by total confectionary marketplace position
21
Source: Bernstein Research, Kraft company presentation.

Snacks, 38.0%
Beverages, 20.0%
Cheese, 18.0%
Meals, 15.0%
Grocery, 10.0% Beverages,
16.6%
Snacks, 31.5%
Confectionary, 19.4%
Cheese, 14.9%
Meals, 9.2%
Grocery, 8.3%
PF Kraft: Improved Business Quality
Over 50% of PF Kraft’s sales will be comprised of Confectionary, Cookies and Crackers – all high quality, branded food categories
Confectionary,Cookies and Crackers represent ~50%
Standalone Pro Forma
(Cookies, crackers, Confectionary)
Cadbury
22
(Cookies, crackers, Confectionary)
Pro Forma for Cadbury acquisition and sale of N.A. Frozen Pizza business.

Confectionary, Cookies and Crackers
Confectionary, cookies and crackers are great food businesses
Low private branding in developed marketsGum: store brands are virtually non-existent (1)
Chocolate: ~5% of category = store brands (1)
Cookies and crackers: ~10% = store brands (1)
Strong emerging markets potentialHigh branded products with broad global appeal particularly to children/young folksEasily shipped, generally low spoilageCheap and affordable “western” treats
High gross margins
23
1) Based on US private brand share estimates. Cookies have higher private brand reach at around 15% of sales and crackers have lower reach at around 7% of sales.

Confectionary, Cookies and Crackers (cont’d)
Confectionary, cookies and crackers are great food businesses
Attractive barriers to entry:
Scale required to be profitable
Marketing spend requirements, given branded goods
Retail shelf-space scarcity particularly in confectionary –front-of-the-counter retail shelf space is owned by a few companies – hard for new entrants to penetrate
In developed markets, cookies and crackers are DSDDirect-to-store-delivery (DSD) distribution is difficult to build and limits competitive entry
KFT’s large scale DSD is a strong competitive advantage which can increase Cadbury growth in North America
24

Improved Emerging Markets Access
Kraft Cadbury Combined
North America 58% 22% 51%
Europe 22% 34% 25%
Developing Markets 20% 44% 25%
Total 100.0% 100.0% 100%
25
Kraft’s existing portfolio of dry goods (cookies, crackers, mac & cheese, dry desserts and powdered beverages) is well suited for Cadbury’s distribution platform in emerging markets
PF Kraft will have 25% of sales in emerging markets, the highest exposure out of all its North American-based food peers, including Kellogg, General Mills, Hershey, H.J. Heinz and Campbell Soup
Based on Pershing Square’s estimates. Developing markets includes Australia and Japan. Percentages may not add up due to rounding.
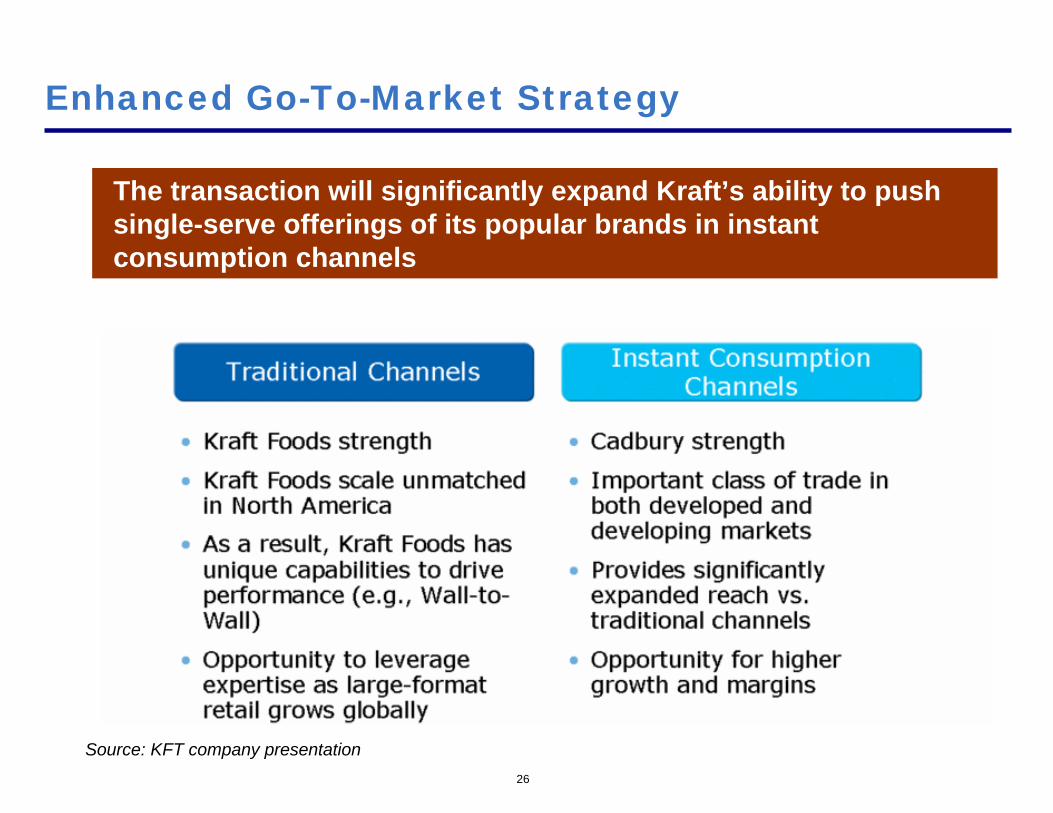
Enhanced Go-To-Market Strategy
26
The transaction will significantly expand Kraft’s ability to push single-serve offerings of its popular brands in instant consumption channels
Source: KFT company presentation
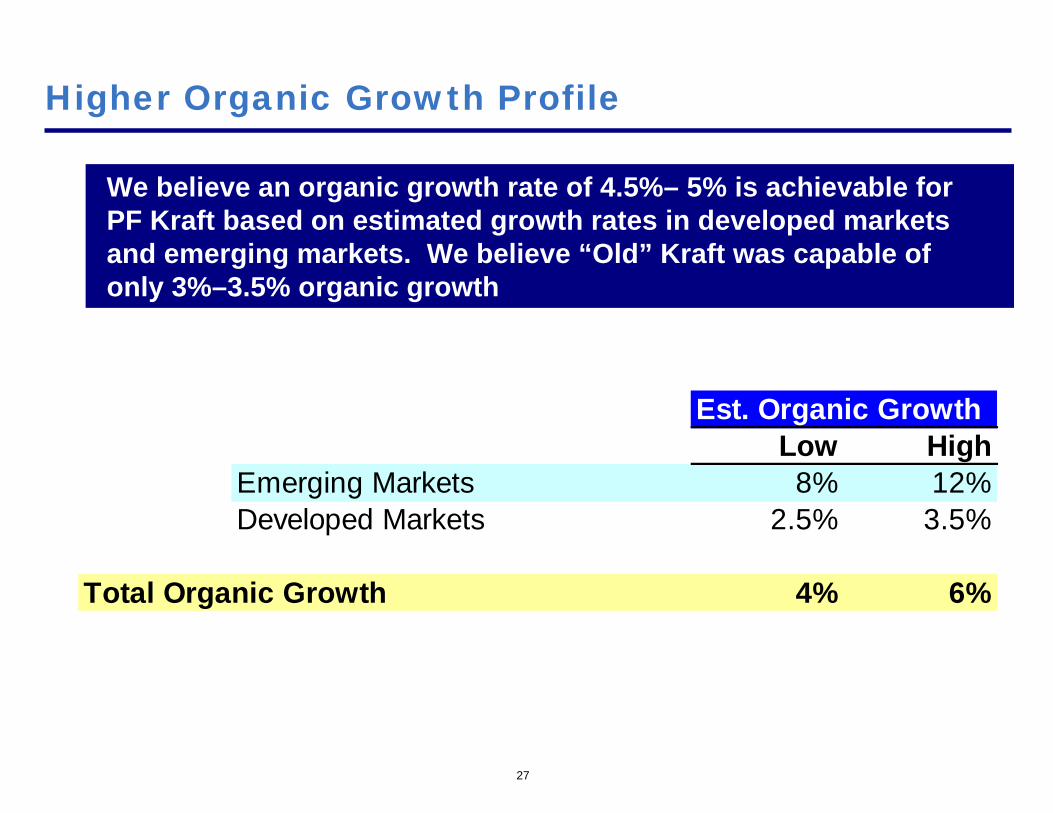
Higher Organic Growth Profile
27
We believe an organic growth rate of 4.5%– 5% is achievable for PF Kraft based on estimated growth rates in developed markets and emerging markets. We believe “Old” Kraft was capable of only 3%–3.5% organic growth
Est. Organic GrowthLow High
Emerging Markets 8% 12%Developed Markets 2.5% 3.5%
Total Organic Growth 4% 6%

PF Kraft is Significantly Undervalued
28
Based on our estimates, Kraft trades at less than ~10x 2012 EPS(1)
OR another way to look at it
PF Kraft trades at less than 15x 2009 EPS, excluding any synergies or other benefits from the transaction
You pay under 15x LTM EPS and you get, for free:$675mm of cost saving synergies (>10% of Pro Forma EBIT)Revenues synergiesKraft standalone margin opportunity (margins up 150bps to ~15%)Cadbury margin opportunity (margins up 150bps to ~15%)Multiple expansion (better business, faster growth)4% dividend yield, while you wait…
(1) Based on recurring earnings per share and includes the estimated non-cash impact of 7 cents / share of step-up amortization as a result of the transaction. Kraft has not yet determined the step up in amortization.

What Is it Worth?
(1) Based on recurring earnings per share and includes the estimated non-cash impact of 7 cents / share of step-up amortization as a result of the transaction. Kraft has not yet determined the step up in amortization.
At the recent price of $28 per share, we believe an investment in Kraft represents a 2-year IRR of 24% - 36%, depending on management’s integration of Cadbury and market conditions. Our midpoint price for Kraft is roughly $45 per share in two years
29
Low High
2012 EPS (1) $2.70 $2.90
NTM P/E Multple 15.0x 17.0x
2-Year Price Target $41 - $49
Plus: Dividend (two years) $2.32 $2.32
Total $ received per share $43 - $52
Total Return 52.9% 84.4%
2 Year IRR 24% - 36%
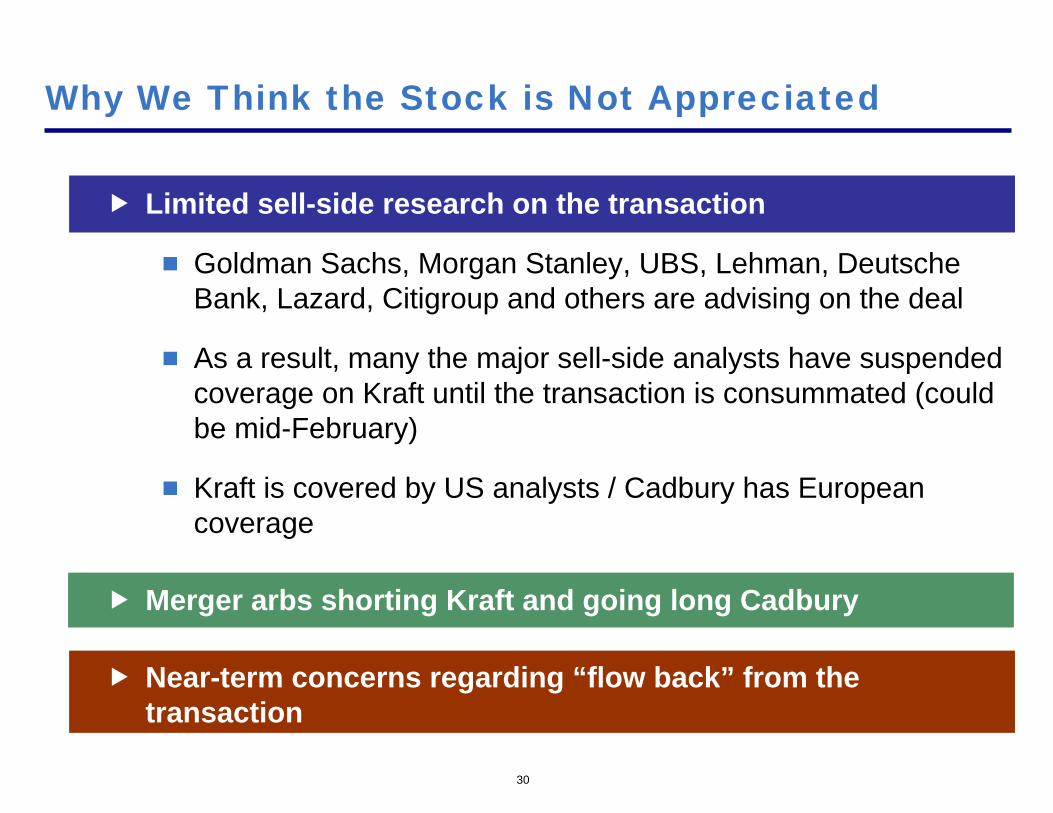
Why We Think the Stock is Not Appreciated
Limited sell-side research on the transaction
Goldman Sachs, Morgan Stanley, UBS, Lehman, Deutsche Bank, Lazard, Citigroup and others are advising on the deal
As a result, many the major sell-side analysts have suspended coverage on Kraft until the transaction is consummated (could be mid-February)
Kraft is covered by US analysts / Cadbury has European coverage
Merger arbs shorting Kraft and going long Cadbury
Near-term concerns regarding “flow back” from the transaction
30