Embed Size (px)
Citation preview
The Theoretical Difference between a Re-
cession and Stagflation: Global Case Stud-
ies
In times of economic distress, it is possible for economic agents
(Consumers, firms, government, and policymakers) to get misled
with contradicting and inadequate analysis of the Nigeria’s econ-
omy. In order not to fall prey to all kinds of economic jargon, we
must be clear in describing the present state. Nigeria is experienc-
ing one of the worst economic growth contractions since the ‘80s.
It is also plagued by other structural and transient issues such as
increasing consumer prices, fiscal and external imbalances, low oil
production levels, a dysfunctional foreign exchange (forex) mar-
ket and so on. It is easy to morph the economy’s situation into a
theoretical narrative that is not necessarily representative of the
Nigerian case. This article aims to address the gaps in the theo-
retical explanations of the economic situation in Nigeria using
global case studies.
Stagflation or Recession
Stagflation
A stagflation is an economic situation where consumer prices are
high, economic growth is slowing and unemployment maintains a
steady upward trajectory. Ian Macleod first explicitly mentioned
FINANCIAL DERIVATIVES COMPANY LIMITED
Bi-monthly Economic
& Business Update
Volume 6, Issue 74
October 26, 2016
INSIDE THIS ISSUE:
The Theoretical Difference between a Recession and
Stagflation: Global Case Stud-
ies
1
Electricity and the Economy 10
Global Perspective – Culled from the Economist
16
Macroeconomics Indicators 20
Stock Market Update 25
Corporate Focus Equity Report: Unilever Nige-
ria Plc.
30
A Financial Derivatives Company Publication
: 7739831, 7798998, 2715414; Email: [email protected]; Website: www.fdcng.com
the concept in his assessment of the UK economy.1 Strong
growth and stable prices characterized post-war Britain. High in-
flation in the 1960s through the 1970s plagued the UK economy.
This era was known as the great inflation. The inflation rate in
that period went as high as 25% (1979). It was attributed to the
oil price shocks of the 70s where the price of oil spiked four times,
making net importers of oil highly susceptible to economic dis-
tress.
A state of stagnation is one where there is a persistent period of
slowing growth often followed by high unemployment. Slowing
growth does not mean negative growth. Negative growth best de-
scribes a recession, where a country experiences at least two con-
secutive periods of negative growth.
There are two main views that attempt to describe stagflation in a
country. The UK and other net-importers of oil in the 70s saw
stagflation come about as a result of a reduction in production ca-
pacity attributed to a negative supply shock. Prices in the econ-
omy increased because negative supply shock caused a slowdown
in output due to higher production costs. Hence, output could not
compensate demand.
The second channel where stagflation occurs is via macroeco-
nomic policy gaps. Policy in all facets of the economy is not in
sync. The government of a country might be engaging in policies
that clamp down on growth spikes to target a fairly normal busi-
ness cycle. However, the central bank might also simultaneously
free up money supply in the economy through monetary policy.
This frees up funds for goods that are unavailable.
Global Cases Studies
Stagflation in OECD – 70s and 80s2
The oil price shocks of the 70s created a wave of slowing growth
and rising consumer prices, which according to John F. Helliwell
was the “hallmark of OECD economic performance in the 70s and
Page 2
A Financial Derivatives Company Publication
: 7739831, 7798998, 2715414; Email: [email protected]; Website: www.fdcng.com
1 Gregory Mankiw (2008). Principles of macroeconomics. Pp. 464. 2 Source: OECD at 50, evolving paradigms in economic policy making. OECD Economic Outlook, No. 50 (OECD, 1991). https://www.oecd.org/eco/outlook/48010330.pdf
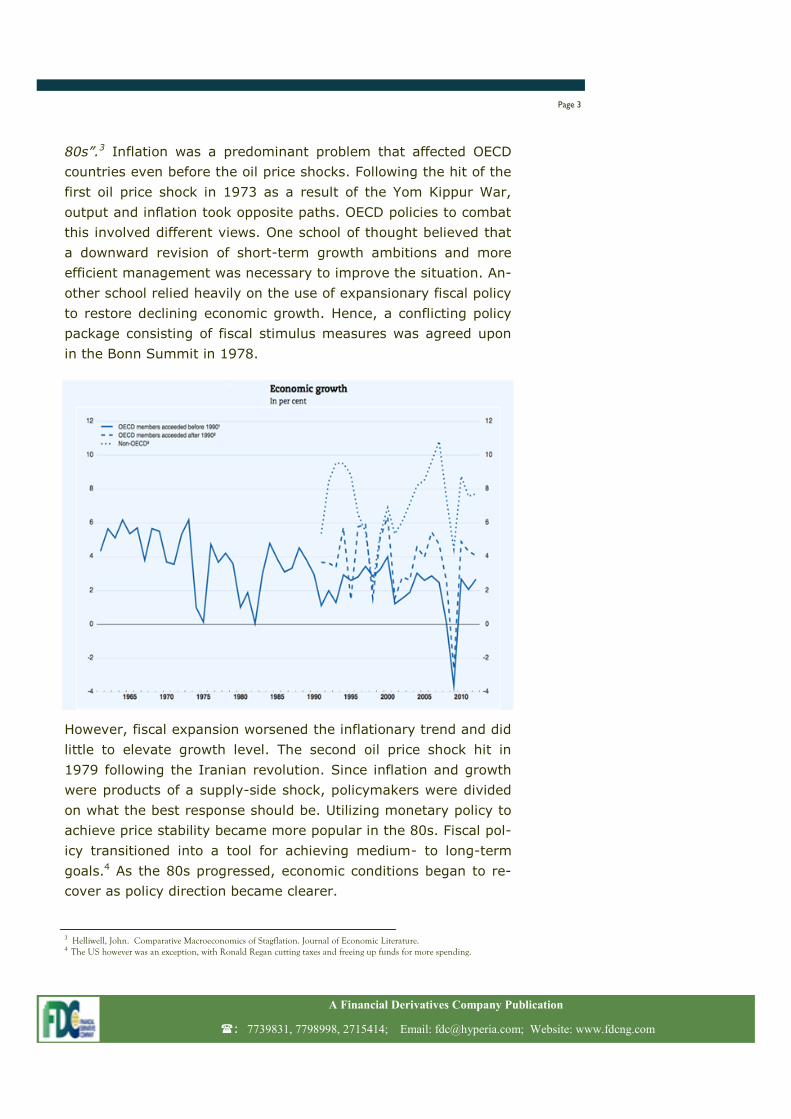
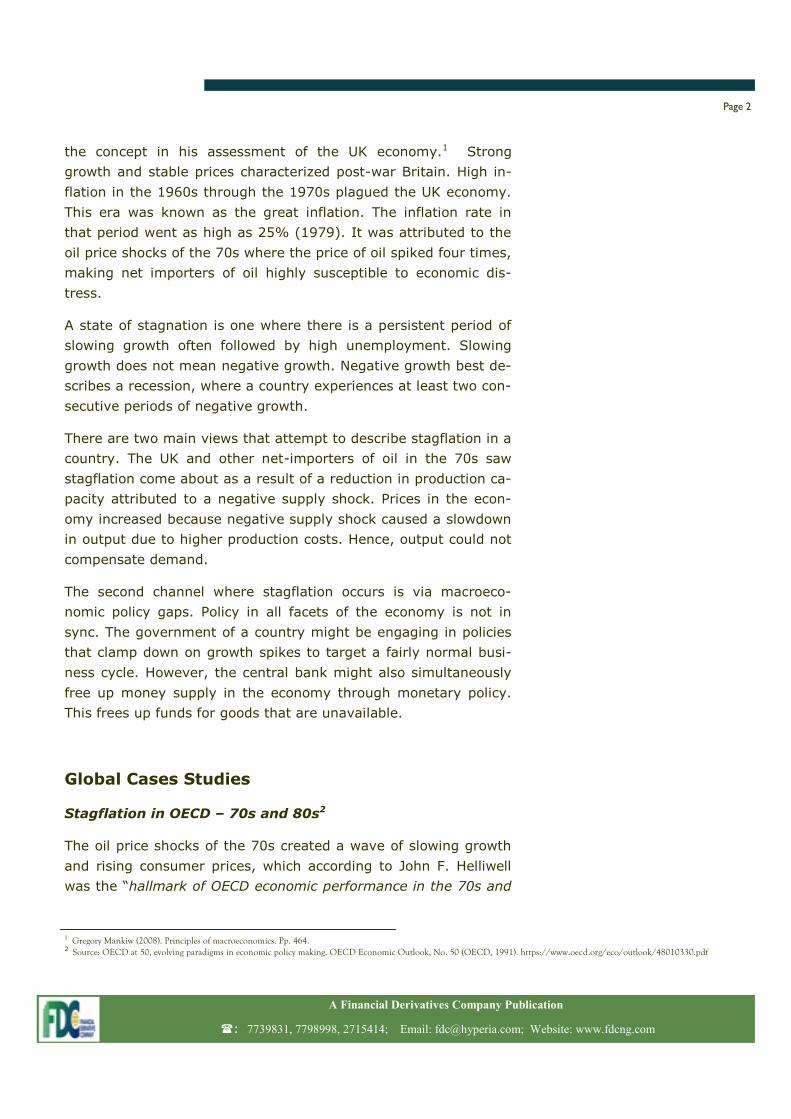
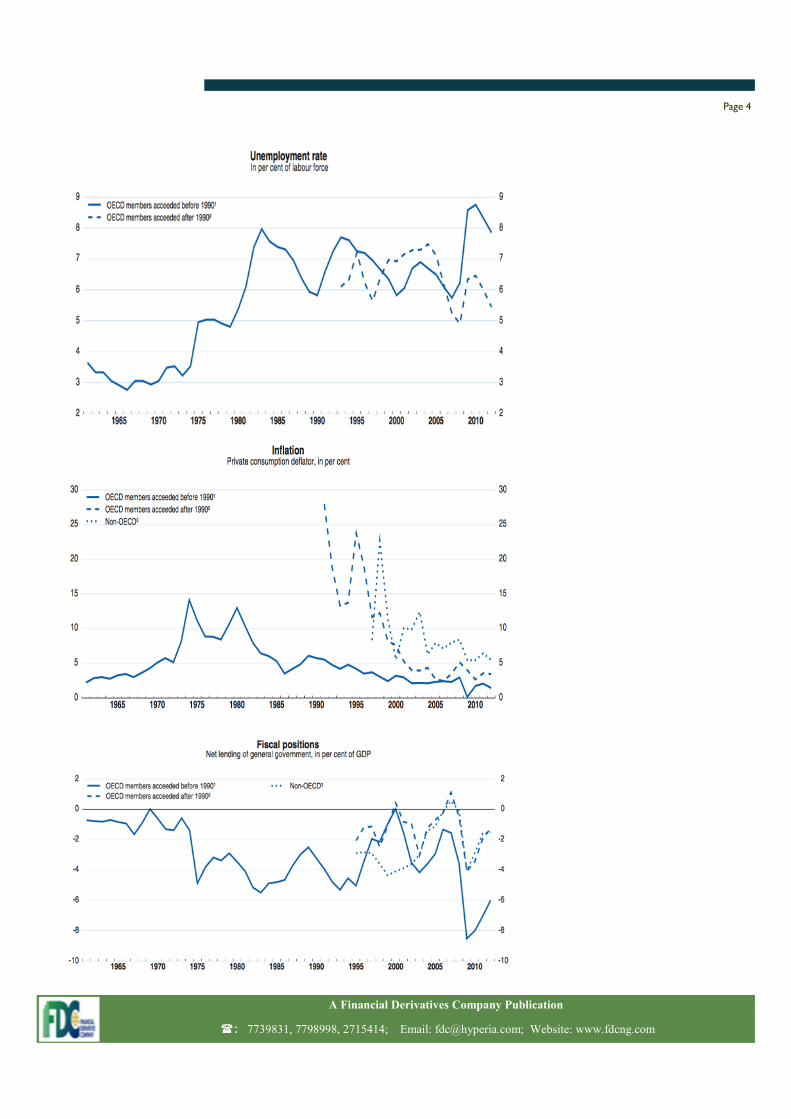
80s”.3 Inflation was a predominant problem that affected OECD
countries even before the oil price shocks. Following the hit of the
first oil price shock in 1973 as a result of the Yom Kippur War,
output and inflation took opposite paths. OECD policies to combat
this involved different views. One school of thought believed that
a downward revision of short-term growth ambitions and more
efficient management was necessary to improve the situation. An-
other school relied heavily on the use of expansionary fiscal policy
to restore declining economic growth. Hence, a conflicting policy
package consisting of fiscal stimulus measures was agreed upon
in the Bonn Summit in 1978.
However, fiscal expansion worsened the inflationary trend and did
little to elevate growth level. The second oil price shock hit in
1979 following the Iranian revolution. Since inflation and growth
were products of a supply-side shock, policymakers were divided
on what the best response should be. Utilizing monetary policy to
achieve price stability became more popular in the 80s. Fiscal pol-
icy transitioned into a tool for achieving medium- to long-term
goals.4 As the 80s progressed, economic conditions began to re-
cover as policy direction became clearer.
Page 3
A Financial Derivatives Company Publication
: 7739831, 7798998, 2715414; Email: [email protected]; Website: www.fdcng.com
3 Helliwell, John. Comparative Macroeconomics of Stagflation. Journal of Economic Literature.
4 The US however was an exception, with Ronald Regan cutting taxes and freeing up funds for more spending.
Page 4
A Financial Derivatives Company Publication
: 7739831, 7798998, 2715414; Email: [email protected]; Website: www.fdcng.com
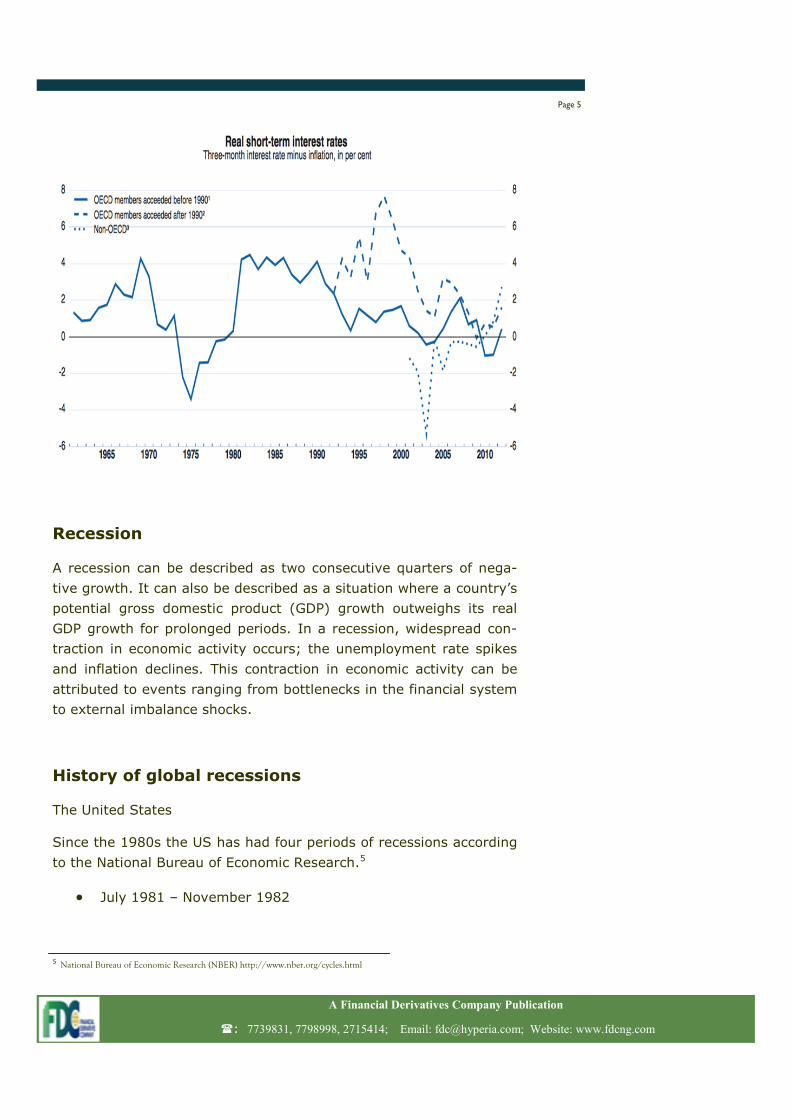
Recession
A recession can be described as two consecutive quarters of nega-
tive growth. It can also be described as a situation where a country’s
potential gross domestic product (GDP) growth outweighs its real
GDP growth for prolonged periods. In a recession, widespread con-
traction in economic activity occurs; the unemployment rate spikes
and inflation declines. This contraction in economic activity can be
attributed to events ranging from bottlenecks in the financial system
to external imbalance shocks.
History of global recessions
The United States
Since the 1980s the US has had four periods of recessions according
to the National Bureau of Economic Research.5
July 1981 – November 1982
Page 5
A Financial Derivatives Company Publication
: 7739831, 7798998, 2715414; Email: [email protected]; Website: www.fdcng.com
5 National Bureau of Economic Research (NBER) http://www.nber.org/cycles.html
July 1990 – March 1991
March 2001 – November 2001
December 2007 – June 2009
The recession of the 80s was part of the bigger picture of stagfla-
tion that plagued OECD countries following the aftermath of the
oil crises of the 70s and out of sync policies that further aggra-
vated the situation. The recession of the 1990s was a result of the
economic downturn that followed the stock market crash of the
late 80s.6 The Dow Jones Industrial Average fell swiftly and unex-
pectedly by 22.6%. The recession of the early 2000s is often criti-
cized as not fitting the criterion for a recession – two consecutive
quarters of negative growth. However, growth slowed as a result
of boom and bust cycles. The global economic boom of the early
to mid 90s reached the threshold for a decline and as such this
‘recession’ was predicted. The recession of the late 2000s was
caused by a combination of a financial crisis and a subprime mort-
gage crisis. The former has been considered the worst financial
crisis since the great depression of the 20s and 30s. The decline
in the value of assets and the collapse in the financial sector had
the ripple effect of causing economic shock waves to the rest of
the world. Confidence was badly bruised.
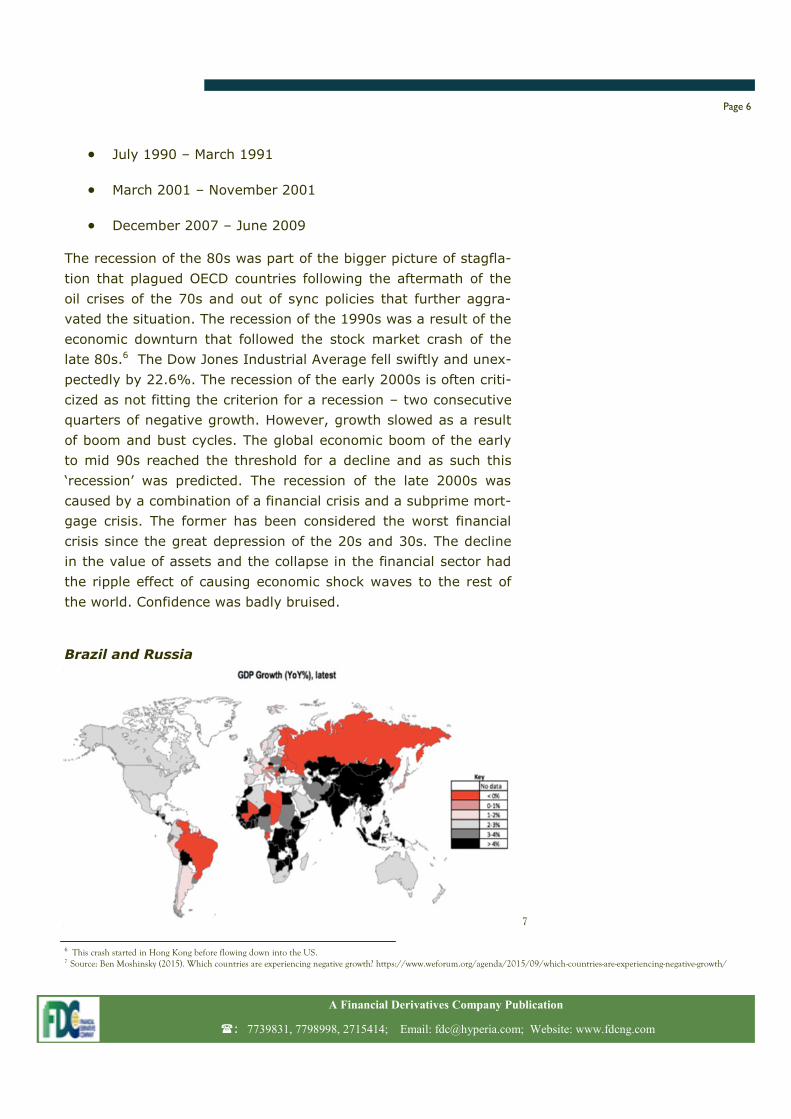
Brazil and Russia
A Financial Derivatives Company Publication
: 7739831, 7798998, 2715414; Email: [email protected]; Website: www.fdcng.com
6 This crash started in Hong Kong before flowing down into the US. 7 Source: Ben Moshinsky (2015). Which countries are experiencing negative growth? https://www.weforum.org/agenda/2015/09/which-countries-are-experiencing-negative-growth/
7
Page 6
Brazil and Russia are two of a few countries to be experiencing
negative growth. Brazil sank further into a recession in the sec-
ond quarter of 2016, falling to -0.6% from -0.4% in Q1 2016.
This decline is the sixth consecutive quarter of economic decline.
It is further expected that the country’s output for 2016 will main-
tain 2015’s contraction of 3.8%. This downturn is being attributed
to reduced spending power brought on through rising unemploy-
ment, weakened consumer confidence and the political woes that
plague the country. Brazil impeached President Dilma Rousseff in
August following accusations of fiscal budget manipulations. Rus-
sia has been experiencing a recession for the past 19 months. A
combination of low oil prices and economic sanctions – as a result
of its atrocities in Ukraine - has taken a toll on the country. The
economy shrunk by 0.6% in the second quarter of 2016.
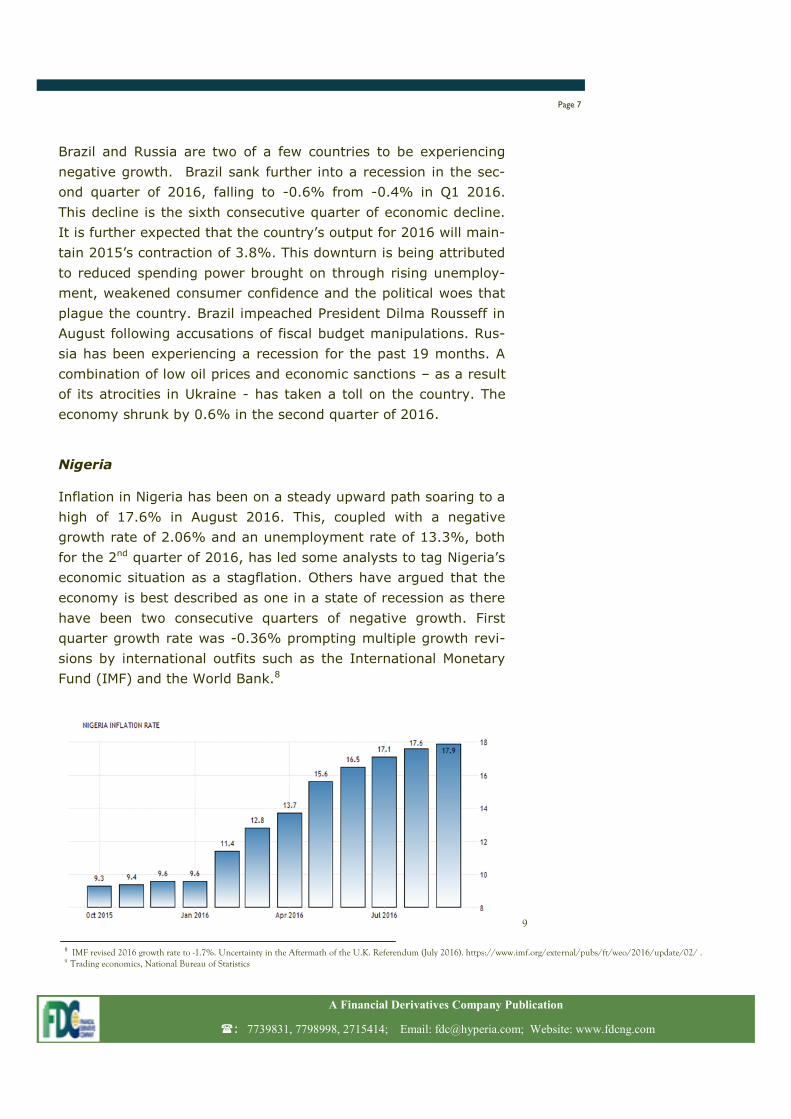
Nigeria
Inflation in Nigeria has been on a steady upward path soaring to a
high of 17.6% in August 2016. This, coupled with a negative
growth rate of 2.06% and an unemployment rate of 13.3%, both
for the 2nd quarter of 2016, has led some analysts to tag Nigeria’s
economic situation as a stagflation. Others have argued that the
economy is best described as one in a state of recession as there
have been two consecutive quarters of negative growth. First
quarter growth rate was -0.36% prompting multiple growth revi-
sions by international outfits such as the International Monetary
Fund (IMF) and the World Bank.8
Page 7
A Financial Derivatives Company Publication
: 7739831, 7798998, 2715414; Email: [email protected]; Website: www.fdcng.com
9
8 IMF revised 2016 growth rate to -1.7%. Uncertainty in the Aftermath of the U.K. Referendum (July 2016). https://www.imf.org/external/pubs/ft/weo/2016/update/02/ . 9 Trading economics, National Bureau of Statistics
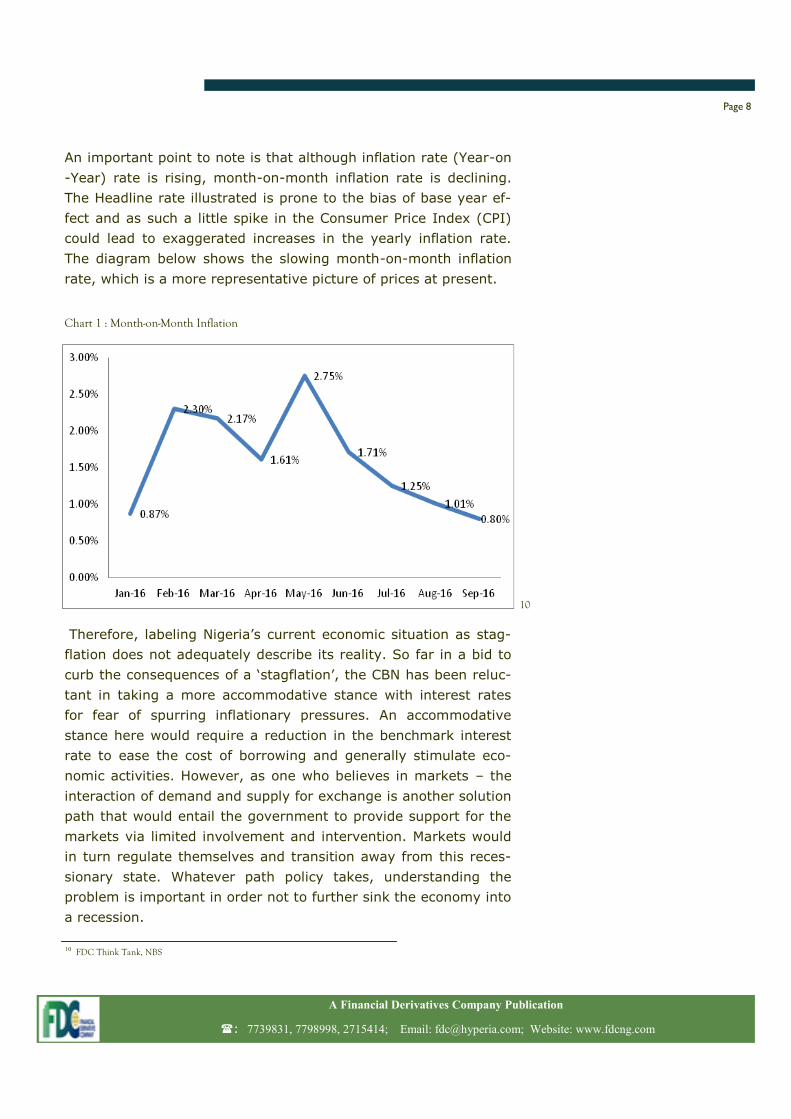
An important point to note is that although inflation rate (Year-on
-Year) rate is rising, month-on-month inflation rate is declining.
The Headline rate illustrated is prone to the bias of base year ef-
fect and as such a little spike in the Consumer Price Index (CPI)
could lead to exaggerated increases in the yearly inflation rate.
The diagram below shows the slowing month-on-month inflation
rate, which is a more representative picture of prices at present.
Therefore, labeling Nigeria’s current economic situation as stag-
flation does not adequately describe its reality. So far in a bid to
curb the consequences of a ‘stagflation’, the CBN has been reluc-
tant in taking a more accommodative stance with interest rates
for fear of spurring inflationary pressures. An accommodative
stance here would require a reduction in the benchmark interest
rate to ease the cost of borrowing and generally stimulate eco-
nomic activities. However, as one who believes in markets – the
interaction of demand and supply for exchange is another solution
path that would entail the government to provide support for the
markets via limited involvement and intervention. Markets would
in turn regulate themselves and transition away from this reces-
sionary state. Whatever path policy takes, understanding the
problem is important in order not to further sink the economy into
a recession.
Page 8
A Financial Derivatives Company Publication
: 7739831, 7798998, 2715414; Email: [email protected]; Website: www.fdcng.com
10 FDC Think Tank, NBS
Chart 1 : Month-on-Month Inflation
10
Electricity and the Economy
Introduction
For those in developed countries it is almost impossible to imagine
life without a basic necessity such as power. During the rare occa-
sions that power supplies are temporarily cut off, cities are shut
down and activity is halted until the normality of 24/7 electricity is
restored.
But in Nigeria, this is not so. The phrase -‘Up Nepa!’ is not an un-
common one; it’s an exclamation of gratitude to the power opera-
tors for choosing to bless us with electricity. During periods of unin-
terrupted power supply, Nigerians become anxious, understanding
that this probably means that days of darkness are ahead.
In a country where there are as many generators as there are
houses and a where there is a ‘charge your phone’ booth on almost
every street, people have learned not only how to live without a
steady supply of power, but how to make a business out of it.
Power generation in Nigeria
We know that electricity generation in Nigeria is problematic, but
how do we compare to others?
Measurements and Rankings
When assessing the power sector of a country there are three sig-
nificant variables to consider.
The first is total electricity production. This measures the total out-
put from electricity plants during the period. According to the In-
ternational Energy Agency, Nigeria’s total production in 2013 was
29m megawatts hours (MwH). Compared to Nigeria’s West African
neighbors, the country appears to have outperformed. In the same
year, Senegal, Ghana and Cote d’Ivoire produced 3.7m MwH,
12.9m MwH and 7.6m MwH respectively.
Page 10
A Financial Derivatives Company Publication
: 7739831, 7798998, 2715414; Email: [email protected]; Website: www.fdcng.com
However, to put it in context, Nigeria’s energy production is just
about the same level as Hungary’s. This small Eastern European
country, the size of Borno state in terms of land area and half the
size of Lagos state in terms of population, produced 30m MwH in
2013.
That is why, for a deeper analysis of the power sector we need to
take into account the next variables of measurement: access to elec-
tricity and electricity consumption per capita.
These paint a clearer picture of the electricity gap as they assess
production in relation to demand. So while Hungay’s production level
is enough to supply constant electricity to all of its 9.89m popula-
tion, it is nowhere sufficient for Nigeria’s 173.6m, half of whom do
not even have access to electricity. As at 2013, only 55.6% of Nige-
rians had access to electricity.*
Electricity consumption per capita is the total electricity generation
minus losses in transmission, distribution and transformation divided
by the population. As of 2013, Nigeria’s electric power consumption
per capita was a measly 141.9 kilowatts hours (kWh), compared to
Angola at 226.8 kWh, South Africa at 4,325.5 kWh, Egypt at 1,697.5
and Ghana at 382 kWh.
In essence, it means that each year*, Nigeria generates enough
electricity for each citizen to power a light bulb for about two
months.
Sources & Structure
Prior to privatization in 2014, the Federal Government managed and
financed all the operations of the power sector. Currently, there are
six generation companies (GENCOs) which depend on two sources of
electricity: natural gas (81.6%) and hydro power (18.4%). These
privately owned GENCOs transfer all generated power to the national
grid controlled by the Transmission Company of Nigeria (TCN). Al-
though previously managed by Manitoba Hydro International, a Ca-
nadian power firm, TCN is now controlled by the Federal Govern-
ment.
Page 11
A Financial Derivatives Company Publication
: 7739831, 7798998, 2715414; Email: [email protected]; Website: www.fdcng.com
The TCN, in turn, transmits power to the 11 electricity distribution
companies (DISCOs). The DISCOs are responsible for distributing
electricity to households in their geopolitical jurisdictions. They
also deal directly with end-users, collecting tariffs and bill pay-
ments. Middlemen agencies are then responsible for the transfer
of profits back to the GENCOs.
Electricity & Economic growth
The importance of electricity lies in its status as a necessary inter-
mediary in the economy. It does not represent an end in itself but
it is required for the success of other initiatives or activities. These
activities can generate welfare or leisure, increase efficiency or
productivity, and generate income.
The shortage and unreliability of power and the need for Nigerians
to generate their own electricity adds unnecessary cost inefficien-
cies. Households and businesses spent N3.5 trillion to power gen-
erators. Given the increase in the price of petrol and diesel, this
figure is estimated to reach N5 trillion in 2017 - a less than ex-
pected spike given the trending switch from fuel energy to renew-
able energy (solar power, inverters etc.). With companies such as
MTN reportedly spending N8bn on power generation annually, it
shows that the present power situation has negative connotations
for business operations and profitability.
In its Ease of Doing Business Report, the World Bank* draws a
parallel between Nigeria’s frail power sector and its business envi-
ronment. Accordingly, the procedures, time and costs involved in
getting connected electricity, combined with the unreliability of
the power supply and the per unit electricity bills are factors that
contribute to making Nigeria a tough place to do business. Using
Lagos State as a proxy, it takes 184 days (6 months) on average
from the moment you submit an application for electricity connec-
tion to initial electricity flow. In the 2016 rankings, Nigeria came
182 out of 189 countries in the ‘Ease of getting electricity’ sub-
index. Furthermore, Nigeria scores 0 out of 8 on the reliability of
supply and transparency of tariff index.
Page 12
A Financial Derivatives Company Publication
: 7739831, 7798998, 2715414; Email: [email protected]; Website: www.fdcng.com
This means that if Nigeria is to realize the dream of becoming the
number 1 FDI destination in the world, with a booming economy
and tourism, then something needs to be done about power- and
fast! Constant and reliable electricity will cut business costs; this
will translate into increased efficiency, productivity, output, job
creation and economic activity.
Challenges
The challenges the power sector faces are deep-rooted and multi-
faceted.
At the generation level, GENCOs continue to produce at sub-
optimal levels; yet, even if they did not, their total installed ca-
pacity would still be unable to meet electricity demands. Outdated
technology, poor maintenance, low investments etc. are some
reasons for this. The GENCOs that use natural gas are also af-
fected by pipeline vandalism and exchange rate illiquidity, both of
which lead to gas shortages and shortfall in generation.
At the transmission level, the national grid’s carrying power is too
modest, such that even if GENCOS were to generate more, the
grid would not be able to handle it. In addition to this, great
amounts of electricity are lost in transmission. Although TNC
claims an average transmission loss of about 8.5%, the loss is
estimated to be much greater due to deteriorating infrastructure.
Furthermore, the DISCOs battle with customers who do not pay
their bills- the biggest culprit being the Nigerian government. As
at Q1’2016, the government had about $300m in unpaid electric-
ity bills*. While it is easier for DISCO agents to threaten the aver-
age citizen with notices and written warnings, it more difficult to
do so with national departments such as the army barracks.
Operators also complain that the current tariff levels are not suffi-
cient to break even. The Nigerian Electricity Regulation Commis-
sion had been ordered to reverse its 45% hike in tariffs by the
Federal High Court in Lagos. Backed by the Ministry of Power, the
NERC is seeking appeal at the Supreme Court.
It is no surprise that these energy industry players have huge
debt burdens. As at March 2016, GENCOs had outstanding loans
Page 13
A Financial Derivatives Company Publication
: 7739831, 7798998, 2715414; Email: [email protected]; Website: www.fdcng.com
of N367 in total. TCN and DISCOs have a joint debt of N162bn.
This increases the profitability risk of the sector and discourages
further private investments.
The way forward
The major problem of the power sector is one of funds and infra-
structure, which can only be tackled with investments into pro-
curement, maintenance and operation. The government has initi-
ated a N213bn Nigerian Electricity Market Stabilization Facility
(NEMSF), out of which a total of N55.4bn has been disbursed so
far. Additionally, according to a Memorandum of Understanding
with Chinese firms, about $50m would be invested into gas infra-
structure, pipelines, power etc. If implemented efficiently and
completely, this brings large promise to the power sector.
However, there are still some risks that need to be curbed to im-
prove the attractiveness of the sector and draw more inflows in
the long run. These involve certainty and predictability of policies
and regulations as well as returns and profit. A profitable market
with an equilibrium price and a favorable policy environment will
attract investment flows.
Thus, the problem must also be approached from the bottom up
i.e. from the consumers to the GENCOs. This includes tackling is-
sues of appropriate pricing and overdue payments.
Conclusion
Nigeria’s vision 2020 is to produce 35,000 MW, the estimated
amount needed to meet consumption needs*. While this originally
seemed far-fetched when the goal was set in 2010, it is all the
more implausible now, as 4 years to the deadline the country still
produces 4,000 MW. However, if these issues are addressed the
nation would be one step closer to the ideal of 24/7 electricity.
Page 14
A Financial Derivatives Company Publication
: 7739831, 7798998, 2715414; Email: [email protected]; Website: www.fdcng.com

A Financial Derivatives Company Publication
: 7739831, 7798998, 2715414; Email: [email protected]; Website: www.fdcng.com
Global Perspective – Culled from the Econo-
mist
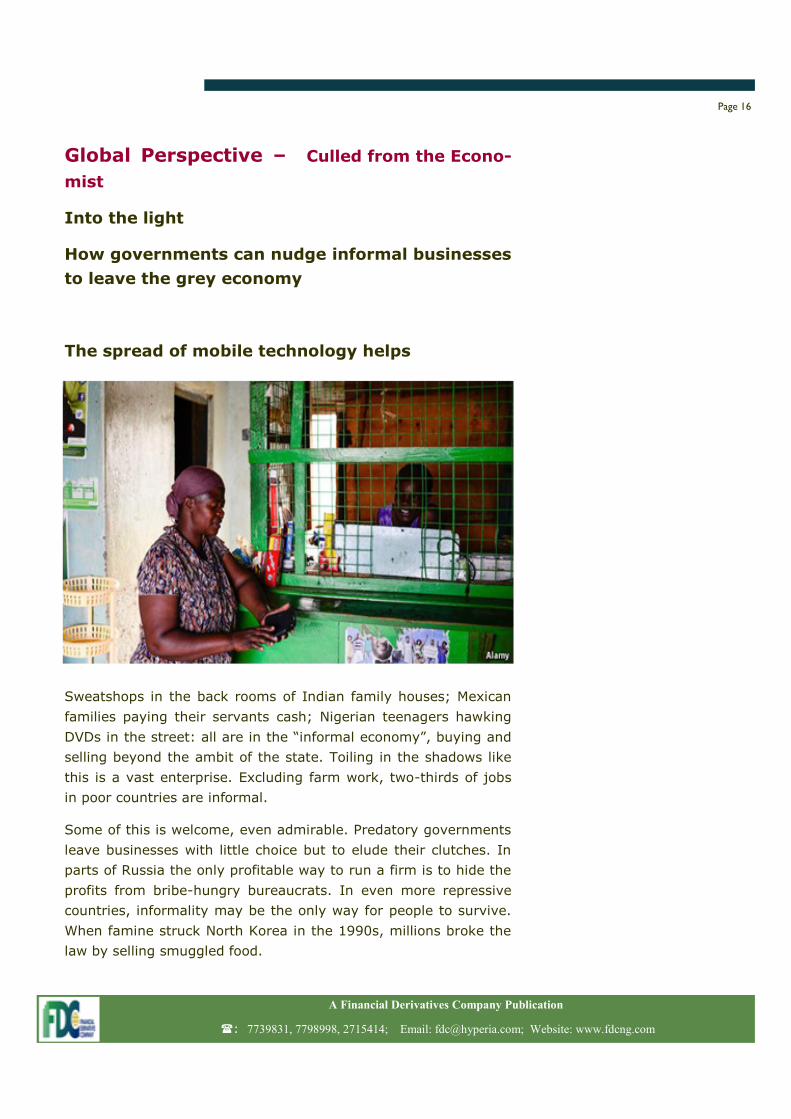
Into the light
How governments can nudge informal businesses
to leave the grey economy
The spread of mobile technology helps
Sweatshops in the back rooms of Indian family houses; Mexican
families paying their servants cash; Nigerian teenagers hawking
DVDs in the street: all are in the “informal economy”, buying and
selling beyond the ambit of the state. Toiling in the shadows like
this is a vast enterprise. Excluding farm work, two-thirds of jobs
in poor countries are informal.
Some of this is welcome, even admirable. Predatory governments
leave businesses with little choice but to elude their clutches. In
parts of Russia the only profitable way to run a firm is to hide the
profits from bribe-hungry bureaucrats. In even more repressive
countries, informality may be the only way for people to survive.
When famine struck North Korea in the 1990s, millions broke the
law by selling smuggled food.
Page 16
A Financial Derivatives Company Publication
: 7739831, 7798998, 2715414; Email: [email protected]; Website: www.fdcng.com
But slogging away in the grey economy is not always noble. Some
people work informally because they can get away with it; others
because it is all they know. Either way, informality hurts workers
and their fellow citizens. Fortunately, smart policies and the
spread of mobile technology can, together, help bring them out of
the shadows.
For almost any business, operating informally has its upsides.
Hiding revenues, or paying staff in cash, is an easy way of cutting
a tax bill. Avoiding regulations lets people pocket more profit. And
yet what makes sense today can be an act of self-harm tomorrow.
Informal firms have weak property rights. This makes it tough to
secure finance, so they struggle to become more productive.
Rarely do they grow.
The drawbacks are widely spread. Informal firms tend to pay
measly wages and offer few or no employee benefits. They also
deprive the state of income and sales taxes. So governments tax
other sorts of economic activity instead, causing harmful distor-
tions, for example by raising income taxes on workers in the
mainstream economy. It is no coincidence that Greece, which by
one calculation has an informal economy about as big as its for-
mal one, has such poor public finances.
Beware of the dark
The problem is that once an informal economy has formed, it is
hard to tackle. No company wants to be the first to go clean, lest
they lose out to other firms in the same industry. The idea of pay-
ing extra tax appeals to no one.
How can governments shift their economies out of this bad equi-
librium? One option is to crush the informal sector. Italy’s Guardia
di Finanza is part of the country’s armed forces. (Pasta-scoffers be
warned: tourists without a proper receipt for their meal can be
fined.) Another common strategy is to set up hotlines, where nosy
neighbours can report suspected misdeeds.
Such punitive measures are occasionally successful. But to spur a
large-scale move out of informality, firms need to see the benefits
of changing their ways. That means governments doing what it
Page 17
A Financial Derivatives Company Publication
: 7739831, 7798998, 2715414; Email: [email protected]; Website: www.fdcng.com
takes to make the formal economy more appealing and easier to
enter.
Grand reforms, such as creating an effective tax system, are im-
portant. But there are also easy wheezes that will nudge citizens
to behave better. Consider one: receipt lotteries. These put pres-
sure on businesses to register revenues by encouraging shoppers
to ask for proof of purchase. Every month or so, the holder of a
lucky receipt number wins a chunk of cash. Since São Paulo intro-
duced its lottery in 2007, more businesses have registered with
the city, and the tax take has swelled. Efforts to show citizens
that public money is wisely spent may also improve “tax mo-
rale”—the sense that paying taxes is a duty.
As technology improves, nudging will become easier, because the
benefits of the formal economy should become more apparent.
Around 80% of adults worldwide will have a smartphone by 2020.
That means more transactions will be recorded digitally. Informal
entrepreneurs will find it harder to do business in cash alone. At
the same time, they will find it easier to apply for credit, bringing
them into the formal economy. Tax authorities can also use digital
platforms to monitor economic activity. Some European countries
are already offering free record-keeping software to companies in
an effort to entice cash-only businesses into the formal sector.
Informality is a wise last resort for many of the world’s poorest.
But for others, life in the shadows is a needless waste. Policies
that draw them into the light need not be complicated or expen-
sive, but they can do a lot of good
Page 18
A Financial Derivatives Company Publication
: 7739831, 7798998, 2715414; Email: [email protected]; Website: www.fdcng.com

Macroeconomics Indicators
Money Market
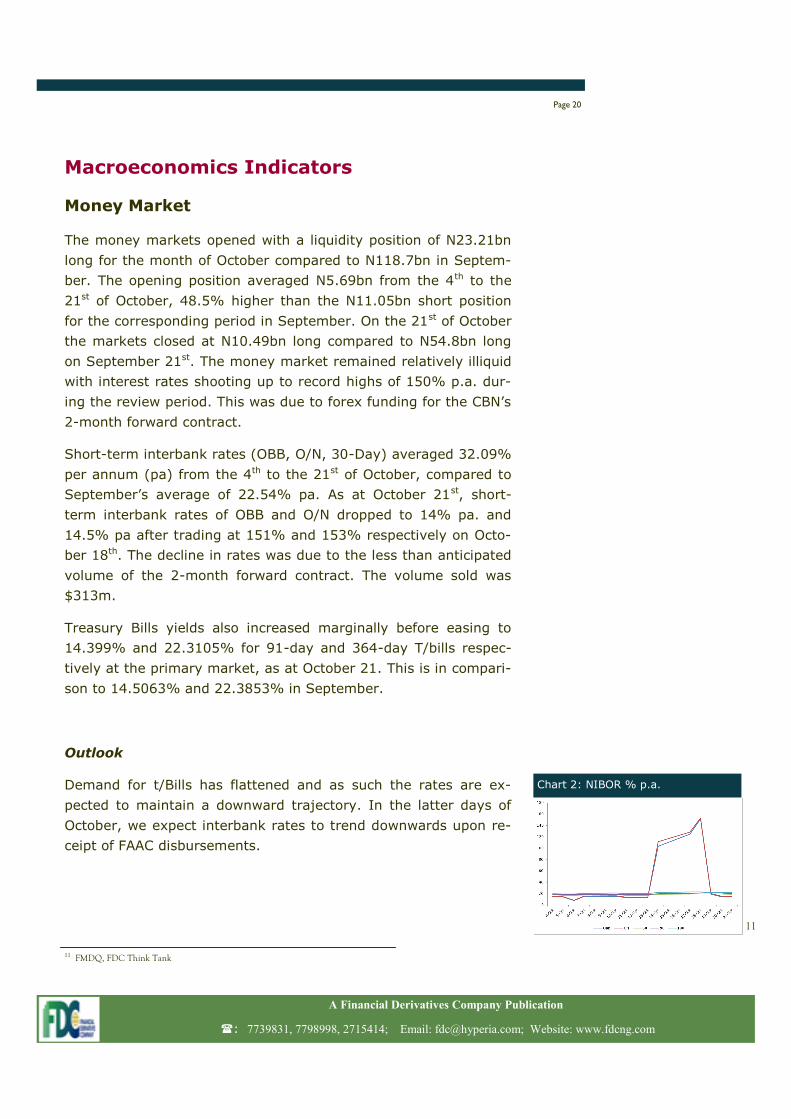
The money markets opened with a liquidity position of N23.21bn
long for the month of October compared to N118.7bn in Septem-
ber. The opening position averaged N5.69bn from the 4th to the
21st of October, 48.5% higher than the N11.05bn short position
for the corresponding period in September. On the 21st of October
the markets closed at N10.49bn long compared to N54.8bn long
on September 21st. The money market remained relatively illiquid
with interest rates shooting up to record highs of 150% p.a. dur-
ing the review period. This was due to forex funding for the CBN’s
2-month forward contract.
Short-term interbank rates (OBB, O/N, 30-Day) averaged 32.09%
per annum (pa) from the 4th to the 21st of October, compared to
September’s average of 22.54% pa. As at October 21st, short-
term interbank rates of OBB and O/N dropped to 14% pa. and
14.5% pa after trading at 151% and 153% respectively on Octo-
ber 18th. The decline in rates was due to the less than anticipated
volume of the 2-month forward contract. The volume sold was
$313m.
Treasury Bills yields also increased marginally before easing to
14.399% and 22.3105% for 91-day and 364-day T/bills respec-
tively at the primary market, as at October 21. This is in compari-
son to 14.5063% and 22.3853% in September.
Outlook
Demand for t/Bills has flattened and as such the rates are ex-
pected to maintain a downward trajectory. In the latter days of
October, we expect interbank rates to trend downwards upon re-
ceipt of FAAC disbursements.
Page 20
A Financial Derivatives Company Publication
: 7739831, 7798998, 2715414; Email: [email protected]; Website: www.fdcng.com
11 FMDQ, FDC Think Tank
Chart 2: NIBOR % p.a.
11
Oil Market
Oil Prices
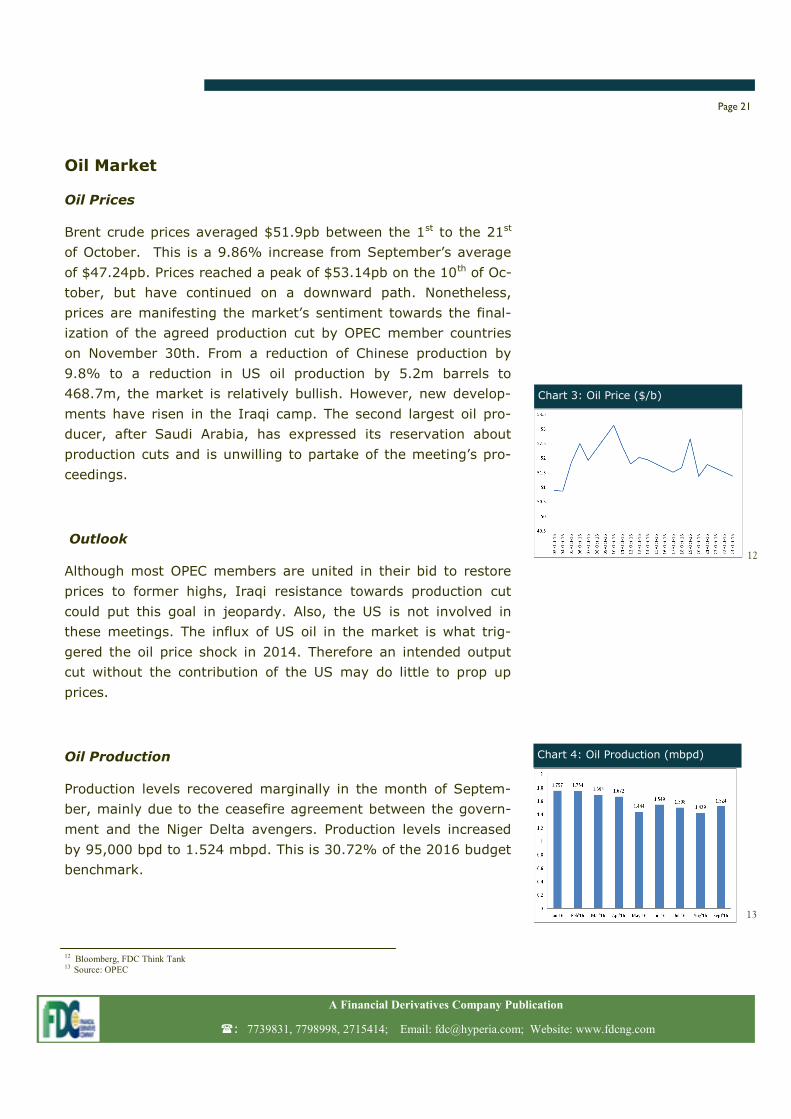
Brent crude prices averaged $51.9pb between the 1st to the 21st
of October. This is a 9.86% increase from September’s average
of $47.24pb. Prices reached a peak of $53.14pb on the 10th of Oc-
tober, but have continued on a downward path. Nonetheless,
prices are manifesting the market’s sentiment towards the final-
ization of the agreed production cut by OPEC member countries
on November 30th. From a reduction of Chinese production by
9.8% to a reduction in US oil production by 5.2m barrels to
468.7m, the market is relatively bullish. However, new develop-
ments have risen in the Iraqi camp. The second largest oil pro-
ducer, after Saudi Arabia, has expressed its reservation about
production cuts and is unwilling to partake of the meeting’s pro-
ceedings.
Outlook
Although most OPEC members are united in their bid to restore
prices to former highs, Iraqi resistance towards production cut
could put this goal in jeopardy. Also, the US is not involved in
these meetings. The influx of US oil in the market is what trig-
gered the oil price shock in 2014. Therefore an intended output
cut without the contribution of the US may do little to prop up
prices.
Oil Production
Production levels recovered marginally in the month of Septem-
ber, mainly due to the ceasefire agreement between the govern-
ment and the Niger Delta avengers. Production levels increased
by 95,000 bpd to 1.524 mbpd. This is 30.72% of the 2016 budget
benchmark.
Page 21
A Financial Derivatives Company Publication
: 7739831, 7798998, 2715414; Email: [email protected]; Website: www.fdcng.com
Chart 3: Oil Price ($/b)
12
12 Bloomberg, FDC Think Tank 13 Source: OPEC
Chart 4: Oil Production (mbpd)
13
Outlook
The outlook on Nigeria’s production level is subject to further at-
tacks by the militants. If the cease fire is temporary, this could
result in further decline in output below 1.5mbpd.
Forex Market
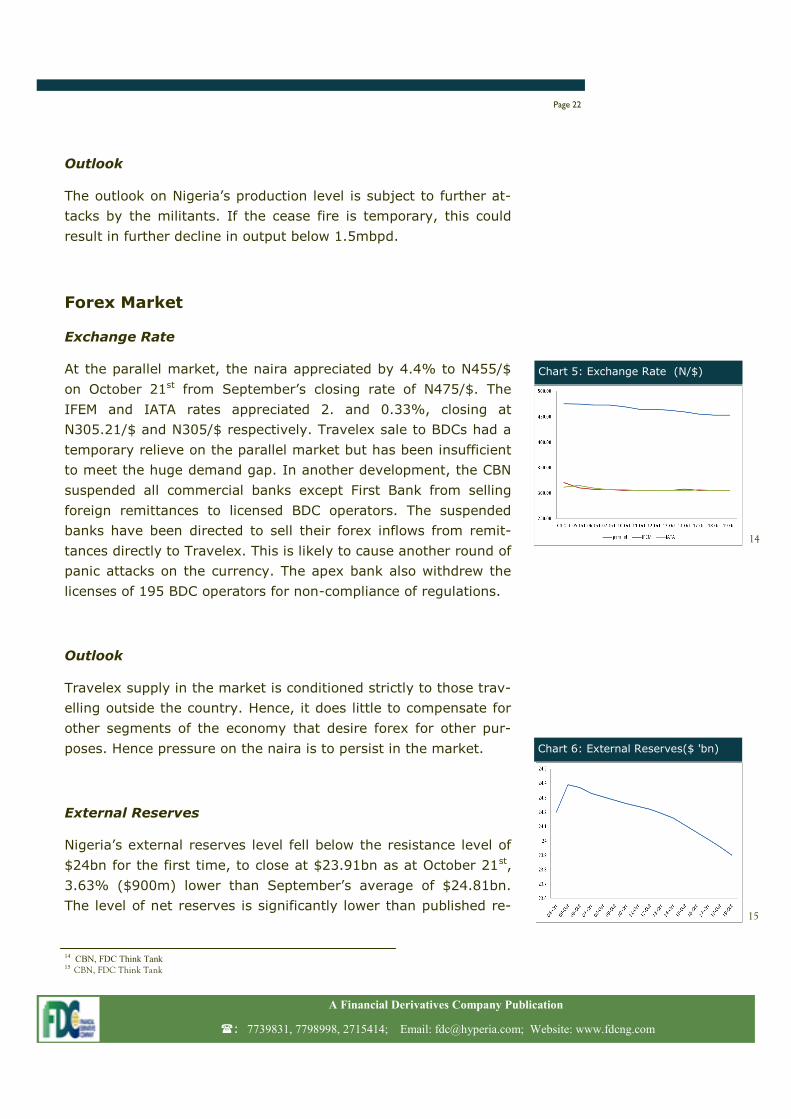
Exchange Rate
At the parallel market, the naira appreciated by 4.4% to N455/$
on October 21st from September’s closing rate of N475/$. The
IFEM and IATA rates appreciated 2. and 0.33%, closing at
N305.21/$ and N305/$ respectively. Travelex sale to BDCs had a
temporary relieve on the parallel market but has been insufficient
to meet the huge demand gap. In another development, the CBN
suspended all commercial banks except First Bank from selling
foreign remittances to licensed BDC operators. The suspended
banks have been directed to sell their forex inflows from remit-
tances directly to Travelex. This is likely to cause another round of
panic attacks on the currency. The apex bank also withdrew the
licenses of 195 BDC operators for non-compliance of regulations.
Outlook
Travelex supply in the market is conditioned strictly to those trav-
elling outside the country. Hence, it does little to compensate for
other segments of the economy that desire forex for other pur-
poses. Hence pressure on the naira is to persist in the market.
External Reserves
Nigeria’s external reserves level fell below the resistance level of
$24bn for the first time, to close at $23.91bn as at October 21st,
3.63% ($900m) lower than September’s average of $24.81bn.
The level of net reserves is significantly lower than published re-
Page 22
A Financial Derivatives Company Publication
: 7739831, 7798998, 2715414; Email: [email protected]; Website: www.fdcng.com
Chart 5: Exchange Rate (N/$)
14
Chart 6: External Reserves($ 'bn)
15
14 CBN, FDC Think Tank 15 CBN, FDC Think Tank
ports. Year to date, the gross reserves level has declined by
17.5% ($5.08bn). The external reserves level is 30.72% below
2015’s peak of $34.51bn and 21.58% lower than 2015’s average
of $30.89bn.
Outlook
The International Monetary Fund (IMF) expects Nigeria’s external
reserves level to decline to $19bn-$21.5bn by the end of
2016. The outstanding obligations are in excess of $4bn. If there
is no improvement in oil production and dollar inflows, we expect
to see a further depletion in the reserves level.
Page 23
A Financial Derivatives Company Publication
: 7739831, 7798998, 2715414; Email: [email protected]; Website: www.fdcng.com

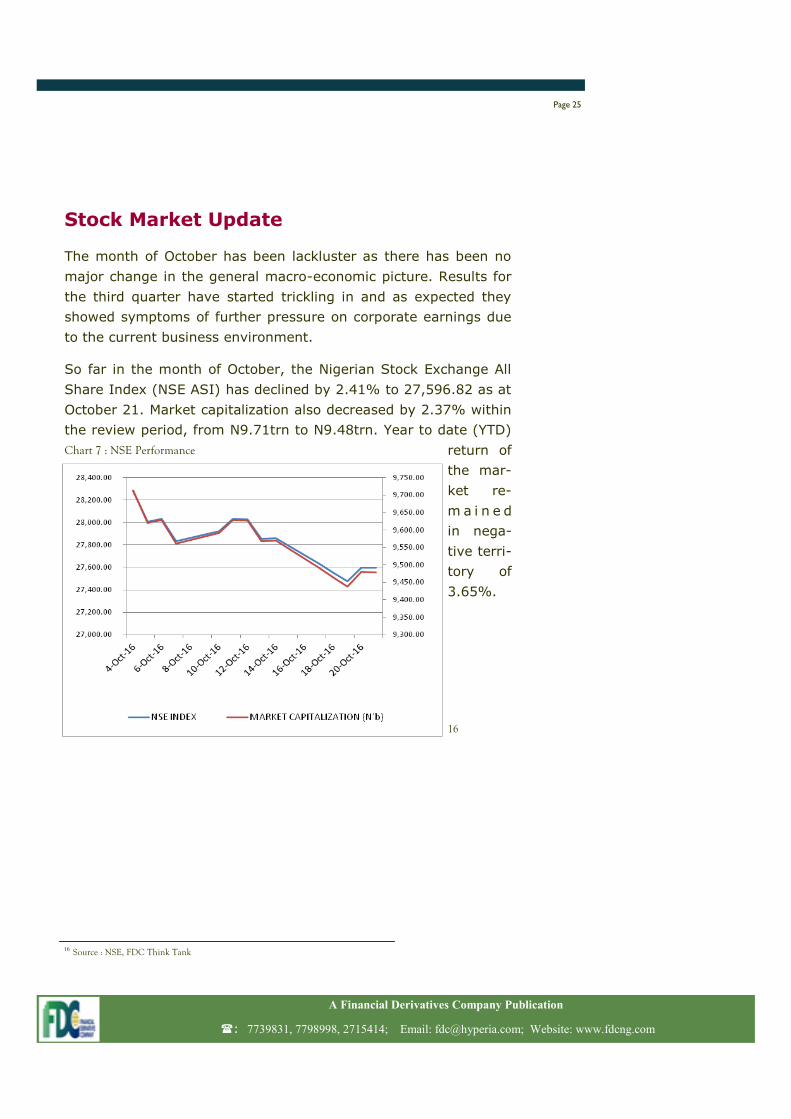
Stock Market Update
The month of October has been lackluster as there has been no
major change in the general macro-economic picture. Results for
the third quarter have started trickling in and as expected they
showed symptoms of further pressure on corporate earnings due
to the current business environment.
So far in the month of October, the Nigerian Stock Exchange All
Share Index (NSE ASI) has declined by 2.41% to 27,596.82 as at
October 21. Market capitalization also decreased by 2.37% within
the review period, from N9.71trn to N9.48trn. Year to date (YTD)
return of
the mar-
ket re-
m a i n e d
in nega-
tive terri-
tory of
3.65%.
Page 25
A Financial Derivatives Company Publication
: 7739831, 7798998, 2715414; Email: [email protected]; Website: www.fdcng.com
16 Source : NSE, FDC Think Tank
Chart 7 : NSE Performance
16
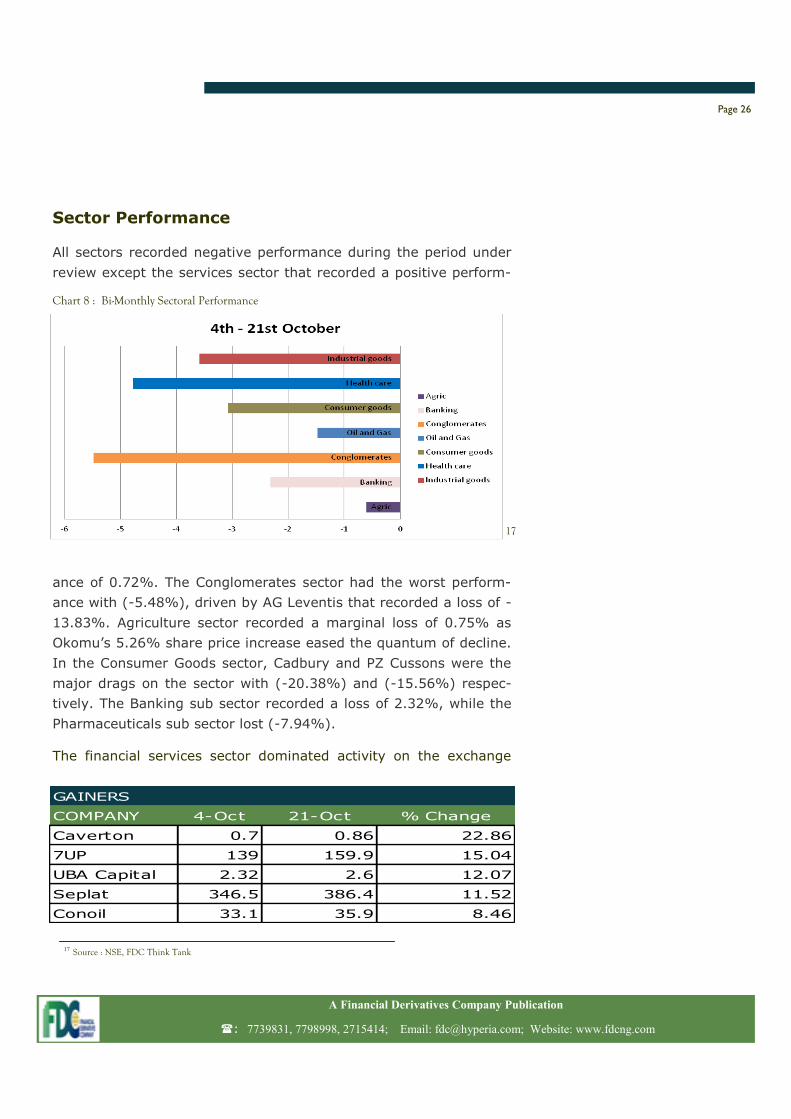
Sector Performance
All sectors recorded negative performance during the period under
review except the services sector that recorded a positive perform-
ance of 0.72%. The Conglomerates sector had the worst perform-
ance with (-5.48%), driven by AG Leventis that recorded a loss of -
13.83%. Agriculture sector recorded a marginal loss of 0.75% as
Okomu’s 5.26% share price increase eased the quantum of decline.
In the Consumer Goods sector, Cadbury and PZ Cussons were the
major drags on the sector with (-20.38%) and (-15.56%) respec-
tively. The Banking sub sector recorded a loss of 2.32%, while the
Pharmaceuticals sub sector lost (-7.94%).
The financial services sector dominated activity on the exchange
Page 26
A Financial Derivatives Company Publication
: 7739831, 7798998, 2715414; Email: [email protected]; Website: www.fdcng.com
Chart 8 : Bi-Monthly Sectoral Performance
17
COMPANY 4-Oct 21-Oct % Change
Caverton 0.7 0.86 22.86
7UP 139 159.9 15.04
UBA Capital 2.32 2.6 12.07
Seplat 346.5 386.4 11.52
Conoil 33.1 35.9 8.46
GAINERS
17 Source : NSE, FDC Think Tank
during the period under review accounting for 54.77% of the total
value traded. The oil and gas sector constituted 18.27% while Con-
sumer goods, industrial goods and conglomerates sectors ac-
counted for 16.17%, 6.96% and 1.39% respectively. Total value of
stocks traded within the period was 23.26bn while market breadth
was 0.32x as 60 stocks declined against 19 stocks that advanced.
105 stocks remained unchanged during the period under review.
The best performing stocks include Caverton 22.86%, 7UP 15.04%,
UBA Capital 12.07%, Seplat 11.52% and Conoil 8.46%.
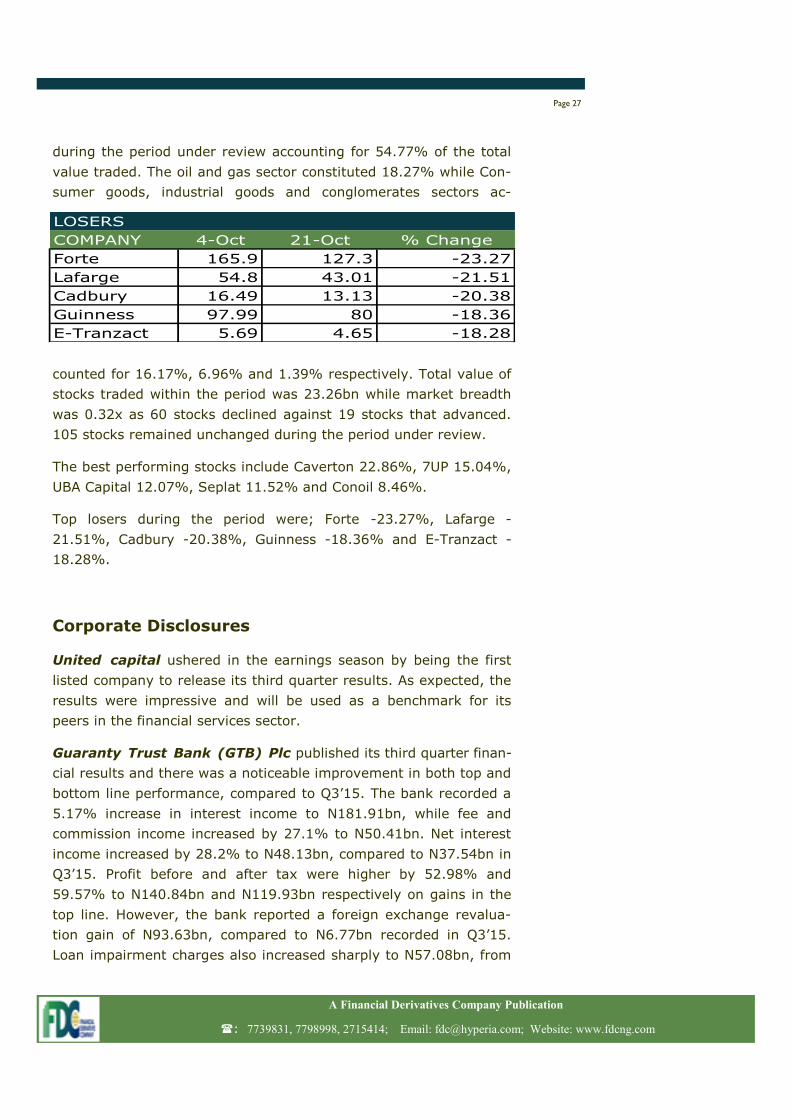
Top losers during the period were; Forte -23.27%, Lafarge -
21.51%, Cadbury -20.38%, Guinness -18.36% and E-Tranzact -
18.28%.
Corporate Disclosures
United capital ushered in the earnings season by being the first
listed company to release its third quarter results. As expected, the
results were impressive and will be used as a benchmark for its
peers in the financial services sector.
Guaranty Trust Bank (GTB) Plc published its third quarter finan-
cial results and there was a noticeable improvement in both top and
bottom line performance, compared to Q3’15. The bank recorded a
5.17% increase in interest income to N181.91bn, while fee and
commission income increased by 27.1% to N50.41bn. Net interest
income increased by 28.2% to N48.13bn, compared to N37.54bn in
Q3’15. Profit before and after tax were higher by 52.98% and
59.57% to N140.84bn and N119.93bn respectively on gains in the
top line. However, the bank reported a foreign exchange revalua-
tion gain of N93.63bn, compared to N6.77bn recorded in Q3’15.
Loan impairment charges also increased sharply to N57.08bn, from
Page 27
A Financial Derivatives Company Publication
: 7739831, 7798998, 2715414; Email: [email protected]; Website: www.fdcng.com
COMPANY 4-Oct 21-Oct % Change
Forte 165.9 127.3 -23.27
Lafarge 54.8 43.01 -21.51
Cadbury 16.49 13.13 -20.38
Guinness 97.99 80 -18.36
E-Tranzact 5.69 4.65 -18.28
LOSERS
N8.51bn in the corresponding period last year.
Zenith Bank Plc. released its third quarter corporate earnings
which showed improvements in both top and bottom line. Gross
earnings increased by 12.9% to N380.35bn from N336.85bn in
Q3’16. Notwithstanding, impairment charges increased by
38.53% to N21.86bn from N15.78bn in the corresponding period
in 2015. Profit before tax (PBT) increased by 16.6% to N121.28bn
while profit after tax (PAT) increased by 20.4% to N100.07bn.
Outlook
We expect the release of more third quarter results to continue to
drive the performance of the equities market in the coming week.
We therefore advise investors to be cautious in their activities on
the bourse and maintain a medium to long-term investment hori-
zon
Page 28
A Financial Derivatives Company Publication
: 7739831, 7798998, 2715414; Email: [email protected]; Website: www.fdcng.com

Corporate Focus
Equity Report: Unilever Nigeria Plc.
Analysts Recommendation: SELL
Recommendation Period: 365 days
Industry: Consumer Goods
Market Capitalization: N139.04bn
Current Price: N45.90
Target Price: N13.45
The FDC Think Tank places a SELL recommendation on Unilever Ni-
geria Plc following a comprehensive analysis of the company.
Recent challenging macroeconomic conditions caused a contraction
in domestic output. In July 2016, the Central Bank of Nigeria (CBN)
announced an unusual increase of 200 basis points (bps) in mone-
tary policy rate (MPR). Manufacturers face rising raw materials and
logistics costs caused by the increase in the cost of the dollar and
an upward review of the Premium Motor Spirit (PMS) price from
N86.5 to N145/ per liter. While households cut down on spending,
the consumer goods industry has proven to be resilient and regis-
tering growth.
Page 30
A Financial Derivatives Company Publication
: 7739831, 7798998, 2715414; Email: [email protected]; Website: www.fdcng.com
Unilever Nigeria Plc’s H1’16 revenue grew 12.4% to N32.27bn, up
from N28.72bn recorded a year earlier. While the company posted a
half year results decline of 94% in profit after tax (PAT) from
N1.46bn (2014) to N85.5m (2015), it showed remarkable improve-
ment in its H1’16 results, which reported N1.09bn in PAT. Its share
price increased by 14.8% in the ten weeks following the half year
results.
Unilever plans to further increase its investment in Nigeria by ac-
quiring farmlands to grow most of its inputs and secure the supply
of essential ingredients for the long term. This strategy increases
competitiveness by providing affordable, nutritious and sustainable
products as the economy recovers. Given these investments, Unile-
ver could remain a leading figure in the consumer goods industry.
Yet, the cumulative effects of supply shocks, in the foreign ex-
change (forex) and energy markets, pose a colossal threat to its
ability to grow revenues consistently. While the devaluation of the
naira created a 12.4% increase in revenues, the company’s inability
to pass on higher costs to consumers affects its profitability. The
company’s receivables increased by 40% (H1’16) hampering its
ability to generate cash. Unilever is currently operating on a debt
1.5 times greater than its shareholders’ equity of N8.9bn. Approxi-
mately 94% of its loans are short-term. It is unlikely that lenders
will call in the loans. Yet, the highly leveraged position remains a
cause for concern, and could possibly cartwheel into a liquidity cri-
sis.
Unilever’s share price for 2016 opened at N43.18. It has gained
6.3% year-to-date (YTD) and 7.3% in the past year. In June 2015
the company’s parent company, Unilever Overseas Holdings BV,
restated its intention to raise its stake in the Nigerian market to
75%, pending regulatory approvals. The company has a price earn-
ings multiple of 65. (Investors are willing to pay 65 times the com-
pany’s reported earnings for a share, as against an industry aver-
age of 19.)
We believe that Unilever’s stock is overvalued, and recommend a
SELL, as we do not foresee a sustainable appreciation in its share
price.
Page 31
A Financial Derivatives Company Publication
: 7739831, 7798998, 2715414; Email: [email protected]; Website: www.fdcng.com
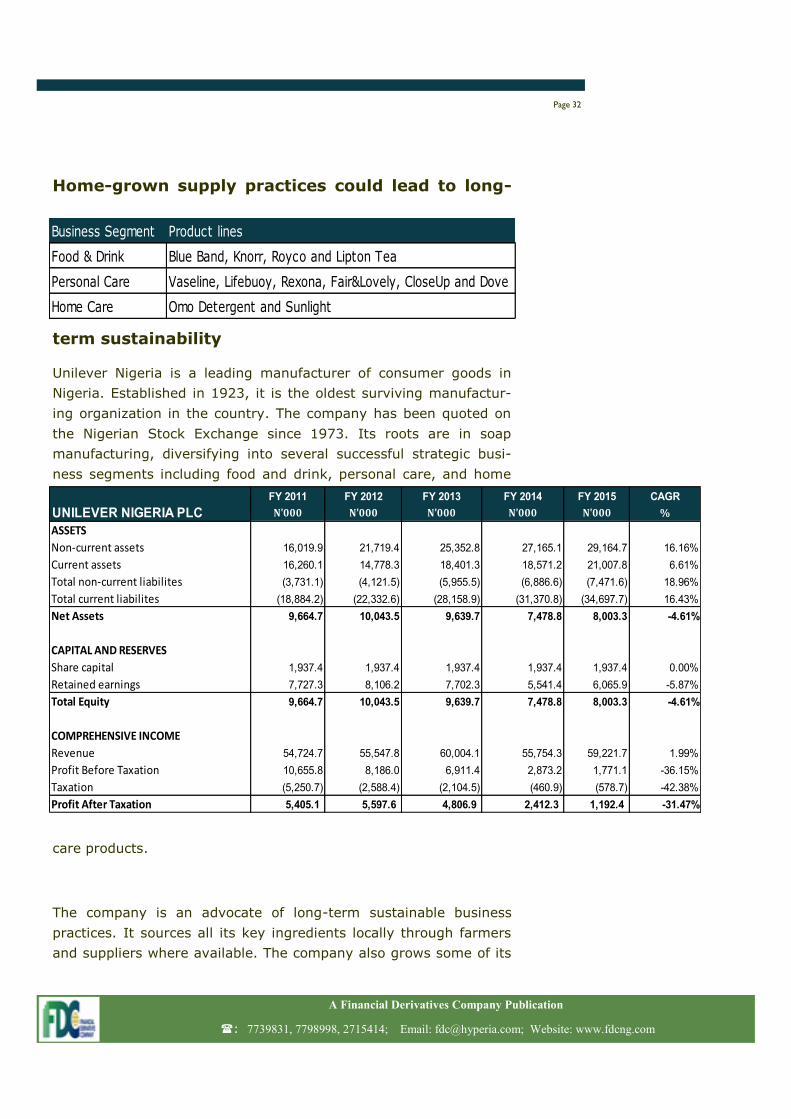
Home-grown supply practices could lead to long-
term sustainability
Unilever Nigeria is a leading manufacturer of consumer goods in
Nigeria. Established in 1923, it is the oldest surviving manufactur-
ing organization in the country. The company has been quoted on
the Nigerian Stock Exchange since 1973. Its roots are in soap
manufacturing, diversifying into several successful strategic busi-
ness segments including food and drink, personal care, and home
care products.
The company is an advocate of long-term sustainable business
practices. It sources all its key ingredients locally through farmers
and suppliers where available. The company also grows some of its
Page 32
A Financial Derivatives Company Publication
: 7739831, 7798998, 2715414; Email: [email protected]; Website: www.fdcng.com
Business Segment Product lines
Food & Drink Blue Band, Knorr, Royco and Lipton Tea
Personal Care Vaseline, Lifebuoy, Rexona, Fair&Lovely, CloseUp and Dove
Home Care Omo Detergent and Sunlight
FY 2011 FY 2012 FY 2013 FY 2014 FY 2015 CAGR
N'000 N'000 N'000 N'000 N'000 %
ASSETS
Non-current assets 16,019.9 21,719.4 25,352.8 27,165.1 29,164.7 16.16%
Current assets 16,260.1 14,778.3 18,401.3 18,571.2 21,007.8 6.61%
Total non-current liabilites (3,731.1) (4,121.5) (5,955.5) (6,886.6) (7,471.6) 18.96%
Total current liabilites (18,884.2) (22,332.6) (28,158.9) (31,370.8) (34,697.7) 16.43%
Net Assets 9,664.7 10,043.5 9,639.7 7,478.8 8,003.3 -4.61%
CAPITAL AND RESERVES
Share capital 1,937.4 1,937.4 1,937.4 1,937.4 1,937.4 0.00%
Retained earnings 7,727.3 8,106.2 7,702.3 5,541.4 6,065.9 -5.87%
Total Equity 9,664.7 10,043.5 9,639.7 7,478.8 8,003.3 -4.61%
COMPREHENSIVE INCOME
Revenue 54,724.7 55,547.8 60,004.1 55,754.3 59,221.7 1.99%
Profit Before Taxation 10,655.8 8,186.0 6,911.4 2,873.2 1,771.1 -36.15%
Taxation (5,250.7) (2,588.4) (2,104.5) (460.9) (578.7) -42.38%
Profit After Taxation 5,405.1 5,597.6 4,806.9 2,412.3 1,192.4 -31.47%
UNILEVER NIGERIA PLC
raw materials on agricultural lands it owns. Exposure to currency
volatility and uncertainty is reduced through a sustainable and se-
cure supply of essential ingredients. The company’s performance
over the years is in the snapshot of its financials shown below:
Macroeconomics work against Unilever’s growth
strategy
Unilever’s revenues grew approximately 8.3%, from N15.49bn in
Q1’16 to N16.78bn in Q2’16. This is an H1’16 increase of 12.4%
(YoY). Improvements in the food and drink, and home care seg-
ments propelled this growth. They increased by 22.3% to N16.86bn
and 25.2% to N7.49bn (YoY) respectively. A more efficient use of
third-party bank facilities saw finance costs drop by 55.6%. This
contributed to the N1.04bn profit reported in H1’16 in contrast to
N85.5m in H1’15.
The Fast Moving Consumer Goods (FMCG) sector remains one of
the fastest growing in the economy despite a decline in its contribu-
tion to GDP. The Nigerian consumer market, estimated at N15 tril-
lion, presents increasing opportunities. Companies, such as Unile-
ver, are at its forefront. Yet, there are several factors that can af-
fect Unilever’s future revenues and share price. The most prominent
is the domestic economy with its increased inflation, decreasing
value of the naira, depleting reserves and a fall in forex earnings
due to variances in oil production. The lower availability of dispos-
able income is also affecting sales in the FMCG sector as consumers
choose cheaper substitutes. Thus, Unilever’s performance walks a
macroeconomic tightrope with management navigating an unpre-
dictable environment.
Management
His Majesty Nnaemeka Achebe CFR, MNI, the Obi of Onitsha, who
joined Unilever in 2003, leads the board. Managing Director, Mr.
Yaw Nsarkoh has led the company since 2004. He has held many
portfolios throughout his 23-year career within Unilever.
The executive management includes knowledgeable individuals who
Page 33
A Financial Derivatives Company Publication
: 7739831, 7798998, 2715414; Email: [email protected]; Website: www.fdcng.com
have worked in Unilever in various capacities. Their perceived com-
mitment to expand in Nigeria earned them the support of the Nige-
rian Senate and the Ministry of Trade and Investment in a press re-
lease in January 2016. This support could enable management to
put in place their strategy to acquire farmlands in secure locations
throughout the country. If Unilever is successful in diversifying, it
could regain and perhaps exceed previous levels of success.
Bulls Say:
Prominent brand value across all its business segments
Investments in its sustainable sourcing program could reduce
costs and enhance the company’s profitability margins
Extensive distribution channels, which could be strengthened
through retail network optimization and strategic expansion
Experienced management team
Bears Say:
Intense competition in the food and drink segments of the con-
sumer goods industry
Increasing consumer resistance, due to lower disposable in-
come, could lead to slowdown in sales
Disruptions in distribution and sales channels, due to insecurity
and insurgency, to put pressure on margins
Performance also limited by higher energy costs and borrowing
costs
Emergence of cheaper substitutes as consumer demand for
economy brands rises
Risks & Outlook: Markets, recession and reduced
Page 34
A Financial Derivatives Company Publication
: 7739831, 7798998, 2715414; Email: [email protected]; Website: www.fdcng.com
household spending
Unilever Nigeria faces several prevailing market risks and security
challenges in the country. Market risks include currency volatility
and uncertainty in the prices of raw materials. With commodity
prices increasing, the company needs to speed up its local sourcing
program to hedge against increased costs of global goods.
Nigeria recorded a negative growth of -2.06% in Q2’16. This con-
firms the economy is in a recession. In spite of management’s abil-
ity to cope with the macroeconomic challenges it faces, the head-
winds, such as weak consumer demand could challenge the com-
pany’s performance.
Finally, the macroeconomic factors and risks may reduce Unilever’s
potential full year performance in spite of the noteworthy H1’16 re-
sults. These factors, alongside our Unilever projections for FY’16,
show that the stock is overvalued. It will likely see a drop in its
share price in the foreseeable future, thus, supporting our SELL rec-
ommendation.
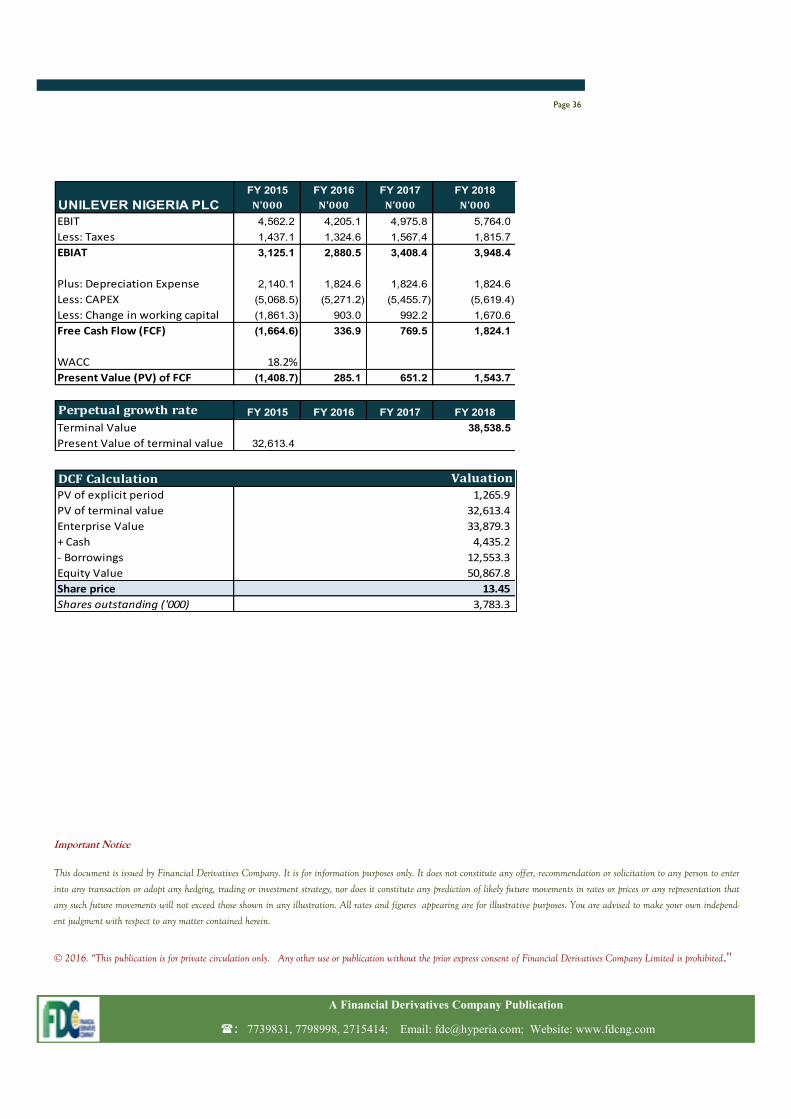
Appendix : Valuation
We derived our valuation for Unilever Nigeria Plc by using the Dis-
counted Cash Flow (DCF) methodology. Our fair value estimate for
Unilever Nigeria Plc is N13.45, which is a 70.7% downside on the
current share price as at October 21, 2016.
Unilever’s intrinsic value is derived to be N13.45 when the DCF
method is used. The discount rate or the weighted average cost of
capital (WACC) of 18.2%, is derived using a 14.99% risk free rate
(the rate for the 3 year FMDQ Bond maturing on August 2019), a
beta of 0.91, an after-tax cost of debt of 17.3%, and a market risk
premium of 5%. The long term cash flow growth rate to perpetuity
calculated is 12.8%.
Despite Unilever’s impressive H1’16 result and its expansionary
plans, we foresee a three-year revenue CAGR of 3.63%. This is off
the back of deteriorating macroeconomic conditions alongside in-
creasing consumer resistance and switch to more affordable substi-
tutes.
A Financial Derivatives Company Publication
: 7739831, 7798998, 2715414; Email: [email protected]; Website: www.fdcng.com
Page 35
Page 36
A Financial Derivatives Company Publication
: 7739831, 7798998, 2715414; Email: [email protected]; Website: www.fdcng.com
FY 2015 FY 2016 FY 2017 FY 2018
N'000 N'000 N'000 N'000
EBIT 4,562.2 4,205.1 4,975.8 5,764.0
Less: Taxes 1,437.1 1,324.6 1,567.4 1,815.7
EBIAT 3,125.1 2,880.5 3,408.4 3,948.4
Plus: Depreciation Expense 2,140.1 1,824.6 1,824.6 1,824.6
Less: CAPEX (5,068.5) (5,271.2) (5,455.7) (5,619.4)
Less: Change in working capital (1,861.3) 903.0 992.2 1,670.6
Free Cash Flow (FCF) (1,664.6) 336.9 769.5 1,824.1
WACC 18.2%
Present Value (PV) of FCF (1,408.7) 285.1 651.2 1,543.7
Perpetual growth rate FY 2015 FY 2016 FY 2017 FY 2018
Terminal Value 38,538.5
Present Value of terminal value 32,613.4
DCF CalculationPV of explicit period
PV of terminal value
Enterprise Value
+ Cash
- Borrowings
Equity Value
Share price
Shares outstanding ('000)
13.45
3,783.3
32,613.4
33,879.3
4,435.2
12,553.3
50,867.8
Valuation
1,265.9
UNILEVER NIGERIA PLC
Important Notice
This document is issued by Financial Derivatives Company. It is for information purposes only. It does not constitute any offer, recommendation or solicitation to any person to enter
into any transaction or adopt any hedging, trading or investment strategy, nor does it constitute any prediction of likely future movements in rates or prices or any representation that
any such future movements will not exceed those shown in any illustration. All rates and figures appearing are for illustrative purposes. You are advised to make your own independ-
ent judgment with respect to any matter contained herein.
© 2016. “This publication is for private circulation only. Any other use or publication without the prior express consent of Financial Derivatives Company Limited is prohibited.”