Embed Size (px)
Citation preview
March 2017
Ilias LekkosParaskevi Vlachou
ECONOMIC RESEARCH AND INVESTMENT STRATEGY
Enterprise Rating System: the rhomboid structure of the Greek corporate universe
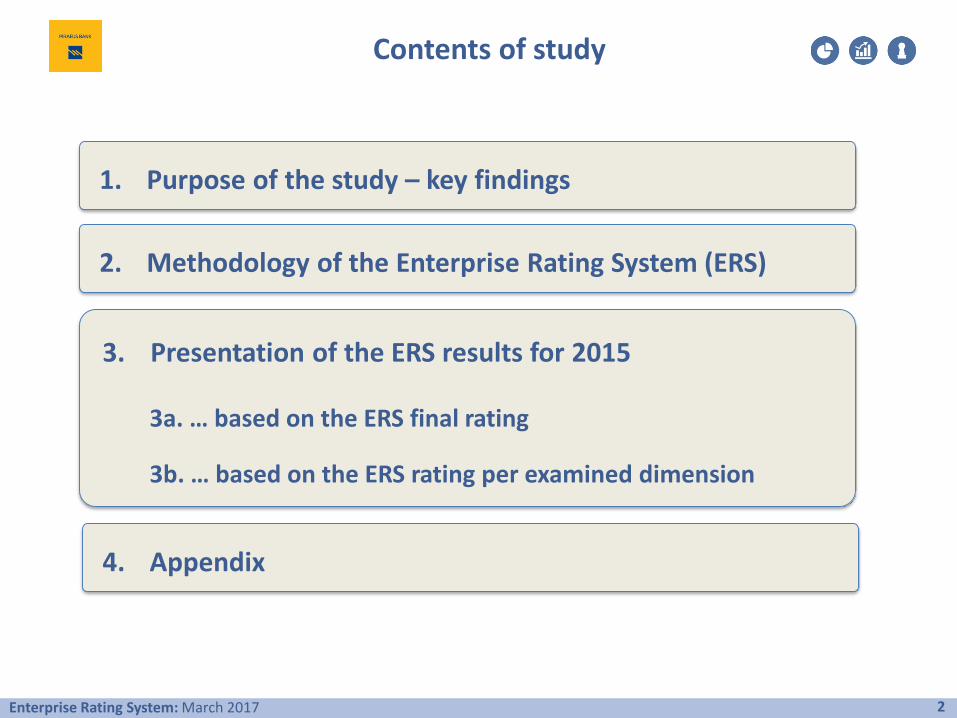
Contents of study
2Enterprise Rating System: March 2017
1. Purpose of the study – key findings
2. Methodology of the Enterprise Rating System (ERS)
3. Presentation of the ERS results for 2015
3a. … based on the ERS final rating
3b. … based on the ERS rating per examined dimension
4. Appendix
3Enterprise Rating System: March 2017
1. Purpose of the study – key findings
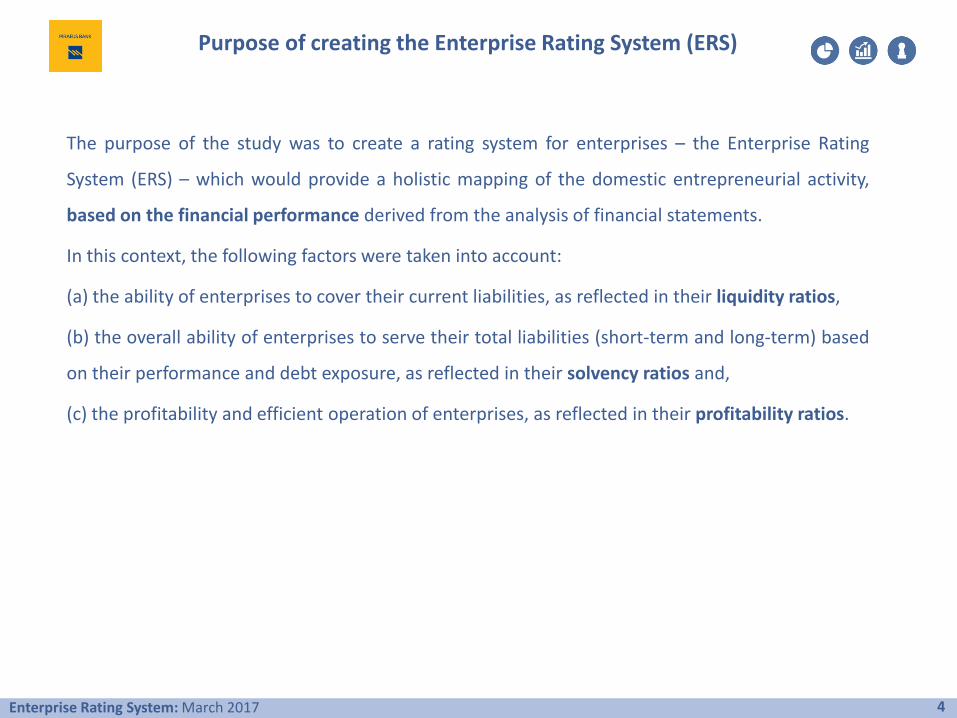
The purpose of the study was to create a rating system for enterprises – the Enterprise Rating
System (ERS) – which would provide a holistic mapping of the domestic entrepreneurial activity,
based on the financial performance derived from the analysis of financial statements.
In this context, the following factors were taken into account:
(a) the ability of enterprises to cover their current liabilities, as reflected in their liquidity ratios,
(b) the overall ability of enterprises to serve their total liabilities (short-term and long-term) based
on their performance and debt exposure, as reflected in their solvency ratios and,
(c) the profitability and efficient operation of enterprises, as reflected in their profitability ratios.
Purpose of creating the Enterprise Rating System (ERS)
4Enterprise Rating System: March 2017
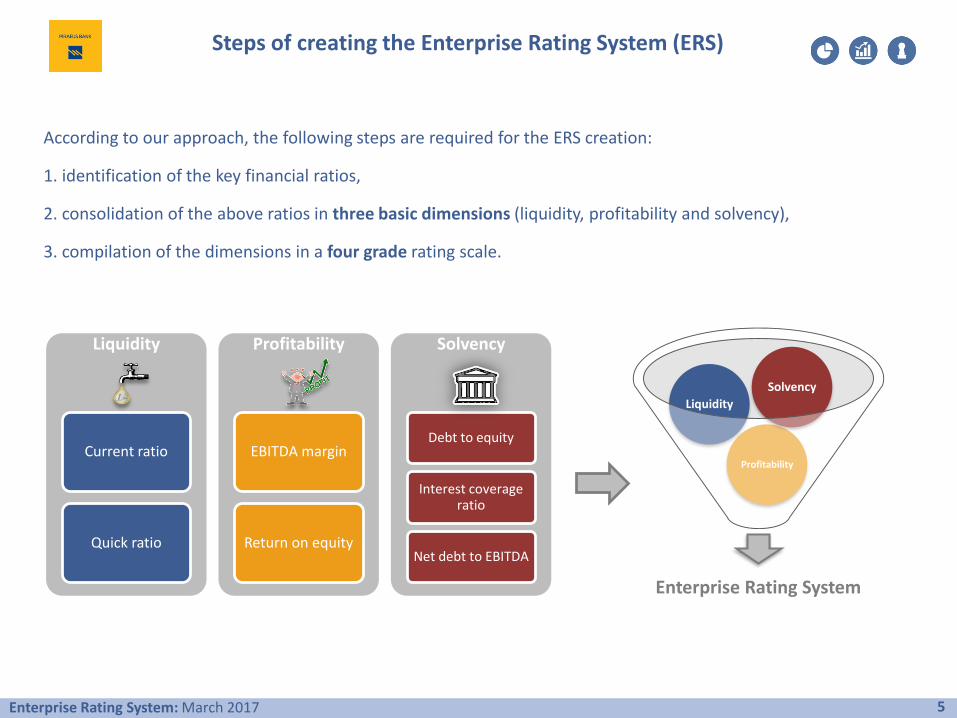
According to our approach, the following steps are required for the ERS creation:
1. identification of the key financial ratios,
2. consolidation of the above ratios in three basic dimensions (liquidity, profitability and solvency),
3. compilation of the dimensions in a four grade rating scale.
Steps of creating the Enterprise Rating System (ERS)
5Enterprise Rating System: March 2017
Liquidity
Current ratio
Quick ratio
Profitability
EBITDA margin
Return on equity
Solvency
Debt to equity
Interest coverage ratio
Net debt to EBITDA
Enterprise Rating System
Profitability
Liquidity
Solvency
Key findings (i)
6Enterprise Rating System: March 2017 Source: ICAP DATA, Piraeus Bank Research
Γενική ρευστότητα: 0,7
Άμεση ρευστότητα: 0,4
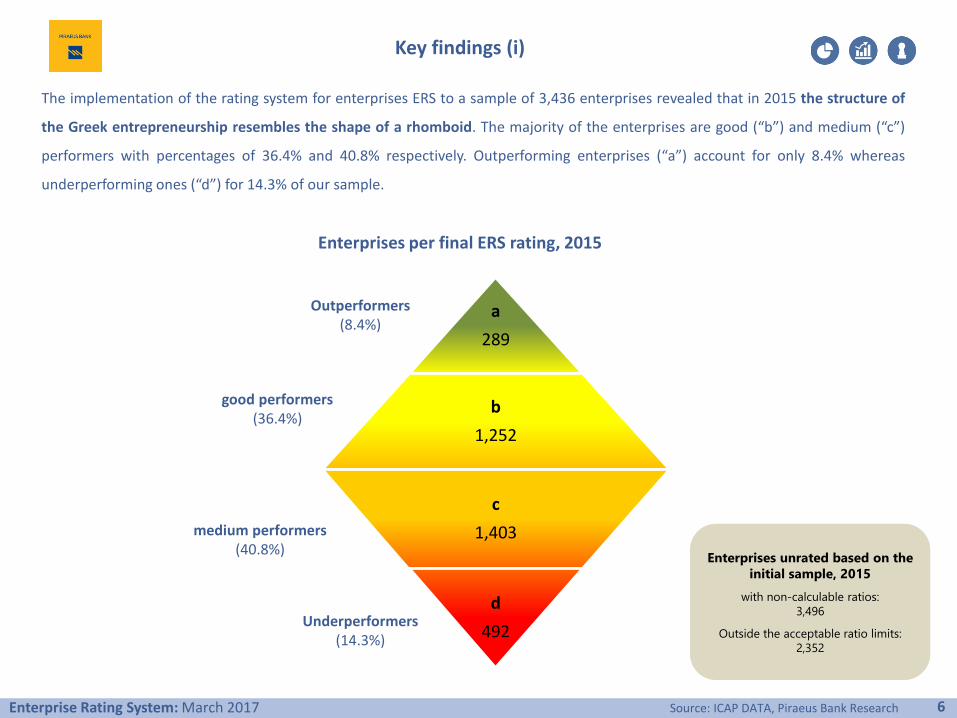
The implementation of the rating system for enterprises ERS to a sample of 3,436 enterprises revealed that in 2015 the structure of
the Greek entrepreneurship resembles the shape of a rhomboid. The majority of the enterprises are good (“b”) and medium (“c”)
performers with percentages of 36.4% and 40.8% respectively. Outperforming enterprises (“a”) account for only 8.4% whereas
underperforming ones (“d”) for 14.3% of our sample.
Outperformers(8.4%)
a
289
b
1,252
c
1,403
d
492
good performers(36.4%)
medium performers(40.8%)
Underperformers(14.3%)
Enterprises per final ERS rating, 2015
Enterprises unrated based on the
initial sample, 2015
with non-calculable ratios:
3,496
Outside the acceptable ratio limits:
2,352
Key findings (ii)
7Enterprise Rating System: March 2017 Source: ICAP DATA, Piraeus Bank Research
Γενική ρευστότητα: 0,7
Άμεση ρευστότητα: 0,4
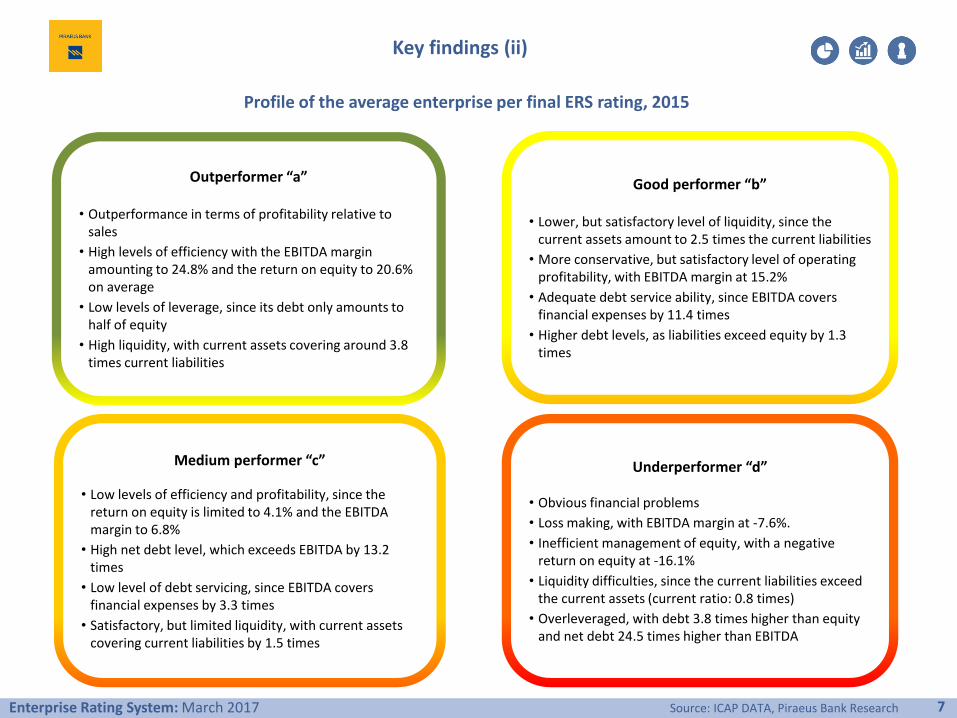
Profile of the average enterprise per final ERS rating, 2015
Outperformer “a”
• Outperformance in terms of profitability relative to sales
• High levels of efficiency with the EBITDA margin amounting to 24.8% and the return on equity to 20.6% on average
• Low levels of leverage, since its debt only amounts to half of equity
• High liquidity, with current assets covering around 3.8 times current liabilities
Good performer “b”
• Lower, but satisfactory level of liquidity, since the current assets amount to 2.5 times the current liabilities
• More conservative, but satisfactory level of operating profitability, with EBITDA margin at 15.2%
• Adequate debt service ability, since EBITDA covers financial expenses by 11.4 times
• Higher debt levels, as liabilities exceed equity by 1.3 times
Medium performer “c”
• Low levels of efficiency and profitability, since the return on equity is limited to 4.1% and the EBITDA margin to 6.8%
• High net debt level, which exceeds EBITDA by 13.2 times
• Low level of debt servicing, since EBITDA covers financial expenses by 3.3 times
• Satisfactory, but limited liquidity, with current assets covering current liabilities by 1.5 times
Underperformer “d”
• Obvious financial problems
• Loss making, with EBITDA margin at -7.6%.
• Inefficient management of equity, with a negative return on equity at -16.1%
• Liquidity difficulties, since the current liabilities exceed the current assets (current ratio: 0.8 times)
• Overleveraged, with debt 3.8 times higher than equity and net debt 24.5 times higher than EBITDA
Key findings (iii)
8Enterprise Rating System: March 2017 Source: ICAP DATA, Piraeus Bank Research
Γενική ρευστότητα: 0,7
Άμεση ρευστότητα: 0,4
An examination of the enterprises based on the rating per individual dimension, leads to following
conclusions:
• Based on the liquidity rating, the current liability coverage ratios decline substantially as we move lower
to the rating scale, with enterprises that received a “d” rating having serious liquidity problems.
• Accordingly, based on the profitability rating, the outperformers (“a”) account only for 6.4% of the
sample. The higher concentration is on the intermediate ratings (“b” and “c”). More than a quarter of the
enterprises underperform (“d”), exhibiting a substantial loss accumulation record.
• Finally, according to the solvency rating, more than 1/3 of the enterprises are medium performers (“c”),
which, more conservatively than the enterprises rated with “a” and “b”, maintain a moderate debt
servicing level. On the other hand, the enterprises with a “d” rating are overleveraged and encounter
debt servicing problems.
9Enterprise Rating System: March 2017
2. Methodology of the Enterprise Rating System (ERS)
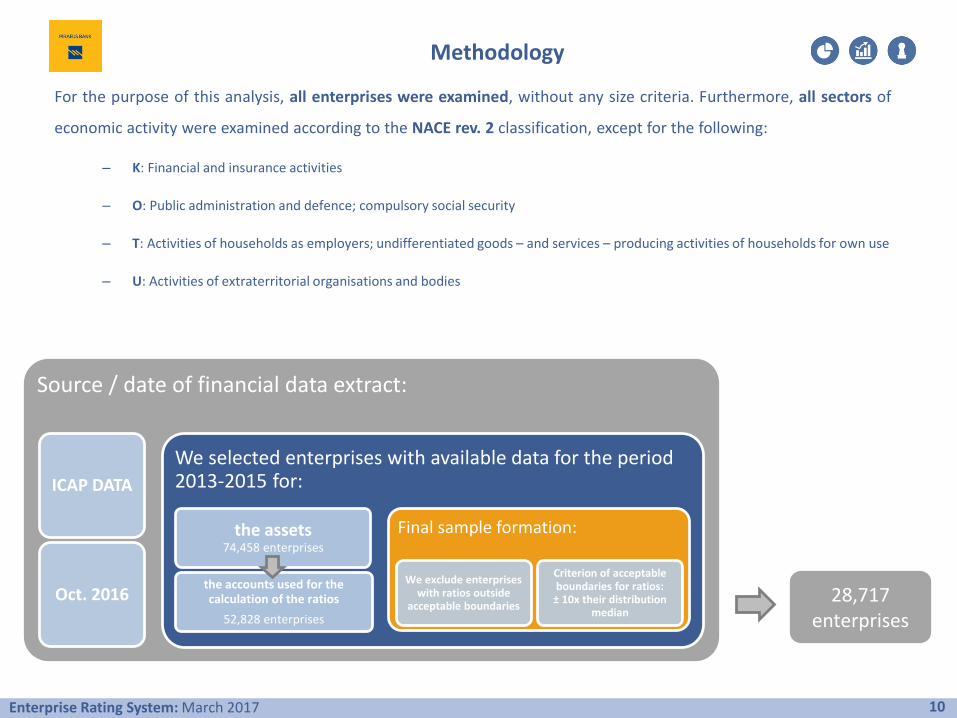
For the purpose of this analysis, all enterprises were examined, without any size criteria. Furthermore, all sectors of
economic activity were examined according to the NACE rev. 2 classification, except for the following:
– Κ: Financial and insurance activities
– O: Public administration and defence; compulsory social security
– Τ: Activities of households as employers; undifferentiated goods – and services – producing activities of households for own use
– U: Activities of extraterritorial organisations and bodies
Methodology
10Enterprise Rating System: March 2017
Source / date of financial data extract:
ICAP DATA
Oct. 2016
We selected enterprises with available data for the period 2013-2015 for:
the assets74,458 enterprises
the accounts used for the calculation of the ratios
52,828 enterprises
Final sample formation:
We exclude enterprises with ratios outside
acceptable boundaries
Criterion of acceptable boundaries for ratios:
± 10x their distribution median
28,717 enterprises
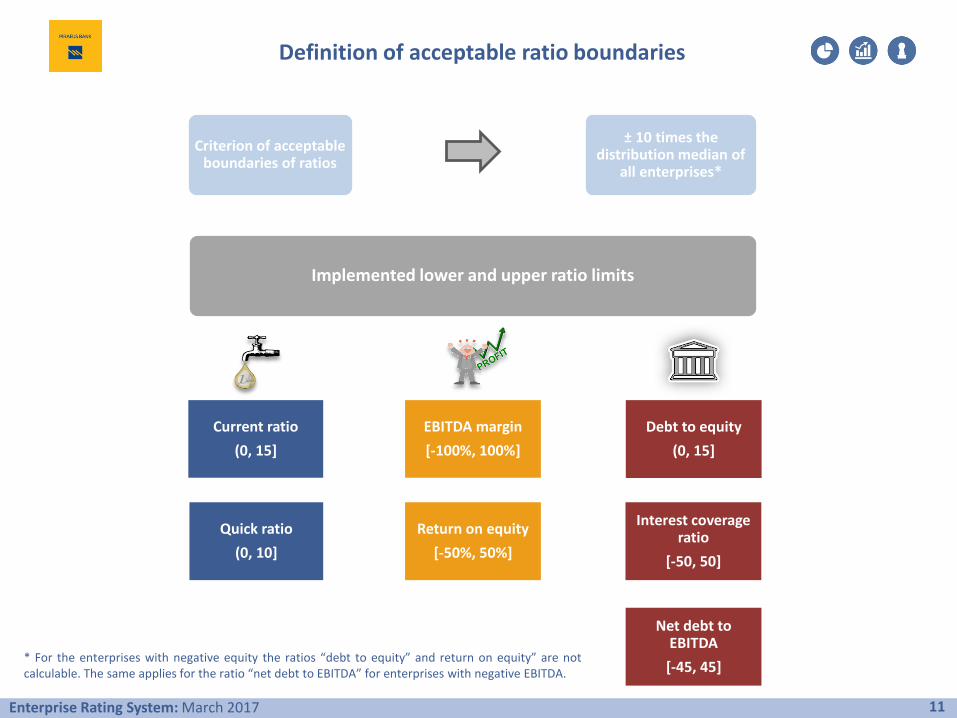
Definition of acceptable ratio boundaries
11Enterprise Rating System: March 2017
Criterion of acceptable boundaries of ratios
± 10 times the distribution median of
all enterprises*
* For the enterprises with negative equity the ratios “debt to equity” and return on equity” are notcalculable. The same applies for the ratio “net debt to EBITDA” for enterprises with negative EBITDA.
Implemented lower and upper ratio limits
Current ratio
(0, 15]
EBITDA margin
[-100%, 100%]
Quick ratio
(0, 10]
Return on equity
[-50%, 50%]
Debt to equity
(0, 15]
Interest coverage ratio
[-50, 50]
Net debt toEBITDA
[-45, 45]
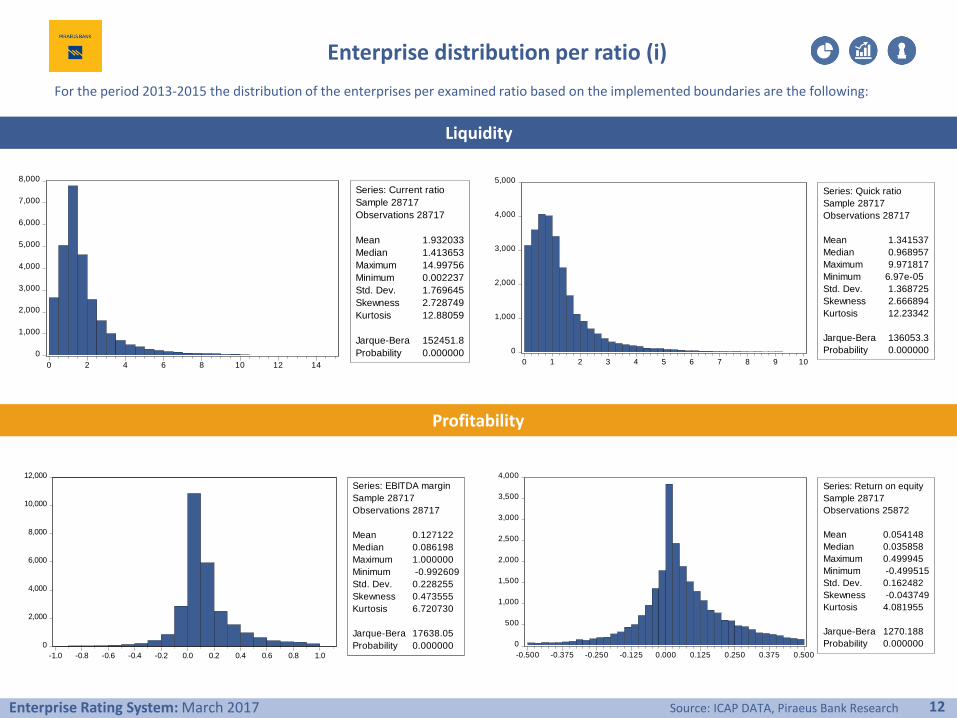
For the period 2013-2015 the distribution of the enterprises per examined ratio based on the implemented boundaries are the following:
Enterprise distribution per ratio (i)
12Enterprise Rating System: March 2017
Liquidity
Profitability
Source: ICAP DATA, Piraeus Bank Research
0
1,000
2,000
3,000
4,000
5,000
6,000
7,000
8,000
0 2 4 6 8 10 12 14
Series: Current ratio
Sample 28717
Observations 28717
Mean 1.932033
Median 1.413653
Maximum 14.99756
Minimum 0.002237
Std. Dev. 1.769645
Skewness 2.728749
Kurtosis 12.88059
Jarque-Bera 152451.8
Probability 0.000000 0
1,000
2,000
3,000
4,000
5,000
0 1 2 3 4 5 6 7 8 9 10
Series: Quick ratio
Sample 28717
Observations 28717
Mean 1.341537
Median 0.968957
Maximum 9.971817
Minimum 6.97e-05
Std. Dev. 1.368725
Skewness 2.666894
Kurtosis 12.23342
Jarque-Bera 136053.3
Probability 0.000000
0
2,000
4,000
6,000
8,000
10,000
12,000
-1.0 -0.8 -0.6 -0.4 -0.2 0.0 0.2 0.4 0.6 0.8 1.0
Series: EBITDA margin
Sample 28717
Observations 28717
Mean 0.127122
Median 0.086198
Maximum 1.000000
Minimum -0.992609
Std. Dev. 0.228255
Skewness 0.473555
Kurtosis 6.720730
Jarque-Bera 17638.05
Probability 0.000000 0
500
1,000
1,500
2,000
2,500
3,000
3,500
4,000
-0.500 -0.375 -0.250 -0.125 0.000 0.125 0.250 0.375 0.500
Series: Return on equity
Sample 28717
Observations 25872
Mean 0.054148
Median 0.035858
Maximum 0.499945
Minimum -0.499515
Std. Dev. 0.162482
Skewness -0.043749
Kurtosis 4.081955
Jarque-Bera 1270.188
Probability 0.000000
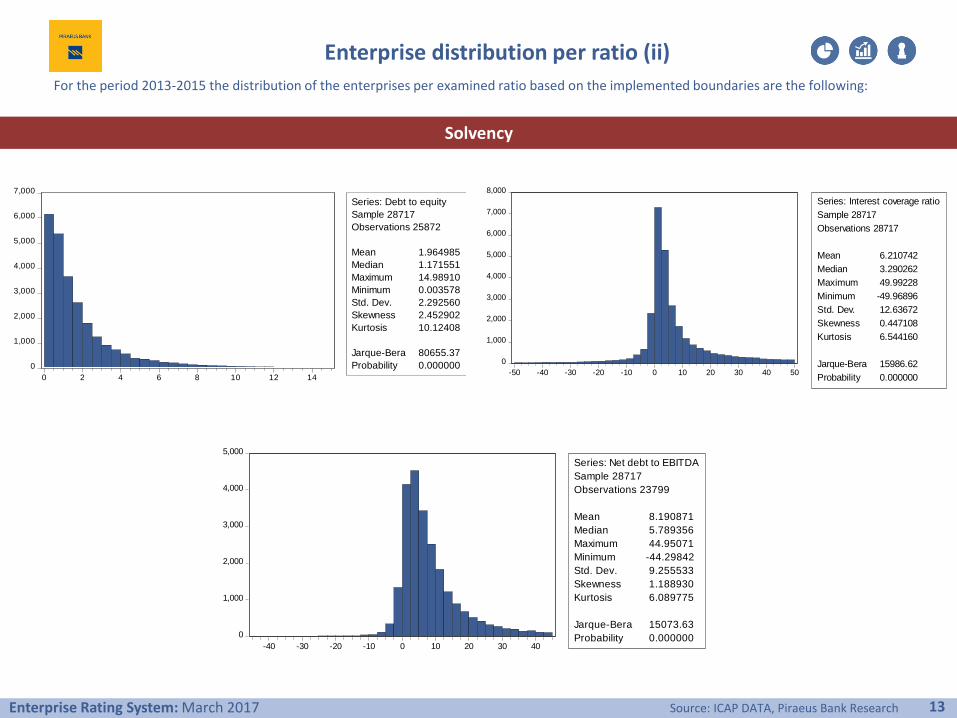
Enterprise distribution per ratio (ii)
13Enterprise Rating System: March 2017
Solvency
Source: ICAP DATA, Piraeus Bank Research
0
1,000
2,000
3,000
4,000
5,000
6,000
7,000
0 2 4 6 8 10 12 14
Series: Debt to equity
Sample 28717
Observations 25872
Mean 1.964985
Median 1.171551
Maximum 14.98910
Minimum 0.003578
Std. Dev. 2.292560
Skewness 2.452902
Kurtosis 10.12408
Jarque-Bera 80655.37
Probability 0.0000000
1,000
2,000
3,000
4,000
5,000
6,000
7,000
8,000
-50 -40 -30 -20 -10 0 10 20 30 40 50
Series: Interest coverage ratio
Sample 28717
Observations 28717
Mean 6.210742
Median 3.290262
Maximum 49.99228
Minimum -49.96896
Std. Dev. 12.63672
Skewness 0.447108
Kurtosis 6.544160
Jarque-Bera 15986.62
Probability 0.000000
0
1,000
2,000
3,000
4,000
5,000
-40 -30 -20 -10 0 10 20 30 40
Series: Net debt to EBITDA
Sample 28717
Observations 23799
Mean 8.190871
Median 5.789356
Maximum 44.95071
Minimum -44.29842
Std. Dev. 9.255533
Skewness 1.188930
Kurtosis 6.089775
Jarque-Bera 15073.63
Probability 0.000000
For the period 2013-2015 the distribution of the enterprises per examined ratio based on the implemented boundaries are the following:
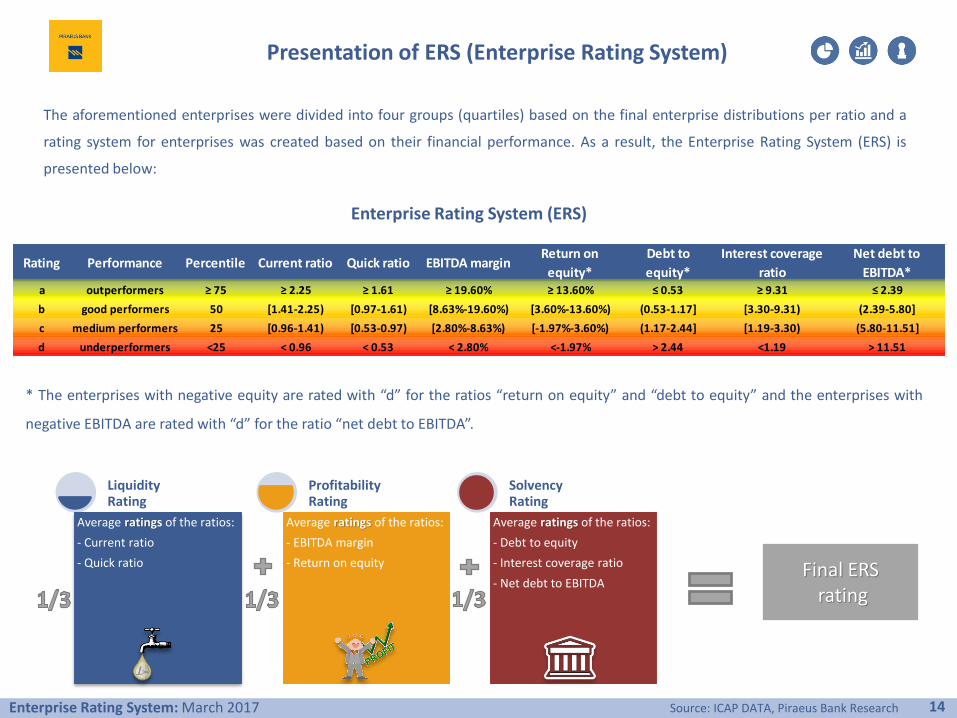
The aforementioned enterprises were divided into four groups (quartiles) based on the final enterprise distributions per ratio and a
rating system for enterprises was created based on their financial performance. As a result, the Enterprise Rating System (ERS) is
presented below:
Presentation of ERS (Enterprise Rating System)
14Enterprise Rating System: March 2017 Source: ICAP DATA, Piraeus Bank Research
Enterprise Rating System (ERS)
* The enterprises with negative equity are rated with “d” for the ratios “return on equity” and “debt to equity” and the enterprises with
negative EBITDA are rated with “d” for the ratio “net debt to EBITDA”.
Average ratings of the ratios:
- Current ratio
- Quick ratio
Liquidity Rating
Average ratings of the ratios:
- EBITDA margin
- Return on equity
Profitability Rating
Average ratings of the ratios:
- Debt to equity
- Interest coverage ratio
- Net debt to EBITDA
Solvency Rating
Final ERSrating
Rating Performance Percentile Current ratio Quick ratio EBITDA marginReturn on
equity*
Debt to
equity*
Interest coverage
ratio
Net debt to
EBITDA*a outperformers ≥ 75 ≥ 2.25 ≥ 1.61 ≥ 19.60% ≥ 13.60% ≤ 0.53 ≥ 9.31 ≤ 2.39
b good performers 50 [1.41-2.25) [0.97-1.61) [8.63%-19.60%) [3.60%-13.60%) (0.53-1.17] [3.30-9.31) (2.39-5.80]
c medium performers 25 [0.96-1.41) [0.53-0.97) [2.80%-8.63%) [-1.97%-3.60%) (1.17-2.44] [1.19-3.30) (5.80-11.51]
d underperformers <25 < 0.96 < 0.53 < 2.80% <-1.97% > 2.44 <1.19 > 11.51
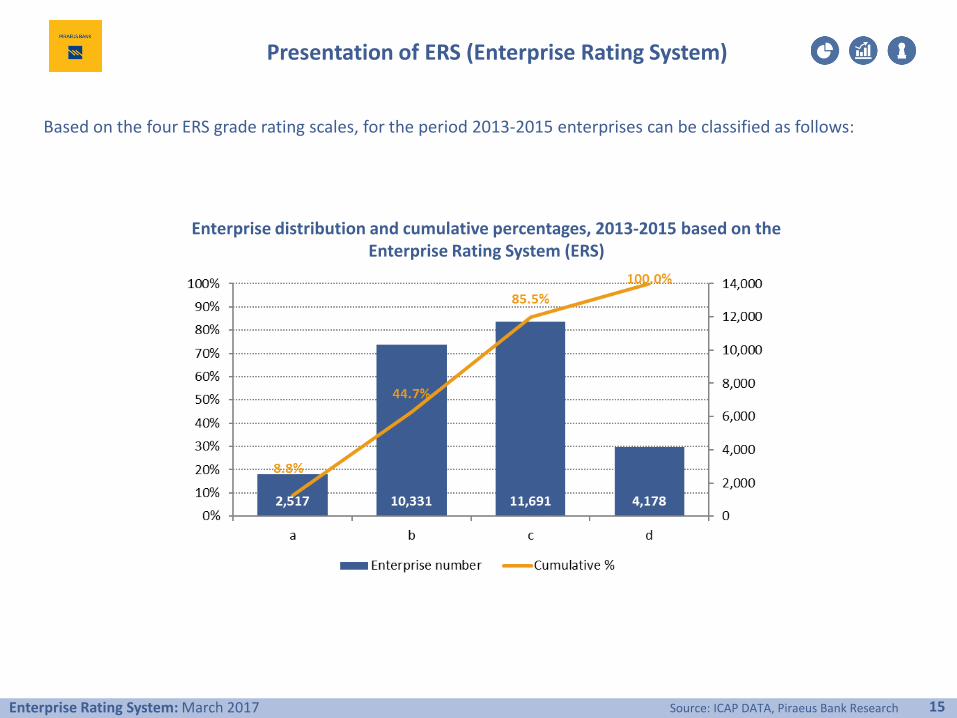
Based on the four ERS grade rating scales, for the period 2013-2015 enterprises can be classified as follows:
Presentation of ERS (Enterprise Rating System)
15Enterprise Rating System: March 2017 Source: ICAP DATA, Piraeus Bank Research
Enterprise distribution and cumulative percentages, 2013-2015 based on theEnterprise Rating System (ERS)
16Enterprise Rating System: March 2017
3. Presentation of the ERS results for 2015
3a. … based on the ERS final rating
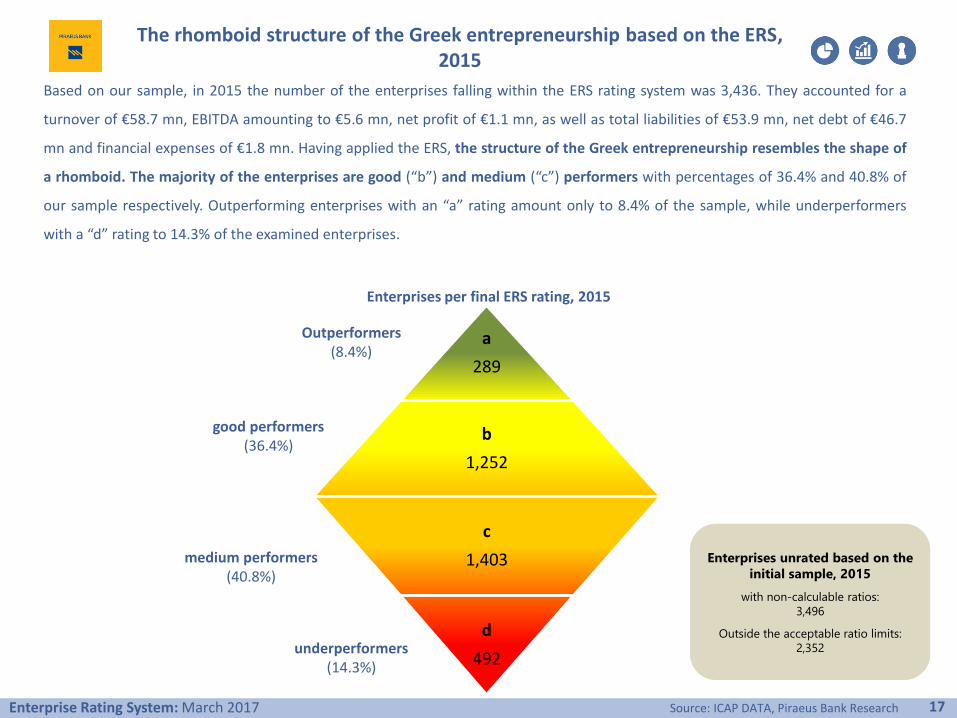
Based on our sample, in 2015 the number of the enterprises falling within the ERS rating system was 3,436. They accounted for a
turnover of €58.7 mn, EBITDA amounting to €5.6 mn, net profit of €1.1 mn, as well as total liabilities of €53.9 mn, net debt of €46.7
mn and financial expenses of €1.8 mn. Having applied the ERS, the structure of the Greek entrepreneurship resembles the shape of
a rhomboid. The majority of the enterprises are good (“b”) and medium (“c”) performers with percentages of 36.4% and 40.8% of
our sample respectively. Outperforming enterprises with an “a” rating amount only to 8.4% of the sample, while underperformers
with a “d” rating to 14.3% of the examined enterprises.
The rhomboid structure of the Greek entrepreneurship based on the ERS, 2015
17Enterprise Rating System: March 2017 Source: ICAP DATA, Piraeus Bank Research
Outperformers(8.4%)
a
289
b
1,252
c
1,403
d
492
good performers(36.4%)
medium performers(40.8%)
underperformers(14.3%)
Enterprises per final ERS rating, 2015
Enterprises unrated based on the
initial sample, 2015
with non-calculable ratios:
3,496
Outside the acceptable ratio limits:
2,352
ERS 2015: Structure of final “a” rating per individual dimension
18Enterprise Rating System: March 2017 Source: ICAP DATA, Piraeus Bank Research
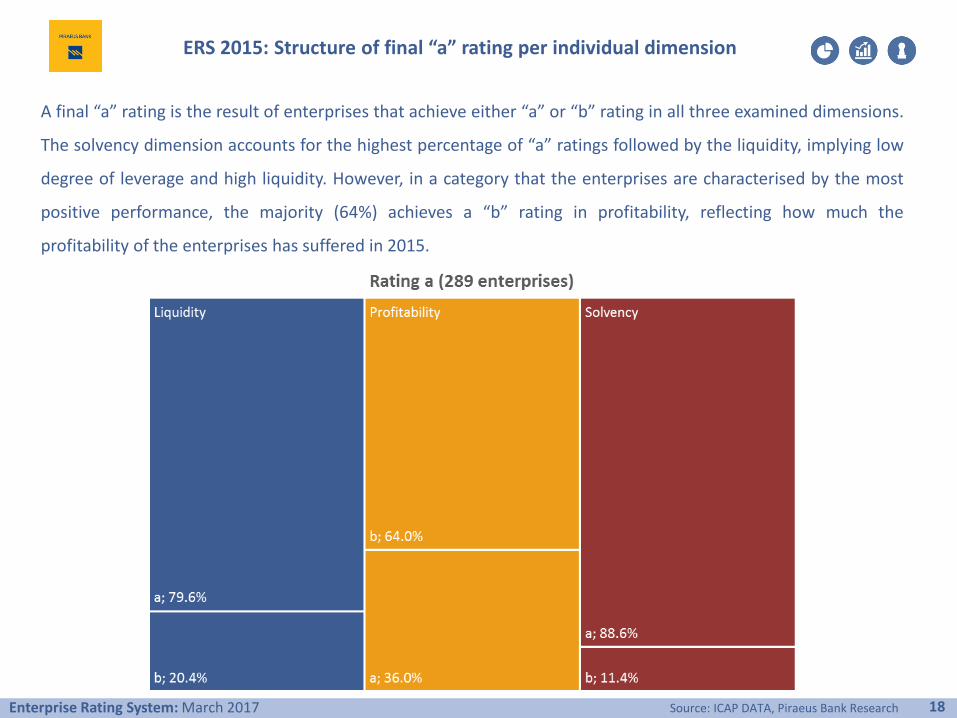
A final “a” rating is the result of enterprises that achieve either “a” or “b” rating in all three examined dimensions.
The solvency dimension accounts for the highest percentage of “a” ratings followed by the liquidity, implying low
degree of leverage and high liquidity. However, in a category that the enterprises are characterised by the most
positive performance, the majority (64%) achieves a “b” rating in profitability, reflecting how much the
profitability of the enterprises has suffered in 2015.
ERS 2015: Structure of final “b” rating per individual dimension
19Enterprise Rating System: March 2017 Source: ICAP DATA, Piraeus Bank Research
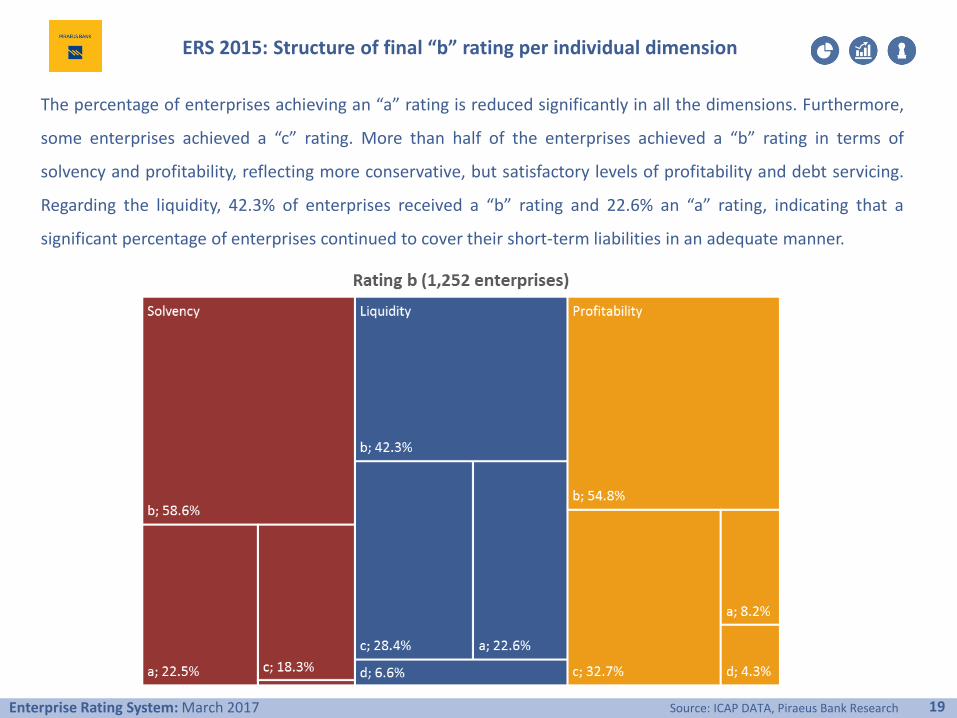
The percentage of enterprises achieving an “a” rating is reduced significantly in all the dimensions. Furthermore,
some enterprises achieved a “c” rating. More than half of the enterprises achieved a “b” rating in terms of
solvency and profitability, reflecting more conservative, but satisfactory levels of profitability and debt servicing.
Regarding the liquidity, 42.3% of enterprises received a “b” rating and 22.6% an “a” rating, indicating that a
significant percentage of enterprises continued to cover their short-term liabilities in an adequate manner.
ERS 2015: Structure of final “c” rating per individual dimension
20Enterprise Rating System: March 2017 Source: ICAP DATA, Piraeus Bank Research
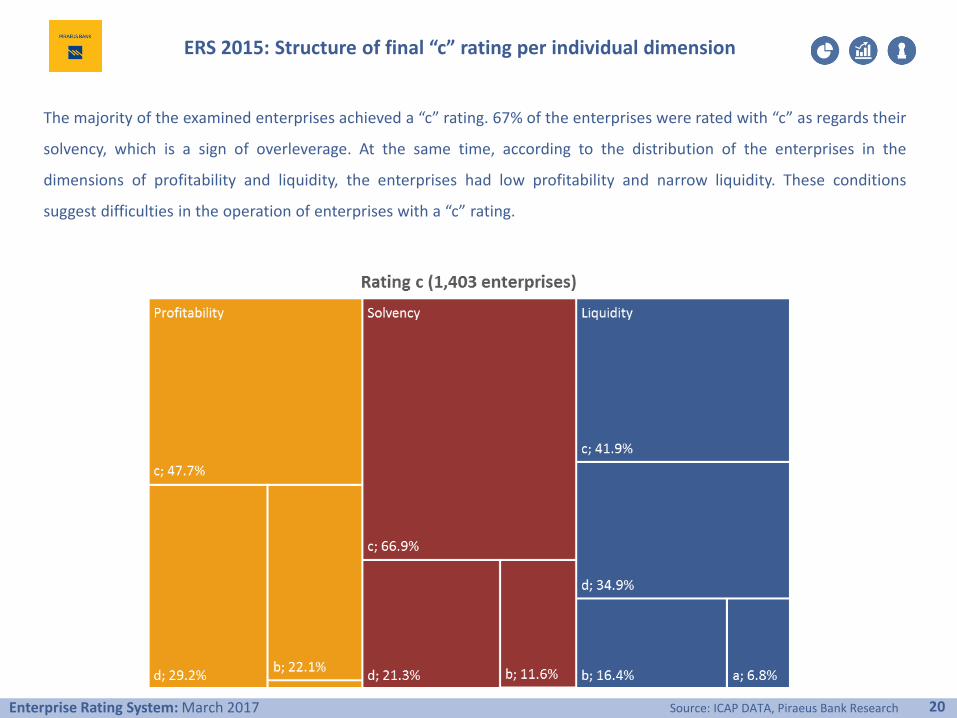
The majority of the examined enterprises achieved a “c” rating. 67% of the enterprises were rated with “c” as regards their
solvency, which is a sign of overleverage. At the same time, according to the distribution of the enterprises in the
dimensions of profitability and liquidity, the enterprises had low profitability and narrow liquidity. These conditions
suggest difficulties in the operation of enterprises with a “c” rating.
ERS 2015: Structure of final “d” rating per individual dimension
21Enterprise Rating System: March 2017 Source: ICAP DATA, Piraeus Bank Research
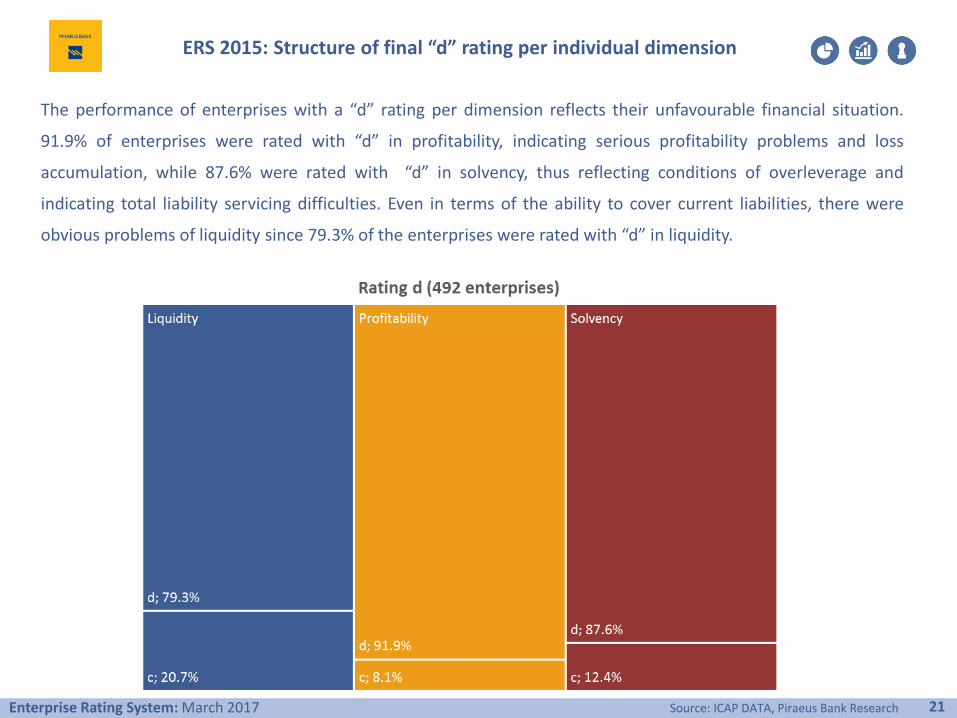
The performance of enterprises with a “d” rating per dimension reflects their unfavourable financial situation.
91.9% of enterprises were rated with “d” in profitability, indicating serious profitability problems and loss
accumulation, while 87.6% were rated with “d” in solvency, thus reflecting conditions of overleverage and
indicating total liability servicing difficulties. Even in terms of the ability to cover current liabilities, there were
obvious problems of liquidity since 79.3% of the enterprises were rated with “d” in liquidity.
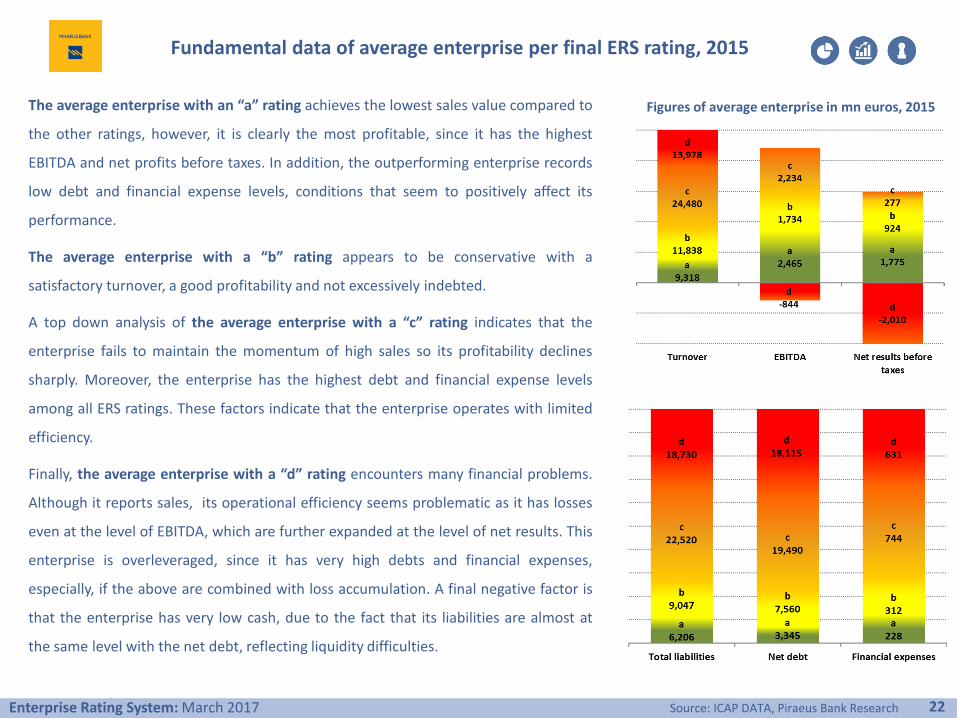
The average enterprise with an “a” rating achieves the lowest sales value compared to
the other ratings, however, it is clearly the most profitable, since it has the highest
EBITDA and net profits before taxes. In addition, the outperforming enterprise records
low debt and financial expense levels, conditions that seem to positively affect its
performance.
The average enterprise with a “b” rating appears to be conservative with a
satisfactory turnover, a good profitability and not excessively indebted.
A top down analysis of the average enterprise with a “c” rating indicates that the
enterprise fails to maintain the momentum of high sales so its profitability declines
sharply. Moreover, the enterprise has the highest debt and financial expense levels
among all ERS ratings. These factors indicate that the enterprise operates with limited
efficiency.
Finally, the average enterprise with a “d” rating encounters many financial problems.
Although it reports sales, its operational efficiency seems problematic as it has losses
even at the level of EBITDA, which are further expanded at the level of net results. This
enterprise is overleveraged, since it has very high debts and financial expenses,
especially, if the above are combined with loss accumulation. A final negative factor is
that the enterprise has very low cash, due to the fact that its liabilities are almost at
the same level with the net debt, reflecting liquidity difficulties.
Fundamental data of average enterprise per final ERS rating, 2015
22Enterprise Rating System: March 2017 Source: ICAP DATA, Piraeus Bank Research
Figures of average enterprise in mn euros, 2015
Average enterprise performance per ratio based on the final ERSrating, 2015 (i)
23Enterprise Rating System: March 2017 Source: ICAP DATA, Piraeus Bank Research
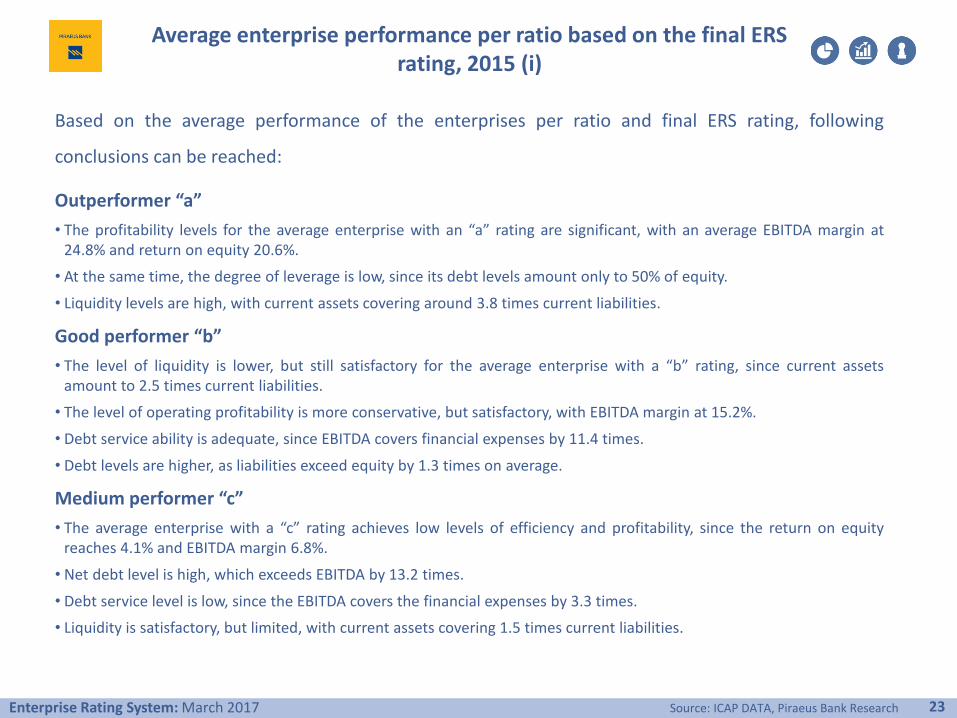
Based on the average performance of the enterprises per ratio and final ERS rating, following
conclusions can be reached:
Outperformer “a”
• The profitability levels for the average enterprise with an “a” rating are significant, with an average EBITDA margin at24.8% and return on equity 20.6%.
• At the same time, the degree of leverage is low, since its debt levels amount only to 50% of equity.
• Liquidity levels are high, with current assets covering around 3.8 times current liabilities.
Good performer “b”
• The level of liquidity is lower, but still satisfactory for the average enterprise with a “b” rating, since current assetsamount to 2.5 times current liabilities.
• The level of operating profitability is more conservative, but satisfactory, with EBITDA margin at 15.2%.
• Debt service ability is adequate, since EBITDA covers financial expenses by 11.4 times.
• Debt levels are higher, as liabilities exceed equity by 1.3 times on average.
Medium performer “c”
• The average enterprise with a “c” rating achieves low levels of efficiency and profitability, since the return on equityreaches 4.1% and EBITDA margin 6.8%.
• Net debt level is high, which exceeds EBITDA by 13.2 times.
• Debt service level is low, since the EBITDA covers the financial expenses by 3.3 times.
• Liquidity is satisfactory, but limited, with current assets covering 1.5 times current liabilities.
Average enterprise performance per ratio based on the final ERSrating, 2015 (ii)
24Enterprise Rating System: March 2017 Source: ICAP DATA, Piraeus Bank Research
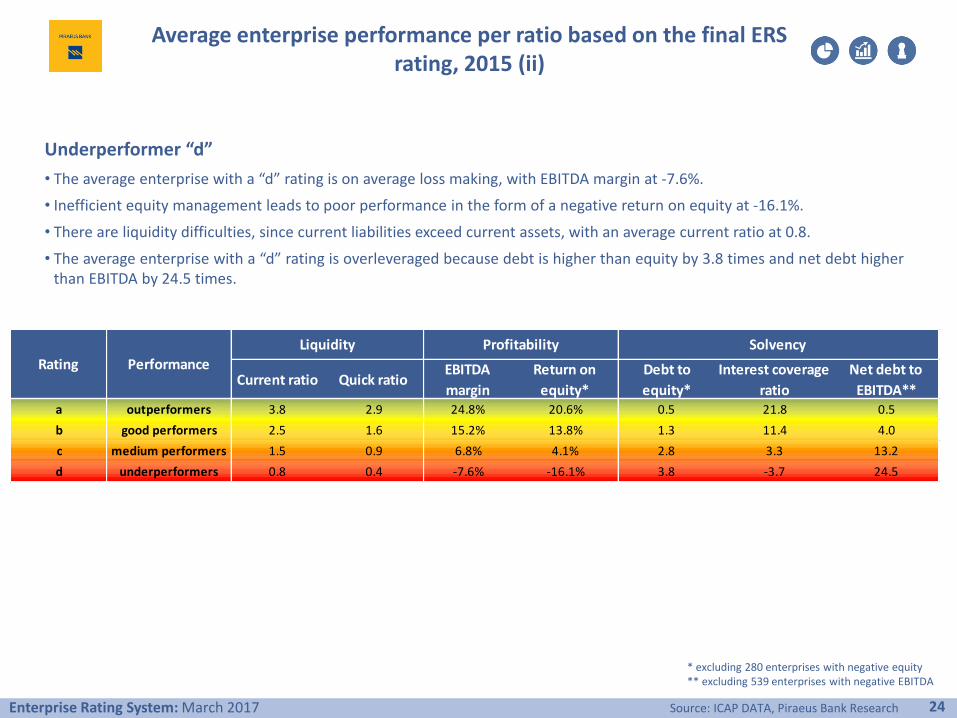
Underperformer “d”
• The average enterprise with a “d” rating is on average loss making, with EBITDA margin at -7.6%.
• Inefficient equity management leads to poor performance in the form of a negative return on equity at -16.1%.
• There are liquidity difficulties, since current liabilities exceed current assets, with an average current ratio at 0.8.
• The average enterprise with a “d” rating is overleveraged because debt is higher than equity by 3.8 times and net debt higherthan EBITDA by 24.5 times.
* excluding 280 enterprises with negative equity** excluding 539 enterprises with negative EBITDA
Current ratio Quick ratioEBITDA
margin
Return on
equity*
Debt to
equity*
Interest coverage
ratio
Net debt to
EBITDA**a outperformers 3.8 2.9 24.8% 20.6% 0.5 21.8 0.5
b good performers 2.5 1.6 15.2% 13.8% 1.3 11.4 4.0
c medium performers 1.5 0.9 6.8% 4.1% 2.8 3.3 13.2
d underperformers 0.8 0.4 -7.6% -16.1% 3.8 -3.7 24.5
Rating Performance
Liquidity Profitability Solvency
Relation between short term liability coverage and leverage based on the final ERS rating, 2015
25Enterprise Rating System: March 2017 Source: ICAP DATA, Piraeus Bank Research
* excluding 280 enterprises with negative equity
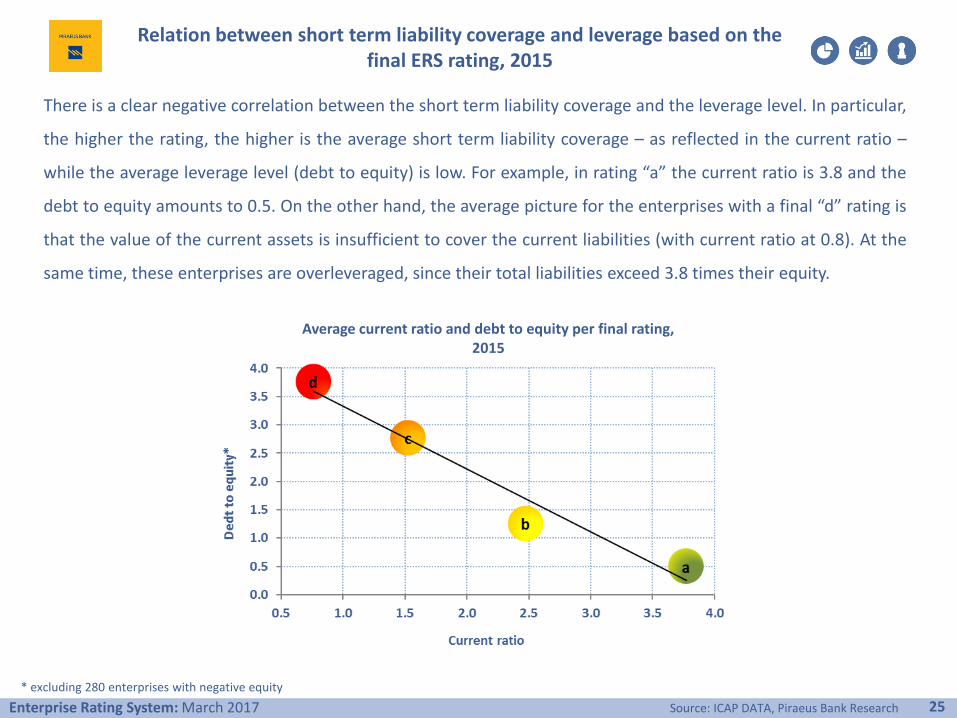
There is a clear negative correlation between the short term liability coverage and the leverage level. In particular,
the higher the rating, the higher is the average short term liability coverage – as reflected in the current ratio –
while the average leverage level (debt to equity) is low. For example, in rating “a” the current ratio is 3.8 and the
debt to equity amounts to 0.5. On the other hand, the average picture for the enterprises with a final “d” rating is
that the value of the current assets is insufficient to cover the current liabilities (with current ratio at 0.8). At the
same time, these enterprises are overleveraged, since their total liabilities exceed 3.8 times their equity.
Average current ratio and debt to equity per final rating, 2015
Relation between liabilities and EBITDA based on the final ERS rating, 2015
26Enterprise Rating System: March 2017 Source: ICAP DATA, Piraeus Bank Research
Γενική ρευστότητα: 0,7
Άμεση ρευστότητα: 0,4
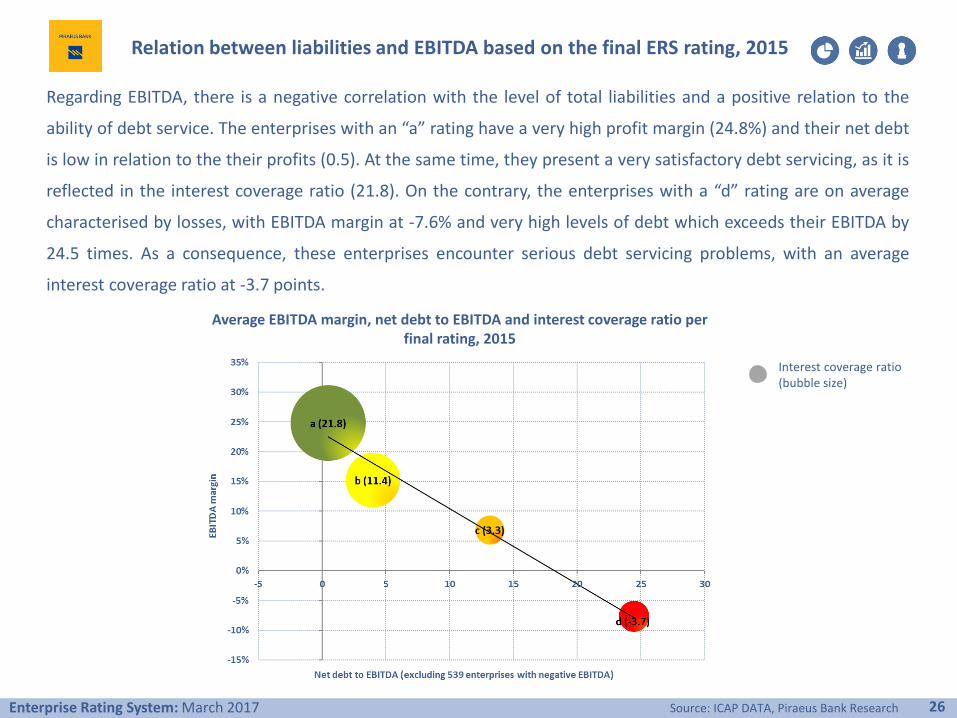
Regarding EBITDA, there is a negative correlation with the level of total liabilities and a positive relation to the
ability of debt service. The enterprises with an “a” rating have a very high profit margin (24.8%) and their net debt
is low in relation to the their profits (0.5). At the same time, they present a very satisfactory debt servicing, as it is
reflected in the interest coverage ratio (21.8). On the contrary, the enterprises with a “d” rating are on average
characterised by losses, with EBITDA margin at -7.6% and very high levels of debt which exceeds their EBITDA by
24.5 times. As a consequence, these enterprises encounter serious debt servicing problems, with an average
interest coverage ratio at -3.7 points.
Interest coverage ratio(bubble size)
Average EBITDA margin, net debt to EBITDA and interest coverage ratio per final rating, 2015
27Enterprise Rating System: March 2017
3. Presentation of the ERS results for 2015
3b. … based on the ERS rating per examined dimension
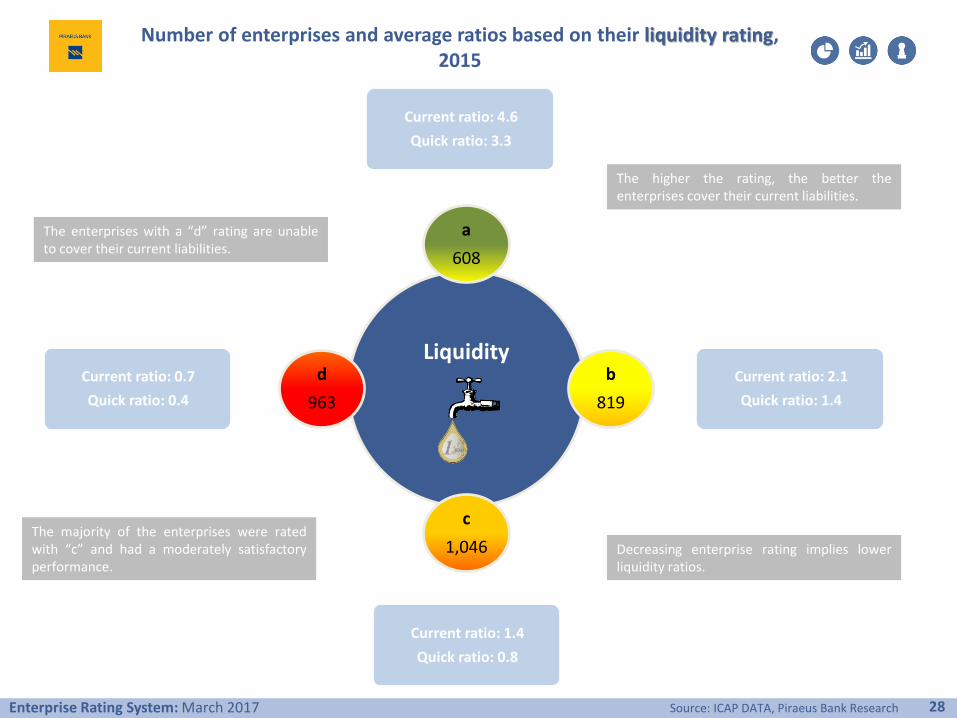
Number of enterprises and average ratios based on their liquidity rating, 2015
28Enterprise Rating System: March 2017 Source: ICAP DATA, Piraeus Bank Research
Liquidity
a
608
b
819
c
1,046
d
963
Current ratio: 4.6
Quick ratio: 3.3
Current ratio: 2.1
Quick ratio: 1.4
Current ratio: 0.7
Quick ratio: 0.4
Current ratio: 1.4
Quick ratio: 0.8
The higher the rating, the better theenterprises cover their current liabilities.
The enterprises with a “d” rating are unableto cover their current liabilities.
Decreasing enterprise rating implies lowerliquidity ratios.
The majority of the enterprises were ratedwith “c” and had a moderately satisfactoryperformance.
29Enterprise Rating System: March 2017 Source: ICAP DATA, Piraeus Bank Research
Profitability
a
221
b
1,181
c
1,118
d
916
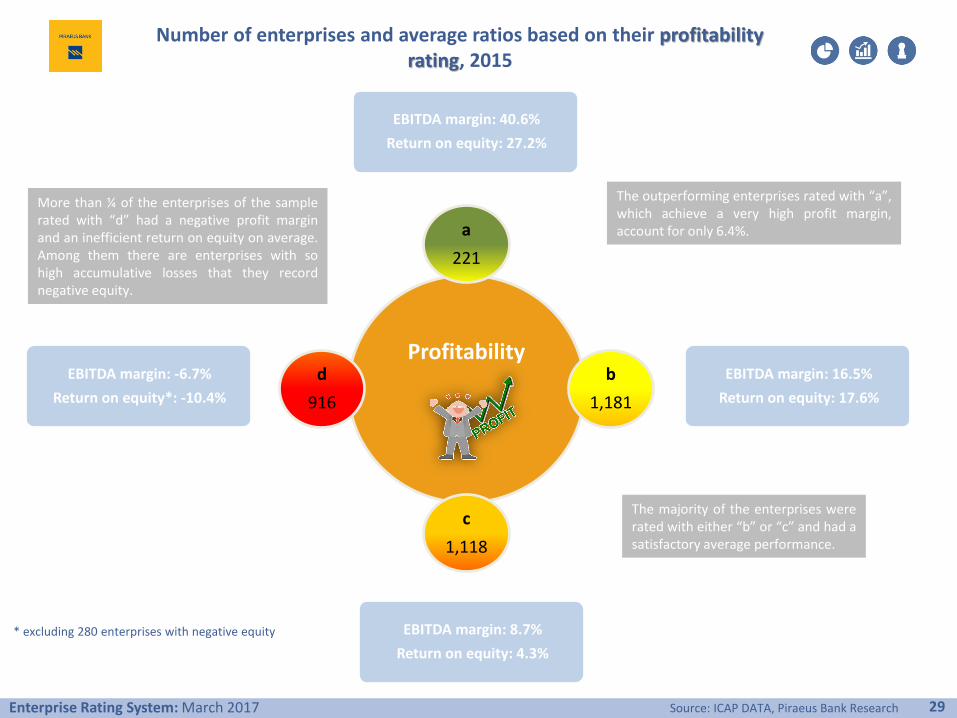
EBITDA margin: 40.6%
Return on equity: 27.2%
Γενική ρευστότητα: 0,7
Άμεση ρευστότητα: 0,4
EBITDA margin: 16.5%
Return on equity: 17.6%
EBITDA margin: 8.7%
Return on equity: 4.3%
EBITDA margin: -6.7%
Return on equity*: -10.4%
* excluding 280 enterprises with negative equity
The outperforming enterprises rated with “a”,which achieve a very high profit margin,account for only 6.4%.
The majority of the enterprises wererated with either “b” or “c” and had asatisfactory average performance.
More than ¼ of the enterprises of the samplerated with “d” had a negative profit marginand an inefficient return on equity on average.Among them there are enterprises with sohigh accumulative losses that they recordnegative equity.
Number of enterprises and average ratios based on their profitability rating, 2015
30Enterprise Rating System: March 2017 Source: ICAP DATA, Piraeus Bank Research
Solvency
a
540
b
930
c
1,229
d
737
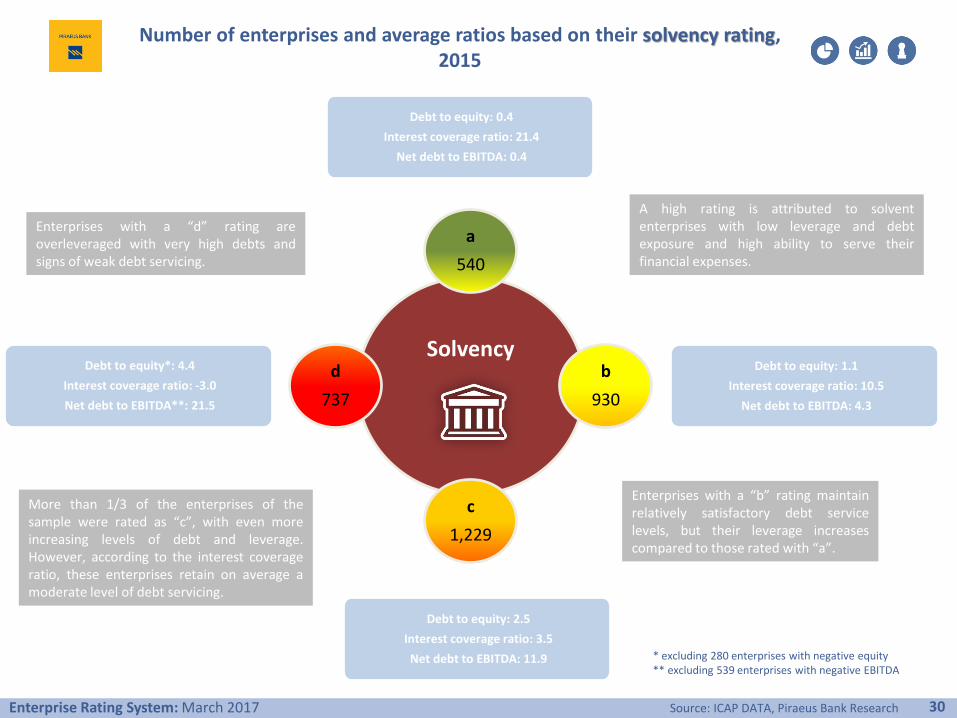
Debt to equity: 0.4
Interest coverage ratio: 21.4
Net debt to EBITDA: 0.4
Γενική ρευστότητα: 0,7
Άμεση ρευστότητα: 0,4
* excluding 280 enterprises with negative equity** excluding 539 enterprises with negative EBITDA
Debt to equity: 1.1
Interest coverage ratio: 10.5
Net debt to EBITDA: 4.3
Debt to equity: 2.5
Interest coverage ratio: 3.5
Net debt to EBITDA: 11.9
Debt to equity*: 4.4
Interest coverage ratio: -3.0
Net debt to EBITDA**: 21.5
A high rating is attributed to solvententerprises with low leverage and debtexposure and high ability to serve theirfinancial expenses.
Enterprises with a “b” rating maintainrelatively satisfactory debt servicelevels, but their leverage increasescompared to those rated with “a”.
More than 1/3 of the enterprises of thesample were rated as “c”, with even moreincreasing levels of debt and leverage.However, according to the interest coverageratio, these enterprises retain on average amoderate level of debt servicing.
Enterprises with a “d” rating areoverleveraged with very high debts andsigns of weak debt servicing.
Number of enterprises and average ratios based on their solvency rating, 2015
31Enterprise Rating System: March 2017
4. Appendix
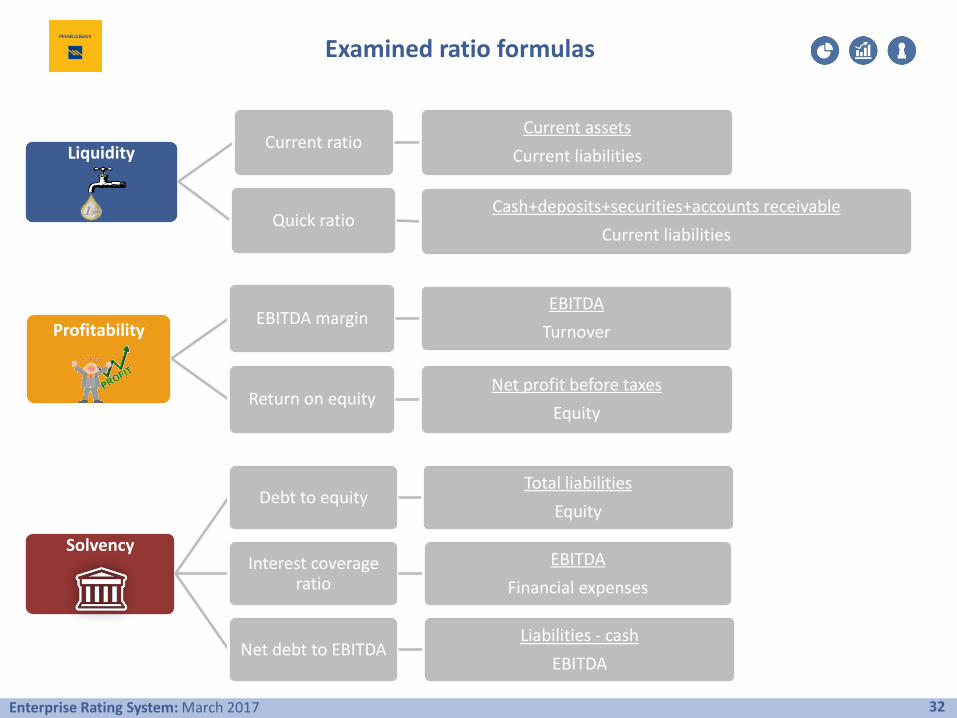
Examined ratio formulas
32Enterprise Rating System: March 2017
LiquidityCurrent ratio
Current assets
Current liabilities
Quick ratioCash+deposits+securities+accounts receivable
Current liabilities
Solvency
Debt to equityTotal liabilities
Equity
Interest coverage ratio
EBITDA
Financial expenses
Net debt to EBITDALiabilities - cash
EBITDA
ProfitabilityEBITDA margin
EBITDA
Turnover
Return on equityNet profit before taxes
Equity
Disclaimer: This document is produced by the Economic Research & Investment Strategy Department of Piraeus Bank (hereinafter “the Bank”), which is supervised by the Bank of Greece and is sent or provided to third parties,without any obligation of its author. This document or any part of it should not be duplicated in any way without the prior written consent of its author.
The information or opinions included in this document are addressed to existing or potential clients in a general manner, without taking into account the particular circumstances, the investment objectives, the financialability, the experience and/or knowledge of the potential recipients of this document and, as a result, they do not constitute or should not be considered neither as a solicitation or offer for the conduct of transactions infinancial instruments or currencies nor as a recommendation or advice for decision making in relation to those. Taking into account the aforementioned, the recipient of the information contained in this document shouldproceed with his/her own research, analysis, and confirmation of the information which is included in this document and seek for independent and professional legal, tax and investment advice, before proceeding with anyinvestment decision making.
The information depicted in this document is relied on sources that the Bank considers to be reliable and is provided on an “as is” basis, however, the Bank cannot warrant as to their accuracy and completeness. The opinionsand estimates herein are related to the trend of the local and international financial markets at the indicated date (prices at closing time) and are subject to changes without any prior notice. Notwithstanding the above, theBank might include in this document investment researches, which have been conducted by third persons. In this case, the Bank does not modify those researches, but it presents them on an “as is” basis, therefore, noresponsibility is assumed in relation to the content of the aforementioned investment researches. The Bank is under no duty to update the information contained in this document. Considering the above, the Bank, themembers of its Board of Directors and the relevant persons assume no responsibility for the information included in the present document and/or for the outcome of any investment decisions made according to suchinformation.
Piraeus Bank Group is an organization with a significant presence in the Greek market and an increasing one in the international markets providing a wide range of investment services. In the context of investment servicesoffered by the Bank and/or any other Piraeus Group companies in general, there might be cases whereby conflict of interests may arise in relation to the information provided herein. Reference should be made to the fact thatthe Bank, the relevant persons and/or other Piraeus Group companies indicatively:
a. Are not subject to any prohibition in relation to trading on own account or in the course of providing portfolio management services prior to the publication of this document or the acquisition of any shares prior toany public offering or the acquisition of any other securities.
b. May offer upon remuneration investment banking services to issuers for whom this document may contain information.c. May participate to the issuers’ share capital or acquire other securities issued by the aforementioned issuers or attract other financial interests from them.d. Might provide market making or underwriting services to issuers that might be mentioned in this document.e. Might have published papers the content of which is different or incompatible to the information presented herein.
The Bank as well as the other Piraeus Group's companies have enacted, implement and maintain an effective policy, which prevents circumstances that may give rise to conflicts of interests and the dissemination of anyinformation among the departments (“chinese walls”) and they also constantly comply with the provisions and regulations relevant to inside information and market abuse. Also, the Bank confirms that it doesn’t have any kindof interest or conflict of interest with a) any other legal entity or person that could have participated in the preparation of the present document and b) with any other legal entity or person that couldn’t have participated inthe preparation of the present document, but had access to it before its publication.
It is duly stated that: the investments described in the present document include investment risks, among which the risk of losing the entire capital invested. In particular, it is stated that;a. The figures presented herein refer to the past and that the past performance is not a reliable indicator of future performance.b. In case the figures refer to simulated past performance, that past performance is not a reliable indicator of future performance.c. The return on investments might be positively or negatively affected as a result of currency fluctuations, in case the figures are denominated in a foreign currency (other than Euro).d. Any forecasts in relation to future performance, may not be a reliable indicator of future performance.e. The tax treatment of the information as well as transactions pertained in this document, depends on each investor's individual circumstances and may be subject to change in the future. As a result, the recipient
should seek for independent advice in relation to the applicable tax legislation.
The distribution of the present document outside Greece and/or to persons governed by foreign law may be subject to restrictions or prohibitions according to the applicable legislation. Therefore, the recipient of the presentshould seek for independent advice in relation to the applicable legislation, in order to look into such restrictions and/or prohibitions.
33Enterprise Rating System: March 2017