Embed Size (px)
Citation preview

El Paso Corporation
First Quarter 2008Financial & Operational Update
May 8, 2008

2
Cautionary StatementRegarding Forward-looking Statements
This presentation includes forward-looking statements and projections, made in reliance on the safe harbor provisions of the Private Securities Litigation Reform Act of 1995. The company has made every reasonable effort to ensure that the information and assumptions on which these statements and projections are based are current, reasonable, and complete. However, a variety of factors could cause actual results to differ materially from the projections, anticipated results or other expectations expressed in this presentation, including, without limitation, changes in unaudited and/or unreviewed financial information; our ability to implement and achieve our objectives in the 2008 plan, including earnings and cash flow targets; the effects of any changes in accounting rules and guidance; our ability to meet production volume targets in our E&P segment; uncertainties and potential consequences associated with the outcome of governmental investigations, including, without limitation, those related to the reserve revisions; outcome of litigation; our ability to comply with the covenants in our various financing documents; our ability to obtain necessary governmental approvals for proposed pipeline projects and our ability to successfully construct and operate such projects; the risks associated with recontracting of transportation commitments by our pipelines; regulatory uncertainties associated with pipeline rate cases; actions by the credit rating agencies; the successful close of our financing transactions; our ability to successfully exit the energy trading business; our ability to close our announced asset sales on a timely basis; changes in commodity prices and basis differentials for oil, natural gas, and power and relevant basis spreads; inability to realize anticipated synergies and cost savings associated with restructurings and divestitures on a timely basis; general economic and weather conditions in geographic regions or markets served by the company and its affiliates, or where operations of the company and its affiliates are located; the uncertainties associated with governmental regulation; political and currency risks associated with international operations of the company and its affiliates; competition; and other factors described in the company’s (and its affiliates’) Securities and Exchange Commission filings. While the company makes these statements and projections in good faith, neither the company nor its management can guarantee that anticipated future results will be achieved. Reference must be made to those filings for additional important factors that may affect actual results. The company assumes no obligation to publicly update or revise any forward-looking statements made herein or any other forward-looking statements made by the company, whether as a result of new information, future events, or otherwise.
Certain of the production information in this presentation include the production attributable to El Paso’s 49 percent interest in Four Star Oil & Gas Company (“Four Star”). El Paso’s Supplemental Oil and Gas disclosures, which are included in its Annual Report on Form 10-K, reflect its proportionate share of the proved reserves of Four Star separate from its consolidated proved reserves. In addition, the proved reserves attributable to its proportionate share of Four Star represent estimates prepared by El Paso and not those of Four Star.
Cautionary Note to U.S. Investors—The United States Securities and Exchange Commission permits oil and gas companies, in their filings with the SEC, to disclose only proved reserves that a company has demonstrated by actual production or conclusive formation tests to be economically and legally producible under existing economic and operating conditions. We use certain terms in this presentation that the SEC's guidelines strictly prohibit us from including in filings with the SEC. U.S. Investors are urged to consider closely the disclosures regarding proved reserves in this presentation and the disclosures contained in our Form 10-K for the year ended December 31, 2007, File No. 001-14365, available by writing; Investor Relations, El Paso Corporation, 1001 Louisiana St., Houston, TX 77002. You can also obtain this form from the SEC by calling 1-800-SEC-0330.
Non-GAAP Financial MeasuresThis presentation includes certain Non-GAAP financial measures as defined in the SEC’s Regulation G. More information on these Non-GAAP financial measures, including EBIT, EBITDA, adjusted EBITDA, adjusted EPS, cash costs, and the required reconciliations under Regulation G, are set forth in this presentation or in the appendix hereto. El Paso defines Resource Potential or Resource Inventory as subsurface volumes of oil and natural gas the company believes may be present and eventually recoverable. The company utilizes a net, geologic risk mean to represent this estimated ultimate recoverable amount.
3
Our Purpose
El Paso Corporation provides natural gas and related energy
products in a safe, efficient, and dependable manner

4
the place to workthe neighbor to havethe company to own
Our Vision & Values

5
First Quarter Overview
FinancialSolid earnings1: $0.33 vs. $0.18Both businesses up; interest expense down
PipelinesEBIT up 5%Good progress on growth projects
E&PProduction up 8% (4% pro forma Peoples, divestitures)2
Per-unit costs down
1Adjusted earnings per share2Includes proportionate share of Four Star equity volumes

Financial Results

7
Financial Results
EBITInterest and debt expenseIncome (loss) before income taxesIncome taxes (benefit) Income (loss) from continuing operationsDiscontinued operations, net of income taxes
Net incomePreferred stock dividends*
Net income available to common stockholders
Diluted EPS from continuing operationsDiluted EPS from discontinued operations
Total diluted EPS
Diluted shares (millions)
$ 216(283)
(67)(19)(48)677629
9$ 620
$(0.08)0.97
$ 0.89
694
2007
Three Months EndedMarch 31,
$ 600(233)367148219
–219
19$ 200
$ 0.29–
$ 0.29
701
2008($ Millions, Except EPS)
*Due to timing, 2008 includes two quarters of preferred stock dividends

8
Items Impacting 1Q 2008 Results
Income available to common stockholders
Adjustments1
Change in fair value of production-related derivativesChange in fair value of power contractsChange in fair value of legacy indemnificationCase Corporation indemnificationGain on sale of portion of telecommunications business
Adjusted EPS—Continuing operations2
$ 214143
(65)(18)
Pre-tax$200
$ 132628
(27)(12)
After-tax$ 0.29
0.020.040.04
(0.04)(0.02)
$ 0.33
Diluted EPS
1All adjustments assume a 36% tax rate, except Case Corporation indemnification, and 701 MM diluted shares2Reflects fully diluted shares of 767 MM and includes income impact from dilutive securities
$ Millions, Except EPS
9
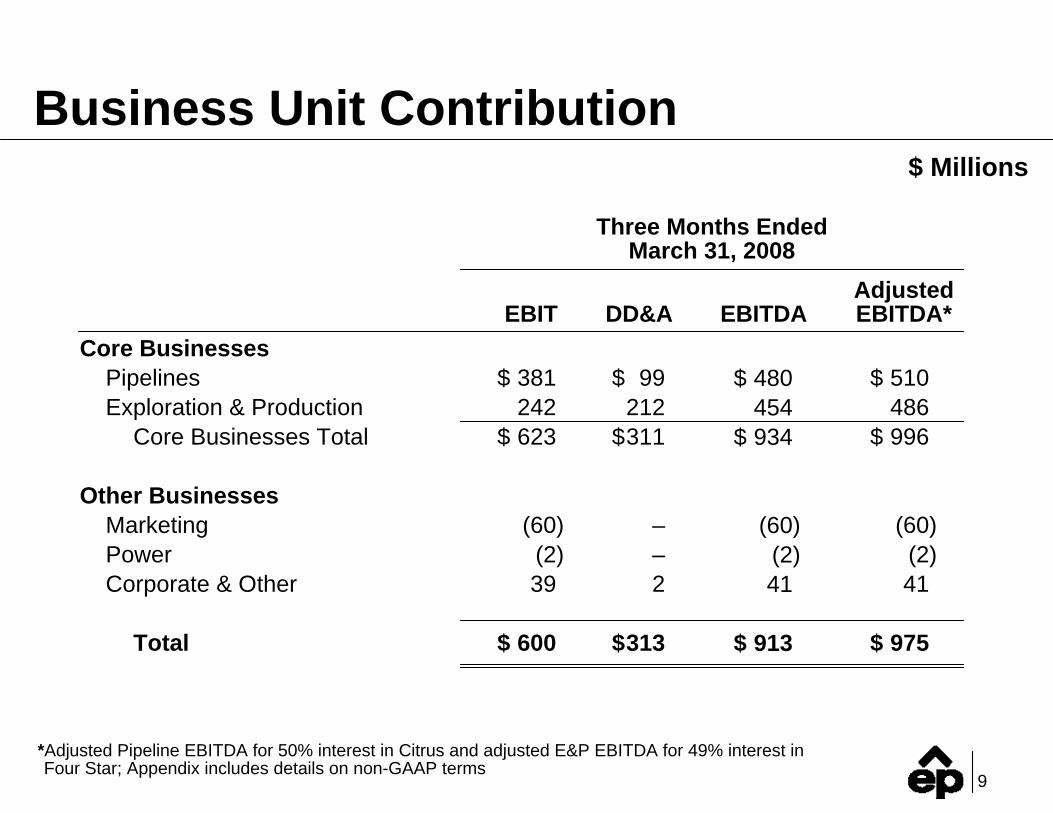
Business Unit Contribution
Core BusinessesPipelines Exploration & Production
Core Businesses Total
Other BusinessesMarketingPowerCorporate & Other
Total
Three Months EndedMarch 31, 2008
$ 381242
$ 623
(60)(2)39
$ 600
AdjustedEBITDA*EBIT DD&A
$ 99212
$311
––2
$313
$ 510486
$ 996
(60)(2)41
$ 975
$ 480454
$ 934
(60)(2)41
$ 913
EBITDA
*Adjusted Pipeline EBITDA for 50% interest in Citrus and adjusted E&P EBITDA for 49% interest in Four Star; Appendix includes details on non-GAAP terms
$ Millions

10
Cash Flow and Capital Investment
$ 219497716(82)634
–$ 634
$ 531$ 295$ 598$ 38
Income (loss) from continuing operationsNon-cash adjustments
SubtotalWorking capital changes and other1
Cash flow from continuing operationsDiscontinued operations
Cash flow from operations
Capital expendituresAcquisitionsDivestituresDividends paid
2008
Three Months EndedMarch 31,
$ (48)489441(93)348(35)
$ 313
$ 528$ 255$ 38$ 37
2007
1Includes change in margin collateral of $(15) MM in 2008 and $20 MM in 2007
$ Millions
11
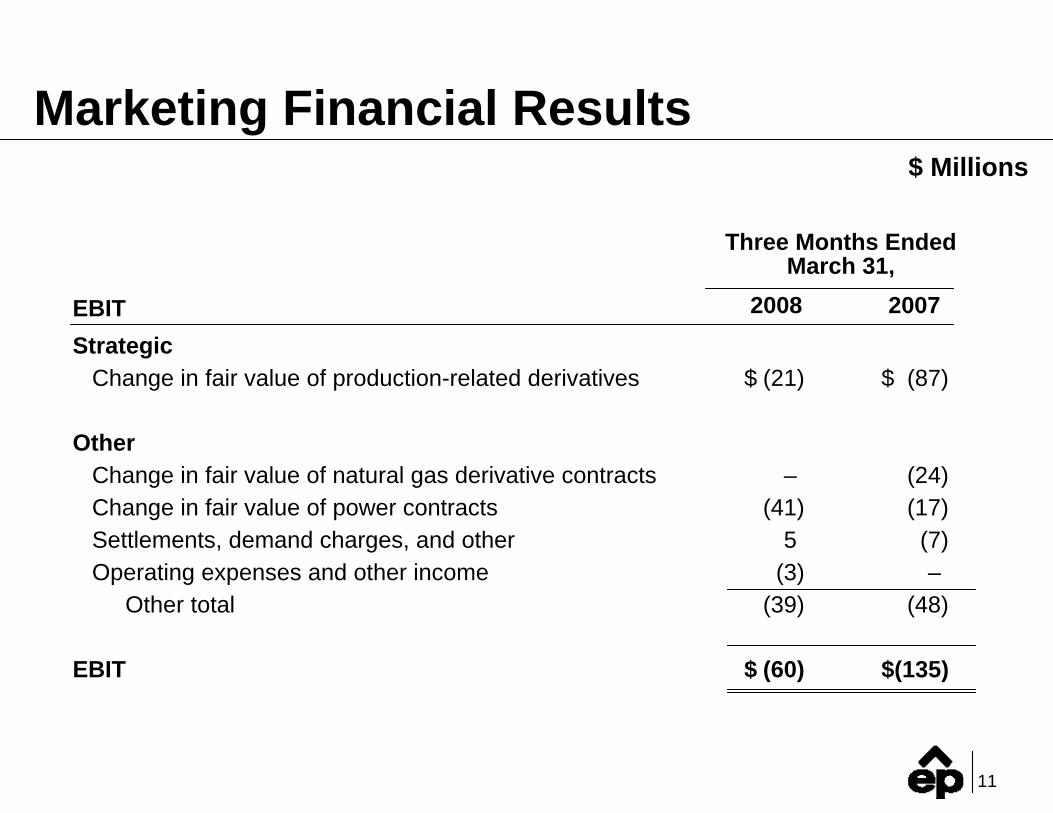
Marketing Financial Results
StrategicChange in fair value of production-related derivatives
OtherChange in fair value of natural gas derivative contractsChange in fair value of power contractsSettlements, demand charges, and otherOperating expenses and other income
Other total
EBIT
$ (21)
–(41)
5(3)
(39)
$ (60)
Three Months EndedMarch 31,
2008 2007
$ (87)
(24)(17)
(7)–
(48)
$(135)
EBIT
$ Millions

12
2008 Natural Gas andOil Hedge Positions
0.7 MMBbls$56.73 ceiling/
$55.00 floor
Balance atMarket Price
Ceiling
Floor
2.6 MMBblsAverage cap $79.97/Bbl
2.6 MMBblsAverage floor $79.51/Bbl
Note: See full Production-Related Derivative Schedule in Appendix
153.0 TBtuAverage cap $10.24/MMBtu
128.2 TBtu$10.74 ceiling/
$8.00 floor
24.8 TBtu$7.65
fixed price
153.0 TBtuAverage floor $7.94/MMBtu
Ceiling
Floor
1.9 MMBbls$88.48
fixed price
Positions as of May 2, 2008(Contract Months April 2008 – Forward)
2008 Gas
2008 Oil
Hedging strategy preserves upside to higher prices

13
Balance atMarket Price
Note: See full Production-Related Derivative Schedule in Appendix
93.2 TBtuAverage cap $12.12/MMBtu
4.6 TBtu$3.56
fixed price
76.4 TBtuAverage floor $8.27/MMBtu
Ceiling
Floor
3.4 MMBbls$109.93
fixed price
Positions as of May 2, 2008
2009 Gas
2009 Oil
2009 Natural Gas andOil Hedge Positions
88.6 TBtu$12.56ceiling
71.8 TBtu$8.57floor
Oil hedges ensure approximately$105 MM incremental revenues vs. 2008

Pipeline Group

15
1Q 2008 Highlights
Favorable 1Q EBIT5% increase from prior year
Throughput increased 7% from 2007
Progress on committed backlogPlaced in-service:
WIC KandaSNG Cypress II—May 1
Received FERC certificate:CIG High Plains Pipeline and Totem Storage
Completed Gulf LNG acquisition—started constructionFGT Phase VIII added to backlog

16
Pipeline Group Financial Results
EBIT before minority interestLess minority interestEBIT
EBITDAAdjusted EBITDA1
Capital expendituresAcquisitions2
Three Months Ended March 31,
2008 2007$ 390
9$ 381
$ 480$ 510
$ 189$ 295
$ 364–
$ 364
$ 458$ 490
$ 194 $ –
$ Millions
1Adjusted Pipeline EBITDA for 50% interest in Citrus2Gulf LNG acquisitionNote: Appendix includes details on non-GAAP terms
17
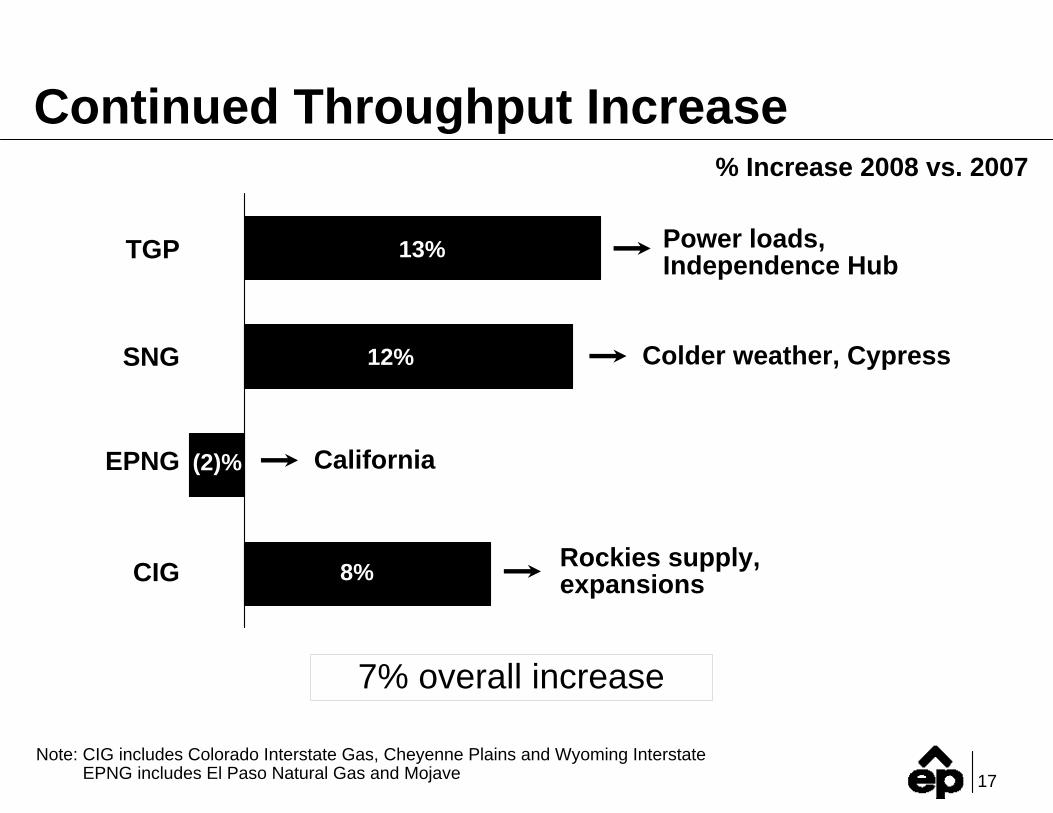
Continued Throughput Increase
TGP
Colder weather, CypressSNG 12%
8%
EPNG
CIG Rockies supply, expansions
7% overall increase
13% Power loads,Independence Hub
Note: CIG includes Colorado Interstate Gas, Cheyenne Plains and Wyoming InterstateEPNG includes El Paso Natural Gas and Mojave
(2)% California
% Increase 2008 vs. 2007

18
Update on Ruby Pipeline
PA with PGE for 375 MMcf/dTargeting 1.1+ Bcf/d of total commitmentsIncreasing capex estimateMarch 2011 in-service
WIC
Ruby Pipeline
CIG
CheyennePlains
Cheyenne
Malin
Opal

Exploration & Production

20
1Q Highlights
Volumes up 8%4% increase pro forma
Lifting costs down 14%
Divestiture process complete309 Bcfe for $2.73/Mcfe*
On track with full year guidance
Note: Production includes our proportionate share of Four Star*Sales price and assumed asset retirement obligation

21
E&P Results
EBIT1
EBITDA1
Adjusted EBITDA1,2
Capital expendituresAcquisition capitalDivestiture Proceeds
$242
$454$486
$302$ –$598
20072008
Three Months EndedMarch 31,
$179
$349$377
$352$254$ –
1Includes $35 MM in MTM losses for 2008 and $3 MM in MTM gains in 20072Adjusted E&P EBITDA for interest in Four StarNote: Appendix includes details on non-GAAP terms
$ Millions

22
Decreasing Direct Lifting Costs$/Mcfe
FY 2007 1Q 2007 1Q 2008
Direct Lifting Costs Production TaxesGeneral & Administrative Taxes Other Than Production & Income
$1.88$0.05
$0.64
$0.31
$0.88
$1.99$0.03
$0.69
$0.32
$0.95$0.82
$0.42
$0.64
$0.04$1.92
23
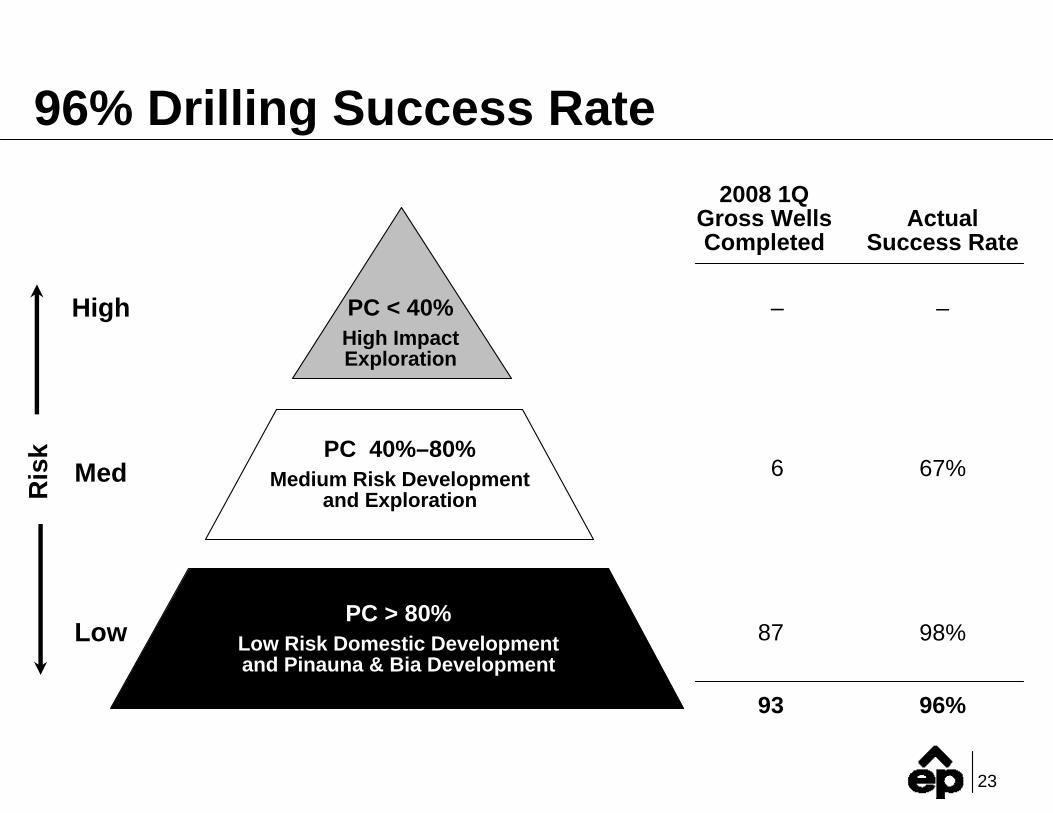
96% Drilling Success Rate
High
Med
Low
Ris
k
2008 1QGross WellsCompleted
–
67%
98%
ActualSuccess Rate
–
6
87
93 96%
PC > 80%Low Risk Domestic Developmentand Pinauna & Bia Development
PC < 40%High Impact Exploration
PC 40%–80%Medium Risk Development
and Exploration

24
1Q Production Update
1Q 2007 1Q 2008
Central Western TGCGOM/SLA International
Note: Includes proportionate share of Four Star equity volumesAppendix includes details on non-GAAP terms*Excludes volumes from domestic assets sold and assumes full year of Peoples
MMcfe/d
1Q 2007 1Q 2008
Central Western TGCGOM/SLA International
283
189
18216
820
150
On track for 860–920 production guidance
316
236
17312
886
149
As Reported8% Increase
Pro Forma*4% Increase
297
182
12116770
154
308
201
13012798
147

25
Drilling Activity Ramping Up
1Q 2007 2Q 2007 3Q 2007 4Q 2007 1Q 2008 2Q 2008E
Average Drilling Rig Count
29 3025 25
31 31

26
UpsidePotential
Heavily weighted to U.S. Onshore (86%)869 Bcfe Proved Undeveloped ReservesR/P of 9.6
6.1 Tcfe unrisked non-proved resources2.0 Tcfe risked unconventional and low riskInventory grew by 12% in 2007
Infill drilling (CBM, Altamont, ArkLaTex)Emerging shale gas plays(Pierre and Haynesville)International exploration leads
Significant Resource Inventory*
2.8 TcfeProved
Reserves
2.8 TcfeUnprovedInventory
*As of 12/31/2007 adjusted for 2008 domestic divestitures

27
Summary
Fundamentals remain strong
Businesses performing well
Solid growth outlook
Higher commodity prices provide increased earnings power

El Paso Corporation
First Quarter 2008Financial & Operational Update
May 8, 2008

29
Appendix
30
Disclosure of Non-GAAPFinancial Measures
The SEC’s Regulation G applies to any public disclosure or release of material information that includes a non-GAAP financial measure. In the event of such a disclosure or release, Regulation G requires (i) the presentation of the most directly comparable financial measure calculated and presented in accordance with GAAP and (ii) a reconciliation of the differences between the non-GAAP financial measure presented and the most directly comparable financial measure calculated and presented in accordance with GAAP. The required presentations and reconciliations are attached. Additional detail regarding non-GAAP financial measures can be reviewed in El Paso’s full operating statistics, which will be posted at www.elpaso.com in the Investors section.
El Paso uses the non-GAAP financial measure “earnings before interest expense and income taxes” or “EBIT” to assess the operating results and effectiveness of the company and its business segments. The company defines EBIT as net income (loss) adjusted for (i) items that do not impact its income (loss) from continuing operations, such as extraordinary items, discontinued operations, and the impact of accounting changes; (ii) income taxes; and (iii) interest and debt expense. The company excludes interest and debt expense so that investors may evaluate the company’s operating results without regard to its financing methods or capital structure. EBITDA is defined as EBIT excluding depreciation, depletion and amortization. El Paso’s business operations consist of both consolidated businesses as well as investments in unconsolidated affiliates. As a result, the company believes that EBIT, which includes the results of both these consolidated and unconsolidated operations, is useful to its investors because itallows them to evaluate more effectively the performance of all of El Paso’s businesses and investments. Exploration and Production per-unit total cash costs or cash operating costs equal total operating expenses less DD&A and cost of products and services divided by total production. It is a valuable measure of operating efficiency. For 2008, Adjusted EPS is earnings per share from continuing operations excluding the loss related to the change in fair value of an indemnification from the sale of an ammonia plant in 2005, the gain related to an adjustment of the liability for indemnification of medical benefits for retirees of the Case Corporation, gain related to the disposition of a portion of the company’s investment in its telecommunications business, changes in fair value of power contracts and changes in fair value of the production-related derivatives in the Marketing segment during the quarter. For 2007, Adjusted EPS is earnings per share from continuing operations excluding changes in fair value of production-related derivatives in the Marketing segment and debt repurchase costs. Adjusted EPS is useful in analyzing the company’s on-going earnings potential.
El Paso believes that the non-GAAP financial measures described above are also useful to investors because these measurements are used by many companies in the industry as a measurement of operating and financial performance and are commonly employed by financial analysts and others to evaluate the operating and financial performance of the company and its business segments and to compare the operating and financial performance of the company and its business segments with the performance of other companies within the industry.
These non-GAAP financial measures may not be comparable to similarly titled measurements used by other companies and should not be used as a substitute for net income, earnings per share or other GAAP operating measurements.

31

32

33
2008 Analysis ofWorking Capital and Other Changes
$ (15)
116
(60)
(169)
(27)
73
$ (82)
Margin collateral
Changes in price risk management activities
Settlements of derivative instruments
Net changes in trade receivable/payable
Settlement of liabilities
Other
Total working capital changes & other
Three Months EndedMarch 31, 2008
$ Millions

34
Items Impacting 1Q 2007 Results
Net income available to common shareholders
Adjustments1
Change in fair value of production-related derivatives
Debt repurchase costs
Discontinued operations (ANR)
Adjusted EPS—continuing operations2
$ 87
201
(1,048)
Pre-tax$ 620
$ 56
128
(677)
After-tax$ 0.89
$ 0.08
0.18
(0.97)
$ 0.18
Diluted EPS
1Assumes a 36% tax rate except for discontinued operations, and 694 MM shares2Based upon 756 MM dilutive shares and includes the income impact from dilutive securities
$ Millions, Except EPS

35
Reconciliation of EBIT/EBITDA
EBITDALess: DD&AEBITInterest and debt expenseIncome (loss) before income taxesIncome taxes Income (loss) from continuing operationsDiscontinued operations, net of taxes
Net IncomePreferred stock dividends
Net income available tocommon stockholders
$ 913313600
(233)367148219
–219
19
$ 200
Three Months EndedMarch 31,
$ 487271216
(283)(67)(19)(48)677629
9
$ 620
2008 2007
$ Millions

36
Reconciliation ofAdjusted Pipeline EBITDA
$ 131398–
$ 43
$ 4804313
$ 510
$ 526
Citrus equity earnings50% Citrus DD&A50% Citrus interest50% Citrus taxesOther*
50% Citrus EBITDA
El Paso Pipeline EBITDAAdd: 50% Citrus EBITDALess: Citrus equity earnings
Adjusted Pipeline EBITDA
Citrus debt at March 31 (50%)
Three Months EndedMarch 31,
2008 2007$ 22
129
12(1)
$ 54
$ 4585422
$ 490
$ 441
*Other represents the excess purchase price amortization and differences between the estimated and actual equity earnings on our investment
$ Millions
37
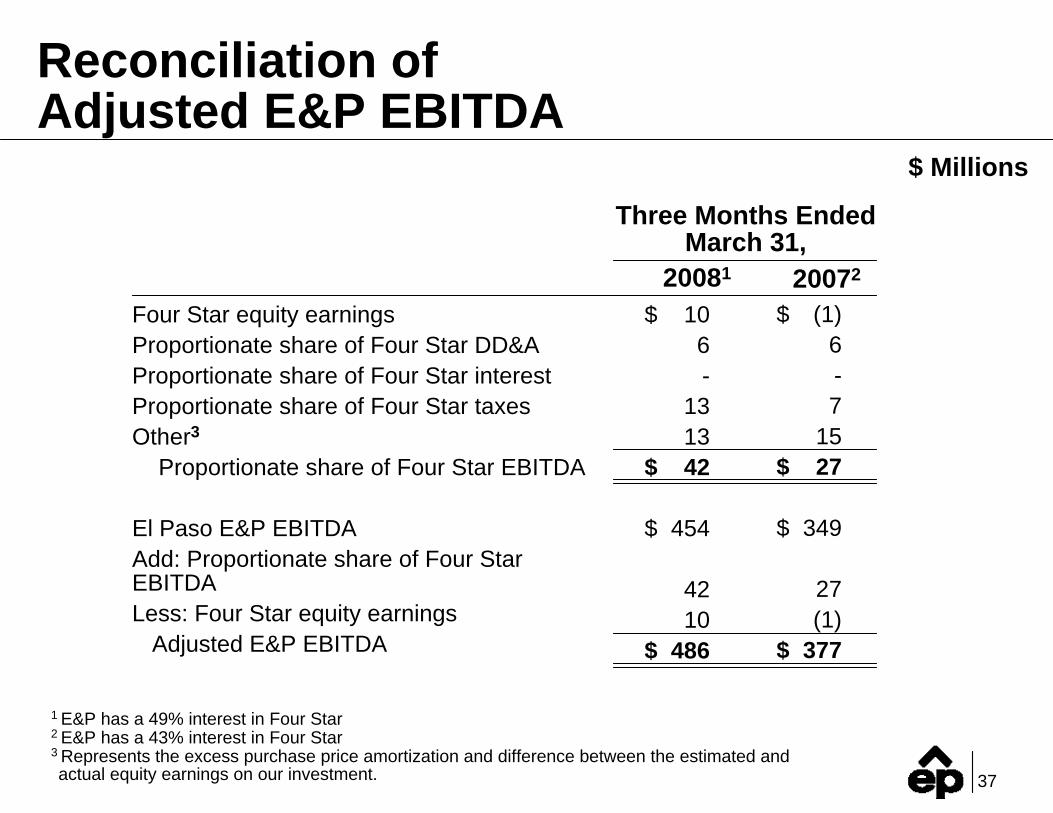
Reconciliation of Adjusted E&P EBITDA
$ 106-
1313
$ 42
$ 454
4210
$ 486
Four Star equity earningsProportionate share of Four Star DD&AProportionate share of Four Star interestProportionate share of Four Star taxesOther3
Proportionate share of Four Star EBITDA
El Paso E&P EBITDAAdd: Proportionate share of Four Star EBITDALess: Four Star equity earnings
Adjusted E&P EBITDA
Three Months EndedMarch 31,
20081 20072
$ (1)6-7
15$ 27
$ 349
27(1)
$ 377
1 E&P has a 49% interest in Four Star2 E&P has a 43% interest in Four Star3 Represents the excess purchase price amortization and difference between the estimated andactual equity earnings on our investment.
$ Millions

38
E&P Cash Costs
Total operating expense
Depreciation, depletion and amortization
Costs of products & services
Per unit cash costs*
Total equivalent volumes (MMcfe)*
$ 328
(170)
(24)
67,442
$4.86
(2.52)
(0.35)
$1.99
Total($ MM)
Per Unit($/Mcfe)
1Q 2007
*Excludes volumes and costs associated with equity investment in Four Star
$ 377
(212)
(24)
$ 5.11
(2.87)
(0.32)
$1.92
Total($ MM)
Per Unit($/Mcfe)
73,762
1Q 2008
$1,414
(780)
(92)
289,242
$4.89
(2.70)
(0.31)
$1.88
Total($ MM)
Per Unit($/Mcfe)
FY 2007

39
Production-Related Derivative Schedule
Designated—EPEPFixed price—LegacyFixed priceCeilingFloor
Economic—EPEPFixed priceCeilingFloor
Economic—EPMCeiling
Avg. ceilingAvg. floor
Designated—EPEPFixed price
Economic—EPEPFixed price
Economic—EPMCeilingFloor
Avg. ceilingAvg. floor
3.515.897.997.9
5.530.330.3
153.0153.0
1.88
0.690.69
2.572.57
$ 3.44$ 8.37$ 10.82$ 8.00
$ 8.24$ 10.48$ 8.00
$ 10.24$ 7.94
$ 88.48
$ 56.73$ 55.00
$ 79.97$ 79.51
4.6
71.871.8
16.8
93.276.4
1.93
1.50
3.433.43
$ 3.56
$ 13.45$ 8.57
$ 8.75
$ 12.12$ 8.27
$109.32
$110.71
$109.93$109.93
4.6
4.64.6
$3.70
$3.70$3.70
2008NotionalVolume(TBtu)
Avg. HedgePrice
($/MMBtu)
2009NotionalVolume(TBtu)
Avg. Hedge Price
($/MMBtu)
NotionalVolume(TBtu)
Avg. Hedge Price
($/MMBtu)
2010
NotionalVolume
(MMBbls)
Avg. HedgePrice
($/Bbl)
2008
Natural Gas
Crude Oil
6.8
6.86.8
$3.88
$3.88$3.88
NotionalVolume(TBtu)
Avg. Hedge Price
($/MMBtu)
2011–2012
Note: Positions are as of May 2, 2008 (Contract months: April 2008–Forward)
NotionalVolume
(MMBbls)
Avg. HedgePrice
($/Bbl)
2009

40
Production & ReservePro Forma Reconciliation
Reserves (Bcfe)Ending reserves 1/1/08
Adjustments*Pro forma ending reserves 1/1/08
1,328
(58)
1,270
715
(40)
675
550
(93)
457
269
(118)
151
247
–
247
3,109
(309)
2,800
OnshoreCentral Western TGC GOM Int’l Total
*Adjustments reflect elimination of divestiture properties

41
Reconciliation ofPro Forma Production Volumes
Equivalents, MMcfe/d
Central
Western
TGC
GOM/SLA
International
Total consolidated
Proportionate shareof Four Star
Total with Four Star
213
150
189
182
16
750
70
820
29
8
30
1
–
68
–
68
ReportedAdd:
Peoples
Less:Domestic
Assets SoldPro
Forma*
15
4
37
62
–
118
–
118
227
154
182
121
16
700
70
770
1Q 2007
241
149
236
173
12
811
75
886
–
–
–
–
–
–
–
–
ReportedAdd:
Peoples
Less:Domestic
Assets SoldPro
Forma*
8
2
35
43
–
88
–
88
233
147
201
130
12
723
75
798
1Q 2008
*Pro forma excludes volumes from domestic assets sold and assumes Peoples