Embed Size (px)
Citation preview

Economic living standardsin the UK
How the financial situation of householdshas changed in the last decade
Ms.Statistics
Ms.Statistics
Our financial situation -levels of personal and
household income,spending, borrowing and
saving - greatly affects our standard of living Ms.Statistics
Ms.Statistics
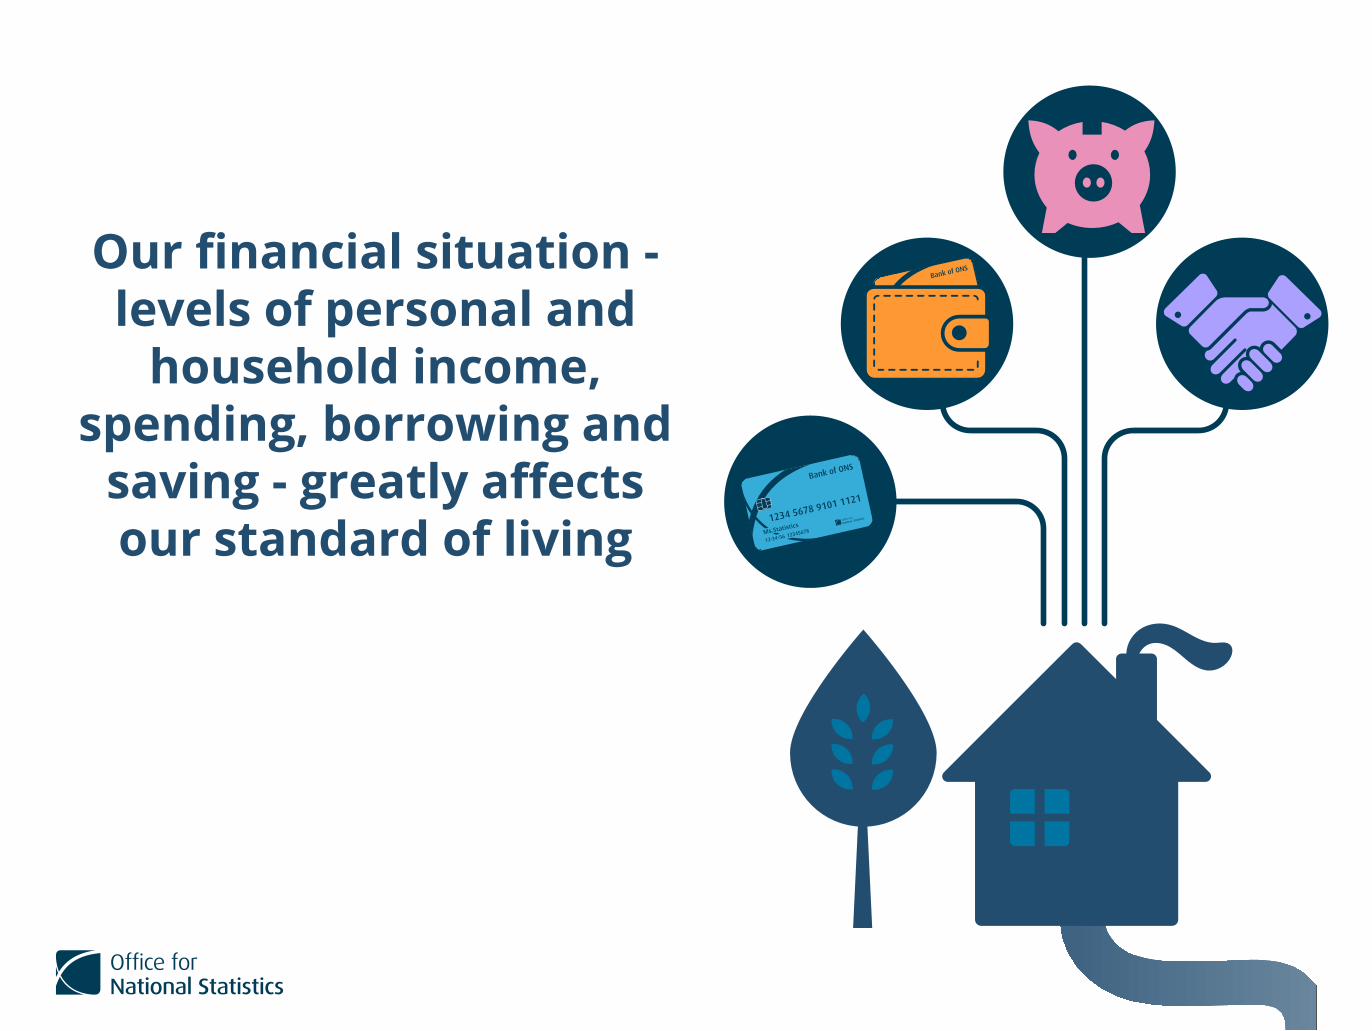
The UK economy has seen a lot of change in the last 10 years, from the recession to the Brexit vote,
but how has our financial situationbeen affected?
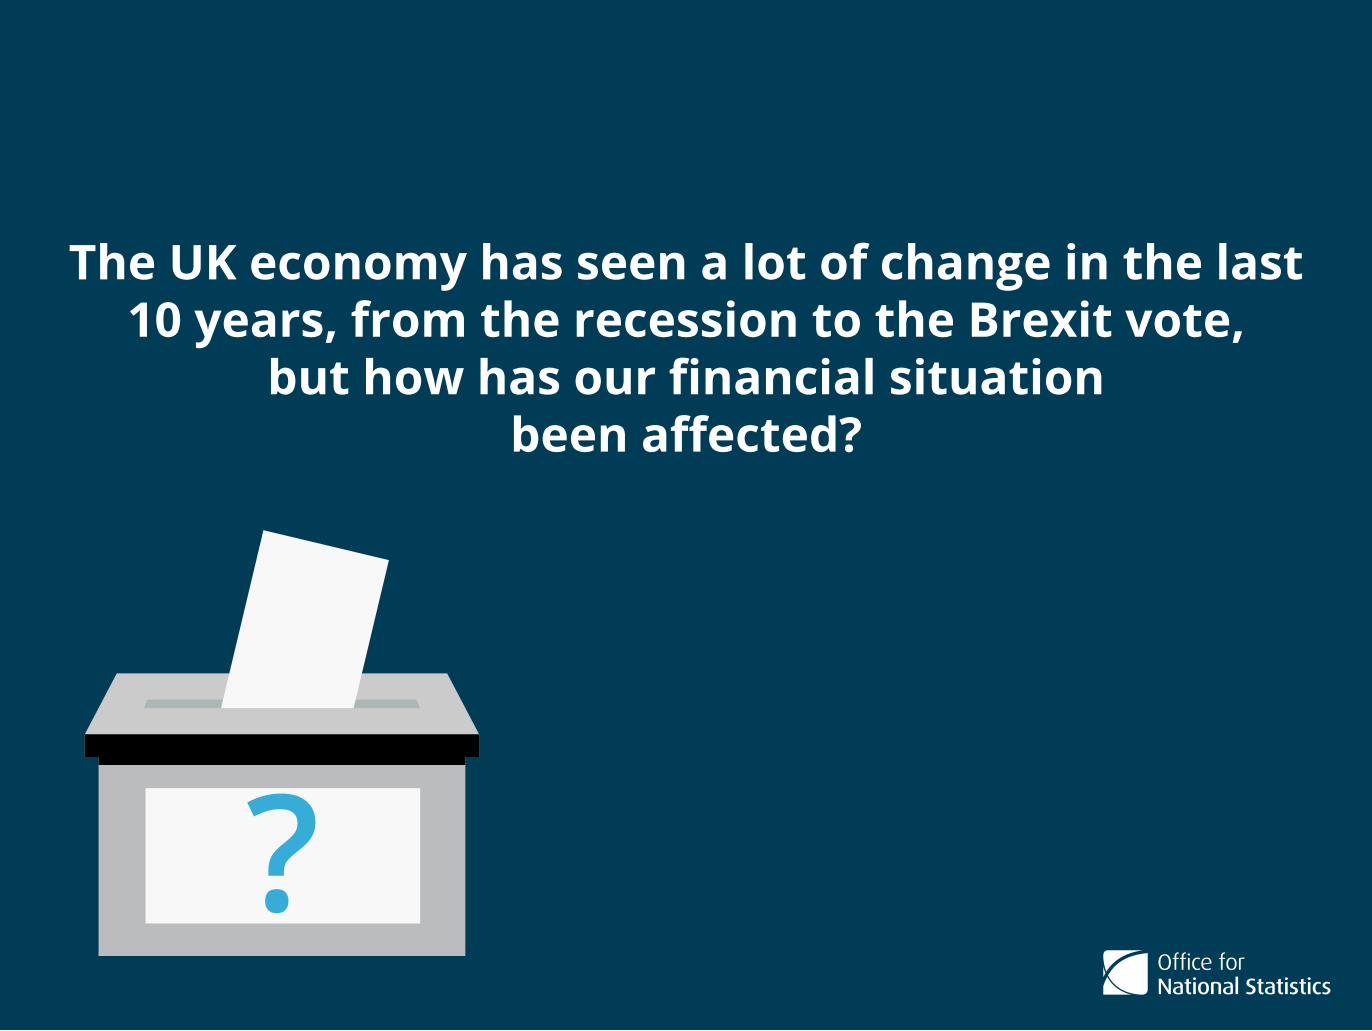
Income, Spending, Saving and Borrowing
Ms.Statistics
Ms.Statistics
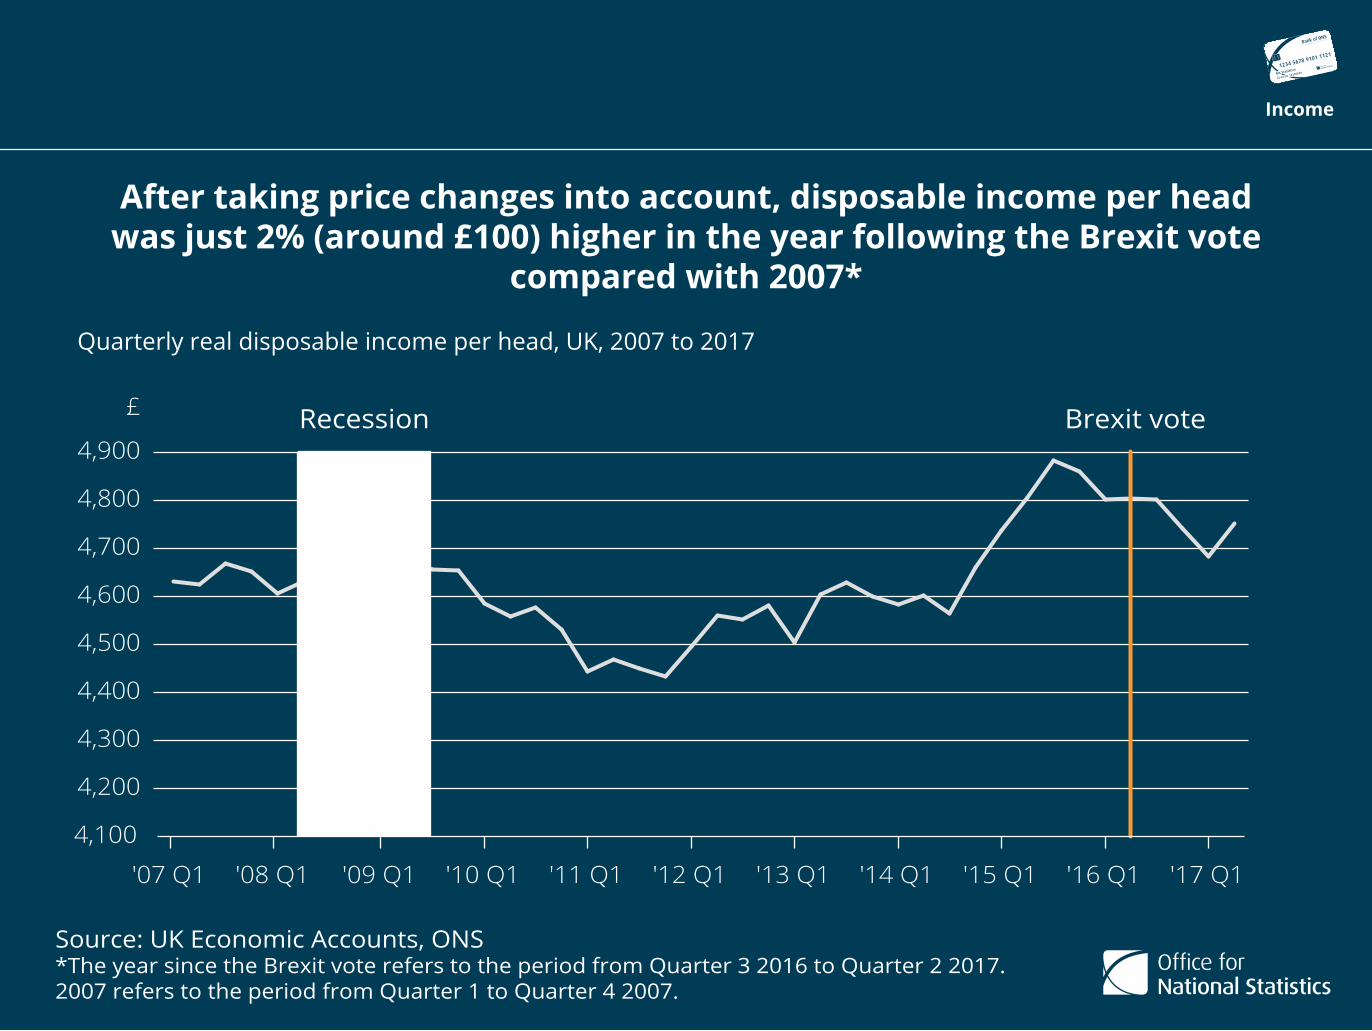
After taking price changes into account, disposable income per headwas just 2% (around £100) higher in the year following the Brexit vote
compared with 2007*
Quarterly real disposable income per head, UK, 2007 to 2017
Source: UK Economic Accounts, ONS*The year since the Brexit vote refers to the period from Quarter 3 2016 to Quarter 2 2017.2007 refers to the period from Quarter 1 to Quarter 4 2007.
Income
Ms.Statistics
4,100
4,200
4,300
4,400
4,500
4,600
4,700
4,800
4,900
£
'17 Q1'16 Q1'15 Q1'14 Q1'13 Q1'12 Q1'11 Q1'10 Q1'09 Q1'08 Q1'07 Q1
Brexit voteRecession

The richest areas have seen their income rise by more than the poorest.The difference between the area with the highest and lowest income
per head widened by nearly a third between 2007 and 2015
Annual gross disposable income per head, 2007 and 2015
Source: Regional gross disposable household income, ONS
Income
Ms.Statistics
0 10000 20000 30000 40000 50000 60000 £
Kensington, Chelsea, Hammersmith and FulhamNottingham
2007Difference: £30,998
£11,079
£12,779
£42,077
£52,298Difference: £39,519
2015
Changes in spending have a major impact on economic growth:
household spending made up 63% of GDP in 2016
Spending
Ms.Statistics
Ms.Statistics
Ms.Statistics

Our spending has edged above its pre-recession level in the last year.A typical person spent £49 (1%) more per quarter,
on average, in the year following the referendum than in 2007
Quarterly real spending per head, UK, 2007 to 2017
Source: UK Economic Accounts, ONS
Spending
Ms.Statistics
3,800
4,000
4,200
4,400
4,600
4,800
£
'17 Q1'16 Q1'15 Q1'14 Q1'13 Q1'12 Q1'11 Q1'10 Q1'09 Q1'08 Q1'07 Q1
Brexit voteRecession
While income and spending have increased in the last 10 years, what we have available to save
has dropped in that period
Saving
Ms.Statistics
Ms.Statistics
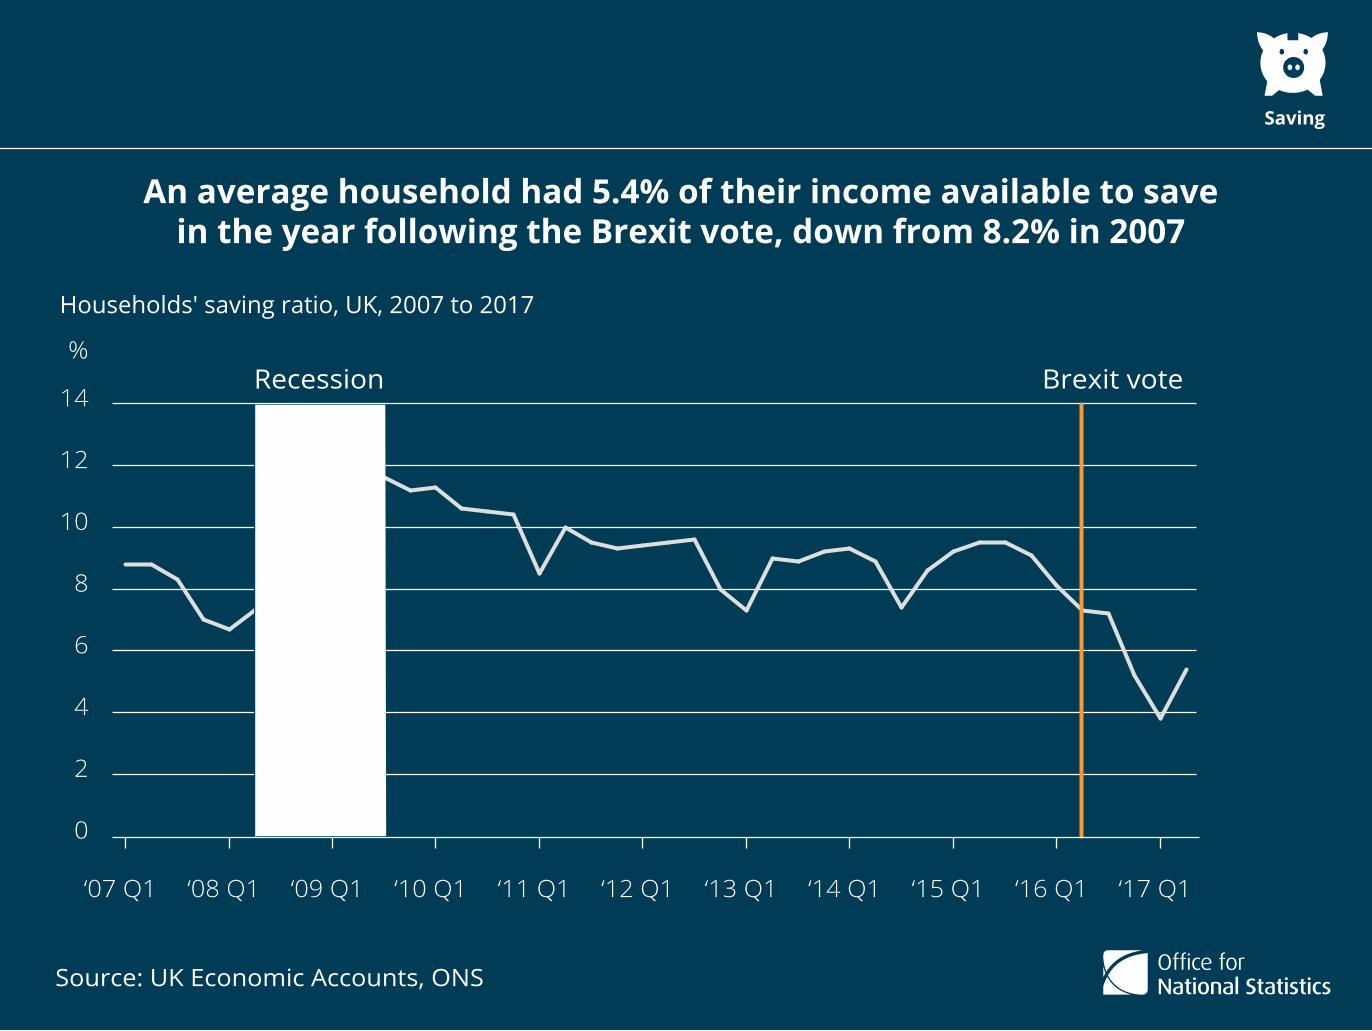
An average household had 5.4% of their income available to savein the year following the Brexit vote, down from 8.2% in 2007
Households' saving ratio, UK, 2007 to 2017
Source: UK Economic Accounts, ONS
Saving
0
2
4
6
8
10
12
14
%
‘17 Q1‘16 Q1‘15 Q1‘14 Q1‘13 Q1‘12 Q1‘11 Q1‘10 Q1‘09 Q1‘08 Q1‘07 Q1
Brexit voteRecession
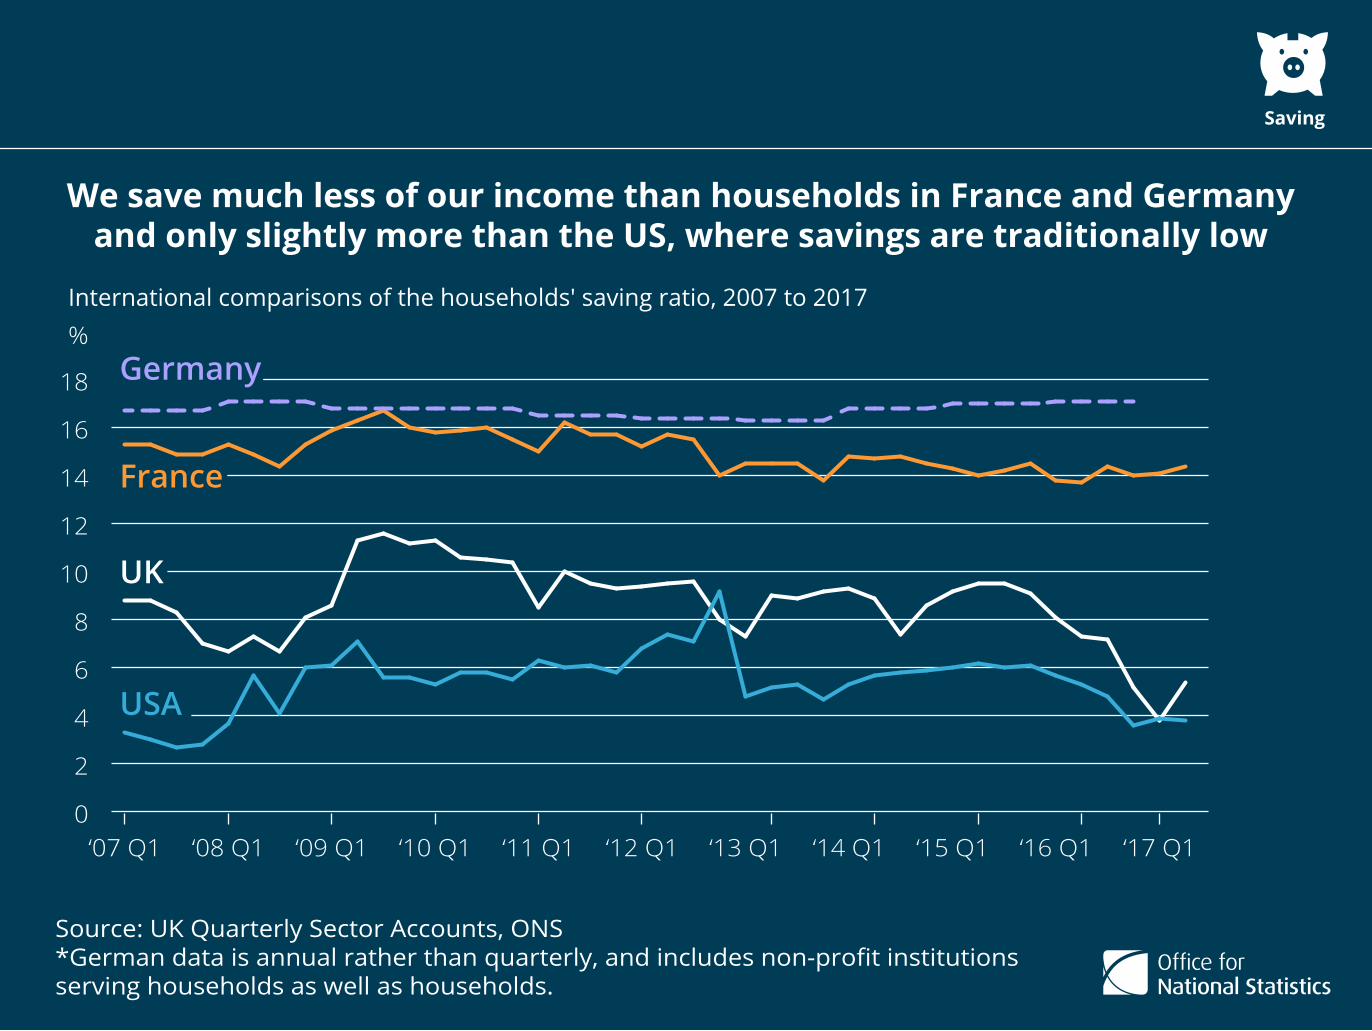
We save much less of our income than households in France and Germanyand only slightly more than the US, where savings are traditionally low
International comparisons of the households' saving ratio, 2007 to 2017
Source: UK Quarterly Sector Accounts, ONS*German data is annual rather than quarterly, and includes non-profit institutionsserving households as well as households.
Saving
0
2
4
6
8
10
12
14
16
18
%
UK
France
USA
‘17 Q1‘16 Q1‘15 Q1‘14 Q1‘13 Q1‘12 Q1‘11 Q1‘10 Q1‘09 Q1‘08 Q1‘07 Q1
Germany
The fall in savings has coincided with a return to
high borrowing seen before the recession,
particularly in the form of consumer credit
Borrowing
Ms.Statistics
Ms.Statistics
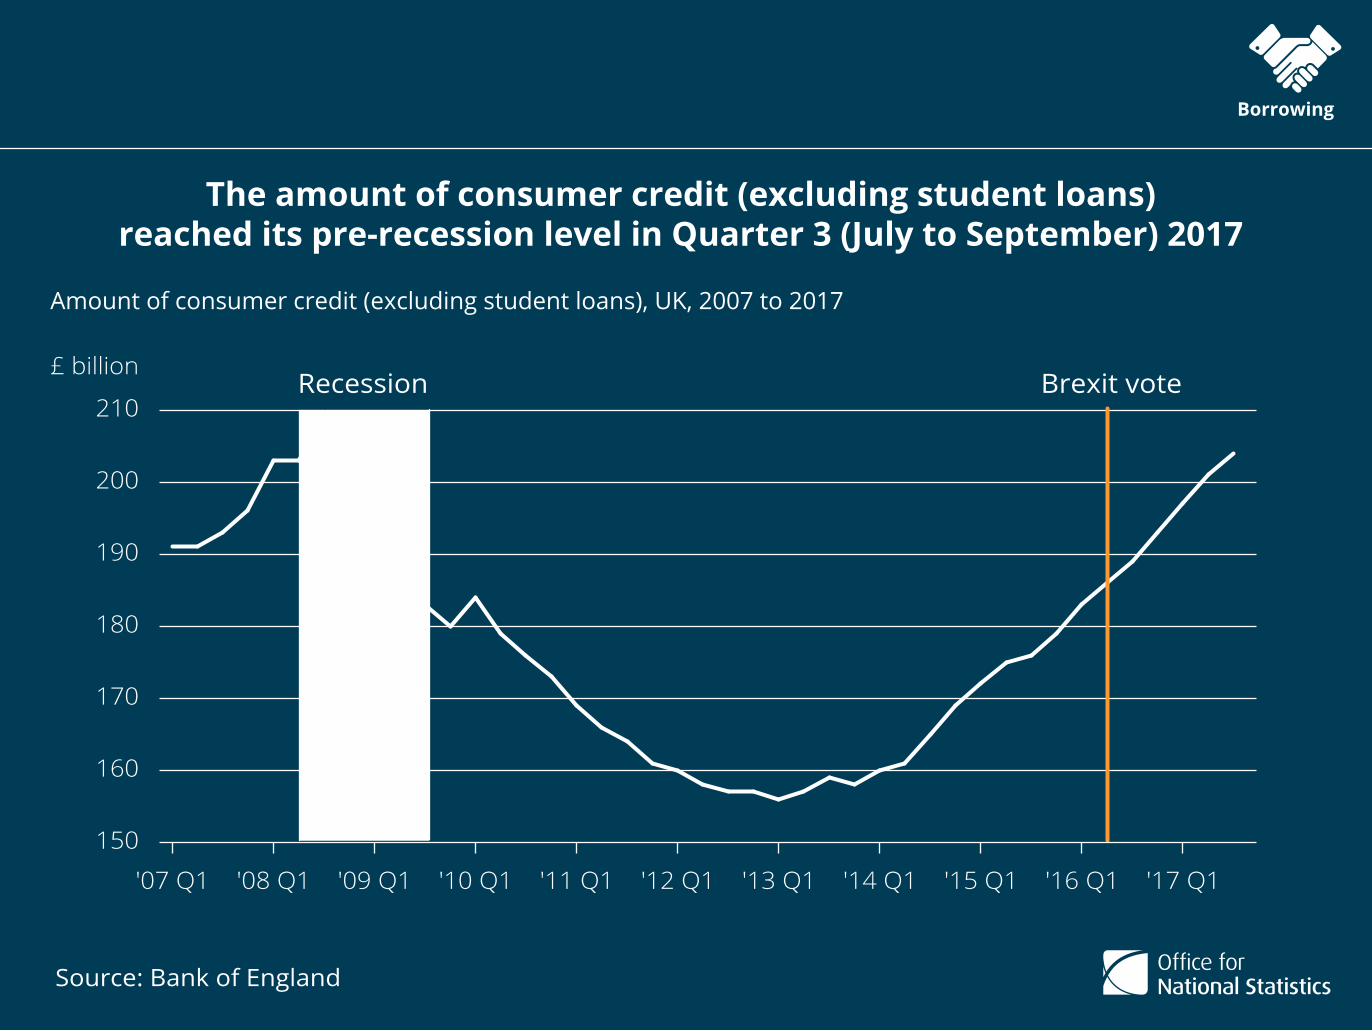
The amount of consumer credit (excluding student loans)reached its pre-recession level in Quarter 3 (July to September) 2017
Amount of consumer credit (excluding student loans), UK, 2007 to 2017
Source: Bank of England
Borrowing
150
160
170
180
190
200
210
£ billion
'17 Q1'16 Q1'15 Q1'14 Q1'13 Q1'12 Q1'11 Q1'10 Q1'09 Q1'08 Q1'07 Q1
Brexit voteRecession
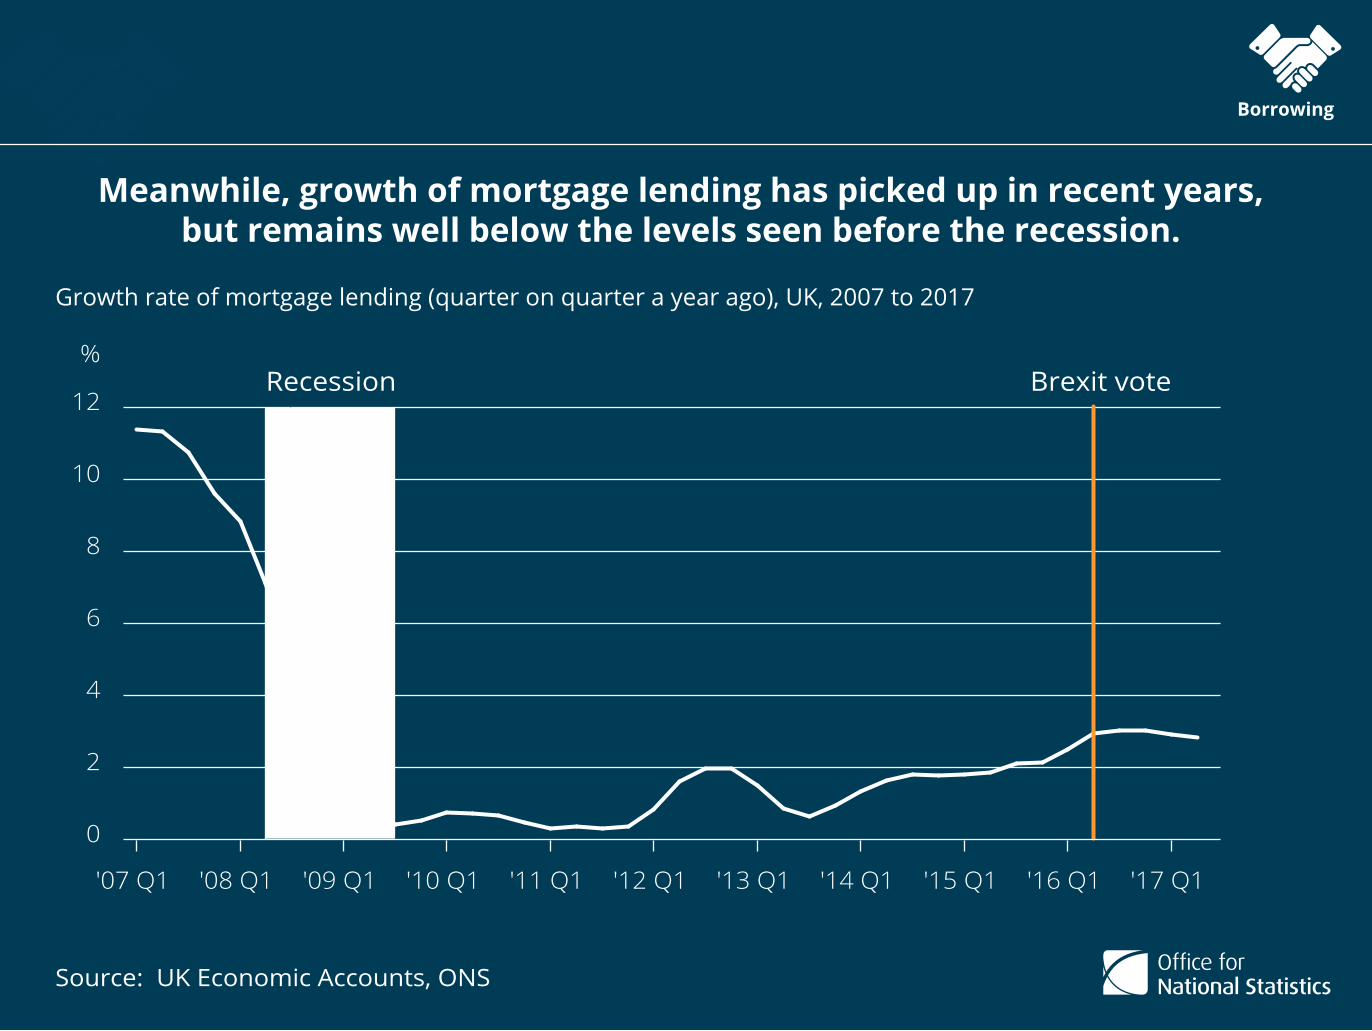
Meanwhile, growth of mortgage lending has picked up in recent years,but remains well below the levels seen before the recession.
Growth rate of mortgage lending (quarter on quarter a year ago), UK, 2007 to 2017
Source: UK Economic Accounts, ONS
Borrowing
0
2
4
6
8
10
12
%
'17 Q1'16 Q1'15 Q1'14 Q1'13 Q1'12 Q1'11 Q1'10 Q1'09 Q1'08 Q1'07 Q1
Brexit voteRecession
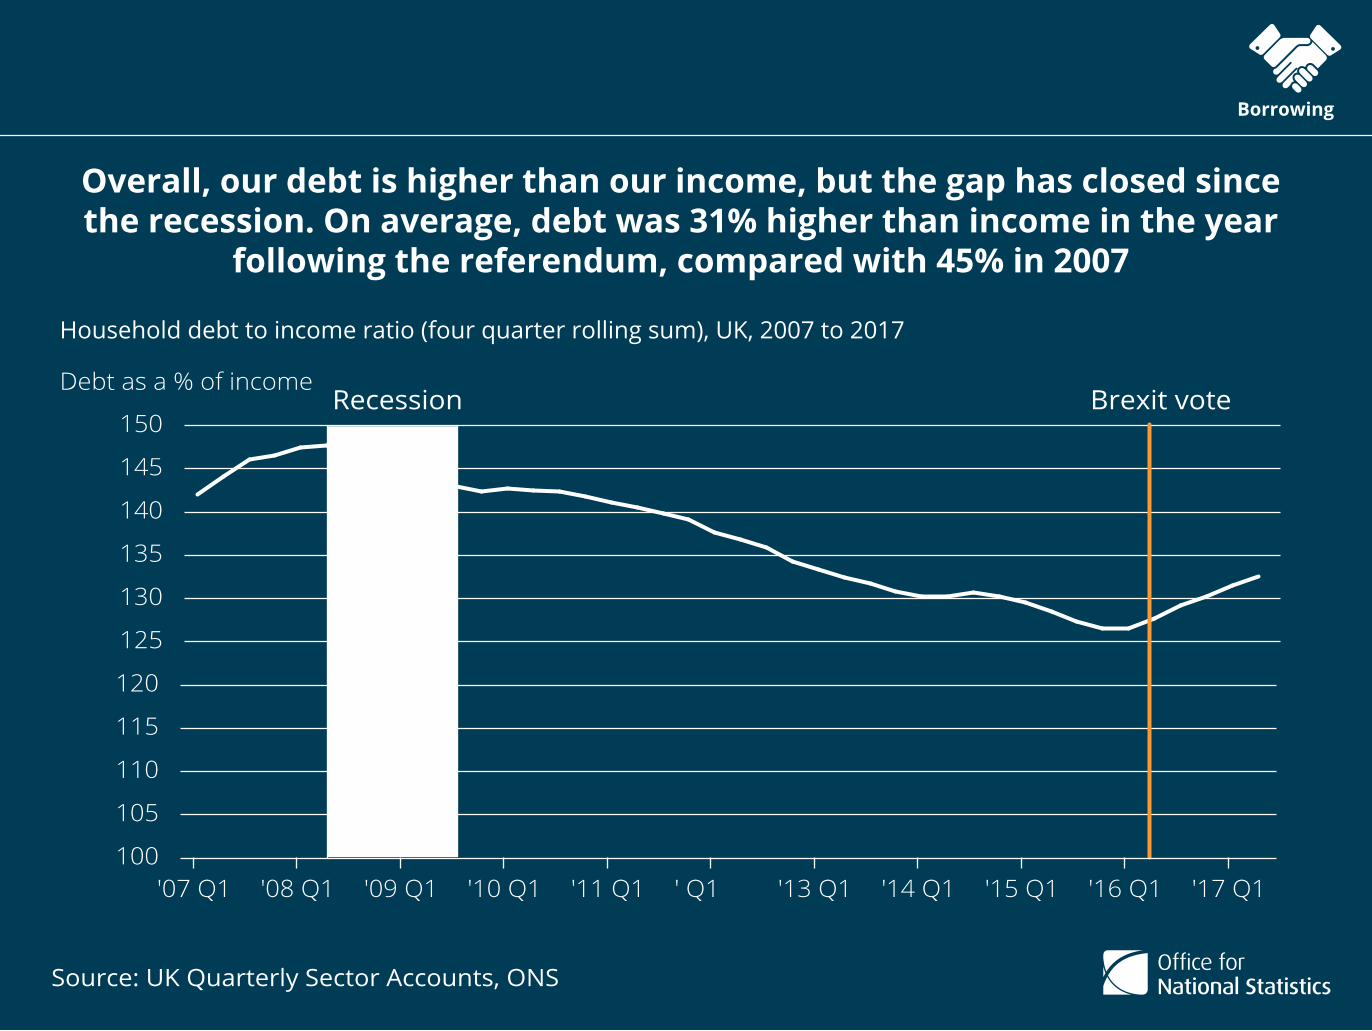
Overall, our debt is higher than our income, but the gap has closed since the recession. On average, debt was 31% higher than income in the year
following the referendum, compared with 45% in 2007
Household debt to income ratio (four quarter rolling sum), UK, 2007 to 2017
Source: UK Quarterly Sector Accounts, ONS
Borrowing
100
105
110
115
120
125
130
135
140
145
150
Debt as a % of income
'17 Q1'16 Q1'15 Q1'14 Q1'13 Q1' Q1'11 Q1'10 Q1'09 Q1'08 Q1'07 Q1
Brexit voteRecession

Keep in touch
For more information, visit our website
www.ons.gov.uk
www.facebook.com/ons www.linkedin.comwww.twitter.com/ons