Embed Size (px)
Citation preview

Presented by Guillermo Mazier/ Atlas Advertising

About Your Presenters
Guillermo Mazier – VP, Strategic Accounts, Atlas Advertising• Former economic developer and tourism marketer for the Costa Rican
Investment and Trade Development Board• Managed economic development and tourism campaign for Tortugero, CR• Industry speaker, content strategy and digital marketing specialist
www.twitter.com/atlasad
Drew Varnado – Data Innovation Specialist, IMPLAN Group• Ph.D. in Agricultural Economics (Applied Economics) from Louisiana State
University• Published in peer reviewed journals, university publications, and in government
agency reports (Bureau of Ocean Energy Management, forthcoming)

Introducing Atlas
1. Denver-based marketing services company, specializing in economic development and tourism marketing
2. Founded in 2001, 30 employees
3. Has worked with more communities than any other economic development marketing services firm in the past 10 years: 195+ economic development clients in 47 states and 6 countries
4. Specialize in providing branding, marketing planning, digital marketing, and GIS enabled websites, all for economic development
5. Pioneered the industry’s first metrics based benchmarking approach for marketing, business attraction, and business retention: High Performance Economic Development Marketing
6. IEDC’s High Performance Economic Development Marketing Partner
7. Frequent public speaker and lead speaker on benchmarking marketing, business attraction, and business retention programs, as well as on branding, research, digital marketing, websites, and GIS.

Introducing Implan
IMPLAN is the leading provider of economic impact modeling for all types of users needing to assess the economic impact of events or projects in any of the 536 IMPLAN industry sectors (corresponding to NAICS).
IMPLAN’s intuitive, online-platform makes constructing multipliers and social accounts easy. Whether you are working with zip codes, county, state, MSA or national aggregates, each subscription includes access to vast economic and demographic variables including employment, multipliers, tax impacts and more.
IMPLAN has been developing complex databases and software since 1993.

View the Slides, Continue the Dialogue
• Continue the Conversation: – Follow us on Twitter:
www.twitter.com/AtlasAd – Tweet questions using hashtag
#ASKATLAS – Join High Performance Economic
Development LinkedIn Group • View and share the slides with your
colleagues (available now): www.slideshare.com/wright0405

Today’s Presentation
• Connecting metrics and “moneyball” • A short history of metrics• How one community is staying true to their metrics• How to implement metrics for your EDO• What tools make it easier for you?
– Benchmarking reports– IMPLAN software– Scorecards
• Summary: key takeaways


The Moneyball Concept
• True story about Oakland A’s 2002 season
• Team lost all their star players and must rebuild with limited resources
• GM Billy Beane carries daunting task of winning against teams with triple the budget
• Beane recruits intern-turned-assistant GM Peter Brand who has radical new ideas about how to win

The Moneyball Concept
• The answer: Instead of focusing on buying players, they needed to focus on buying wins
• In order to buy wins, they needed to buy runs
• In order to buy runs, they needed to acquire players that could get on base
For Billy, the question was, "Which actions correlate most strongly to winning games?”

History of Metrics for Economic
Development
In 2015, the general public still doesn’t know the value of
what we do
EDOs have been measuring their
performance for years
However, with differing viewpoints, metrics have
gotten muddy and misunderstood
In 2011, Atlas put together its first survey of EDO outcomes, to assist
EDOs in planning their marketing, business
attraction, and business retention programs
2011
In 2014, IEDC published its “Making it Count”
Metrics for High Performing EDOs
2014
2016

25,000
123
Average companies served
Typical number of establishments in a community

Trends in the Profession That Make
Metrics a Moving Target 1. Digital is changing the way communities are being evaluated, and changing our
roles in the process2. Workforce drives business location, and opens up new ways for EDOs to
influence economies3. The debate about whether the profession drives outcomes continues, even as the
Great Recession is in the rear view4. There are more deals happening in communities, leading to more positive
impressions of EDOs 5. The investor/stakeholder mindset is changing, as demographics of those involved in EDOs are changing

How Can Your EDO Go From .250 to .300?
Ø In the sport of baseball, most respectable players bat an average of .250, or one hit for every four times at bat.
Ø If a .250 batter is also a good fielder, he can expect to do well in the big
leagues. Ø But, if he hits .300, or three hits out of 10 at bats, he is considered a star. By
the end of a season, only a hand full of players will be at .300 and be honored as a star.
Consider this: the difference between the truly great players and the average ones is only one hit out of 20.
What if we were to apply this same principle to economic development? How could a community know how to achieve its
margin of greatness? And how do we know if, as economic developers, we’re making a difference?


4 Ways IEDC Defines Performance Metrics
1. Internal Segment (Employee
satisfaction, funding sources)
2. ED Program Segment (Business Attraction, Business Retention, Business Creation)
3. Relationship Management Segment (Relationships with internal and external stakeholders)
4. Community Segment (Community well
being, in terms of demographics, workforce, household income, etc.)

Atlas High Performance Economic
Development Focuses on the Relationship
Management Segment (Plus Outcomes from
those Relationships)
1. Internal Segment (Employee satisfaction,
funding sources
2. ED Program Segment (Business Attraction, Business Retention, Business Creation)
3. Relationship Management Segment (Relationships with internal and external stakeholders)
4. Community Segment (Community well being,
in terms of demographics, )
Outcomes for jobs announced and capital investment announced

Start With the Big 4, Then Get More

Source: How High Performance Economic Development Creates Exceptional Communities (2015)
The Spread Between High & Low Performing
Organizations is Staggering, at All Sizes


BUILDINGACULTUREOFRESPONSIBILITY

KEEP SCORE

REGIONAL
SCO
RECA
RD


“
”


Poll Question: How many metrics do you use to measure your org?
Poll Question: Did your organization meet the metrics that it set in 2015? Do you believe that those metrics were not as aggressive?

Poll Question: What is stopping you from implementing metrics for your
role within the organization?


Steps to Put High Performance into Practice
1. Discuss your organizational priorities for marketing, business recruitment, and business retention, and start with a simple score card
2. Assign metrics to certain staff 3. Set a plan to influence that metric for each staff person 4. Make the metrics plan transparent to your stakeholders 5. Execute, report, and adjust

What are your Organizational Priorities?

Assigning Metrics to Staff What Metrics Does Each Function Influence?
WEB VISITS INQUIRIES /CONVERSATIONS
JOBS ANNOUNCED
CAPITAL INVESTMENT ANNOUNCED
CEO/Executive X X X X Business Developer X X X
Marketer X X
Researcher X

Setting A Plan So That Each Staff
Person Can Drive High Performance
BUILD THIS
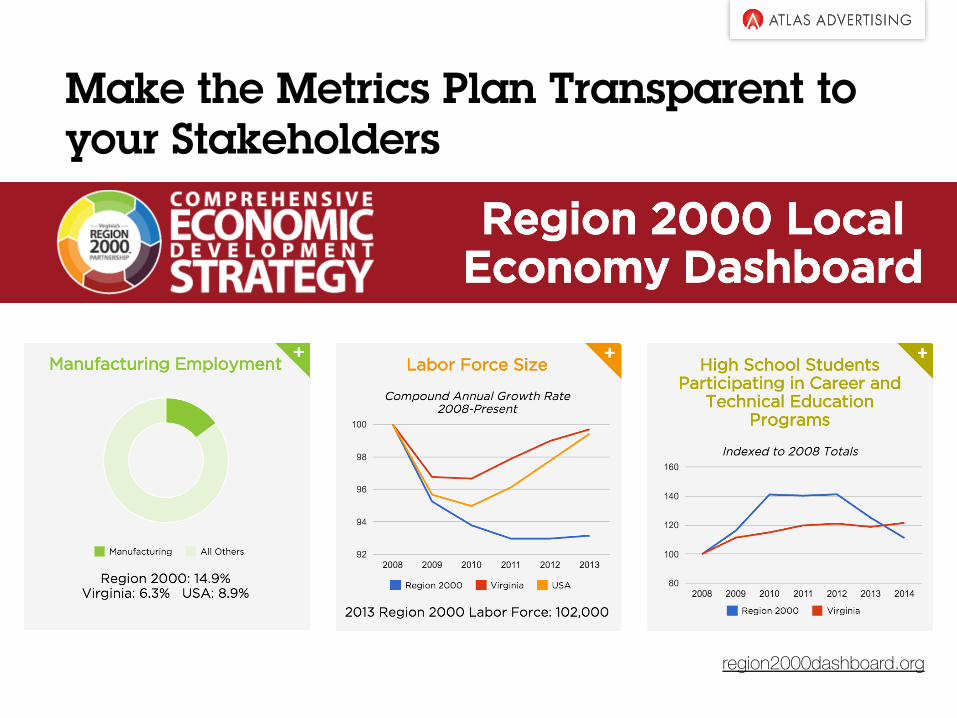
Make the Metrics Plan Transparent to
your Stakeholders
region2000dashboard.org

Make the Metrics Plan Transparent to your Stakeholders
ncdashboard.net
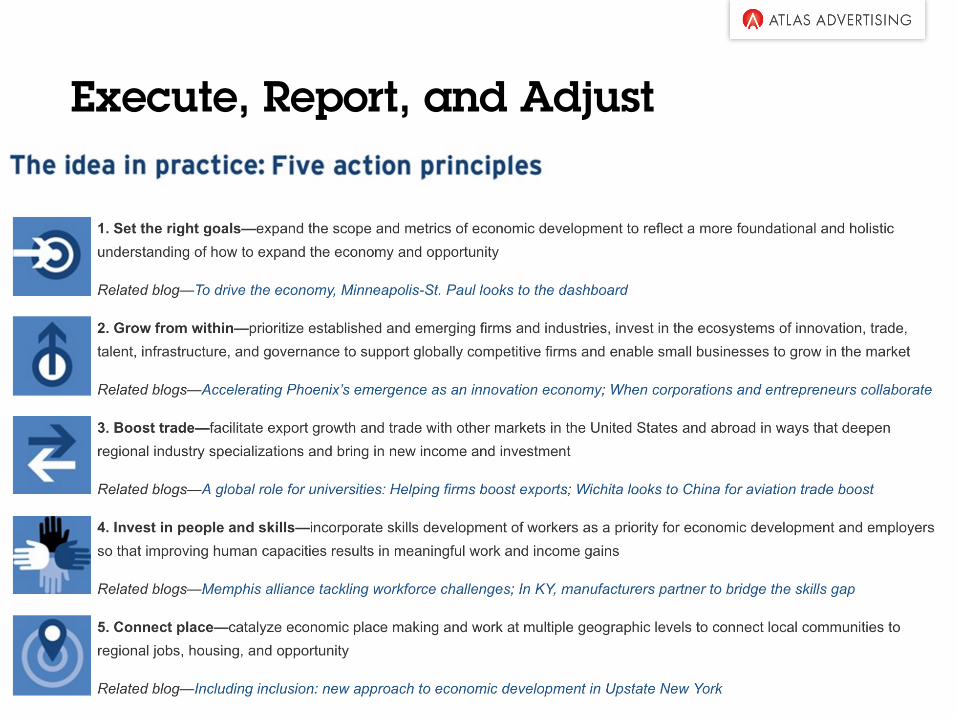
Execute, Report, and Adjust
Tools to Check Out!
Public Sources 1. U.S. Bureau of Labor Statistics 2. U.S. Census Bureau 3. Bureau of Economic Analysis 4. State research centers/ED departments 5. Area university research centers 6. Atlas benchmarking tool Proprietary Sources 1. Moody’s Economy.com 2. EMSI (Economic Modeling Specialists
Intl.) 3. Edward Lowe Foundation
(youreconomy.org) 4. IMPLAN Group
It’s unbelievable how much you don’t know about the game you’ve been playing all your life. - Mickey Mantle

The metrics that your EDO selects will drive the impact that you have on your community
The impact that you have on your community will affect the lives of your stakeholders, and prove the value of your EDO

UnderstandingYourEconomy
• DataDrivenApproachtoMeasureTotalImpact• Evalua<onofProjects• UnderstandingtheImpactofYourOrganiza<onontheEconomy
• DriversoftheEconomy

• KeyIndustries• Employment• LaborIncome• Output• TotalandPerCapita/Employee• Mul<pliers
• Specializa<on• Loca<onQuo<ent• Shannon-WeaverIndex
UnderstandingYourEconomy

DefiningyourMetrics
• MeasuresofOpportunity-ImportSubs<tu<onStrategy
• HouseholdandIndustryDemand• RegionalPurchasingCoefficients• InputsintoKeyIndustries
• ValueChain• GrowthOpportuni<esbasedonexis<ngdemand

Quan<fyingtheImpact
• Inputs• Employment,Investment,Wages
• Impacts• Direct• Indirect• Induced
• Employment• IndustriesImpacted• Fiscal/TaxImpacts

These changes are the
DIRECT EFFECTS
The process begins with a
change in Production or
Spending
Household Income
Leakages Imports
Personal Taxes
Savings
Spending on Local Goods and Services causes INDUCED
EFFECTS
Leakages Payroll Taxes In-Commuters
Labor Income
The Direct Output Effects are applied to the Indirect
Multipliers to calculate the INDIRECT EFFECTS
Leakages Imports Taxes Profits
HowDoesImpactAnalysisWork?

Baseline:BuncombeCounty,NC
Indicator Smith,TX Buncombe,NC
Output $21,596,609,976 $21,519,741,849
Outputperworker $154,068 $127,890
TotalEmployment 140,176 168,268
AverageHHIncome $118,975 $92,351
Popula<on 218,842 250,539
ShannonWeaverIndex 0.71469 0.74054
NumberofIndustries 265 311
LandArea 929 656

TopFiveSectors:Employment
Sector Employment Output EmployeeCompensa<on
Realestate 7,696 $958,804,688 $43,405,155
Full-servicerestaurants 7,267 302,299,438 148,285,294
Hospitals 6,960 990,983,032 453,143,005
Limited-servicerestaurants 5,343 380,082,947 82,896,782
Localgovt,educa<on 4,697 $303,959,503 $262,238,342

TopFiveSectors:Output
Sector Employment Output EmployeeCompensa<on
Hospitals 6,960 $990,983,032 $453,143,005
Realestate 7,696 958,804,688 43,405,155
Wholesaletrade 3,861 782,788,757 228,740,952
Officesofphysicians 4,384 684,782,288 476,147,156
Relayandindustrialcontrolmanufacturing 1,686 $627,366,638 $147,647,827

TopFiveSectors:EmployeeCompensa<on
Sector Employment Output EmployeeCompensa<on
Officesofphysicians 4,384 $684,782,288 $476,147,156
Hospitals 6,960 990,983,032 453,143,005
*Employmentandpayrolloffederalgovt,non-military 2,425 420,883,575 269,351,044
*Employmentandpayrolloflocalgovt,educa<on 4,697 303,959,503 262,238,342
*Employmentandpayrolloflocalgovt,non-educa<on 3,065 219,606,110 189,266,922
Full-servicerestaurants 7,267 $302,299,438 $148,285,294

Loca<onQuo<ent:Specializa<on
Sector LQ EmploymentRelayandControlMfg 39.1 1,686Sohwarereproducing 16.5 193Breweries 9.1 386Aircrahengine 3.7 271Wineries 3.7 216
Greenhouse,nursery,andfloricultureproduc<on 3.2 440Prin<ng 2.7 1,304
Warehousingandstorage 2.1 1,838Hotels 1.6 2,040MotorGeneratorMfg 1.6 663
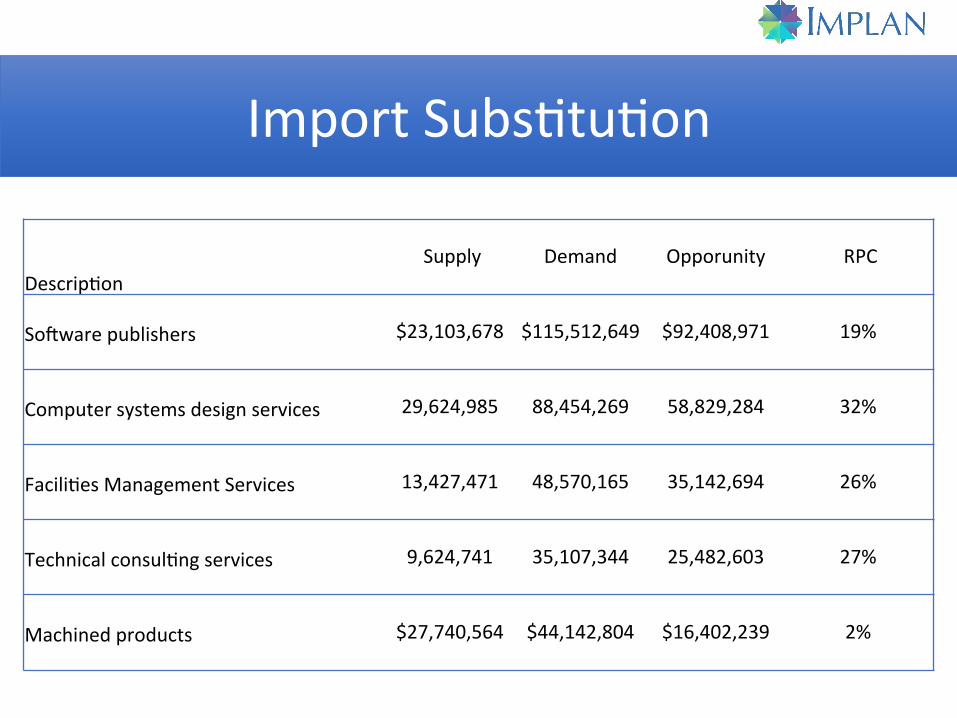
ImportSubs<tu<on
Descrip<onSupply Demand Opporunity RPC
Sohwarepublishers $23,103,678 $115,512,649 $92,408,971 19%
Computersystemsdesignservices 29,624,985 88,454,269 58,829,284 32%
Facili<esManagementServices 13,427,471 48,570,165 35,142,694 26%
Technicalconsul<ngservices 9,624,741 35,107,344 25,482,603 27%
Machinedproducts $27,740,564 $44,142,804 $16,402,239 2%

FilteringtheOpportuni<es
Sector Employment OutputPerWorkerLaborIncomePer
Worker
Wirelesstelecommunica<onscarriers(exceptsatellite) 230 $1,555,137 $29,557
Pharmaceu<calprepara<onmanufacturing 145 1,524,176 81,762
Electricpowertransmissionanddistribu<on 154 1,456,327 101,210
Breweries 386 1,014,475 50,807
Aircrahengineandenginepartsmanufacturing 271 $722,305 $78,407

EmploymentImpacts
200 200 200
89131
96
90
96 145
0
50
100
150
200
250
300
350
400
450
500
Brewery AircrahEngine RelayandIndustrialControl
Direct Indirect Induced

LaborIncome
10,553,600
16,286,790 18,185,984
12,268,0635,070,986
4,852,409
5,401,3314,995,429
5,387,628
0
5,000,000
10,000,000
15,000,000
20,000,000
25,000,000
30,000,000
Brewery AircrahEngine RelayandIndustrialControlsDirect Indirect Induced
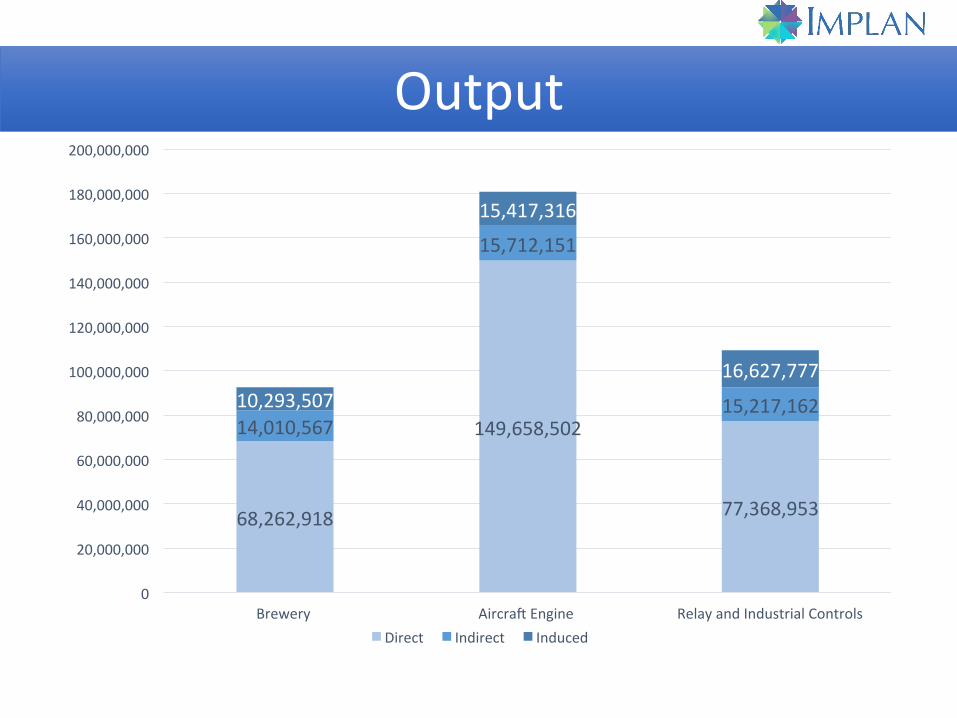
Output
68,262,918
149,658,502
77,368,953
14,010,567
15,712,151
15,217,16210,293,507
15,417,316
16,627,777
0
20,000,000
40,000,000
60,000,000
80,000,000
100,000,000
120,000,000
140,000,000
160,000,000
180,000,000
200,000,000
Brewery AircrahEngine RelayandIndustrialControlsDirect Indirect Induced

TaxImpacts
$899,286$1,459,038
$739,774
$728,240
$684,265
$949,527
$556,286
$743,312
$801,660
$0
$500,000
$1,000,000
$1,500,000
$2,000,000
$2,500,000
$3,000,000
$3,500,000
Brewery AircrahEngine RelayandIndustrialControls
Direct Indirect Induced

Brewery-KeyIndustriesImpacted:Output
Descrip<on Indirect Induced TotalWholesaletrade $2,308,450 $349,217 $2,657,666
Managementofcompaniesandenterprises $1,595,732 $48,825 $1,644,557Trucktransporta<on $1,363,556 $101,165 $1,464,721Owner-occupieddwellings $0 $1,349,289 $1,349,289Realestate $345,023 $702,027 $1,047,051Lessorsofnonfinancialintangibleassets $823,686 $30,470 $854,157Hospitals $0 $812,404 $812,404
Banking $357,344 $343,700 $701,044
Electricpowertransmissionanddistribu<on $447,746 $157,363 $605,109
BuildingMaintenance $363,376 $94,172 $457,548

Brewery-TopTenGrossInputs
Descrip<on GrossInputs OpportunityRegionalInputs
Metalcans $37,080,663 $37,056,343 $24,319
Glasscontainers 30,365,156 30,365,156 0
Managementofcompaniesandenterprises 24,350,913 15,795,146 8,555,767
Wholesaletradedistribu<onservices 20,360,737 7,892,440 12,468,296
Flour 16,827,231 16,552,766 274,465
Paperboardcontainers 16,549,067 16,141,605 407,462
Grains 10,278,448 10,099,286 179,163
Trucktransporta<onservices 8,883,071 1,422,752 7,460,319
Wetcorn 6,204,752 6,204,752 0
Allothercrops $2,878,644 $1,290,059 $1,588,585

Brewery-TopTenRegionalInputs
Descrip<on GrossInputs Opportunity RegionalInputs
Wholesaletradedistribu<onservices $20,360,737 $7,892,440 $12,468,296
Managementofcompaniesandenterprises 24,350,913 15,795,146 8,555,767
Trucktransporta<onservices 8,883,071 1,422,752 7,460,319
Banking 4,164,534 27,065 4,137,470
Electricitytransmissionanddistribu<on 3,582,662 1,426,725 2,155,937
Naturalgasdistribu<on 2,562,920 432,365 2,130,554
Malt 2,472,651 547,368 1,925,283
Railtransporta<onservices 2,555,302 658,898 1,896,405
Wastemanagementandremedia<onservices 1,871,146 137,159 1,733,987
Allothercrops $2,878,644 $1,290,059 $1,588,585

Indicator Direct Indirect Induced Total
Employment 200 89 90 379
LaborIncome $10,553,600 $12,268,063 $5,401,331 $28,222,994
Output $68,262,918 $14,010,567 $10,293,507 $92,566,992
TaxImpacts $899,286 $726,240 $556,286 $2,183,812
Brewery:ImpactSummary

KeyTakeaways• Haveadeepunderstandingofyoureconomyandhowitworks
• Interac<onsbetweenindustries• Buildaneconomicecosystem
• Understandthetruevalueofyourac<vity• Nextwaveofdevelopment

Moneyball for economic development is all about maximizing limited resources. It's about optimization, for which the key is to find the
one factor that matters most and focus on optimizing that

Key Takeaways
• Think differently about how you should view metrics for your EDO
• Learn to see the game in a whole new way
• Depend on information to predict success
• Measure what matters • Recruit the right players (i.e. your
board, partners, staff)
Intern-turned-assistant GM Peter Brand played by Jonah Hill

How the Moneyball Story Ends
• A’s finish first in the AL West • Won a record 20 straight wins • Won as many games as the Yankees (103)
– Yankees = $1.4 million per win– A’s = $260,000 per win
• Red Sox take note – Adopt the A’s moneyball philosophy and win
World Series in 2004 (first time since 1918)

Thank you! Contact information: Guillermo Mazier Atlas Advertising [email protected] 303.292.3300 x 232 Drew Varnado IMPLAN Group [email protected]

Questions?