Embed Size (px)
Citation preview

EUpDates March 2017
AAA MMMooonnnttthhhlllyyy SSStttaaatttiiissstttiiicccaaalll BBBuuulllllleeetttiiinnn
2017
SSSuuurrrgggeee RRReeessseeeaaarrrccchhh SSSuuuppppppooorrrttt
wwwwwwwww...eeecccooofffiiinnn---sssuuurrrgggeee...cccooo...iiinnn

E-UpDates March 2017 Surge Research Support
2
A Quick Review of the Economy
Although there is some improvement in economic indicators across the global economy as headwinds in commodity exporters gradually diminish, the uncertainty surrounding the speed of future monetary policy changes by major central banks could keep global economic growth contained, as the Fed continues to normalize interest rates and the ECB faces increasing inflation. Downside risks still dominate the outlook and are associated with heightened policy uncertainty, protectionist pressures, and potential financial market disruptions.
US: Most measures of business and consumer confidence have improved decidedly since the November election, which has raised hope that the economy will accelerate in 2017. Much of the rise in optimism is based on hope that tax reform, a roll back of regulations and increased infrastructure spending will spur economic growth. The for capital spending outside of the energy sector has also improved now that the nearly two-year slide in industrial activity appears to have ended. The ISM manufacturing PMI ended 2016 on a strong note, with production and the forward-looking new orders rising to their highest levels in two years. Alternative measures of core inflation in the US, including PCE inflation and the Dallas Fed’s PCE trimmed mean measures, show inflation is now very close to the Fed’s target and in a rising trend. The Fed is thus close to its dual mandate, recent evidence suggests that economic growth remains above trend, and further progress is being made towards the Fed’s goal of full employment and 2% inflation. A Fed rate hike on 15 March is now widely expected.
A gauge of globalequity price movements, the MSCI World equity index reached a High of 447.67 and a Low of 432.58 in February. Risky credit has been outperforming by far; the Bloomberg Barclays Global High Yield Index returned 19% over the past year (in end-February) while a global Treasuries index has lost 1.2% over the same period.
Though GDP growth slowed to 7% in October-December 2016-17 — the slowest in over nine quarters — it was still stronger than expected considering the impact of the government’s decision to withdraw high-value currency notes in the economy in this quarter. Some sectors such as agriculture, mining and manufacturing had performed better than expected in the period. In the third quarter of 2015-16, the economy had expanded at 7.5%. GVA growth was 6.6% in the third quarter against 7% a year ago. CSO has maintained its GDP growth forecast for the fiscal at 7.1%. The economy grew at 7.9% in 2015-16.
IIP contracted 0.4% y-o-y in December 2016 in contrast to 5.7% growth in November. Consumer durables output declined 10.3% in December, compared with a growth of 9.8 percent in the previous month mostly in line with the expected effects of demonetisation. Among important items that registered sharp declines were Three-wheelers (including passenger and goods carrier’ -43.3%) and Two-wheelers (around -25%).Capital goods were lower by 3% in December, confirming subdued investment sentiment. Manufacturing output declined by 2% as 17 out of 22 manufacturing sub-sectors reported contraction in December 2016 with office, accounting & computing machineryleading with a 23.9% contraction. Core sector output expanded at a slower pace of 3,4 % in January 2017 compared to the 5.6% growth recorded in December 2016, but faster than the pace of 2.9% recorded in January 2016.
During January, 2017 exports grew 4.32% yoy in dollar terms (US$ 22115.03 million) and 5.6% in rupee terms (Rs. 150559.98 crore). For the period April-January 2016-17 exports registered growth of 1.09% in dollar terms and 4.5% in rupee terms, over the same period last year. During January, 2017 imports grew 10.7% yoy in dollar terms (US$ 31955.94 million) and 12.1% in rupee terms (Rs. 217557.32 crore). For the period April-January 2016-17 imports declined by 5.8% in dollar terms and 2.6% in rupee terms, over the same period last year. Oil imports during January grew by 61.1% yoy to US$8140.83 million.
Annual WPI inflation for November 2016 based on the final index was 3.38%. Wholesale inflation shot up to a 30-month high of 5.25% (provisional) in January as rising global crude oil prices spiked domestic fuel cost, even as food prices moderated. The index for ‘Food Articles’ group declined by 0.56% (1.1%, m-o-m) mainly driven by lower inflation for Vegetables at -32.3% (-7%, m-o-m), pulses at 6.21%(-12%, m-o-m and compared to 45% in January 2016) and potatoes at -0.2 (-31%, m-o-m and down from 73.6% in September). The Manufactured Products (Weight 64.97%) index rose by 3.99% (0.5%, m-o-m). Inflation in the 'Fuel and Power' basket more than doubled to 18.14% in January, up from 8.65% in the previous month.
Annual CPI and CFPI inflation for December 2016 based on the final index were at 3.41% and 1.37%, respectively.
The Centre’s fiscal and revenue deficits between April and January exceeded the Budget target for 2016-17. The fiscal deficit shot up to Rs. 5,64,192 crore, amounting to 105.7% of the Budget estimate in April- January 2016-17. RBI has been progressively moving the liquidity conditions close to neutrality—— a level of liquidity adequate enough to meet demand. RBI expects surplus liquidity to decline with progressive remonetisation and the current abundant liquidity with banks is likely to persist till early 2017-18. Average daily liquidity absorbtion (net) during February was around Rs. 927 crore. Overnight rates remained below the policy repo rate. However, with rising inflation and inflation expectations and the neutral stance of RBI constant maturity yields (CMYs) of long term GSecs have hardened by 30 to 40 basis points.
Capital mobilisation in the primary market for equity during December 2016 was Rs. 4581 crore compared to Rs. 3777 crore in November. In December 2016, Rs. 59,587 crore was raised through private placement route in the corporate bond market compared to Rs. 38,645 in November. The Sensex reached a high of 290653 and a low of 27590 in February and closed the month at 28743 up from 27980 in the previous month. FPI and Mutual Fund investment in the equity and debt markets remained positive in the month.

E-UpDates March 2017 Surge Research Support
3
Contents Page
………… 3
………… 4
………… 6
………… 7
………… 9
………… 11
………… 14
………… 17
………… 20
………… 22
………… 23
………… 24
Table of Contents
1. Key Rates to Remember
2. Indian Economy — Growth Indicators
3. Indian Economy — Price Indicators
4. Indian Economy — Banking Indicators
10. Global Economy — Economic Indicators
11. Global Economy — Stock Indices
12. Global Economy — Commodity Indices
5. Indian Economy — Exchange Rates
6. Indian Economy — Interest Rates
7. Indian Economy — Stock Markets
8. Indian Economy — Capital Flows
9. Indian Economy — Commodity Markets
www.ecofin-surge.co.in

E-UpDates March 2017 Surge Research Support
4
For more click:
http://www.ecofin-surge.co.in/terminology.html
2016-17* 7.20% Dec-16 -0.40%
2015-16* 7.70% Dec-15 -0.90%
As on 28-Feb-17 29-Feb-16 As on 28-Feb-17 29-Feb-16
Repo rate 6.25% 6.75% CRR 4.00% 4.00%
Reverse repo rate 5.75% 5.75% Base rate 9.25-9.65% 9.30-9.70%
MSF rate 6.75% 7.75% CMR 4.75-6.25% 5.00-7.50%
Inflation CPI-C* CFPI-C* WPI
Jan-17 3.17% 0.53% 5.25% Feb-17 54.36
Jan-16 5.69% 6.85% -1.07% Feb-16 31.05
*Base: 2012=100 US$ per barrel
February
50.7 28-Feb-17 66.7450.3 29-Feb-16 68.62
GDP IIP
Base : 2004-05=100.
Oil Price (World Average)
Purchasing Managers Index US$/Rupee Rate
*April-December; New Series (at
2011-12 prices).
Nikkei Markit Mnfg. PMI
Nikkei Markit Services BAI
RBI Reference rate
http://www.ecofin-surge.co.in/index.html
For explanations click:

E-UpDates March 2017 Surge Research Support
5
GDP Growth Rates
(at 2011-12 prices)
Q1 Q2 Q3 Q4 FY
2016-17 7.2 7.4 7.0 7.1 (2nd AE)
2015-16 7.5 7.6 7.2 7.9 7.6 (PE)
GVA at Basic Price by Economic
Activity
1 Agriculture, forestry & fishing 16,87,064 4.4 16,16,461 0.8
2 Mining & quarrying 3,49,351 1.3 3,44,972 12.3
3 Manufacturing 20,07,564 7.7 18,63,835 10.6
4 Electricity, gas, water supply &
other utlility services
2,39,203 6.6 2,24,323 5.1
5 Construction 8,79,525 3.1 8,52,821 2.8
6 Trade, hotels, transport,
communication and services related
to broadcasting
21,33,851 7.3 19,88,512 10.7
7 Financial, real estate & professional
services
24,43,633 6.5 22,94,193 10.8
8 Public administration, defence and
Other Services
14,28,124 11.2 12,84,603 6.9
9 GVA at basic prices (1 to 8) 111,68,315 6.7 104,69,720 7.8
Estimates of Final Expenditures
on GDP
10 Private final consumption 68,25,585 7.2 (56.1) 63,66,043 7.3 (56.1)
11 Government final consumption 12,90,553 17.0 (10.6) 11,02,961 2.9 (9.7)
12 Gross fixed capital formation
(GFCF)
35,55,361 0.6 (29.2) 35,35,296 6.1 (31.1)
13 Changes in stocks (CIS) 3,08,426 17.2 (2.5) 2,63,071 7.9 (2.3)
14 Valuables 1,18,069 `-34.2 (1.0) 1,79,371 `-4.8 (1.6)
15 Exports 24,29,413 2.3 (20.0) 23,75,780 `-5.4 (20.9)
16 Less (-) Imports 24,80,531 `-1.2 (20.4) 25,10,401 `-5.9 (22.1)
17 Discrepancies (GDP less 10 to 16) 1,18,605 `(1.0) 45,407 `(0.4)
18 GDP (10 to 17) 121,65,481 7.1 (100.0) 113,57,529 7.9 (100.0)
Growth Indicators
YoY Growth
(Share in
GDP) (%)
GDP
[at Constant(2011-12) prices]
2016-17
(2nd AE)
Rs.Crore YoY Growth
(Share in
GDP) (%)
2015-16
(1st RE)
Rs.Crore
E-UpDates March 2017 Surge Research Support
6
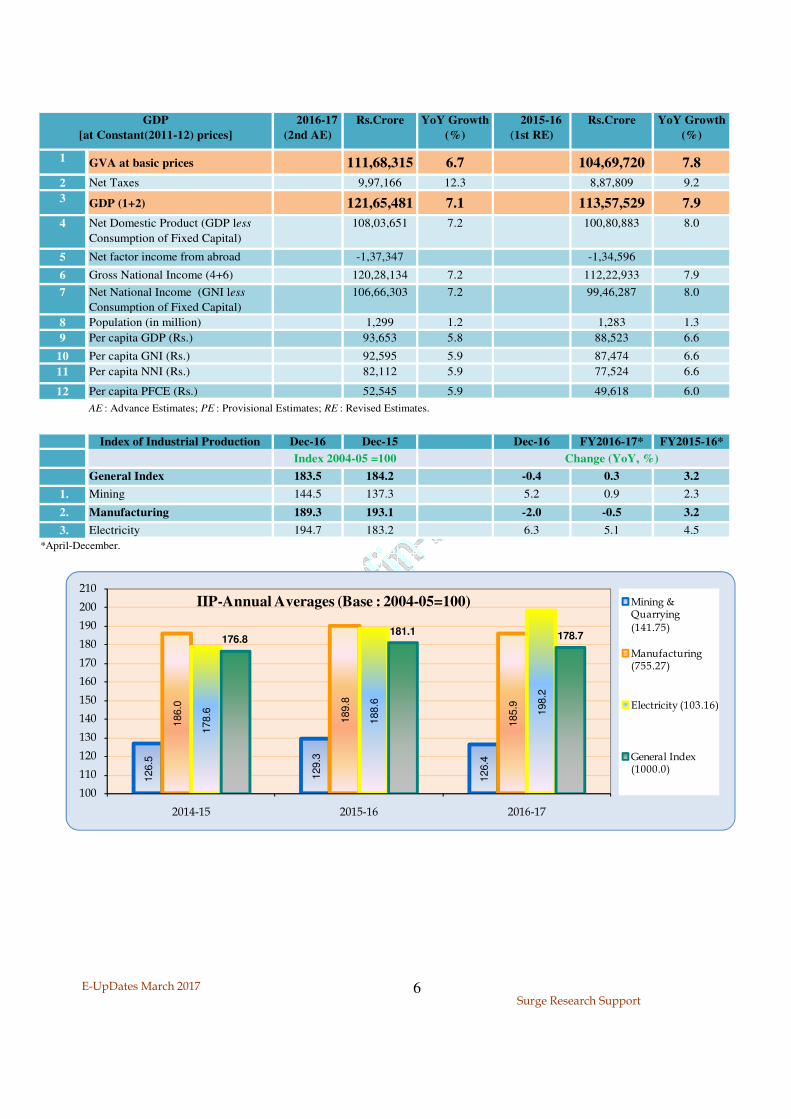
1 GVA at basic prices 111,68,315 6.7 104,69,720 7.8
2 Net Taxes 9,97,166 12.3 8,87,809 9.2
3 GDP (1+2) 121,65,481 7.1 113,57,529 7.9
4 Net Domestic Product (GDP less
Consumption of Fixed Capital)
108,03,651 7.2 100,80,883 8.0
5 Net factor income from abroad -1,37,347 -1,34,596
6 Gross National Income (4+6) 120,28,134 7.2 112,22,933 7.9
7 Net National Income (GNI less
Consumption of Fixed Capital)
106,66,303 7.2 99,46,287 8.0
8 Population (in million) 1,299 1.2 1,283 1.3
9 Per capita GDP (Rs.) 93,653 5.8 88,523 6.6
10 Per capita GNI (Rs.) 92,595 5.9 87,474 6.6
11 Per capita NNI (Rs.) 82,112 5.9 77,524 6.6
12 Per capita PFCE (Rs.) 52,545 5.9 49,618 6.0
AE : Advance Estimates; PE : Provisional Estimates; RE : Revised Estimates.
Index of Industrial Production Dec-16 Dec-15 Dec-16 FY2016-17* FY2015-16*
General Index 183.5 184.2 -0.4 0.3 3.2
1. Mining 144.5 137.3 5.2 0.9 2.3
2. Manufacturing 189.3 193.1 -2.0 -0.5 3.2
3. Electricity 194.7 183.2 6.3 5.1 4.5
*April-December.
Index 2004-05 =100 Change (YoY, %)
Rs.Crore YoY Growth
(%)
GDP
[at Constant(2011-12) prices]
2016-17
(2nd AE)
Rs.Crore YoY Growth
(%)
2015-16
(1st RE) 126.5
129.3
126.4
186.0
189.8
185.9
178.6
188.6
198.2
176.8181.1
178.7
100
110
120
130
140
150
160
170
180
190
200
210
2014-15 2015-16 2016-17
IIP-Annual Averages (Base : 2004-05=100) Mining & Quarrying
(141.75)
Manufacturing (755.27)
Electricity (103.16)
General Index (1000.0)

E-UpDates March 2017 Surge Research Support
7
Wholesale Price Index
(Base: 2004-05=100)
(Inflation %)
All
Commodities
Primary Articles Food Articles Non-food
Articles
Crude
Petroleum
Manufactured
Products
November– 2016 183.1 (3.15) 259.4 276.1 221.4 182.4 157.9
December– 2016 182.8 (3.39) 256.3 270.1 225.6 189.7 158.0
January– 2017 184.6 (5.25) 255.7 267.2 231.3 182.3 158.8
Consumer Price Index
(Inflation %)
All India
General Index
(All Groups
combined)
Base 2010=100
Rural Areas (All
Groups) Base
2010=100
Urban Areas
(All Groups)
Base 2010=100
Industrial
Workers Base
2001=100
Rural
Labourers
Base 1986-
87=100
Agricultural
Labourers
Base 1986-
87=100
November– 2016 131.2 (3.63) (F) 133.6 (4.13) (F) 128.4 (3.05) (F) 277 (2.59) 883 (3.03) 878 (2.93)
December– 2016 130.4 (3.41) (F) 132.8 (3.83) (F) 127.6 (2.90) (F) 275 (2.23) 881 (2.80) 876 (2.70)
January– 2017 130.3 (3.17) (P) 132.4 (3.36) (P) 127.8 (2.90) (P) 274 (1.86) 876 (2.58) 870 (2.47)
Price Indicators
Build up of inflation in the financial year so far is 5.31% compared to a build up of -0.40% in the corresponding period of the previous year.
F: Final; P: Provisional.
180.2
181.7
182.6
184.6
185.7
185.0
183.9
181.5
179.8
178.3
175.8
176.1
176.0
177.7
178.6
177.5
176.7
176.6
176.7
177.6
177.4
175.7
174.0
174.6
177.0179.4
182.0183.9 183.1 182.8 182.9 183.1 182.8
184.6
120
130
140
150
160
170
180
190
200
Apr May Jun Jul Aug Sep Oct Nov Dec Jan Feb Mar
WPI (Base 2004-05=100) New Series
2014-15 2015-16 2016-17
CPI Inflation –January 2017 Rural Urban Combined
Cereals & Pdcts. 4.89 6.01 5.23
Pulses & Pdcts. -1.34 -15.80 -6.62
Oils etc 3.61 3.92 3.12
Meat & Fish 3.38 2.21 2.98
Milk & Pdcts. 4.91 3.02 4.23
Vegetables -14.49 -17.63 -15.62
Food & Beverages 1.67 0.61 1.29
Fuel & Light 4.83 0.94 3.42
Clothing etc 5.58 3.28 4.71

E-UpDates March 2017 Surge Research Support
8
March 31, 2016 January 2017 February 2017
Reserve Money : 21,80,740 14,97,170 16,46,070
% change during the month 4.29 9.95
% change since March 31 (31.35) (24.52)
(A) Components of Reserve Money (1+2+3)
1 Currency in circulation 16,63,460 10,16,720 11,64,150
% change during the month 8.35 14.50
% change since March 31 (38.88) (30.02)
2 Banker's deposits with RBI 5,02,560 4,65,110 4,66,140
% change during the month (3.30) 0.22
% change since March 31 (7.45) (7.25)
3 "Other" deposits with RBI 15,080 15,340 15,770
% change during the month (5.43) 2.80
% change since March 31 1.72 4.58
(B) Sources of Reserve Money (4+5+6+7-8)
4 Net RBI credit to Government 4,25,330 2,10,250 5,45,690
% change during the month 301.85 159.54
% change since March 31 (50.57) 28.30
5 RBI credit to Banks & Commercial Sector 3,04,540 (2,47,100) (4,40,740)
% change during the month 75.30 78.37
% change since March 31 (181.14) (244.72)
5.1 RBI credit to banks(including NABARD) 2,84,450 (2,51,900) (4,45,350)
% change during the month 71.52 76.80
% change since March 31 (188.56) (256.57)
5.2 RBI credit to Commercial Sector 20,090 4,800 4,610
% change during the month (18.64) (3.96)
% change since March 31 (76.11) (77.05)
6 Net Foreign Exchange Assets of RBI 23,83,480 24,65,950 24,27,310
% change during the month 0.65 (1.57)
% change since March 31 3.46 1.84
7 Govt's Currency Liabilities to the Public 21,910 24,620 24,620
% change during the month - -
% change since March 31 12.37 12.37
8 Net Non-monetary Liabilities of RBI 9,54,170 9,56,510 9,10,810
% change during the month 0.63 (4.78)
% change since March 31 0.25 (4.54)
Note: (i) Figures in parentheses denote negative numbers.
Banking IndicatorsCOMPONENTS & SOURCES OF RESERVE MONEY AND THEIR VARIATIONS (Rs. crore)
E-UpDates March 2017 Surge Research Support
9
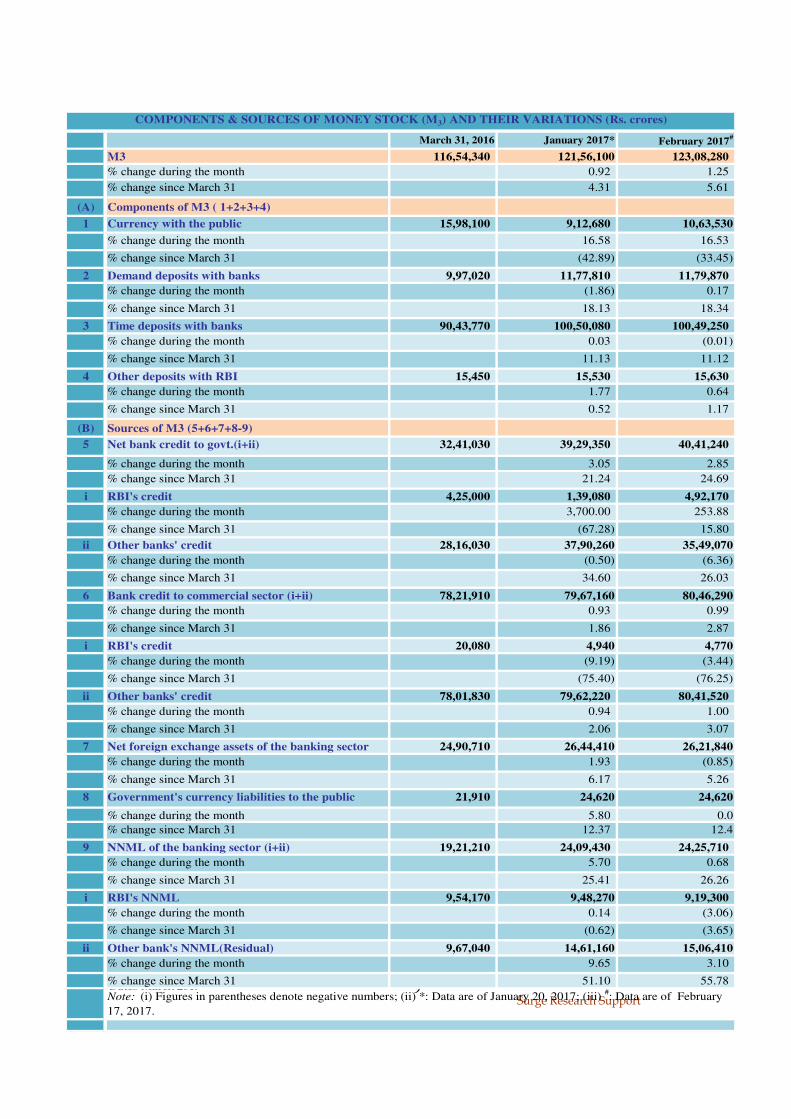
March 31, 2016 January 2017* February 2017#
M3 116,54,340 121,56,100 123,08,280
% change during the month 0.92 1.25
% change since March 31 4.31 5.61
(A) Components of M3 ( 1+2+3+4)
1 Currency with the public 15,98,100 9,12,680 10,63,530
% change during the month 16.58 16.53
% change since March 31 (42.89) (33.45)
2 Demand deposits with banks 9,97,020 11,77,810 11,79,870
% change during the month (1.86) 0.17
% change since March 31 18.13 18.34
3 Time deposits with banks 90,43,770 100,50,080 100,49,250
% change during the month 0.03 (0.01)
% change since March 31 11.13 11.12
4 Other deposits with RBI 15,450 15,530 15,630
% change during the month 1.77 0.64
% change since March 31 0.52 1.17
(B) Sources of M3 (5+6+7+8-9)
5 Net bank credit to govt.(i+ii) 32,41,030 39,29,350 40,41,240
% change during the month 3.05 2.85
% change since March 31 21.24 24.69
i RBI's credit 4,25,000 1,39,080 4,92,170
% change during the month 3,700.00 253.88
% change since March 31 (67.28) 15.80
ii Other banks' credit 28,16,030 37,90,260 35,49,070
% change during the month (0.50) (6.36)
% change since March 31 34.60 26.03
6 Bank credit to commercial sector (i+ii) 78,21,910 79,67,160 80,46,290
% change during the month 0.93 0.99
% change since March 31 1.86 2.87
i RBI's credit 20,080 4,940 4,770
% change during the month (9.19) (3.44)
% change since March 31 (75.40) (76.25)
ii Other banks' credit 78,01,830 79,62,220 80,41,520
% change during the month 0.94 1.00
% change since March 31 2.06 3.07
7 Net foreign exchange assets of the banking sector 24,90,710 26,44,410 26,21,840
% change during the month 1.93 (0.85)
% change since March 31 6.17 5.26
8 Government's currency liabilities to the public 21,910 24,620 24,620
% change during the month 5.80 0.0
% change since March 31 12.37 12.4
9 NNML of the banking sector (i+ii) 19,21,210 24,09,430 24,25,710
% change during the month 5.70 0.68
% change since March 31 25.41 26.26
i RBI's NNML 9,54,170 9,48,270 9,19,300
% change during the month 0.14 (3.06)
% change since March 31 (0.62) (3.65)
ii Other bank's NNML(Residual) 9,67,040 14,61,160 15,06,410
% change during the month 9.65 3.10
% change since March 31 51.10 55.78
COMPONENTS & SOURCES OF MONEY STOCK (M3) AND THEIR VARIATIONS (Rs. crores)
Note: (i) Figures in parentheses denote negative numbers; (ii) *: Data are of January 20, 2017; (iii) #: Data are of February
17, 2017.

E-UpDates March 2017 Surge Research Support
10
Date Day Spot 1 Month 3 Month 6 Month Spot 1 Month 3 Month 6 Month
1-Feb-17 Wed na na
2-Feb-17 Thu na na
3-Feb-17 Fri na na
6-Feb-17 Mon 67.23 67.51 68.09 68.81 72.18 72.51 73.28 74.35
7-Feb-17 Tue 67.43 67.70 68.28 69.01 71.88 72.21 72.97 74.04
8-Feb-17 Wed 67.21 67.51 68.11 68.87 71.56 71.90 72.70 73.79
9-Feb-17 Thu 66.86 67.18 67.81 68.57 71.39 71.76 72.58 73.69
10-Feb-17 Fri na na
13-Feb-17 Mon 66.90 67.19 67.82 68.58 71.20 71.55 72.36 73.47
14-Feb-17 Tue 66.95 67.21 67.82 68.62 71.12 71.43 72.22 73.36
15-Feb-17 Wed 66.92 67.18 67.78 68.58 70.64 70.95 71.73 72.87
16-Feb-17 Thu 67.09 67.37 67.96 68.75 71.30 71.63 72.40 73.54
17-Feb-17 Fri 67.02 67.31 67.91 68.70 71.34 71.68 72.45 73.59
20-Feb-17 Mon 66.94 67.23 67.83 68.63 71.08 71.41 72.19 73.33
21-Feb-17 Tue 66.94 67.24 67.84 68.64 70.56 70.90 71.68 72.82
22-Feb-17 Wed 66.99 67.28 67.91 68.70 70.35 70.70 71.50 72.63
23-Feb-17 Thu 66.84 67.15 67.75 68.55 70.51 70.86 71.65 72.79
24-Feb-17 Fri na na
27-Feb-17 Mon 66.72 67.04 67.59 68.40 70.62 70.98 71.72 72.85
28-Feb-17 Tue 66.71 67.02 67.58 68.42 70.69 71.05 71.81 72.98
Date Day Spot 1 Month 3 Month 6 Month Spot 1 Month 3 Month 6 Month
1-Feb-17 Wed na na
2-Feb-17 Thu na na
3-Feb-17 Fri na na
6-Feb-17 Mon 83.76 84.12 84.92 86.00 59.80 60.07 60.70 61.56
7-Feb-17 Tue 83.28 83.63 84.43 85.50 60.08 60.35 60.97 61.84
8-Feb-17 Wed 83.89 84.26 85.11 86.23 59.87 60.17 60.82 61.71
9-Feb-17 Thu 83.96 84.37 85.25 86.38 59.48 59.78 60.45 61.36
10-Feb-17 Fri na na
13-Feb-17 Mon 83.54 83.92 84.79 85.91 58.95 59.23 59.90 60.80
14-Feb-17 Tue 83.47 83.81 84.66 85.82 59.07 59.33 59.98 60.91
15-Feb-17 Wed 83.06 83.41 84.24 85.41 58.48 58.74 59.38 60.31
16-Feb-17 Thu 83.84 84.21 85.04 86.20 58.98 59.27 59.90 60.82
17-Feb-17 Fri 83.13 83.50 84.32 85.49 59.38 59.68 60.32 61.25
20-Feb-17 Mon 83.49 83.86 84.69 85.87 59.17 59.45 60.09 61.03
21-Feb-17 Tue 83.11 83.49 84.32 85.50 58.87 59.17 59.81 60.75
22-Feb-17 Wed 83.35 83.73 84.60 85.78 59.23 59.53 60.21 61.15
23-Feb-17 Thu 83.30 83.69 84.53 85.72 59.05 59.35 60.00 60.95
24-Feb-17 Fri na na
27-Feb-17 Mon 82.82 83.24 84.01 85.19 59.43 59.77 60.38 61.32
28-Feb-17 Tue 82.92 83.33 84.12 85.33 59.44 59.77 60.38 61.35
Exchange RatesMovement of the Rupee (INR) (Average of Buying & Selling Rates)
Dollar Euro
Pound Yen

E-UpDates March 2017 Surge Research Support
11
Euro
Date Day 1 Month 3 Month 6 Month 1 Month 3 Month 6 Month
1-Feb-17 Wed na na
2-Feb-17 Thu na na
3-Feb-17 Fri na na
6-Feb-17 Mon 5.11 5.22 4.76 5.71 6.27 6.10
7-Feb-17 Tue 4.91 5.14 4.74 5.65 6.23 6.12
8-Feb-17 Wed 5.49 5.50 5.02 5.76 6.50 6.32
9-Feb-17 Thu 5.80 5.77 5.18 6.40 6.84 6.55
10-Feb-17 Fri na na
13-Feb-17 Mon 5.42 5.62 5.10 6.15 6.68 6.48
14-Feb-17 Tue 4.85 5.30 5.05 5.36 6.36 6.40
15-Feb-17 Wed 4.86 5.27 5.04 5.40 6.32 6.41
16-Feb-17 Thu 5.13 5.29 5.01 5.70 6.35 6.38
17-Feb-17 Fri 5.32 5.39 5.06 5.78 6.37 6.41
20-Feb-17 Mon 5.32 5.43 5.11 5.63 6.39 6.43
21-Feb-17 Tue 5.51 5.49 5.14 5.94 6.50 6.51
22-Feb-17 Wed 5.32 5.61 5.19 6.05 6.70 6.57
23-Feb-17 Thu 5.62 5.53 5.17 6.12 6.60 6.57
24-Feb-17 Fri na na
27-Feb-17 Mon 5.91 5.32 5.10 6.29 6.38 6.42
28-Feb-17 Tue 5.72 5.32 5.19 6.38 6.49 6.58
Date Day 1 Month 3 Month 6 Month 1 Month 3 Month 6 Month
1-Feb-17 Wed na na
2-Feb-17 Thu na na
3-Feb-17 Fri na na
6-Feb-17 Mon 5.28 5.68 5.42 5.55 6.12 5.97
7-Feb-17 Tue 5.16 5.64 5.40 5.53 6.06 5.96
8-Feb-17 Wed 5.50 5.97 5.66 6.18 6.50 6.24
9-Feb-17 Thu 6.02 6.26 5.85 6.33 6.72 6.42
10-Feb-17 Fri na na
13-Feb-17 Mon 5.60 6.10 5.74 5.96 6.60 6.38
14-Feb-17 Tue 5.00 5.80 5.71 5.41 6.31 6.33
15-Feb-17 Wed 5.18 5.83 5.74 5.47 6.26 6.34
16-Feb-17 Thu 5.35 5.82 5.71 5.96 6.39 6.34
17-Feb-17 Fri 5.55 5.85 5.76 6.13 6.45 6.40
20-Feb-17 Mon 5.45 5.90 5.78 5.83 6.37 6.39
21-Feb-17 Tue 5.63 5.95 5.83 6.18 6.54 6.47
22-Feb-17 Wed 5.69 6.16 5.92 6.25 6.75 6.57
23-Feb-17 Thu 5.77 6.01 5.89 6.27 6.56 6.54
24-Feb-17 Fri na na
27-Feb-17 Mon 6.34 5.90 5.81 6.98 6.51 6.44
28-Feb-17 Tue 6.10 5.94 5.91 6.76 6.48 6.53
Pound Yen
Dollar
Annualised Forward Premia

E-UpDates March 2017 Surge Research Support
12
RBI
LAF
Net Injection(+)/
Absorption(-) of Liquidity
(Rs. billion)*
Repo Rates
(Repo/Reverse
Repo)
Over-
night
Rates
(%)
Call
Money**
CBLO** Mibor USD Libor
01-Feb-17 -1105.6 6.25/5.75 6.05 6.12 6.25 0.690
02-Feb-17 -1622.0 5.96 5.93 6.16 0.691
03-Feb-17 -1638.4 5.75 5.34 6.16 0.693
04-Feb-17 5.97 6.19
06-Feb-17 -1162.2 5.98 6.08 6.17 0.693
07-Feb-17 -437.5 6.09 6.19 6.22 0.688
08-Feb-17 -757.1 6.03 6.11 6.25 0.688
09-Feb-17 -480.6 6.08 6.16 6.25 0.687
10-Feb-17 -475.6 6.11 6.10 6.24 0.687
13-Feb-17 -756.2 6.09 6.13 6.18 0.688
14-Feb-17 -336.8 6.02 6.13 6.22 0.687
15-Feb-17 -907.9 5.98 6.09 6.20 0.687
16-Feb-17 -993.6 6.00 6.05 6.21 0.686
17-Feb-17 -1906.1 5.77 5.20 6.21 0.686
18-Feb-17 6.08 6.14
20-Feb-17 -1673.6 5.98 5.87 6.14 0.686
21-Feb-17 -68.9 6.14 0.686
22-Feb-17 -1746.5 5.88 5.77 6.14 0.686
23-Feb-17 -1976.1 5.92 5.79 6.10 0.683
24-Feb-17 -86.7 0.683
27-Feb-17 -201.6 5.94 5.73 0.683
28-Feb-17 -209.2 6.25/5.75 5.95 5.73 0.683
*Includes liquidity provided under MSF at 6.75%; **Weighted average rates.
Money Market Rates & Liquidity
Interest Rates
0.682
0.684
0.686
0.688
0.690
0.692
0.694
5.20
5.40
5.60
5.80
6.00
6.20
6.40
6.60
2-F
eb-1
7
4-F
eb-1
7
6-F
eb-1
7
8-F
eb-1
7
10
-Feb
-17
12
-Feb
-17
14
-Feb
-17
16
-Feb
-17
18
-Feb
-17
20
-Feb
-17
22
-Feb
-17
24
-Feb
-17
26
-Feb
-17
28
-Feb
-17
Repo ReverseRepo Call Money Mibor USD Libor

E-UpDates March 2017 Surge Research Support
13
On Developing Constant Maturity Yield Curves for India:
https://papers.ssrn.com/sol3/papers.cfm?abstract_id=300052
Date 3 months 6 months 1 year 2 Year 3 Year 4 Year 5 Year 7 Year 10 Year >10
Year &
<=15
Year
>15
Year &
<= 20
Year
>20
Year
1-Feb-17 6.16 6.15 6.38 6.46 6.65 6.86 7.04 7.10
2-Feb-17 6.16 6.15 6.27 6.37 6.42 6.59 6.55 6.84 6.81 7.03 7.12
3-Feb-17 6.10 6.14 6.32 6.41 6.52 6.63 6.86 6.85 7.00 7.17
6-Feb-17 6.10 6.13 6.22 6.37 6.42 6.57 6.58 6.87 6.87 7.03 7.17
7-Feb-17 6.10 6.13 6.38 6.43 6.56 6.69 6.91 6.90 7.00 7.16
8-Feb-17 6.12 6.16 6.20 6.37 6.52 6.58 6.57 6.76 7.06 7.01 7.06 7.19
9-Feb-17 6.22 6.29 6.26 6.62 6.70 7.00 7.24 7.31 7.30 7.39
10-Feb-17 6.24 6.26 6.45 6.61 6.69 6.90 7.00 7.24 7.33 7.45 7.42
13-Feb-17 6.23 6.26 6.25 6.49 6.59 6.68 6.88 7.03 7.28 7.33 7.44 7.46
14-Feb-17 6.22 6.51 6.62 6.70 6.93 7.00 7.36 7.39 7.49 7.50
15-Feb-17 6.19 6.43 6.26 6.48 6.62 6.69 6.95 7.06 7.28 7.34 7.47 7.55
16-Feb-17 6.18 6.27 6.26 6.60 6.68 6.95 6.99 7.28 7.34 7.46 7.54
17-Feb-17 6.18 6.23 6.48 6.60 6.68 6.91 6.99 7.31 7.32 7.41 7.54
20-Feb-17 6.18 6.21 6.25 6.61 6.70 6.92 6.98 7.30 7.34 7.47 7.48
21-Feb-17
22-Feb-17 6.15 6.24 6.23 6.62 6.73 6.98 7.05 7.36 7.37 7.49 7.57
23-Feb-17 6.09 6.20 6.23 6.50 6.61 6.73 6.99 7.12 7.33 7.43 7.50 7.57
24-Feb-17
27-Feb-17 6.14 6.24 6.20 6.45 6.60 6.70 6.93 7.07 7.34 7.39 7.50 7.57
28-Feb-17 6.00 6.20 6.59 6.70 6.94 7.11 7.35 7.40 7.50 7.54
February-2017 6.15 6.26 6.20 6.42 6.53 6.62 6.82 6.90 7.19 7.20 7.31 7.39
Constant Maturity Yields for Government Bonds—February 2017
Debt Market Yields
Constant Maturity Yields relates the yield on a security to its time to maturity. The usual practice worldwide is to
provide yields of traded bonds for finely defined residual maturity brackets. The monthly CMYs given here provide
information on (Indian government) bond yields for several chosen residual maturities, like 3 & 6 months,
1/2/5/10/12/15 years. Say, the market determined YTMs for all traded Gilts with 340 to 380 days left to mature
would give the CMY for the 1 year maturity bracket. The monthly CMYs are estimated from marketwide data. For the
estimation methodology see:

E-UpDates March 2017 Surge Research Support
14
Debt Market Yields
6.0
9 6.2
26
.29
6.3
16
.39
6.3
66
.43
6.4
06
.48
6.4
66
.52
6.4
86
.55
6.5
16
.60
6.6
46
.59 6.7
0 6.8
16
.90
6.8
16
.84
6.8
36
.69
6.9
26
.96
6.8
76
.95
7.0
47
.28
7.0
47
.07
6.8
77
.14
6.7
27
.17
7.2
57
.31
7.2
97
.22
6.9
77
.28
7.0
97
.34 7
.53
7.3
07
.36
6.8
47
.25 7
.41
7.3
17
.33 7.4
57
.48
7.4
07
.45
7.4
47
.43
7.3
57
.10
6.00
6.20
6.40
6.60
6.80
7.00
7.20
7.40
7.60
7.80
Ap
ril 2
01
7Ju
ly 2
01
7A
ug
ust
20
17
Ap
ril 2
01
8A
pri
l 20
18
Sep
tem
ber
201
8F
ebru
ary 2
01
9Ju
ne
201
9Ju
ne
201
9Ju
ly 2
01
9Ja
nuar
y 2
02
0Ja
nuar
y 2
02
0M
ay 2
02
0Ju
ne
20
20
Dec
emb
er 2
02
0A
pri
l 20
21
May
202
1N
ov
emb
er 2
02
1F
ebru
ary 2
02
2M
ay 2
02
2Ju
ne
202
2A
ug
ust
20
22
Sep
tem
ber
202
2D
ecem
ber
202
2M
ay 2
02
3N
ov
emb
er 2
02
3D
ecem
ber
202
3Ju
ne
202
4Ju
ly 2
02
4N
ov
emb
er 2
02
4M
ay 2
02
5S
epte
mb
er 2
02
5Ja
nuar
y 2
02
6Ju
ly 2
02
6S
epte
mb
er 2
02
6N
ov
emb
er 2
02
6F
ebru
ary 2
02
7S
epte
mb
er 2
02
7Ju
ne
202
8M
arch
20
29
Dec
emb
er 2
02
9M
arch
20
30
May
203
0S
epte
mb
er 2
03
0D
ecem
ber
203
0A
ug
ust
20
32
No
vem
ber
20
33
Dec
emb
er 2
03
3A
ug
ust
20
34
Dec
emb
er 2
03
4S
epte
mb
er 2
03
5Ju
ne
203
6Ju
ly 2
04
0D
ecem
ber
204
1D
ecem
ber
204
2D
ecem
ber
204
3D
ecem
ber
204
4Ju
ne
204
5O
ctob
er 2
04
6N
ov
emb
er 2
05
1
Wei
ghte
d A
ver
age
YT
Ms
Maturity Year
Yields of G-Secs Traded in February 2017
6.7
1
6.6
4
6.7
4
7.0
5
7.1
0
7.0
5
7.4
4
6.0
7
6.0
7
8.0
9
7.9
0
6.0
5
7.5
7 8.6
5
8.5
6
6.0
8
7.7
8
7.8
5
7.8
0
6.1
0
6.0
9
8.0
9
6.1
1
7.7
8
7.6
2
7.4
5
0.00
1.00
2.00
3.00
4.00
5.00
6.00
7.00
8.00
9.00
10.00
Ma
rch
20
17
Ap
ril
20
17
Oct
ob
er 2
01
7
July
20
18
July
20
20
Sep
tem
ber
20
20
Dec
emb
er 2
02
0
Jun
e 2
02
2
Feb
rua
ry 2
02
3
Jun
e 2
02
3
Oct
ob
er 2
02
4
July
20
25
Oct
ob
er 2
02
5
Dec
emb
er 2
02
5
Ma
rch
20
26
Ma
rch
20
26
Ap
ril
20
26
Ma
y 2
02
6
Ma
y 2
02
6
Jun
e 2
02
6
Ma
rch
20
27
Jun
e 2
02
7
Ma
rch
20
29
Ma
rch
20
31
Ma
y 2
03
1
July
20
31W
eig
hte
d A
ver
age
YT
Ms
Maturity Year
Yields of Benchmark Corporate Bonds (AAA) - February 2017

E-UpDates March 2017 Surge Research Support
15
Month/
Year
No of
Companies
Listed*
No. of
Securities
Traded*
Turnover
(Rs.cr)
Average
Daily
Turnover
(Rs.cr)
Market
Capitalisation
(Rs.cr)*
Month
High
Month Low Month-
Closing
P/E P/B Dividend
Yield
Nov-16 5870 2949 70178.1 3341.8 10788708.8 28029.8 25717.9 26652.8 20.57 2.71 1.47
Dec-16 5820 2978 53905.4 2450.2 10623347.1 26803.8 25753.7 26626.5 20.56 2.68 1.49
Jan-17 5795 3119 64764.2 3084.0 11256330.3 27980.4 26447.1 27656.0 21.19 2.76 1.44
Month/
Year
No of
Companies
Listed*
No. of
Securities
Traded*
Turnover
(Rs.cr)
Average
Daily
Turnover
(Rs.cr)
Market
Capitalisation
(Rs.cr)*
Month
High
Month Low Month-
Closing
P/E P/B Dividend
Yield
Nov-16 1833 1926 472856.0 22517.0 10618012.0 8669.6 7916.4 8224.5 21.99 3.13 1.34
Dec-16 1840 1939 342747.0 15579.0 10439621.0 8275.0 7893.8 8185.8 21.49 3.08 1.36
Jan-17 1847 1948 405119.0 19291.0 11047315.0 8672.7 8133.8 8561.3 22.44 3.18 1.32
*End of the Month.
No. of
contracts
Turnover
(Rs. cr.)
No. of
contracts
Turnover
(Rs. cr.)
No. of contracts Notional
Turnover
(Rs. cr.)
No. of
contracts
Notional
Turnover
(Rs. cr.)
No. of
contracts
Turnover
(Rs. cr.)
Nov-16 554 37.9 194 14.9 748 52.8 2.5
Dec-16 2 0.1 115 8.9 117 9.0 0.4
Jan-17 97 7.5 97 7.5 0.4
No. of
contracts
Turnover
(Rs. cr.)
No. of
contracts
Turnover
(Rs. cr.)
No. of contracts Notional
Turnover
(Rs. cr.)
No. of
contracts
Notional
Turnover
(Rs. cr.)
No. of
contracts
Turnover
(Rs. cr.)
Nov-16 6602274 438924.6 14435919 945534.8 106583292 7317509.6 7989482 562511.5 135610967 9264480.5 441165.7
Dec-16 5199107 338543.1 12269473 781055.3 95784703 6384802.2 6193728 420188.1 119447011 7924588.6 360208.6
Jan-17 4792429 324469.3 14512081 963574.0 92850779 6475081.5 7851266 541494.0 120006555 8304618.9 395458.0
Stock Options Total Average
Daily
Turnover
(Rs. cr.)
STOCK MARKETSEquity Market Turnover
S&P BSE Sensex (30 Scrips) (1978-79=100)BSE Equity Market
Total Average
Daily
Turnover
(Rs. cr.)
CNX Nifty (50 Scrips)(Nov.3, 1993=100)NSE Capital Market Segment
BSE Derivatives (F&O) Trades
NSE Derivatives (F&O) Segment
Month/
Year
Index Futures Stock Futures Index Options Stock Options
Derivatives Turnover
Month/
Year
Index Futures Stock Futures Index Options

E-UpDates March 2017 Surge Research Support
16
Open High Low Close Price/Earnings Price/Bookvalue Dividend Yield
01-Feb-17 27669.1 28159.5 27590.1 28141.6 21.91 2.86 1.39
02-Feb-17 28167.8 28299.9 28070.8 28226.6 21.94 2.87 1.44
03-Feb-17 28270.7 28280.6 28127.2 28240.5 21.98 2.87 1.43
06-Feb-17 28340.4 28487.3 28340.4 28439.3 22.09 2.88 1.43
07-Feb-17 28443.2 28483.4 28239.1 28335.2 21.93 2.86 1.44
08-Feb-17 28386.1 28391.6 28149.1 28289.9 21.93 2.86 1.44
09-Feb-17 28349.2 28469.5 28152.2 28329.7 22.08 2.88 1.43
10-Feb-17 28367.2 28456.2 28286.8 28334.3 22.12 2.88 1.43
13-Feb-17 28450.4 28458.8 28197.4 28351.6 22.09 2.88 1.45
14-Feb-17 28386.1 28393.4 28263.5 28339.3 21.49 2.81 1.45
15-Feb-17 28270.1 28382.3 28102.2 28155.6 21.35 2.79 1.46
16-Feb-17 28223.9 28327.8 28146.2 28301.3 21.46 2.81 1.45
17-Feb-17 28670.4 28726.3 28410.9 28468.8 21.55 2.82 1.45
20-Feb-17 28481.9 28696.5 28419.3 28661.6 21.83 2.85 1.43
21-Feb-17 28716.7 28801.0 28597.3 28761.6 21.90 2.86 1.43
22-Feb-17 28822.4 28963.5 28789.3 28864.7 21.91 2.86 1.42
23-Feb-17 28927.7 29065.3 28860.5 28893.0 22.02 2.88 1.42
27-Feb-17 28910.5 28961.8 28791.2 28812.9 21.92 2.86 1.42
28-Feb-17 28825.2 28876.5 28721.1 28743.3 21.85 2.85 1.43
Open High Low Close Price/Earnings Price/Bookvalue Dividend Yield
01-Feb-17 8570.4 8722.4 8537.5 8716.4 23.27 3.30 1.27
02-Feb-17 8724.8 8757.6 8685.8 8734.3 23.38 3.31 1.26
03-Feb-17 8735.2 8748.3 8707.8 8741.0 23.29 3.31 1.26
06-Feb-17 8785.5 8814.1 8770.2 8801.1 23.43 3.34 1.25
07-Feb-17 8805.7 8809.3 8741.1 8768.3 23.31 3.32 1.26
08-Feb-17 8774.6 8791.3 8715.0 8769.1 23.28 3.32 1.26
09-Feb-17 8795.6 8821.4 8724.1 8778.4 23.31 3.33 1.26
10-Feb-17 8812.4 8822.1 8771.2 8793.6 23.34 3.33 1.26
13-Feb-17 8819.8 8826.9 8754.2 8805.1 23.15 3.34 1.25
14-Feb-17 8819.9 8820.5 8772.5 8792.3 23.05 3.33 1.26
15-Feb-17 8779.0 8807.9 8712.9 8724.7 22.84 3.31 1.27
16-Feb-17 8739.0 8784.0 8719.6 8778.0 23.08 3.33 1.26
17-Feb-17 8883.7 8896.5 8804.3 8821.7 23.10 3.34 1.25
20-Feb-17 8818.6 8886.3 8809.8 8879.2 23.19 3.37 1.24
21-Feb-17 8890.8 8920.8 8861.0 8907.9 23.27 3.38 1.24
22-Feb-17 8931.6 8960.8 8905.3 8926.9 23.32 3.38 1.24
23-Feb-17 8956.4 8982.2 8927.6 8939.5 23.36 3.39 1.24
27-Feb-17 8943.7 8951.8 8888.7 8896.7 23.21 3.37 1.25
28-Feb-17 8899.0 8914.8 8867.6 8879.6 23.13 3.37 1.25
Index MovementsBSE: S&P BSE Sensex (30 Scrips) (1978-79=100)
NSE: Nifty (50 Scrips) (Nov.3, 1993=100)

E-UpDates March 2017 Surge Research Support
17
8500
8550
8600
8650
8700
8750
8800
8850
8900
8950
9000
27500
27700
27900
28100
28300
28500
28700
28900
29100
01-F
eb-1
7
02-F
eb-1
7
03-F
eb-1
7
06-F
eb-1
7
07-F
eb-1
7
08-F
eb-1
7
09-F
eb-1
7
10-F
eb-1
7
13-F
eb-1
7
14-F
eb-1
7
15-F
eb-1
7
16-F
eb-1
7
17-F
eb-1
7
20-F
eb-1
7
21-F
eb-1
7
22-F
eb-1
7
23-F
eb-1
7
27-F
eb-1
7
28-F
eb-1
7
Sensex High Low
Nifty High Low
FUTIDX-NIFTY Futures
(Expiry 23 February '17)
Open High Low Close No. of Contracts Turnover ('00,000) Change in OI
01-Feb-17 8600.2 8747.5 8555.0 8737.9 256338 1662725 1413600
02-Feb-17 8730.0 8773.8 8697.3 8744.0 137422 899984 798075
03-Feb-17 8745.0 8763.9 8725.3 8754.4 90734 595125 -172800
06-Feb-17 8808.0 8834.4 8781.8 8816.6 110169 728035 368325
07-Feb-17 8800.5 8811.9 8758.7 8785.6 85012 560426 -285900
08-Feb-17 8785.6 8814.0 8732.5 8796.4 116252 765413 199800
09-Feb-17 8816.3 8843.8 8733.0 8796.9 155576 1024704 -7275
10-Feb-17 8829.9 8839.9 8786.6 8809.4 87575 578911 -75525
13-Feb-17 8836.7 8846.0 8765.5 8815.4 118500 782547 632850
14-Feb-17 8824.0 8830.0 8786.1 8814.9 89528 591556 1032675
15-Feb-17 8826.1 8827.2 8727.0 8743.1 171595 1128252 1740075
16-Feb-17 8760.0 8796.2 8734.0 8787.6 103632 681850 -471000
17-Feb-17 8869.8 8872.5 8800.1 8827.0 137805 913002 -366375
20-Feb-17 8828.2 8881.3 8810.0 8873.9 115075 763959 -2559000
21-Feb-17 8880.1 8924.5 8858.9 8910.4 174589 1163092 -5422200
22-Feb-17 8919.0 8957.6 8901.6 8920.1 155133 1038633 -2831325
23-Feb-17 8934.3 8982.9 8926.0 8942.2 185747 1247661 -5231100

E-UpDates March 2017 Surge Research Support
18
Capital Flows
Equity Gross
Purchases (Rs
Crores)
Gross Sales
(Rs Crores)
Net Investment
(Rs Crores)
01-Feb-17 1969.5 1018.0 951.5
02-Feb-17 1897.9 1938.6 -40.7
03-Feb-17 1525.8 1330.7 195.2
06-Feb-17 1534.6 1402.9 131.7
07-Feb-17 1555.6 1843.2 -287.6
08-Feb-17 1323.2 1208.2 115.0
09-Feb-17 1396.0 1407.5 -11.5
10-Feb-17 1405.1 1539.9 -134.8
13-Feb-17 1295.1 1385.9 -90.8
14-Feb-17 1222.5 1103.9 118.6
15-Feb-17 1694.0 1194.8 499.2
16-Feb-17 1924.9 1094.2 830.7
17-Feb-17 2313.9 7580.3 -5266.4
20-Feb-17 1799.2 929.0 870.1
21-Feb-17 2252.5 1043.1 1209.4
22-Feb-17 2506.9 1619.5 887.4
23-Feb-17 3827.7 3858.4 -30.7
27-Feb-17 2847.9 1939.7 908.2
28-Feb-17 3181.0 1995.8 1185.2
Total for February 37473.3 35433.6 2039.7
Debt Gross
Purchases (Rs
Crores)
Gross Sales
(Rs Crores)
Net Investment
(Rs Crores)
01-Feb-17 5779.8 721.0 5058.9
02-Feb-17 6914.8 5045.5 1869.3
03-Feb-17 10398.7 7789.6 2609.1
06-Feb-17 9153.2 7173.5 1979.8
07-Feb-17 7892.7 6021.5 1871.3
08-Feb-17 5895.5 4761.4 1134.0
09-Feb-17 4054.8 5566.4 -1511.6
10-Feb-17 4110.0 4606.0 -496.0
13-Feb-17 5169.9 4556.0 614.0
14-Feb-17 5281.9 4663.7 618.1
15-Feb-17 5194.2 3494.4 1699.8
16-Feb-17 6557.2 4832.5 1724.6
17-Feb-17 6080.0 3469.6 2610.5
20-Feb-17 7057.2 2295.3 4761.9
21-Feb-17 36.2 7.9 28.2
22-Feb-17 6032.9 5080.0 952.9
23-Feb-17 6966.1 2285.4 4680.7
27-Feb-17 8515.6 2338.7 6176.9
28-Feb-17 7963.8 5516.5 2447.3
Total for February 119054.5 80224.9 38829.7
Mutual Funds Investment Trends

E-UpDates March 2017 Surge Research Support
19
Mutual Funds' Asset
Position (Rs. Crore)
April 2016 to February 2017Private Sector
Mutual Funds
Public Sector
Mutual Funds (of which) UTI Total
14,80,637.7 3,08,409.3 1,32,123.3 1,789,047.02
82.76% 17.24% 7.39% 100.00%Cumulative Position of Net Assets as on
February 28, 2017
156,22,824.9
Net Inflow/ Outflow (-ve) of funds
Mobilisation of Funds 12,620,100.24 30,02,724.6 14,25,437.7
26,038.85 397,931.84 325,415.08 72,516.76
ECB (& FCCB) Dec-16 Jan-17
Automatic Route 7078,62,766 1,376,996,302
Approval Route 1,777,750,000 4269,62,195
Total ECB 2,485,612,766 1,803,958,497
Value in US$.
01-Feb-17 1065.99 882.29 183.7 27.09
02-Feb-17 1230.55 416.34 814.21 120.37
03-Feb-17 1271.68 1171.65 100.03 14.83
06-Feb-17 729.92 537.85 192.07 28.51
07-Feb-17 3388.81 1077.49 2311.32 343.96
08-Feb-17 2010.85 1302.64 708.21 105.12
09-Feb-17 1560.8 2235.08 -674.28 -100.19
10-Feb-17 1168.22 1064.31 103.91 15.51
13-Feb-17 1849.38 1134.09 715.29 106.86
14-Feb-17 990.26 221.52 768.74 114.79
15-Feb-17 1908.56 841.88 1066.68 159.34
16-Feb-17 1060.08 814.33 245.75 36.72
17-Feb-17 337.65 314.11 23.54 3.51
20-Feb-17 487.71 437.32 50.39 7.52
21-Feb-17
22-Feb-17 433 391.68 41.32 6.17
23-Feb-17 334.75 1707.06 -1372.31 -204.93
27-Feb-17 696.74 674.06 22.68 3.39
28-Feb-17 1014.89 355.89 659 98.76
Total for February 21539.84 15579.59 5960.25 887.33
Total for 2017 39680.81 36039.75 3641.06 547.92
Debt Gross
Purchases
(Rs Crores)
Gross Sales
(Rs Crores)Net Investment
(Rs Crores)
Net
Investment
US$ million
FPI Investments in Primary & Secondary Markets

E-UpDates March 2017 Surge Research Support
20
01-Feb-17 5542.5 5091.4 451.1 66.5
02-Feb-17 5476.4 5401.6 74.8 11.1
03-Feb-17 5913.2 5193.2 720.0 106.7
06-Feb-17 5376.2 4772.4 603.8 89.6
07-Feb-17 4126.8 4569.2 -442.4 -65.8
08-Feb-17 4393.7 4123.4 270.3 40.1
09-Feb-17 4468.4 4656.7 -188.3 -28.0
10-Feb-17 4964.4 4365.3 599.1 89.4
13-Feb-17 4952.8 4397.5 555.3 83.0
14-Feb-17 3893.4 3575.5 317.9 47.5
15-Feb-17 4397.9 4414.3 -16.4 -2.5
16-Feb-17 5551.1 5297.5 253.6 37.9
17-Feb-17 5085.2 5281.6 -196.4 -29.4
20-Feb-17 13274.7 5215.4 8059.3 1202.0
21-Feb-17
22-Feb-17 7039.6 8993.2 -1953.6 -291.7
23-Feb-17 6454.7 6203.1 251.6 37.6
27-Feb-17 9747.8 9059.8 688.0 103.0
28-Feb-17 5185.7 5331.0 -145.3 -21.8
Total for February 105844.3 95942.1 9902.2 1475.3
Total for 2017 185102.7 176377.1 8725.6 1302.4
Equity Gross
Purchases (Rs
Crores)
Gross Sales
(Rs Crores)Net Investment
(Rs Crores)
Net
Investment
US$ Million
-700-500-300-10010030050070090011001300
1-Feb-17
8-Feb-17
15-Feb-17
22-Feb-17
8059.29
-1953.62-5266.4
Net Flows (Rs.Cr.)
FPI Equity
MF Equity
Foreign Investment 2015-16* 2016-17* Nov-16 Dec-16
Foreign Investment Inflows 33,523.0 33,599.0 5,438.0 4,260.0
Net Direct Investments 27,225.0 31,186.0 4,512.0 3,081.0
Net Portfolio Inflows –2,592 –3,178 –5,481 –4,034
*April-December; US$ million.

E-UpDates March 2017 Surge Research Support
21
Turnover
(Rs. Crore)
Corporate
Bonds-NSE
Corporate
Bonds-BSE
Currency
Derivatives -
NSE
Currency
Derivatives-
BSE
Interest rate
Derivatives-
NSE
Interest rate
Derivatives-
BSE
Commodity
Dervatives-
MCX
Commodity
Dervatives-
NCDEX
Nov-16 1,12,682 25,784 5,54,009 3,02,327 32,610 11,781 5,51,238 31,645
Dec-16 1,09,145 31,071 4,38,729 2,56,606 35,695 11,793 3,82,469 22,140
Date Futures Spot Futures Spot Futures Spot Futures Spot Futures Spot01-Feb-17 3809.0 3905.0 1755.0 2081.5 693.1 706.7 3639.0 3581.0 28682.0 29030.0
02-Feb-17 3847.0 3918.2 1759.0 2058.4 691.1 710.8 3668.0 3645.0 28850.0 29207.0
03-Feb-17 3900.0 3917.2 1739.0 2050.0 689.2 709.9 3667.0 3611.0 28909.0 28977.0
06-Feb-17 3931.0 3966.7 1711.0 2050.0 689.4 707.8 3633.0 3627.0 29193.0 29092.0
07-Feb-17 3904.0 3968.4 1715.0 2042.4 689.2 708.9 3556.0 3562.0 29332.0 29305.0
08-Feb-17 3907.0 3968.2 1726.0 2029.2 694.3 709.1 3566.0 3515.0 29330.0 29376.0
09-Feb-17 3892.0 3953.9 1729.0 2000.0 695.4 709.5 3590.0 3523.0 29089.0 29366.0
10-Feb-17 3901.0 3960.0 1721.0 1958.1 693.0 705.3 3648.0 3552.0 29173.0 29015.0
13-Feb-17 3892.0 3980.0 1723.0 1950.0 684.8 700.0 3591.0 3605.0 29021.0 29164.0
14-Feb-17 3850.0 3963.8 1718.0 1947.5 678.0 693.2 3612.0 3545.0 29001.0 29112.0
15-Feb-17 3852.0 3951.5 1726.0 1946.7 680.2 690.8 3596.0 3561.0 29143.0 29042.0
16-Feb-17 3872.0 3949.0 1725.0 1919.6 670.6 683.6 3624.0 3554.0 29416.0 29341.0
17-Feb-17 3939.0 3956.3 1730.0 1901.3 664.8 680.0 3604.0 3572.0 29360.0 29412.0
20-Feb-17 3894.0 3975.5 1728.0 1900.0 659.4 669.8 3623.0 3580.0 29303.0 29289.0
21-Feb-17 3876.0 1701.0 1900.0 656.0 667.5 3668.0 3580.0 29301.0 29171.0
22-Feb-17 3826.0 3971.7 1698.0 1906.4 654.8 665.0 3601.0 3639.0 29208.0 29309.0
23-Feb-17 3807.0 3967.8 1692.0 1903.4 652.1 662.0 3633.0 3589.0 29451.0 29300.0
24-Feb-17 3818.0 1692.0 655.7 3615.0 3639.0 29623.0
27-Feb-17 3815.0 3971.7 1679.0 1902.5 654.3 664.5 3623.0 3608.0 29710.0 29661.0
28-Feb-17 3837.0 3970.6 1662.0 1900.0 675.4 666.6 3566.0 3606.0 29566.0 29591.0
*National Commodity & Derivatives Exchange Ltd. **Multi Commodity Exchange of India. Futures: March & Gold: April contracts.
(100 Kgs) (100 Kgs) (10 Kgs) (1 Bbl.) (10 Grams)
Commodity Futures & Spot Prices
Sugar* Wheat* Refined Soya Oil* Energy: Crude Oil** Bullion: Gold**
Commodity Futures & Spot Markets

E-UpDates March 2017 Surge Research Support
22
MCXCOMDEX MCXAGRI MCXMETAL MCXENERGY NCDEX-Dhaanya
01-Feb-17 3390.36 2695.53 4792.46 2674.70 3096.87
02-Feb-17 3399.86 2707.73 4788.76 2697.00 3088.62
03-Feb-17 3380.96 2706.92 4754.59 2682.44 3079.63
06-Feb-17 3391.79 2702.54 4806.09 2661.29 3056.28
07-Feb-17 3378.56 2712.73 4808.72 2619.18 3055.94
08-Feb-17 3390.33 2718.36 4829.14 2626.53 3059.95
09-Feb-17 3373.72 2715.87 4775.44 2638.28 3061.48
10-Feb-17 3424.82 2712.62 4878.17 2670.05 3043.91
13-Feb-17 3408.07 2715.79 4877.38 2625.72 3020.95
14-Feb-17 3399.84 2696.88 4856.86 2634.28 3007.43
15-Feb-17 3403.42 2701.51 4870.43 2627.71 3030.12
16-Feb-17 3414.55 2685.86 4893.69 2641.20 3022.84
17-Feb-17 3394.72 2663.03 4869.67 2625.08 3026.44
20-Feb-17 3409.63 2653.57 4904.11 2634.15 3011.34
21-Feb-17 3403.55 2642.16 4876.94 2651.20 2998.85
22-Feb-17 3388.61 2651.00 4867.68 2617.21 3007.93
23-Feb-17 3375.12 2634.00 4817.24 2641.07 3012.52
24-Feb-17 3404.62 2656.72 4884.20 2639.45 3014.07
27-Feb-17 3407.89 2642.94 4901.85 2637.19 3009.96
28-Feb-17 3403.20 2673.84 4894.98 2616.43 3046.10
Multi Commodity Exchange of India and National Commodity & Derivatives Exchange Ltd: Index Close
Commodity Futures Indices
2500.0
2700.0
2900.0
3100.0
3300.0
3500.0
3700.0
3900.0
4100.0
4300.0
4500.0
4700.0
4900.0
2-F
eb
4-F
eb
6-F
eb
8-F
eb
10
-Feb
12
-Feb
14
-Feb
16
-Feb
18
-Feb
20
-Feb
22
-Feb
24
-Feb
26
-Feb
28
-Feb
MCXCOMDEX MCXMETAL MCXENERGY
MCXAGRI NCDEX-Dhaanya

E-UpDates March 2017 Surge Research Support
23
http://www.ecofin-surge.co.in/
Stock
Market
Country Risk
Indicator/
Country
(per US$)
Q4 January
USA 1.9 Jan 0.0 2.5 3.0 1.06 2.34 Dec -750.1 119.2 7.0 AA+/Stable
Canada Q3/1.3 Nov 1.5 2.1 2.3 0.88 1.69 1.34 Dec -19.9 84.8 2.5 AAA/Stable
UK 2.0 Dec 4.3 1.8 3.5 0.34 1.13 0.81 Dec -182.3 142.6 3.0 AA/-ve
Euro area 1.7 Dec 2.0 1.8 3.5 -0.33 0.28 0.95 Dec 295.4 342.4 3.1 (EU)AA/Stable
Germany 1.8 Dec -0.6 1.9 2.4 -0.33 0.28 0.95 Dec 279.8 177.2 5.2 AAA/Stable
France 1.2 Dec 1.3 1.3 3.3 -0.33 1.00 0.95 Dec -54.0 2.1 AA/Stable
Italy 1.1 Dec 6.6 1.0 2.5 -0.33 2.12 0.95 Dec 57.1 0.8 BBB-/Stable
Spain 3.0 Dec -1.6 3.0 7.6 -0.33 1.76 0.95 Dec -20.7 4.4 BBB+/Stable
Russia -0.4 Jan 2.3 5.0 12.7 11.3 8.25 58.4 Dec 90.4 390.6 -3.7 BB+/Stable
Japan 1.7 Jan 3.2 0.4 0.5 -0.01 0.10 114.00 Dec 47.8 1231.6 4.0 A+/ Stable
China 6.8 Dec 6.0 2.1 6.9 4.29 2.96 6.88 Jan 505.3 2998.2 5.7 AA-/-ve
Hong Kong 3.1 Q3 -0.1 1.3 0.94 1.85 7.76 Jan -53.8 391.5 7.9 AAA/-ve
Malaysia 4.5 Dec 4.8 3.2 3.49 4.12 4.45 Dec 21.1 95.0 4.3 A-/Stable
Singapore 2.9 Jan 2.2 0.6 .. 2.35 1.41 Jan 44.6 252.7 11.1 AAA/Stable
South Korea 2.3 Jan 1.7 2.0 3.7 1.41 2.16 1131.00 Feb 87.6 374.0 10.2 AA/Stable
Taiwan 2.9 Jan 2.8 2.2 0.66 1.13 30.8 Jan 15.9 436.6 9.6 AA-/Stable
Thailand 3.0 Jan 1.3 1.6 1.33 2.67 35.0 Jan 21.2 179.2 4.0 BBB+/Stable
Brazil Q3/-2.9 Dec 0.0 5.4 11.7 10.0 3.12 Jan 49.5 367.7 16.1 BB/-ve
Chile Q3/1.6 Jan -0.9 2.8 0.56 4.16 650.00 Jan 4.4 39.9 9.4 AA-/ -ve
Mexico 2.4 Dec -0.6 4.7 6.61 7.42 19.90 Jan -13.1 175.0 7.4 BBB+/-ve
South Africa Q3/0.7 Dec -0.8 6.6 5.9 7.33 8.79 13.00 Jan 0.5 46.7 7.0 BBB-/-ve
India 7.0 Dec -0.4 3.2 5.3 6.05 6.93 66.8 Jan -97.5 361.6 10.6 BBB-/Stable
Note: Trade balance for last 12 months. FX Reserves at end of period.
*Per cent change of the major index in US$ terms between December 30, 2016 and March 1, 2017. **Foreign Currency Ratings by S&P.
Global Economic Indicators
January 01-Mar
GDP Short-
term
Rate
Long-
term
Rate
Exchange
Rate
Trade BalanceIIP CPI PPI Share
Price
Growth*
Sovereign
Rating**
(% change on year ago) (%) (US$ bn.)
FX
Reserves
Economic & Financial Market Indicators for Major Global Economies
Growth Inflation Interest Rates External Sector
For more Countrywise Indicators and Updates visit:
3.2 3.1
3.4 3.6
2.8 2.9
3.3 3.3
2.7
1.9
3.84.1
1.8
2.3
2.8
3.3
3.8
2015 2016 2017 2018
World Output, Inflation & Trade (% change, IMF, WEO Database & Updates)
GDP Inflation Trade

E-UpDates March 2017 Surge Research Support
24
S&P BSE
Sensex
(India)
DJI (US) S&P
500(US)
FTSE
100(UK)
FTSE 100
(Europe)
NIKKEI 225
(Japan)
HSI
(HongKong)
IPC
(Mexico)
BOVESPA
(Brazil)
01-Feb-17 28,141.64 19,890.94 2,279.55 7,107.65 2,817.65 19,148.08 23,318.39 47,009.51 64,836.00
02-Feb-17 28,226.61 19,884.91 2,280.85 7,140.75 2,802.83 18,914.58 23,184.52 47,095.07 64,578.00
03-Feb-17 28,240.52 20,071.46 2,297.42 7,188.30 2,820.53 18,918.20 23,129.21 47,225.10 64,954.00
06-Feb-17 28,439.28 20,052.42 2,292.56 7,172.15 2,804.31 18,976.71 23,348.24 63,993.00
07-Feb-17 28,335.16 20,090.29 2,293.08 7,186.22 2,811.34 18,910.78 23,331.57 46,728.95 64,199.00
08-Feb-17 28,289.92 20,054.34 2,294.67 7,188.82 2,814.28 19,007.60 23,485.13 46,921.71 64,835.00
09-Feb-17 28,329.70 20,172.40 2,307.87 7,229.50 2,842.52 18,907.67 23,525.14 47,232.17 64,965.00
10-Feb-17 28,334.25 20,269.37 2,316.10 7,258.75 2,844.17 19,378.93 23,574.98 47,797.04 66,125.00
13-Feb-17 28,351.62 20,412.16 2,328.25 7,278.92 2,865.49 19,459.15 23,710.98 47,661.69 66,968.00
14-Feb-17 28,339.31 20,504.41 2,337.58 7,268.56 2,863.79 19,238.98 23,703.01 47,391.24 66,713.00
15-Feb-17 28,155.56 20,611.86 2,349.25 7,302.41 2,877.59 19,437.98 23,994.87 47,161.74 67,976.00
16-Feb-17 28,301.27 20,619.77 2,347.22 7,277.92 2,865.92 19,347.53 24,107.70 47,293.85 67,814.00
17-Feb-17 28,468.75 20,624.05 2,351.16 7,299.96 2,872.44 19,234.62 24,033.74 47,164.71 67,748.00
20-Feb-17 28,661.58 7,299.86 2,874.96 19,251.08 24,146.08 47,083.81 68,533.00
21-Feb-17 28,761.59 20,743.00 2,365.38 7,274.83 2,893.83 19,381.44 23,963.63 47,614.99 69,052.00
22-Feb-17 28,864.71 20,775.60 2,362.82 7,302.25 2,898.07 19,379.87 24,201.96 47,195.68 68,590.00
23-Feb-17 28,892.97 20,810.32 2,363.81 7,271.37 2,893.23 19,371.46 24,114.86 47,206.36 67,461.00
24-Feb-17 20,821.76 2,367.34 7,243.70 2,871.18 19,283.54 23,965.70 47,047.67 66,662.00
27-Feb-17 28,812.88 20,837.44 2,369.73 7,253.00 2,865.55 19,107.47 23,925.05 47,349.20
28-Feb-17 28,743.32 20,812.24 2,363.64 7,263.44 2,869.82 19,118.99 23,740.73 46,856.79
Closing Values
International Stock Index Movements vs S&P BSE Sensex February-2017, with 1st Feb=100)
Global Stock Indices
Selected Indian & International Stock Indices
DJI (US) S&P 500 (US)FTSE 100(UK) FTSE 100 (Europe)
NIKKEI 225 (Japan)
HSI (HongKong) IPC (Mexico) BOVESPA (Brazil)

E-UpDates March 2017 Surge Research Support
25
Units Descriptor Dec-15 Jan-16 Feb-16 Dec-16 Jan-17 Feb-17
Index Number Fuel and Non-Fuel 90.83 83.20 83.98 114.31 116.98 118.71
Index Number Non-Fuel 121.94 121.80 121.44 138.71 143.23 145.53
Index Number Food 132.12 134.10 135.12 145.34 152.31 151.85
Index Number Agricultural Raw Materials 110.49 110.80 100.74 117.51 119.66 122.25
Index Number Industrial Inputs 107.66 106.93 105.55 130.99 133.34 138.76
Index Number Metals 105.62 104.13 109.03 140.72 143.21 150.68
Index Number Energy 72.64 60.61 62.07 100.04 101.62 103.02
Index Number Crude Oil 68.60 56.05 58.32 98.89 100.85 102.22
USD per Barrel Crude Oil, Brent 37.72 30.80 33.20 54.07 54.89 55.49
USD per Barrel Crude Oil Dubai Fateh 34.70 27.25 29.61 51.76 53.43 54.17
USD per Barrel Crude Oil WTI 36.56 29.92 31.05 52.61 53.63 54.36
USD per Million Metric British
Thermal UnitNatural Gas, H H, Louisiana 1.92 2.27 1.96 3.58 3.26 2.82
USD per Metric Ton Coal, Australian Thermal 55.85 53.37 54.33 92.49 89.71 86.31
USD per Metric Ton Aluminum 1497.20 1481.10 1531.26 1727.74 1791.24 1860.75
USD per Metric Ton Copper 4638.83 4471.79 4598.62 5660.35 5754.56 5940.91
USD per Metric Ton Zinc 1527.79 1520.36 1709.85 2664.81 2714.80 2845.55
US Cents per Metric Ton Iron Ore 40.88 42.20 46.49 79.43 80.82 88.80
US cents per Pound Rubber 56.59 55.33 57.04 101.01 115.90 122.99
US cents per Pound Cotton 70.39 68.75 66.57 79.50 82.33 85.16
USD per Metric Ton Palm oil 520.60 531.62 595.90 711.76 726.49 706.79
USD per Metric Ton Sunflower Oil 1022.14 1020.14 1039.58 1012.25 980.86 966.97
USD per Metric Ton Soybean Oil 677.20 659.90 686.90 800.26 771.88 742.92
USD per Metric Ton Soybeans 323.32 323.20 320.13 375.29 379.59 380.87
US cents per Pound Sugar, European 24.93 23.95 23.77 20.79 20.53 20.76
US cents per Pound Sugar, Free Market 14.76 14.36 14.01 18.83 20.54 20.35
US cents per Pound Sugar, U.S. 25.60 25.52 25.46 29.29 29.01 30.40
US cents per Kg. Tea 343.49 319.83 287.26 336.66 368.73 382.87
US cents per Pound Coffee, Arabicas 149.52 146.32 148.94 162.16 167.83 165.56
USD per Metric Ton Rice, Bangkok 354.35 359.48 373.19 367.55 372.55 368.10
USD per Metric Ton Wheat, US 163.79 164.56 159.25 122.80 137.09 147.31
*Base 2005=100
Primary Commodity Indices*/ Prices
Global Commodity Prices
0 50 100 150 200
2015
2016
2017
2018
Observed & Projected Price Movements, IMF WEO Database Fuel and Non-Fuel Price Indices
Food Price Index includes Cereal, Vegetable
Oils, Meat, Seafood, Sugar, Bananas, and Oranges Industrial Inputs Price Index includes
Agricultural Raw Materials and Metals
Agricultural Raw Materials Index includes
Timber, Cotton, Wool, Rubber, and Hides PriceCrude Oil Index(Petroleum), Brent, West
Texas Intermediate, and the Dubai Fateh
Metals Price Index, Copper, Aluminum, Iron
Ore, Tin, Nickel, Zinc, Lead, and Uranium Price Indices

E-UpDates March 2017 Surge Research Support
26
E-UpDates Subscription (Renewal) form
One year subscription: Rs. 3600.00 Back issue: Rs. 150.00 (per issue)
SUBSCRIBER INFORMATION
(Please complete the form clearly to receive information and offerings from Ecofin-Surge) Subscription for……………………………. Subscription Number……………..………… (New subscription or Renewal or Back issue) (for renewal) Issues from……………………………………………….. to ………………………………………………. (please specify for Back issues) Name ……………………………………………………………………………………… Organization ……………………………………………………………………………… Address1…………………………………………………………………………………... Address2…………………………………………………………………………………... City…………………………………………….. State …………………………………… Pin……………………..Phone………………….…… Email…………………………….
PAYMENT INFORMATION
Cheque (in favour of SURGE RESEARCH SUPPORT) Cheque Number …………………. Bank ………..…………………….. Date………………………….. Amount…………… OR Bank Transfer (made payable to SURGE RESEARCH SUPPORT) Bank Name: Axis Bank Branch: Rashbehari Avenue, Kolkata A/C Number: 911020021891851 IFS Code: UTIB0000253 Date………………………….. Amount…………… Please complete this page and mail (/email) it to: Sakuntala Sarkar For: Surge Research Support 772, R.N. Tagore Road Kolkata 700 077 West Bengal, INDIA Email: [email protected]
E-UpDates March 2017
EUpDatesMarch 2017
A Monthly Statistical Bulletin
2017
Surge Resear
27
EUpDates March 2017
A Monthly Statistical Bulletin
To subscribe visit
www.ecofin-surge.co.in/kiosk.html
or email
Rs. 3600.00 (12 Issues)
Surge Rese
www.ecofin
Surge Research Support
Surge Research Support
www.ecofin-surge.co.in
3/12/2017