Embed Size (px)
DESCRIPTION
Citation preview
DERIVATIVES
DERIVATIVESDERIVATIVES
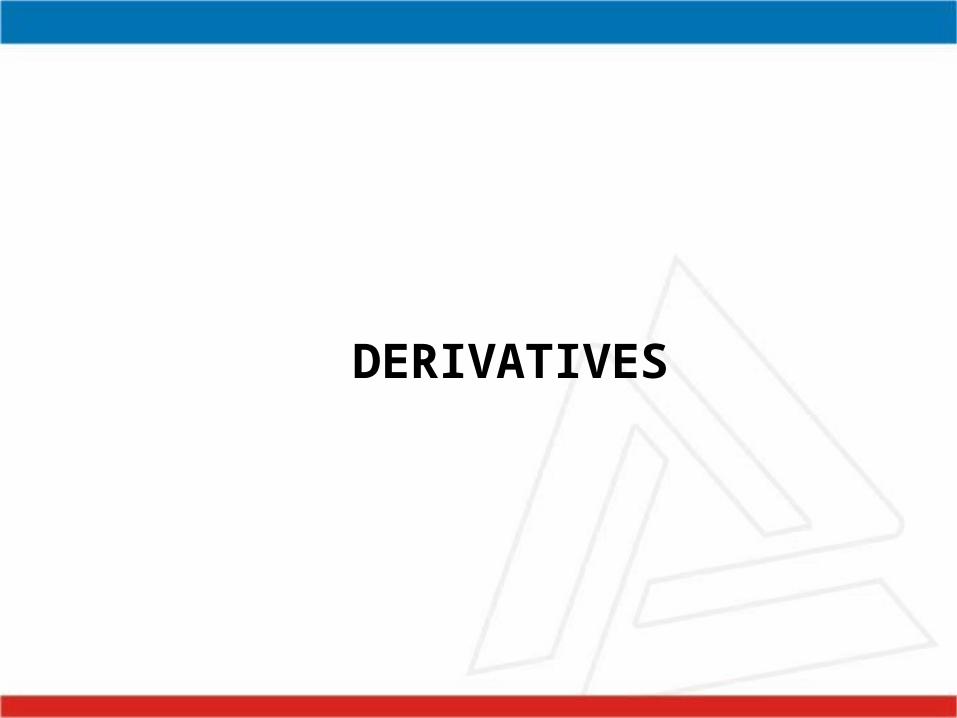
Derivative Contracts are wasting assets,
which derive their values from an underlying
asset. These underlying can be :
Stocks (Equity) Agri Commodities including grains,
coffee beans, etc. Precious metals like gold and silver. Foreign exchange rate Bonds Short-term debt securities such as
T-bills
TYPES OF DERIVATIVES
Forwards
Futures
Option
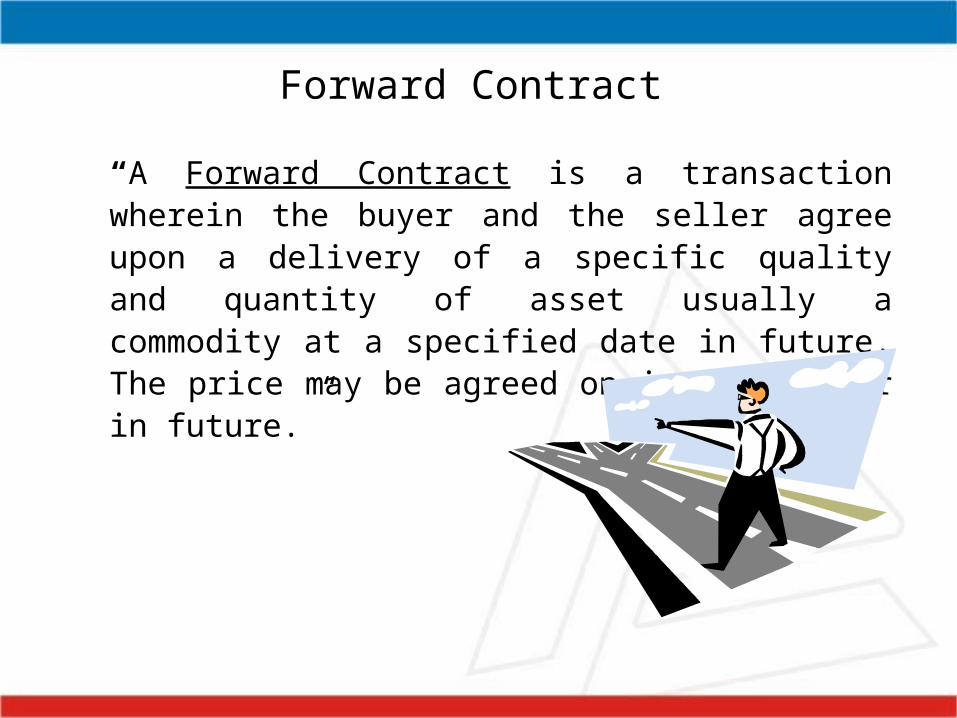
“A Forward Contract is a transaction wherein the buyer and the seller agree upon a delivery of a specific quality and quantity of asset usually a commodity at a specified date in future. The price may be agreed on in advance or in future.”
Forward Contract
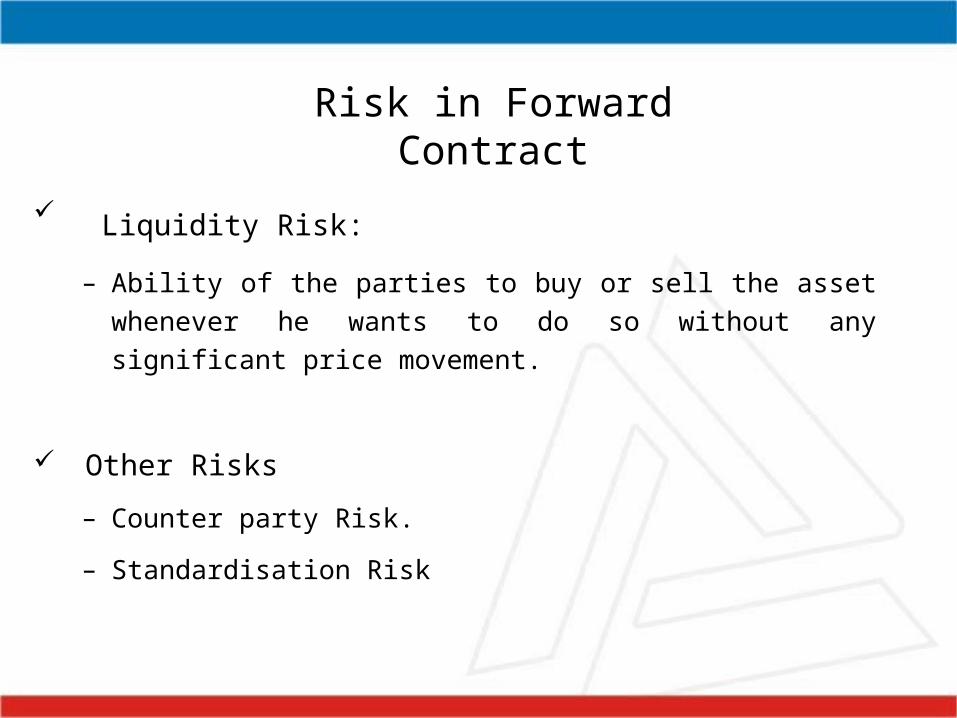
Risk in Forward Contract
Liquidity Risk:
– Ability of the parties to buy or sell the asset whenever he wants to do
so without any significant price movement.
Other Risks
– Counter party Risk.
– Standardisation Risk
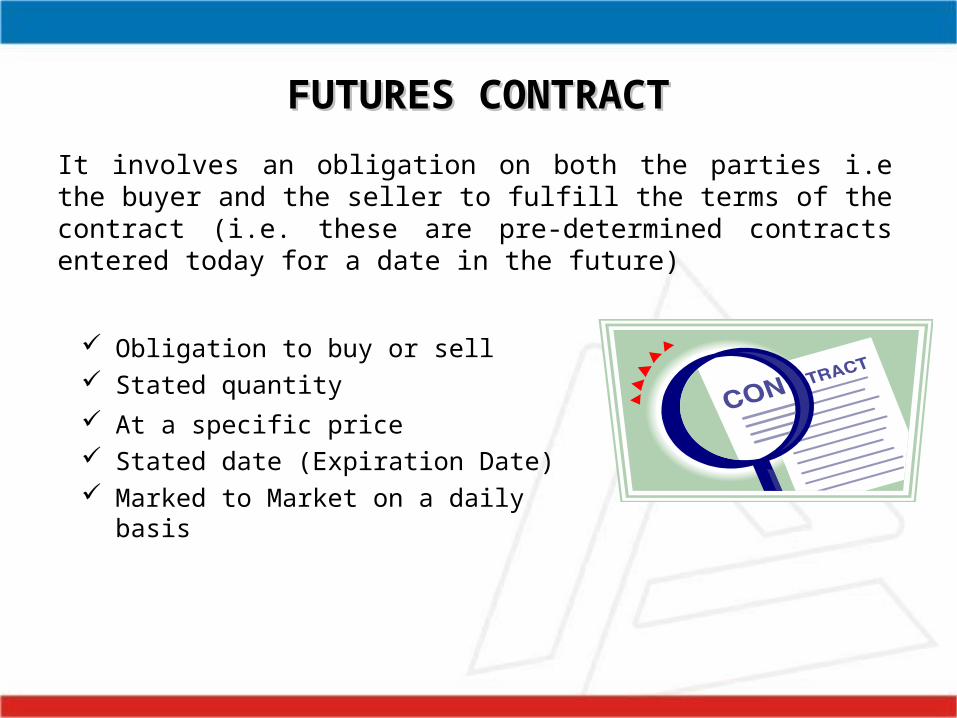
FUTURES CONTRACTFUTURES CONTRACT
It involves an obligation on both the parties i.e the buyer and the seller to fulfill the terms of the contract (i.e. these are pre-determined contracts entered today for a date in the future)
Obligation to buy or sell Stated quantity
At a specific price Stated date (Expiration Date) Marked to Market on a daily basis
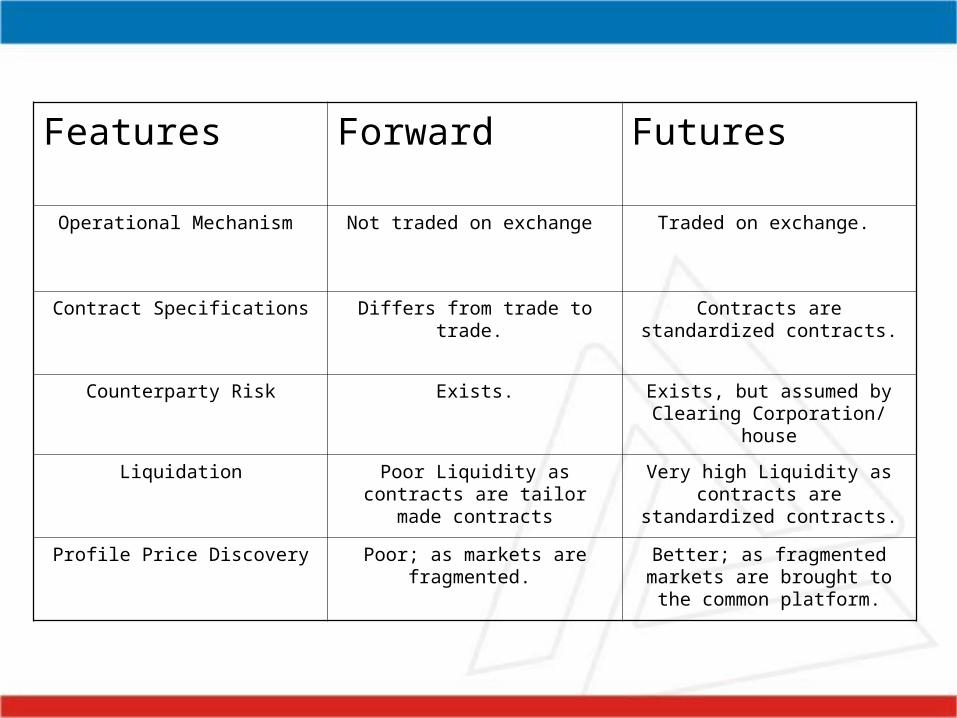
Features Forward Futures
Operational Mechanism Not traded on exchange Traded on exchange.
Contract Specifications Differs from trade to trade. Contracts are standardized contracts.
Counterparty Risk Exists. Exists, but assumed by Clearing Corporation/ house
Liquidation Poor Liquidity as contracts are tailor made contracts
Very high Liquidity as contracts are standardized contracts.
Profile Price Discovery Poor; as markets are fragmented. Better; as fragmented markets are brought to the common platform.
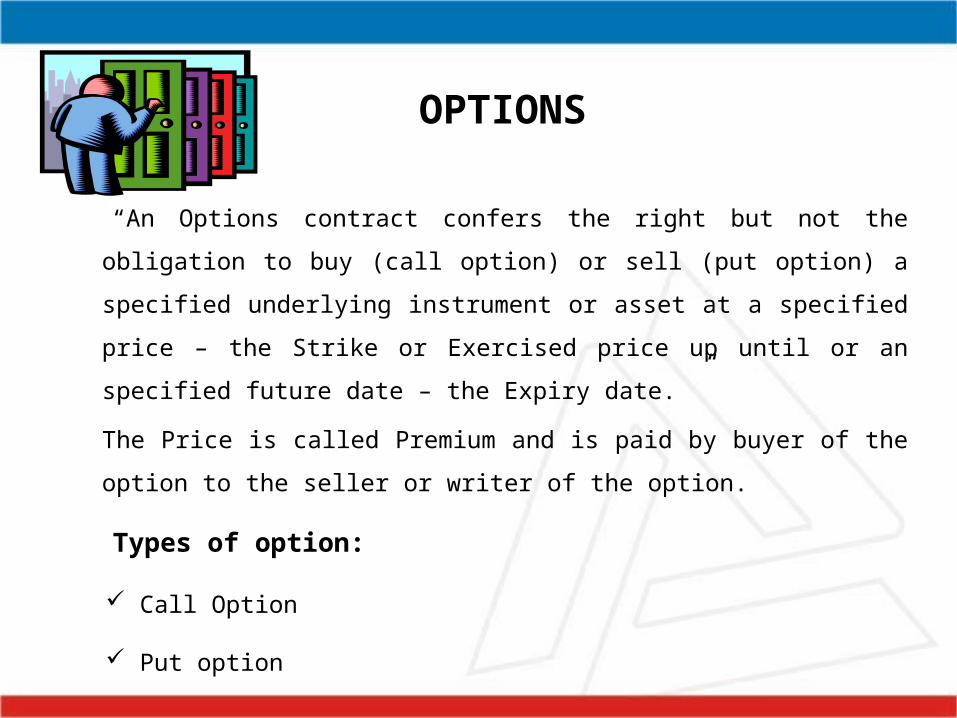
OPTIONS
“An Options contract confers the right but not the obligation to buy (call
option) or sell (put option) a specified underlying instrument or asset at a
specified price – the Strike or Exercised price up until or an specified
future date – the Expiry date. ”
The Price is called Premium and is paid by buyer of the option to the seller
or writer of the option.
Types of option:
Call Option
Put option
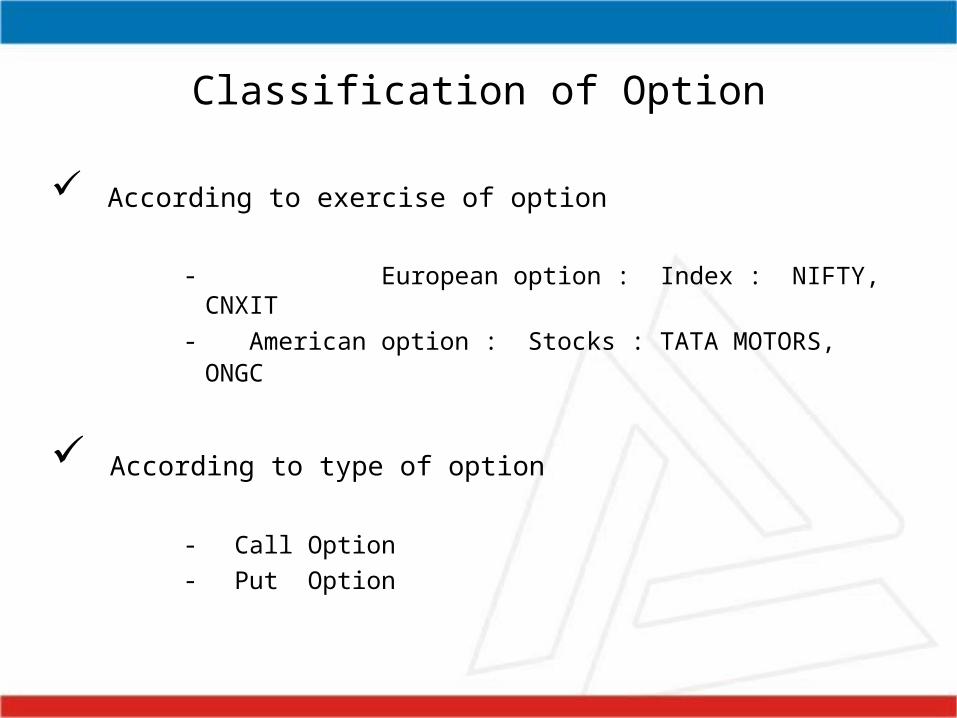
Classification of Option
According to exercise of option
- European option : Index : NIFTY, CNXIT
- American option : Stocks : TATA MOTORS, ONGC
According to type of option
- Call Option
- Put Option
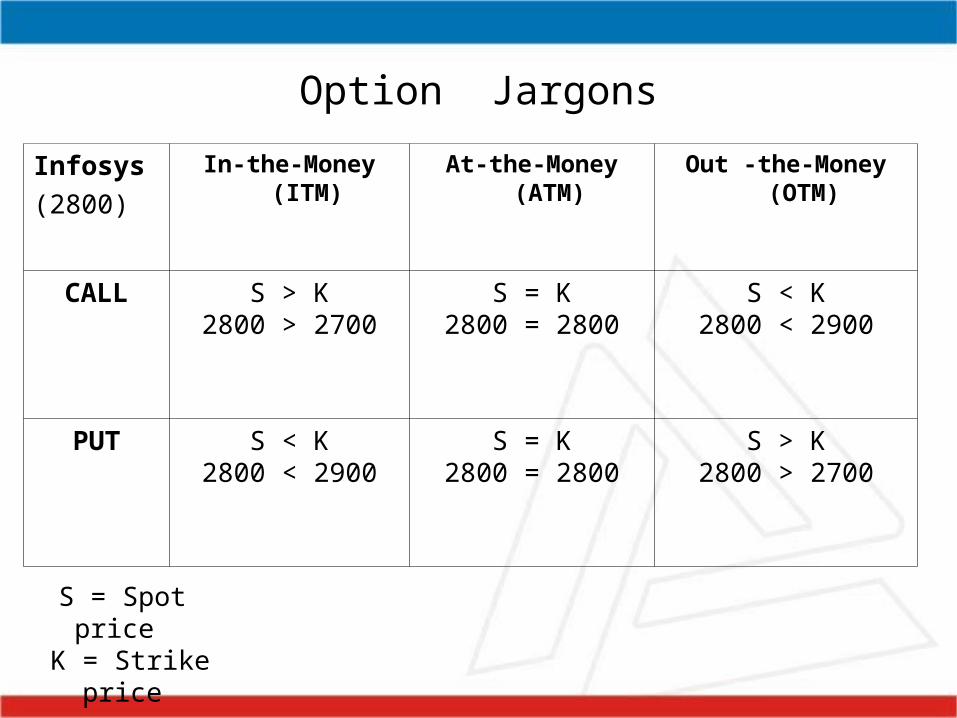
Option Jargons
Infosys
(2800)
In-the-Money (ITM) At-the-Money (ATM) Out -the-Money (OTM)
CALL S > K2800 > 2700
S = K2800 = 2800
S < K2800 < 2900
PUT S < K2800 < 2900
S = K2800 = 2800
S > K2800 > 2700
S = Spot price K = Strike
price
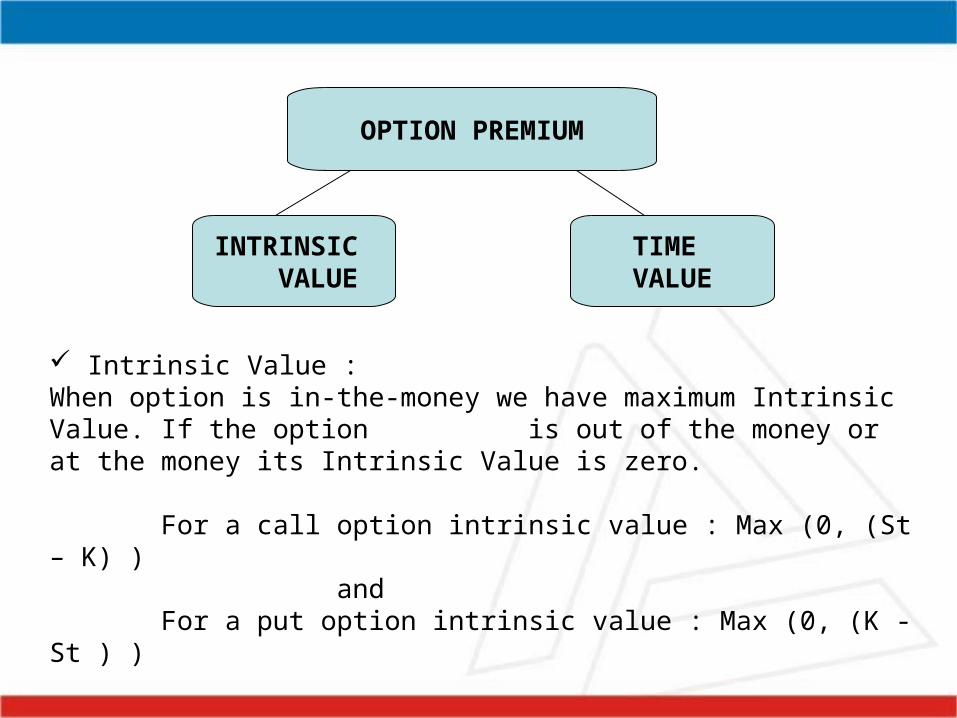
INTRINSIC VALUE
TIME VALUE
Intrinsic Value :When option is in-the-money we have maximum Intrinsic Value. If the option is out of the money or at the money its Intrinsic Value is zero.
For a call option intrinsic value : Max (0, (St – K) ) and
For a put option intrinsic value : Max (0, (K - St ) )
OPTION PREMIUM
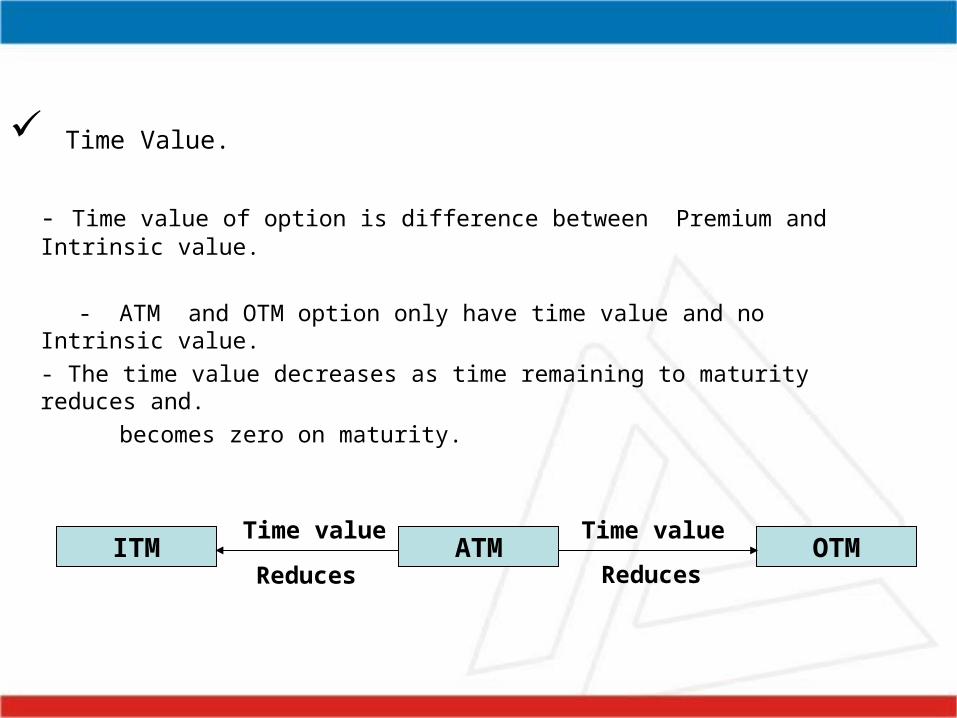
Time Value.
- Time value of option is difference between Premium and Intrinsic value.
- ATM and OTM option only have time value and no Intrinsic value.
- The time value decreases as time remaining to maturity reduces and.
becomes zero on maturity.
ATMITM OTM
Time value
Reduces
Time value
Reduces
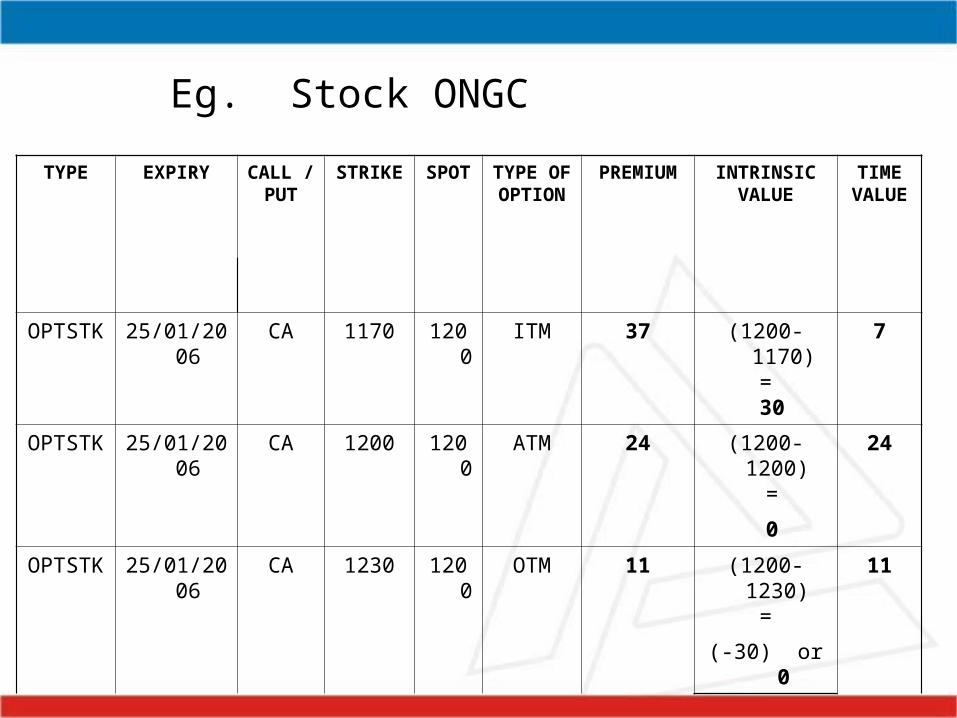
Eg. Stock ONGC
TYPE EXPIRY CALL / PUT
STRIKE SPOT TYPE OFOPTION
PREMIUM INTRINSICVALUE
TIMEVALUE
OPTSTK 25/01/2006 CA 1170 1200 ITM 37 (1200-1170)=
30
7
OPTSTK 25/01/2006 CA 1200 1200 ATM 24 (1200-1200) =
24
0
OPTSTK 25/01/2006 CA 1230 1200 OTM 11 (1200-1230) =
11
(-30) or 0
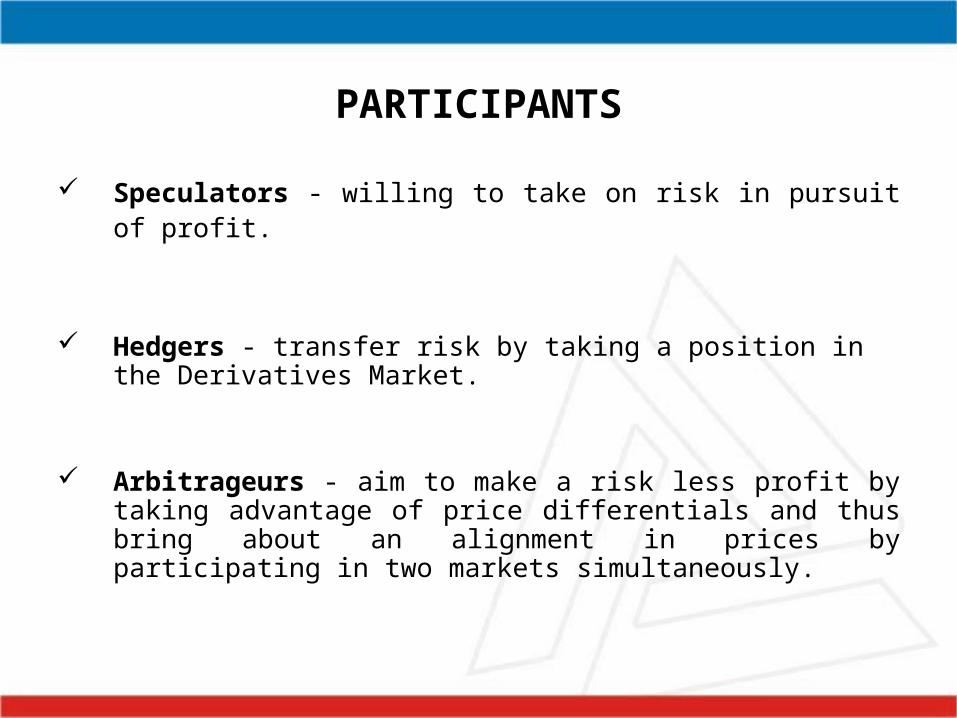
PARTICIPANTS
Speculators - willing to take on risk in pursuit of profit.
Hedgers - transfer risk by taking a position in the Derivatives Market.
Arbitrageurs - aim to make a risk less profit by taking advantage of price differentials and thus bring about an alignment in prices by participating in two markets simultaneously.
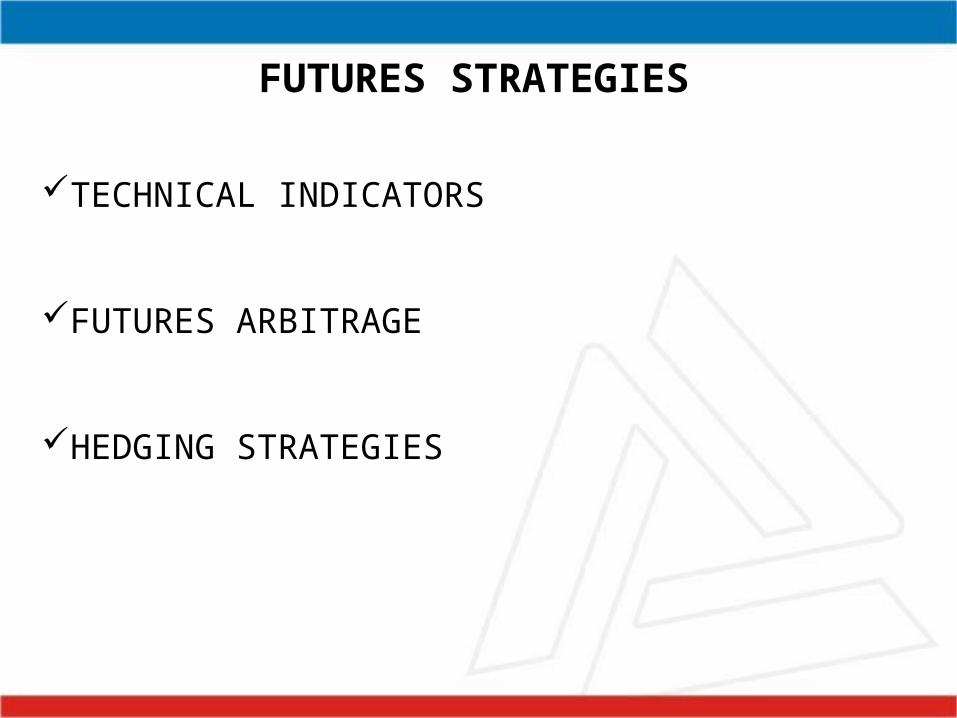
FUTURES STRATEGIES
TECHNICAL INDICATORS
FUTURES ARBITRAGE
HEDGING STRATEGIES
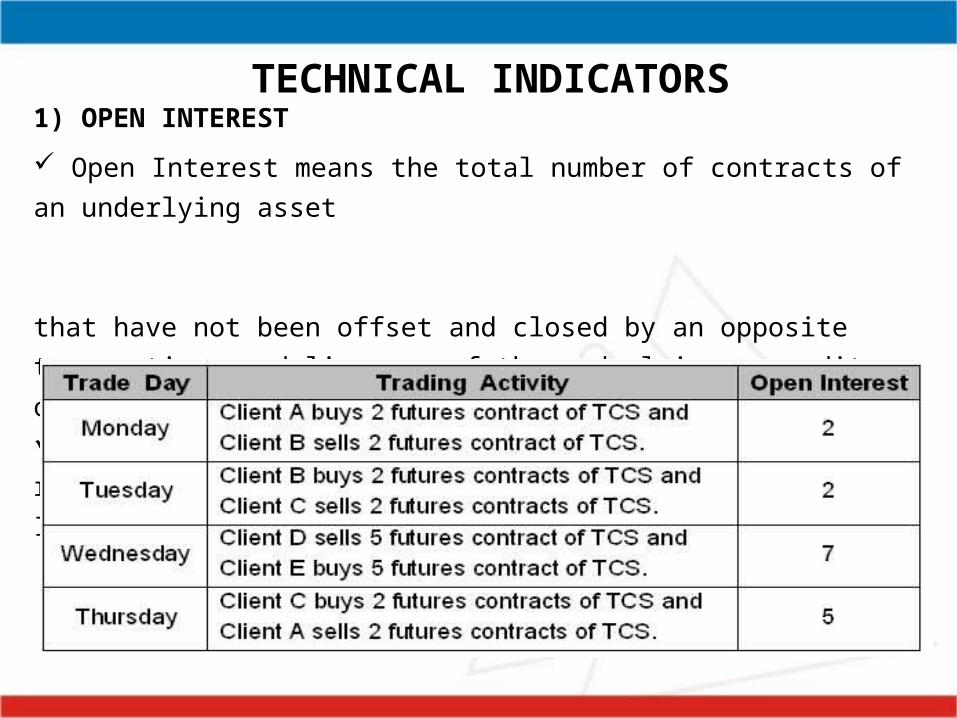
1) OPEN INTEREST
Open Interest means the total number of contracts of an underlying asset
that have not been offset and closed by an opposite transaction or delivery of
the underlying commodity or by cash settlement. Sum of all positions taken by different traders are reflected in the Open
Interest.
TECHNICAL INDICATORS
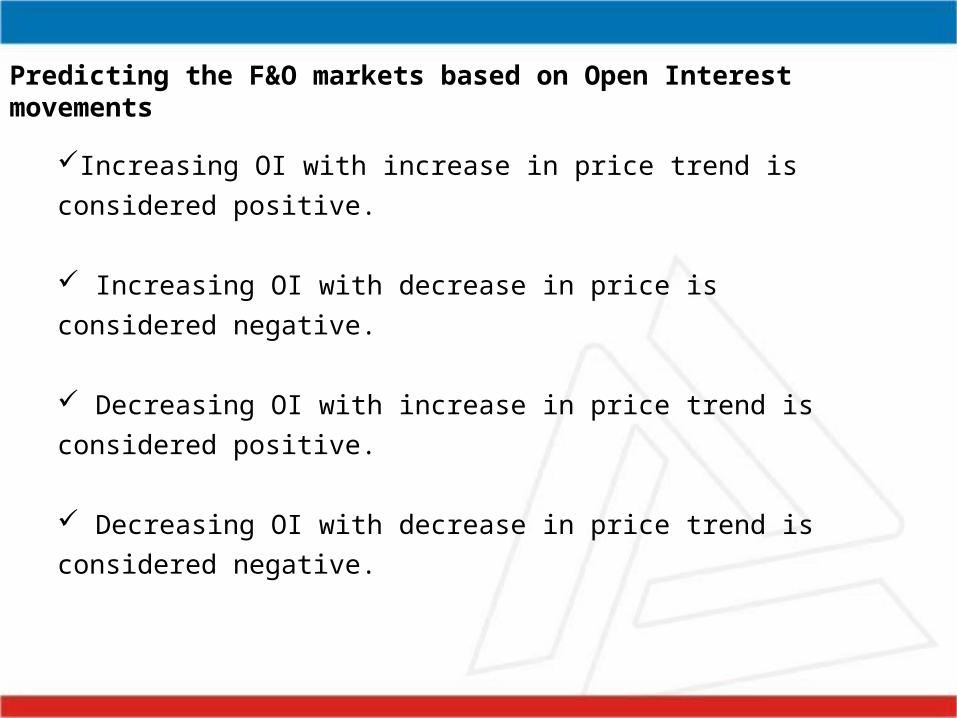
Predicting the F&O markets based on Open Interest movements
Increasing OI with increase in price trend is considered positive.
Increasing OI with decrease in price is considered negative.
Decreasing OI with increase in price trend is considered positive.
Decreasing OI with decrease in price trend is considered negative.
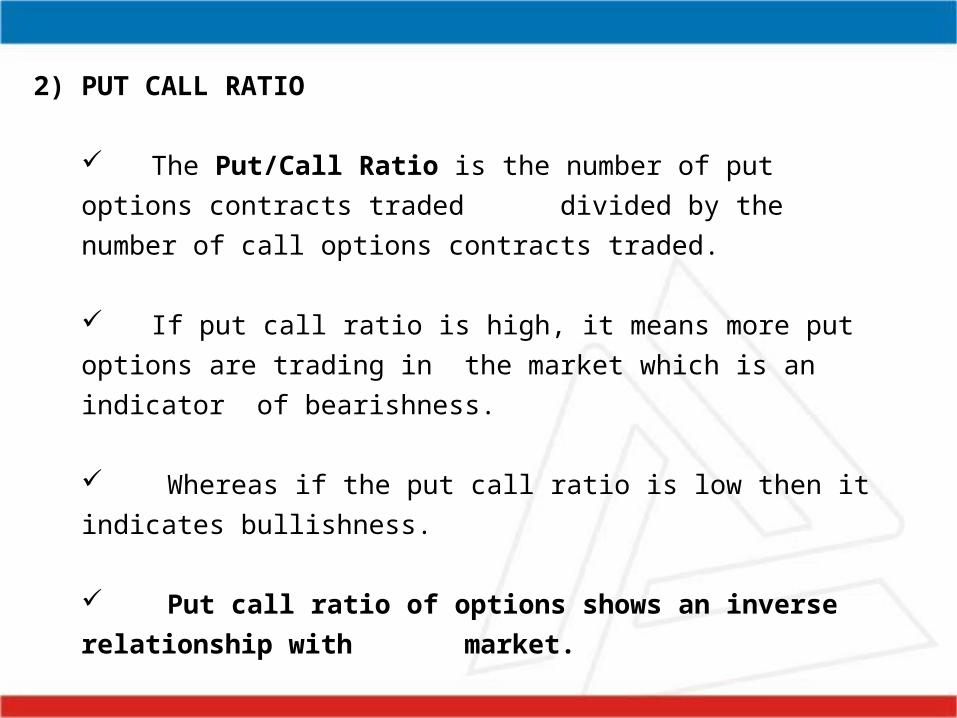
2) PUT CALL RATIO
The Put/Call Ratio is the number of put options contracts traded
divided by the number of call options contracts traded.
If put call ratio is high, it means more put options are trading in
the market which is an indicator of bearishness.
Whereas if the put call ratio is low then it indicates bullishness.
Put call ratio of options shows an inverse relationship with
market.
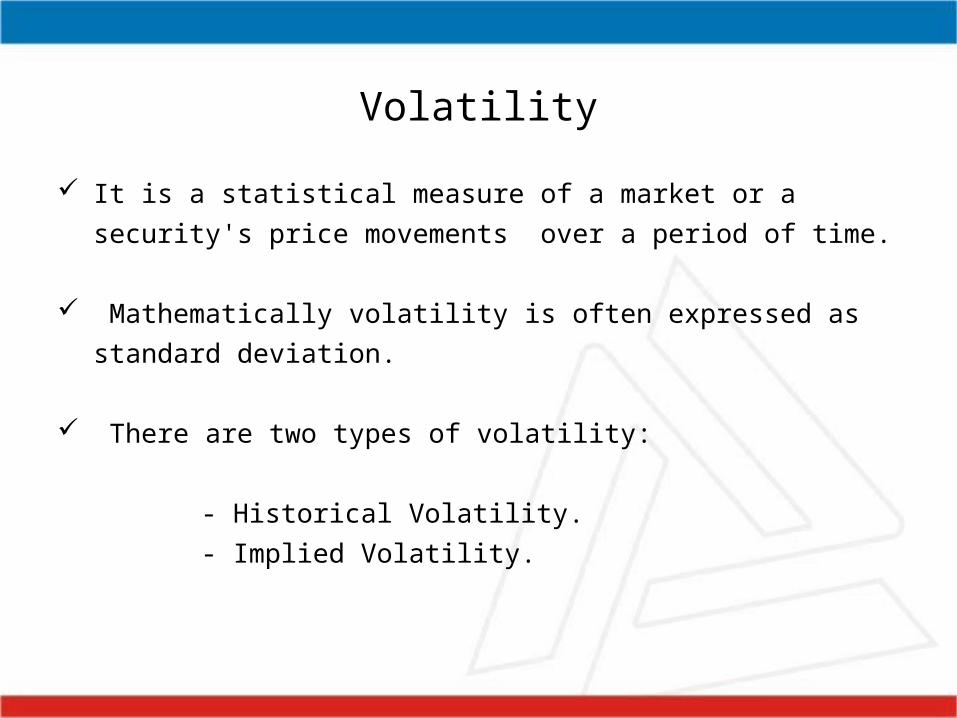
Volatility
It is a statistical measure of a market or a security's price movements over
a period of time.
Mathematically volatility is often expressed as standard deviation.
There are two types of volatility:
- Historical Volatility.
- Implied Volatility.
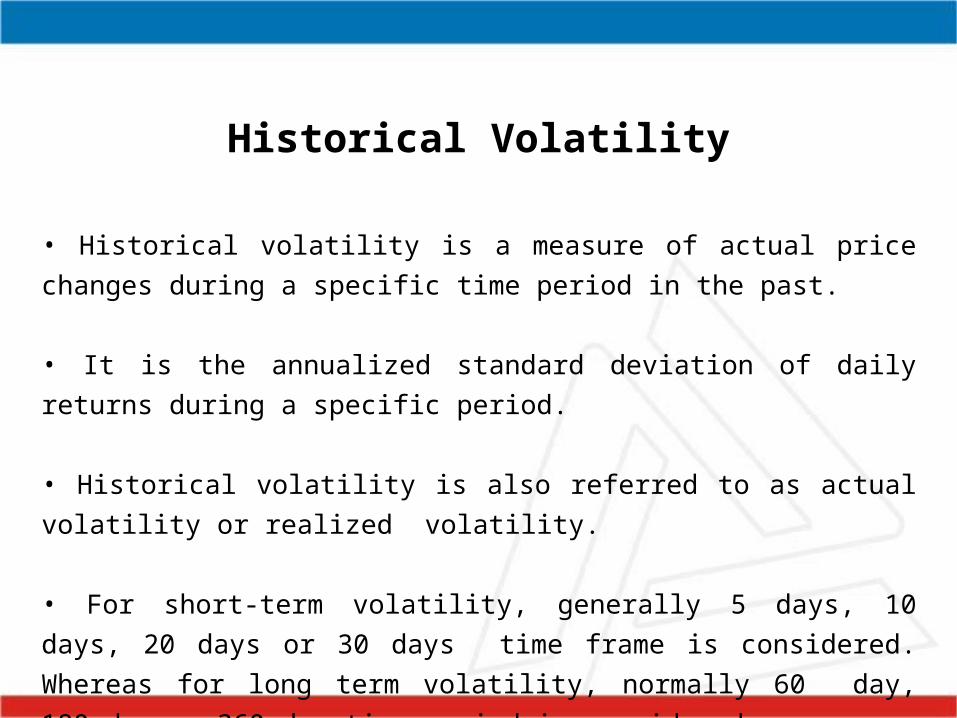
Historical Volatility
• Historical volatility is a measure of actual price changes during a specific time
period in the past.
• It is the annualized standard deviation of daily returns during a specific period.
• Historical volatility is also referred to as actual volatility or realized volatility.
• For short-term volatility, generally 5 days, 10 days, 20 days or 30 days time
frame is considered. Whereas for long term volatility, normally 60 day, 180 day
or 360 day time period is considered.
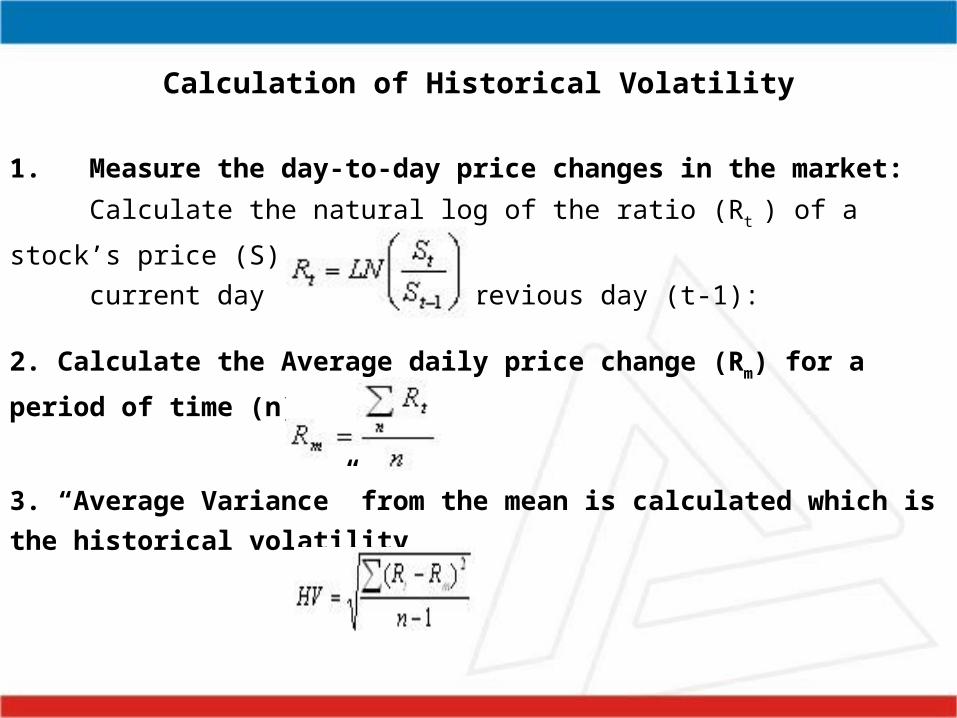
Derivatives’ StrategiesCalculation of Historical Volatility
1. Measure the day-to-day price changes in the market:
Calculate the natural log of the ratio (Rt ) of a stock’s price (S) from the
current day (t) to the previous day (t-1):
2. Calculate the Average daily price change (Rm) for a period of time (n)
3. “Average Variance” from the mean is calculated which is the historical
volatility
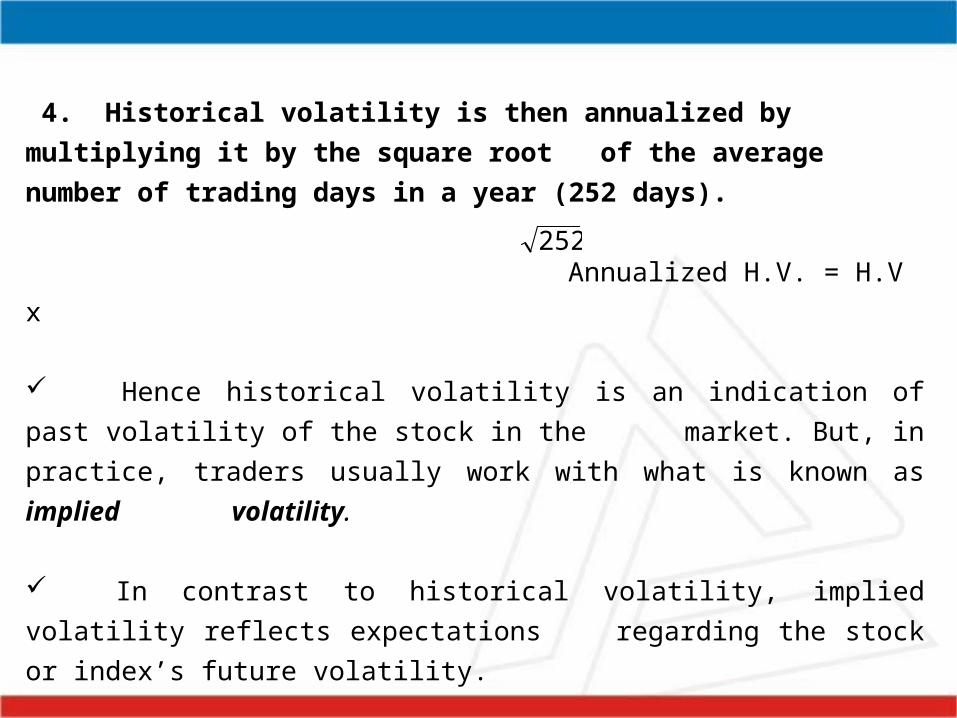
Derivatives’ Strategies 4. Historical volatility is then annualized by multiplying it by the square root
of the average number of trading days in a year (252 days).
Annualized H.V. = H.V x
Hence historical volatility is an indication of past volatility of the stock in the
market. But, in practice, traders usually work with what is known as implied
volatility.
In contrast to historical volatility, implied volatility reflects expectations
regarding the stock or index’s future volatility.
252
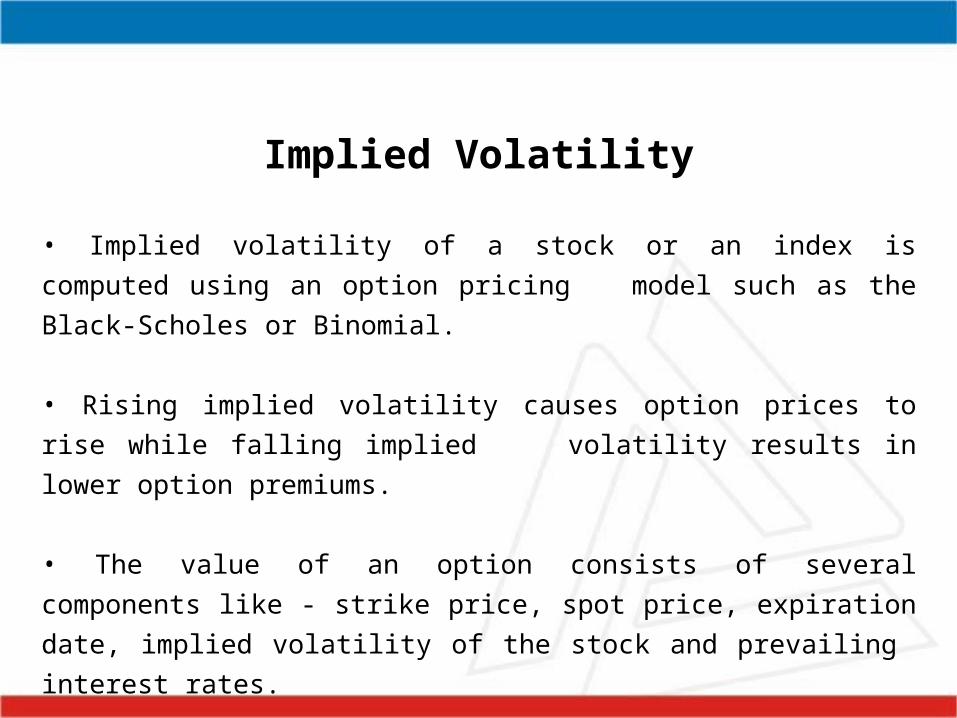
Implied Volatility
• Implied volatility of a stock or an index is computed using an option pricing
model such as the Black-Scholes or Binomial.
• Rising implied volatility causes option prices to rise while falling implied
volatility results in lower option premiums.
• The value of an option consists of several components like - strike price, spot
price, expiration date, implied volatility of the stock and prevailing interest rates.
Derivatives’ Strategies• On a given stock, there would generally be a number of calls outstanding,
which may have different exercise prices and expiration dates.
• From each of these we can make an estimate about the standard deviation of
the stock’s rate of return.
• The various standard deviations are then combined on a simple or weighted
average basis and an estimate about the volatility can be made.
• Therefore implied volatility is that level of volatility which is calculated from
the current trading option price.
FUTURES ARBITRAGE
Arbitrage is the act of simultaneously buying and selling assets or commodities in an attempt to exploit a profitable opportunity.
Arbitrage is done between two related instruments which are temporarily mis-priced. For example, the futures price and spot price are related by the interest rate, time to maturity and corporate benefit, if any, in the interregnum.
If the two prices do not move in tandem, then it throws up arbitrage opportunity. An arbitrageur will buy what is cheap and sell what is costly and lock in profits without any risk.
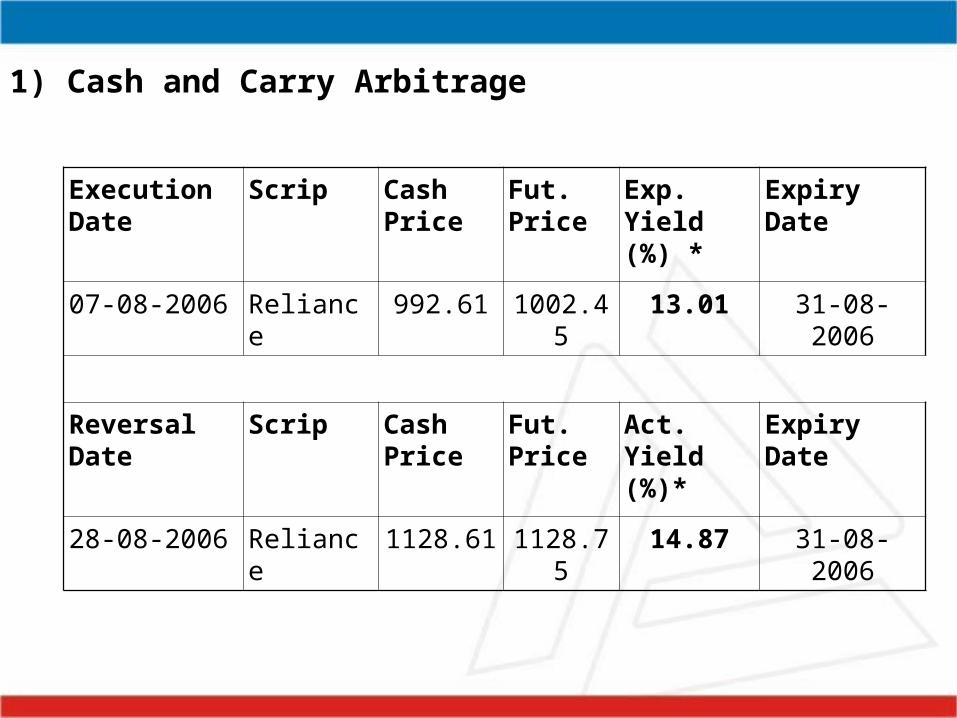
Execution Date
Scrip Cash Price
Fut. Price
Exp. Yield (%) *
Expiry Date
07-08-2006 Reliance 992.61 1002.45 13.01 31-08-2006
Reversal Date Scrip Cash Price
Fut. Price
Act. Yield (%)*
Expiry Date
28-08-2006 Reliance 1128.61 1128.75 14.87 31-08-2006
1) Cash and Carry Arbitrage
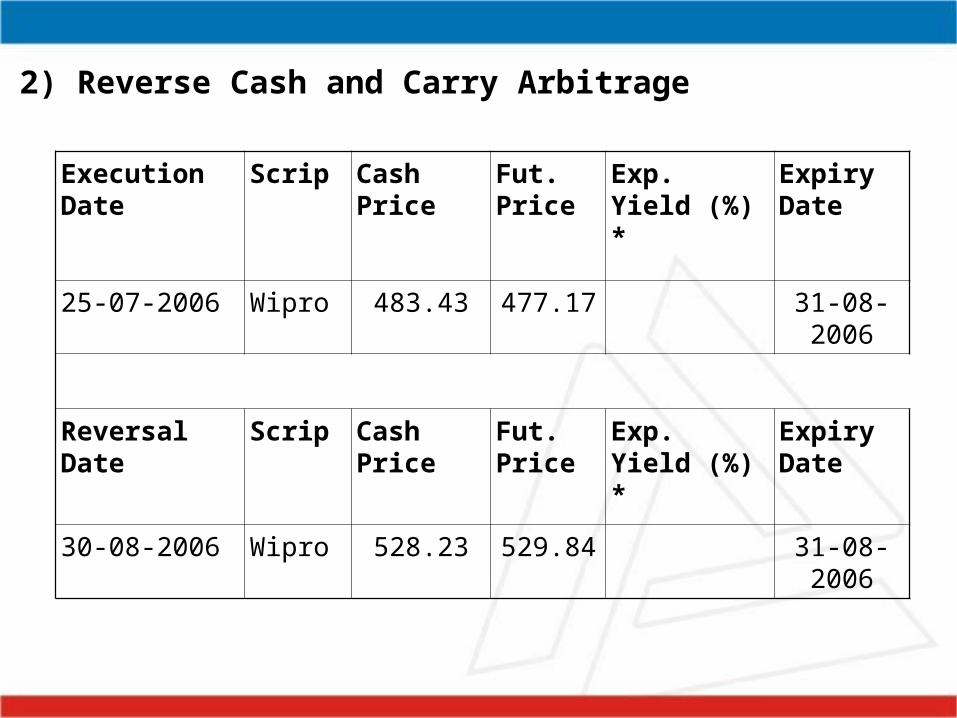
2) Reverse Cash and Carry Arbitrage
Execution Date Scrip Cash Price Fut. Price
Exp. Yield (%) *
Expiry Date
25-07-2006 Wipro 483.43 477.17 31-08-2006
Reversal Date Scrip Cash Price Fut. Price
Exp. Yield (%) *
Expiry Date
30-08-2006 Wipro 528.23 529.84 31-08-2006
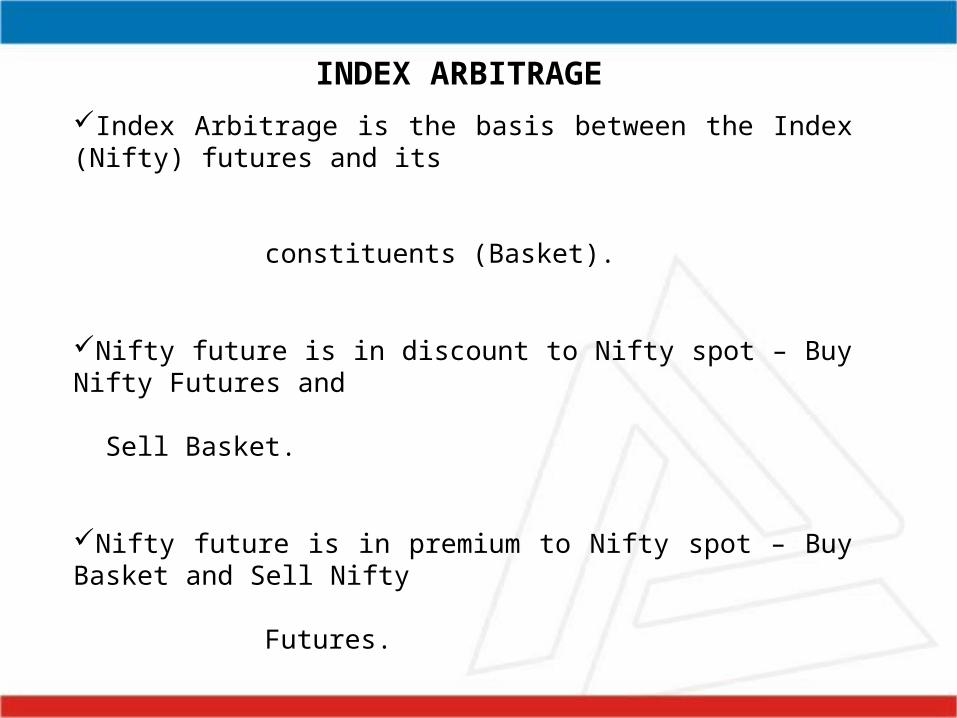
Index Arbitrage is the basis between the Index (Nifty) futures and its constituents (Basket).
Nifty future is in discount to Nifty spot – Buy Nifty Futures and Sell Basket.
Nifty future is in premium to Nifty spot – Buy Basket and Sell Nifty Futures.
As we can’t trade in Nifty spot, we have to create Basket of Nifty components either with underlying stock or stock futures.
INDEX ARBITRAGE
If Nifty is in discount (as quite often), then you have to sell basket.
As you cannot short sell in cash, we will be creating basket using stock futures.
Advantage of using stock futures is – only margin money will be deployed.
We will be creating Basket based on the weight of the constituents in the Nifty.(Market Capitalization Method)
We have to make portfolio - “Perfect Hedge”.
PROCESS
Contd…
Minimum exposure of 242 contracts in Nifty (12,100 units) as it will be best hedge. All the stocks will participate according to their actual weights on the exposure of 242 contracts in Nifty.
Once good returns have been observed we will execute the strategy. Execution requires highly skilled arbitrageurs.
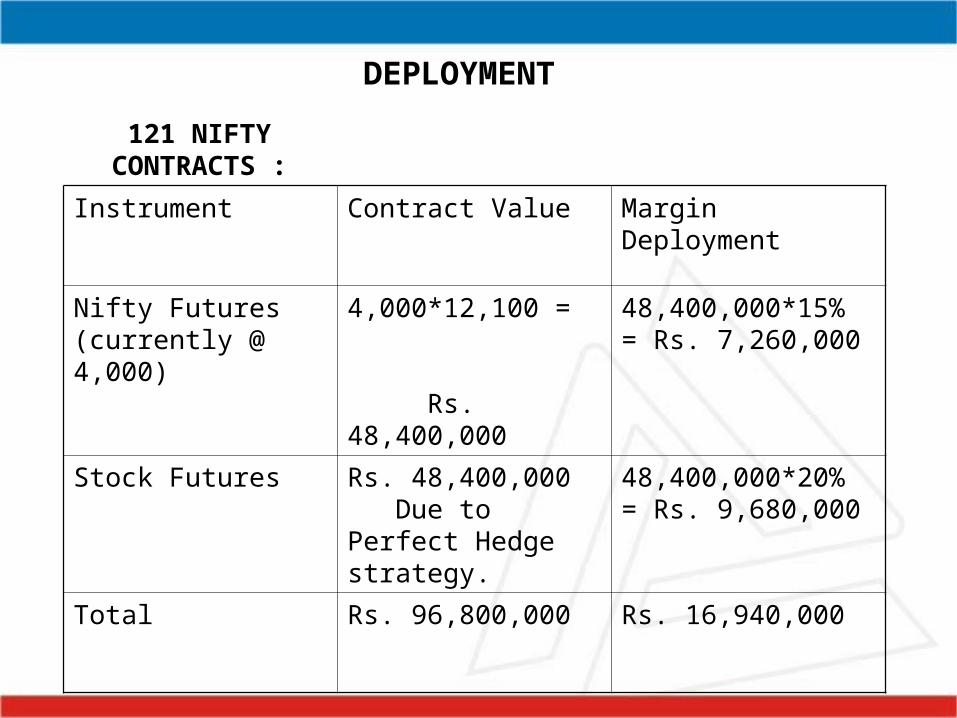
121 NIFTY CONTRACTS :
Instrument Contract Value Margin Deployment
Nifty Futures (currently @ 4,000)
4,000*12,100 = Rs. 48,400,000
48,400,000*15% = Rs. 7,260,000
Stock Futures Rs. 48,400,000 Due to Perfect Hedge strategy.
48,400,000*20% = Rs. 9,680,000
Total Rs. 96,800,000 Rs. 16,940,000
DEPLOYMENT
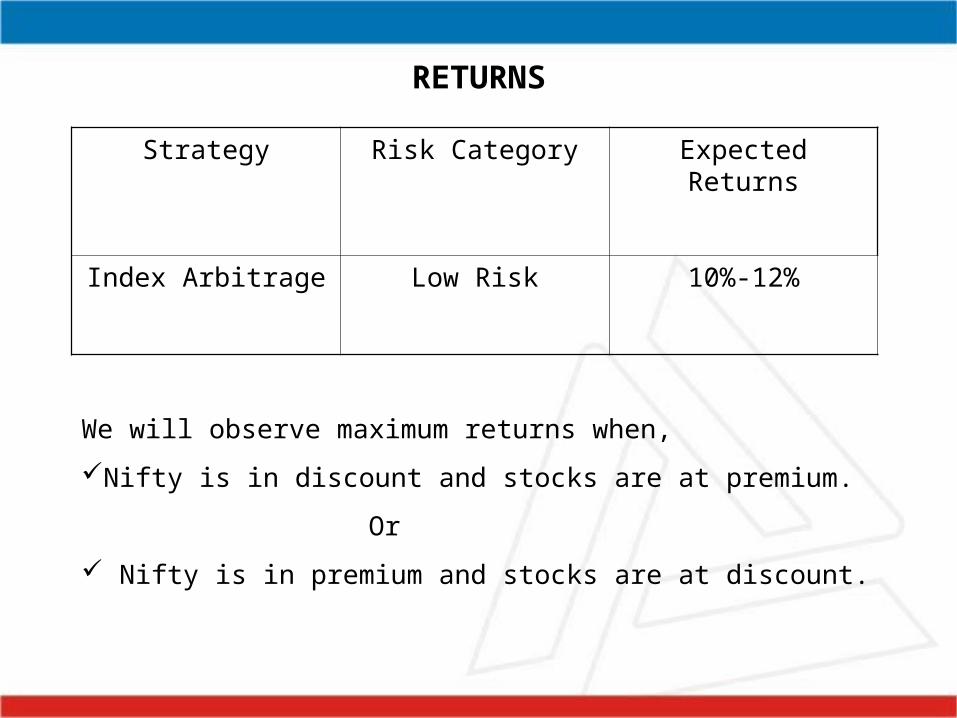
RETURNS
Strategy Risk Category Expected Returns
Index Arbitrage Low Risk 10%-12%
We will observe maximum returns when,
Nifty is in discount and stocks are at premium.
Or
Nifty is in premium and stocks are at discount.
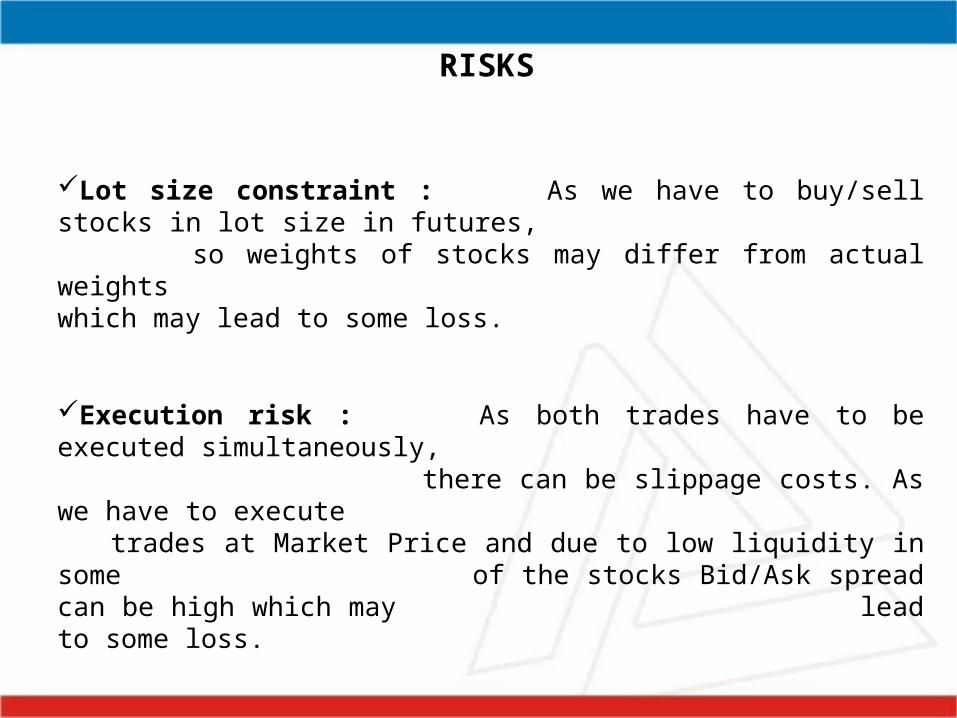
RISKS
Lot size constraint : As we have to buy/sell stocks in lot size in futures, so weights of stocks may differ from actual weights
which may lead to some loss.
Execution risk : As both trades have to be executed simultaneously, there can be slippage costs. As we have to execute
trades at Market Price and due to low liquidity in some of the stocks Bid/Ask spread can be high which may lead to some loss.
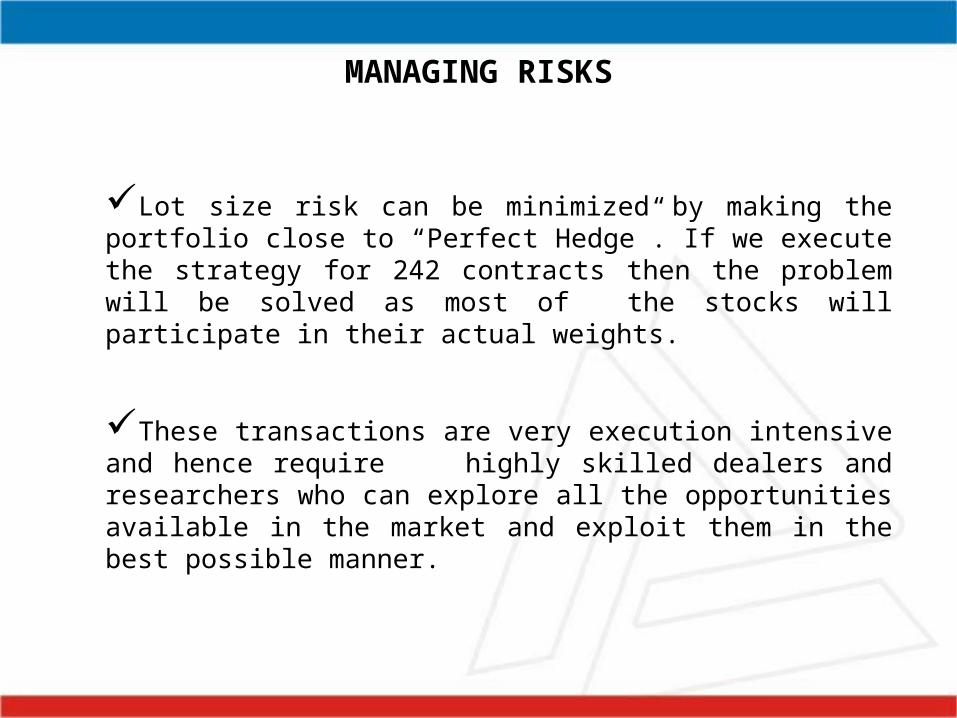
MANAGING RISKS
Lot size risk can be minimized by making the portfolio close to “Perfect Hedge”. If we execute the strategy for 242 contracts then the problem will be solved as most of the stocks will participate in their actual weights.
These transactions are very execution intensive and hence require highly skilled dealers and researchers who can explore all the opportunities available in the market and exploit them in the best possible manner.
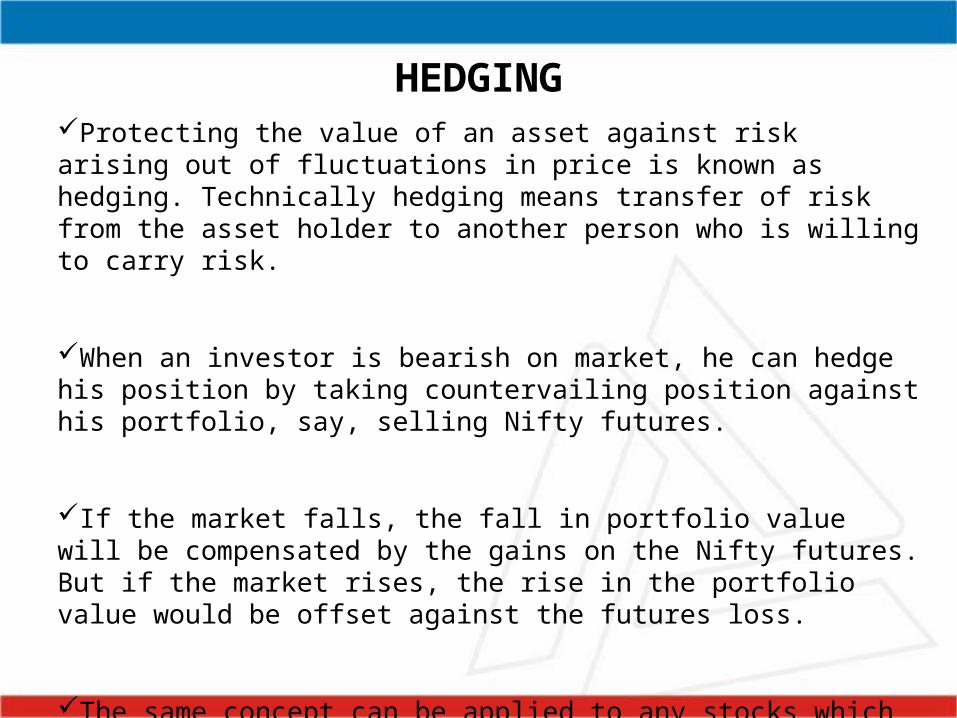
HEDGINGProtecting the value of an asset against risk arising out of fluctuations in price is known as hedging. Technically hedging means transfer of risk from the asset holder to another person who is willing to carry risk.
When an investor is bearish on market, he can hedge his position by taking countervailing position against his portfolio, say, selling Nifty futures.
If the market falls, the fall in portfolio value will be compensated by the gains on the Nifty futures. But if the market rises, the rise in the portfolio value would be offset against the futures loss.
The same concept can be applied to any stocks which have a presence in futures market. The result of any Perfect Hedge contract is – “No Profit and No Loss”
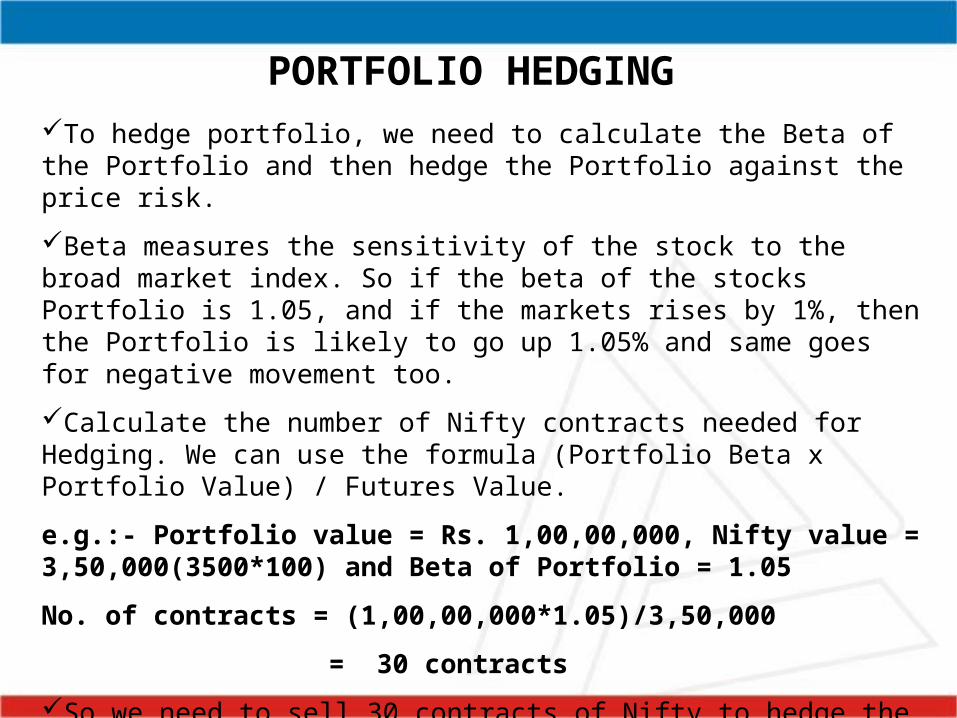
PORTFOLIO HEDGINGTo hedge portfolio, we need to calculate the Beta of the Portfolio and then hedge the Portfolio against the price risk.
Beta measures the sensitivity of the stock to the broad market index. So if the beta of the stocks Portfolio is 1.05, and if the markets rises by 1%, then the Portfolio is likely to go up 1.05% and same goes for negative movement too.
Calculate the number of Nifty contracts needed for Hedging. We can use the formula (Portfolio Beta x Portfolio Value) / Futures Value.
e.g.:- Portfolio value = Rs. 1,00,00,000, Nifty value = 3,50,000(3500*100) and Beta of Portfolio = 1.05
No. of contracts = (1,00,00,000*1.05)/3,50,000
= 30 contracts
So we need to sell 30 contracts of Nifty to hedge the Long Portfolio.
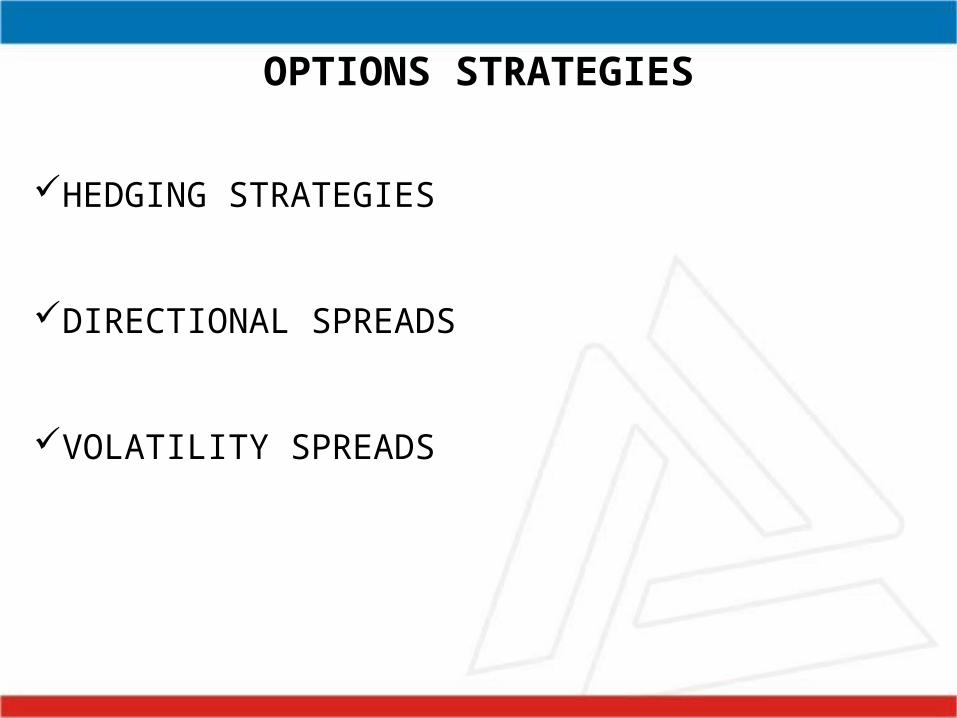
OPTIONS STRATEGIES
HEDGING STRATEGIES
DIRECTIONAL SPREADS
VOLATILITY SPREADS
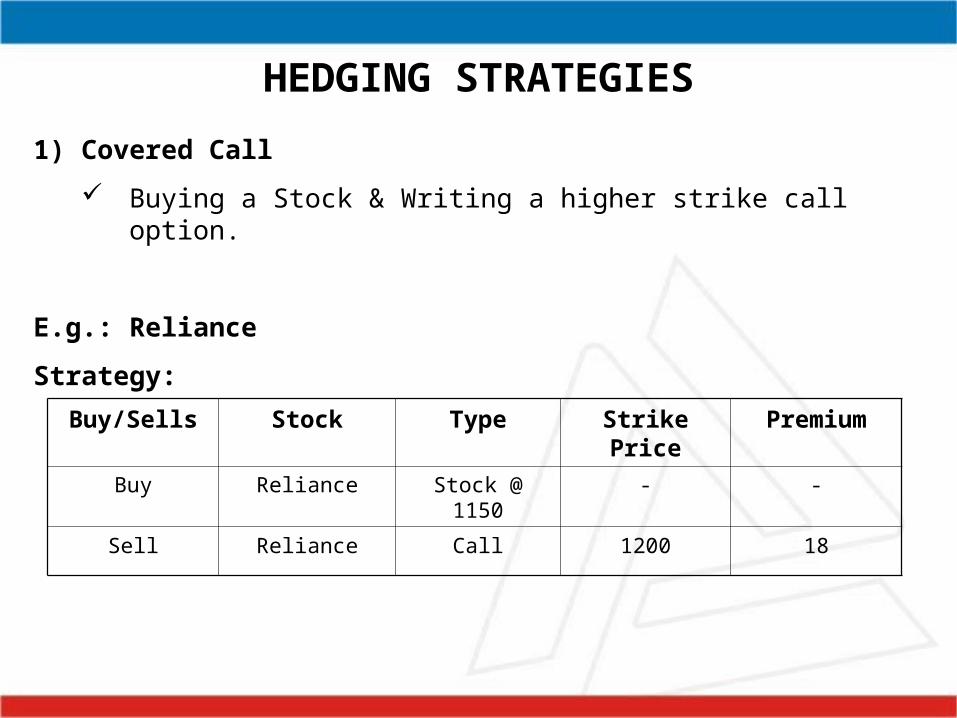
HEDGING STRATEGIES
1) Covered Call
Buying a Stock & Writing a higher strike call option.
E.g.: Reliance
Strategy:
Buy/Sells Stock Type Strike Price Premium
Buy Reliance Stock @ 1150 - -
Sell Reliance Call 1200 18
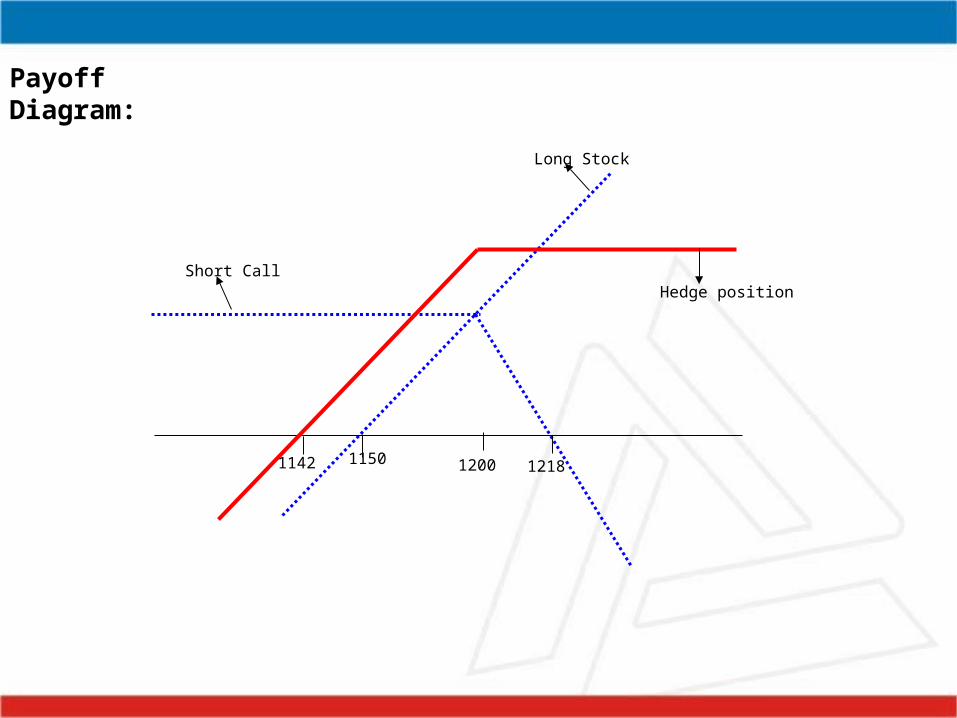
1150 1200
Short Call
Long Stock
Hedge position
1142 1218
Payoff Diagram:
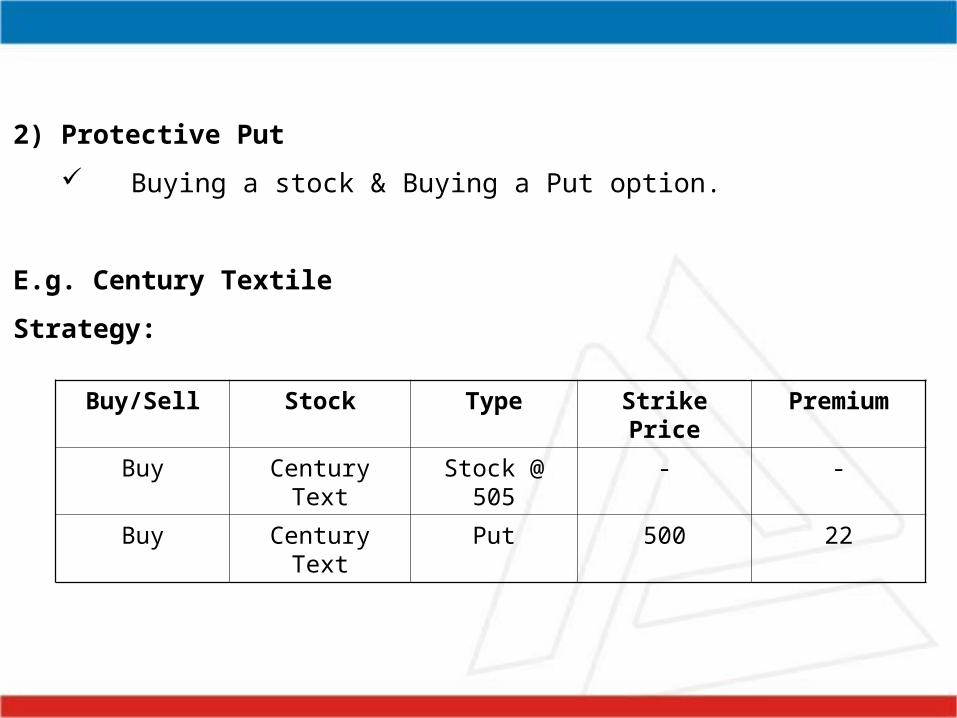
2) Protective Put
Buying a stock & Buying a Put option.
E.g. Century Textile
Strategy:
Buy/Sell Stock Type Strike Price Premium
Buy Century Text Stock @ 505 - -
Buy Century Text Put 500 22
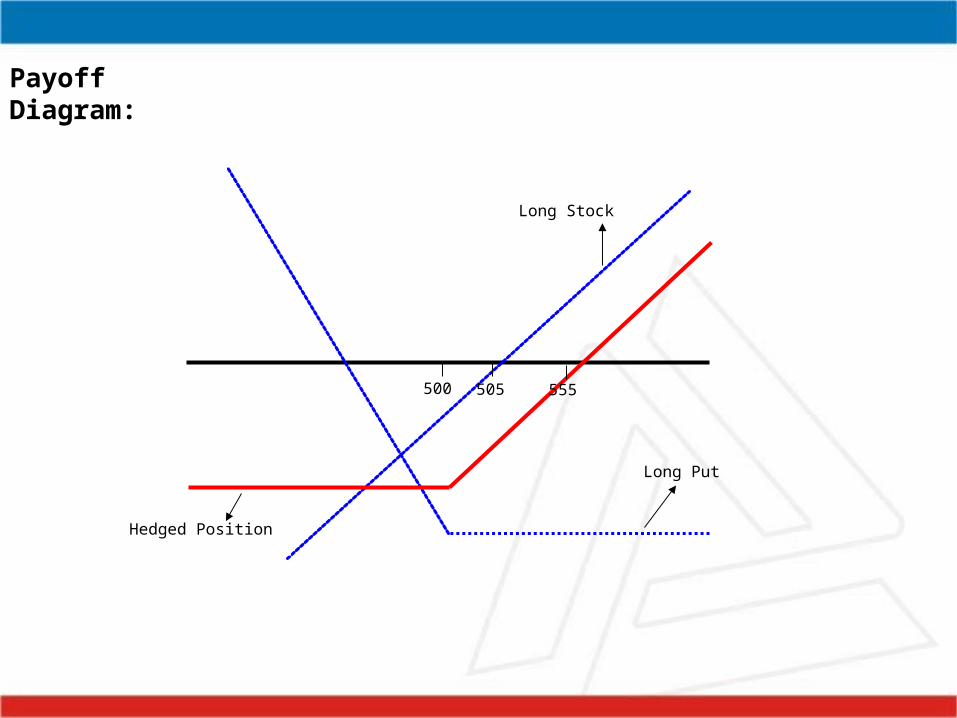
Long Put
Long Stock
Hedged Position
505500 555
Payoff Diagram:
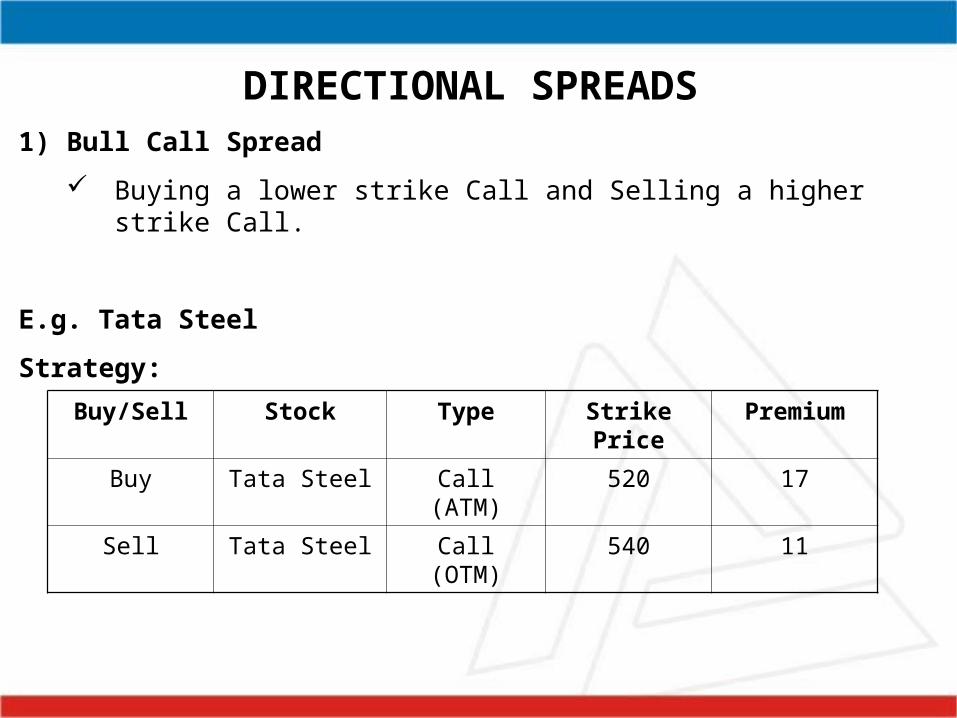
DIRECTIONAL SPREADS1) Bull Call Spread
Buying a lower strike Call and Selling a higher strike Call.
E.g. Tata Steel
Strategy:
Buy/Sell Stock Type Strike Price Premium
Buy Tata Steel Call (ATM) 520 17
Sell Tata Steel Call (OTM) 540 11
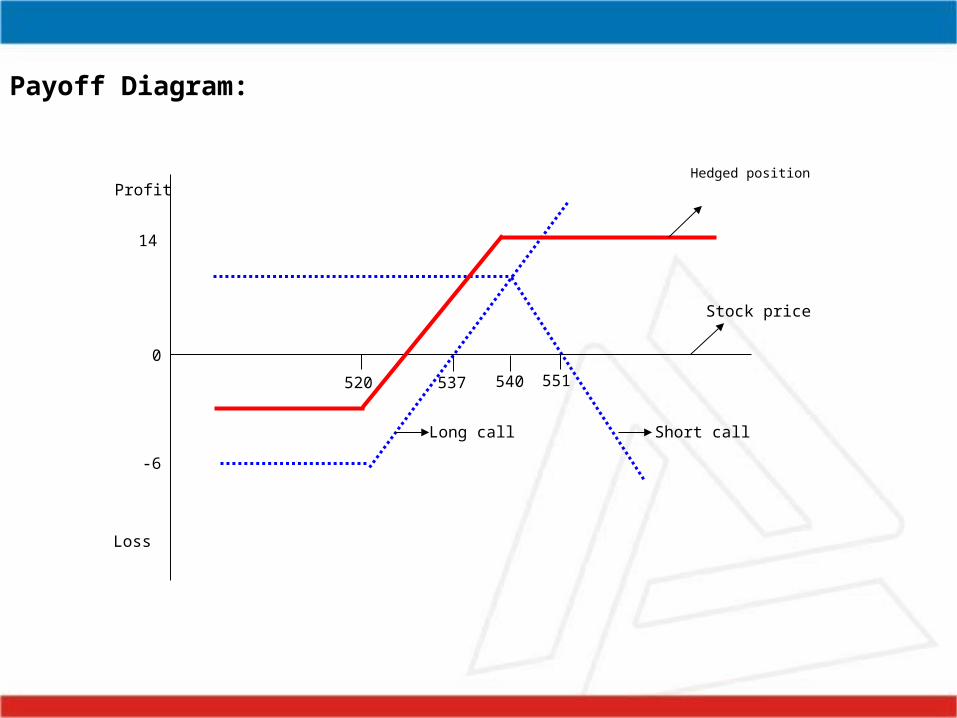
Payoff Diagram:
520 540 551537
Long call Short call
Hedged position
Stock price
Profit
Loss
0
14
-6
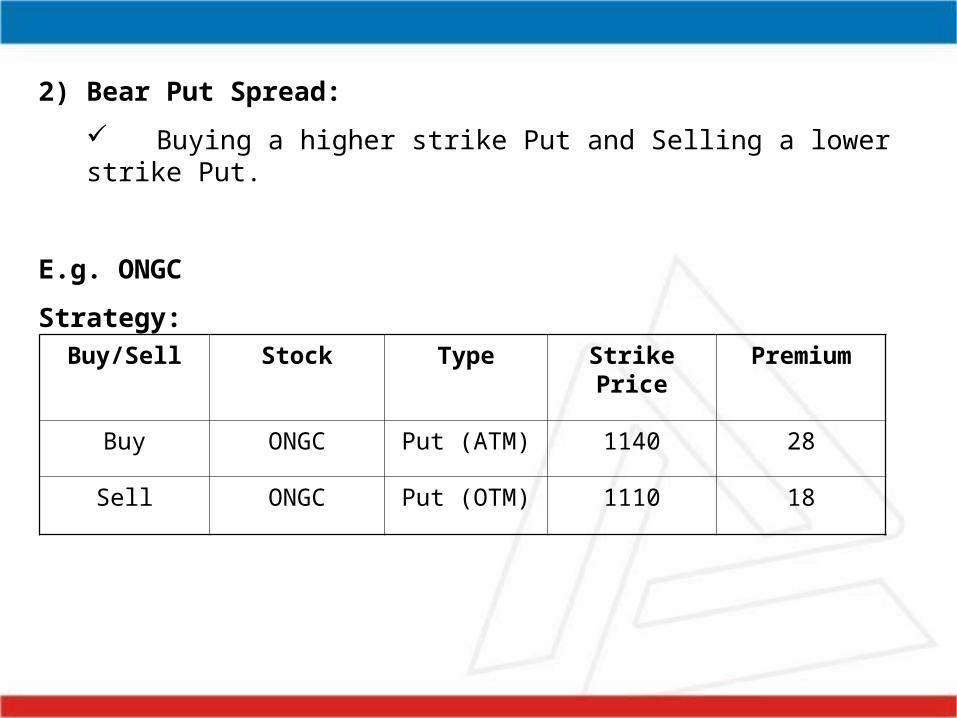
2) Bear Put Spread:
Buying a higher strike Put and Selling a lower strike Put.
E.g. ONGC
Strategy:
Buy/Sell Stock Type Strike Price Premium
Buy ONGC Put (ATM) 1140 28
Sell ONGC Put (OTM) 1110 18
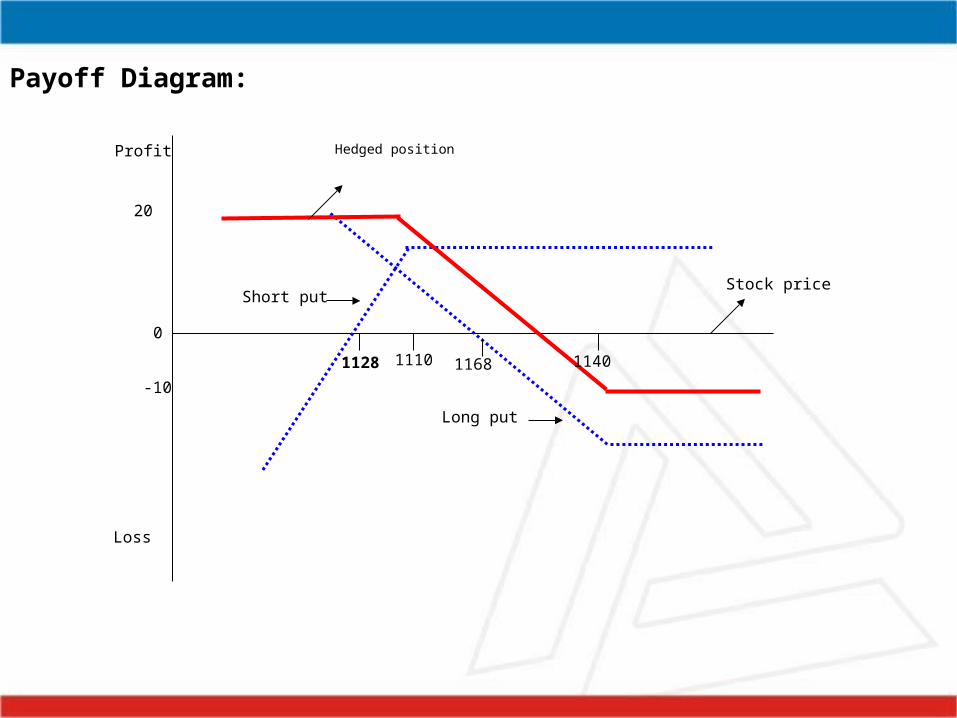
Long put
Short put
Hedged position
Stock price
1128 1168 11401110
Profit
Loss
0
20
-10
Payoff Diagram:
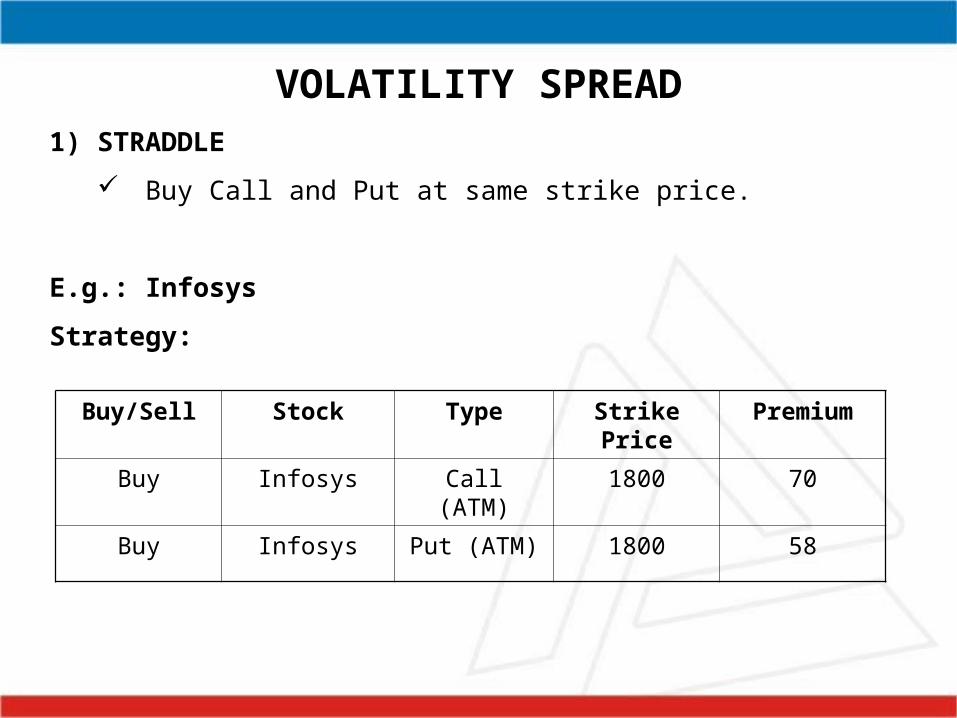
VOLATILITY SPREAD1) STRADDLE
Buy Call and Put at same strike price.
E.g.: Infosys
Strategy:
Buy/Sell Stock Type Strike Price Premium
Buy Infosys Call (ATM) 1800 70
Buy Infosys Put (ATM) 1800 58
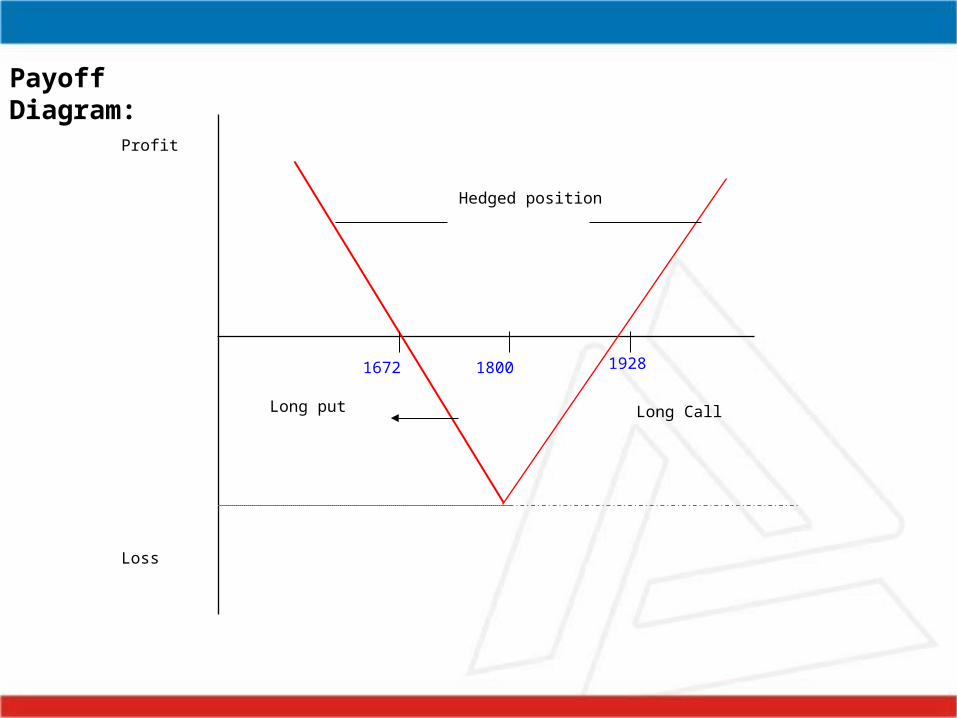
Payoff Diagram:
1672
Hedged position
Long CallLong put
Profit
Loss
1800 1928
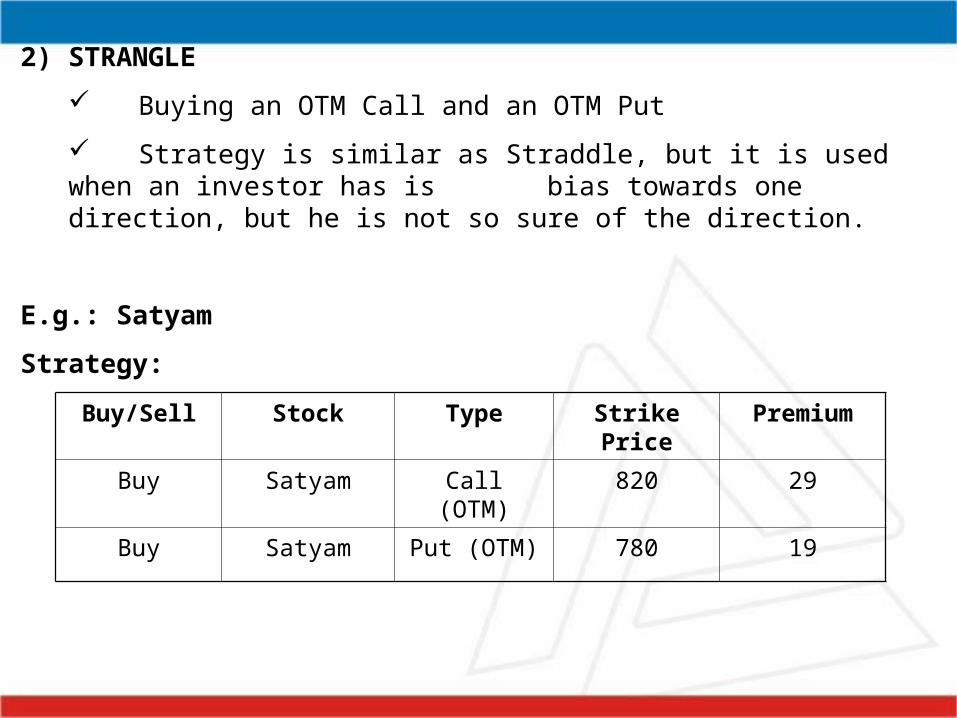
2) STRANGLE
Buying an OTM Call and an OTM Put
Strategy is similar as Straddle, but it is used when an investor has is bias towards one direction, but he is not so sure of the direction.
E.g.: Satyam
Strategy:
Buy/Sell Stock Type Strike Price Premium
Buy Satyam Call (OTM) 820 29
Buy Satyam Put (OTM) 780 19
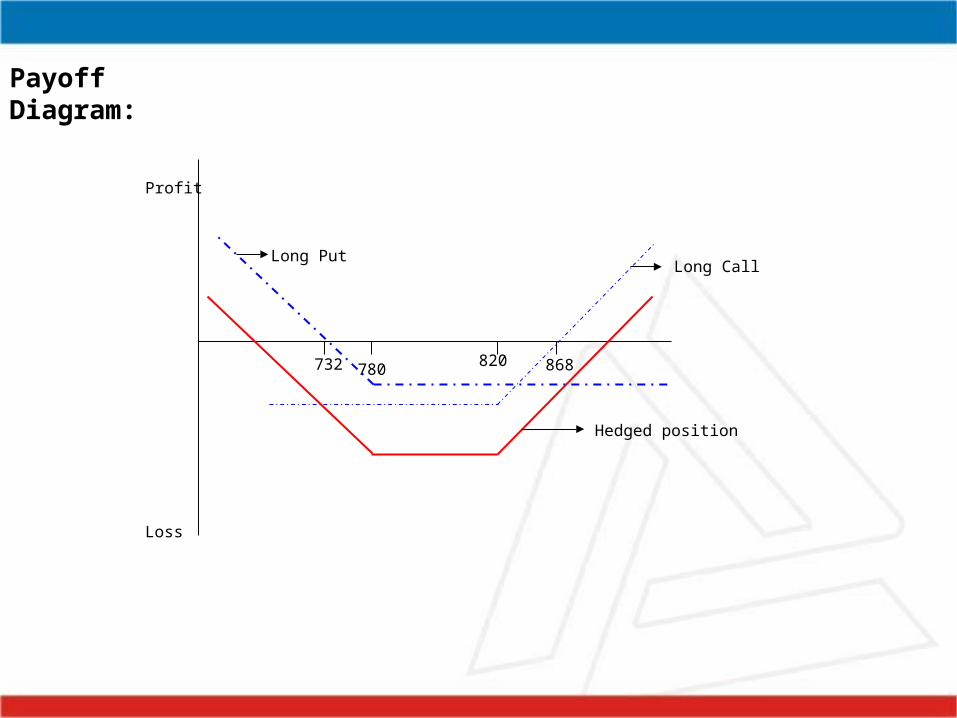
Payoff Diagram:
780820 868732
Long PutLong Call
Hedged position
Profit
Loss
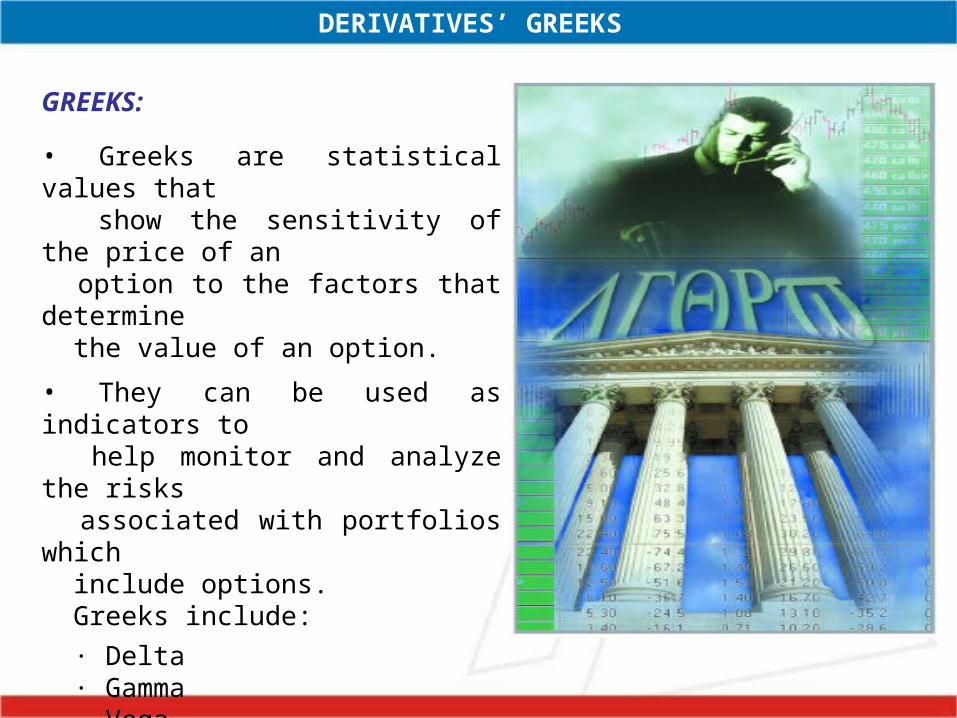
DERIVATIVES’ GREEKS
GREEKS:
• Greeks are statistical values that show the sensitivity of the price of an option to the factors that determine the value of an option.
• They can be used as indicators to help monitor and analyze the risks associated with portfolios which include options. Greeks include:
· Delta · Gamma · Vega · Theta · Rho
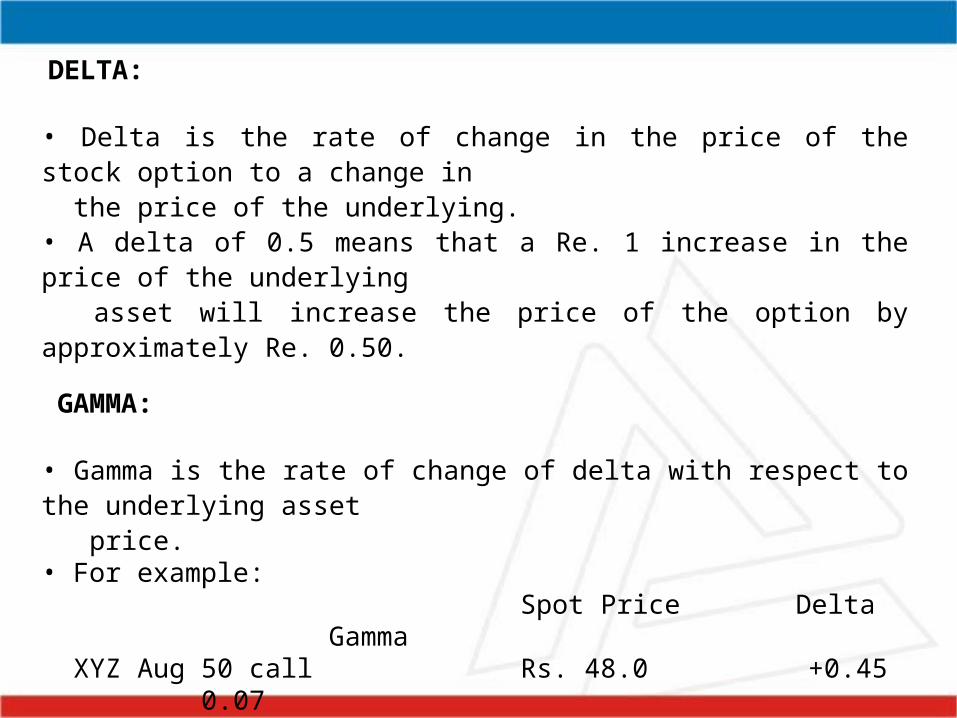
DELTA:
• Delta is the rate of change in the price of the stock option to a change in the price of the underlying.• A delta of 0.5 means that a Re. 1 increase in the price of the underlying asset will increase the price of the option by approximately Re. 0.50. GAMMA:
• Gamma is the rate of change of delta with respect to the underlying asset price. • For example:
Spot Price Delta Gamma XYZ Aug 50 call Rs. 48.0 +0.45 0.07 Rs. 49.0 +0.52
Rs. 47.0 +0.35• If gamma is small, delta changes slowly whereas if gamma is large delta is very sensitive to the price of the underlying
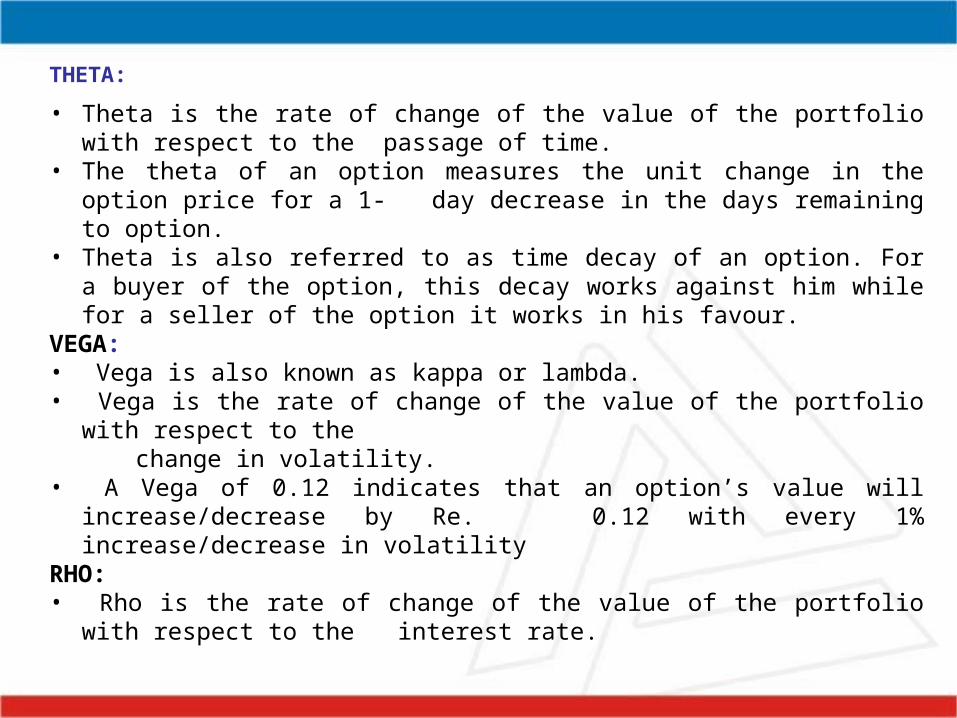
THETA:
• Theta is the rate of change of the value of the portfolio with respect to the passage of time.
• The theta of an option measures the unit change in the option price for a 1- day decrease in the days remaining to option.
• Theta is also referred to as time decay of an option. For a buyer of the option, this decay works against him while for a seller of the option it works in his favour.
VEGA: • Vega is also known as kappa or lambda. • Vega is the rate of change of the value of the portfolio with respect to the change in volatility. • A Vega of 0.12 indicates that an option’s value will increase/decrease by Re.
0.12 with every 1% increase/decrease in volatilityRHO:• Rho is the rate of change of the value of the portfolio with respect to the
interest rate.
DERIVATIVES REPORT
• DERISMART
• DERISTRAT
• DERIWATCH
• PAIR STARTEGY
• ROLLOVER ANALYSIS
MIB (Smart Net)
• Open Interest
• Put Call Ratio
• Implied Volatility
• Cash & Carry Arbitrage Opportunity
• Reverse Cash & Carry
• Bulletin Board
Thank You