Embed Size (px)
Citation preview
Stockholm Institute of Transition Economics (SITE) Stockholm School of Economics Box 6501 SE-113 83 Stockholm Sweden
Stockholm Institute of Transition Economics
WORKING PAPER
February 2012
No. 15
Crisis Prevention and Management
What Worked in the 2008/2009 Crisis?
Torbjörn Becker
Working papers from Stockholm Institute of Transition Economics (SITE) are preliminary by nature, and are circulated to promote discussion and critical comment. The views expressed here are the authors’ own and not necessarily those of the Institute or any other organization or institution.

Crisis prevention and management: What worked in the 2008/09 crisis?*
Torbjörn Becker**
Abstract This paper takes a systematic look at the economic impact of the crisis that started in earnest in the fall of 2008 across countries and regions. Despite warnings of growing domestic and external imbalances in many countries years ahead of the crisis, the massive impact of the crisis came as a surprise to most. By correlating economic performance in the crisis with an extensive set of early warning, country insurance, and policy indicators, this paper provides some lessons on crisis prevention and management for the future. Although significant efforts have been made to develop robust early warnings systems, the paper shows the mixed success of some commonly analyzed indicators in predicting economic outcomes in this crisis. The only robust early warning indicator was increases in real estate prices while international reserves seem to have insured against the worst crisis outcomes on average. However, much work on building a robust early warning system remains and the analytical and empirical challenges in this area are substantial. The issues confronting early warning systems are also relevant to the more recent field of macro prudential supervision and regulation. Nevertheless, the cost of crises is massive and preventing future ones with better regulation, policies and supervision based on solid research must be a top priority among policy makers and academics alike.
Keywords: economic crisis, crisis prevention, early warning indicators
JEL codes: E6, F3, F4
* The author is grateful to Steven Rosefielde for encouraging this project and for his great patience in providing
many valuable comments and suggestions to improve the paper. Many thanks also to seminar participants at SITE and to Evelina Bonnier and Bogdan Klishchuk for expert research assistance. Remaining shortcomings are of course the author’s sole responsibility. ** SITE, Stockholm School of Economics, P.O. Box 6501,113 83 Stockholm. Email: [email protected].
2
1. Introduction This paper discusses prevention and crisis management strategies that have developed over several decades before the crisis of 2008-09. It then provides a detailed empirical examination of how key economic indicators identified after previous crises correlate with economic performance in the 2008-09 crisis. This examination is closely related to long-running efforts to develop early warning indicators of crises and more recent discussion of macro-prudential indicators as ways to prevent crises.1 As will be evident in the chapter, the cost of crises is in many cases very substantial and ways to prevent or limit the impact of crises should be a top priority among economists and policy makers. However, the chapter illustrates the weaknesses of many of the current early warning indicators, which suggests that more research efforts in this area are called for. The empirical part also details the geographic impact of the crisis and offers some perspective on its global scope. Economic crises are not new phenomena. Policy makers have pondered how to prevent and deal with them for centuries. The definition of “crisis” has differed over time and across countries, and has been used to describe a wide range of diverse phenomena including for example debt, banking, currency, oil, and food related events. The crisis label is also used extensively to describe economic problems at the regional and country level, e.g., the Latin American, Asian, Russian, ERM (European Exchange Rate Mechanism) or Nordic crisis. Becker and Mauro (2006) focus on economic crises defined as episodes with substantial losses of GDP and document the frequency of these events over the last century for the countries included in the Maddison (2003) dataset. GDP was selected as the key crisis indicator because it is closely related to consumption and welfare. The authors show that output crises occurred throughout the 20th century, but the number of countries entering a crisis has varied substantially over time. The peak was the great depression, when 45 percent of the countries in the sample experienced the onset of a crisis. In the post-war period, the frequency varies between 2-10 percent, and at the end of the century, only 2-5 percent of countries entered into crisis. If countries want to prevent output losses, a first step is to investigate their triggers or correlates. Becker and Mauro accomplish this by relating the onset of a GDP crisis to a large number of shocks, such as debt, banking, currency and oil crises. The list of shocks also includes sudden stops in capital flows, drastic changes in terms of trade, sharp international interest rate movements, political crises, conflicts and disasters. The authors then use shock frequency data, together with information on output losses and conditional probabilities that link output losses to shocks to compute the expected value of losses for different types of countries. It turns out that sudden stops in capital flows are particularly harmful to emerging markets, while terms-of-trade shocks are correlated with extreme income losses in developing countries. Other shocks,
1 Kaminsky, Lizondo and Reinhart (1998) present a first early warning model of currency crises, later enhanced by Berg and Pattillio (1999), while for example Kaminsky and Reinhart (1999) focus on banking crises and Manasse and Roubini (2005) on debt crises.
3
such as political, currency and debt crises also carry substantial costs. In the current crisis (the 2008-2009 crisis and its lingering aftermath), a variety of shocks hit many countries at the same time. Around half the 183 countries in the IMF’s World Economic Outlook database experienced a decline in GDP. It is premature to make a final account of how many countries will experience output collapses as defined in Becker and Mauro (2006) because most have not yet returned to pre-crisis GDP levels, but the figure surely will be the highest since the great depression. It is also clear that banking problems, overvalued currencies, sudden stops in capital flows and massive swings in terms-of-trade all occurring simultaneously have contributed to this crisis’s global scale, in line with the correlates identified by Becker and Mauro. The remainder of this chapter is organized in four sections. First, we look at regional economic performance, followed by an extensive section on crisis prevention detailing how early warning indicators and prevention measures correlate with economic performance. A section on crisis management discussing domestic and international responses to the crisis is provided next, before drawing lessons in the conclusion.
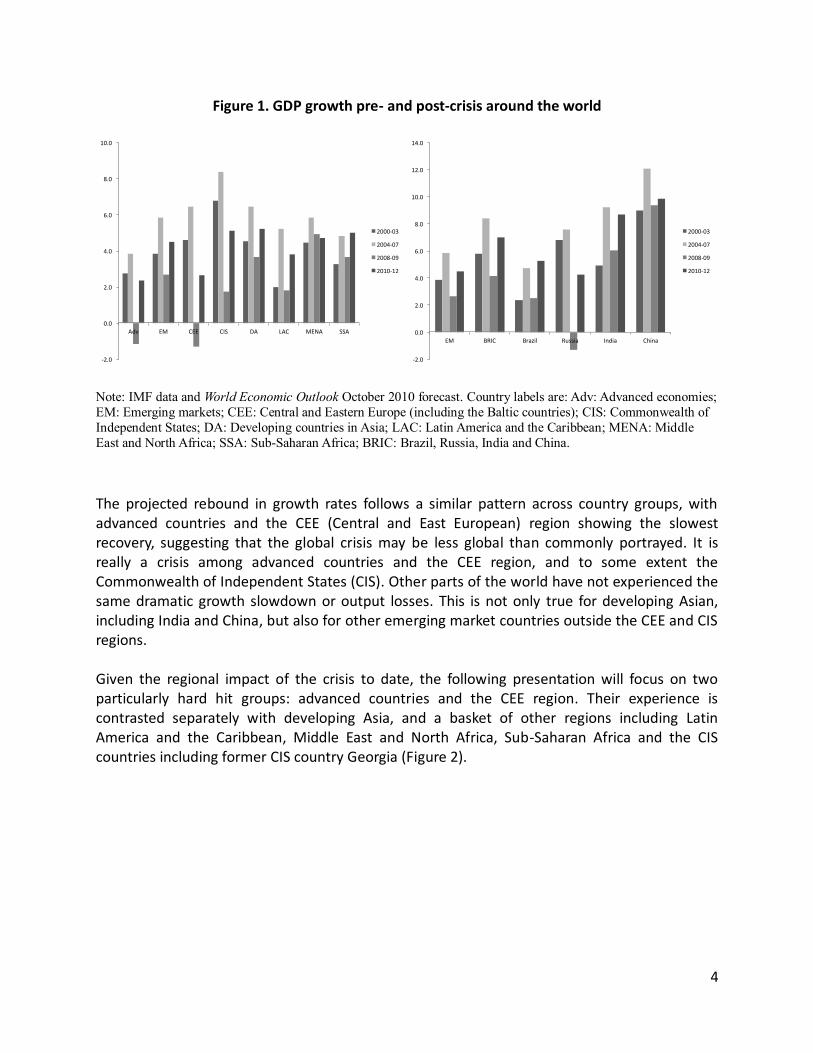
2. Economic performance in the crisis The 2008-2009 crisis was global, but its impact was uneven across countries and regions. This section documents the phenomenon. It reveals that the 2008-2009 was atypically concentrated in advanced countries, unlike much of the postwar period where emerging markets crises were more prevalent.2 Compared to 2004-2007, growth rates during the current crisis receded in all country groups. However, it was only in advanced countries and the nations of Central and Eastern Europe that growth rates turned negative on average in 2008-2009. Furthermore, in developing Asia, Latin America and the Caribbean, Middle East and North Africa and Sub-Saharan Africa, crisis growth rates were comparable to growth in 2000-2003, and it is pre-crisis growth rates that look abnormally high. This is also true for the BRIC (Brazil, Russia, India and China) countries except Russia, which suffered a significant drop in growth rates in the crisis, well below pre-crisis rates (Figure 1).
2 There are now a number of studies that have looked at the economic impact of the crisis and its correlates, see for example Berkmen, Gelos, Rennhack, and Walsh (2009), Lane and Milesi-Feretti (2010), Frankel and Saravelos (2010), Barrell, Davis, Karim, Liadze (2010). All these papers differ from the current analysis in either how the crisis impact is measured, the variables that are correlated with the crisis, the geographical coverage or regional breakdown and/or sample period. For a more extensive discussion focused on Central and Eastern Europe, see Becker et al (2010).
4
Figure 1. GDP growth pre- and post-crisis around the world
Note: IMF data and World Economic Outlook October 2010 forecast. Country labels are: Adv: Advanced economies;
EM: Emerging markets; CEE: Central and Eastern Europe (including the Baltic countries); CIS: Commonwealth of
Independent States; DA: Developing countries in Asia; LAC: Latin America and the Caribbean; MENA: Middle
East and North Africa; SSA: Sub-Saharan Africa; BRIC: Brazil, Russia, India and China.
The projected rebound in growth rates follows a similar pattern across country groups, with advanced countries and the CEE (Central and East European) region showing the slowest recovery, suggesting that the global crisis may be less global than commonly portrayed. It is really a crisis among advanced countries and the CEE region, and to some extent the Commonwealth of Independent States (CIS). Other parts of the world have not experienced the same dramatic growth slowdown or output losses. This is not only true for developing Asian, including India and China, but also for other emerging market countries outside the CEE and CIS regions. Given the regional impact of the crisis to date, the following presentation will focus on two particularly hard hit groups: advanced countries and the CEE region. Their experience is contrasted separately with developing Asia, and a basket of other regions including Latin America and the Caribbean, Middle East and North Africa, Sub-Saharan Africa and the CIS countries including former CIS country Georgia (Figure 2).
-2.0
0.0
2.0
4.0
6.0
8.0
10.0
Adv EM CEE CIS DA LAC MENA SSA
2000-03
2004-07
2008-09
2010-12
-2.0
0.0
2.0
4.0
6.0
8.0
10.0
12.0
14.0
EM BRIC Brazil Russia India China
2000-03
2004-07
2008-09
2010-12
5
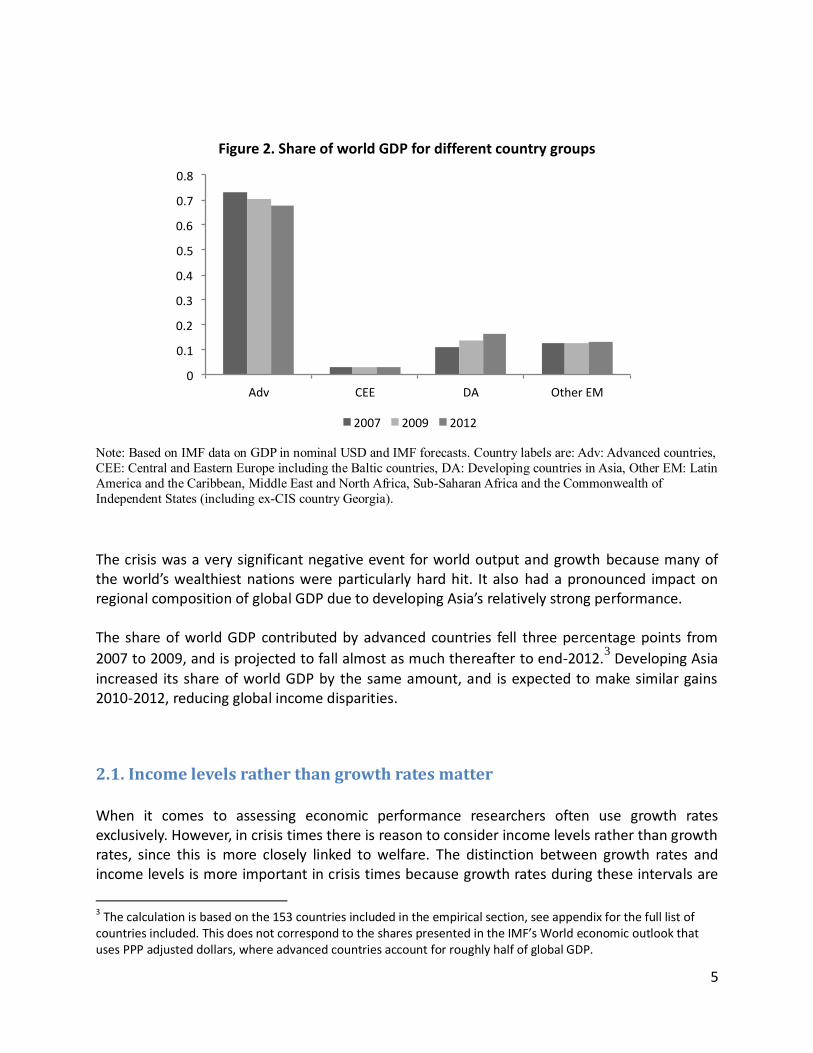
Figure 2. Share of world GDP for different country groups
Note: Based on IMF data on GDP in nominal USD and IMF forecasts. Country labels are: Adv: Advanced countries,
CEE: Central and Eastern Europe including the Baltic countries, DA: Developing countries in Asia, Other EM: Latin
America and the Caribbean, Middle East and North Africa, Sub-Saharan Africa and the Commonwealth of
Independent States (including ex-CIS country Georgia).
The crisis was a very significant negative event for world output and growth because many of the world’s wealthiest nations were particularly hard hit. It also had a pronounced impact on regional composition of global GDP due to developing Asia’s relatively strong performance. The share of world GDP contributed by advanced countries fell three percentage points from
2007 to 2009, and is projected to fall almost as much thereafter to end-2012.3 Developing Asia
increased its share of world GDP by the same amount, and is expected to make similar gains 2010-2012, reducing global income disparities.
2.1. Income levels rather than growth rates matter When it comes to assessing economic performance researchers often use growth rates exclusively. However, in crisis times there is reason to consider income levels rather than growth rates, since this is more closely linked to welfare. The distinction between growth rates and income levels is more important in crisis times because growth rates during these intervals are
3 The calculation is based on the 153 countries included in the empirical section, see appendix for the full list of countries included. This does not correspond to the shares presented in the IMF’s World economic outlook that uses PPP adjusted dollars, where advanced countries account for roughly half of global GDP.
0
0.1
0.2
0.3
0.4
0.5
0.6
0.7
0.8
Adv CEE DA OtherEM
2007 2009 2012
6
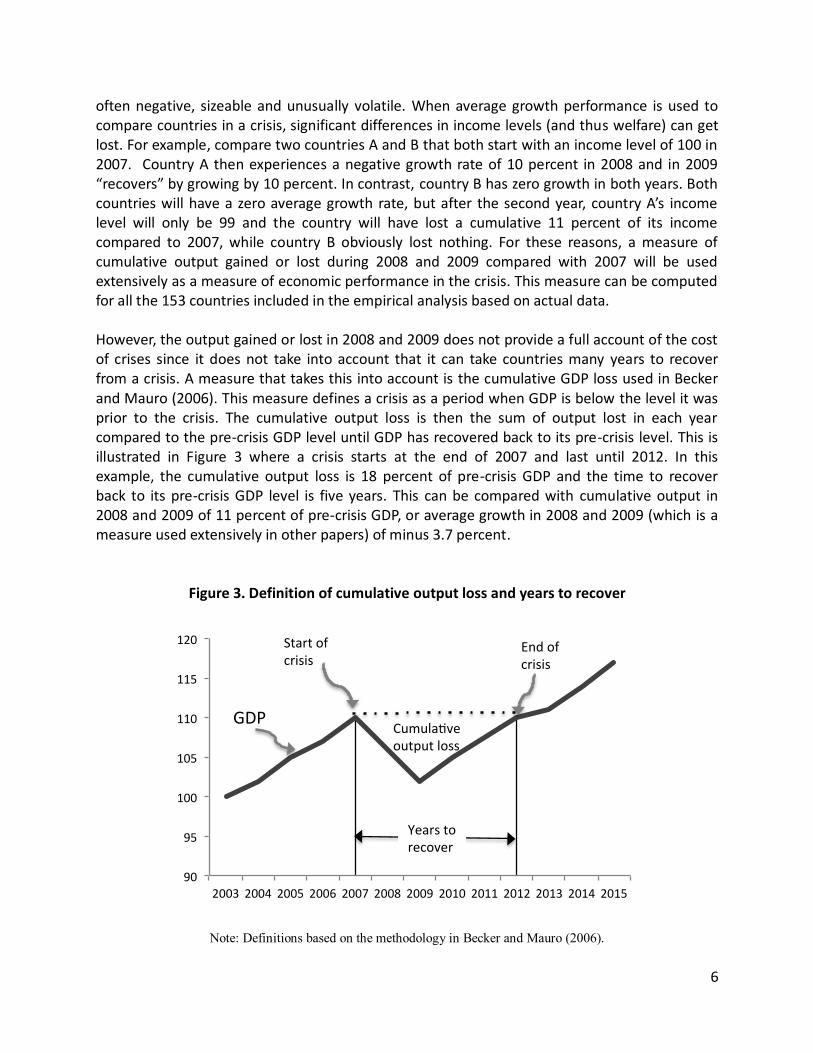
often negative, sizeable and unusually volatile. When average growth performance is used to compare countries in a crisis, significant differences in income levels (and thus welfare) can get lost. For example, compare two countries A and B that both start with an income level of 100 in 2007. Country A then experiences a negative growth rate of 10 percent in 2008 and in 2009 “recovers” by growing by 10 percent. In contrast, country B has zero growth in both years. Both countries will have a zero average growth rate, but after the second year, country A’s income level will only be 99 and the country will have lost a cumulative 11 percent of its income compared to 2007, while country B obviously lost nothing. For these reasons, a measure of cumulative output gained or lost during 2008 and 2009 compared with 2007 will be used extensively as a measure of economic performance in the crisis. This measure can be computed for all the 153 countries included in the empirical analysis based on actual data. However, the output gained or lost in 2008 and 2009 does not provide a full account of the cost of crises since it does not take into account that it can take countries many years to recover from a crisis. A measure that takes this into account is the cumulative GDP loss used in Becker and Mauro (2006). This measure defines a crisis as a period when GDP is below the level it was prior to the crisis. The cumulative output loss is then the sum of output lost in each year compared to the pre-crisis GDP level until GDP has recovered back to its pre-crisis level. This is illustrated in Figure 3 where a crisis starts at the end of 2007 and last until 2012. In this example, the cumulative output loss is 18 percent of pre-crisis GDP and the time to recover back to its pre-crisis GDP level is five years. This can be compared with cumulative output in 2008 and 2009 of 11 percent of pre-crisis GDP, or average growth in 2008 and 2009 (which is a measure used extensively in other papers) of minus 3.7 percent.
Figure 3. Definition of cumulative output loss and years to recover
Note: Definitions based on the methodology in Becker and Mauro (2006).
90
95
100
105
110
115
120
2003200420052006200720082009201020112012201320142015
Startofcrisis
Endofcrisis
Cumula veoutputloss
GDP
Yearstorecover
7
The Becker and Mauro (2006) methodology is applied to all of the countries that had a negative growth rate in at least one of the years 2008 and 2009, which then defines the start of the crisis for that country. The return to the pre-crisis GDP level is estimated by using the IMF World
Economic Outlook forecasts for the period 2010 to 2012.4 Since some countries will not have
returned to their pre-crisis GDP level in 2012 (the last year of this IMF forecast) the growth rate thereafter is assumed to be the projected 2012 growth rate. This measure is generated for all of the 77 countries that experienced an output loss in the crisis, or roughly half of the countries
included in the overall sample.5
The average growth rate in 2008 and 2009 and the cumulative output gain or loss in 2008 and 2009 can be computed for all countries based on actual data. These two measures are of course correlated with each other as well as with the cumulative output loss measure computed using the Becker and Mauro (2006) methodology but the correlations are far from perfect. Looking at the 77 countries for which we can compute all three measures, it is notable that only 36 of these countries also show a negative cumulative change over 2008-09 (since some were growing relatively well in 2008), while 45 countries show a negative average growth rate over the two years. The correlation between the cumulative output loss measure and the two others—average growth 2008-2009 and cumulative output 2008-2009—are 82 and 69 percent, respectively. In short, if income levels rather than growth rates matter, using growth rates to compare crisis performance can be misleading. Further more, since the duration of a crisis can differ between countries, just looking at the immediate impact and not the full path to recovery can also lead to the wrong conclusions.
4 The IMF forecast of course changes over time and the forecast used here is the October 2010 World Economic Outlook that was available when the main drafting of this chapter was done. The outlook has obviously changed for individual countries since then but the main messages of this chapter do not change because of this. 5 Becker and Mauro seeks to identify major output collapses and use two filters that remove output drops that last
for less than two years and are smaller than five percent of pre-crisis GDP. In this chapter, the focus is more generally on economic performance and the output loss measure is competed for all countries that had negative growth in at least one of the years 2008 and 2009, and the additional conditions that declines have to be at least 5 percent or last for at least two years have not been imposed here.
8
Figure 4. Regional comparison of crisis impact on GDP
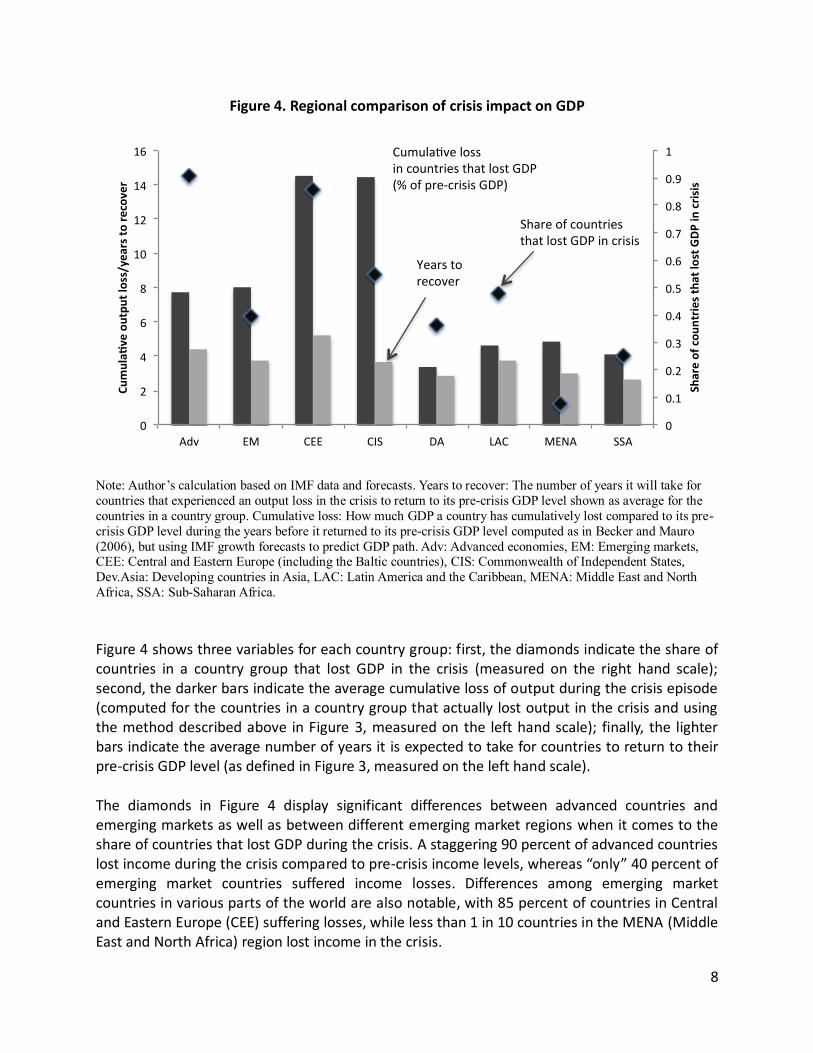
Note: Author’s calculation based on IMF data and forecasts. Years to recover: The number of years it will take for
countries that experienced an output loss in the crisis to return to its pre-crisis GDP level shown as average for the
countries in a country group. Cumulative loss: How much GDP a country has cumulatively lost compared to its pre-
crisis GDP level during the years before it returned to its pre-crisis GDP level computed as in Becker and Mauro
(2006), but using IMF growth forecasts to predict GDP path. Adv: Advanced economies, EM: Emerging markets, CEE: Central and Eastern Europe (including the Baltic countries), CIS: Commonwealth of Independent States,
Dev.Asia: Developing countries in Asia, LAC: Latin America and the Caribbean, MENA: Middle East and North
Africa, SSA: Sub-Saharan Africa.
Figure 4 shows three variables for each country group: first, the diamonds indicate the share of countries in a country group that lost GDP in the crisis (measured on the right hand scale); second, the darker bars indicate the average cumulative loss of output during the crisis episode (computed for the countries in a country group that actually lost output in the crisis and using the method described above in Figure 3, measured on the left hand scale); finally, the lighter bars indicate the average number of years it is expected to take for countries to return to their pre-crisis GDP level (as defined in Figure 3, measured on the left hand scale). The diamonds in Figure 4 display significant differences between advanced countries and emerging markets as well as between different emerging market regions when it comes to the share of countries that lost GDP during the crisis. A staggering 90 percent of advanced countries lost income during the crisis compared to pre-crisis income levels, whereas “only” 40 percent of emerging market countries suffered income losses. Differences among emerging market countries in various parts of the world are also notable, with 85 percent of countries in Central and Eastern Europe (CEE) suffering losses, while less than 1 in 10 countries in the MENA (Middle East and North Africa) region lost income in the crisis.
0
0.1
0.2
0.3
0.4
0.5
0.6
0.7
0.8
0.9
1
0
2
4
6
8
10
12
14
16
Adv EM CEE CIS DA LAC MENA SSA
Shareofcountriesthatlo
stGDPin
crisis
Cumula
veoutputloss/yearstorecover
ShareofcountriesthatlostGDPincrisis
Cumula velossincountriesthatlostGDP(%ofpre-crisisGDP)
Yearstorecover
9
In terms of cumulative output lost and years to recover to pre-crisis GDP, advanced and emerging market countries are more alike, with average cumulative GDP losses of around 8 percent of pre-crisis GDP (darker bars) and 4 years to return pre-crisis GDP levels (lighter bars). The regional picture is more diverse, with CEE and CIS losing on average close to 15 percent while average losses in Asia are estimated at only 3 percent of pre-crisis GDP (darker bars). There is also considerable variation within the different country groups that is not evident by looking at Figure 4. For example, in the advanced country group, Ireland is projected to lose 20 of output before it is back at its 2007 level and this is expected to take 8 years based on the low growth rates in the IMF forecasts, or twice the average for advanced countries. Within the CEE group, Latvia is projected to return to pre-crisis income levels only after 11 years after having lost a cumulative 42 percent of pre-crisis GDP or about three times the country group average. Furthermore, the massive initial drops in GDP in Latvia means that the cumulative output loss is substantially larger than the one projected for Ireland while the time it will take for the countries to return to pre-crisis GDP levels is of a more similar order of magnitude. These IMF forecasts from late 2010 are obviously already outdated when looking at individual countries, but the numbers on output losses and crisis duration illustrate the general point that the economic impact of crises can be massive and long-lived and just comparing initial changes in growth rates between countries can be misleading.
3. Crisis prevention strategies This section provides an overview of the lessons learned from previous crises, and the early warning indicators and strategies devised in various countries before 2008 to prevent
recurrences.6 It then empirically assesses the effectiveness of these preventive measures by
country and region.
3.1. Lessons from the past Crises aren’t news. They occurred often in the past three decades, including Latin America (1980s), Asia (1997), Russia (1998), Argentina (2000), ERM (1992) and Nordic countries (early 1990s), and all diversely influenced crisis prevention and management thinking prior to 2008. Capital flight linked with debt, banking and currency problems played a major role in emerging market crises. In the ERM and Nordic crisis, overvalued currencies and competitiveness were proximate causes, stemming more fundamentally from excess credit growth, real estate bubbles and an impaired banking sector. The overarching lesson taught by these crises was that a stable macroeconomic environment
6 Becker, Jeanne, Mauro, Ostry and Ranciere (2007) discuss how shocks affect countries at different stages of development and policies to protect against such shocks.
10
and a sound prevention regime were essential for forestalling domestic bubbles and effectively coping with external shocks. The key to achieving both objectives boiled down to identifying key variables capable of providing timely signals of impending crisis and acquiring the pertinent data on a standardized basis for the entire world economy. The International Monetary Fund (IMF) and other international bodies, rising to the challenge, mounted a major effort to devise a battery of reliable early warning indicators, and facilitate the effective monitoring of global
economic conditions.7
The IMF’s work on early warning systems started in earnest after the Mexican crisis in 1994 and was expanded in the aftermath of the Asian crisis in 1997, culminating in a comprehensive early warning model. Its Global Financial Stability Report (GFSR) (IMF, April 2008) contains a table presenting four vulnerability variables for 27 emerging market countries. They are: current account balances, private sector credit growth, changes in the ratio of private credit to GDP, and the external position of BIS reporting banks. Commodity price sensitivity, gross reserves to short
term external debt, inflation and the real policy rate variables were added in October 2008,8
and the country set expanded to 38.9 Further modifications were made in April 2009, during the
2008-09 crisis. External debt refinancing needs, loan to deposit ratios and the share of foreign currency deposits were added to the mix. Although specific indicators varied from set to set, all functioned as proxies for (excess) borrowing, especially in foreign currency or from foreign sources, and domestic macroeconomic imbalances. The variables chosen by the IMF contain both flows and stocks. For example, the current account balance is a flow variable related to the stock variables foreign debt and international reserves. It is unclear if early warning variables should focus on stocks or flows. For example, a sudden capital flow stoppage that causes a sharp current account deficit contraction can be harmful at relatively modest foreign debt levels, but the likelihood of the stoppage itself may depend on the magnitude of foreign debt relative to foreign reserves. The 2008 crisis also revealed another deficiency in the IMF’s early warning regime. The indicators didn’t adequately capture the complexity of the international financial system. They took no account of the sophisticated instruments employed by contemporary banking institutions, or cross border financial linkages. These omissions were to some extent remedied
7 The early warning model developed by Kaminsky, Reinhart and Lizondo (1998) and further developed by Berg and
Pattillio (1999) has led to a long line of early warning papers. Abiad (2003) provides an extensive survey and extension. Frankel and Saravelos (2010) extends the survey and also look at performance in the current crisis. Berg, Borensztein, and Pattillo (2005) look at how early warnings have worked in practice compared to various benchmarks, including some basic market indicators. Gosh, Ostry and Tamarisa (2009) provide a short, policy focused discussion of early warning systems. 8 The real policy rate in the table is defined as the interest rate set by the monetary authority deflated by the past year-on-year inflation rate, so it is not based on ex-ante expected inflation. 9 The change in private credit to GDP variable was dropped.
11
in the 2010 GFSR (IMF, 2010b) which presented a fresh table better attuned to the needs of advanced countries that contain new variables including market spreads, fiscal indicators,
external debt and the potential impact of the banking system on national fiscal accounts.10
The FSB and BIS recently began collaborating with the IMF in perfecting its crisis prevention regime (IMF, 2010c) and related work on macro-prudential frameworks complements this effort (see for example IMF 2011a and 2011b).
3.2. How did early warnings and crisis prevention measures correlate with economic performance in the crisis? The 2008 crisis promoted renewed calls for the creation of an effective crisis prevention regime. In this section, we will survey the effectiveness of prior crisis prevention regimes in terms of numerous variables grouped into three main categories: early warnings, policy choice instruments, and insurance measures. Table 1 lists these variables and reports their average values for the full sample of countries, clustered into four aggregates: advanced economies, CEE, developing Asia and the rest of the world (which includes LAC, MENA, SSA, and CIS). From the regional account of GDP performance presented earlier, we know that advanced countries and the CEE group were hardest hit by the crisis, and that developing Asia did relatively well. Did any or some of the variables listed in Table 1 reliably predict these outcomes? The answer is clearly yes. For example, CEE current account deficits were five times greater than those in developing Asia and other emerging markets before 2008. CEE credit growth was extreme. CEE housing prices rose faster than anywhere else; and CEE external debt to GDP ratios were twice the advanced country norm, and far greater than those of other groupings. All these indicators accurately sounded early warnings of impending crisis for the
CEE.11
Are any or some of the variables listed in Table 1 equally effective at the national level? Again, the answer is yes, but there aren’t sufficient numbers of independent observations to reliably
settle the matter with regressions.12
Simple scatter plots and correlations therefore must be
employed instead to assess predictive power, even if causal connections are opaque.13
Two
measures of output will be used for this purpose. The first is the cumulative output gain or loss
10 The IMF provided real figures and identified areas of potential vulnerabilities as shaded boxes in its April 2008 table. This changed in October 2008 when statistics were replaced by a color coded “heat map”. 11 The deficit indicator however gave a faulty reading for advanced countries, where fiscal deficit on average were more or less balanced. 12 In addition, the overlap of countries for some of these variables is imperfect which means that a regression with all the variables leaves a small number of observations to estimate quite a few coefficients. 13 Our indicators are subject to the usual ambiguities of endogeneity and causation. Pre-crisis macro, policy and insurance variables are used to minimize the endogeneity problem, but it doesn’t eliminate it. Given the nature of the crisis, where both its magnitude and timing were largely unanticipated, this is probably not a major concern.
12
2008-2009 available for 153 countries. The measure is applicable for all countries regardless of whether crisis period output contracts or expands. Sampling selection isn’t an issue, but the cumulative GDP change metric for the years 2008-09 doesn’t capture the full loss for countries that remained depressed beyond 2009. Therefore the cumulative output discussed above is computed for the 77 countries suffering protracted declines. As might be expected, predictive merit is sensitive to the output metric chosen, raising a variety of knotty practical issues.
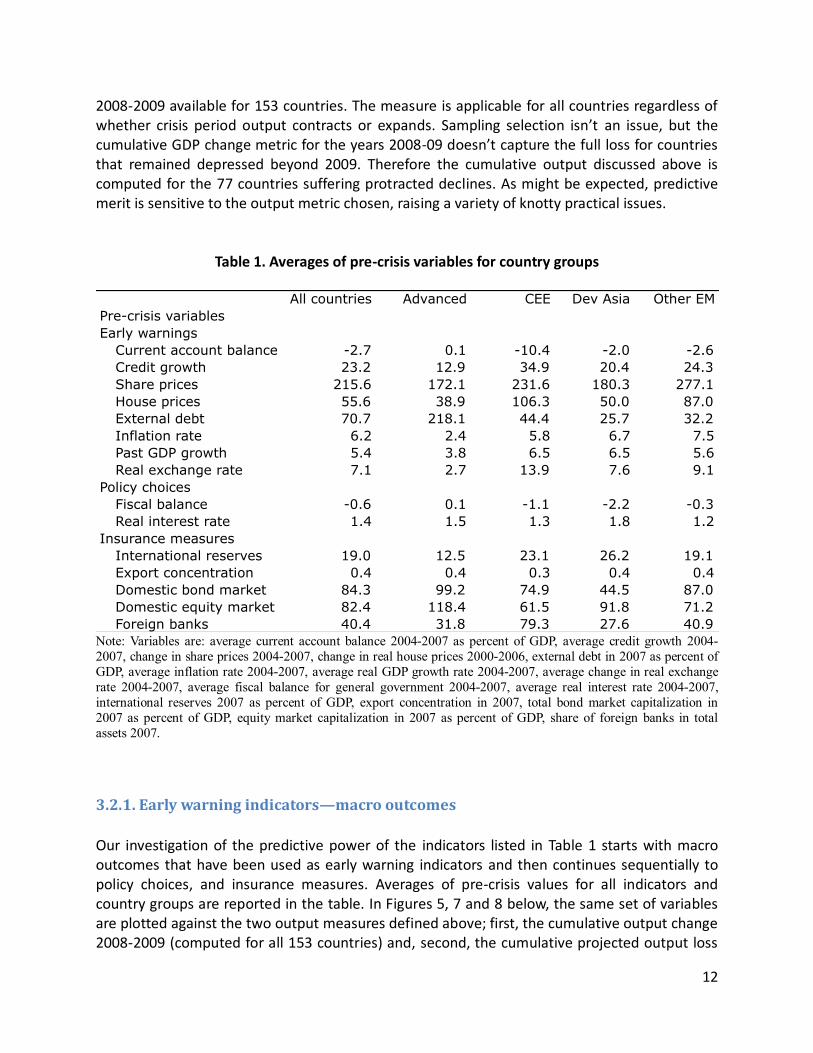
Table 1. Averages of pre-crisis variables for country groups
Note: Variables are: average current account balance 2004-2007 as percent of GDP, average credit growth 2004-
2007, change in share prices 2004-2007, change in real house prices 2000-2006, external debt in 2007 as percent of
GDP, average inflation rate 2004-2007, average real GDP growth rate 2004-2007, average change in real exchange
rate 2004-2007, average fiscal balance for general government 2004-2007, average real interest rate 2004-2007,
international reserves 2007 as percent of GDP, export concentration in 2007, total bond market capitalization in
2007 as percent of GDP, equity market capitalization in 2007 as percent of GDP, share of foreign banks in total
assets 2007.
3.2.1. Early warning indicators—macro outcomes
Our investigation of the predictive power of the indicators listed in Table 1 starts with macro outcomes that have been used as early warning indicators and then continues sequentially to policy choices, and insurance measures. Averages of pre-crisis values for all indicators and country groups are reported in the table. In Figures 5, 7 and 8 below, the same set of variables are plotted against the two output measures defined above; first, the cumulative output change 2008-2009 (computed for all 153 countries) and, second, the cumulative projected output loss
All countries Advanced CEE Dev Asia Other EM
Pre-crisis variables
Early warnings
Current account balance -2.7 0.1 -10.4 -2.0 -2.6
Credit growth 23.2 12.9 34.9 20.4 24.3
Share prices 215.6 172.1 231.6 180.3 277.1
House prices 55.6 38.9 106.3 50.0 87.0
External debt 70.7 218.1 44.4 25.7 32.2
Inflation rate 6.2 2.4 5.8 6.7 7.5
Past GDP growth 5.4 3.8 6.5 6.5 5.6
Real exchange rate 7.1 2.7 13.9 7.6 9.1
Policy choices
Fiscal balance -0.6 0.1 -1.1 -2.2 -0.3
Real interest rate 1.4 1.5 1.3 1.8 1.2
Insurance measures
International reserves 19.0 12.5 23.1 26.2 19.1
Export concentration 0.4 0.4 0.3 0.4 0.4
Domestic bond market 84.3 99.2 74.9 44.5 87.0
Domestic equity market 82.4 118.4 61.5 91.8 71.2
Foreign banks 40.4 31.8 79.3 27.6 40.9
13
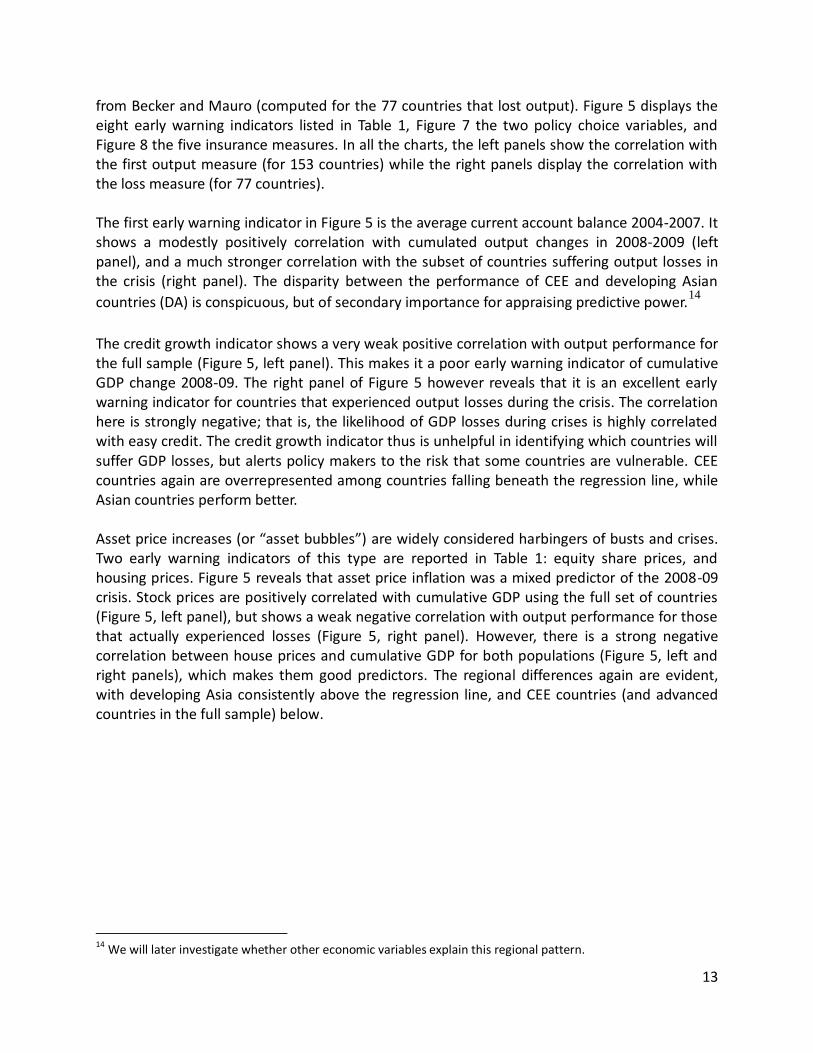
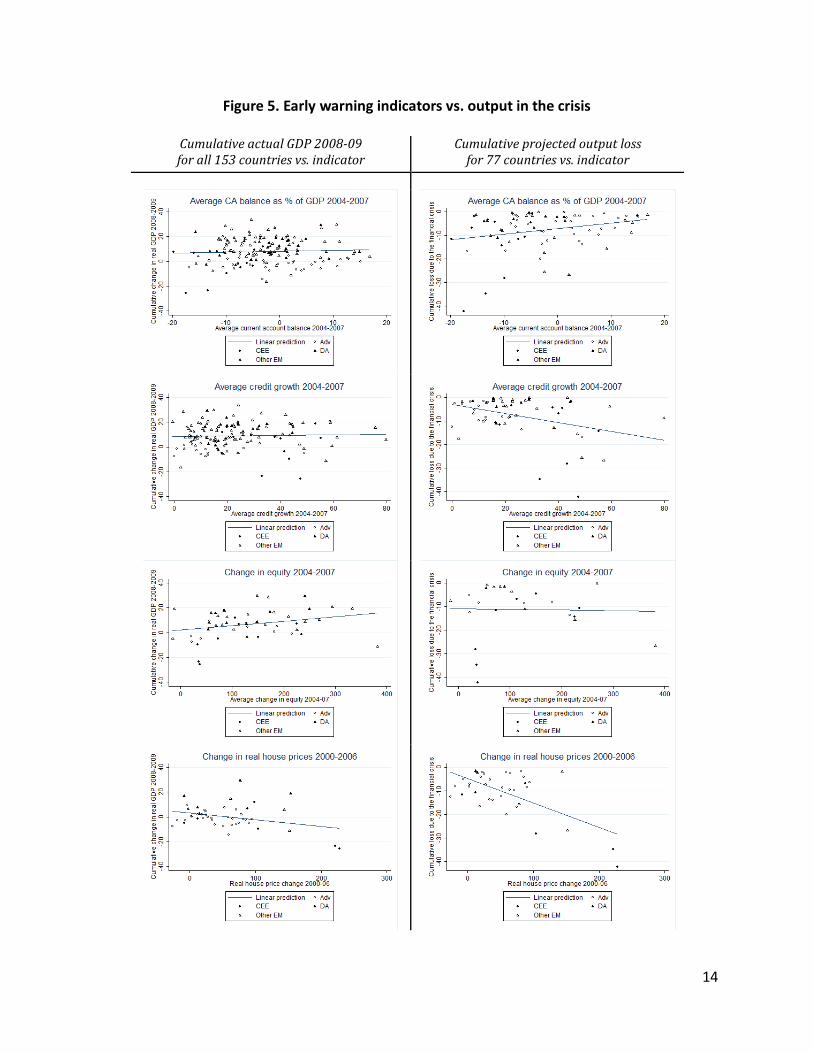
from Becker and Mauro (computed for the 77 countries that lost output). Figure 5 displays the eight early warning indicators listed in Table 1, Figure 7 the two policy choice variables, and Figure 8 the five insurance measures. In all the charts, the left panels show the correlation with the first output measure (for 153 countries) while the right panels display the correlation with the loss measure (for 77 countries). The first early warning indicator in Figure 5 is the average current account balance 2004-2007. It shows a modestly positively correlation with cumulated output changes in 2008-2009 (left panel), and a much stronger correlation with the subset of countries suffering output losses in the crisis (right panel). The disparity between the performance of CEE and developing Asian
countries (DA) is conspicuous, but of secondary importance for appraising predictive power.14
The credit growth indicator shows a very weak positive correlation with output performance for the full sample (Figure 5, left panel). This makes it a poor early warning indicator of cumulative GDP change 2008-09. The right panel of Figure 5 however reveals that it is an excellent early warning indicator for countries that experienced output losses during the crisis. The correlation here is strongly negative; that is, the likelihood of GDP losses during crises is highly correlated with easy credit. The credit growth indicator thus is unhelpful in identifying which countries will suffer GDP losses, but alerts policy makers to the risk that some countries are vulnerable. CEE countries again are overrepresented among countries falling beneath the regression line, while Asian countries perform better. Asset price increases (or “asset bubbles”) are widely considered harbingers of busts and crises. Two early warning indicators of this type are reported in Table 1: equity share prices, and housing prices. Figure 5 reveals that asset price inflation was a mixed predictor of the 2008-09 crisis. Stock prices are positively correlated with cumulative GDP using the full set of countries (Figure 5, left panel), but shows a weak negative correlation with output performance for those that actually experienced losses (Figure 5, right panel). However, there is a strong negative correlation between house prices and cumulative GDP for both populations (Figure 5, left and right panels), which makes them good predictors. The regional differences again are evident, with developing Asia consistently above the regression line, and CEE countries (and advanced countries in the full sample) below.
14 We will later investigate whether other economic variables explain this regional pattern.
14
Figure 5. Early warning indicators vs. output in the crisis
CumulativeactualGDP2008-09forall153countriesvs.indicator
Cumulativeprojectedoutputlossfor77countriesvs.indicator
15
Figure 5 (continued). Early warning indicators vs. output in the crisis
CumulativeactualGDP2008-09forall153countriesvs.indicator
Cumulativeprojectedoutputlossfor77countriesvs.indicator
16
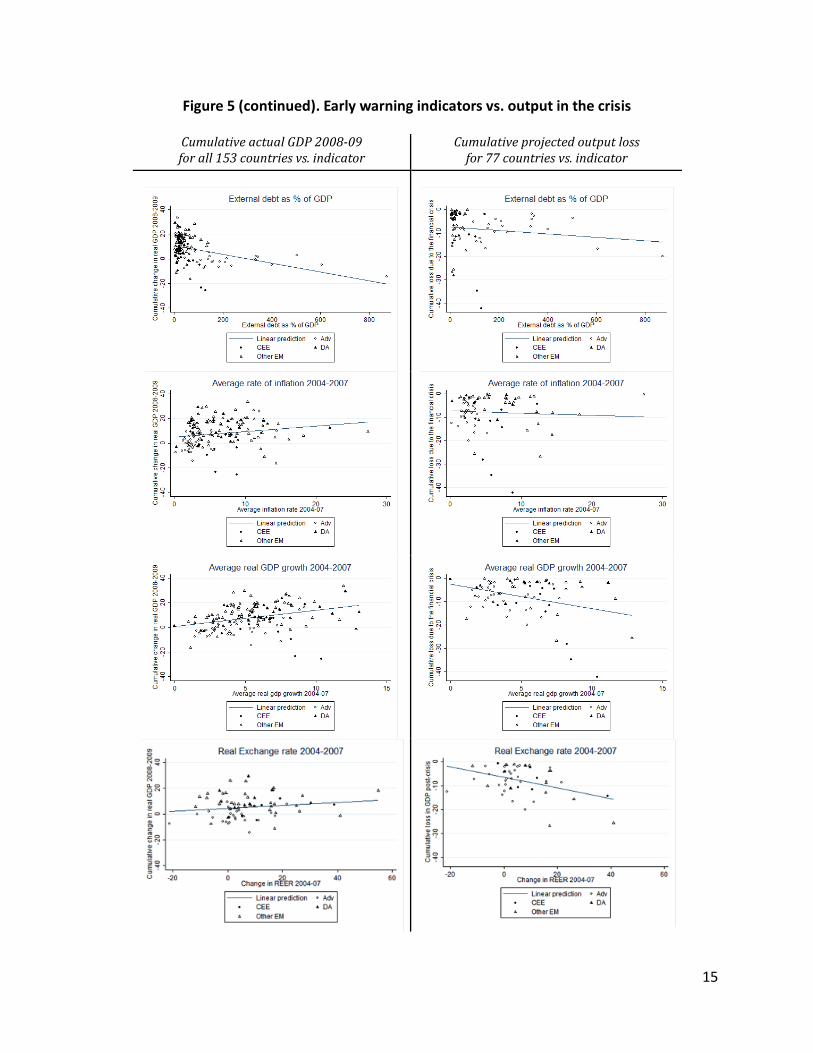
External debt also proves to be an accurate predictor, just as it was previously when applied exclusively to emerging market countries. It is negatively correlated with cumulative GDP change in both the full sample and sample of countries losing GDP 2008-09 (Figure 5, left and right panels). However, it should be noted that it is the advance countries that drive the correlations. In separate plots of emerging markets and regional country groups (not shown here) there are actually slight positive correlations between external debt and GDP growth. Inflation also is a mixed predictor. It is positively correlated with cumulative GDP change, and negatively correlated with the same metric for countries that lost GDP 2008-09 (Figure 5, left and right panels). Regional differences are evident as before with other indicators. CEE countries fall below the regression line, and Asian countries above it. Past GDP growth shows a positive correlation with cumulative output for the full sample of countries in 2008-09 and a negative correlation for countries that swooned into depression (Figure 5, left and right panel). As before, this mixed result tells us that the past GDP growth early warning indicator can serve only as a cautionary signal, not as a dependable predictor. The final early warning indicator plotted is the change in the real exchange rate prior to the crisis. Again we have a mixed predictor that shows a positive correlation with output in 2008-2009 for all countries (Figure 5, left panel), meaning that countries with appreciating real exchange rates prior to the crisis did relatively well during 2008-2009. However, for countries that lost output in the crisis, the correlation is negative (Figure 5, right panel), implying that reduced competitiveness prior to the crisis led to greater output losses for crisis struck countries.
3.2.2. Policy choices
Policy choice variables provide insight into macro-regulatory intentions of national governments. The two predictors listed in Table 1 are fiscal balances and real interest rates and the corresponding plots with output performance are shown in Figure 7 below. Fiscal deficits in Keynesian theory are thought to be stimulatory; surpluses either stabilizing or contractive. High real interest rates ceteris paribus are believed to be GDP growth retarding; low real interest rates expansionary. However, policy makers (in most cases) only seek to set a nominal policy interest rate, and the real interest rate is then a result of this rate and the realized inflation rate. Realized inflation is in turn a complex equilibrium macro outcome that does not only depend on the nominal policy rate but also on external and domestic balances that are linked to exchange rates and fiscal policy. Policy makers’ intentions therefore can be deduced from the handling of fiscal balances and real interest rates, providing clues about the likelihood of ensuing crises. This is best done however in conjunction with information about nations’ foreign exchange rate
17
regimes.15
The correlations reported later must be interpreted in this broad context.
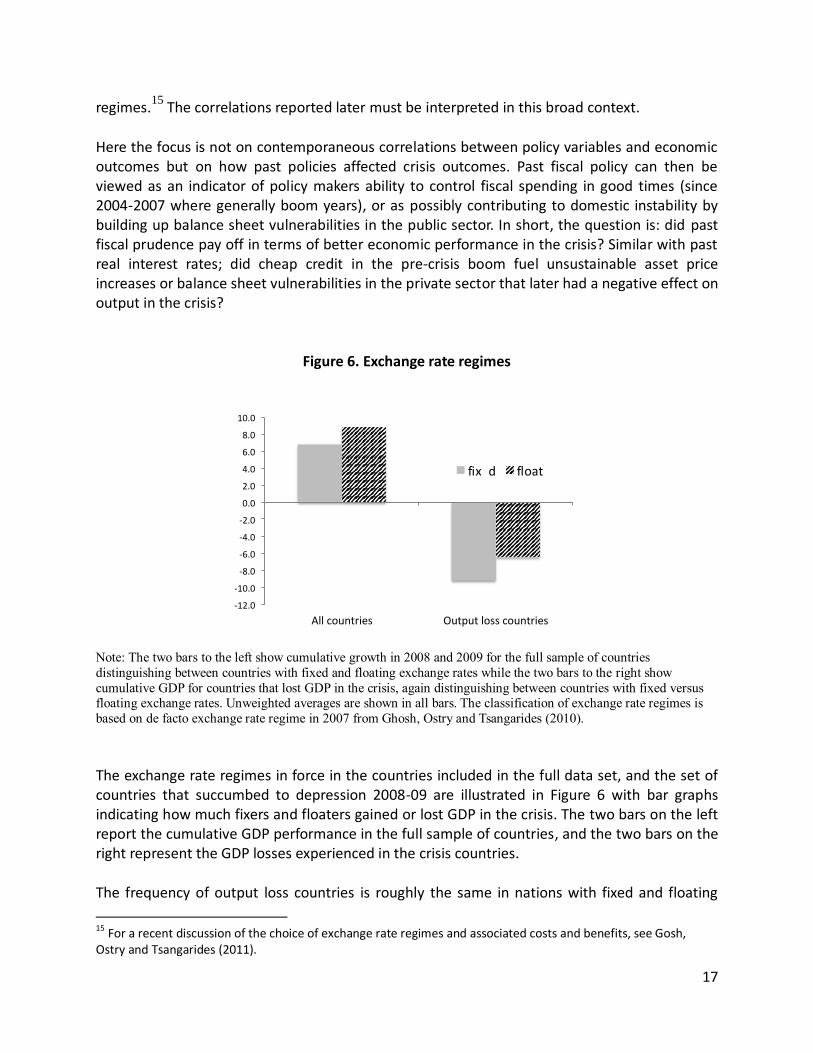
Here the focus is not on contemporaneous correlations between policy variables and economic outcomes but on how past policies affected crisis outcomes. Past fiscal policy can then be viewed as an indicator of policy makers ability to control fiscal spending in good times (since 2004-2007 where generally boom years), or as possibly contributing to domestic instability by building up balance sheet vulnerabilities in the public sector. In short, the question is: did past fiscal prudence pay off in terms of better economic performance in the crisis? Similar with past real interest rates; did cheap credit in the pre-crisis boom fuel unsustainable asset price increases or balance sheet vulnerabilities in the private sector that later had a negative effect on output in the crisis?
Figure 6. Exchange rate regimes
Note: The two bars to the left show cumulative growth in 2008 and 2009 for the full sample of countries
distinguishing between countries with fixed and floating exchange rates while the two bars to the right show
cumulative GDP for countries that lost GDP in the crisis, again distinguishing between countries with fixed versus floating exchange rates. Unweighted averages are shown in all bars. The classification of exchange rate regimes is
based on de facto exchange rate regime in 2007 from Ghosh, Ostry and Tsangarides (2010).
The exchange rate regimes in force in the countries included in the full data set, and the set of countries that succumbed to depression 2008-09 are illustrated in Figure 6 with bar graphs indicating how much fixers and floaters gained or lost GDP in the crisis. The two bars on the left report the cumulative GDP performance in the full sample of countries, and the two bars on the right represent the GDP losses experienced in the crisis countries. The frequency of output loss countries is roughly the same in nations with fixed and floating
15 For a recent discussion of the choice of exchange rate regimes and associated costs and benefits, see Gosh, Ostry and Tsangarides (2011).
-12.0
-10.0
-8.0
-6.0
-4.0
-2.0
0.0
2.0
4.0
6.0
8.0
10.0
Allcountries Outputlosscountries
fix
e
d float
18
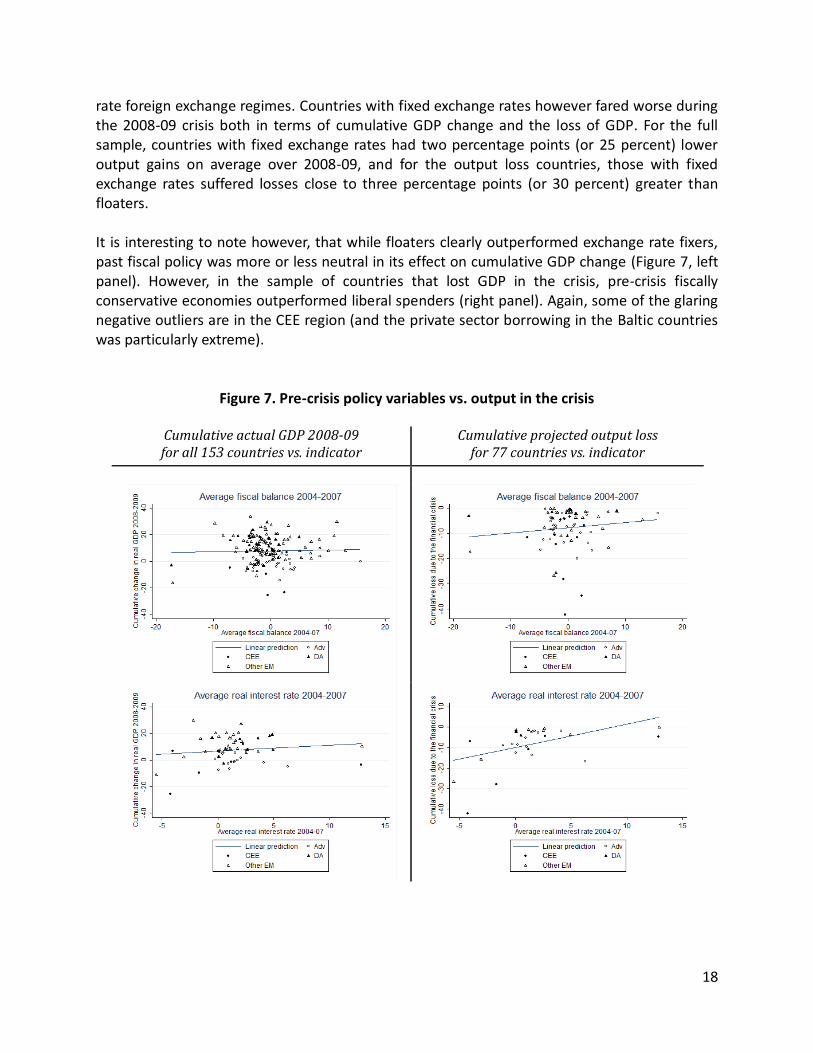
rate foreign exchange regimes. Countries with fixed exchange rates however fared worse during the 2008-09 crisis both in terms of cumulative GDP change and the loss of GDP. For the full sample, countries with fixed exchange rates had two percentage points (or 25 percent) lower output gains on average over 2008-09, and for the output loss countries, those with fixed exchange rates suffered losses close to three percentage points (or 30 percent) greater than floaters. It is interesting to note however, that while floaters clearly outperformed exchange rate fixers, past fiscal policy was more or less neutral in its effect on cumulative GDP change (Figure 7, left panel). However, in the sample of countries that lost GDP in the crisis, pre-crisis fiscally conservative economies outperformed liberal spenders (right panel). Again, some of the glaring negative outliers are in the CEE region (and the private sector borrowing in the Baltic countries was particularly extreme).
Figure 7. Pre-crisis policy variables vs. output in the crisis
CumulativeactualGDP2008-09forall153countriesvs.indicator
Cumulativeprojectedoutputlossfor77countriesvs.indicator
19
Macro-theorists consider the real interest rate a key barometer of domestic imbalances.16
Very
high rates can signal significant risk premia, and very low or even negative rates can be signs of slack investment demand. Cheap money has been a driving force in many financial crises and speculative asset price increases. The correlations between cumulative GDP change and the past real interest rate for both data pools are positive (Figure 7). Low real interest rates go hand in hand with poor GDP performance in both cases; consistent with the hypothesis that cheap credit creates vulnerabilities that lead to poor economic performance down the road. Again, the interpretation regarding the real interest rate as a policy variable or macro outcome is far from clear, but still it seems that on average, very low real interest rates have been correlated with poor performance in this crisis. If today’s low nominal policy rates also translate into low real interest rates (which is not always and everywhere true), this may not be all good news for financial stability and output growth in the future.
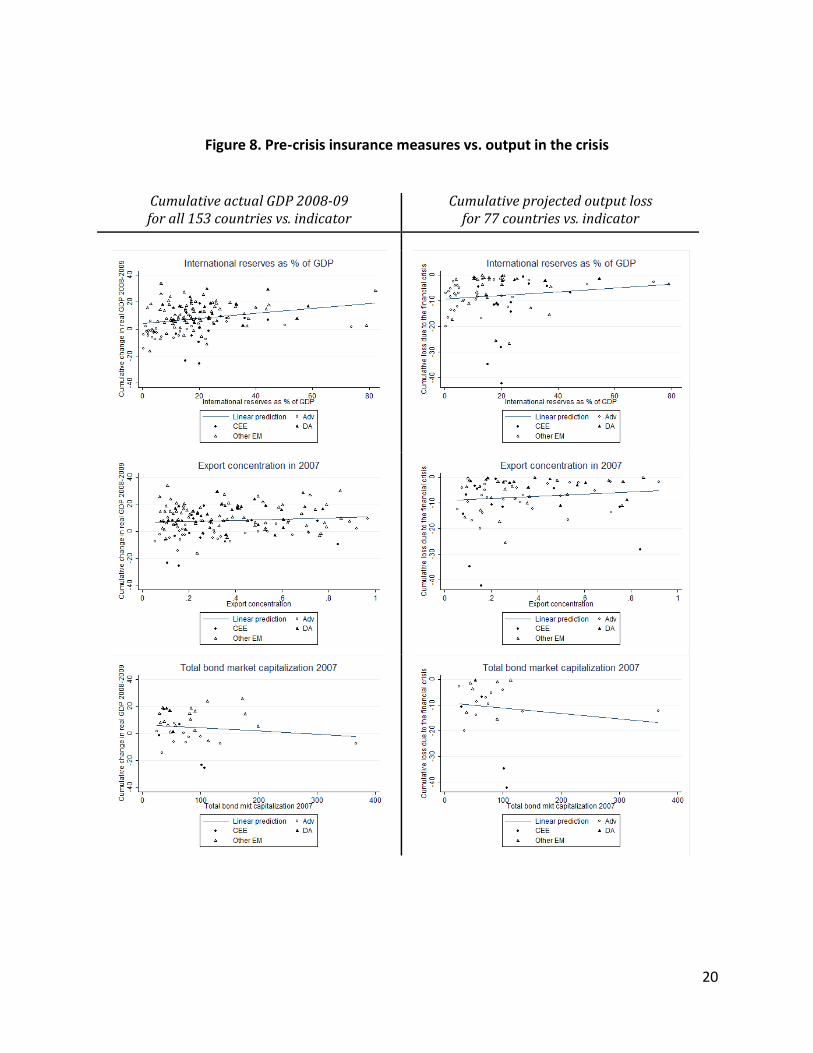
3.2.3. Country Insurance Deterioration in national crisis prevention safeguard systems provides a third set of crisis predictors. These country insurance indicators include international reserves; export concentration; size of the domestic capital market; and the share of foreign banks. Each variable represents a different vulnerability. Low reserves invite sudden stops in capital inflows or capital flight. Concentrated exports render nations vulnerable to shifts in terms of trade. Undeveloped domestic capital markets may indicate overreliance on foreign funding, while the absence of foreign competition in the banking systems could be a sign of an inefficient banking system. The different insurance indicators are plotted against output performance in Figure 8. International reserves can be accumulated for different reasons, including support for an export oriented growth strategy. However, it can also be viewed as buying insurance against sudden stoppages in capital inflows, which clearly has been a motive in some countries, not least in Asia where countries witnessed the effects of sharp capital flow reversals in the 1997 crisis. In the 2008-09 crisis holding larger international reserves has been positively correlated with better economic performance, both in the full sample and among the output loss countries (Figure 8, left and right panels). The real side of the foreign reserves phenomenon is changes in current account balances and separate plots (not shown here) indicated that there is a strong correlation between swings in current accounts and output performance, both in the full
sample and more strongly among the output loss countries.17
16 The real interest rate in micro theory is determined by “time preference” and under competition represents the inter-temporal equilibrium price of trading with the future. High and low interest rates affect the composition of GDP, but not its level. See Irving Fisher, The Theory of Interest, 1930. 17 These correlations include all changes in current accounts. However, if we filter the samples, limiting our attention to the countries experiencing sudden capital inflow stoppages (cases where pre-crisis current account deficits contracted sharply in the crisis), it turns out somewhat surprisingly the few countries experience sudden stoppages.
20
Figure 8. Pre-crisis insurance measures vs. output in the crisis
CumulativeactualGDP2008-09forall153countriesvs.indicator
Cumulativeprojectedoutputlossfor77countriesvs.indicator
21
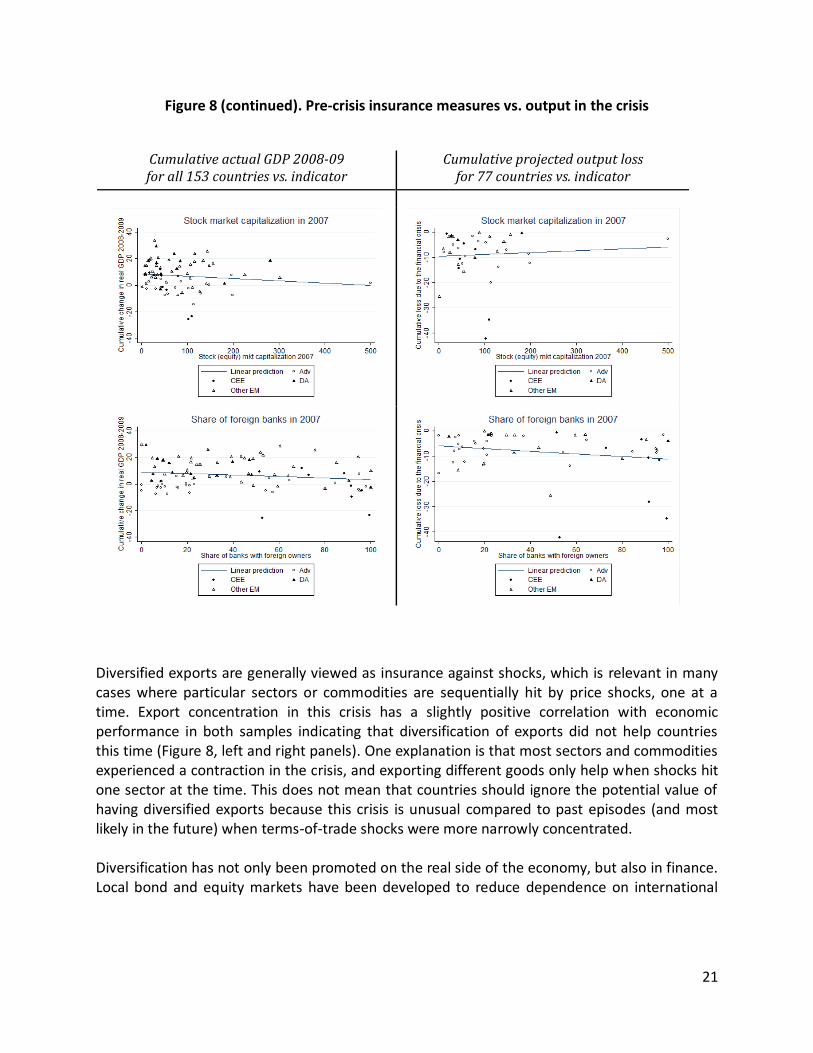
Figure 8 (continued). Pre-crisis insurance measures vs. output in the crisis
Diversified exports are generally viewed as insurance against shocks, which is relevant in many cases where particular sectors or commodities are sequentially hit by price shocks, one at a time. Export concentration in this crisis has a slightly positive correlation with economic performance in both samples indicating that diversification of exports did not help countries this time (Figure 8, left and right panels). One explanation is that most sectors and commodities experienced a contraction in the crisis, and exporting different goods only help when shocks hit one sector at the time. This does not mean that countries should ignore the potential value of having diversified exports because this crisis is unusual compared to past episodes (and most likely in the future) when terms-of-trade shocks were more narrowly concentrated. Diversification has not only been promoted on the real side of the economy, but also in finance. Local bond and equity markets have been developed to reduce dependence on international
CumulativeactualGDP2008-09forall153countriesvs.indicator
Cumulativeprojectedoutputlossfor77countriesvs.indicator
22
financial flows, and are construed here in this sense.18
However, the indicator may be blurred to
the extent that foreign investors account for a large share of a domestic market, or domestic investors behave like foreign investors in countries with relatively open capital accounts. If investors in local markets hedge currency risks and move capital in and out of a country’s domestic markets, a country with a large domestic market is also subject to risks of large capital flow reversals that affect exchange rates and funding opportunities in crisis times. In this crisis, the correlations between the size of domestic bond and equity markets and economic performance were slightly negative or non-existent, excluding some outliers (Figure 8, left and right panels). This should not deter efforts to develop domestic capital markets in countries that are lacking them because such development may have positive effects on various institutional factors important for long-run growth. However, in this crisis, domestic capital markets did not seem to improve economic performance. Given the negative role the financial sector has played in many countries in the 2008 crisis, this may not be too surprising. The lesson for a country that wants to develop its capital markets to enhance future growth prospects is that it is a good idea to think hard about regulation and supervision of these markets from the outset. Banks are another important part of the financial system and in many developing countries and emerging markets, the participation of foreign banks has been seen as a way to modernize and enhance domestic banking efficiency and stability. There is probably little doubt that foreign banks bring new skills and technologies to domestic banking markets, but the question here is whether this contributed to better output performance in the 2008-09 crisis. The correlation between the share of foreign banks in the domestic banking system and output performance is slightly negative in the full sample (Figure 8, left panel), and more strongly so among output loss countries (Figure 8, right panel). The share of foreign banks also is strongly correlated with current account balances. A larger share of foreign banks is associated with larger pre-crisis current account deficits. Current account deficits in turn have been shown above to be associated with inferior economic performance in this crisis, especially among output loss countries. If foreign banks provide easy access to foreign credit that allows unsustainable current account deficits, this may create a vulnerability that outweighs the benefits of a more efficient domestic banking system.
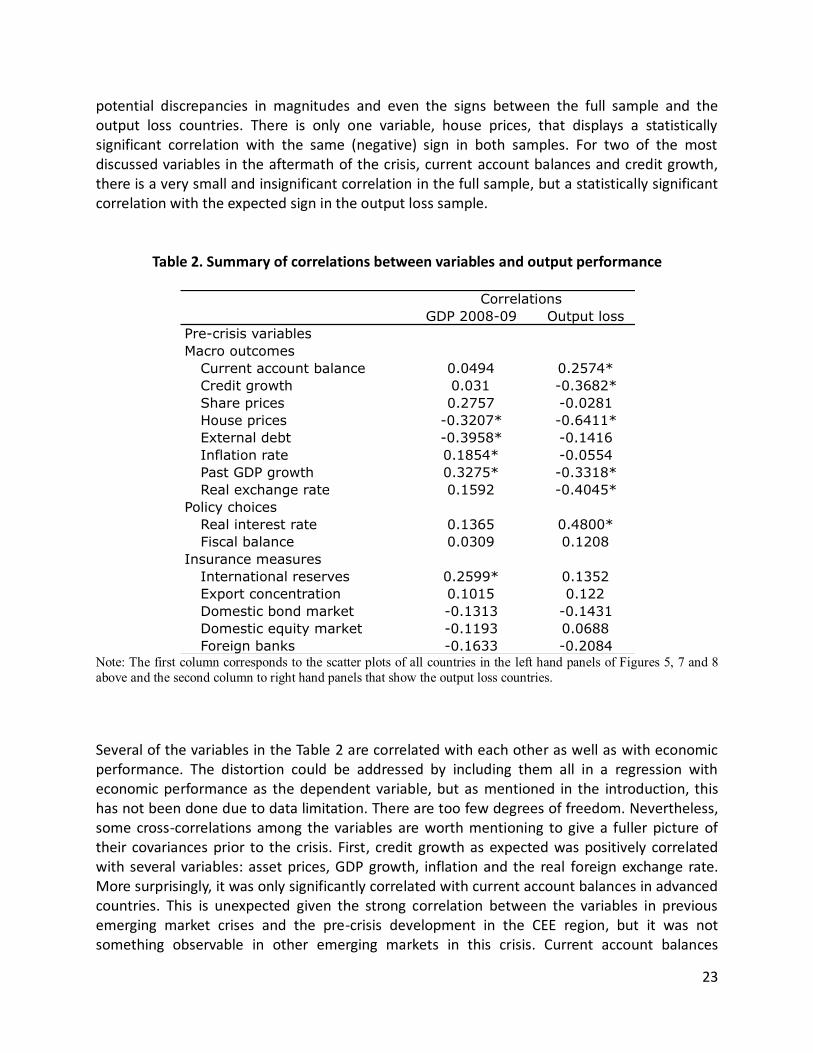
3.2.4. Summary of indicators and output performance The visual patterns in Figures 5, 7 and 8 are complemented with Table 2, which summarizes the numerical correlation estimates and their statisical significance. The data in Table 2 reveal that although correlations are informative, only a handful are statistically significant and there are
18 This characterization assumes that domestic capital markets provide services that international markets
do not, such as, allowing domestic entities to fund themselves with local currency instruments or by pulling in domestic savings into the financial systems that otherwise are used inefficiently.
23
potential discrepancies in magnitudes and even the signs between the full sample and the output loss countries. There is only one variable, house prices, that displays a statistically significant correlation with the same (negative) sign in both samples. For two of the most discussed variables in the aftermath of the crisis, current account balances and credit growth, there is a very small and insignificant correlation in the full sample, but a statistically significant correlation with the expected sign in the output loss sample.
Table 2. Summary of correlations between variables and output performance
Note: The first column corresponds to the scatter plots of all countries in the left hand panels of Figures 5, 7 and 8
above and the second column to right hand panels that show the output loss countries.
Several of the variables in the Table 2 are correlated with each other as well as with economic performance. The distortion could be addressed by including them all in a regression with economic performance as the dependent variable, but as mentioned in the introduction, this has not been done due to data limitation. There are too few degrees of freedom. Nevertheless, some cross-correlations among the variables are worth mentioning to give a fuller picture of their covariances prior to the crisis. First, credit growth as expected was positively correlated with several variables: asset prices, GDP growth, inflation and the real foreign exchange rate. More surprisingly, it was only significantly correlated with current account balances in advanced countries. This is unexpected given the strong correlation between the variables in previous emerging market crises and the pre-crisis development in the CEE region, but it was not something observable in other emerging markets in this crisis. Current account balances
GDP 2008-09 Output loss
Pre-crisis variables
Macro outcomes
Current account balance 0.0494 0.2574*
Credit growth 0.031 -0.3682*
Share prices 0.2757 -0.0281
House prices -0.3207* -0.6411*
External debt -0.3958* -0.1416
Inflation rate 0.1854* -0.0554
Past GDP growth 0.3275* -0.3318*
Real exchange rate 0.1592 -0.4045*
Policy choices
Real interest rate 0.1365 0.4800*
Fiscal balance 0.0309 0.1208
Insurance measures
International reserves 0.2599* 0.1352
Export concentration 0.1015 0.122
Domestic bond market -0.1313 -0.1431
Domestic equity market -0.1193 0.0688
Foreign banks -0.1633 -0.2084
Correlations
24
showed a significant negative correlation with house price increases in emerging market economies partly because the sample for which we have house prices is incomplete, and over-represents the CEE region. Current account balances also have been positively correlated with fiscal balances and with the share of foreign banks in the domestic banking system both in emerging markets and advanced countries.
4. Crisis management strategies When crisis prevention fails, crisis management has to step in to minimize the damage. Given that many crisis countries haven’t fully recovered, and the full experience is not observable, it is premature to make a conclusive assessment about the comparative merit of various crisis predictors, and intervention strategies. This section therefore is descriptive. Before turning to the quantitative matters, we provide a brief discussion of the lessons discernible from past crises.
4.1 Lessons from the past The key lesson from the past used at the onset of the 2008-09 crisis came from the widely held view that the severity of the great depression was attributable to governments’ failure to employ its full kit of policy tools. This lesson pertained exclusively to serious crisis situations; not “business as usual” monetary and fiscal policy, which over the years had increasingly become rules based and intervention averse. Accordingly, when Lehman Brothers’ bankruptcy threatened to devastate the global financial system in September 2008, contemporary macroeconomic theorists counseled energetic counter-crisis fiscal and monetary intervention, including bailouts for banks and other large financial institutions. This posture was mirrored by the IMF’s advice and the design of the economic rescue packages organized by the international community. Suddenly, Keynesian
policy was rehabilitated after having fallen from grace in the late 1990s.19
Many of these Keynesian prescriptions departed sharply from prior IMF policies recommended during and after the emerging market crises of the 1980’s and 90’s. These crisis management strategies stressed adjusting exchange rates to restore competitiveness and confidence, backed up with stringent fiscal and monetary policies aimed at preventing sovereign defaults, hyper inflation and free falling exchange rates. Unlike the “Washington consensus” applied during the Asian crisis in the late 1990s, it focused almost exclusively on macroeconomic factors, disregarding structural reforms presumably because market liberalization, subsidy reduction and privatization were regarded as subsidiary issues for advanced western economies.
19 See chapter 2, this volume. The insurgent “Ricardian Equivalence,” “Great Moderation,” and “Divine Coincidence” doctrines persuaded most macro-theorists that fiscal policy was ineffectual.
25
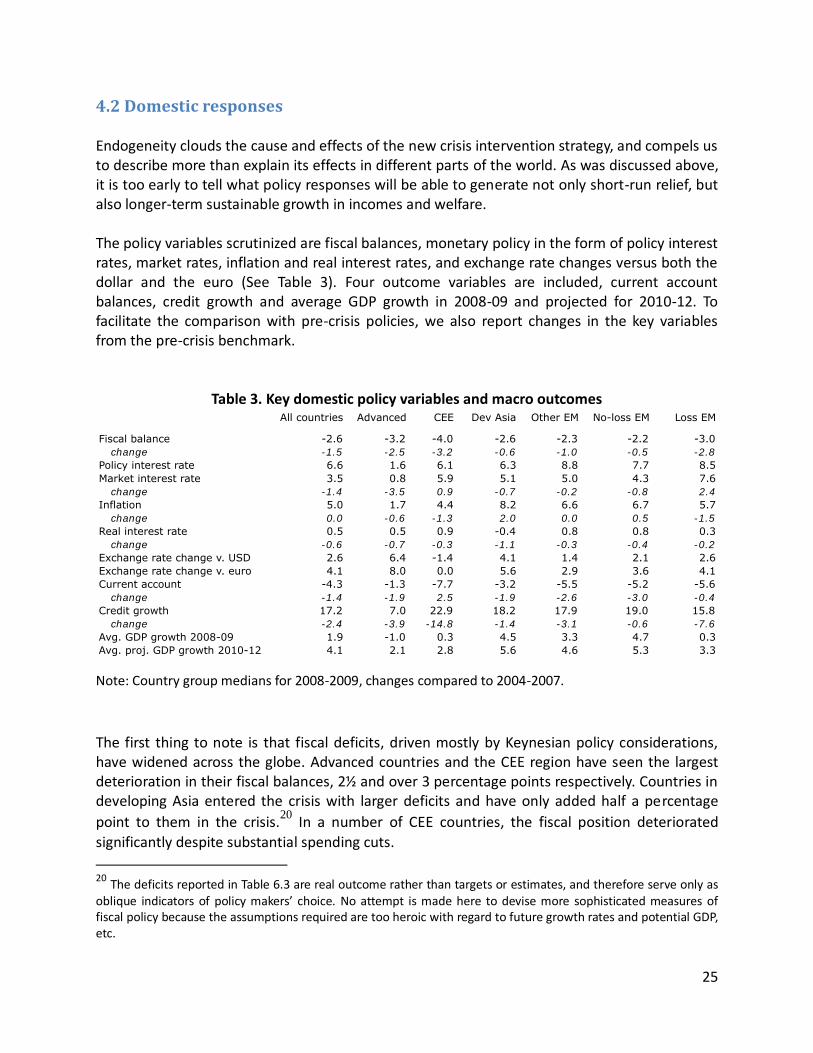
4.2 Domestic responses Endogeneity clouds the cause and effects of the new crisis intervention strategy, and compels us to describe more than explain its effects in different parts of the world. As was discussed above, it is too early to tell what policy responses will be able to generate not only short-run relief, but also longer-term sustainable growth in incomes and welfare. The policy variables scrutinized are fiscal balances, monetary policy in the form of policy interest rates, market rates, inflation and real interest rates, and exchange rate changes versus both the dollar and the euro (See Table 3). Four outcome variables are included, current account balances, credit growth and average GDP growth in 2008-09 and projected for 2010-12. To facilitate the comparison with pre-crisis policies, we also report changes in the key variables from the pre-crisis benchmark.
Table 3. Key domestic policy variables and macro outcomes
Note: Country group medians for 2008-2009, changes compared to 2004-2007.
The first thing to note is that fiscal deficits, driven mostly by Keynesian policy considerations, have widened across the globe. Advanced countries and the CEE region have seen the largest deterioration in their fiscal balances, 2½ and over 3 percentage points respectively. Countries in developing Asia entered the crisis with larger deficits and have only added half a percentage
point to them in the crisis.20
In a number of CEE countries, the fiscal position deteriorated
significantly despite substantial spending cuts.
20 The deficits reported in Table 6.3 are real outcome rather than targets or estimates, and therefore serve only as oblique indicators of policy makers’ choice. No attempt is made here to devise more sophisticated measures of fiscal policy because the assumptions required are too heroic with regard to future growth rates and potential GDP, etc.
All countries Advanced CEE Dev Asia Other EM No-loss EM Loss EM
Fiscal balance -2.6 -3.2 -4.0 -2.6 -2.3 -2.2 -3.0
change -1.5 -2.5 -3.2 -0.6 -1.0 -0.5 -2.8
Policy interest rate 6.6 1.6 6.1 6.3 8.8 7.7 8.5
Market interest rate 3.5 0.8 5.9 5.1 5.0 4.3 7.6
change -1.4 -3.5 0.9 -0.7 -0.2 -0.8 2.4
Inflation 5.0 1.7 4.4 8.2 6.6 6.7 5.7
change 0.0 -0.6 -1.3 2.0 0.0 0.5 -1.5
Real interest rate 0.5 0.5 0.9 -0.4 0.8 0.8 0.3
change -0.6 -0.7 -0.3 -1.1 -0.3 -0.4 -0.2
Exchange rate change v. USD 2.6 6.4 -1.4 4.1 1.4 2.1 2.6
Exchange rate change v. euro 4.1 8.0 0.0 5.6 2.9 3.6 4.1
Current account -4.3 -1.3 -7.7 -3.2 -5.5 -5.2 -5.6
change -1.4 -1.9 2.5 -1.9 -2.6 -3.0 -0.4
Credit growth 17.2 7.0 22.9 18.2 17.9 19.0 15.8
change -2.4 -3.9 -14.8 -1.4 -3.1 -0.6 -7.6
Avg. GDP growth 2008-09 1.9 -1.0 0.3 4.5 3.3 4.7 0.3
Avg. proj. GDP growth 2010-12 4.1 2.1 2.8 5.6 4.6 5.3 3.3
26
Keynesian monetary policy likewise has been expansionary. Advanced countries have been cutting policy interest rates very aggressively, and market interest rates have fallen by 3½ percentage points, without seriously affecting wage and price levels. Inflation as measured by official statistics has declined and is on average less than two percent. In some countries, it is
close to zero.21
Policy interest rates and inflation in emerging markets prior to the crisis were
substantially higher than in advanced countries. Inflation remained higher, and actually increased in developing Asia during the 2008-09 crisis, but this was atypical. The crisis triggered a sharp drop in prices in the CEE region. CEE market interest rates, however, moved in the opposite direction as lenders demanded premia to compensate for increased credit risk. Exchange rate policy responses to the 2008-09 crisis differed widely despite a Keynesian inclination toward devaluation because many nations have fixed foreign exchange rate regimes. Nonetheless, many countries with floating, or flexible peg exchange rate regimes fostered the depreciation of their currencies including America and the EU. Others sought to stimulate their economies even more by depreciating their currencies against the “safe” dollar and euro. The only exception is the CEE region where many countries had fixed their currencies to the euro. When other countries around the world let their currencies fall, this put additional pressure on the CEE region. Part of the region’s poor economic performance surely is due to this rigidity. Finally, policy makers tried to shore up their beleaguered economies with massive support to financial sectors, ranging from direct balance sheet assistance, to large-scale guarantees. Liquidity problems in banks and financial institutions during the 2008-09 crisis made government financial assistance essential in 16 advanced countries, 3 in the CEE region, and 4 in CIS countries. The direct fiscal costs, according to Leaven and Valencia (2010) are around 5 percent of GDP, while the impact on public debt averages almost 25 percent of GDP.
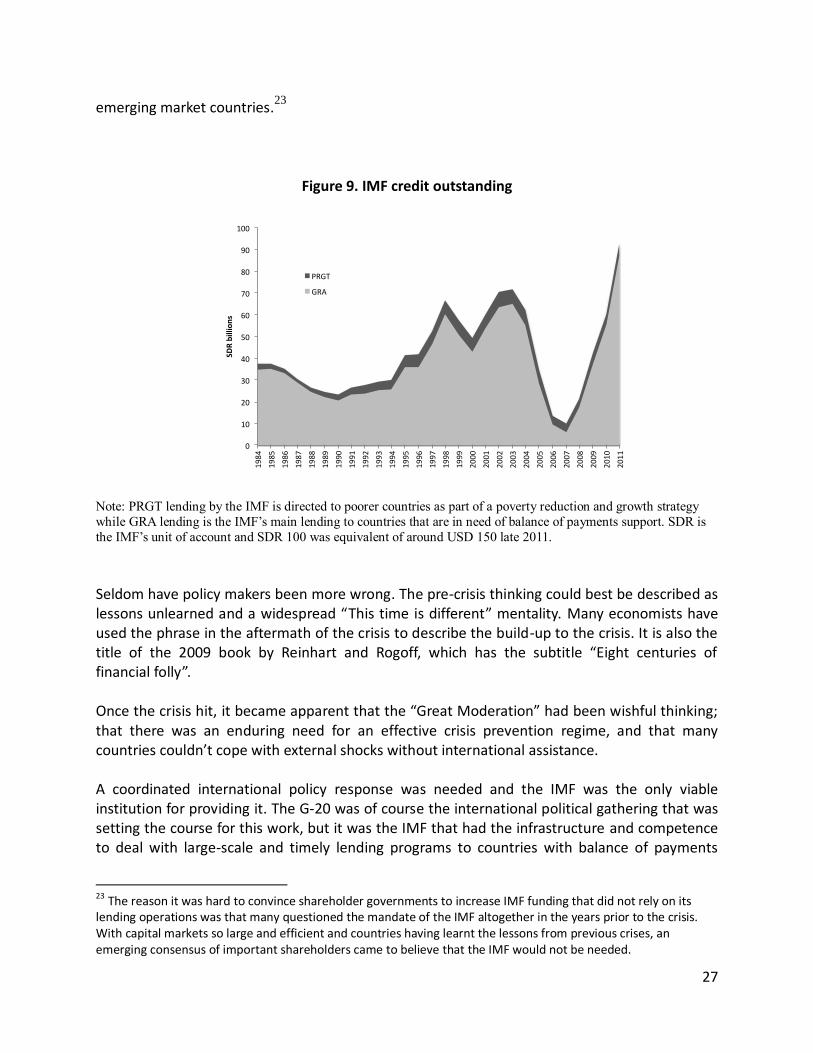
4.3 International community’s response The years before the 2008-09 crisis were relatively stable, especially in major emerging market countries receiving large international funding packages from the IMF and other IFIs. As a result, IMF lending declined substantially (Figure 9), and policy makers around the globe convinced themselves that the planet had entered a new, crisis-free age, dubbed the “Great Moderation.” The signs of this new confidence were visible in many places, not least in the board of the IMF where shareholder governments made two decisions that in retrospect look particularly unwise. First, staff at the IMF was cut significantly barely a year prior to the crisis; and, second, it was decided not to push forward with a new crisis-prevention facility designed to deter capital flight
in international capital markets.22
The decision to cut IMF staff was clearly linked to the funding
model of the IMF, which predicted lower revenues due to reduced crisis borrowing by large
21
Some are critical of the official measures of inflation but a full discussion of the extent to which official statistics provide a measure of prices that are relevant to a majority of consumers is beyond the scope of this chapter. 22
The target countries were those pre-qualifying for IMF credit in normal times.
27
emerging market countries.23
Figure 9. IMF credit outstanding
Note: PRGT lending by the IMF is directed to poorer countries as part of a poverty reduction and growth strategy
while GRA lending is the IMF’s main lending to countries that are in need of balance of payments support. SDR is
the IMF’s unit of account and SDR 100 was equivalent of around USD 150 late 2011.
Seldom have policy makers been more wrong. The pre-crisis thinking could best be described as lessons unlearned and a widespread “This time is different” mentality. Many economists have used the phrase in the aftermath of the crisis to describe the build-up to the crisis. It is also the title of the 2009 book by Reinhart and Rogoff, which has the subtitle “Eight centuries of financial folly”. Once the crisis hit, it became apparent that the “Great Moderation” had been wishful thinking; that there was an enduring need for an effective crisis prevention regime, and that many countries couldn’t cope with external shocks without international assistance. A coordinated international policy response was needed and the IMF was the only viable institution for providing it. The G-20 was of course the international political gathering that was setting the course for this work, but it was the IMF that had the infrastructure and competence to deal with large-scale and timely lending programs to countries with balance of payments
23 The reason it was hard to convince shareholder governments to increase IMF funding that did not rely on its lending operations was that many questioned the mandate of the IMF altogether in the years prior to the crisis. With capital markets so large and efficient and countries having learnt the lessons from previous crises, an emerging consensus of important shareholders came to believe that the IMF would not be needed.
0
10
20
30
40
50
60
70
80
90
100
1984
1985
1986
1987
1988
1989
1990
1991
1992
1993
1994
1995
1996
1997
1998
1999
2000
2001
2002
2003
2004
2005
2006
2007
2008
2009
2010
2011
SDRbillions
PRGT
GRA
28
problem. Even the EU and the Eurozone eventually realized that IMF involvement was essential in euro countries. IMF resources accordingly have been increased. The Fund’s lending capacity grew in several steps from around $250bn to $750bn after negotiations in various G-20 meetings. It was also agreed that international liquidity should be increased by providing central banks with extra foreign exchange reserves. SDR allocations were increased by $250bn for this purpose. Part of the international bargain has been to increase the voice of emerging markets on the IMF board. Suddenly, countries that had been viewed as potential IMF borrowers have become funders of
the international bailouts, changing the power balance.24
The idea of crisis-prevention lending facilities for countries with good policy records pre-qualifying for large credit lines was finally accepted during the crisis. The reform came too late for the countries already stricken, but is still a valuable tool for averting future contagion. Late 2011, three countries had access to SDR70bn of such funding, which can be compared to around SDR90bn in outstanding credit and SDR250bn of forward commitment capacity. Presumably, had global policy makers been less enthralled with the “Great Moderation,” their response would have been more effective, but the cost of this wishful thinking is difficult to calibrate because when the crisis struck, authorities reacted decisively. IMF papers and presentations document that policy makers responded to the 2008 crisis with
unusually large international rescue packages and less stringent conditionality.25
The EU and the
ECB intervened with more or less (in)transparent bailouts to EU countries, first outside (Hungary, Latvia and Romania), and then inside (Greece and Ireland) the Eurozone. The European Stabilisation Mechanism was set up in May 2010 with several pillars including ECB and IMF funding of up to €750 bn. Already the packages to the countries listed above amount to around €100bn. At the same time, the ECB provided €500bn in loans to commercial banks in Austria, Finland, Germany, Greece, Ireland, Italy, Portugal, and Spain in early 2011. In sum, the financial response of the international community to crisis stricken countries has been substantial. Nevertheless, the constant political battles over how much, when and to whom, and taking a piecemeal approach to arranging various bailout mechanisms particularly in Europe has created a significant amount of uncertainty that has impeded the restoration of confidence.
24 Discussions on reforming IMF governance began long before the crisis, but the crisis transformed talk into action. The process is incomplete. Quotas and voting power still need further adjustment to accurately reflect the economic importance and strength of member countries. 25 See for example IMF (2010a) and Giorgianni (2009).
29
5. Conclusions and lessons for the future The 2008 crisis has (re-)kindled a heated debate on how to avoid and manage crises as well as
rethinking macroeconomic policies more generally.26
Many see the 2008 crisis as a wakeup call
that will help the world community implement much needed reform in areas ranging from regulation of the international financial system to reforming the voting shares in the IFIs, to setting-up robust early warning systems, and pushing through structural reforms in advanced countries to stimulate growth and assure sustainable fiscal dynamics. As the world economy is recovering, many of the more ambitious goals are taking a backseat and the attention is shifting to more immediate rescue efforts in countries with the direst needs. Many argue that this is a missed opportunity that will contribute to a new crisis in a not too distant future, and it is not hard to see why this may happen, given the one-way street rescues provided to financial firms “too-big-to-fail.” Despite the global label that is used for the crisis, there are large differences in the crisis’s impact among the country groups discussed above. Most notably, the central figures in this crisis are advanced countries, and CEE countries with strong financial and trade ties to the advanced economies. By contrast, developing Asia fared relatively well in the crisis, and in many instances suffered few ill effects. Of course, the global label is appropriate from the standpoint of worldwide aggregate economic activity. Planetary GDP did fall due to the high weight of crisis stricken advanced countries. 29 of 32 advanced countries suffered output losses, in stark contrast to the MENA region, where only one country experienced an output decline in 2008-2009. Likewise, growth in developing Asia and Sub-Saharan Africa was mostly positive during the 2008 crisis. Early warning indicators did signal problems in CEE, but when we plot all countries together, most of these indicators were weakly or moderately correlated with economic performance, and served as poor crisis predictors. Some were better when the focus is narrowed to the sub-set of crisis-afflicted countries, and may serve as effective indicators of future vulnerability. This suggests that a principal virtue of compiling crisis predictors is the impetus they provide for closer case-by-case investigation to resolve ambiguities. “False positives” add another wrinkle. In some cases a signal will be truly false in the sense that no crisis is coming, but in others the signal may merely be premature. For example, in Latvia, the IMF raised warning flags several years before the crisis, but they were ignored because the economy kept flourishing for another three years. The signals were correct, but timing wasn’t. This problem is especially perplexing for crises involving speculative bubbles. Many observers did not believe the dot com hype, and claimed it was a bubble well before it burst, but investors that listened to that advice too early lost significant amounts of money in the interim. Timing is also a bothersome empirical issue. It is difficult to include all relevant leads and lags when constructing an empirical model, especially when they are country specific.
26 A paper that received ample attention both among academics and policy makers is Blanchard, Dell’Arriccia and Mauro (2010).
30
At the end of the day, cheap money that fuels rapid credit and funds speculative debt-financed asset investments turns out to be a primary cause of most “bubbles.” Once confidence falters, too many debtors simultaneously run into trouble, and the financially over-exposed cannot save themselves without government support. Some governments are able to provide the needed assistance, but in many cases, the international community has to come to the rescue. Most people concur with this diagnosis. However, it doesn’t save the day because interested parties tend to disagree about whether economies are over-stimulated. Economists cannot infallibly foretell that money is too cheap, credit is growing too fast and assets are overvalued before crises, leaving the door open to procrastination that assures “this time” really won’t be “different.” However, persistent crises cannot be ascribed solely to stochastic ambiguity. It also is the result of a fundamental mismatch between speculators’ expected returns (including anticipated bailouts), and social costs. If the well-paid financial players had to pick up the bill after each financial meltdown, they would be much more risk-averse, and welfare losses would be correspondingly lower. Policy makers are in a position to redress this asymmetry, but have been noticeably loath to do so, suggesting that when push comes to shove they don’t place enough importance on crisis prevention. The 2008 crisis has also made it clear that the link between fiscal deficits and national debt must be confronted. Deficit spending one’s way out of recession without accumulating countercyclical surpluses is a temporary palliative setting the stage for even greater crises tomorrow. Several countries have seen their public debt explode in the 2008-09 crisis, both because of the direct bailout costs borne by the public sector, and the crisis’s impact on the tax base and government transfers. Economists at the IMF and elsewhere have rightly called for creating fiscal space in good times to finance counter-crisis deficit spending later. Becker (1999) has suggested that public debt management strategies should include the risks of bailouts, which would affect both desired debt levels and the composition of public debt. In the model, the public debt manager should basically undo (part) of the private sectors financial decisions by taking the opposite position in the public debt portfolio. This is Ricardian equivalence in reverse. The standard Ricardian argument as in Barro (1974) is that households undo the government deficit by adjusting its savings, which leads to the neutrality of government debt. In the final analysis, the lesson from our investigation is simply that crises will always be too frequent and severe because of human folly, and governments should be prepared to deal with them in a manner that reduces the negative income and welfare effects for the whole population. This requires major changes to financial sector regulation, reducing moral hazard in lending and borrowing, limiting bailouts, and making significant changes to fiscal policy and public debt management. It also necessitates the creation of crisis prevention regimes, despite their limitations, that press policy makers to take better account of catastrophic risk, and
31
encourage them to prioritize stability over wishful thinking. Our scatterplots have shown that early warning indicators can provide useful signals of mounting risk for the global community, even though they don’t always apply to the entire population of countries. Very little of this will of course happen because this time is indeed unlikely to be different.
References Abiad, Abdul, 2003, “Early Warning Systems: A Survey and a Regime-Switching Approach”, IMF Working Paper WP/03/32 Barrell, Ray, E. Philip Davis, Dilruba Karim, and Iana Liadze, 2010, "Bank regulation, property prices and early warning systems for banking crises in OECD countries," Journal of Banking & Finance, Elsevier, vol. 34(9), pages 2255-2264, September Barro, Robert, 1974, “Are Government Bonds Net Wealth?”, Journal of Political Economy, Vol. 81, pp. 1095-1117 Becker, Torbjörn and Paulo Mauro, 2006, “Output Drops and the Shocks That Matter”, IMF Working Paper WP/06/197 Becker, Torbjörn, 1999, “Public Debt Management and Bailouts”, IMF Working Paper WP/99/103 Becker, Torbjörn, Daniel Daianu, Zsolt Darvas, Vladimir Gligorov, Michael A. Landesmann, Pavle Petrovic, Jean Pisani-Ferry, Dariusz K. Rosati, André Sapir and Beatrice Weder Di Mauro (2010), “Whither Growth in Central and Eastern Europe? Policy lessons for an integrated Europe”, Bruegel Blueprints number 453, 12, Bruegel and The Vienna Institute for International Economic Studies (WIIW) Becker, Torbjörn; Olivier Jeanne, Paolo Mauro, Jonathan D. Ostry, Roman Ranciere, 2007, “Country Insurance: The Role of Domestic Policies”, IMF Occasional Paper No. 254 Berg, Andrew, and Catherine Pattillo, 1999, “Are Currency Crises Predictable? A Test,” IMF Staff Papers, Vol. 46, No. 2 (June), pp. 107–38 Berg, Andrew, Eduardo Borensztein, and Catherine A. Pattillo, 2005, “Assessing Early Warning Systems: How Have They Worked in Practice?” IMF Staff Papers, Vol. 52, No. 3, pp. 462–502 Berkmen, Pelin, Gelos, Gaston, Rennhack, Robert and James Walsh, 2009, “The Global Financial Crisis: Explaining Cross-Country Differences in the Output Impact”, IMF Working Paper, WP/09/280 Blanchard, Olivier J., Giovanni Dell'Ariccia, Paolo Mauro, 2010, “Rethinking Macroeconomic
32
Policy”, IMF Staff Position Note No. 2010/03 Frankel, Jeffrey A and G. Saravelos, 2010, “Are Leading Indicators of Financial Crises Useful for Assessing Country Vulnerability?”, NBER Working Paper 16047 Ghosh, Atish R., Jonathan D. Ostry, Charalambos G. Tsangarides, 2011, “Exchange Rate Regimes and the Stability of the International Monetary System”, IMF Occasional Paper No. 270 Ghosh, Atish, Jonathan D. Ostry, and Natalia Tamirisa, 2009, “Anticipating the Next Crisis,” Finance and Development, vol. 46, no. 3, pp. 35–7 Giorgianni, Lorenzo, 2009, “IMF-supported Programs in the Crisis: What have we learned so far?”, Presentation in Instanbul, October 2 Available at http://www.imf.org/external/np/pp/eng/2009/100209ppt.pdf IMF, 2008, Global Financial Stability Report, April IMF, 2010a, “How Did Emerging Markets Cope in the Crisis?”, IMF Policy paper, June 15 IMF, 2010b, Global Financial Stability Report, April IMF, 2010c, “The IMF-FSB Early Warning Exercise: Design and Methodological Toolkit” IMF, 2011a, “Macroprudential Policy: An organizing framework”, IMF Policy Paper IMF, 2011b, Global Financial Stability Report, September, Chapter 3 Kaminsky, Gabriela, Saul Lizondo, and Carmen M. Reinhart, 1998, “Leading Indicators of Currency Crises,” IMF Staff Papers, Vol. 45, No. 1 (March), pp. 1–48 Kaminsky, Graciela, and Carmen Reinhart, 1999, “The Twin Crises: The causes of banking and balance-of-payments problems,” American Economic Review, Vol. 89, No. 3, pp. 473–500 Laeven, Luc and Fabian Valencia, 2010, “Resolution of Banking Crises: The Good, the Bad, and the Ugly”, IMF Working Paper, WP/10/146 Lane, Philip R. and Gian Maria Milesi-Ferretti, 2010, “The Cross-Country Incidence of the Global Crisis”. IMF Working Paper WP/10/171 Maddison, Angus, 2003, The World Economy—Historical Statistics, OECD (Paris). Data available at http://dx.doi.org/10.1787/456125276116 Manasse, Paolo and Nouriel Roubini, 2005, “’Rules of Thumb’ for Sovereign Debt Crises,” IMF Working Paper WP/05/42
33
Reinhart, Carmen and Kenneth Rogoff, 2009, This time is different: eight centuries of financial folly, Princeton University Press
34
Appendix
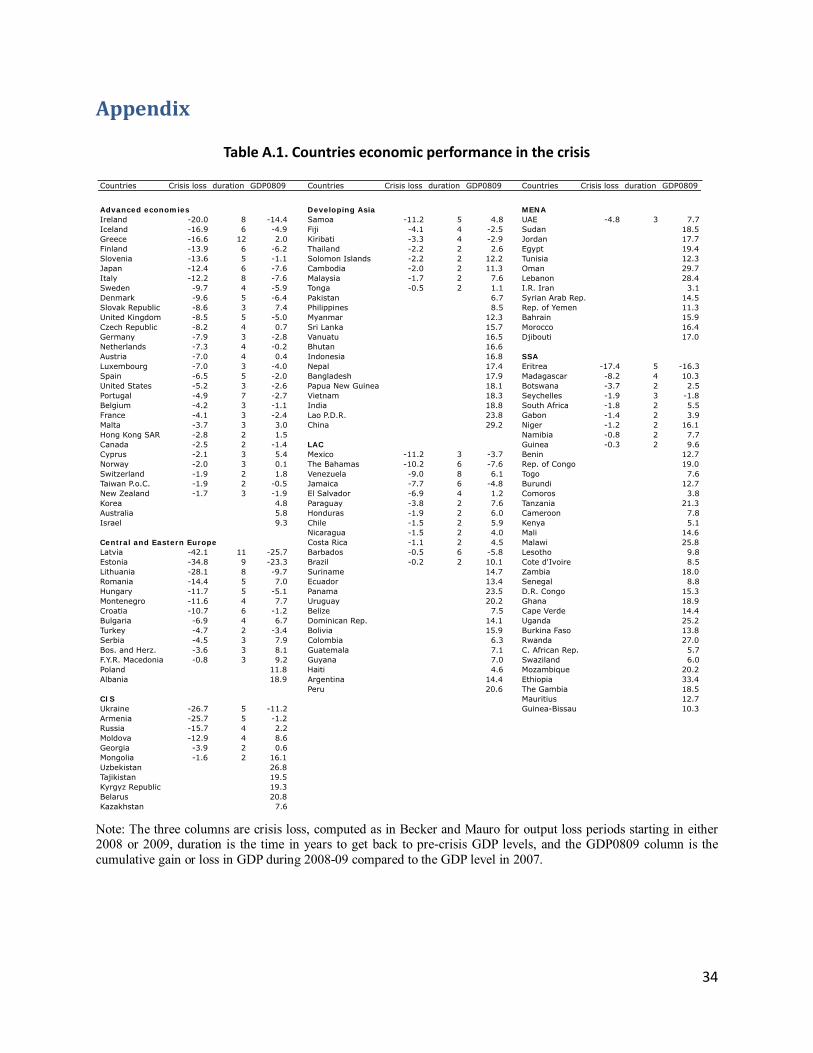
Table A.1. Countries economic performance in the crisis
Note: The three columns are crisis loss, computed as in Becker and Mauro for output loss periods starting in either 2008 or 2009, duration is the time in years to get back to pre-crisis GDP levels, and the GDP0809 column is the
cumulative gain or loss in GDP during 2008-09 compared to the GDP level in 2007.
Countries Crisis loss duration GDP0809 Countries Crisis loss duration GDP0809 Countries Crisis loss duration GDP0809
Advanced econom ies Developing Asia MENA
Ireland -20.0 8 -14.4 Samoa -11.2 5 4.8 UAE -4.8 3 7.7
Iceland -16.9 6 -4.9 Fiji -4.1 4 -2.5 Sudan 18.5
Greece -16.6 12 2.0 Kiribati -3.3 4 -2.9 Jordan 17.7
Finland -13.9 6 -6.2 Thailand -2.2 2 2.6 Egypt 19.4
Slovenia -13.6 5 -1.1 Solomon Islands -2.2 2 12.2 Tunisia 12.3
Japan -12.4 6 -7.6 Cambodia -2.0 2 11.3 Oman 29.7
Italy -12.2 8 -7.6 Malaysia -1.7 2 7.6 Lebanon 28.4
Sweden -9.7 4 -5.9 Tonga -0.5 2 1.1 I.R. Iran 3.1
Denmark -9.6 5 -6.4 Pakistan 6.7 Syrian Arab Rep. 14.5
Slovak Republic -8.6 3 7.4 Philippines 8.5 Rep. of Yemen 11.3
United Kingdom -8.5 5 -5.0 Myanmar 12.3 Bahrain 15.9
Czech Republic -8.2 4 0.7 Sri Lanka 15.7 Morocco 16.4
Germany -7.9 3 -2.8 Vanuatu 16.5 Djibouti 17.0
Netherlands -7.3 4 -0.2 Bhutan 16.6
Austria -7.0 4 0.4 Indonesia 16.8 SSA
Luxembourg -7.0 3 -4.0 Nepal 17.4 Eritrea -17.4 5 -16.3
Spain -6.5 5 -2.0 Bangladesh 17.9 Madagascar -8.2 4 10.3
United States -5.2 3 -2.6 Papua New Guinea 18.1 Botswana -3.7 2 2.5
Portugal -4.9 7 -2.7 Vietnam 18.3 Seychelles -1.9 3 -1.8
Belgium -4.2 3 -1.1 India 18.8 South Africa -1.8 2 5.5
France -4.1 3 -2.4 Lao P.D.R. 23.8 Gabon -1.4 2 3.9
Malta -3.7 3 3.0 China 29.2 Niger -1.2 2 16.1
Hong Kong SAR -2.8 2 1.5 Namibia -0.8 2 7.7
Canada -2.5 2 -1.4 LAC Guinea -0.3 2 9.6
Cyprus -2.1 3 5.4 Mexico -11.2 3 -3.7 Benin 12.7
Norway -2.0 3 0.1 The Bahamas -10.2 6 -7.6 Rep. of Congo 19.0
Switzerland -1.9 2 1.8 Venezuela -9.0 8 6.1 Togo 7.6
Taiwan P.o.C. -1.9 2 -0.5 Jamaica -7.7 6 -4.8 Burundi 12.7
New Zealand -1.7 3 -1.9 El Salvador -6.9 4 1.2 Comoros 3.8
Korea 4.8 Paraguay -3.8 2 7.6 Tanzania 21.3
Australia 5.8 Honduras -1.9 2 6.0 Cameroon 7.8
Israel 9.3 Chile -1.5 2 5.9 Kenya 5.1
Nicaragua -1.5 2 4.0 Mali 14.6
Central and Eastern Europe Costa Rica -1.1 2 4.5 Malawi 25.8
Latvia -42.1 11 -25.7 Barbados -0.5 6 -5.8 Lesotho 9.8
Estonia -34.8 9 -23.3 Brazil -0.2 2 10.1 Cote d'Ivoire 8.5
Lithuania -28.1 8 -9.7 Suriname 14.7 Zambia 18.0
Romania -14.4 5 7.0 Ecuador 13.4 Senegal 8.8
Hungary -11.7 5 -5.1 Panama 23.5 D.R. Congo 15.3
Montenegro -11.6 4 7.7 Uruguay 20.2 Ghana 18.9
Croatia -10.7 6 -1.2 Belize 7.5 Cape Verde 14.4
Bulgaria -6.9 4 6.7 Dominican Rep. 14.1 Uganda 25.2
Turkey -4.7 2 -3.4 Bolivia 15.9 Burkina Faso 13.8
Serbia -4.5 3 7.9 Colombia 6.3 Rwanda 27.0
Bos. and Herz. -3.6 3 8.1 Guatemala 7.1 C. African Rep. 5.7
F.Y.R. Macedonia -0.8 3 9.2 Guyana 7.0 Swaziland 6.0
Poland 11.8 Haiti 4.6 Mozambique 20.2
Albania 18.9 Argentina 14.4 Ethiopia 33.4
Peru 20.6 The Gambia 18.5
CI S Mauritius 12.7
Ukraine -26.7 5 -11.2 Guinea-Bissau 10.3
Armenia -25.7 5 -1.2
Russia -15.7 4 2.2
Moldova -12.9 4 8.6
Georgia -3.9 2 0.6
Mongolia -1.6 2 16.1
Uzbekistan 26.8
Tajikistan 19.5
Kyrgyz Republic 19.3
Belarus 20.8
Kazakhstan 7.6
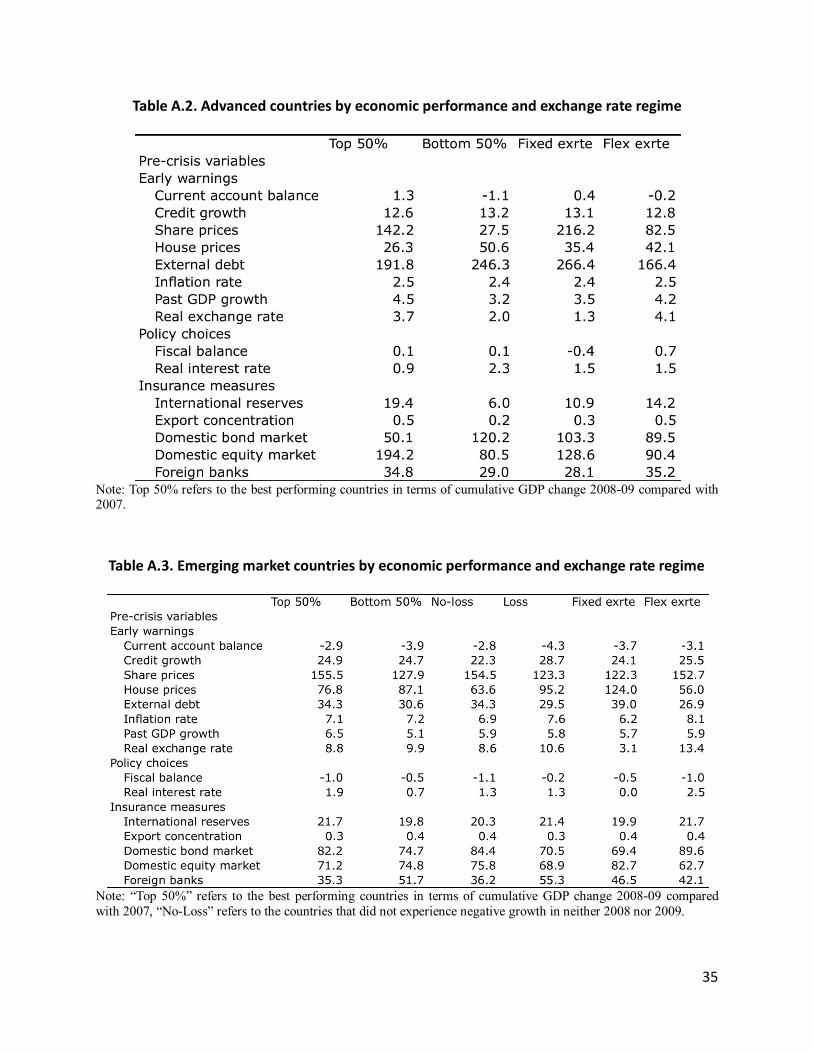
35
Table A.2. Advanced countries by economic performance and exchange rate regime
Note: Top 50% refers to the best performing countries in terms of cumulative GDP change 2008-09 compared with 2007.
Table A.3. Emerging market countries by economic performance and exchange rate regime
Note: “Top 50%” refers to the best performing countries in terms of cumulative GDP change 2008-09 compared
with 2007, “No-Loss” refers to the countries that did not experience negative growth in neither 2008 nor 2009.


![INDEX [futurecity.vision]futurecity.vision/225.pdf · action in the following areas: Crisis prevention, crisis assessment, crisis handling and crisis termi-nation. The aim of crisis](https://img.pdfslide.us/doc/110x75/5ea66fd453adc30f1f146824/index-action-in-the-following-areas-crisis-prevention-crisis-assessment-crisis.jpg)