Embed Size (px)
DESCRIPTION
Citation preview

Citywire Montreux – 9th ‐11th May 2012
Emerging Market Corporate DebtAn asset class that has emerged

Contents
• Emerging Market Corporate Debt – an asset class that has emerged g g p g
• Emerging Market Corporate Debt at BlueBay
2

EM Corporate Debt – An asset class that has emergedLarge and well diversified asset class
• The EM Corporates universe is US$863bn(1) in size compared to US$608bn(2) for EM sovereign and US$325bn for European High Yield(3)
Of h US$863b C U i US$ 80b (6 %) d I G d• Of the US$863bn EM Corporates Universe, US$580bn (67%) are rated Investment Grade
• While still being a smaller universe, EM corporates as an asset class are now comparable to US HY (US$1.3tln), European IG (€1.3tln) and US IG (US$4.1tln)
800
900
1000
EM Corporate debt is larger than EM sovereign and European HY(1)(2)(3)
US$4100bn
Estimated Corp Debt Stock (US$bn), to January 2012
400
500
600
700
US
$bn
Siz
e (
US$bn)
100
200
300
400
US$1300bn
US$863bn
Univ
ers
e
0
1998
1999
2000
2001
2002
2003
2004
2005
2006
2007
2008
2009
2010
2011
YTD
-12
EM Sovereign Debt European High Yield EM Corporate Debt
US$325bn
US IG US HY EM Corp Euro HY
3Data source: JP Morgan(1) EM Corporates universe, as of January 2012 (2) EM sovereign universe as at 30 September 2011 (3) European High Yield universe based on the market cap of ML HY bond index, as at January 2012
Data source: JP Morgan

EM Corporate Debt – An asset class that has emergedLarge and well diversified asset class
• The EM Corporate asset class encompasses over 60 countries providing opportunity to diversify and take advantage of different economic cycles
• The asset class also offers sector diversification with banks being the largest issuers
Country Breakdown as at 10 January 2012* Sector Breakdown as at 10 January 2012*
Real Estate
TM T7.32%
Transport1.88%
Utilities8.06%
Consumer4.15%
Diversified5.60%
PhilippinesCzech
UkrainePeru
Argent inaHungary
ColombiaTurkeyPoland
ThailandSaudi Arabia
Ot her
Oil & gas19.67%
Pulp & paper1.69%
5.45%
Financial34.13%
Hong KongChina
Kazakhst anIndia
VenezuelaSingapore
ChileQat ar
IndonesiaMalaysia
Supranat ionSout h Af r ica
Israelpp
Industrial4.18%
Infrastructure1.52%
M etals & mining6.35%
0% 2% 4% 6% 8% 10% 12% 14%
BrazilRussiaKorea
MexicoUAE
Hong Kong
Composition of Emerging Market Corporate bonds by issuer type Composition of Emerging Market Corporate bonds by rating
Rating Entity Total (US$mn)
Issuing Entity Since 2002Africa & ME Asia
Emerging Europe
Latin America Total
Banks 30 105 94 121 350
Banks ‐ Gov't guarantee 3 3
Banks Quasi‐sovereign*** 35 77 70 40 222
Rating Entity Total (US$mn)
High Yield Bank 44,431Bank quasi‐sovereign 18,404Corporate 157,230Corporate quasi‐sovereign 56,516Supranational Bank 475g
Corporate 44 294 91 385 814
Corporate Quasi‐sovereign 62 111 56 86 315
Total number of Issues 171 587 314 632 1,704
Total 277,057High Grade Bank 98,626
Bank quasi‐sovereign 97,817Corporate 163,462Corporate quasi‐sovereign 214,287Supranational Bank 11,915
4Data source: Top charts – JP Morgan, Bloomberg, BlueBay Asset Management. Bottom charts – JP Morgan as at 10 January 2012 *Based on US$863bn Universe ***Includes Supranational Banks
Total 586,107Total EM Corporate bond stock 863,164

EM Corporate Debt – An asset class that has emergedLarge and well diversified asset class
• Approximately two thirds of EM Corporates are rated Investment Grade, a number of which are of systemic importance to the sovereign. Quasi sovereign credits account for one third of the asset class
• New issuance remains strong in EM Corporates with the majority of issuance coming from IG corporates. 2011 issuance was US$202.5bn and a further US$185bn is anticipated for the full year 2012
Estimated EM Corporate Debt Stock (US$bn) to 10 January 2012
100%
Q uasi-sovereign* Investment Grade High Y ield
CCC and lower*8 85%
AAA1.25%
Rating Breakdown of EM Corporate Universe
US$116.0bn US$283.5bn US$179.0bn US$285.0bn US$863.2bn
20.22%
12 27% 30 36%
14.52%20.60%
31.72%24.47% 23.36%
70%
80%
90%
8.85%
B 10.47%
A26 05%
AA5.55%
65.26%56 01%
38.32% 12.27%37.93%
30.36%
30%
40%
50%
60%BB
13.44%
26.05%
41.08%
56.01%
37.60%46.27%
0%
10%
20%
30%
Africa & Asia Emerging Latin Total
BBB34.40%
5
Africa & Middle East
Asia Emerging Europe
Latin America
Total
Data source: JP Morgan *Including supranationals and government guaranteedData source: JP Morgan, BlueBay Asset Management, as of 10 January 2012*Including not rated
EM Corporate Debt – An asset class that has emergedExposure does not match increasing economic importance
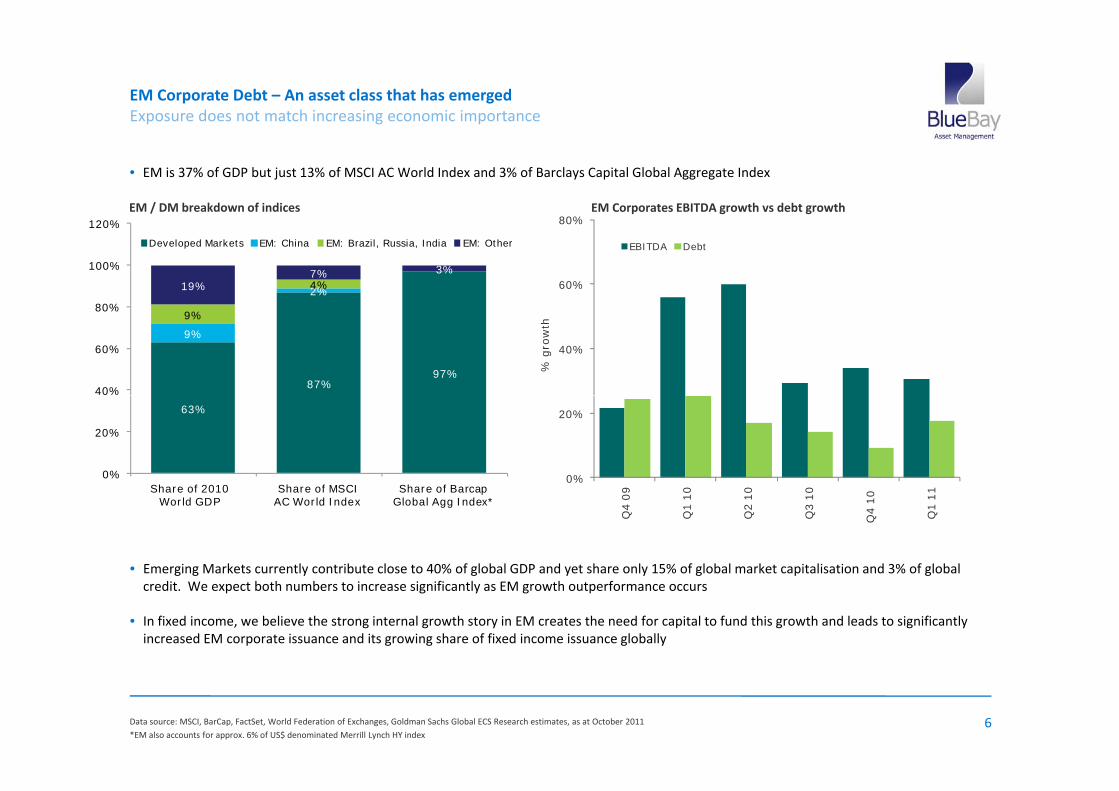
• EM is 37% of GDP but just 13% of MSCI AC World Index and 3% of Barclays Capital Global Aggregate Index
EM Corporates EBITDA growth vs debt growthEM / DM breakdown of indices80%
60%
80%
EBITDA Debt
2%4%19%7% 3%
80%
100%
120%
Developed Markets EM: China EM: Brazil, Russia, India EM: Other
40%
% g
row
th
87%97%
9%
9%
40%
60%
80%
0%
20%63%
0%
20%
Sh f 2010 Sh f MSCI Sh f B
Q4 0
9
Q1 1
0
Q2 1
0
Q3 1
0
Q4 1
0
Q1 1
1Share of 2010 World GDP
Share of MSCI AC World Index
Share of Barcap Global Agg Index*
• Emerging Markets currently contribute close to 40% of global GDP and yet share only 15% of global market capitalisation and 3% of global g g y g y y g p gcredit. We expect both numbers to increase significantly as EM growth outperformance occurs
• In fixed income, we believe the strong internal growth story in EM creates the need for capital to fund this growth and leads to significantly increased EM corporate issuance and its growing share of fixed income issuance globally
6Data source: MSCI, BarCap, FactSet, World Federation of Exchanges, Goldman Sachs Global ECS Research estimates, as at October 2011
*EM also accounts for approx. 6% of US$ denominated Merrill Lynch HY index

EM Corporate Debt – An asset class that has emergedEM dedicated investor base is small but growing
• The launch of JP Morgan CEMBI Diversified index in November 2007 opened the door for a dedicated EM Corporate investor base. Despite fast g p p pAUM growth during 2011, dedicated EM corporate investors only account for US$29.6bn versus US$863bn asset class. Majority of themandates are run for mixed rating products as well as EM IG and EM HY dedicated mandates
• We expect to see further growth in the dedicated investor base for EM Corporates
2 4 6 26.5
228.5
26.4
231.4
250
300Local Market Debt
External Debt
Corporate External Debt
Total AUM managed against EM indices, to 14 December 2011
.3 .3 5.0
30.2
33.3
146.5
178.2 197.2
181.2
158.9
149.8
162.7
174.1
178.8
187.3
189.1
192.0
204.2
205.4
206.6 2 2 2 2
150
200
bn)
3 .9 .9 55.1
62.3
62.3 7
9.2
79.2
79.2
79.2
111.4
119.
121
125
13 13
5 6
100
150
AU
M (
US
$
20.8 28.3 35.
35.
6.7 7.2 8.1
8.1 13.9
13.9
17.2
20.9
21.0
21.9
24.8
26.7
29.5
29.6
0
50
ul-
07
n-0
8
n-0
8
n-0
9
ul-
09
n-1
0
r-10
ul-
10
p-1
0
ct-1
0
c-10
r-11
r-11
y-1
1
n-1
1
ul-
11
p-1
1
c-11
7Data source: JP Morgan
Ju Jan
Jun
Jan
Ju Jan
Ap Ju
Sep
Oc
Dec
Ma
Ap
May
Jun
Ju
Sep
Dec

EM Corporate Debt – An asset class that has emergedIssuer Selection is Key
• The dispersion between the top 5 returns and the bottom 5 returns within the index has been increasing
Thi d h d f b di h id if h b di ifi i i
150
median (div)
Return Dispersion in the JP Morgan CEMBI Div index
• This demonstrates the need for bottom up credit research to identify the best credit specific opportunities
100
( )
50
turn
(%
)
-50
-
Tota
l re
t
-100 2003 2004 2005 2006 2007 2008 2009 2010 2011
8Data source: BlueBay Asset Management

EM Corporate Debt – An asset class that has emergedHistoric Risk Reward is Attractive
• Despite the September 2008 sell‐off, the historical performance of EM Corporates has been strong, generating a high return per unit of risk
• As the EM Corporates asset class develops we are seeing a trend towards lower levels of volatility as evidenced by the 5 year vs 2 year risk• As the EM Corporates asset class develops we are seeing a trend towards lower levels of volatility, as evidenced by the 5 year vs 2 year risk reward profile of the asset class
2 year period: 31 March 2010 to 31 March 2012
CEMBI DivML EUR
EMBIG DivJULI
S&P 500 MSCI EM EquityIBOXX EUR GBI‐EM
CEMBI DivHigh Yield
EMBIG Div(US High Grade)
S&P 500 MSCI EM EquityIG Corps Glob Div Unhedged
Correlation to CEMBI Div 1.00 0.75 0.87 0.41 0.34 0.59 0.66 0.63
Annualised return 8.6% 7.8% 9.8% 8.9% 9.8% 2.4% 4.5% 7.9%
Hi i l l ili 5 8% 8 7% 6 2% 4 8% 19 0% 23 9% 3 6% 10 3%Historical volatility 5.8% 8.7% 6.2% 4.8% 19.0% 23.9% 3.6% 10.3%
Return per unit of risk 1.49 0.89 1.59 1.85 0.51 0.10 1.27 0.77
5 year period: 31 March 2007 to 31 March 2012y p
CEMBI DivML EUR High Yield
EMBIG DivJULI
(US High Grade)S&P 500 MSCI EM Equity
IBOXX EUR IG Corps
GBI‐EM Glob DivUnhedged
Correlation to CEMBI Div 1.00 0.74 0.86 0.51 0.41 0.59 0.55 0.61
A li d 8 1% 8 4% 8 2% 8 5% 0 2% 2 3% 4 4% 8 9%Annualised return 8.1% 8.4% 8.2% 8.5% ‐0.2% 2.3% 4.4% 8.9%
Historical volatility 9.5% 11.9% 11.2% 6.2% 23.4% 30.4% 4.2% 11.5%
Return per unit of risk 0.85 0.71 0.73 1.37 ‐ 0.01 0.08 1.06 0.77
9Data source: Bloomberg, JP Morgan, Morgan Stanley, UBS, and BlueBay Asset Management

EM Corporate Debt – An asset class that has emergedOffers spread pickup vs DM Corporates
• EM corporate spreads (excluding financials) are materially higher than similar rated corporates in developed markets, offering potential for spread pickup
Asset Class RatingSpread Spread pick up Asset Class Rating
Spread Spread pick up
Investment Grade, as at 04 April 2012 High Yield, as at 04 April 2012
Asset Class Rating(bps) in EM over DM
DM CORPS ex fin AAA 50
EM CORPS ex fin AAA 116 2.32
Asset Class Rating(bps) in EM over DM
DM CORPS ex fin BB 405
EM CORPS ex fin BB 567 1.40 DM CORPS ex fin AA 87
EM CORPS ex fin AA 203 2.33
DM CORPS ex fin A 120
DM CORPS ex fin B 607
EM CORPS ex fin B 972 1.60
EM CORPS ex fin A 197 1.64
DM CORPS ex fin BBB 216
EM CORPS ex fin BBB 287 1.33
DM CORPS ex fin CCC 943
EM CORPS ex fin CCC 1084 1.15
10Data source: Merrill Lynch
EM Corporate Debt – An asset class that has emergedEM Corporates spreads offer value over US Corporates
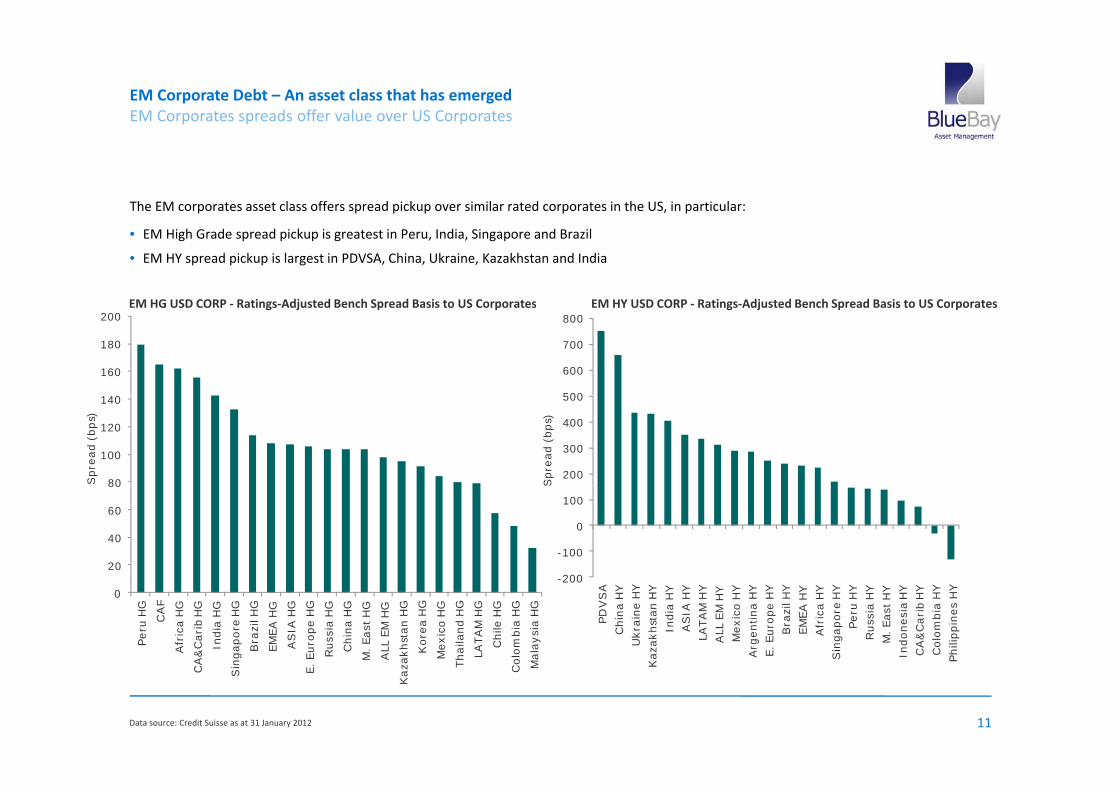
The EM corporates asset class offers spread pickup over similar rated corporates in the US, in particular:
• EM High Grade spread pickup is greatest in Peru, India, Singapore and Brazil
• EM HY spread pickup is largest in PDVSA, China, Ukraine, Kazakhstan and India
EM HG USD CORP ‐ Ratings‐Adjusted Bench Spread Basis to US Corporates EM HY USD CORP ‐ Ratings‐Adjusted Bench Spread Basis to US Corporates
500
600
700
800
0
160
180
200EM HG USD CORP Ratings Adjusted Bench Spread Basis to US Corporates EM HY USD CORP Ratings Adjusted Bench Spread Basis to US Corporates
200
300
400
500
Spre
ad (
bps)
80
100
120
140
Spre
ad (
bps)
200
-100
0
100
S
20
40
60
80
-200
PD
VS
A
Chin
a H
Y
Ukra
ine H
Y
Kaza
khst
an H
Y
India
HY
AS
IA H
Y
LATA
M H
Y
ALL
EM
HY
Mexic
o H
Y
Arg
entina H
Y
E. Euro
pe H
Y
Bra
zil H
Y
EM
EA
HY
Afr
ica H
Y
Sin
gapore
HY
Peru
HY
Russ
ia H
Y
M. East
HY
Indonesi
a H
Y
CA
&C
ari
b H
Y
Colo
mbia
HY
Phili
ppin
es
HY0
Peru
HG
CA
F
Afr
ica H
G
A&
Cari
b H
G
India
HG
ngapore
HG
Bra
zil H
G
EM
EA
HG
AS
IA H
G
. Euro
pe H
G
Russ
ia H
G
Chin
a H
G
M. East
HG
ALL
EM
HG
zakhst
an H
G
Kore
a H
G
Mexic
o H
G
Thaila
nd H
G
LATA
M H
G
Chile
HG
olo
mbia
HG
Mala
ysi
a H
G
11Data source: Credit Suisse as at 31 January 2012
KCA
Si E.
Kaz T C M

EM Corporates – Investment CaseEM Corporates benefit from a strong liquidity position
• EM Corporates have close to 3 times the cash to total debt when compared to 5 years ago
35
• They also have ample cash to cover short term liabilities with 1.7 times cash to short term debt
US & EM HY. Cash as % of Total DebtUS & EM IG. Cash as % of Total Debt
25
30
35
l Debt
US HY Corporates
EM HY Corporates
2930
35
40
l Debt
US IG corporates
EM IG Corporates
13
20
15
20
25
Cash
as
a %
of Tota
24
20
25
Cash
as
a %
of Tota
5
10
C5
10
15C
0M
ar 06
Jun 0
6
Sep 0
6
Dec
06
Mar 07
Jun 0
7
Sep 0
7
Dec
07
Mar 08
Jun 0
8
Sep 0
8
Dec
08
Mar 09
Jun 0
9
Sep 0
9
Dec
09
Mar 10
Jun 1
0
Sep 1
0
Dec
10
Mar 11
Jun 1
1
Sep 1
1
0
Mar 06
Jun 0
6
Sep 0
6
Dec
06
Mar 07
Jun 0
7
Sep 0
7
Dec
07
Mar 08
Jun 0
8
Sep 0
8
Dec
08
Mar 09
Jun 0
9
Sep 0
9
Dec
09
Mar 10
Jun 1
0
Sep 1
0
Dec
10
Mar 11
Jun 1
1
Sep 1
1
12Data source: Bank of America Merrill Lynch, as at September 2011

EM Corporate Debt – An asset class that has emergedFundamentally, EM Corporates are well positioned
• Entering the economic downturn, EM Corporates had lower leverage than High Yield and High Grade credits in Developed Markets
7.0250Upgrades
• The re‐rating process is underway with the upgrades to downgrades ratio reversing sharply since the start of the last year
US Upgrades/Downgrades. Total EM, as at 30 December 2011Leverage In EM And Developed Markets, as at 31 Jan 2012 (Net Debt/EBITDA)
5.0x
5.0
6.0
200
Downgrades
Upgrades to Downgrades ratio
US3.6x
4.0x
5.0x
4.0150
Ratio
of u
p/d
ow
des/
dow
ngra
des
EM2.5x
3.0x
vera
ge
(x)
2.0
3.0
50
100
wngra
desU
pgra
dUS1.6x
EM1.0x
1.0x
2.0xLe
0.0
1.0
0
50
Q07
Q07
Q07
Q07
Q08
Q08
Q08
Q08
Q09
Q09
Q09
Q09
Q10
Q10
Q10
Q10
Q11
Q11
Q11
Q11
0.0xIG Net Leverage HY Net Leverage
13
1Q
2Q
3Q
4Q
1Q
2Q
3Q
4Q
1Q
2Q
3Q
4Q
1Q
2Q
3Q
4Q
1Q
2Q
3Q
4Q
Data source: Merrill Lynch Data source: JPMorgan

EM Corporate Debt – An asset class that has emergedDefault rates are expected to be low
• Historically EM Corporate defaults were lower than US High Yield corporate defaults with the exception of 2 years when the defaults were driven by sovereign crises. We expect default rates in EM corporates to remain low, supported by improving EM Sovereign fundamentals
• EM Corporate fundamentals remain on an improving path, with BlueBay estimates for current year defaults running at 1.9%, this translates into 0.6% for the asset class
Historical defaults (as a % of HY bonds outstanding)Senior Unsecured Recoveries by Region 2009 (%) Historical defaults (as a % of HY bonds outstanding)Senior Unsecured Recoveries by Region, 2009 (%)
Asia
%
20
24US
EM
US Average
EM Average
Europe
EEMEA
% 0.3
%
15.4
%
10.7
%
12
16
t R
ate
s (%
)US & Canada
5.2
%
5.0
%
9.1
%
8.0
%
3%
% %
10
6.8
%
7.3
%
6.3
%
1
%**
8D
efa
ult
0 10 20 30 40 50
Latam
Senior Unsecured Recovery, 2009
3.3
1.1
% 2.8
%
0.9
%
0.4
%
2.3
%
0.8
% 1.7
%
1.5
%
1.0
%
0.1
%
0.0
%
0.2
%
0.0
% 1.9
%
1.5
%
0.5
%
3.0
%
0
4999
000
001
002
003
004
005
006
007
008
09*
010
011
12F
14
Senior Unsecured Recovery, 2009
Data source: S&P data for years 2000–2008 inclusive for EM; J.P. Morgan actual data 2009, and forecasts 2010 & 2011*Figure includes distressed exchanges; ** Figure excludes BTAS (distressed default)
Data source: Bank of America Merrill Lynch
19
20
20
20
20
20
20
20
20
20
200 20
20
201

EM Corporate Debt – An asset class that has emergedEM Corporates are growing in liquidity
20
Q2 2009 Q1 2010 Q2 2010 Q3 2010
Daily Average Trade Volume by Value (US$ billion)0.55
EM IG Corps
EM IG Corps vs DM Corps Average Trading Volume (US$bn)
12
14
16
18Q2 2009 Q1 2010 Q2 2010 Q3 2010
Q4 2010 Q1 2011
0.40
0.45
0.50
me, Pct
of fa
ce
p
US BBBs
US As
6
8
10
12
rade V
olu
me
0.30
0.35
avg tra
ding v
olum
0
2
4
IG C orporate HY C orporate EM C orporate EM Sovereign
T
0.15
0.20
0.25
Mar 10 Jun 10 Sep 10 Dec 10 Mar 11 Jun 11 Sep 11 Dec 11
30-d
ay a
IG C orporate HY C orporate EM C orporate EM Sovereign
• EM Corporates market is more shallow than the more established asset classes, but liquidity is improving
Size of universe (US$bn)
IG Corporate 4,000
• EM Corporates liquidity as measured by quarterly turnover as % of universe
Mar 10 Jun 10 Sep 10 Dec 10 Mar 11 Jun 11 Sep 11 Dec 11
• Daily trade volumes have more than doubled since Q2 2009
• There is a clear upward trend in EM Corporate liquidity, and average daily trade volumes are approaching those of the EM Sovereign asset class
HY Corporate 1,304
EM Corporate 834
EM Sovereign 608
stacks up well compared to US Investment Grade
15Data source: FINRA/TRACE, EMTA Data source: FINRA/TRACE, EMTA

EM Corporate Debt – An asset class that has emergedCorrelation to Treasuries dependent on spread cushion
EM IG corporates correlation with US treasury Index EM HY corporates correlation with US treasury Index
• EM IG corporates become highly correlated with Treasuries at spreads of less than 200, but at current levels (around 275bps*) some spread cushion remains
• EM HY corporate are negatively correlated with Treasuries at current levels (around 636bps*) with an implied cushion of around 200bps before Treasury correlation turns positive
16Data source: Merrill Lynch *As at 4th April 2012

EM Corporate Debt – An asset class that has emergedBe mindful of potential risks
Technical risks
• Historically EM corporates have been more volatile compared to other fixed income asset classes given (1) early stage of asset class development and (2) small dedicated investor base
Fundamental risks
• Bottom‐up research is key driver of returns in the asset class. Reliance on credit ratings or sovereign support is not enough
• Sovereign risks, legal framework and shareholder motivations should also be taken into account
St t l i kStructural risks
• Deal structures are as important as company’s fundamentals. Given the fast growing nature of the asset class and uncertain long term operating outlook, fundamental profile of a corporate can change rapidly. Investors should demand solid structures to protect the downside risk
Macro risks
• EM corporates fundamentals are not affected by sovereign Europe but they are not immune to volatility
17

EM Corporate Debt at BlueBayEM Corporate subsectors that offer the best opportunities
Despite strong performance of the asset class in October, we still believe that both EM IG and HY corporates offer value. There are also opportunities in the total return products
• Good entry point into EM HY credits?
‐ HY corporates are trading at spread of 647bps implying a 6% default rate versus BlueBay projections of 1.9% default rate. We feel the p g p p p y g y p jdefault rate is not justified given high liquidity cushion and low leverage
‐ We see pockets of opportunities in (1) credit re‐rating theme with corporates benefiting from sovereign upgrades; (2) M&A opportunities; (3) equity like returns for performing HY credits (in particular in Asia)
• Where is value in EM IG credits?
‐ HG corporate are now trading at 289bps and on average still trade close to double the spread of similar rated corps in US. However EM IG corps have the strongest liquidity historically and maintain lower leverage then developed markets counterparts
‐ We see pockets of opportunities in (1) new issue market offering substantial premium versus secondary; (2) credit re‐rating theme with We see pockets of opportunities in ( ) new issue market offering substantial premium versus secondary; ( ) credit re rating theme withcorporates benefiting from sovereign upgrades; (3) Strong technicals in particular in EM IG defensive sectors
• Opportunities in EM Corporate Total Return products?
Large dispersion of returns due to the early development stage of the EM corporate asset class breadth of the universe and a small‐ Large dispersion of returns due to the early development stage of the EM corporate asset class, breadth of the universe and a small dedicated investor base. Spread differential between worst and best performers reaching close to 100% this year
‐ Multiple alpha strategies including credit long‐short, event driven, capital structure, special situations and local EM corporates
‐ We expect bottom‐up credit selection to be the main driver of returns
18Data source: BlueBay Asset Management, JP Morgan, as at 08 November 2011

Contents
• Emerging Market Corporate Debt – an asset class that has emerged g g p g
• Emerging Market Corporate Debt at BlueBay
19
EM Corporate Debt at BlueBayEvolution
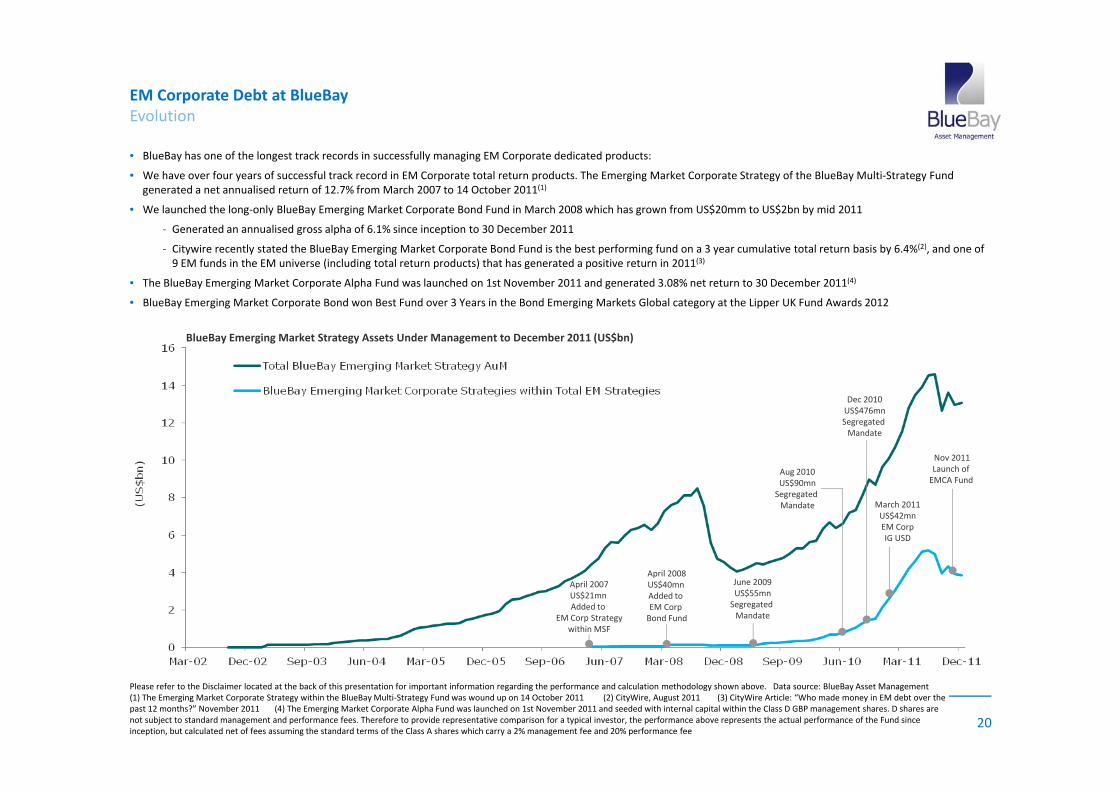
• BlueBay has one of the longest track records in successfully managing EM Corporate dedicated products:
• We have over four years of successful track record in EM Corporate total return products. The Emerging Market Corporate Strategy of the BlueBay Multi‐Strategy Fund generated a net annualised return of 12.7% from March 2007 to 14 October 2011(1)
• We launched the long‐only BlueBay Emerging Market Corporate Bond Fund in March 2008 which has grown from US$20mm to US$2bn by mid 2011
‐ Generated an annualised gross alpha of 6.1% since inception to 30 December 2011
‐ Citywire recently stated the BlueBay Emerging Market Corporate Bond Fund is the best performing fund on a 3 year cumulative total return basis by 6.4%(2), and one of 9 EM funds in the EM universe (including total return products) that has generated a positive return in 2011(3)
• The BlueBay Emerging Market Corporate Alpha Fund was launched on 1st November 2011 and generated 3.08% net return to 30 December 2011(4)
• BlueBay Emerging Market Corporate Bond won Best Fund over 3 Years in the Bond Emerging Markets Global category at the Lipper UK Fund Awards 2012BlueBay Emerging Market Corporate Bond won Best Fund over 3 Years in the Bond Emerging Markets Global category at the Lipper UK Fund Awards 2012
BlueBay Emerging Market Strategy Assets Under Management to December 2011 (US$bn)
Aug 2010US$90mn
Dec 2010US$476mnSegregated Mandate
Nov 2011Launch of EMCA Fund
April 2008
US$90mnSegregated Mandate March 2011
US$42mnEM Corp IG USD
April 2008US$40mn Added to EM Corp Bond Fund
June 2009US$55mnSegregated Mandate
April 2007US$21mn Added to
EM Corp Strategywithin MSF
20
Please refer to the Disclaimer located at the back of this presentation for important information regarding the performance and calculation methodology shown above. Data source: BlueBay Asset Management (1) The Emerging Market Corporate Strategy within the BlueBay Multi‐Strategy Fund was wound up on 14 October 2011 (2) CityWire, August 2011 (3) CityWire Article: “Who made money in EM debt over the past 12 months?” November 2011 (4) The Emerging Market Corporate Alpha Fund was launched on 1st November 2011 and seeded with internal capital within the Class D GBP management shares. D shares are not subject to standard management and performance fees. Therefore to provide representative comparison for a typical investor, the performance above represents the actual performance of the Fund since inception, but calculated net of fees assuming the standard terms of the Class A shares which carry a 2% management fee and 20% performance fee

EM Corporate Debt at BlueBayBlueBay EM Corporate Product Offering
Details BlueBay EM Corporate Fund BlueBay EM IG Corporate Fund BlueBay EM HY Corporate Fund BlueBay EM Corporate Alpha FundLaunch Date 31 March 2008 15 March 2011 17 January 2012 01 November 2011Type /Regulation UCITS/ Part 1 SICAV UCITS/ Part 1 SICAV UCITS/ Part 1 SICAV Cayman Master Fund
h l f h l f h l f h b l k d dInvestment Objective
Achieve a total return in excess of CEMBI Diversified from portfolio of EM Corporate Issuers
Achieve a total return in excess of CEMBI IG Diversified from portfolio of EM IG Corporate Issuers
Achieve a total return in excess of CEMBI HY Diversified from portfolio of EM HY Corporate Issuers
Achieve absolute risk‐adjusted return through long and short exposures mainly in EM corproate fixed income instruments
Benchmark CEMBI Div CEMBI IG Div CEMBI HY Div noneTarget Alpha 300bps per annum, gross of fees 200bps per annum, gross of fees 300bps per annum, gross of fees 12%‐15% net absolute returnTarget Tracking Error 0‐6% relative to index 0‐4% relative to index 0‐6% relative to index N/ATarget Information Ratio >0 5 >0 5 >0 5 N/ATarget Information Ratio >0.5 >0.5 >0.5 N/A
Principal Investments At least two thirds of net assets invested in EM Corporates
At least two thirds of net assets invested in EM IG Corporates. Max HY limit of 15%
At least two thirds of net assets invested in EM HY Corporates
Invested mainly in EM corporates in Hard Currency,Local Currency and through derivatives
Liquidity Weekly Daily WeeklyMonthly (60 days notice period on redemptions)
L N N N0‐4x maximum gross leverage, 2x
i h t l 2 iLeverage None None None maximum short leverage, 2x maximum long leverage
Short SellingUncovered short positions not permitted, short positions only via derivatives and CDS
Uncovered short positions not permitted, short positions only via derivatives and CDS
Uncovered short positions not permitted, short positions only via derivatives and CDS
Short positions permitted via cash bonds, derivatives and CDS
Must invest at least 2/3 of its total net assets excuding ancillary liquid assets
Must invest at least 2/3 of its net assets (excluding ancillary liquid assets) in
Must invest at least 2/3 of its net assets (excluding ancillary liquid assets) in
Core Investment Restriction
assets excuding ancillary liquid assets directly or indirectly issues by emerging market corporate issuers and in unrated debt securities and distreseed debt securities.
fixed income securities rated investment grade and issued by corporate issuers which are domiciled or have significant operations in an Emerging Market Country.
fixed income securities rated below investment grade and issued by corporate issuers which are domiciled or have significant operations in an Emerging Market Country.
Key Concentration Guidelines
Exposure limited to 5% of any one issuer, this may be increased to 10%
Exposure limited to 5% of any one issuer, this may be increased to 10%
Exposure limited to 5% of any one issuer, this may be increased to 10%
20% i li itKey Concentration Guidelines , yprovided that exposures over 5% in aggregate do not exceed 40%
, yprovided that exposures over 5% in aggregate do not exceed 40%
, yprovided that exposures over 5% in aggregate do not exceed 40%
20% issuer limit
Internal Country Guidelines Max country exposure of 20% of NAV Max country exposure of 20% of NAV Max country exposure of 20% of NAV
Max country exposure of 40% of NAV (if rated Investment Grade), Max country exposure of 20% of NAV (if rated High Yield)
i i li i VAR not to exceed 200% of VAR of the VAR not to exceed 200% of VAR of the VAR not to exceed 200% of VAR of the Controlled within the 0‐4x maximum
21Data source: BlueBay Asset Management
Derivative limits VAR not to exceed 200% of VAR of the benchmark
VAR not to exceed 200% of VAR of the benchmark
VAR not to exceed 200% of VAR of the benchmark
Controlled within the 0 4x maximum leverage band

EM Corporate Debt at BlueBayA dedicated team of 27 investment professionals
Risk Management, Compliance & Legal
Dominique Kobler
• Experience: The team has an average investment
EM Investment Team
7 Portfolio ManagersDavid Dowsett (Senior)Neil Phillips (Senior)
P li K d k (S i C t )
Dominique Kobler(Head of Risk & Performance)
Steve Thomas(Global Head of Compliance)
James Brace (General Counsel)
Lucien Orlovius(Head of Transactional Legal) p g
experience of 12 years
• Participation at Investment Committee: Senior
investment professionals across all product areas are
Polina Kurdyavko (Senior ‐ Corporates)Adam Borneleit (Corporates)
Nick ShearnJonathan FaymanSteven Murphy
4 Assistant Portfolio ManagersChristian Libralato
A h K l (C )
(Head of Transactional Legal)
members of the Investment Committee, chaired by
the CIO
• Dedicated research: Supported by a dedicated unit of
Emerging Market analysts with range of expertise
Anthony Kettle (Corporates)Colin Read
Matthew Garnett
10 AnalystsJo Morris
Rodrigo da Fonseca (Economist)Stanislav Gelfer (Economist)
including sovereign, local currency and corporate debtTrade Execution
John Orrock(Head of Trade Execution)
Jane Lewis (Execution Trader – EM)
Nicholas Wood (Execution Trader – EM)
Shikeb Farooqui (Economist)Lucy Miller (Corporates)
Kaushik Rambhiya (Corporates)Amanda Gray (Corporates) Sven Scholtze (Corporates)Alan Siow (Corporates)
Magashlin Chetty (Corporates)
Investment Committee*Mark Harrison
(Execution Trader – EM)
Mike McGill(Execution Trader – EM)
Vanessa Fleming(Execution Product Specialist – EM)
Desk AssistantAdrian Hall
Investment Committee
Mark Poole (CIO)+18 additional members
22Data as at 31 March 2012

EM Corporate Debt at BlueBayFocus on bottom‐up credit research
• Our research process is based on thorough bottom‐up credit work while factoring in the macro environment. Our investment has an emphasis on alpha generation and the preservation of capital
Company Analysis
(PM, EM Corp Analyst)
• Strategy
• Sustainable competitive advantage
Covenants & Structure
(PM, EM Corp Analyst, Transactional and External Legal Counsel)
• Covenants
Other Investment Factors
• Identifiable catalyst
• Downside valuation
Sustainable competitive advantage
• Management and owners
• Cash flow generating ability
• Leverage
• Business and asset valuation
• Collateral, security package ‐ size relative to debt and ease of realization
• Legal jurisdiction considerations
Investment Opportunity
‘Bottom‐Up’ Factors
Country Factors
(EM S i )
Industry Dynamics
(IG HY EM l )
Global Macro Outlook
(Gl b l M T
‘Top‐Down’ Factors
(EM Sovereign team)
• GDP growth
• Inflation
• Business and legal environment
• Political risk
(IG, HY, EM sector analysts)
• Cyclical / defensive
• Nature of competition
(Global Macro Team, Investment Committee)• Global growth
• Market technicals
• Credit conditions
23Data source: BlueBay Asset Management

EM Corporate Debt at BlueBayLong Only Products – BlueBay Emerging Market Corporate Bond Fund
1M 3M YTD 1YR 2YR* 3YR* Ann SI*
Performance (US$ gross of fees to 30 March 2012)
1M 3M YTD 1YR 2YR* 3YR* Ann. SI*
BlueBay Funds ‐ BlueBay Emerging Market Corporate Bond Fund 0.24% 5.75% 5.75% 8.17% 10.73% 22.55% 15.35%
JP Morgan Corporate Emerging Market Bond Index (CEMBI) Diversified 0.11% 5.62% 5.62% 7.51% 8.68% 17.95% 9.60%
Alpha 0.13% 0.13% 0.13% 0.66% 2.05% 4.60% 5.75%
80%
100%Cumulative Gross Relative Performance (to 30 March 2012)
BlueBay Funds ‐ BlueBay Emerging Market Corporate Bond FundJP Morgan Corporate Emerging Market Bond Index Diversified
Risk/Return Characteristics – Actual Annualised SI
Characteristic Target
Al h 5 75%3.0% p.a
40%
60%
Alpha 5.75%p
gross of fees
Beta 0.66 ‐
Tracking Error 5.33 0‐6%
0%
20%Information Ratio 1.08 >0.5
Standard Deviation – Fund 8.09 ‐
S d d D i i I d 10 76
‐40%
‐20%
‐08
g‐08 ‐09
‐09
‐09
‐10
g‐10 ‐11
y‐11 ‐11
‐12
Standard Deviation – Index 10.76 ‐
24
Mar
Aug
Jan
Jun
Oct
Mar
Aug
Jan
May Oct
Mar
Data source: BlueBay Asset Management Fund Type: UCITS IV Fund (Part I SICAV) *Annualised return. Fund inception date: 31 March 2008Please refer to the Disclaimer located at the back of this presentation for important information regarding the performance shown above

EM Corporate Debt at BlueBayLong Only Products – BlueBay Emerging Market Corporate Bond Fund
Weekly Performance Since Inception* to 21 Feb 2012: BlueBay Emerging Market Corporate Bond Fund vs Index**
60%
80%
100%Weekly Performance Since Inception to 21 Feb 2012: BlueBay Emerging Market Corporate Bond Fund vs Index
Percentage of
Weeks when index rose Weeks when index fell
56.6%
83.6%
20%
40%
60%weeks outperformed
since inception
43.4%
16.4%
20%
0%
Percentage of weeks underperformed
60%
40%
BlueBay Emerging Market Corporate Bond Fund ahead of Index
weeks underperformedsince inception
100%
80%
BlueBay Emerging Market Corporate Bond Fund behind Index
• Demonstrates value of issuer selection and use of selective risk management instruments
25Data source: BlueBay Asset Management. *Fund inception date: 31 March 2008 **Index = JP Morgan Corporate Emerging Market Bond Index Diversified in USD

EM Corporate Debt at BlueBayLong Only Products – BlueBay Emerging Market Investment Grade Corporate Bond Fund
1M 3M YTD Cum SI*
Performance (US$ gross of fees to 30 March 2012)
1M 3M YTD Cum. SI*
BlueBay Funds ‐ BlueBay Emerging Market Investment Grade Corporate Bond Fund 0.48% 4.97% 4.97% 11.05%
JP Morgan Corporate Emerging Market Diversified High Grade Index 0.13% 4.23% 4.23% 8.61%
Alpha 0.35% 0.74% 0.74% 2.44%
12.0%
14.0%
2.44%
Risk/Return CharacteristicsCumulative Gross Relative Performance (to 30 March 2012)
JP Morgan CEMBI Diversified High Grade IndexBlueBay Emerging Market Investment Grade Corporate Bond Fund
8.0%
10.0%2.0% p.a. gross of fees
1 68
Alpha
2.0%
4.0%
6.0%>0.5
1.68Information
RatioActual Cumulative SI
Target
‐2.0%
0.0%
2.0%
11 ‐11
‐11
‐11
‐11
‐11
‐11
‐11
‐11
‐11
‐12
‐12
12
0‐4%
1.47%
0 1 2 3 4 5
Tracking Error
26
Mar‐
Apr ‐
May‐
Jun‐
Jul‐
Aug‐
Sep‐
Oct‐
Nov
‐
Dec
‐
Jan‐
Feb‐
Mar‐
Data source: BlueBay Asset Management Fund Type: UCITS IV Fund (Part I SICAV) *Cumulative return. Fund inception 15 March 2011Please refer to the Disclaimer located at the back of this presentation for important information regarding the performance shown above
EM Corporate Debt at BlueBayLong Only Products – BlueBay Emerging Market High Yield Corporate Bond Fund
1M Cum SI*
Performance (US$ gross of fees to 30 March 2012)
1M Cum. SI*
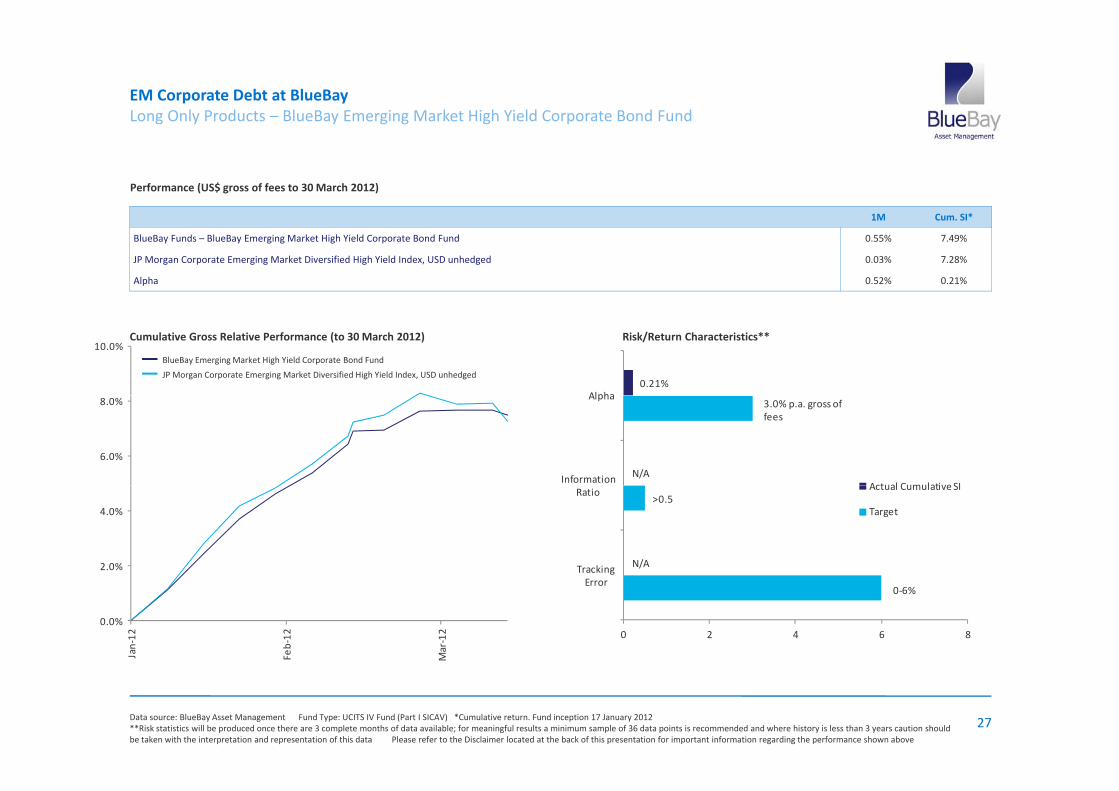
BlueBay Funds – BlueBay Emerging Market High Yield Corporate Bond Fund 0.55% 7.49%
JP Morgan Corporate Emerging Market Diversified High Yield Index, USD unhedged 0.03% 7.28%
Alpha 0.52% 0.21%
10.0%
0.21%Alpha
Risk/Return Characteristics**Cumulative Gross Relative Performance (to 30 March 2012)
JP Morgan Corporate Emerging Market Diversified High Yield Index, USD unhedged
BlueBay Emerging Market High Yield Corporate Bond Fund
6.0%
8.0% 3.0% p.a. gross of fees
N/AInformation
Alpha
Actual Cumulative SI
2.0%
4.0%>0.5
N/ATracking
Ratio Actual Cumulative SI
Target
0.0%
Jan‐12
Feb‐12
Mar‐12
0‐6%
0 2 4 6 8
Error
27Data source: BlueBay Asset Management Fund Type: UCITS IV Fund (Part I SICAV) *Cumulative return. Fund inception 17 January 2012 **Risk statistics will be produced once there are 3 complete months of data available; for meaningful results a minimum sample of 36 data points is recommended and where history is less than 3 years caution should be taken with the interpretation and representation of this data Please refer to the Disclaimer located at the back of this presentation for important information regarding the performance shown above

EM Corporate Debt at BlueBayPerformance of BlueBay Emerging Market Corporate Alpha Fund
• EM corporate alpha fund seeks to achieve total return though taking long and short exposures mainly in EM corporate fixed income instruments (both USD and Local currency) exploiting the high levels of dispersion in this asset class
• The Fund’s positioning is based on idiosyncratic, bottom-up fundamental credit views on single name EM Corporates using any of credit long/short, event driven, capital structure, opportunistic and special situation opportunities C f f ’• Corporate Alpha fund leverages credit expertise of BlueBay’s market-leading EM debt investment team, including what we believe is the largest dedicated EM corporate debt group
BlueBay Emerging Market Corporate Alpha Fund
Cumulative Net Performance (to 30 March 2012)
10 0%
12.0%
% R
etur
n
6.0%
8.0%
10.0%
%
2.0%
4.0%
Performance (%) Net of Fees (USD) of BlueBay Emerging Market Corporate Alpha Fund*
0.0%01‐Nov‐11 01‐Dec‐11 31‐Dec‐11 30‐Jan‐12 29‐Feb‐12 30‐Mar‐12
Jan Feb Mar Apr May Jun Jul Aug Sep Oct Nov Dec YTD
2012 3.39 2.65 1.20 7.40
2011 ‐‐‐ ‐‐‐ ‐‐‐ ‐‐‐ ‐‐‐ ‐‐‐ ‐‐‐ ‐‐‐ ‐‐‐ ‐‐‐ 1.59 0.59 2.19
*The BlueBay Emerging Market Corporate Alpha Fund was launched and seeded with internal capital within the Class D GBP management shares. D shares are not subject to standard management and performance fees.
28Please refer to the Disclaimer located at the back of this presentation for important information regarding the performance and calculation methodology shown aboveData Source: BlueBay Asset Management
e ue ay e g g a e o po a e p a u d as au c ed a d seeded e a cap a e ass G a age e s a es s a es a e o subjec o s a da d a age e a d pe o a ce eesTherefore to provide representative comparison for a typical investor, the performance above represents the actual performance of the Fund since inception, but hedged in USD and calculated net of fees assuming the standard terms of the Class A shares which carry a 2% management fee and 20% performance fee.

Contact Information
For further information please contact the following:
Jane De La Haye Partner, Head of Marketing & Client Service Tel: +44 20 7389 3773
Mattias Højmark‐Jensen Partner, Head of Sales – Europe, Middle East and Africa Tel: +44 20 7389 3724
Roberto Valsecchi Oliva Head of Sales – Central & Southern Europe Tel: +44 20 7389 3686Roberto Valsecchi Oliva Head of Sales Central & Southern Europe Tel: 44 20 7389 3686
Pierre Giannini Sales Manager Tel: +44 20 7389 3333
29

Disclaimer
This document is issued by BlueBay Asset Management LLP, which is authorised and regulated by the UK Financial Services Authority (FSA) and registered with the US Securities and Exchange Commission (SEC) as an InvestmentAdviser. BlueBay Asset Management USA LLC is a subsidiary of BlueBay Asset Management (Services) Ltd.
The document is intended for “professional clients” and “eligible counterparties” (as defined by the FSA handbook of rules and guidance) only and should not be relied upon by any other category of customer. This documentdoes not constitute an offer to sell or the solicitation of an offer to purchase any security or investment product in any jurisdiction. Any such offer or solicitation may only be made by means of delivery of an approvedconfidential Prospectus. This document is confidential and may not be distributed without the express written consent of BlueBay Asset Management LLP.
No BlueBay Fund will be offered, except pursuant and subject to the offering memorandum and subscription materials (the "Offering Materials"), which may be provided to Canadian permitted clients only, and not to any othercategory of investor. This document is for general information only and is not a complete description of an investment in any BlueBay Fund. If there is an inconsistency between this document and the Offering Materials for theBlueBay Fund, the provisions in the Offering Materials shall prevail.
Information herein is believed to be reliable but BlueBay Asset Management LLP does not warrant its completeness or accuracy. The opinions expressed within are entirely those of BlueBay and do not constitute an offer ofinvestment advice. All information provided in this document is for informational purposes only and should not be deemed as a guide to investing or a recommendation to buy the securities mentioned. BlueBay closelymonitors the markets and may make changes to BlueBay’s investment strategy or outlook when warranted by changing market conditions. There is no guarantee that the opinions expressed herein will be valid beyond the dateof this document.
Any indices shown are presented only to allow for comparison of the BlueBay funds performance to that of certain widely recognised indices. The volatility of the indices may be materially different from the individualy p y p y p y g y y yperformance attained by a specific fund or investor. In addition, the BlueBay fund holdings may differ significantly from the securities that comprise the indices shown. Investors cannot invest directly in an index.
Gross performance figures reflect the reinvestment of all dividends and earnings, but do not reflect the deduction of investment management and performance fees. An investor’s return will be reduced by the deduction of theapplicable fees, which will vary with the rate of return on the fund. For example, the compounding effect of a 0.60% management fee and a 0.20% performance fee would reduce annualised returns from 10% to 9.32% over a 5year period. In addition, the typical fees and expenses charged to a fund will offset the funds trading profits. A description of the specific fee structure for each BlueBay fund is contained in the fund’s Prospectus.
Net performance figures reflect the reinvestment of all dividends and earnings, and the deduction of investment management and performance fees. In addition, the typical fees and expenses charged to a fund will offset thefunds trading profits. A description of the specific fee structure for each BlueBay fund is contained in the fund’s Prospectus. Figures may not sum due to rounding.
Hypothetical/forecast performance figures are based on the stated facts and assumptions. No representation is being made that BlueBay Funds will or are likely to achieve profits or losses similar to those shown. There areyp p g p p g y y pfrequently sharp differences between hypothetical/forecast performance results and the actual results subsequently achieved by any particular investment or trading strategy. There are numerous other factors related to themarkets in general or to the implementation of any specific investment or trading strategy which cannot be fully accounted for in the preparation of hypothetical/forecast performance results and all which can adversely affecttrading results.
The performance track record may include a named fund manager’s activity for and on behalf of their previous firm in their capacity as the named fund manager of a named fund. Investors should be aware that anyperformance should not be attributed solely to that named fund manager as it derived from their previous firm’s investment process and support functions.
Risk statistics are annualized and calculated using weekly data points since inception. Risk statistics will be produced once there are 3 complete months of data available; for meaningful results a minimum sample of 36 datapoints is recommended and where history is less than 3 years caution should be taken with the interpretation and representation of this data. Returns for periods of less than 1 year have not been annualized in accordance withcurrent industry standard reporting practices.
Past performance will not necessarily be repeated and is not indicative of future results. The investments discussed may fluctuate in value and you may not get back the amount invested. There is no guarantee that theobjectives shown will be achieved. Changes in rates of exchange may have an adverse effect on the value of investments. Investment in derivatives may involve a high degree of gearing or leverage, so that a relatively smallmovement in the price of the underlying investment results in a much larger movement in the price of the instrument, as a result of which prices are more volatile. The BlueBay funds are subject to various other risk factors andconflicts of interest. For further information regarding the risk factors and conflicts of interest with respect to each BlueBay fund please refer to the fund’s Prospectus.
Any investor who proposes to subscribe for an investment in any of the BlueBay funds must be able to bear the risks involved and must meet the respective fund’s suitability requirements. No assurance can be given that afund’s investment objectives will be achieved. BlueBay fund investments may be speculative and involve a substantial degree of risk. The funds may be leveraged and engage in other speculative investment practices that mayincrease the risk of investment loss. An investor must realise that he or she could lose all or a substantial amount of his or her investment in a BlueBay fund. The investments and strategies discussed here may not be suitablefor all investors; if you have any doubts you should consult your investment adviser.
Investments in the BlueBay funds may be highly illiquid and there may not be a secondary market for an investor’s interest in the funds, in which case none should be expected to develop. There are restrictions on transferringinterests in the funds. The fees and expenses charged to a fund may offset the funds trading profits. The instruments in which the funds invest may involve complex tax structures and there may be delays in distributingimportant tax information. The funds are not required to provide periodic pricing or valuation information to investors with respect to its individual investments.
BlueBay is not registered under securities laws in Canada and is relying on the international dealer exemption under applicable provincial securities legislation, which permit BlueBay to carry out certain specified dealer activitiesfor those Canadian residents that qualify as "a Canadian permitted client”, as such term is defined under applicable securities legislation in Canada.
® Registered trademark of Royal Bank of Canada. RBC Global Asset Management is a trademark of Royal Bank of Canada.
30V1 – Data end Mar 2012. Published 25 April 2012
No part of this document may be reproduced in any manner without the prior written permission of BlueBay Asset Management LLP. Copyright 2012 © BlueBay, the investment manager, advisor and global distributor of theBlueBay Funds, is a wholly‐owned subsidiary of Royal Bank of Canada and the BlueBay Funds may be considered to be related and/or connected issuers to Royal Bank of Canada and its other affiliates. BlueBay AssetManagement LLP, registered office 77 Grosvenor Street, London W1K 3JR, England, registered in England and Wales number OC370085. All rights reserved.