Embed Size (px)
Citation preview


A short Intro
“Capital” in a nutshell:Structure of the book
Findings of the book
Data and methodology
Income and Capital:Income and Output
Growth: Illusions and Realities
The dynamics of Capital/Income Ratio:The metamorphosis of Capital
The Capital/Income Ratio of the Long Run
The Capital – Labor Split in the Twenty-First Century

A Short Intro

• Professor of Macro-Economics at the ParisSchool of Economics.
• Director of EHESS.
• Author of numerous articles (published injournals such as the Quarterly Journal ofEconomics, the Journal of PoliticalEconomy, the American Economic Reviewand the Review of Economic Studies) and ofa dozen books.
• Major historical and theoretical works onthe interplay between economicdevelopment and the distribution ofincome and wealth.
Who’s Piketty?

Recent publications:
• Le capital au XXIème siècle (T. Piketty, Le seuil, 2013);
• Capital is Back: Wealth-Income Ratios in Rich Countries 1700-2010 (T. Piketty, G. Zucman, 2013);
• A Theory of Optimal Inheritance Taxation (T. Piketty, E. Saez, Econometrica, 2013);
• World Top Incomes Database (F. Alvaredo, T. Atkinson, T. Piketty, E.Saez, 2011-2013).

What are the grand dynamics that drive the accumulation and
distribution of capital?
How is the concentration of wealth in the long run?
Given such concentration, how is the long-term evolution of inequality?
Which are the main drivers of inequality?
What can prevent inequality?
What should we do to reduce inequality?
Relevant questions in Piketty’s literature:

Piketty tried to answer all these questions in:

“Capital” in a nutshell

Structure of the book:
The book has three main parts:
A history of inequality and wealth (Parts I &II);
A forecast of how things will evolve over the next century
(Part III);
Policy reccomendations, such as global tax on wealth (Part
IV).

Findings of the book:
• The history of the distribution of wealth has always been deeply political, and it cannot be reduced to purely economic mechanisms;
• The dynamics of wealth distribution reveal powerful mechanisms pushing alternately toward convergence and divergence;
• No matter how powerful a convergent force may be, it can be overwhelmed by stronger forces pushing in the opposite direction, toward greater inequality;
• The fundamental force for divergence is represented by: r > g
Fundamental Force: r > g
“If the rate of return on capital remainssignificantly above the growth rate for anextended period of time (more likely when thegrowth rate is low), then the risk of divergence inthe distribution of wealth is very high”.

• More precisely, when the rate of return on capital exceeds the growth rate ofeconomy, then the inherited wealth growth faster than output and income;
• People with inherited wealth need save only a portion of their income fromcapital to see the capital growth more quickly than the economy as a whole;
• In such case, the concentration of wealth will attain extremely high levelsincompatible with meritocratic values and principles of social justice;
• Empirical evidence and historical data of XIX and XX centuries would show such inequality pattern.
Growth of inequality as central issue!

Data and methodology:
1. Sources dealing with inequality and distribution of income:
World Top Income Database (WTID) as primary source of data;
High incomes estimated from tax data based on stated incomes;
National income and average income derived from nationalaccounts;
Data series begin when an income tax is established (1910 – 1920).
2. Sources dealing with distribution of wealth and relation of wealthto income:
Changes in inequality of wealth estimated from estate tax returns;
Data on wealth and inheritance;
Total stock of national wealth (lands, other real estate, ecc.) derivedfrom capital/income ratio: misure of wealth in terms of years ofnational income required to amass it.
Reliance primarily on data of US, Japan, Germany, France, UK.

In this presentation we discuss Parts I and II of the book
In particular:
We introduce the concept of national income, capital and capital/income ratio;
We discuss how the global distribution of income and wealth has evolved;
We examine the long-run evolution of the capital-income ratio;
We show the global division of income between labor and capital in 21 Century;
We examine global historical experiences of the evolution of the capital/income
ratio and the relative shares of capital and labor.

Income and Capital

Income and Output
National income: sum of all income available to the residents of a givencountry in a given year, regardless of the legal classification.
Domestic output[GDP – Depreciation = (usually 90% of GDP)]
+
Net income from abroad[Income received by the country from investments abroad]
=
National Income

National income can be decomposed as follows:
National income = capital income + labor income
Capital income: sum of all non-human assets that can be ownedand exchanged on some market (real properties, financial assets, ecc.);
To Piketty the words “Capital income” and “Wealth” are perfectly interchageably.
National Wealth = Private Wealth + Public Wealth

National Wealth can be broken down in:
National Wealth = Domestic Capital + Net Foreign Capital
Domestic Capital: value of the capital stock (buildings, firms, etc.) located within the borders of a country;
Net Foreign Capital: difference between assets owned by the country’s citizens in the rest of the world and assets of the country owned bycitizens of other countries.
Which rule ties together Income & Capital?
Capital/Income ratio:
Income is a flow: quantity of goods produced and distributed in a given period.
Capital is a stock: total wealth owned at a given point. This stock comes from the wealth accumulated in all prior years combined.
Then, we can measure the capital stock of a country (β) by dividing that stock by the annual flow of income:
β = Capital/Income
[Ex.: β = 6 (or 600%) means that a country’s total capital stock is the equivalent ofsix years of national income].

First Foundamental Law of Capitalism: α = r x β
r = rate of return on Capital;
This law links the Capital stock to the flow of Income from Capital;
[Ex.: if β = 600% and r = 5%, then α = r x β = 30% ]
In other words, if national wealth represents the equivalent ofsix years of national income, and if the rate of return on capitalis 5 %, then capital’s share in national income is 30%.
Very important law: it expresses a simple relationship amongthe 3 most important concepts of capitalist system and allow usto analyze the importance of capital for an entire country.

How these abstract quantities can be measured?
Data on distribution of Global Production show that:
In Western Countries national income is roughly 30,000-35.000 € per capita;
Global inequality ranges from regions in which the per capita income is on order of
150-250 Euros per month to regions where it is as high as 2.500 – 3.000 Euros per
month. Global average is around 600-800 euro per month.
Global income distribution is more unequal than the output distribution:
countries with the highest per capita output are also more likely to own part of the
capital of other countries and therefore to receive a positive flow of income from
capital originating in countries with a lower level of per capita output.
Don’t forecast convergence of per capita income between rich and poor nations.

Growth: Illusions and Realities
Growth must be decomposed in two terms: population growth and percapita output growth;

1) Population Growth:
Piketty implies that we are returning to very low level of growth, at leastinsofar as the demographic component is concerned.
Demographic growth has important implications for the structure ofinequality: indeed, strong demographic growth tends to play an equalizingrole because it decreases the importance of inherited wealth;

A stagnant or decreasing population increases the influence of capitalaccumulated in previous generations;
The same intuition can be applied to economic stagnation: with low growth, it’splausible that the rate of return on capital will be substantially higher than theeconomic growth rate;
Furthermore when growth is zero, the various economic and social functions aswell as professional activities, are reproduced virtually without change fromgeneration to generation.
Greater Inequality
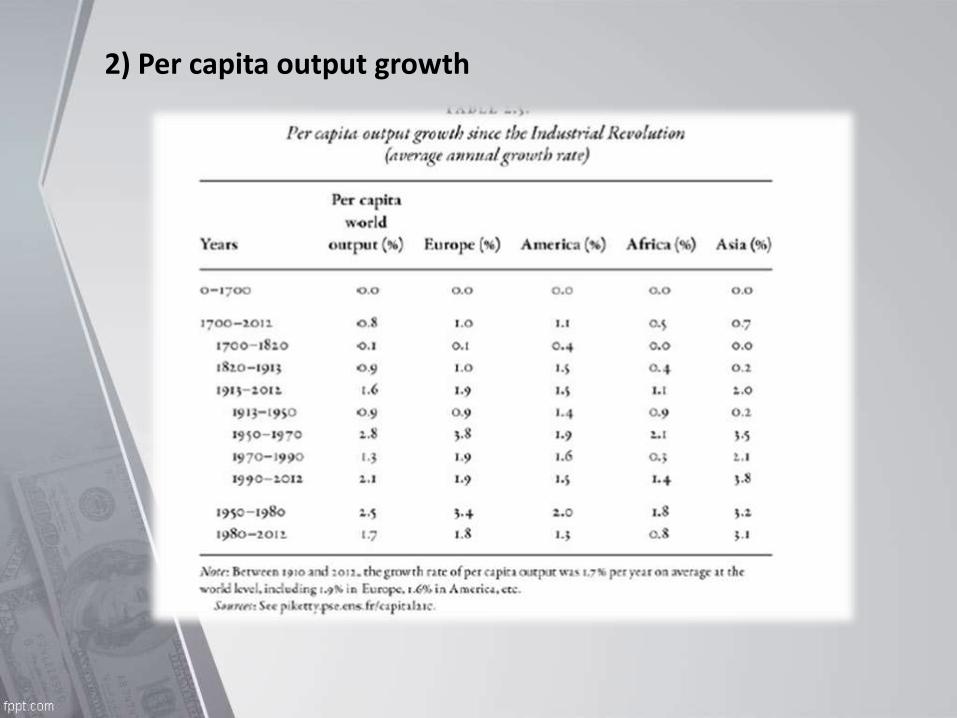
2) Per capita output growth

With these preliminaries what can we say about future growth?
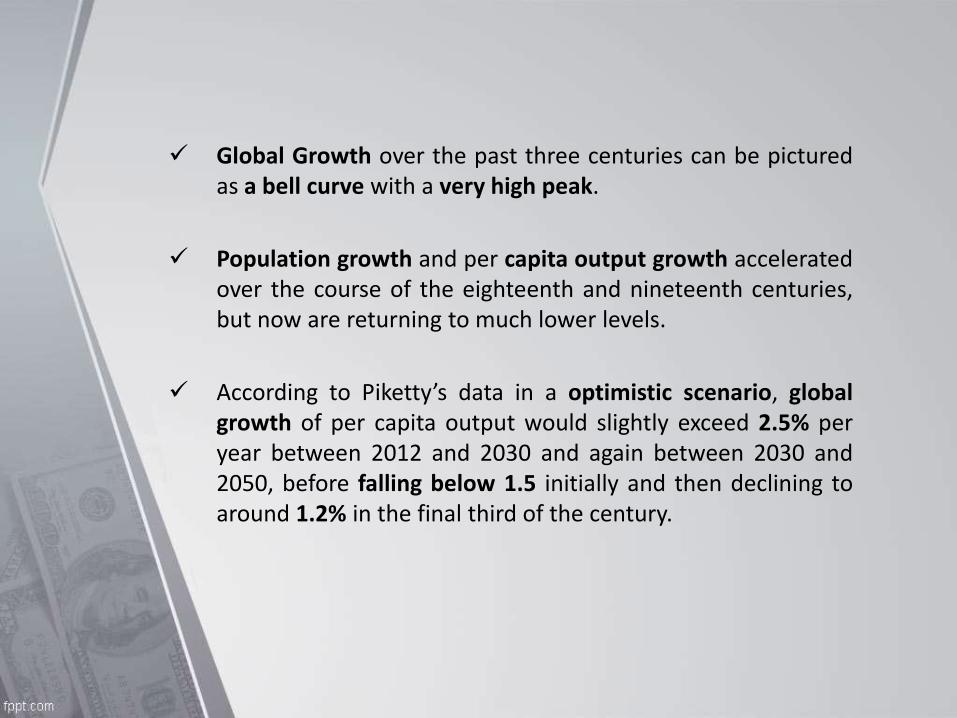
Global Growth over the past three centuries can be picturedas a bell curve with a very high peak.
Population growth and per capita output growth acceleratedover the course of the eighteenth and nineteenth centuries,but now are returning to much lower levels.
According to Piketty’s data in a optimistic scenario, globalgrowth of per capita output would slightly exceed 2.5% peryear between 2012 and 2030 and again between 2030 and2050, before falling below 1.5 initially and then declining toaround 1.2% in the final third of the century.

If we add the two curves (both of Population Growth and of PerCapita Output Growth) we obtain a third curve as follow:
The growth rate of world output will drop below 3.5% in 2030-2050 and then to roughly 1.5% during the second half of the XXIc.

The Dynamics of the Capital/Income Ratio

The Metamorphoses of Capital
What is the evolution of capital stock as measured by the capital/incomeratio?
How did the nature of the wealth change over time?
(Britain 1700-2010)
(France 1700 - 2010)

Capital/Income ratio in both countries followed similar trajectories.
National capitals fluctuated between six and seven years of national income up to1914. Then plumbed during World Wars and began to climb afterwards (U-shapedcurve).
In the end, by 2010, the capital/income ratio had returned to its pre-World War Ilevel.
What is changed then is the composition of national capital since 1700: oncemainly land, now became primarily industrial and financial assets.
[National capital = farmland + housing + other domestic capital + net foreign capital]
Piketty suggests that the structure of national capital has been transformed since1700 while preserving the same value in terms of annual income.

(Germany 1700 - 2010)
All available sources indicate that the changes observed in Britain, France andGermany are representative of the entire continent: although interestingvariations do exist, the overall pattern is the same.
This phenomenon affected all European Countries.
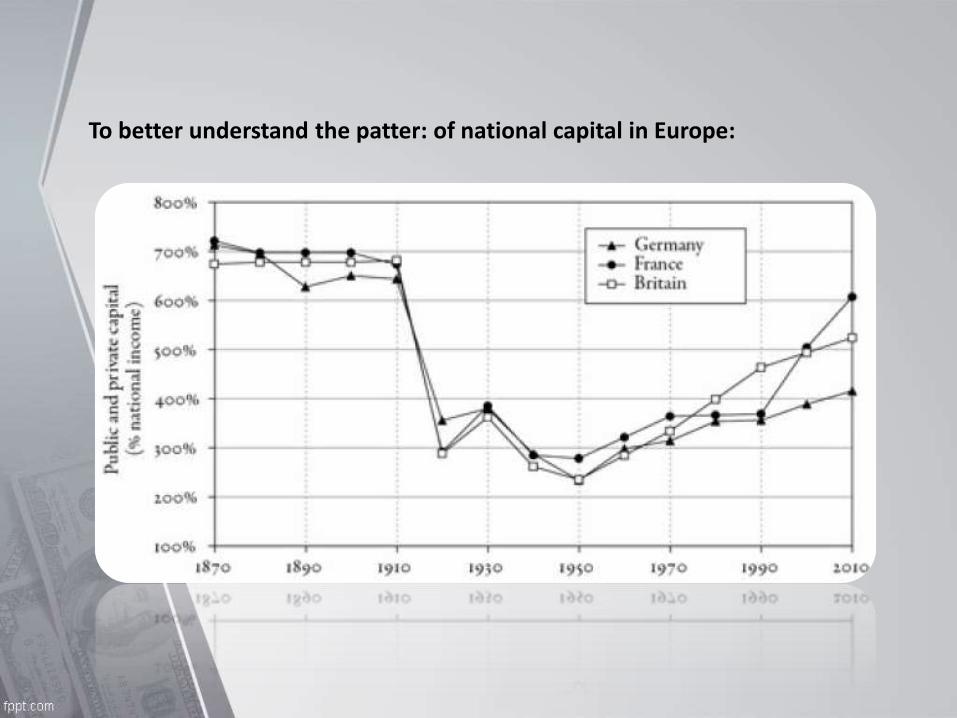
To better understand the patter: of national capital in Europe:

Capital in America: more stable than in Europe
In US capital mattered less then Europe: national capital was scarcely morethan 3 years of national income when US declared Independence. Why?
There was so much land that its market value was very low: the price effectmore than counterbalanced the volume effect.
Also other types of capital were less important: new arrivals – a largefraction of US population, did not cross the Atlantic with their capitals; thenit took time to accumulate the equivalent of years of national income.

Net Foreign capital have also had limited importance in US. This is because USnever became a colonial power itself. They have been at times positive, at timesnegative but always of relative limited importance. (less than 5%).
However, a key difference in US capital structure was the market of slaves. In1800 slaves represented nearly 20% of population for a total market value of ayear and half of US national income.
If we add the values of slaves along with other component of wealth, we findthat the total American wealth has remained stable from the colonial era to thepresent, at around four a half years of national income.

The Capital/Income Ratio over the Long Run
So far we have seen that the nature of capital was totallytransformed but the total value of capital stock, measured inyears of national income, did not change very much over a longperiod of time.
However since 1950 we see in all countries a steady increase ofthe capital/income ratio. Why?
What forces imply that capital in one society should be worth sixor seven years of national income?
Is there an equilibrium level for the capital/income ratio?

The Second Fundamental Law of Capitalism
A simple and transparent way to relate β (capital/income ratio), s (savingsrate) and g (growth rate):
β = s / g
[Ex. If a country saves 12% of national income every year, and the rate of growth of its national
income is 2% per year, then in the long run capital/income ratio will be 600%]
This simply means that a country that saves a lot and growth slowly will overthe long run accumulate an enormous stock of capital, which can in turn havea significant effect on the social structure and distribution of wealth.
Then the return to high income/capital ratio in XXI c. can therefore beexplained as a return to a slow-growth regime.

Decreased growth in both its 2 components (demographic andper capita output) is responsible for high capital accumulation.
According to Piketty’s data this law is able to give a goodaccount of the historical evolution of the capital/income ratio.
This law is the result if a dynamic process: it represents a stateof equilibrium toward which an economy will tend if thesavings rate s and the growth rate g.
To remember however that such law works only under certainassumptions (ex. valid only in the long run, only valid foraccumulable capital, exc.).

Over forty years, these differences mount up to createsignificant variation: if one combine variations in growth rateswith variations in savings rate, it is easy to explain why differentcountries accumulate very different quantities of capital.

This mechanism that explains the capital accumulation is amplified by 2complementary phenomena:
1) The Privatization of Wealth in rich countries: the revival of privatewealth is partly due the ongoing privatization of national wealth. [Ex. InItaly the decrease in public wealth represented between 1/5 and ¼ of theincrease in private wealth].
2) The “Catch up” of asset prices over the long term: one may see a generaltendency of Tobin Q (i.e. ratio of market value to the book value ofindividual firms) to increase in rich countries since 1970. This is aconsequence of the historic rebound of asset prices.

Possible Predictions of Capital/Income ratio in XXI c.

The Capital Labor Split in the Twenty–First Century
From the analysis of the capital/income ratio to the division of nationalincome between labor and capital: the formula α = r x β allow us to movetransparently between the two.
[Ex. If capital stock is equal to six years of national income (β = 6), and if average return on capital is 5% (r = 5%), then the share of income from capital α, in national income is 30%].
Yet, how to determine the rate of return r?

This average rates of return aggregates the returns of very differenttypes of assets and investments: the goal is in fact to measure theaverage return on capital in a given society taken as a whole.
The principal conclusion of Piketty’s estimates then is that in bothFrance and Britain, from XVIII to XXI, the pure return on capital hasoscillated around a central value 4-5% a year, or more generally in aninterval from 3-6% a year.
However takes into account that such returns are pretax returns.When all the taxes are taken into account, the average tax rate onincome from capital is currently around 30% in most of the richcountries.
Furthermore, that pure return of around 3-4% is an average that hidesenormous disparities.
Finally that rates of return are real rates of return, not nominal. Noinflation rate is counted.
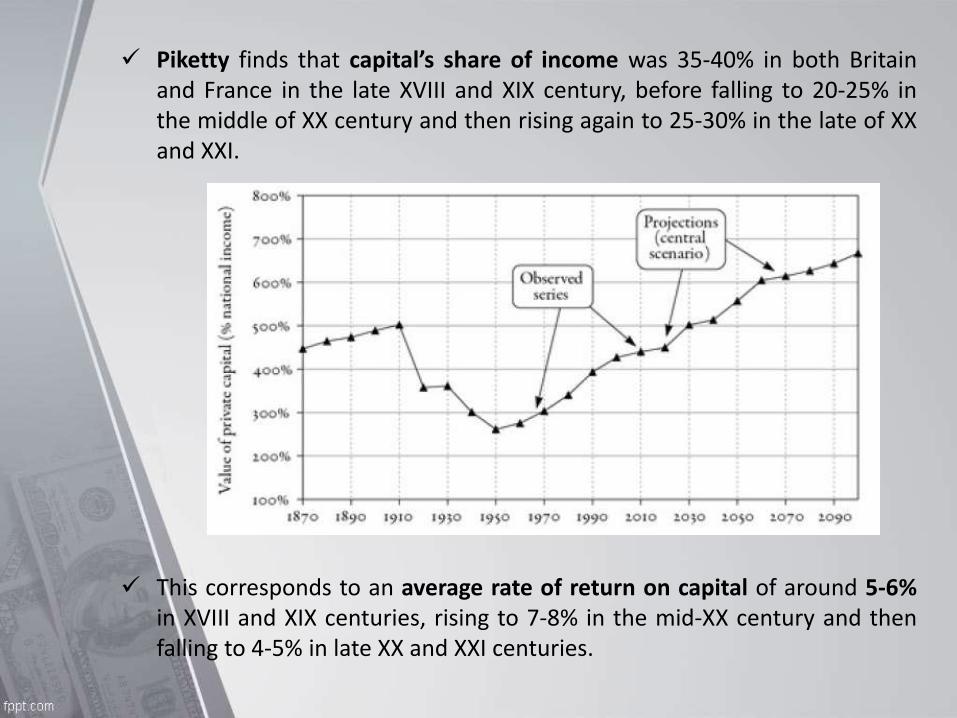
Piketty finds that capital’s share of income was 35-40% in both Britainand France in the late XVIII and XIX century, before falling to 20-25% inthe middle of XX century and then rising again to 25-30% in the late of XXand XXI.
This corresponds to an average rate of return on capital of around 5-6%in XVIII and XIX centuries, rising to 7-8% in the mid-XX century and thenfalling to 4-5% in late XX and XXI centuries.

How is the rate of return on capital determined in a particular society at a particular point in time? Which social and economic forces are at work?
The rate of return on capital is primarily determined by 2 forces:
1) Technology: simply means what is capital used for;
2) The abundance of the capital stock: whatever the rules and institutions thatstructure the capital-labor split may be, it is natural to expect that the marginalproductivity of capital decreases as the stock of capital increases.
Too much capital kills the return on capital!

How much the return on capital r decreases when the capital/income β increases?
2 cases are possible:
1) If r falls more than proportionally when the capital/income β increases, thenthe share of capital income α = r x β decreases when β increases.
2) If r falls less than proportionally when β increases, then share of capitalincome α = r x β increases when β increases.
Based on historical evolutions observed in Britain and France the second case is more relevant over the long term: the capital share of income α, follows the same U-shaped curve as the capital income ratio β.

Indeed, Piketty’s data indicate that capital’s share of income increased inmost rich countries between 1970 and 2010 to the extent that capital/incomeratio increased:

To sum up let’s imagine the following scenario:
1) No structural growth, the productivity and population growth rate g iszero;
2) Savings rate s is positive (capitalists insist to accumulate more andmore capital every year):
Then, the capital/income ratio β will increase indefinitely;
3) But if β is extremely large, capital’s share of income α = r x β, willultimately devour all of national income.
In stagnant societies, wealth accumulated in the past naturally takes on considerable importance.
What we learnt from Piketty’s work?
Similar patterns may be recognized in the evolution of Wealth and Capitalamongst rich countries;
We may link together Growth, Savings and Rate of Return on Capital by theFirst and Second Law of Capitalism to understand how the dynamics ofcapital/income ratio is affected by macroeconomic variations;
Piketty recognized the validity of his model by looking at an huge amount ofhistorical data available of rich countries.
The forecast is an increasing accumulation of capital by wealthy people in astagnant economy.
The result is greater inequality which required political intervention.

Thanks.