Embed Size (px)
Citation preview

Building State CapacityEvidence from Biometric Smartcards in India
Karthik Muralidharan1 Paul Niehaus1 Sandip Sukhtankar2
1UC San Diego
2Dartmouth College
September 1, 2015SITE Corruption Workshop

Motivations
Pragmatic: Billions of dollars spent annually on anti-poverty programsin India (and many LDC’s), but these programs are often poorlyimplemented (World Bank 2003; Pritchett 2010)
I Estimates of “leakage” as high as 70-80% in some settings(Reinikka-Svensson 2004; PEO 2005)
Yet governments tend to focus more on programs than on state capacityfor implementation
I Patronage (Lizzeri-Persico 2001, Mathew-Moore 2011)
I Perception that the RoI is beyond electoral cycles
Conceptual: A recent theoretical literature has highlighted theimportance of investing in state capacity for long-term development(Besley-Persson 2009, 2010), but there is much less empirical evidenceon the returns to such investments

Payments infrastructure as state capacity
A key constraint in implementation of anti-poverty programs isgovernments’ inability to securely transfer welfare payments to intendedbeneficiaries. Secure payments technologies can therefore be seen as aform of “state capacity”
I Can improve the performance of existing programs
I Can also expand the set of feasible policies
Electronic benefit transfers (EBT) supported by biometric authenticationhave garnered huge momentum, with programs in over 80 LDCs(Gelb-Clark 2013).
I Potential to leapfrog literacy hurdles (compare e.g. Fujiwara 2014)
I Best exemplified by India’s UID (Aadhaar) program: > 700 millionUIDs issued to date
I Aadhaar-enabled EBT will be “a game changer for governance.” -former Finance Minister P. Chidambaram

Yet...
A number of reasons to doubt the hype
1. Implementation and logistical challenges at scale; getting everythingright difficult (Kremer 1993)
2. Subversion by vested interests whose rents are threatened (Krussel& Rios-Rull 1996; Parente & Prescott 2000)
3. Negative effects on access through dampened incentives for officials(Leff 1964)
4. Exclusion errors if legitimate beneficiaries denied payments, leavingpoorest worse off (Khera 2011)
5. Cost-effectiveness unclear, based on untested assumptions (NIPFP2012)
Little to no credible evidence on effectiveness

This paper
We worked with the state of Andhra Pradesh to randomize the rollout ofbiometrically authenticated EBTs (“Smartcards”) in 157 subdistricts
I The Smartcards were linked to bank accounts, and were integratedwith workfare (NREGS) and pension (SSP) schemes
I Functionally equivalent precursor to Aadhaar (UID) integrateddelivery of welfare programs
We present evidence on the impact of Smartcards on NREGS and SSPbased on a two-year long experiment conducted “as is” at scale (affectedpopulation ∼ 19 million)
I We focus on ITT estimates (the policy parameter of interest)
I These capture the returns to politicians / top bureaucrats on thedecision to invest, and also reflect the myriad managementchallenges that accompany implementation at scale (Banerjee et al.2008; Bold et al. 2013)

Summary of results
I Implementation was meaningful (∼ 50%) but far from complete
I The NREGS payments process got faster (29%), lesstime-consuming (20%), and more predictable (39%)
I Substantial reduction in leakage in both programs
I NREGS: 12.7 percentage point reduction (∼ 41%)I SSP: 2.8 percentage point reduction (∼ 47%)
I Access to programs did not deteriorate (improved in NREGS)
I Little evidence of heterogenous impacts
I User preferences were strongly in favor of Smartcards (> 90%)
I Smartcards were quite cost-effective (time savings; leakage)

Literatures we contribute to
I State Capacity
I Empirical complement to Besley-Persson (2009, 2010)I We find that returns to investing in state implementation
capacity in LDC’s can pay off relatively quickly, despite hugeimplementation challenges.
I Reducing corruption in LDCs
I Reinikka and Svensson (2005); Olken (2007)I Can clarify literature on technology and service delivery, which
suggests that technology may or may not live up to hype(Duflo et al. 2012 vs. Banerjee et al. 2008)
I Our results suggest that technological solutions can have a bigpositive impact when implemented as part of an institutionaldecision to do so at scale
I Benefits of payments and authentication infrastructure in LDCs
I Jack and Suri (2014); Aker et al (2013); Gine et al (2012)

Agenda
Context and intervention
Research designRandomizationImplementation
ResultsProgram performanceHeterogeneity and mechanismsRobustnessCost-effectiveness
Discussion

Agenda
Context and intervention
Research designRandomizationImplementation
ResultsProgram performanceHeterogeneity and mechanismsRobustnessCost-effectiveness
Discussion

Transfer programs: NREGS and SSP
I National Rural Employment Guarantee Scheme (NREGS)
I Flagship social protection program (∼ 0.75 % of GDP; covers11% of world population; AP budget $800M)
I No eligibility restrictions: sign up for a free jobcard and bewilling to work for at minimum wages
I Payments often late, time-consuming to collectI High estimated leakage rates
I Social Security Pensions (SSP)
I Large state welfare program (AP budget $360M)I Eligibility: must be poor AND either widowed, disabled,
elderly, or had (selected) displaced occupationI Rs. 200 per month (Rs. 500 for select categories)I Some evidence of ghosts, but lower initial leakage than NREGS

Status-quo: unauthenticated payments delivered by local officials
State
District
Mandal
Gram Panchayat
Worker
1
2
Paper muster rolls
maintained by GP
and sent to Mandal
computer center
Digitized muster roll
data sent to state
financial system3
Money transferred
electronically from
State to District to
Mandal
4
Paper money
delivered to GP
(typically via post
office) and then to
workers

Smartcard-enabled: authenticated payments delivered by CSP
State
District
Mandal
Gram Panchayat
Worker
1
2
Paper muster rolls
maintained by GP
and sent to Mandal
computer center
Digitized muster roll
data sent to state
financial system
3
Money transferred
electronically from
State to Bank, TSP,
CSP
Bank
TSP
CSP
4
CSP delivers cash and
receipts to
authenticated
recipients


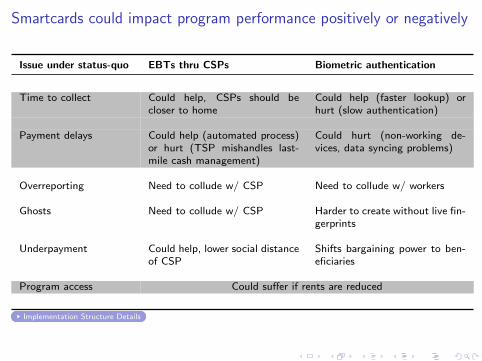
Smartcards could impact program performance positively or negatively
Issue under status-quo EBTs thru CSPs Biometric authentication
Time to collect Could help, CSPs should becloser to home
Could help (faster lookup) orhurt (slow authentication)
Payment delays Could help (automated process)or hurt (TSP mishandles last-mile cash management)
Could hurt (non-working de-vices, data syncing problems)
Overreporting Need to collude w/ CSP Need to collude w/ workers
Ghosts Need to collude w/ CSP Harder to create without live fin-gerprints
Underpayment Could help, lower social distanceof CSP
Shifts bargaining power to ben-eficiaries
Program access Could suffer if rents are reduced
Implementation Structure Details
Agenda
Context and intervention
Research designRandomizationImplementation
ResultsProgram performanceHeterogeneity and mechanismsRobustnessCost-effectiveness
Discussion

Opportunity to evaluate mature payment system at scale
I MoU with Govt of Andhra Pradesh to randomize rollout atmandal (sub-district) level in 8 districts (2010-2012)
I These districts had made no headway under initial vendors(2006), and were re-assigned to better-performing banks on aone-district-one-bank basis
I Good time for evaluation since most major implementationissues resolved in other districts
I Mandals randomized into three waves: treatment, non-study,and control Balance
I 45 control & 112 treatment mandals Map
I 24 month lag between roll out in control and treatmentmandals
I Evaluation team worked with GoAP to ensure nocontamination in control areas

Sampling & data collection
I All official records (beneficiary lists, benefits paid, daysworked)
I Samples representative (after re-weighting) of the followingframes
I NREGS: All jobcard holders, over-weighting recent workersI SSP: All beneficiaries
I Village-level panel: baseline (Aug-Sep 2010) and endline(Aug-Sep 2012) surveys of ∼ 8800 households Seasonality
Attrition Frame Composition
I 880 villages (6/mandal in 6 districts, 4/mandal in 2)I 10 HH per village
I Survey collected data on program participation, performance,benefits; income, employment, consumption, loans, andassets; village-level economic, political, and social data

Agenda
Context and intervention
Research designRandomizationImplementation
ResultsProgram performanceHeterogeneity and mechanismsRobustnessCost-effectiveness
Discussion

Contextualizing implementation quality
I Implementation faced various challenges
1. Technical challenges, including logistics and enrollment2. Optimal contract unclear; banks ended up with little incentive
to saturate beyond 40% threshold3. Pushback from vested interests in local governments4. Large political cost to state government of stopping
non-carded payments
I Implementation benefited from experience and top-levelsupport
1. Most major issues solved by 2010 when evaluation began, e.g.one bank per district, re-tendering and droppingnon-performing banks
2. AP generally considered one of the better-administered states3. GoAP spent considerable administrative resources on
implementing project

NREGA/SSP roll-out progress since Jun 2011 SC Usage
Wave I (Treatment) mandals
NREGA SSP
0
25
50
75
Aug−2011 Nov−2011 Feb−2012 May−2012 Aug−2011 Nov−2011 Feb−2012 May−2012Month
Con
vers
ion
%
% Mandals % GPs % Carded Payments

Assessing implementation
I ∼ 50% implementation in two years compares favorably tolarge programs elsewhere
I Social Security took the US 15 years from start of directdeposits (mid-1990s) to last check (1 March, 2013)
I Philippines’ 4Ps cash transfer program took 5 years to reach40% coverage from 2008-13
I We focus on ITT estimates which yield the policy parameter ofinterest. i.e. the impact of the decision by the government toimplement the program (net of all implementation challenges)

Estimation
Yipmd = α+βTreatedmd +γY0pmd +δDistrictd +ρPCmd +εipmd (1)
I Observations indexed by individual i , panchayat p, mandal m,district d
I Treatment probabilities were constant within districts
I Given village-level panel, we include lagged village-level mean
of dependent variable Y0pmd (when available); also include
principal component of vector of mandal-level characteristicson which we stratified
I Standard errors clustered at mandal level
I Weighted to obtain average partial effects for population ofNREGS jobcard holders / SSP beneficiaries

Agenda
Context and intervention
Research designRandomizationImplementation
ResultsProgram performanceHeterogeneity and mechanismsRobustnessCost-effectiveness
Discussion

NREGS time to collect payments and payment delays fell
Time to Collect (Min) Payment Lag (Days)
(1) (2) (3) (4) (5) (6) (7) (8)Ave Payment Delay Deviation
Treatment -22∗∗ -22∗∗ -6.1 -3.5 -5.8∗ -10∗∗∗ -2.5∗∗ -4.7∗∗∗
(9.2) (8.7) (5.2) (5.4) (3.5) (3.5) (.99) (1.6)
BL GP Mean .079∗ .23∗∗∗ .013 .042(.041) (.07) (.08) (.053)
District FE Yes Yes Yes Yes Yes Yes Yes Yes
Week Fe No No No No Yes Yes Yes Yes
Adj R-squared .06 .08 .07 .11 .17 .33 .08 .17Control Mean 112 112 77 77 34 34 12 12N. of cases 10191 10120 3789 3574 14213 7201 14213 7201Level Indiv. Indiv. Indiv. Indiv. Indiv-Week Indiv-Week Indiv-Week Indiv-WeekSurvey NREGS NREGS SSP SSP NREGS NREGS NREGS NREGS
The dependent variable in columns 1-4 is the average time taken to collect a payment(in minutes), including the time spent on unsuccessful trips to payment sites, withobservations at the beneficiary level. The dependent variable in columns 5-6 is theaverage lag (in days) between work done and payment received on NREGS, whilecolumns 7-8 report results for absolute deviations from the median mandal lag.

NREGS disbursements unchanged, but payments increased → leakagedeclined
Official Survey Leakage
(1) (2) (3) (4) (5) (6)
Treatment 11 9.6 35∗∗ 35∗∗ -24∗ -25∗
(12) (12) (16) (16) (13) (13)
BL GP Mean .13∗∗∗ .11∗∗∗ .096∗∗
(.027) (.037) (.038)
District FE Yes Yes Yes Yes Yes Yes
Adj R-squared .03 .05 .05 .06 .04 .04Control Mean 127 127 146 146 -20 -20N. of cases 5143 5107 5143 5107 5143 5107
Dependent variable: rupees per household-week. Sample includes workers on
sampled jobcards and found (or confirmed not to exist) in household surveys.

SSP leakage declined as well
Official Survey Leakage
(1) (2) (3) (4) (5) (6)
Treatment 4.3 5.1 12∗∗ 12∗ -7.5∗ -7∗
(5.3) (5.4) (5.9) (6.1) (3.9) (3.9)
BL GP Mean .16∗ .0074 -.022(.092) (.022) (.026)
District FE Yes Yes Yes Yes Yes Yes
Adj R-squared .00 .01 .01 .01 .01 .01Control Mean 251 251 236 236 15 15N. of cases 3330 3135 3330 3135 3330 3135
Dependent variable: rupees per month. Sample includes beneficiary in
household found (or confirmed not to exist) in household surveys.
Margins of leakage

Quantifying leakage reduction relative to fiscal outlays
Estimating levels of leakage is more challenging and requiresfurther assumptions
I NREGS official quantities are measured for sampled jobcard,whereas survey quantities are measured for the household
I NREGS households often hold multiple jobcards
I NSS data and official records imply average household holds1.9 jobcards, conditional on holding at least one
I Work done could be reported on jobcard not part of oursample and hence official estimates
I Level estimates scaled by district-specific multipliers: 30.7%leakage in control, treatment effect = 12.7 percentage points(41%, p = 0.11) Table

Quantifying leakage reduction relative to fiscal outlays
Estimating levels of leakage is more challenging and requiresfurther assumptions
I NREGS official quantities are measured for sampled jobcard,whereas survey quantities are measured for the household
I NREGS households often hold multiple jobcardsI NSS data and official records imply average household holds
1.9 jobcards, conditional on holding at least oneI Work done could be reported on jobcard not part of our
sample and hence official estimatesI Level estimates scaled by district-specific multipliers: 30.7%
leakage in control, treatment effect = 12.7 percentage points(41%, p = 0.11) Table

Why did official disbursements not react?
0
5
10
15
Jan−2010 Mar−2010 May−2010 Jul−2010 Sep−2010 Nov−2010Month
Ave
rage
Am
ount
Dis
burs
ed
ControlTreatment
(a) 2010
0
5
10
15
Mar−2012 May−2012 Jul−2012 Sep−2012 Nov−2012Month
Ave
rage
Am
ount
Dis
burs
ed
ControlTreatment
(b) 2012
Rs. per GP-week, study mandals.

Despite reduced corruption, access improves
Proportion ofHhds doing
NREGS work
Was any Hhdmember unable to get
NREGS work in...
Is NREGS workavailable when
anyone wants it
Did you have to payanything to get this
NREGS work?
Did you have to payanything to start
receiving this pension?
(1) (2) (3) (4) (5) (6) (7) (8) (9) (10)Study Period Study Period May January All Months All Months NREGS NREGS SSP SSP
Treatment .072∗∗ .071∗∗ -.023 -.027 .027∗ .024 -.0003 -.00054 -.046 -.055(.033) (.033) (.027) (.033) (.015) (.015) (.0015) (.0015) (.031) (.039)
BL GP Mean .14∗∗∗ -.023 -.0064∗∗ .025(.038) (.027) (.0031) (.046)
District FE Yes Yes Yes Yes Yes Yes Yes Yes Yes Yes
Adj R-squared .05 .06 .10 .11 .02 .02 .00 .00 .05 .05Control Mean .42 .42 .2 .42 .035 .035 .0022 .0022 .075 .075N. of cases 4943 4909 4748 4496 4755 4715 7185 6861 581 352
Why did access not deteriorate?
I Insufficient time for officials to react? But, endline after 14.5months of average exposure, and no trends in officialdisbursements.
I Few substitutable activities? Note dedicated Field Assistantrole (and leakage was still positive albeit lower)

Agenda
Context and intervention
Research designRandomizationImplementation
ResultsProgram performanceHeterogeneity and mechanismsRobustnessCost-effectiveness
Discussion

Was anybody made worse off?
We test along three dimensions
1. Distributional impacts on main outcomes (quantile TE)
2. Heterogenous treatment effects across baseline distributions ofmain outcomes
3. Non-experimental decompositions along carded/non-cardedGPs/households
I In particular, are uncarded beneficiaries in carded GPs worse offI Also relevant for understanding mechanism of impact
We also examine beneficiary perceptions of the intervention

Treated distributions stochastically dominate control - NREGS−
200
020
040
0T
ime
to C
olle
ct
0 .2 .4 .6 .8 1Time
Control TreatmentDifference 95% Confidence Band
−50
050
100
Pay
men
t Lag
0 .2 .4 .6 .8 1Lag
Control TreatmentDifference 95% Confidence Band
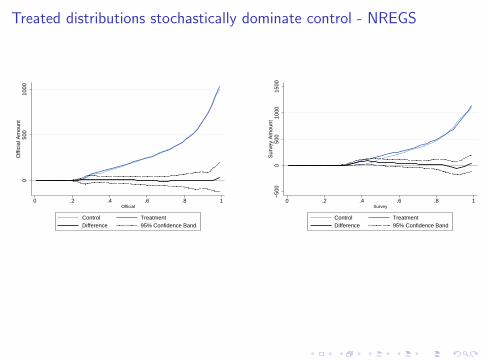
Treated distributions stochastically dominate control - NREGS0
500
1000
Offi
cial
Am
ount
0 .2 .4 .6 .8 1Official
Control TreatmentDifference 95% Confidence Band
−50
00
500
1000
1500
Sur
vey
Am
ount
0 .2 .4 .6 .8 1Survey
Control TreatmentDifference 95% Confidence Band

Treated distributions stochastically dominate control - SSP−
200
020
040
060
0O
ffici
al A
mou
nt
0 .2 .4 .6 .8 1Official
Control TreatmentDifference 95% Confidence Band
010
020
030
040
050
0S
urve
y A
mou
nt
0 .2 .4 .6 .8 1Survey
Control TreatmentDifference 95% Confidence Band

No significant heterogeneity by baseline characteristics
Time to Collect Payment Lag Official Payments Survey Payments
(1) (2) (3) (4)
BL GP Mean .024 .19 .012 .048(.08) (.25) (.042) (.074)
Consumption (Rs. 1,000) -.085 -.0045 -.0024 -.044(.16) (.025) (.2) (.26)
GP Disbursement, NREGS (Rs. 1,000) .015∗ .00014 .014 .0044(.0078) (.0013) (.01) (.016)
SC Proportion .31 25∗ 3.6 13(48) (13) (49) (51)
BPL Proportion -61 -24 -64 -171(127) (22) (111) (114)
District FE Yes Yes Yes Yes
Week FE No Yes No No
Control Mean 112 34 127 146Level Indiv. Indiv-Week Hhd HhdN. of cases 10143 12334 4999 4999
All covariates are aggregated to the GP-level. Consumption is annualized. “GPDisbursement” is the total amount disbursed for NREGA between January 1, 2010 toJuly 22, 2010. “SC Proportion” is the proportion of NREGA work done by ScheduledCaste workers. “BPL Proportion” is the proportion of Below Poverty Line householdsin the baseline survey.

Organizational and technological mechanisms of impact
Time to collect Payment lag Official Survey LeakageProportion ofHhds doing
NREGS work
(1) (2) (3) (4) (5) (6) (7) (8) (9) (10) (11) (12)
Carded GP -33∗∗∗ -4.9∗ 10 40∗∗ -29∗∗ .078∗∗
(8.1) (2.8) (13) (15) (13) (.035)
Have SCard, Carded GP -33∗∗∗ -4.7 93∗∗∗ 169∗∗∗ -75∗∗∗ .31∗∗∗
(8.4) (2.9) (17) (23) (22) (.041)
No SCard, Carded GP -33∗∗∗ -5.4∗ -14 -11 -4.6 -.042(8.5) (2.9) (14) (17) (13) (.043)
No Info SCard, Carded GP .33 -5.9 -109∗∗∗ -128∗∗∗ 18 -.38∗∗∗
(20) (3.7) (13) (15) (13) (.037)
Not Carded GP 4.9 5 -7.4 -7.4 8.4 6.6 23 20 -14 -13 .056 .046(13) (13) (5) (5) (16) (16) (22) (22) (19) (19) (.04) (.042)
District FE Yes Yes Yes Yes Yes Yes Yes Yes Yes Yes Yes YesWeek FE No No Yes Yes No No No No No No No NoBL GP Mean Yes Yes No No Yes Yes Yes Yes Yes Yes Yes Yes
p-value: carded GP = not carded GP <.001∗∗∗ .46 .9 .35 .39 .5p-value: Have SC = No SC .88 .67 <.001∗∗∗ <.001∗∗∗ .0019∗∗∗ <.001∗∗∗
Adj R-squared .1 .1 .17 .17 .046 .095 .057 .13 .04 .051 .058 .16Control Mean 112 112 34 34 127 127 146 146 -20 -20 .42 .42N. of cases 10120 10120 14213 14213 5107 5107 5107 5107 5107 5107 4909 4909Level Indiv. Indiv. Indiv-Week Indiv-Week Hhd Hhd Hhd Hhd Hhd Hhd Hhd Hhd
A GP becomes a “Carded GP” once 40% of beneficiaries within the GP have been issued a Smartcard. Within a“Carded GP”, individuals a) have a Smartcard b) don’t have a Smartcard or c) “No Info SCard, Carded GP”captures observations whose status is unknown, either because they didn’t participate in the program and weren’tasked questions about Smartcards or because they are ghosts. By virtue of the research design, all observations arein treatment mandals.
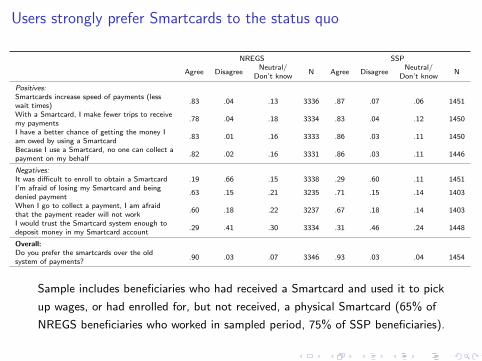
Users strongly prefer Smartcards to the status quo
NREGS SSP
Agree DisagreeNeutral/
Don’t knowN Agree Disagree
Neutral/Don’t know
N
Positives:Smartcards increase speed of payments (lesswait times)
.83 .04 .13 3336 .87 .07 .06 1451
With a Smartcard, I make fewer trips to receivemy payments
.78 .04 .18 3334 .83 .04 .12 1450
I have a better chance of getting the money Iam owed by using a Smartcard
.83 .01 .16 3333 .86 .03 .11 1450
Because I use a Smartcard, no one can collect apayment on my behalf
.82 .02 .16 3331 .86 .03 .11 1446
Negatives:It was difficult to enroll to obtain a Smartcard .19 .66 .15 3338 .29 .60 .11 1451I’m afraid of losing my Smartcard and beingdenied payment
.63 .15 .21 3235 .71 .15 .14 1403
When I go to collect a payment, I am afraidthat the payment reader will not work
.60 .18 .22 3237 .67 .18 .14 1403
I would trust the Smartcard system enough todeposit money in my Smartcard account
.29 .41 .30 3334 .31 .46 .24 1448
Overall:Do you prefer the smartcards over the oldsystem of payments?
.90 .03 .07 3346 .93 .03 .04 1454
Sample includes beneficiaries who had received a Smartcard and used it to pick
up wages, or had enrolled for, but not received, a physical Smartcard (65% of
NREGS beneficiaries who worked in sampled period, 75% of SSP beneficiaries).

Agenda
Context and intervention
Research designRandomizationImplementation
ResultsProgram performanceHeterogeneity and mechanismsRobustnessCost-effectiveness
Discussion

Robustness
I Our estimates could over-state recipients’ earnings gains ifthey are colluding with officials (e.g. NREGS officials askworkers to report more work than they have done and splitproceeds from extra payments)
I Directly measuring this is infeasible, but a number of indirectindicators suggest it is not driving results
1. “List method” elicitation showed no affect on reportedcollusion requests
2. NREGS worksites suggest proportional increase in actual workdone Table
3. Quantile treatment effect plots of official/survey payments4. Beneficiaries overwhelmingly prefer new system (below)5. Private sector wages increased
I #s 2, 3, 4 and lack of consistent pattern related to survey lagalso rule out differential recall

Agenda
Context and intervention
Research designRandomizationImplementation
ResultsProgram performanceHeterogeneity and mechanismsRobustnessCost-effectiveness
Discussion

Pricing impacts
Real cost of administration: 2% of (converted) payments, gross ofsavings on status-quo
Efficiency effects
I Reduced time collecting payments
I (Reduced variability of payment lags)
Redistributive effects: directionally positive but can only bequantified by taking a stand on welfare weights
I Shorter payment lags moves float: from banks to beneficiaries
I Reduced NREGS leakage: from corrupt officials tobeneficiaries/government
I Reduced SSP leakage: from corrupt officials/illegitimatebeneficiaries to beneficiaries/government

Smartcards appear cost-effective
Concept Metric NREGS SSP Total
Costs 2% of payments $4.05 $2.25 $6.30in converted GPs
Efficiency gains Time savings $4.49 - $4.49Predictability ? - ?
Redistribution Float $0.40 - $0.40Leakage $38.54 $3.15 $41.70
All figures in $ million per year, for 8 study districts

Agenda
Context and intervention
Research designRandomizationImplementation
ResultsProgram performanceHeterogeneity and mechanismsRobustnessCost-effectiveness
Discussion

Summary and Lessons Learned
1. Smartcards appear cost-effective under real-world conditions
I Implementation was incomplete, but Smartcards still improvedthe ease, speed, predictability, and volume of payments
I Improvements spread across distribution, and practicallyeveryone prefers Smartcards over status quo
I Time savings alone justify costs in the case of NREGS; largereductions in leakage; no negative extensive margin effects
2. Our data do not capture potential future gains from servicesbuilt on Smartcards infrastructure
I For public sector programs (e.g. food security alternatives)I As “public infrastructure” for private sector products (e.g.
savings products, remittances)
3. Investments in state capacity in LDCs may have large returnsrelatively quickly (even with incomplete implementation)

Agenda
Context and intervention
Research designRandomizationImplementation
ResultsProgram performanceHeterogeneity and mechanismsRobustnessCost-effectiveness
Discussion

Balance on mandal characteristics
Treatment Control Difference p-value
(1) (2) (3) (4)
Numbers based on official records from GoAP in 2010
% population working .53 .52 .0062 .47% male .51 .51 .00023 .82Literacy rate .45 .45 .0043 .65% SC .19 .19 .0025 .81% ST .1 .12 -.016 .42Jobcards per capita .54 .55 -.0098 .63Pensions per capita .12 .12 .0015 .69% old age pensions .48 .49 -.012 .11% weaver pensions .0088 .011 -.0018 .63% disabled pensions .1 .1 .0012 .72% widow pensions .21 .2 .013∗∗ .039
Numbers based on 2011 census rural totals
Population 45580 45758 -221 .91% population under age 6 .11 .11 -.00075 .65% agricultural laborers .23 .23 -.0049 .59% female agri. laborers .12 .12 -.0032 .52% marginal agri. laborers .071 .063 .0081 .14
Numbers based on 2001 census village directory
# primary schools per village 2.9 3.2 -.28 .3% village with medical facility .67 .71 -.035 .37% villages with tap water .59 .6 -.007 .88% villages with banking facility .12 .16 -.034∗∗ .021% villages with paved road access .8 .81 -.0082 .82Avg. village size in acres 3392 3727 -336 .35
This table presents outcome means from official data on mandal characteristics. Column 4 reports the p-value onthe treatment indicator from a simple regressions of the outcome with district fixed effects as the only controls.“SC” (“ST”) refers to Scheduled Castes (Tribes), historically discriminated-against sections of the population nowaccorded special status and affirmative action benefits under the Constitution.
Balance on household characteristics
NREGS SSP
Treatment Control Difference p-value Treatment Control Difference p-value
(1) (2) (3) (4) (5) (6) (7) (8)
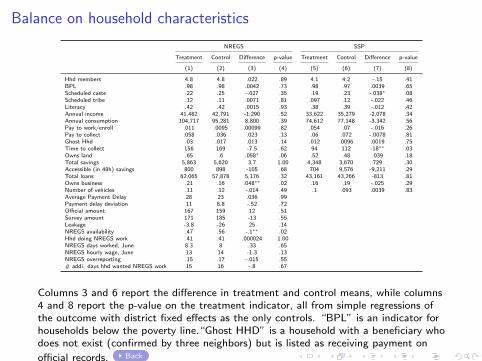
Hhd members 4.8 4.8 .022 .89 4.1 4.2 -.15 .41BPL .98 .98 .0042 .73 .98 .97 .0039 .65Scheduled caste .22 .25 -.027 .35 .19 .23 -.038∗ .08Scheduled tribe .12 .11 .0071 .81 .097 .12 -.022 .46Literacy .42 .42 .0015 .93 .38 .39 -.012 .42Annual income 41,482 42,791 -1,290 .52 33,622 35,279 -2,078 .34Annual consumption 104,717 95,281 8,800 .39 74,612 77,148 -3,342 .56Pay to work/enroll .011 .0095 .00099 .82 .054 .07 -.016 .26Pay to collect .058 .036 .023 .13 .06 .072 -.0078 .81Ghost Hhd .03 .017 .013 .14 .012 .0096 .0019 .75Time to collect 156 169 -7.5 .62 94 112 -18∗∗ .03Owns land .65 .6 .058∗ .06 .52 .48 .039 .18Total savings 5,863 5,620 3.7 1.00 4,348 3,670 729 .30Accessible (in 48h) savings 800 898 -105 .68 704 9,576 -9,211 .29Total loans 62,065 57,878 5,176 .32 43,161 43,266 -813 .81Owns business .21 .16 .048∗∗ .02 .16 .19 -.025 .29Number of vehicles .11 .12 -.014 .49 .1 .093 .0039 .83Average Payment Delay 28 23 .036 .99Payment delay deviation 11 8.8 -.52 .72Official amount 167 159 12 .51Survey amount 171 185 -13 .55Leakage -3.8 -26 25 .14NREGS availability .47 .56 -.1∗∗ .02Hhd doing NREGS work .41 .41 .000024 1.00NREGS days worked, June 8.3 8 .33 .65NREGS hourly wage, June 13 14 -1.3 .13NREGS overreporting .15 .17 -.015 .55# addi. days hhd wanted NREGS work 15 16 -.8 .67
Columns 3 and 6 report the difference in treatment and control means, while columns4 and 8 report the p-value on the treatment indicator, all from simple regressions ofthe outcome with district fixed effects as the only controls. “BPL” is an indicator forhouseholds below the poverty line.“Ghost HHD” is a household with a beneficiary whodoes not exist (confirmed by three neighbors) but is listed as receiving payment on
official records. Back

NREGS attrition
Treatment Control Difference p-value
(1) (2) (3) (4)
Attriters from Baseline .013 .024 -.012 .19Entrants in Endline .06 .059 .0018 .74
This table compares the entire NREGS sample frame – i.e., all jobcard holders– across treatment and control mandals
I Some jobcards drop out of baseline sample frame because of death,migration, or household splits (1.58% overall)
I New jobcards also enter because of creation of new nuclear families,migration, and new enrollments (6.77% over 2 years)
I Neither change differentially affects treatment mandals

SSP attrition
Treatment Control Difference p-value
(1) (2) (3) (4)
Attriters from Baseline .097 .097 -.000016 1Entrants in Endline .17 .16 .0056 .37
This table compares the entire SSP sample frame – i.e., all SSP beneficiaries –across treatment and control mandals
I Some recipients drop out of baseline sample frame because of death ormigration
I New recipients also enter mainly because of creation of new enrollments
I Neither change differentially affects treatment mandals
Back

NREGS frame composition
(1) (2) (3) (4) (5) (6) (7) (8)N. of Members Hindu SC Any Hhd Mem Reads BPL Total Consump Total Income Own Land
Treatment .042 -.024 .022 -.031 -.0022 -767 7201∗ .054∗∗
(.11) (.018) (.022) (.027) (.023) (4653) (3839) (.024)
EL Entrant -.16 .0094 .03 .065 .067 -10564 -3281 -.052(.25) (.047) (.077) (.049) (.043) (6874) (10373) (.12)
Treat X EL Entrant .12 -.024 -.082 -.089 -.049 5029 16803 .056(.34) (.058) (.088) (.071) (.057) (9075) (14119) (.14)
District FE Yes Yes Yes Yes Yes Yes Yes Yes
Adj R-squared .02 .07 .03 .01 .01 .01 .04 .01Control Mean 4.3 .93 .19 .85 .89 90317 69708 .59N. of cases 4909 4909 4909 4869 4887 4902 4875 4887Level Hhd Hhd Hhd Hhd Hhd Hhd Hhd Hhd
This table shows that new entrants to the NREGS sample frame are no differentacross treatment and control groups. “EL Entrants” is an indicator for a householdthat entered the sample frame for the endline survey but was not in the baselinesample frame. “SC” is an indicator for the household belonging to a “ScheduledCaste” (historically discriminated-against caste). “Any HHD Mem Reads” is a proxyfor literacy.
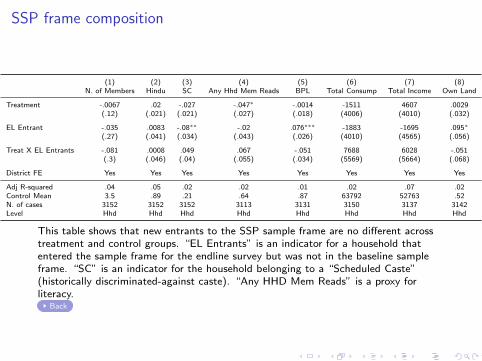
SSP frame composition
(1) (2) (3) (4) (5) (6) (7) (8)N. of Members Hindu SC Any Hhd Mem Reads BPL Total Consump Total Income Own Land
Treatment -.0067 .02 -.027 -.047∗ -.0014 -1511 4607 .0029(.12) (.021) (.021) (.027) (.018) (4006) (4010) (.032)
EL Entrant -.035 .0083 -.08∗∗ -.02 .076∗∗∗ -1883 -1695 .095∗
(.27) (.041) (.034) (.043) (.026) (4010) (4565) (.056)
Treat X EL Entrants -.081 .0008 .049 .067 -.051 7688 6028 -.051(.3) (.046) (.04) (.055) (.034) (5569) (5664) (.068)
District FE Yes Yes Yes Yes Yes Yes Yes Yes
Adj R-squared .04 .05 .02 .02 .01 .02 .07 .02Control Mean 3.5 .89 .21 .64 .87 63792 52763 .52N. of cases 3152 3152 3152 3113 3131 3150 3137 3142Level Hhd Hhd Hhd Hhd Hhd Hhd Hhd Hhd
This table shows that new entrants to the SSP sample frame are no different acrosstreatment and control groups. “EL Entrants” is an indicator for a household thatentered the sample frame for the endline survey but was not in the baseline sampleframe. “SC” is an indicator for the household belonging to a “Scheduled Caste”(historically discriminated-against caste). “Any HHD Mem Reads” is a proxy forliteracy.
Back

Smartcard intervention structure
Vendors Competitive procurement
I Bank/Technology Service Provider (TSP) pairings
I “One-district-one-bank” model
I Banks receive 2% commissions after going live
Enrollment “Campaign” model with enrollment camps until reaching40% threshold at the panchayat level, but no process forongoing enrollment
Staffing Customer service provider (CSP) appointed by bank/TSP
I Resident of village
I Not related to local officials
I 10th grade education
I Member of self-help group
I Preferably from lower caste group
Technology Physical PoS devices using offline authentication but withGSM connectivity for data sync Back


Smartcards were used for both, NREGA ...
Official data Survey data
(1) (2) (3) (4)
Carded GPMean fraction
carded paymentsPayments generally
carded (village mean)Most recent paymentcarded (village mean)
Treatment .67∗∗∗ .45∗∗∗ .38∗∗∗ .38∗∗∗
(.045) (.041) (.043) (.042)
District FE Yes Yes Yes Yes
Adj R-squared .45 .48 .36 .36Control Mean .0046 .0017 .039 .013N. of cases 880 880 818 818Level GP GP GP GP
Observations on the GP-level. A GP becomes a “Carded-GP” once 40% of allbeneficiaries have been issued a Smartcard. “Mean fraction carded pmts” is the
proportion of transactions done with carded beneficiaries in carded GPs Back

... and SSP payments
Official data Survey data
(1) (2) (3) (4)
Carded GPMean fraction
carded paymentsPayments generally
carded (village mean)Most recent paymentcarded (village mean)
Treatment .79∗∗∗ .59∗∗∗ .45∗∗∗ .45∗∗∗
(.042) (.038) (.052) (.049)
District FE Yes Yes Yes Yes
Adj R-squared .57 .57 .38 .38Control Mean 0 0 .069 .044N. of cases 880 880 878 878Level GP GP GP GP
Observations on the GP-level. A GP becomes a “Carded-GP” once 40% of allbeneficiaries have been issued a Smartcard. “Mean fraction carded pmts” is the
proportion of transactions done with carded beneficiaries in carded GPs Back

NREGS payments increased, and leakage declined
Dependent variable: Rupees per week (averaged over jobcard frame)
Official Survey Leakage
(1) (2) (3) (4) (5) (6) (7) (8)
Treatment 9.7 4.6 -7.3 33 32 -23 -27 -33(25) (24) (23) (21) (20) (21) (20) (21)
BL GP Mean .16∗∗∗ .1∗∗∗ .14∗∗∗
(.025) (.038) (.034)
BL jobcard payment .24∗∗∗ .16∗∗∗
(.048) (.053)
BL jobcard payment > 0 185∗∗∗ 86∗∗
(32) (34)
BL GP Mean survey payment -.1∗∗
(.047)
District FE Yes Yes Yes Yes Yes Yes Yes Yes
Adj R-squared .03 .05 .19 .06 .07 .06 .07 .12Control Mean 260 260 260 180 180 80 80 80N. of cases 5143 5107 5107 5143 5107 5143 5107 5107
Includes all residents of households of sampled jobcards. Official figures scaled
by # jobcards per households estimated using NSS data. p-value on leakage
treatment effect = 0.11

NREGS payments increased, and leakage declined
Dependent variable: Rupees per week (averaged over jobcard frame)
Official Survey Leakage
(1) (2) (3) (4) (5) (6)
Treatment 9.7 4.6 33 32 -23 -27(25) (24) (21) (20) (21) (20)
BL GP Mean .16∗∗∗ .1∗∗∗ .14∗∗∗
(.025) (.038) (.034)
District FE Yes Yes Yes Yes Yes Yes
Adj R-squared .03 .05 .06 .07 .06 .07Control Mean 260 260 180 180 80 80N. of cases 5143 5107 5143 5107 5143 5107
Includes all residents of households of sampled jobcards. Official figures scaled
by # jobcards per households estimated using NSS data. p-value on leakage
treatment effect = 0.16

Other robustness
# of workersfound in audit Paid yet for a given period
(1) (2) (3) (4) (5) (6)
Treatment 13 11 .029 .032(12) (10) (.033) (.035)
Treatment X First 4 weeks .04 .044(.034) (.036)
Treatment X Last 3 weeks -.035 -.034(.059) (.063)
District FE Yes Yes Yes YesWeek FE No Yes Yes Yes Yes YesBL GP Mean No No No Yes No Yesp-value: first 4 weeks = last 3 weeks .19 .21
Adj R-squared .097 .14 .085 .085 .087 .087Control Mean 28 28 .9 .9 .9 .9N. of cases 508 508 11854 11174 11854 11174Level GP GP Indiv-Week Indiv-Week Indiv-Week Indiv-Week
In columns 1 and 2, units represent estimated number of NREGS workers on a givenday, found in an independent audit of NREGS worksites in GPs. In columns 3-6, theoutcome is an indicator for whether an NREGS respondent had received payment for agiven week’s work at the time of the survey, weighted by the official payment amount.

Hawthorne effects on measurement
Audit Official Survey
(1) (2) (3) (4) (5) (6)
Survey in GP -3.7 10 -4.8(8) (34) (33)
Audit in GP 7.5 -13 6.8 -12 116(31) (28) (42) (37) (106)
Audit in Week -52 -71 -26 -34 40(51) (52) (39) (39) (84)
Recon in Week 12 -.8 49 44 45(69) (68) (53) (52) (90)
District FE Yes Yes Yes Yes Yes Yes
Week FE Yes Yes Yes Yes Yes Yes
BL GP Value No No Yes No Yes Yes
GP Size FE No Yes Yes No No No
Adj R-squared .18Control Mean 49 758 758 756 756 1175Level Week Week Week Week Week WeekSample Audit All All Survey & Audit Survey & Audit SurveyN. of cases 676 52311 52311 7679 7679 6111
Each cell represents a separate regression of the effect on the data source (column) from the survey type (row).Units are number of days worked in a GP per week. “WSM in GP” is being surveyed by the work site audit. “WSMSurvey in Week” is whether the work site audit happened in that specific week. “Recon Survey in week” is whetheran enumerator to map the worksites in that specific week. Sample of “All” refers to all GPs in our study districts.
Back

Study MandalsWave
Non-StudyControlTreatment
Andhra Pradesh Smartcard Study Districts
Back

NREGS margins of leakage reduction
Ghost households (%) Other overreporting (%) Bribe to collect (%)
(1) (2) (3) (4) (5) (6)
Treatment -.012 -.011 -.082∗∗ -.084∗∗ -.0083 -.0087(.021) (.022) (.033) (.036) (.013) (.013)
BL GP Mean -.013 .016 .0087(.069) (.044) (.023)
District FE Yes Yes Yes Yes Yes Yes
Adj R-squared .02 .02 .05 .04 .02 .02Control Mean .11 .11 .26 .26 .026 .026N. of cases 5143 5107 3953 3672 7119 7071Level Hhd Hhd Hhd Hhd Indiv. Indiv.
Other over-reporting here is indicator for jobcards with positive official
payment, zero survey payment

SSP margins of leakage reduction
Ghost payments (Rs) Other overreporting (Rs) Underpayment (Rs)
(1) (2) (3) (4) (5) (6)
Treatment -2.9 -2.4 -2.7 -3.1 -2.3 -2.4(2.7) (2.7) (2.9) (3) (1.9) (2)
BL GP Mean .19 .024∗∗ -.02(.16) (.01) (.045)
District FE Yes Yes Yes Yes Yes Yes
Adj R-squared .01 .01 .01 .01 .01 .01Control Mean 11 11 1.7 1.7 2.5 2.5N. of cases 3330 3135 3165 2986 3165 2986Level Indiv. Indiv. Indiv. Indiv. Indiv. Indiv.
Other over-reporting for SSP captures the difference between officialdisbursements and reported entitlements from survey respondents.Underpayment for SSP is the monthly amount paid in order to receive pensionsin May-July 2012. Back