Embed Size (px)
Citation preview
© BP p.l.c. 2015
February 2015
bp.com/energyoutlook
#BPstats
BP Energy Outlook 2035
© BP p.l.c. 2015
Disclaimer
This presentation contains forward-looking statements, particularly those regarding global
economic growth, population growth, energy consumption, policy support for renewable
energies and sources of energy supply. Forward-looking statements involve risks and
uncertainties because they relate to events, and depend on circumstances, that will or may
occur in the future. Actual outcomes may differ depending on a variety of factors, including
product supply, demand and pricing; political stability; general economic conditions; legal and
regulatory developments; availability of new technologies; natural disasters and adverse
weather conditions; wars and acts of terrorism or sabotage; and other factors discussed
elsewhere in this presentation. BP disclaims any obligation to update this presentation. Neither
BP p.l.c. nor any of its subsidiaries accept liability for any inaccuracies or omissions or for any
direct, indirect, special, consequential or other losses or damages of whatsoever kind in
connection to this presentation or any information contained in it.
Energy Outlook 2035 2
© BP p.l.c. 2015
Contents
Introduction
Global energy trends
Liquid fuels
Natural gas
Coal and non-fossil fuels
Key uncertainties
Appendix
Energy Outlook 2035 3
Page
4
7
29
49
63
77
93
© BP p.l.c. 2015
Welcome to the 2015 edition of BP’s Energy Outlook.
At a time when our industry is focused on the rapid response to a dramatic fall in oil
prices, it is instructive to look at events from a longer term perspective.
Today’s turbulence is a return to business-as-usual. Continuous change is the norm in our
industry. The energy mix changes. The balance of demand shifts. New sources of energy
emerge, such as shale gas, tight oil, ultra-deepwater oil or renewables. Economies
expand and contract. Energy production and consumption are affected by disruptions,
from wars to extreme weather. New policies are created to address climate change or
bolster energy security.
Energy companies need to adapt – as BP is doing as I write; and to build strategically for
the longer term we not only need to control capital and costs, but to set a clear direction.
This Outlook is therefore valuable in giving us an insight into the most likely shape of the
future energy landscape and some of the most important changes expected over the next
20 years. Three key features are particularly worth noting.
First, trade patterns are shifting. The strong growth of US tight oil in recent years has had
a dramatic impact, with oil increasingly flowing from West to East rather than East to
West. This is likely to continue, with strong growth in China and India driving energy
demand. We also expect to see the market in gas become more global as liquefied
natural gas (LNG) integrates regional markets and leads to greater congruence in global
price movements.
4 Energy Outlook 2035
© BP p.l.c. 2015
Second, the energy mix continues to shift. Fossil fuels are projected to provide the
majority of the world’s energy needs, meeting two-thirds of the increase in energy
demand out to 2035. However, the mix will shift. Renewables and unconventional fossil
fuels will take a larger share, along with gas, which is set to be the fastest growing fossil
fuel, as well as the cleanest, meeting as much of the increase in demand as coal and oil
combined. Meanwhile, coal is now expected to be the slowest growing fuel, as
industrialization in emerging Asian economies slows and environmental policies around
the globe tighten.
That brings us to the environmental challenge. The most likely path for carbon emissions,
despite current government policies and intentions, does not appear sustainable. The
projections highlight the scale of the challenge facing policy makers at this year’s UN-led
discussions in Paris. No single change or policy is likely to be sufficient on its own. And
identifying in advance which changes are likely to be most effective is fraught with
difficulty. This underpins the importance of policy-makers taking steps that lead to a
global price for carbon, which provides the right incentives for everyone to play their
part.
It will be a year of debate, not only on the environment, but the economy and energy in
general. We hope that this year’s BP Energy Outlook 2035 can make a useful contribution
to informing the discussion and shaping a future where energy is sustainable, secure and
affordable.
Bob Dudley
Group chief executive
5 Energy Outlook 2035
© BP p.l.c. 2015
Notes on method and assumptions
6 Energy Outlook 2035
This edition updates our view of the likely path of global energy markets
to 2035. The underlying methodology remains unchanged – we build a
single “most likely” view based on assumptions about changes in policy,
technology and the economy.
We focus on the “most likely” base case as a basis for discussion. But
there are many uncertainties surrounding the base case and in the
process of building the Outlook we explore the impact of alternative
assumptions. Some of those uncertainties are considered in the “Key
uncertainties” section, although this discussion is by no means
exhaustive.
Unless noted otherwise, data definitions are based on the BP Statistical
Review of World Energy, and historical energy data up to 2013 are
consistent with the 2014 edition of the Review. Gross Domestic Product
(GDP) is expressed in terms of real Purchasing Power Parity (PPP) at 2011
prices. All data sources are listed on page 98.
© BP p.l.c. 2015
Introduction
Global energy trends
Liquid fuels
Natural gas
Coal and non-fossil fuels
Key uncertainties
Appendix
Energy Outlook 2035 7
Page
4
7
29
49
63
77
93
© BP p.l.c. 2015
0
30
60
90
OECD Other
Population growth
Income growth
per person
0
60
120
180
240
1975 1995 2015 2035
Trillion, $2011 PPP
GDP
0
1
2
3
4
5
6
7
8
9
1975 1995 2015 2035
Global population and increases in income per person…
Contribution to GDP
growth 2013-35
Population
Billion
Other
Non-OECD
Asia
OECD
Energy Outlook 2035 8
Trillion, $2011 PPP
Non-OECD
Asia
© BP p.l.c. 2015
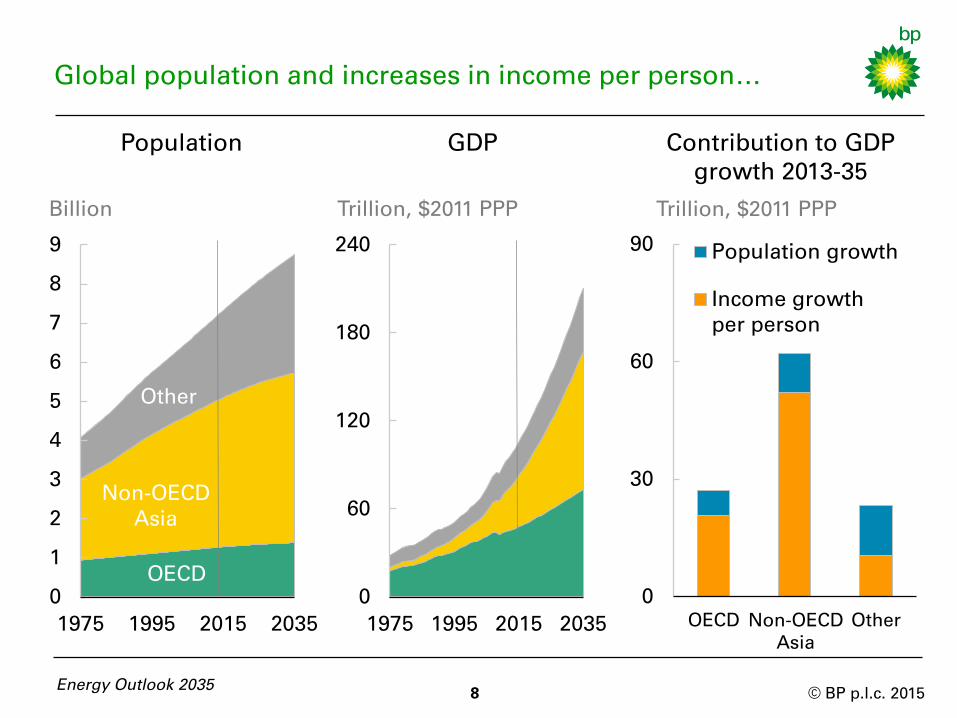
… underpin growing energy demand
Population growth and increases in income per person are the key
drivers behind growing demand for energy. By 2035, the world’s
population is projected to reach 8.7 billion, which means an additional 1.6
billion people will need energy.
Over the same period, GDP is expected to more than double, with non-
OECD Asia contributing nearly 60% of that growth. Globally, GDP per
person in 2035 is expected to be 75% higher than today, an increase in
productivity which accounts for three-quarters of global GDP growth.
China and India are key drivers of non-OECD growth and are projected to
grow by 5.5% per annum (p.a.) between 2013 and 2035. By 2035, they
will be the world’s largest and 3rd largest economies respectively, jointly
accounting for about one-third of global population and GDP.
As China’s level of productivity catches up with the OECD, its rate of
growth is expected to slow from 7% p.a. in this decade to 4% p.a. in the
decade to 2035. India’s growth moderation is more gradual: slowing
from 6% p.a. in this decade to 5% p.a. in the final decade.
9 Energy Outlook 2035
© BP p.l.c. 2015
0%
2%
4%
6%
8%
Primary energy consumption growth slows...
10
Billion toe
Consumption by region
0
3
6
9
12
15
18
1965 2000 2035
Th
ou
san
ds
OECD
Other
Non-OECD
Asia
Energy Outlook 2035
% per annum
Non-OECD Asia energy growth
2000-13
Slower
GDP
growth
2013-35
Faster
decline in
energy
intensity
© BP p.l.c. 2015
…as the impact of non-OECD industrialization weakens
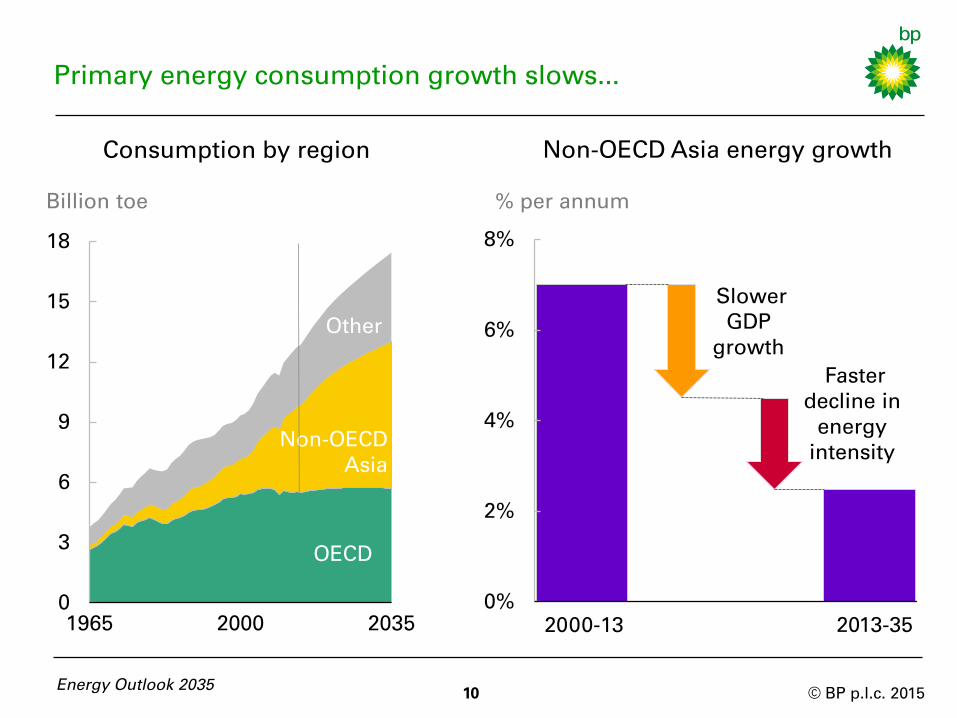
Primary energy consumption increases by 37% between 2013 and 2035,
with growth averaging 1.4% p.a.. Virtually all (96%) of the projected
growth is in the non-OECD, with energy consumption growing at 2.2%
p.a.. OECD energy consumption, by contrast, grows at just 0.1% p.a. over
the whole period and is actually falling from 2030.
The projected growth rate of global energy consumption is significantly
slower than the recent trend (2.4% p.a. for 2000-13). This slowdown is
most marked in non-OECD Asia, where growth has averaged 7% p.a.
since 2000 and is projected to slow to 2.5% p.a. between 2013 and 2035.
This reflects the end of the phase of rapid growth in energy demand in
developing Asia, centred on China, driven by industrialization and
electrification. Slower economic growth and an accelerated reduction in
energy intensity* (as economic growth becomes less dependent on
heavy industry) play roughly equal parts in explaining the slowing of
energy growth.
Energy Outlook 2035 11
* The amount of energy used per unit of GDP
© BP p.l.c. 2015
The slowdown in demand growth from industry...
12 Energy Outlook 2035
Billion toe
Consumption by final sector1
Consumption by fuel
Billion toe
0
3
6
9
12
15
18
1965 2000 2035
Transport
Other
Industry
0
3
6
9
12
15
18
1965 2000 2035
Th
ou
san
ds
Oil
Gas
Coal
Hydro
Nuclear
Renew.2
2Includes biofuels
1Primary fuels in power allocated according to final sector electricity consumption
© BP p.l.c. 2015
…is reflected in the slower growth of coal
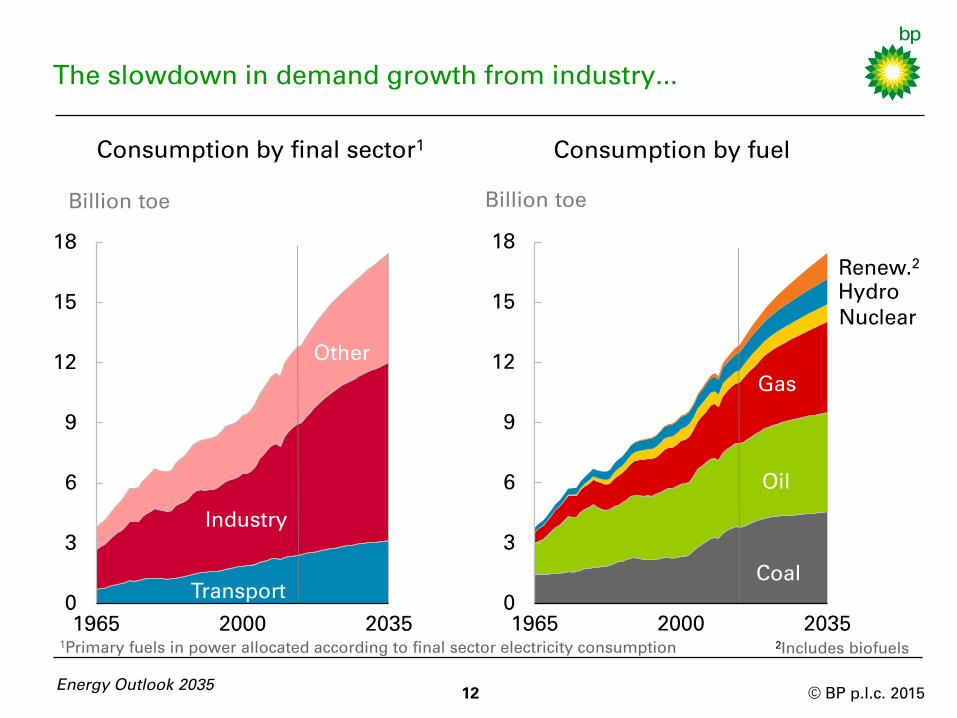
The fading impact of industrialization is apparent in the split of primary
energy consumption by sector. Industry has been the fastest growing
sector since 2000, averaging 2.7% p.a., but projected growth slows to
1.4% p.a. The ‘other’ sector (residential, services and agriculture) becomes
the fastest growing sector, averaging 1.6% p.a. 2013-35.
Transport continues to play a relatively small role in primary energy
growth, growing steadily (1.2% p.a.) but accounting for just 15% of total
growth during 2013-35.
Coal suffers a sharp change in fortunes, from being the fastest growing
fossil fuel since 2000 (3.8% p.a.), to the slowest growing fuel from 2013 to
2035 (0.8% p.a.). This reflects the slowing of coal-based industrialization in
Asia, compounded by the effects of environmental regulations and low
gas prices in key markets. Natural gas is the fastest growing fossil fuel
(1.9% p.a.), with oil (0.8% p.a.) marginally ahead of coal.
The fastest fuel growth is seen in renewables (6.3% p.a.). Nuclear (1.8%
p.a.) and hydro-electric power (1.7% p.a.) grow faster than total energy.
Energy Outlook 2035 13
© BP p.l.c. 2015
0%
10%
20%
30%
40%
50%
1965 2000 2035
Fossil fuels continue to provide most of the world’s energy...
14 Energy Outlook 2035
*Includes biofuels
2013-35 increments by fuel
-1
0
1
2
3
4
5
World Non-OECD
Renew.*
Hydro
Nuclear
Gas
Oil
Coal
Billion toe
Shares of primary energy
Oil
Coal
Gas
Hydro
Nuclear Renewables*
OECD
© BP p.l.c. 2015
…even as the mix shifts towards lower carbon fuels
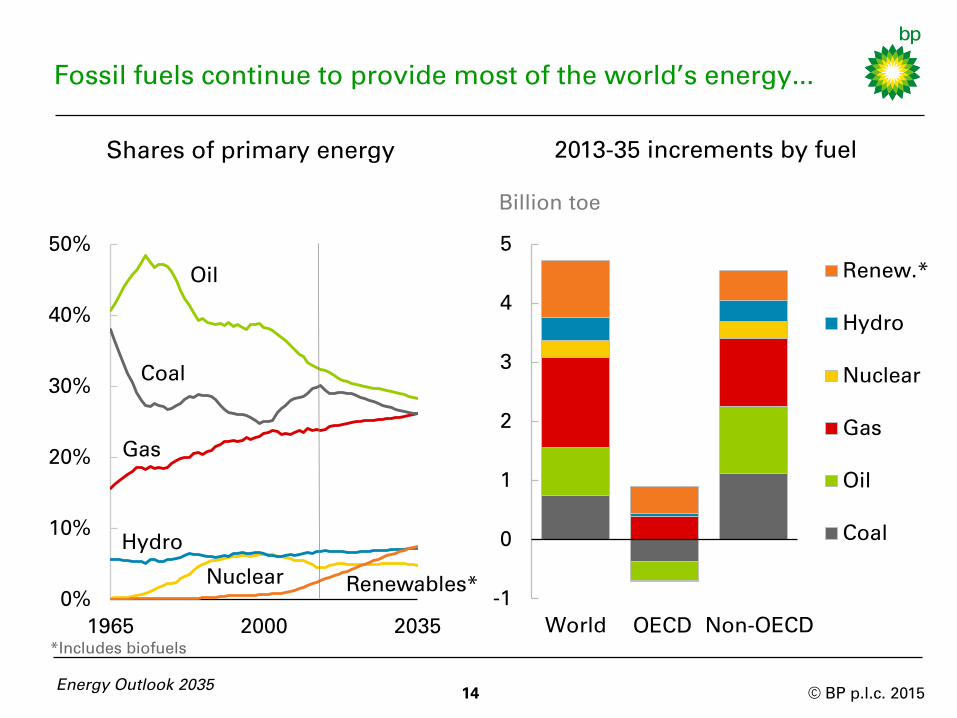
Gas gains share steadily, while the shares of both oil and coal fall.
By 2035 all the fossil fuel shares are clustered around 26-28% with no
single dominant fuel – a first since the Industrial Revolution. Fossil fuels
in aggregate lose share but remain the dominant form of energy in 2035
with a share of 81%, down from 86% in 2013.
Among non-fossil fuels, renewables (including biofuels) gain share
rapidly, from around 3% today to 8% by 2035, overtaking nuclear in the
early 2020s and hydro in the early 2030s.
Roughly one-third of the increase in energy demand is provided by gas,
another third by oil and coal together, and the final third by non-fossil
fuels.
In the OECD, declines in oil and coal are offset by increases in gas and
renewables, in roughly equal parts. Growth in non-OECD energy is
evenly spread, with roughly a quarter each for oil, gas, coal and non-
fossil fuels.
Energy Outlook 2035 15
© BP p.l.c. 2015
The power sector takes an increasing share of energy…
0%
25%
50%
75%
100%
1965 2000 2035
Inputs to power as a share of
total primary energy
Primary inputs to power
20%
30%
40%
50%
1965 2000 2035
16 Energy Outlook 2035
Coal
Gas
Oil
Hydro
Nuclear
Renew.
© BP p.l.c. 2015
…and plays a key role in changing the energy mix
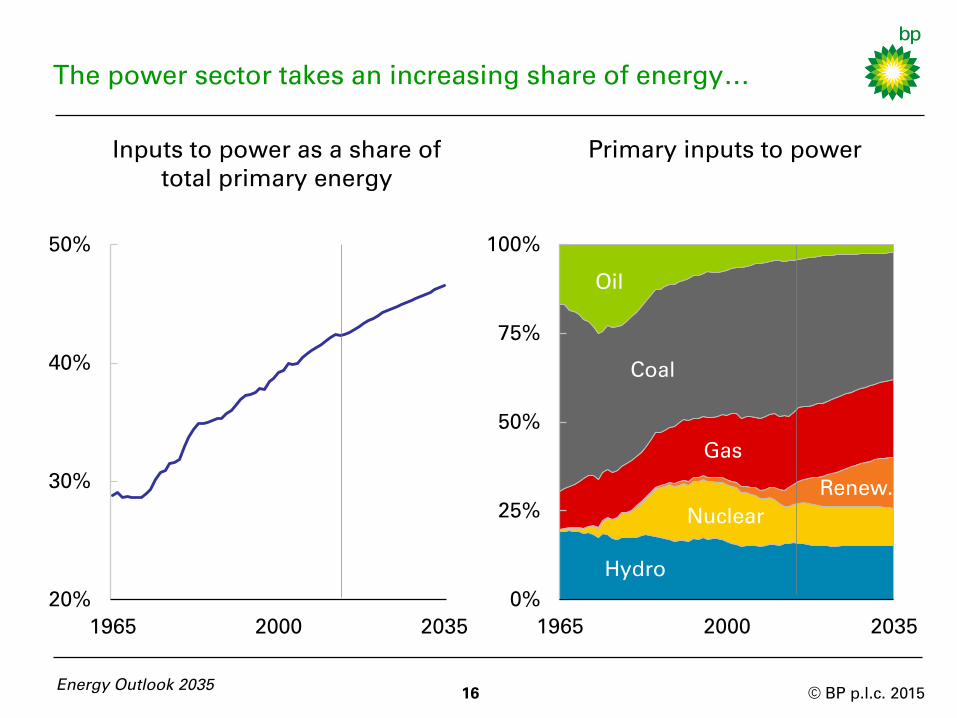
Power generation is expected to account for an ever-increasing share of
primary energy consumption as the world continues on a long-term
trend of electrification: the share rises from 42% today to 47% by 2035.
Power generation is the one sector where all fuels compete and so will
play a major role in how the global fuel mix evolves.
There have been some rapid shifts in fuel shares in power generation in
the past: oil gaining in the 1960s and losing in the 1970s; nuclear picking
up in the 1970s/80s and falling in the 2000s; gas rising through the 1990s
and 2000s. In the Outlook, the largest shifts are the increase in the
renewables share and the decline in the coal share.
The outcome by 2035 is a more balanced and diversified portfolio of
fuels for power generation. Coal remains the dominant fuel, accounting
for more than a third of the inputs to power generation, but that share is
down from 44% today and the gap between the shares of coal and of
other fuels narrows significantly.
17
Energy Outlook 2035
© BP p.l.c. 2015
Energy efficiency restrains the growth of emissions…
18 Energy Outlook 2035
Billion tonnes CO2
0
5
10
15
20
25
30
35
Emissions growth 2013 to 2035
GDP growth
effect
Projected
growth
Energy
intensity
Fuel mix
Index: 1990 = 100
100
200
300
400
500
1990 2005 2020 2035
CO2
Energy
GDP
GDP, energy and emissions
© BP p.l.c. 2015
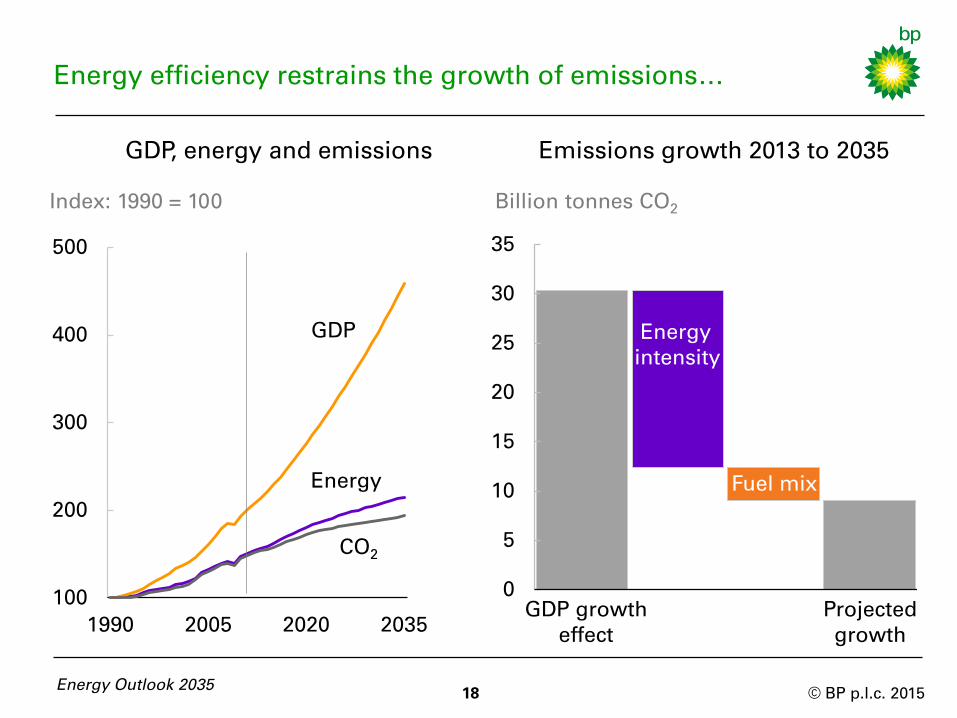
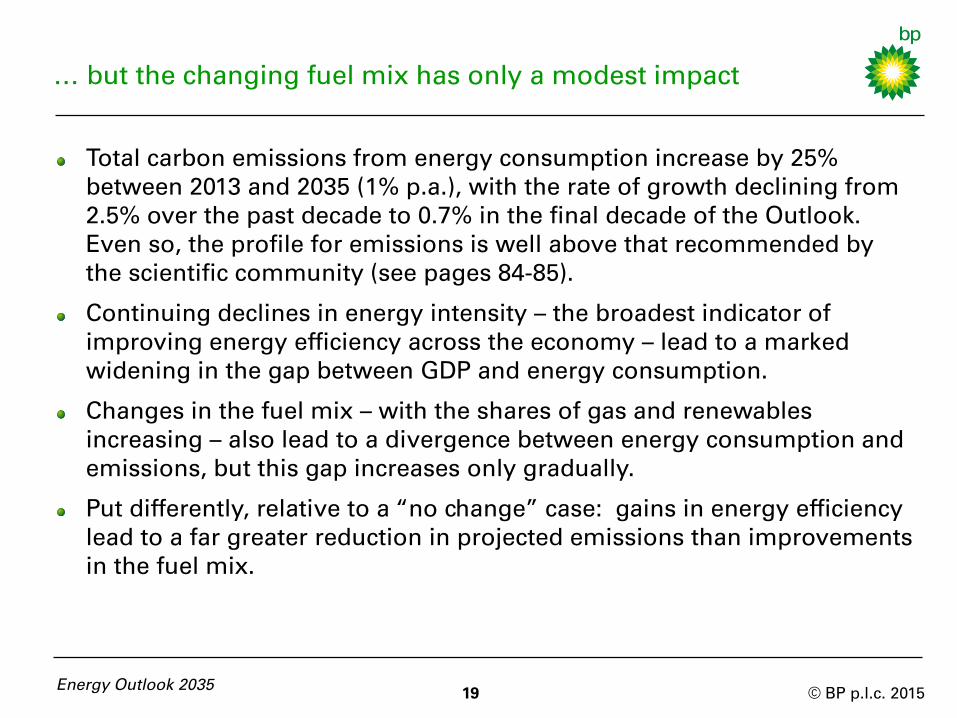
… but the changing fuel mix has only a modest impact
Total carbon emissions from energy consumption increase by 25%
between 2013 and 2035 (1% p.a.), with the rate of growth declining from
2.5% over the past decade to 0.7% in the final decade of the Outlook.
Even so, the profile for emissions is well above that recommended by
the scientific community (see pages 84-85).
Continuing declines in energy intensity – the broadest indicator of
improving energy efficiency across the economy – lead to a marked
widening in the gap between GDP and energy consumption.
Changes in the fuel mix – with the shares of gas and renewables
increasing – also lead to a divergence between energy consumption and
emissions, but this gap increases only gradually.
Put differently, relative to a “no change” case: gains in energy efficiency
lead to a far greater reduction in projected emissions than improvements
in the fuel mix.
19 Energy Outlook 2035
© BP p.l.c. 2015
0
6
12
18
1990 2005 2020 2035
Europe
FSU
N America
Middle East
Africa
S & C America
Asia Pacific
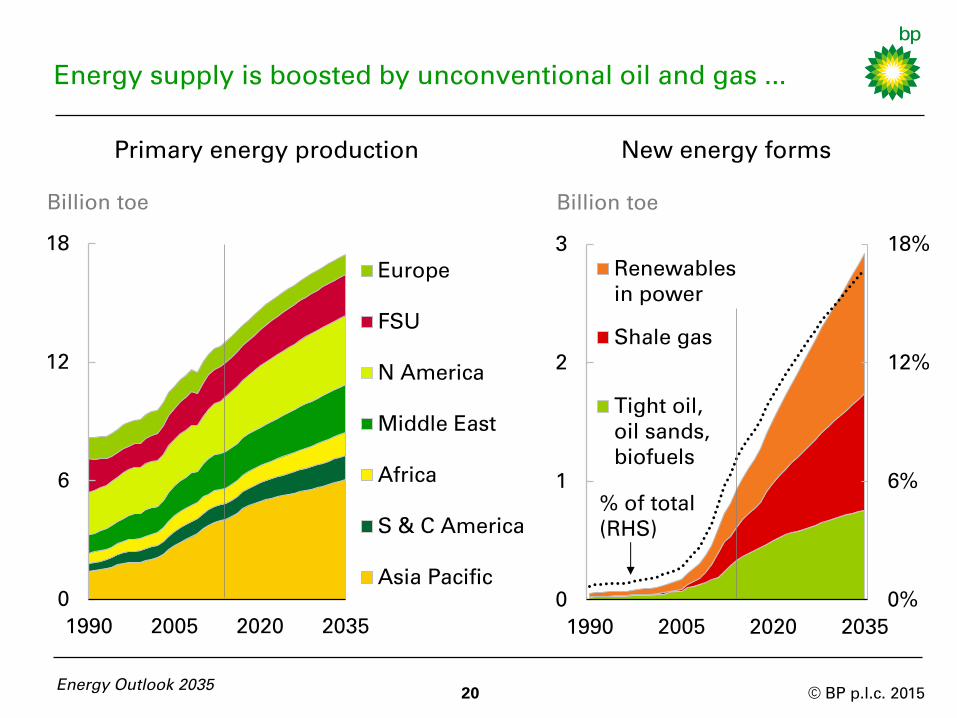
Energy supply is boosted by unconventional oil and gas ...
Energy Outlook 2035 20
Billion toe
Primary energy production
0%
6%
12%
18%
0
1
2
3
1990 2005 2020 2035
Renewables
in power
Shale gas
Tight oil,
oil sands,
biofuels
New energy forms
Billion toe
% of total
(RHS)
© BP p.l.c. 2015
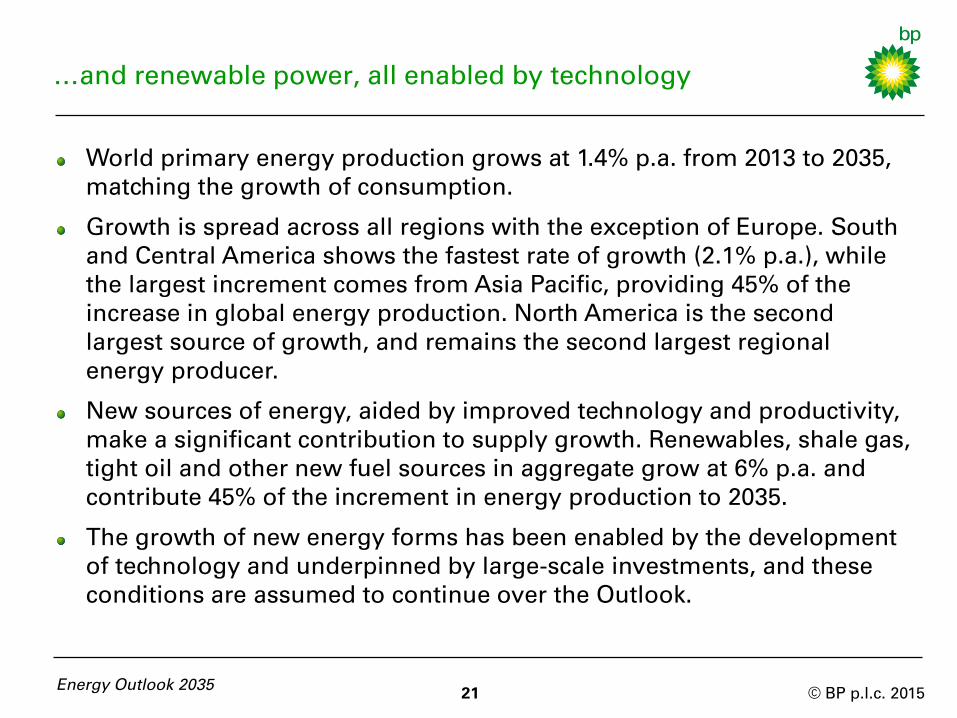
…and renewable power, all enabled by technology
World primary energy production grows at 1.4% p.a. from 2013 to 2035,
matching the growth of consumption.
Growth is spread across all regions with the exception of Europe. South
and Central America shows the fastest rate of growth (2.1% p.a.), while
the largest increment comes from Asia Pacific, providing 45% of the
increase in global energy production. North America is the second
largest source of growth, and remains the second largest regional
energy producer.
New sources of energy, aided by improved technology and productivity,
make a significant contribution to supply growth. Renewables, shale gas,
tight oil and other new fuel sources in aggregate grow at 6% p.a. and
contribute 45% of the increment in energy production to 2035.
The growth of new energy forms has been enabled by the development
of technology and underpinned by large-scale investments, and these
conditions are assumed to continue over the Outlook.
21 Energy Outlook 2035
© BP p.l.c. 2015
0 20 40 60 0 20 40 60
Tight oil
Shale gas
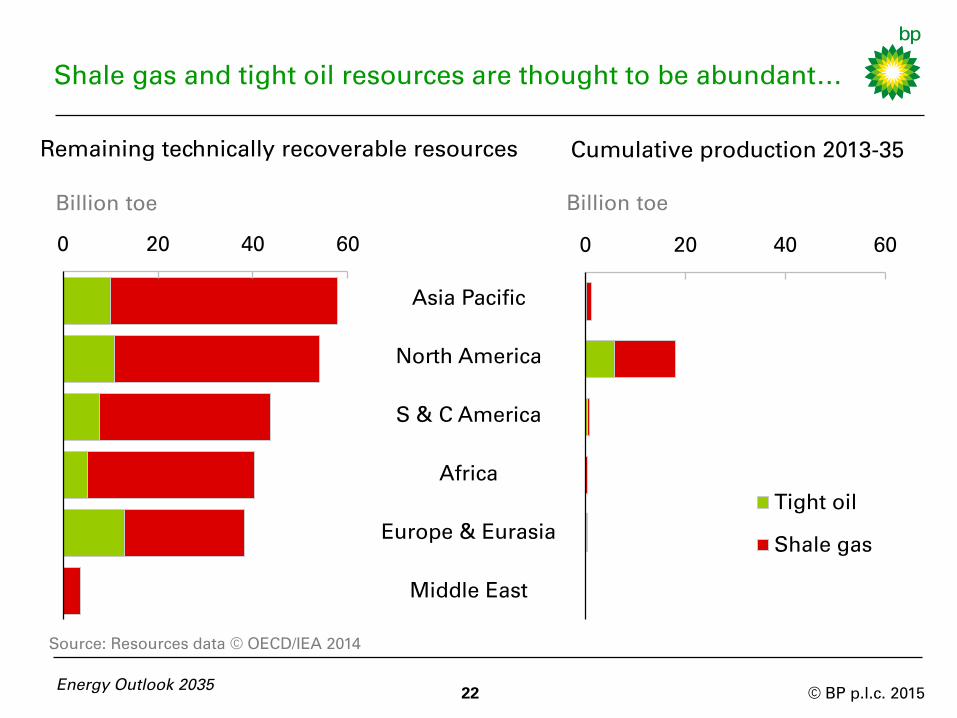
Shale gas and tight oil resources are thought to be abundant…
Billion toe Billion toe
Asia Pacific
North America
S & C America
Africa
Europe & Eurasia
Middle East
Remaining technically recoverable resources Cumulative production 2013-35
Source: Resources data © OECD/IEA 2014
Energy Outlook 2035 22
© BP p.l.c. 2015
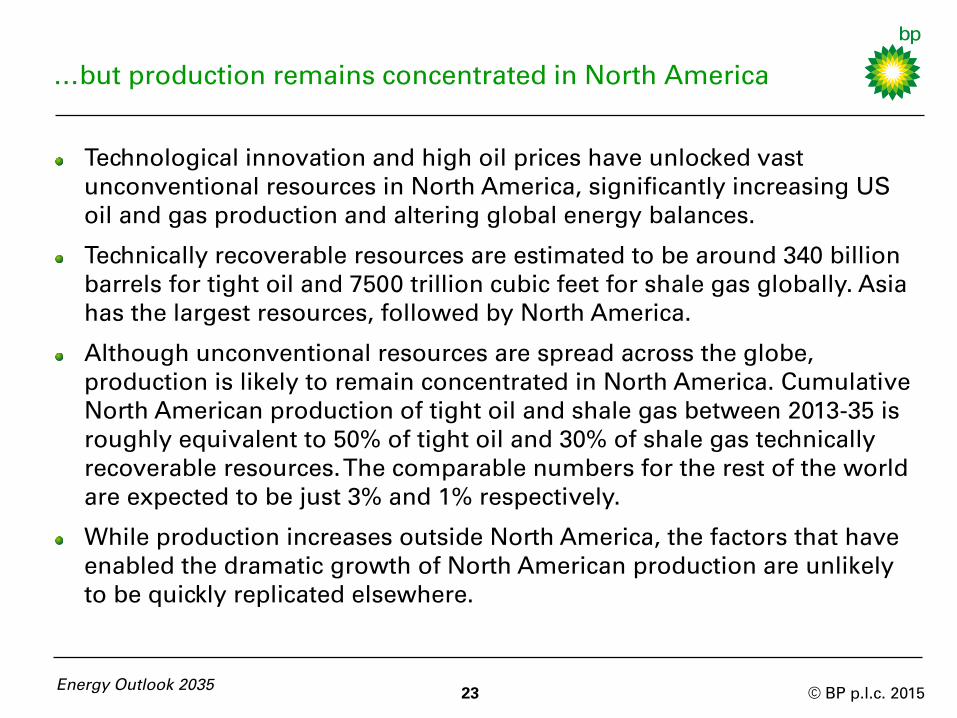
…but production remains concentrated in North America
Technological innovation and high oil prices have unlocked vast
unconventional resources in North America, significantly increasing US
oil and gas production and altering global energy balances.
Technically recoverable resources are estimated to be around 340 billion
barrels for tight oil and 7500 trillion cubic feet for shale gas globally. Asia
has the largest resources, followed by North America.
Although unconventional resources are spread across the globe,
production is likely to remain concentrated in North America. Cumulative
North American production of tight oil and shale gas between 2013-35 is
roughly equivalent to 50% of tight oil and 30% of shale gas technically
recoverable resources. The comparable numbers for the rest of the world
are expected to be just 3% and 1% respectively.
While production increases outside North America, the factors that have
enabled the dramatic growth of North American production are unlikely
to be quickly replicated elsewhere.
Energy Outlook 2035 23
© BP p.l.c. 2015
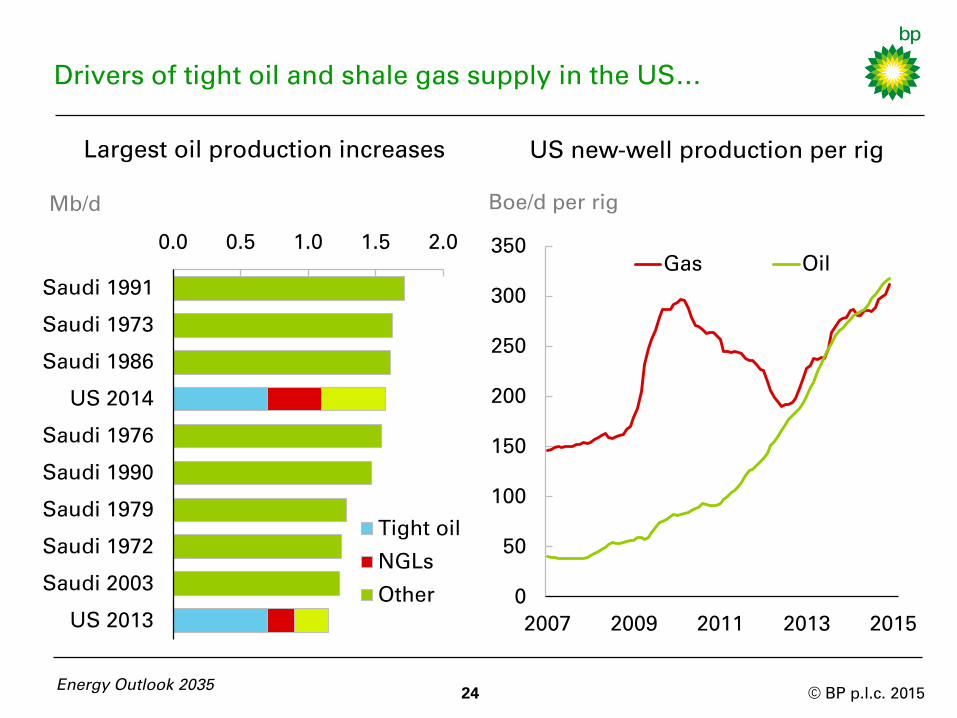
Drivers of tight oil and shale gas supply in the US…
0.0 0.5 1.0 1.5 2.0
Saudi 1991
Saudi 1973
Saudi 1986
US 2014
Saudi 1976
Saudi 1990
Saudi 1979
Saudi 1972
Saudi 2003
US 2013
Tight oil
NGLs
Other
Largest oil production increases
Mb/d
24 Energy Outlook 2035
0
50
100
150
200
250
300
350
2007 2009 2011 2013 2015
Gas Oil
Boe/d per rig
US new-well production per rig
© BP p.l.c. 2015
…include rapid growth of investment and significant innovation
US oil production growth in 2014 (roughly 1.5 Mb/d) was the largest in
US history, driven by tight oil and NGLs (natural gas liquids). The
increases in US production in recent years have been among the largest
ever seen, with only Saudi Arabia recording larger annual production
growth.
Growth of US tight oil and shale gas has been supported by increasing
investment and rapid technological innovation. Productivity, as measured
by new-well production per rig, increased by 34% p.a. for oil and 10% p.a.
for gas between 2007 and 2014.
Growth in US tight oil is expected to flatten out in coming years,
reflecting high well decline rates and less extensive resources than gas.
In contrast, US shale gas production is expected to grow rapidly over the
Outlook (4.5% p.a.), although growth rates moderate gradually.
25 Energy Outlook 2035
© BP p.l.c. 2015
FSU
Africa
S&C America
Middle East
N America
Asia
Europe
-4
-2
0
2
4
1990 2005 2020 2035
4%
8%
12%
16%
20%
24%
28%
-0.4
0.0
0.4
0.8
1.2
1.6
2.0
1990 2005 2020 2035
Oil
Gas
Coal
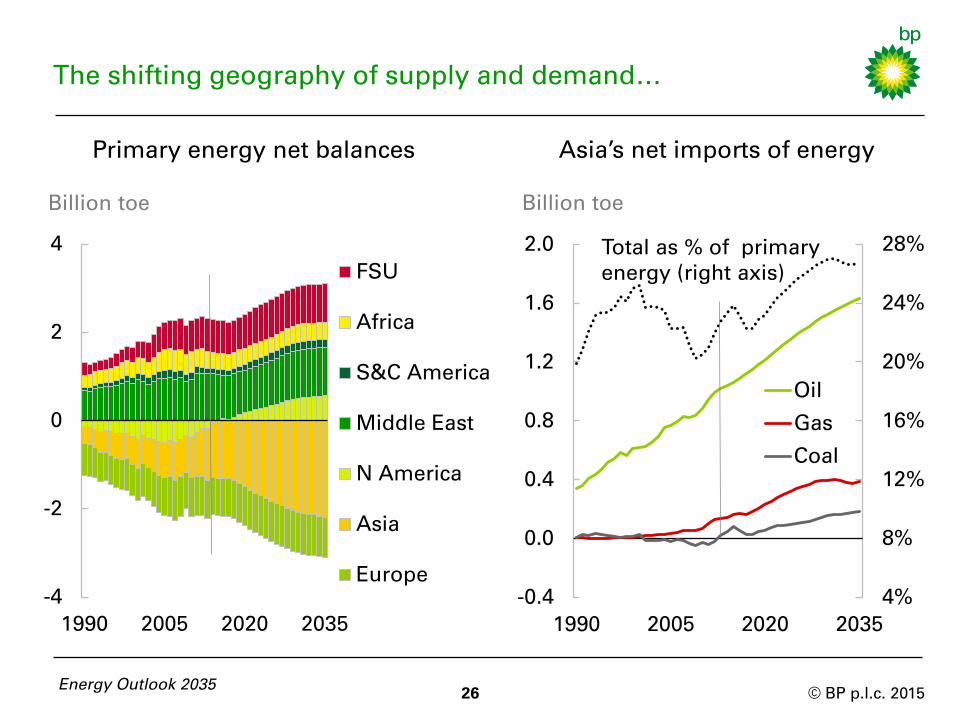
The shifting geography of supply and demand…
26 Energy Outlook 2035
Primary energy net balances
Billion toe Billion toe
Total as % of primary
energy (right axis)
Asia’s net imports of energy
© BP p.l.c. 2015
…has big implications for energy trade
Regional energy imbalances – production minus consumption for each
region – are set to increase markedly over the next 20 years, with
consequent implications for energy trade.
North America switches from being a net importer of energy to a net
exporter this year (2015). Asia’s imports of energy continue to expand,
accounting for around 70% of inter-regional net imports by 2035.
Among exporting regions, the Middle East remains the largest net
energy exporter, but its share falls from 46% in 2013 to 36% in 2035.
Russia remains the world’s largest energy exporting country.
Asia’s import dependency rises from 23% in 2013 to 27% by 2035. Oil
accounts for 60% of that rise, with imports accounting for over 80% of
Asian oil consumption by 2035. Asia’s oil imports in 2035 are almost as
large as OPEC’s current entire oil production.
27 Energy Outlook 2035
© BP p.l.c. 2015 Energy Outlook 2035
28
© BP p.l.c. 2015
Introduction
Global energy trends
Liquid fuels
Natural gas
Coal and non-fossil fuels
Key uncertainties
Appendix
Energy Outlook 2035 29
Page
4
7
29
49
63
77
93
© BP p.l.c. 2015
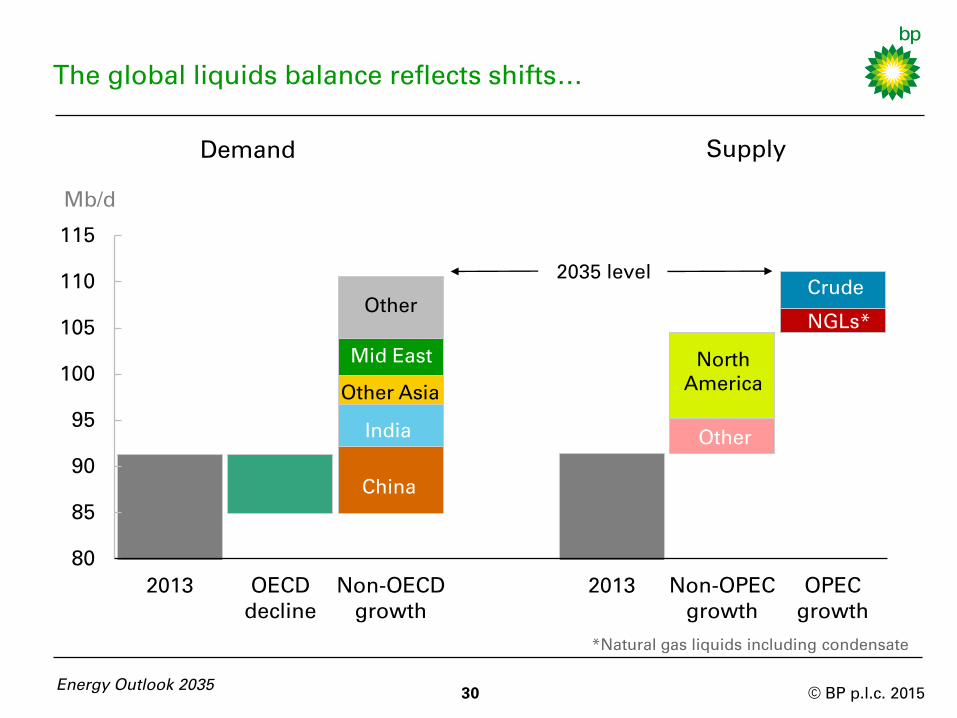
The global liquids balance reflects shifts…
30
Mb/d
Energy Outlook 2035
80
85
90
95
100
105
110
115
2013 OECD
decline
Non-OECD
growth
2013 Non-OPEC
growth
OPEC
growth
India
Mid East
China
NGLs*
Crude
Other
Other Asia
2035 level
North
America
Other
Demand Supply
*Natural gas liquids including condensate
© BP p.l.c. 2015
…in non-OECD demand and non-OPEC supply growth
31 Energy Outlook 2035
Global liquids demand (oil, biofuels, and other liquids) is projected to
rise by around 19 Mb/d, to reach 111 Mb/d by 2035. Growth slows over
the period: from 1.2% p.a. in 2013-20 to 0.7% p.a. for 2020-35.
Demand growth comes exclusively from rapidly growing non-OECD
economies. Non-OECD consumption reaches around 70 Mb/d by 2035 –
56% higher than in 2013. OECD demand peaked in 2005 and is expected
to fall further (-6 Mb/d) to around 40 Mb/d in 2035, the lowest since 1986.
The increased demand is met initially by supply from non-OPEC
unconventional sources and, later in the Outlook, from OPEC. By 2035,
non-OPEC supply is expected to have increased by 13 Mb/d, while OPEC
production expands by 7 Mb/d.
The largest increments of non-OPEC supply come from the US (6 Mb/d),
Brazil (3 Mb/d), and Canada (3 Mb/d), which offset declines in mature
provinces such as the North Sea. OPEC supply growth comes primarily
from NGLs (3 Mb/d) and crude oil in Iraq (2 Mb/d).
© BP p.l.c. 2015
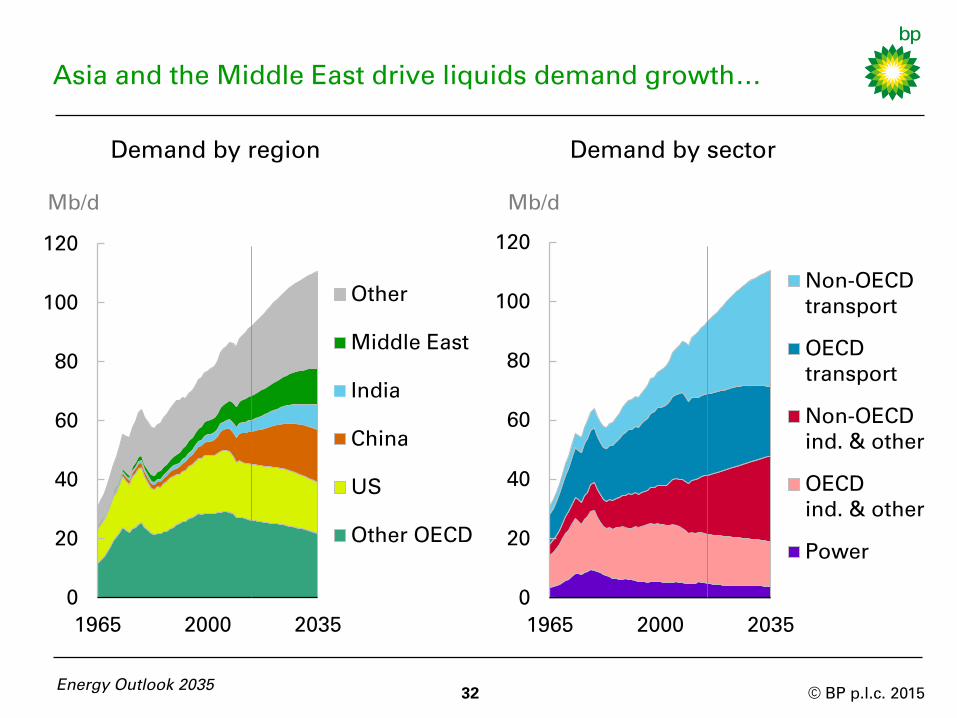
Asia and the Middle East drive liquids demand growth…
32
Mb/d
Demand by region
0
20
40
60
80
100
120
1965 2000 2035
Other
Middle East
India
China
US
Other OECD
Energy Outlook 2035
0
20
40
60
80
100
120
1965 2000 2035
Non-OECD
transport
OECD
transport
Non-OECD
ind. & other
OECD
ind. & other
Power
Mb/d
Demand by sector
© BP p.l.c. 2015
…with largest growth in transport followed by industry
33
China is the largest contributor to world demand growth: growing by
7 Mb/d to 18 Mb/d in 2035, surpassing US demand (which falls by 2 Mb/d
to 17 Mb/d). Even so, US consumption per capita is about 3.5 times
greater than China in 2035.
India is the second largest contributor, growing by more than 4 Mb/d,
followed by the Middle East with 4 Mb/d. India overtakes China as the
largest source of demand growth towards the end of the Outlook.
Non-OECD demand growth stems primarily from transport (16 Mb/d) –
reflecting a rapid increase in vehicle ownership – and industry (8 Mb/d)
largely for petrochemicals. OECD consumption in both sectors declines.
By sector, transport accounts for about 55% of total liquids demand. It
contributes 64% of the total demand increment to 2035, but growth
slows post 2020, due to efficiency improvements and a modest
displacement by natural gas and electricity. Industry has the fastest
growth rate (1.2% p.a.) driven by petrochemicals.
Energy Outlook 2035
© BP p.l.c. 2015
Vehicle numbers are likely to grow rapidly…
Vehicle fleet
0
1
2
3
1975 1995 2015 2035
Non-OECD
OECD
Energy Outlook 2035 34
Billions of vehicles
0
1
2
3
4
1975 1995 2015 2035
Electricity
Coal
Gas
Biofuels
Oil non-OECD
Oil OECD
Billion toe
Transport demand
0
5
10
15
20
1975 1995 2015 2035
US light vehicles
EU
China
Fuel economy of new cars
Litres per 100 km*
*New European Driving Cycle
© BP p.l.c. 2015
…but efficiency improvements limit growth in fuel demand
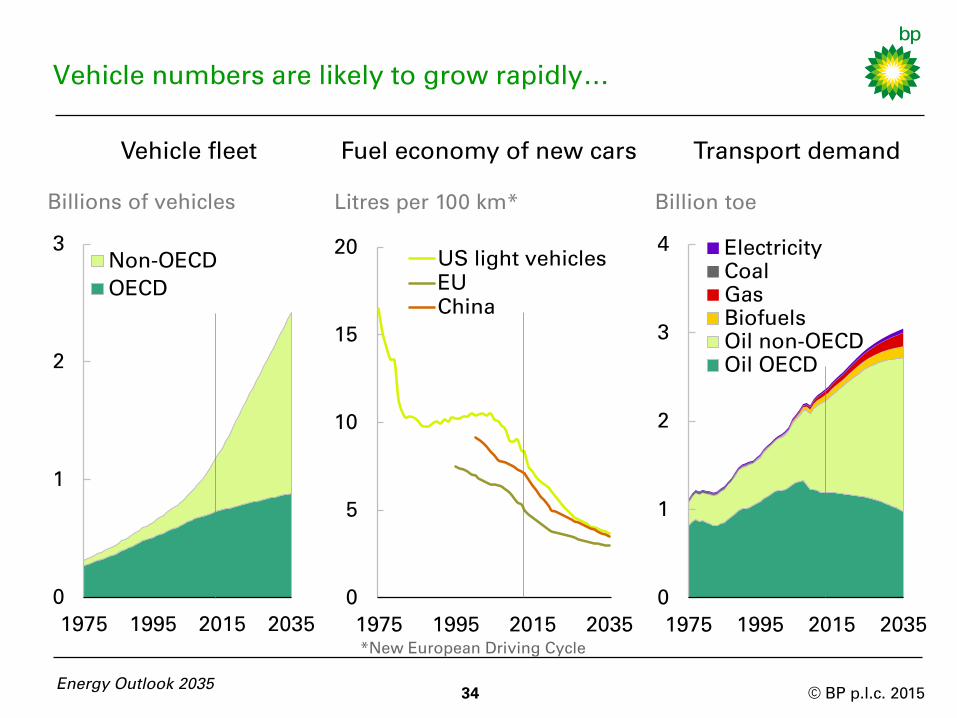
The global vehicle fleet (commercial vehicles and passenger cars) more
than doubles from around 1.2 billion today to 2.4 billion by 2035. Most of
that growth is in the developing world (88%), while some OECD markets
are already at saturation levels.
Fuel economy has improved in recent years, driven by consumer choice,
tightening policy (e.g. CO2 emissions limits in Europe and CAFE
standards in the US), and improved technology. Efficiency gains are likely
to accelerate over the Outlook, with vehicle fleet fuel economy forecast to
improve by 2.1% p.a. between 2013 and 2035, having improved by about
1.5% p.a. over the past decade.
Efficiency gains limit growth in transport fuel demand. Transport demand
rises by only around 30%, despite a more than doubling of the vehicle
fleet.
Transport fuel demand continues to be dominated by oil (89% in 2035),
but the share of non-oil alternatives increases from 5% in 2013 to 11% in
2035, with natural gas the fastest growing transport fuel (6.3% p.a.).
Energy Outlook 2035 35
© BP p.l.c. 2015 36
Oil demand outside of transport
Mb/d
Energy Outlook 2035
0
4
8
12
16
20
24
1965 2000 2035
Other Power
Petrochemicals Other industry
NGLs production by region
0
4
8
12
16
1990 2005 2020 2035
Other
Middle East
US
Mb/d
Petrochemicals are the other key driver of oil demand…
© BP p.l.c. 2015
... aided by strong growth in NGLs supplies
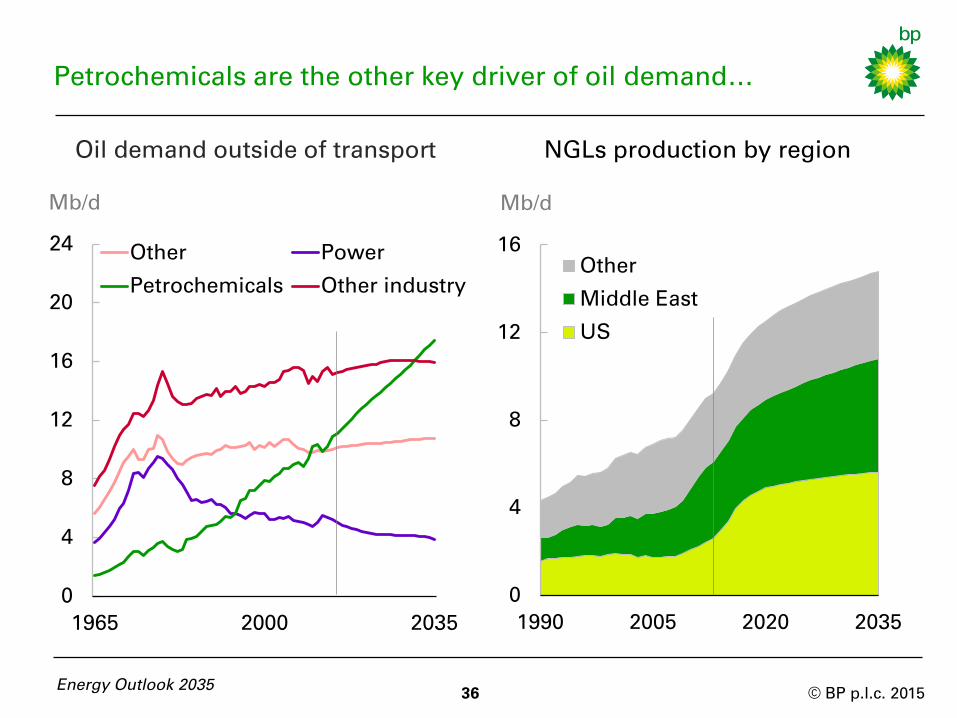
Since the oil price shocks of the 1970s, the use of oil outside of transport
has been concentrating in petrochemicals, where there is limited scope
for substitution by cheaper fuels.
Oil demand in petrochemicals increases by 2.5% p.a. (7 Mb/d) between
2013 and 2035. This continued strong growth reflects the use of oil as a
feedstock, for which there are limited alternatives and little scope for
efficiency gains. This is reinforced by strong growth in supplies of NGLs
which are particularly well suited as a feedstock. By 2035, petrochemicals
account for more than half of industrial oil demand.
Growth in the supply of NGLs stems primarily from the US (3 Mb/d) and
the Middle East (2 Mb/d). This growth is strongest in the next decade,
prompting a surge in petrochemicals demand in the US as well as
continued growth in the Middle East and non-OECD Asia.
Outside of petrochemicals and transport, oil demand is expected to be
broadly stagnant, as the effects of GDP growth are offset by efficiency
gains and displacement by relatively cheaper gas and coal.
Energy Outlook 2035 37
© BP p.l.c. 2015
0
20
40
60
80
100
120
1990 2005 2020 2035
Other
Biofuels
Condensate
Oil sands
Tight oil
NGLs
Conventional
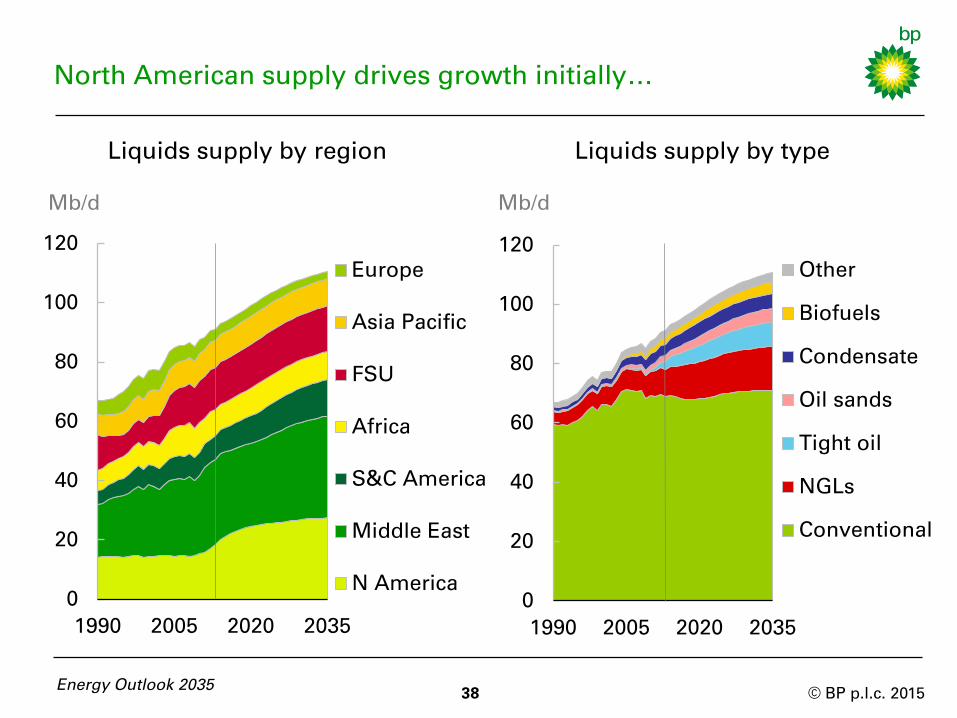
North American supply drives growth initially…
Energy Outlook 2035
Mb/d
Liquids supply by region Liquids supply by type
0
20
40
60
80
100
120
1990 2005 2020 2035
Europe
Asia Pacific
FSU
Africa
S&C America
Middle East
N America
Mb/d
38
© BP p.l.c. 2015
…before Middle East supply growth increases
Liquids supply expands by almost 20 Mb/d by 2035, led by growth in
North America during the early part of the Outlook, before the Middle
East gains ground during the latter part.
North American production expands by 9 Mb/d by 2035, with growth
concentrated in the first half of the Outlook. North American growth
comes from tight oil, NGLs, and oil sands. Outside of North America,
South and Central American production expands by 4 Mb/d by 2035,
largely due to Brazil.
Middle East production expands after 2020, as North American growth
slows. Middle East output increases by a little over 5 Mb/d by 2035.
Conventional crude production is broadly flat and nearly all of the
growth comes from other sources (tight oil, NGLs, biofuels and oil
sands). By 2035, NGLs and tight oil provide 13% and 7% of global supply,
respectively.
39 Energy Outlook 2035
© BP p.l.c. 2015
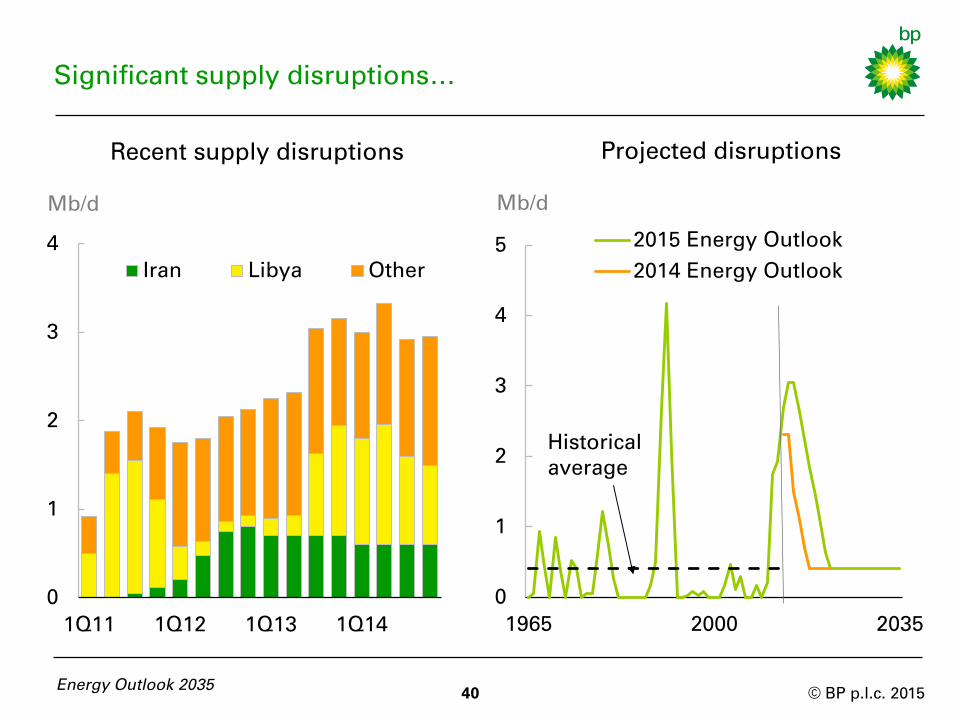
Significant supply disruptions…
Energy Outlook 2035
Mb/d
Recent supply disruptions Projected disruptions
Mb/d
0
1
2
3
4
5
1965 2000 2035
2015 Energy Outlook
2014 Energy Outlook
0
1
2
3
4
1Q11 1Q12 1Q13 1Q14
Iran Libya Other
40
Historical
average
© BP p.l.c. 2015
… are likely to be a durable factor
Since the advent of the Arab Spring in 2011, supply disruptions have
once again become a key feature in oil markets, reaching 3 Mb/d in 2014.
Libyan production fluctuated throughout the year, civil war limited
output from Syria, unrest continued in Nigeria, the Sudans and Yemen,
and international sanctions on Iran limited output.
Total supply disruptions in 2014 were well above the historical average of
roughly 400 Kb/d. The historical high for supply disruptions of a little
over 4 Mb/d was reached in 1991, as a result of the Iraq-Kuwait war and
the collapse of the Soviet Union.
Heightened levels of geopolitical risk and uncertainty suggest that supply
disruptions may well remain elevated through the medium-term.
Accordingly, we have increased the size and duration of our provision for
supply disruptions compared with our previous Outlook (see also the
discussion of geopolitical risks on pages 88-89).
41 Energy Outlook 2035
© BP p.l.c. 2015
Tight oil remains a disruptive force in the near term…
0
1
2
3
4
5
6
2005-20 2020-35
Russia
S&C America
China
Canada & Mexico
US
US
Other
Tight oil supply growth
Mb/d
-20%
0%
20%
40%
60%
80%
100%
120%
2005-20 2020-35
Share of global liquids growth
Energy Outlook 2035 42
Other
NGLs
Tight oil
OPEC
crude
© BP p.l.c. 2015
…but the market rebalances in later years
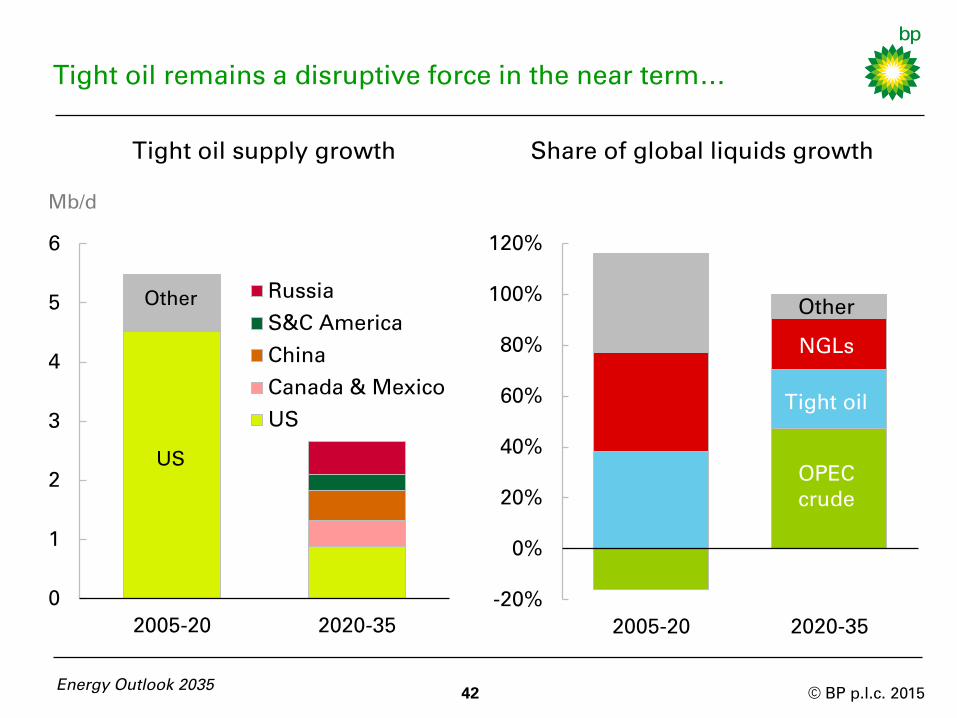
Tight oil supply, notably in the US, continues to grow in the first part of
the Outlook. US tight oil output grows by about 3 Mb/d between 2013-35
and accounts for around two-thirds of global tight oil production in 2035.
The strength of tight oil and the relative weakness of demand have
reduced the market requirement for OPEC crude in recent years. This
pressure on OPEC is likely to persist in the early years of the Outlook and
the response of OPEC to this reduction is a key uncertainty.
Further out, as tight oil supply growth slows and demand strengthens,
the call on OPEC crude begins to increase, exceeding the historical high
(32 Mb/d in 2007) by 2030.
OPEC’s market share by the end of the Outlook is around 40%, similar to
its average of the past 20 years.
43 Energy Outlook 2035
© BP p.l.c. 2015
-14
-12
-10
-8
-6
-4
-2
0
2
1985 1995 2005 2015 2025 2035
China US India
Oil trade patterns change…
44 Energy Outlook 2035
Mb/d
Net exports
-50
-25
0
25
50
75
1985 1995 2005 2015 2025 2035
Middle East FSU
Europe Asia Pacific
Africa S&C America
N America
Regional net imbalances
Mb/d
© BP p.l.c. 2015
… as Asia’s imports grow and the US becomes self-sufficient
45 Energy Outlook 2035
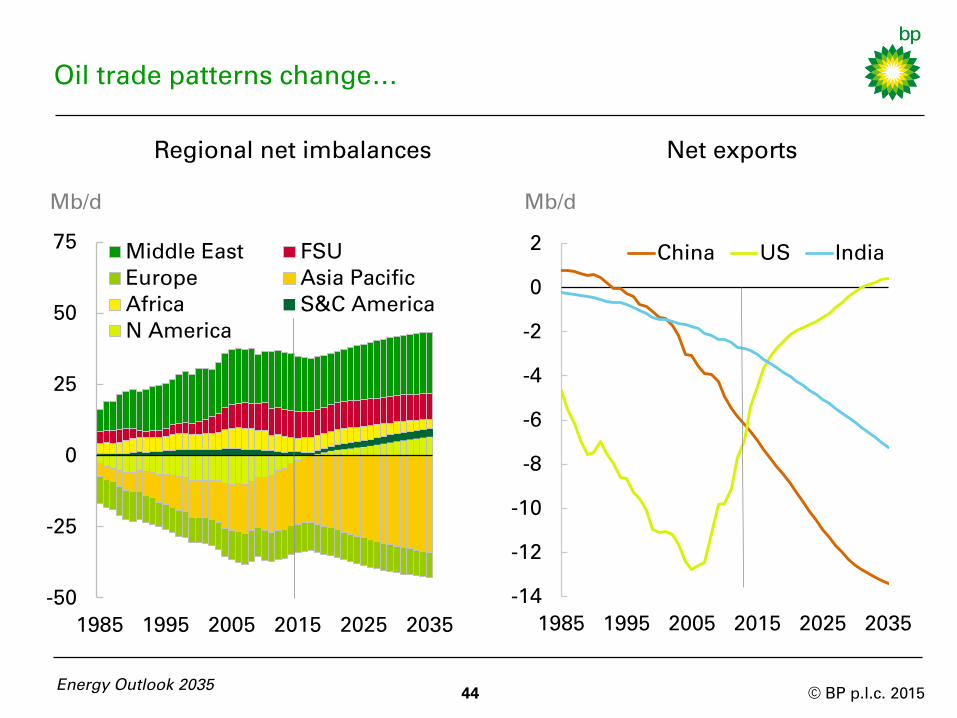
Regional trade imbalances increase and become more concentrated. In
particular, Asia’s imports account for nearly 80% of inter-regional net
imports of oil by 2035, up from around 60% today. The Middle East’s
share of inter-regional net exports falls from 55% in 2013 to a touch
below 50% by 2035. North America becomes a net oil exporter over the
next few years.
In the US, the increase in tight oil production coupled with declining
demand transform its reliance on oil imports. Having imported well over
12 Mb/d – 60% of its total demand – in 2005, US is set to become self-
sufficient by the 2030s.
China’s import requirement more than doubles to around 13 Mb/d,
accounting for around three-quarters of its total oil consumption. China
surpasses the US as the largest consumer of liquid fuels by the end of
the Outlook.
India’s import requirements also grow rapidly, with imports accounting
for almost 90% of its total oil demand by 2035.
© BP p.l.c. 2015
0
2
4
6
8
2006 2008 2010 2012 2014
0
5
10
15
20
2015 2020 2025 2030 2035
Other
NGLs
Biofuels
Crude oil
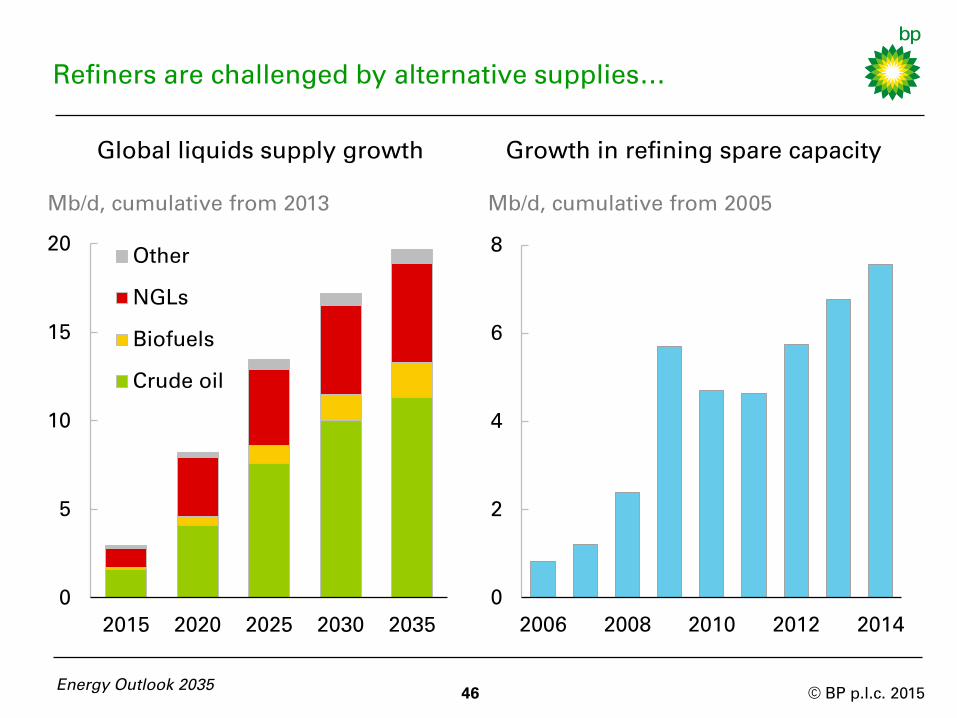
Mb/d, cumulative from 2013
Global liquids supply growth
Refiners are challenged by alternative supplies…
Growth in refining spare capacity
Mb/d, cumulative from 2005
Energy Outlook 2035 46
© BP p.l.c. 2015
... and already ample spare capacity
Of the 20 Mb/d increase in the supply of liquids to 2035, about 8 Mb/d
comes from NGLs, biofuels and other liquids that do not require
refining.
China’s demand for liquids grows by 7 Mb/d to 2035. If they follow the
pattern of the past two decades, Chinese crude runs will grow by a
similar amount, leaving crude run growth outside China of only 4 Mb/d
over more than 20 years.
Global spare refining capacity is already 7 Mb/d above its recent low
(2005) and, in recent years, a net 1 Mb/d additional capacity has been
added each year.
This Outlook therefore suggests a long period of volatile margins, with
large capacity reductions required in disadvantaged refining centres.
Energy Outlook 2035 47

© BP p.l.c. 2015 Energy Outlook 2035
48
© BP p.l.c. 2015
Introduction
Global energy trends
Liquid fuels
Natural gas
Coal and non-fossil fuels
Key uncertainties
Appendix
Energy Outlook 2035 49
Page
4
7
29
49
63
77
93
© BP p.l.c. 2015
0
100
200
300
400
500
1965 2000 2035
Other non-OECD
China
Middle East
OECD
Energy Outlook 2035 50
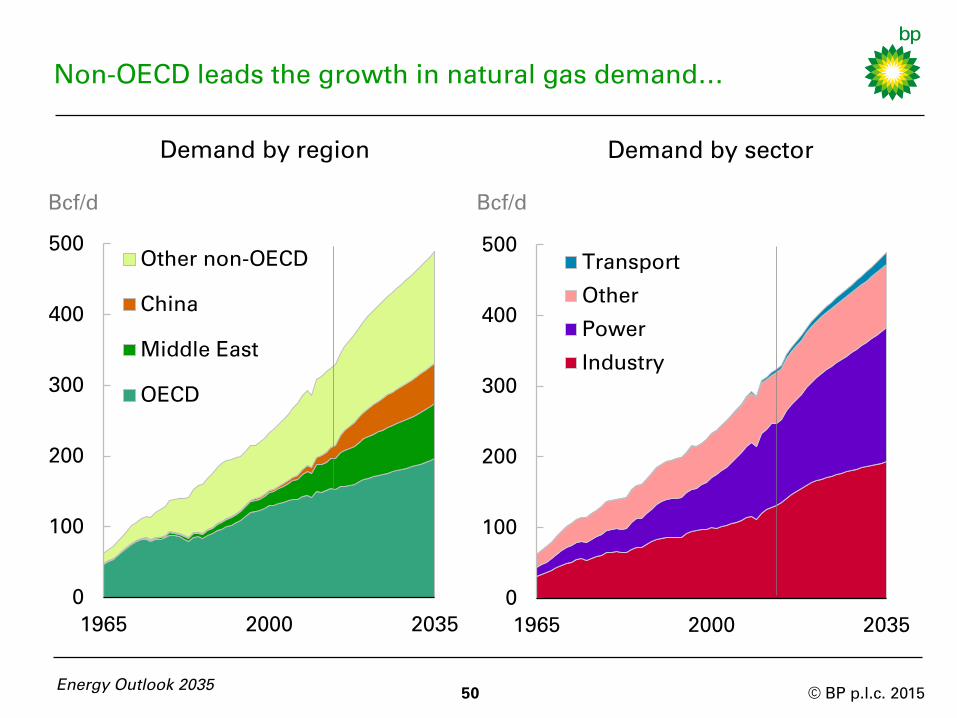
Non-OECD leads the growth in natural gas demand…
Demand by region
0
100
200
300
400
500
1965 2000 2035
Transport
Other
Power
Industry
Power
Demand by sector
Bcf/d Bcf/d
© BP p.l.c. 2015
…with increasing usage in power and industrial sectors
Global natural gas demand is expected to grow by 1.9% p.a. over the
Outlook, reaching around 490 Bcf/d by 2035.
Growth is driven by non-OECD demand, which grows 2.5% p.a., adding
123 Bcf/d. OECD grows more modestly (1.1% p.a.), adding 42 Bcf/d.
Increased usage by the power and industrial sectors account for over
80% of total demand growth, with power showing the largest gain of 75
Bcf/d (2.3% p.a.), followed by industry (61 Bcf/d, 1.8% p.a.).
In the non-OECD, power and industry add almost 50 Bcf/d each to
demand. In the OECD, growth in power sector demand (25 Bcf/d) is more
than twice that of industry (12 Bcf/d).
Transport is the fastest growing sector, albeit from a very small base,
with its share of total natural gas consumption rising to 3% by 2035.
Energy Outlook 2035 51
© BP p.l.c. 2015
0%
8%
16%
24%
0
40
80
120
1990 2005 2020 2035
Rest of world
China
Europe & Eurasia
Canada & Mexico
US
% of total gas
production
(right axis)
Energy Outlook 2035 52
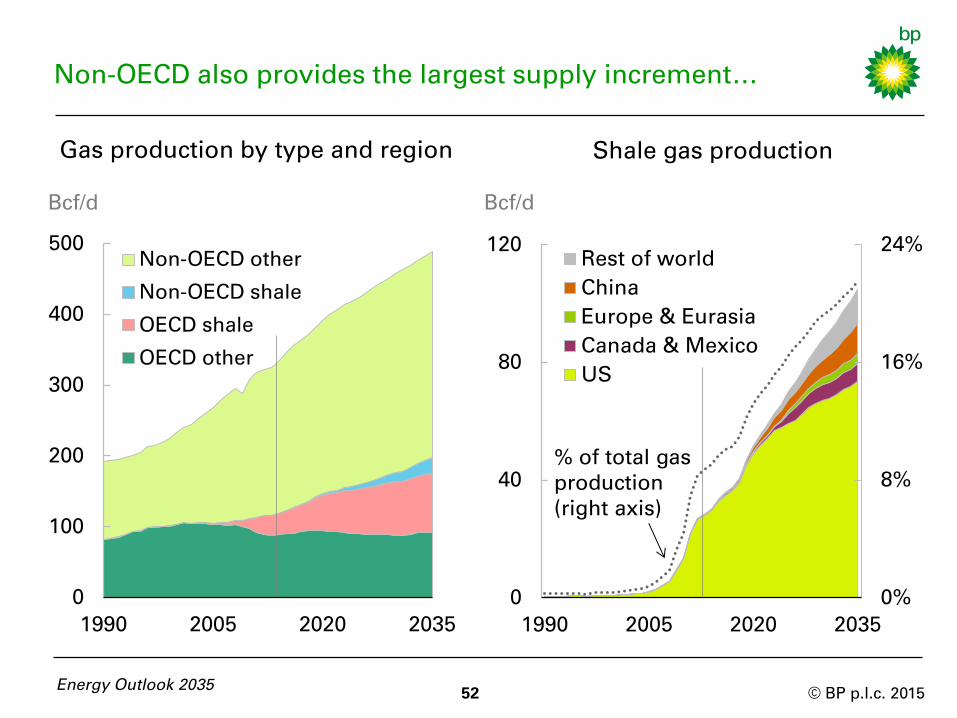
Non-OECD also provides the largest supply increment…
Gas production by type and region
0
100
200
300
400
500
1990 2005 2020 2035
Non-OECD other
Non-OECD shale
OECD shale
OECD other
Bcf/d
Shale gas production
Bcf/d
© BP p.l.c. 2015
…while OECD shale gas has the fastest growth
Around half of the increase in global gas supply comes from non-OECD
conventional gas (82 Bcf/d or 1.5% p.a.), driven in particular by the
Middle East and Russia. Almost 80% of non-OECD growth is from non-
shale sources.
OECD shale gas grows much faster at 5% p.a., adding 52 Bcf/d and
accounting for around a third of the increase in global gas supply to
2035.
Shale gas production is dominated by North America, which currently
accounts for nearly all of shale gas supply and continues to account for
around three-quarters in 2035.
However, growth in shale gas outside North America accelerates and by
the 2030s overtakes North American growth (in volume terms). China is
the most promising country outside North America, accounting for 13%
of the increase in global shale gas. By the end of the Outlook, China and
North America account for around 85% of global shale gas production.
Energy Outlook 2035 53
© BP p.l.c. 2015
FSU Africa
Middle East S & C America
N America Europe
Asia Pacific
-120
-80
-40
0
40
80
120
1975 1990 2005 2020 2035
300
350
400
450
500
2013
production
Consumed
locally
Exported 2035
production
Production and trade growth
Bcf/d
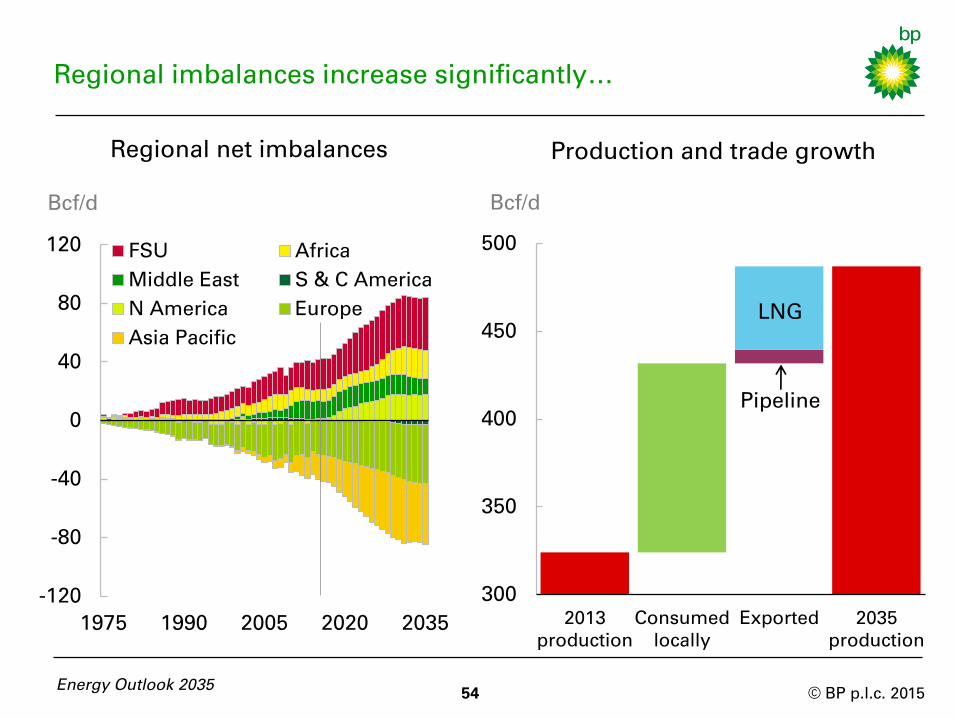
Regional imbalances increase significantly…
Bcf/d
Regional net imbalances
Energy Outlook 2035 54
LNG
Pipeline
© BP p.l.c. 2015
…with Asia overtaking Europe as the key importing region
Net inter-regional imbalances more than double by 2035. Growth in gas
traded across regions accounts for around a third of the increase in total
gas consumption.
The expansion of trade is driven by Asia Pacific, where net imports
nearly triple and account for almost 50% of global gas net imports by
2035. Asia Pacific overtakes Europe as the largest net importing region in
early 2020s. The growth of shale gas means North America will switch
from being a net importer to a net exporter in the next few years.
A vast majority (87%) of the increase in gas traded across regions
reflects increased supplies of LNG (liquefied natural gas). Pipeline
supplies grow much more slowly with new pipelines being
commissioned from Russia and Central Asia.
Energy Outlook 2035 55
© BP p.l.c. 2015 Energy Outlook 2035
56
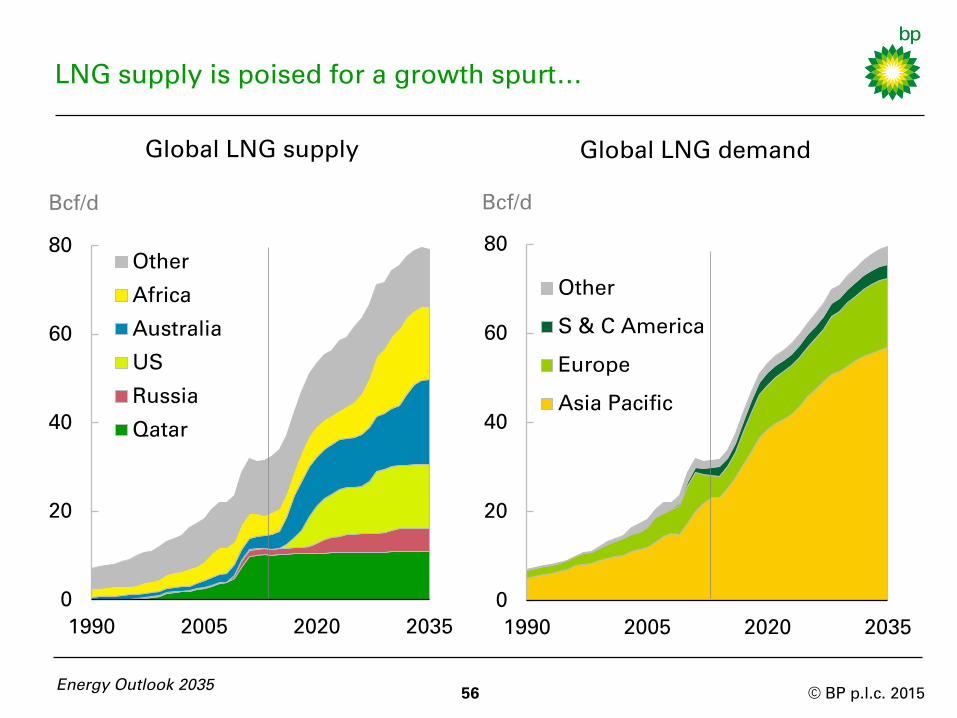
LNG supply is poised for a growth spurt…
Global LNG demand
Bcf/d
Global LNG supply
Bcf/d
0
20
40
60
80
1990 2005 2020 2035
Other
Africa
Australia
US
Russia
Qatar
0
20
40
60
80
1990 2005 2020 2035
Other
S & C America
Europe
Asia Pacific
© BP p.l.c. 2015
…supporting the expansion of Asian imports
The LNG market is poised for a growth spurt with a slew of new projects
adding 22 Bcf/d by 2020. LNG supply grows 7.8% p.a. between 2013-20.
Overall, LNG supply grows by 48 Bcf/d by 2035, with Australia (16 Bcf/d)
and the US (14 Bcf/d) each contributing around a third of that increase.
African LNG supply, led by East Africa, increases by 12 Bcf/d. As a result,
Qatar, which has the largest market share today, is overtaken by Australia
(24% share of the market by 2035), Africa (21%), and the US (18%).
Asia is the largest destination for LNG, with its share in global LNG
demand remaining above 70%. By 2035, China becomes the second
largest LNG importer (12 Bcf/d), just behind Japan (13 Bcf/d).
Europe’s share of global LNG imports rises from 16% to 19% between
2013 and 2035, with an additional 10 Bcf/d of LNG demand.
Energy Outlook 2035 57
© BP p.l.c. 2015
0%
10%
20%
30%
40%
1990 2005 2020 2035
Energy Outlook 2035 58
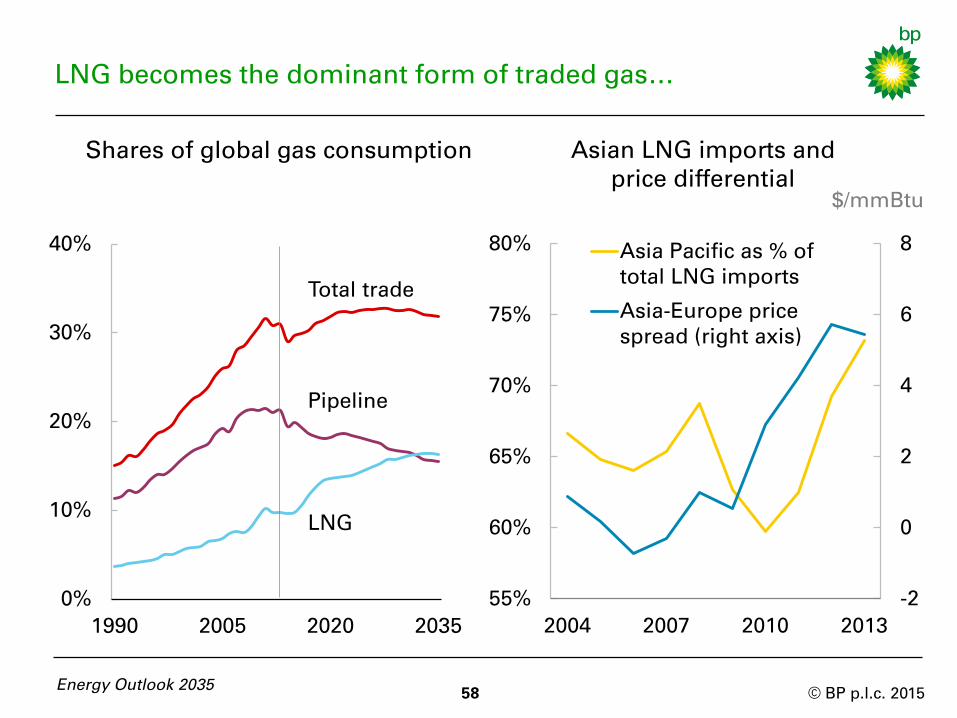
LNG becomes the dominant form of traded gas…
Total trade
Pipeline
LNG
Shares of global gas consumption Asian LNG imports and
price differential
-2
0
2
4
6
8
55%
60%
65%
70%
75%
80%
2004 2007 2010 2013
Asia Pacific as % of
total LNG imports
Asia-Europe price
spread (right axis)
$/mmBtu
© BP p.l.c. 2015
…with supplies pivoting towards large Asian markets
Global trade grows by 2% p.a. over the Outlook, causing the share of gas
consumption supplied via traded gas to increase marginally.
Traded gas supplied via pipelines declines as a share of consumption,
reflecting the pivoting of import demand away from the US and Europe
and towards Asia.
In contrast, gas supplied via LNG grows by 4.3% p.a., more than twice as
fast as total trade. As a result, LNG becomes the dominant form of traded
gas by the end of the Outlook.
The greater ability of LNG supplies to respond to varying movements in
demand and supply across the world means that gas deficit regions such
as Asia Pacific are able to attract larger LNG supplies by paying a
premium over other markets.
In the long run, increased LNG supplies lead to more integrated markets,
with gas prices moving in greater unison across regions.
Energy Outlook 2035 59
© BP p.l.c. 2015 60 60
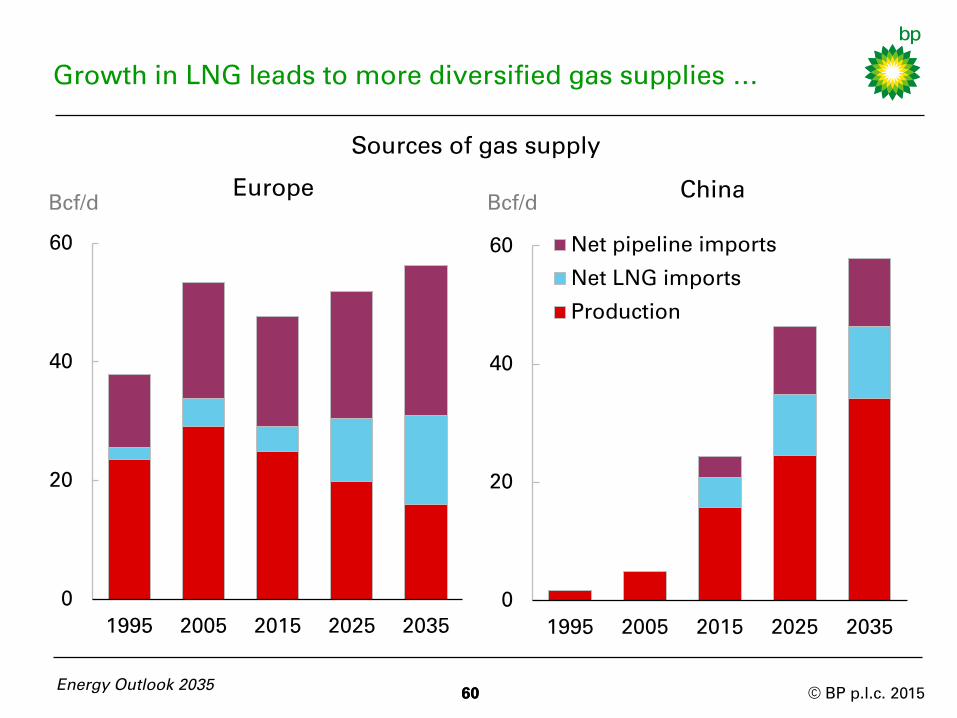
Growth in LNG leads to more diversified gas supplies …
Bcf/d China
Bcf/d
Europe
Sources of gas supply
0
20
40
60
1995 2005 2015 2025 2035
Net pipeline imports
Net LNG imports
Production
Energy Outlook 2035
0
20
40
60
1995 2005 2015 2025 2035
© BP p.l.c. 2015
…for both Europe and China
Europe’s gas imports currently account for around 50% of its total gas
consumption. Over 80% of these imports are via pipeline, the vast
majority of which are from Russia.
European domestic production declines by 2% p.a. over the Outlook, so
that, even with only modest demand growth (0.8% p.a.), almost three-
quarters of Europe’s gas needs are met by imports by 2035. Growth of
LNG means these imports are more diversified, with pipelines
accounting for around two-thirds of imports and LNG the remainder.
China, by contrast, enjoys strong growth in gas production (5.1% p.a.)
across all types of supply. Shale gas makes a significant contribution to
growth (10 Bcf/d, 33% p.a.), with most of that increase coming in the last
decade of the Outlook.
Nonetheless, Chinese demand growth requires a rapid expansion of
imports (7.6% p.a.) via both LNG and pipelines. LNG overtakes pipeline
supplies as the dominant form of Chinese gas imports by the 2030s.
Energy Outlook 2035 61

© BP p.l.c. 2015 Energy Outlook 2035
62
© BP p.l.c. 2015
Introduction
Global energy trends
Liquid fuels
Natural gas
Coal and non-fossil fuels
Key uncertainties
Appendix
Energy Outlook 2035 63
Page
4
7
29
49
63
77
93
© BP p.l.c. 2015 Energy Outlook 2035
64
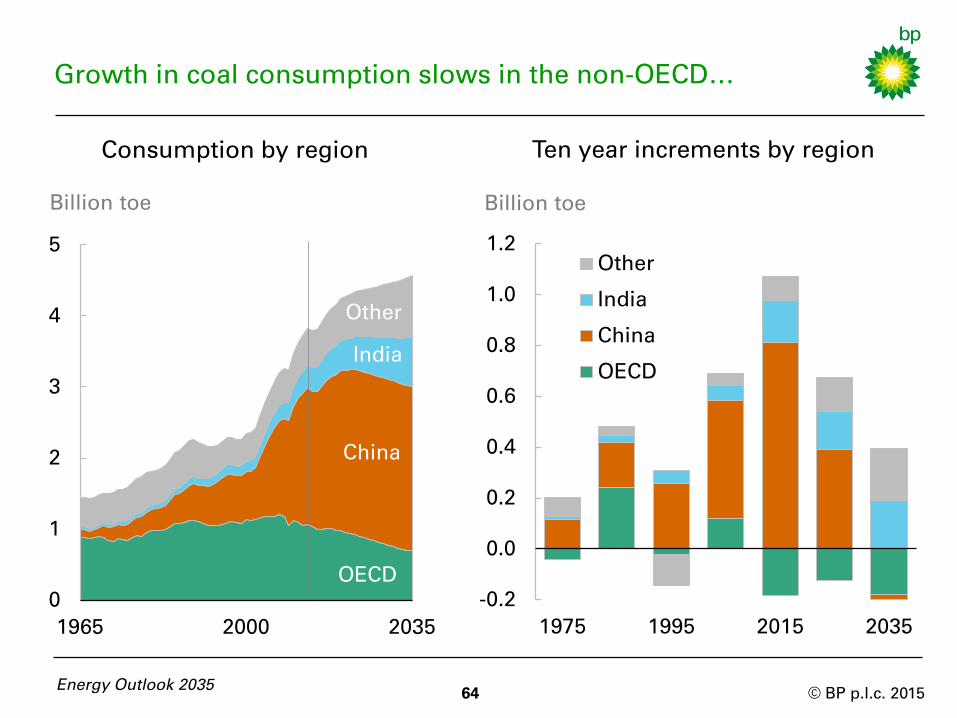
Growth in coal consumption slows in the non-OECD…
Ten year increments by region
Billion toe
Consumption by region
FSU pipeline
Conventional
LNG
Russian pipeline
0
1
2
3
4
5
1965 2000 2035
OECD
China
India
Other
-0.2
0.0
0.2
0.4
0.6
0.8
1.0
1.2
1975 1995 2015 2035
Other
India
China
OECD
Billion toe
© BP p.l.c. 2015
…whilst OECD consumption declines
Global coal demand grows by 0.8% p.a. between 2013 and 2035, making
it the slowest growing fuel. Non-OECD consumption increases (1.1 Btoe),
partially offset by declines in OECD consumption (-0.4 Btoe).
China continues to lead the growth in consumption (390 Mtoe) even
though its growth rate declines from 8.3% p.a. during 2000-13 to 0.8% in
2013-35. Chinese coal consumption peaks in 2025 and then declines
slightly in the final decade of the Outlook.
India increases coal consumption by 360 Mtoe by 2035, making it the
second largest growth market. Increases in power sector demand
account for almost 70% of India’s consumption growth.
The decline in OECD consumption is led by the US (-220 Mtoe) and the
European Union (-150 Mtoe). This reduction is concentrated in the power
sector, where environmental policies and ample supplies of gas
encourage gas to displace coal.
Energy Outlook 2035 65
© BP p.l.c. 2015
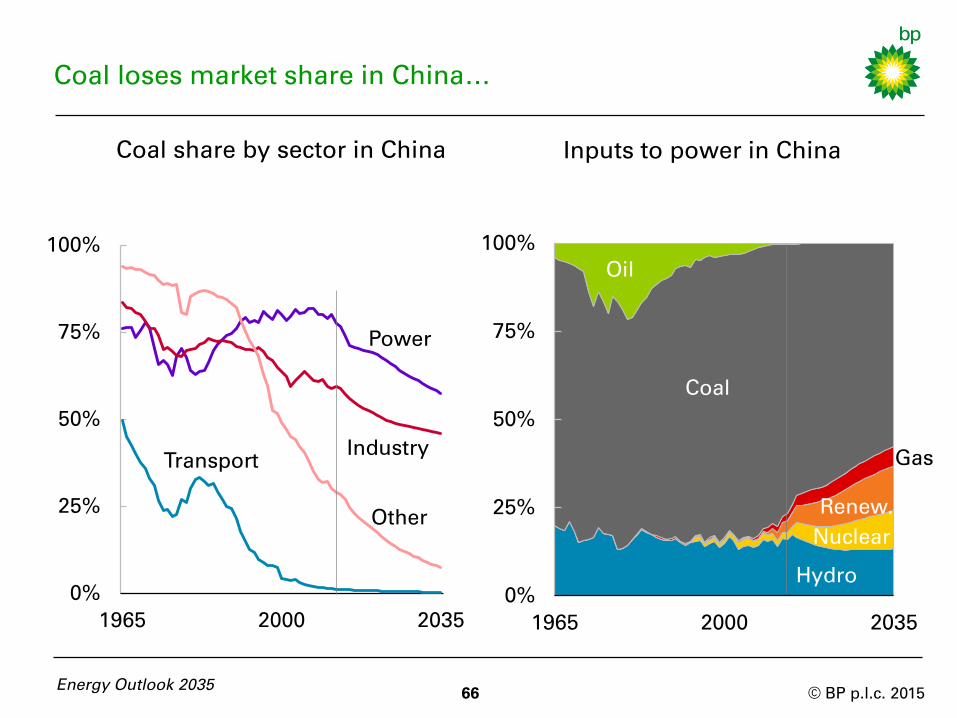
Coal loses market share in China…
66
Coal share by sector in China Inputs to power in China
0%
25%
50%
75%
100%
1965 2000 2035
0%
25%
50%
75%
100%
1965 2000 2035
Oil
Coal
Hydro
Nuclear
Renew.
Gas Transport
Other
Power
Industry
Energy Outlook 2035
© BP p.l.c. 2015
…as the country transitions to cleaner fuels
Growth in Chinese coal consumption is led by demand in the power
sector (1.4% p.a.) followed by industry (0.4% p.a.). These two sectors
account for 97% of China’s coal consumption by 2035.
Growth slows considerably in all sectors, from the highs during 2000-13
when power sector consumption grew by 10% p.a. and industrial
consumption by 7% p.a..
The share of coal as a source of energy declines across all sectors in
China. In power generation, the largest coal consuming sector, coal’s
share declines from 77% in 2013 to 58% by 2035, as renewables and
nuclear gain share. The loss of market share in industry is more modest,
falling from 59% to 46%.
As a result, China records the steepest decline in the share of coal in
primary energy between 2013 and 2035. Nevertheless, in 2035, China still
has the highest coal share in primary energy at 51%.
Energy Outlook 2035 67
© BP p.l.c. 2015
0%
10%
20%
30%
40%
1990 2005 2020 2035
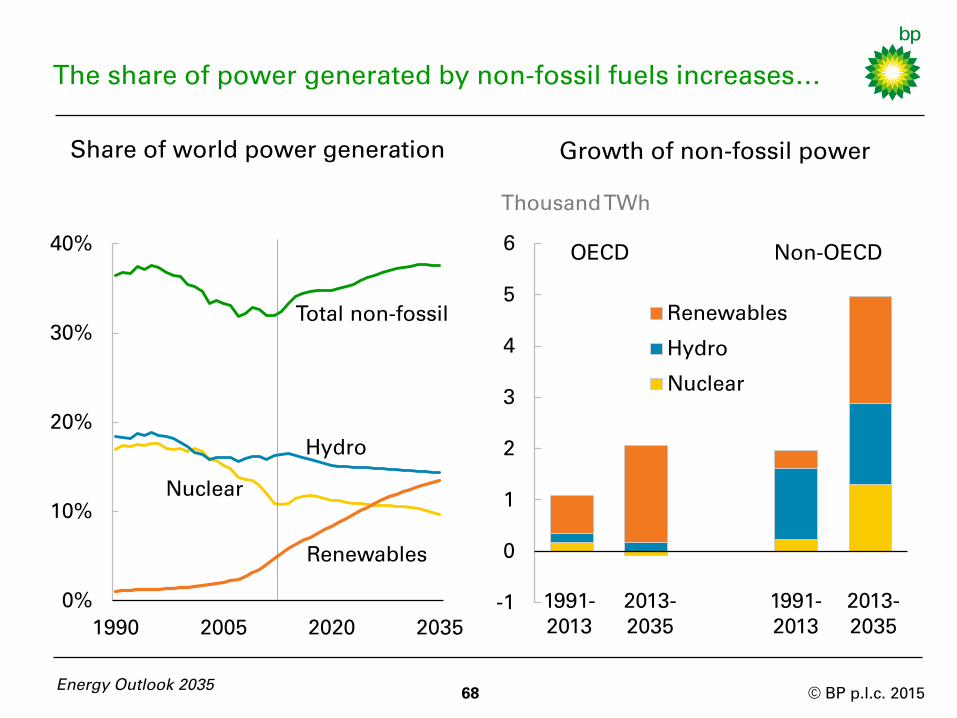
The share of power generated by non-fossil fuels increases…
Share of world power generation
Total non-fossil
Hydro
Nuclear
Renewables
68 Energy Outlook 2035
-1
0
1
2
3
4
5
6
Renewables
Hydro
Nuclear
Growth of non-fossil power
Thousand TWh
OECD Non-OECD
1991-
2013
1991-
2013
2013-
2035
2013-
2035
© BP p.l.c. 2015
…driven by the rapid growth of renewables
69 Energy Outlook 2035
Until recently, the share of non-fossil fuels in global power generation
was declining as nuclear and hydro struggled to keep pace with the
growth of global power generation, and renewables were too small to
make a material difference.
Looking ahead, the shares of nuclear and hydro continue to decline, but
the scaling up of renewables is sufficient to lift the aggregate non-fossil
share from 32% in 2013 to 38% by 2035.
Within the OECD, renewables dominate the growth of non-fossil power,
and contribute 90% of the net growth in power generation from all
sources.
The growth of non-fossil fuels in the non-OECD is broader based. The
increase in renewable power is roughly the same in volume terms as in
the OECD. But there are also significant increases in nuclear and hydro.
Renewables account for 16% of the growth in power generation in the
non-OECD.
© BP p.l.c. 2015
0
50
100
150
200
250
300
2015 2035 2015 2035 2015 2035 2015 2035
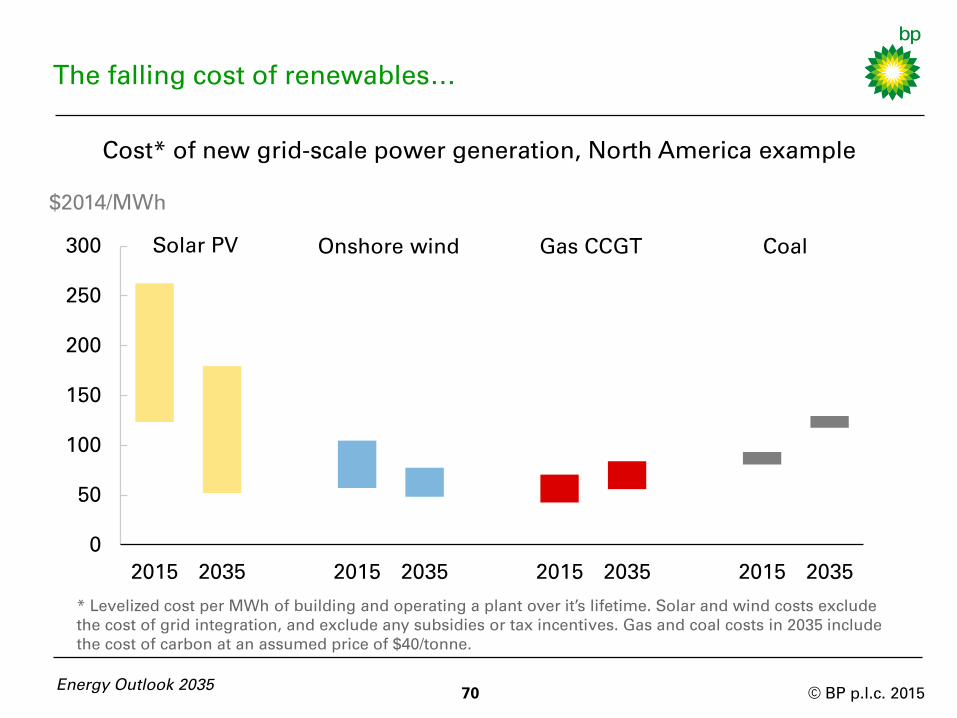
The falling cost of renewables…
Cost* of new grid-scale power generation, North America example
Gas CCGT Coal Onshore wind Solar PV
$2014/MWh
* Levelized cost per MWh of building and operating a plant over it’s lifetime. Solar and wind costs exclude
the cost of grid integration, and exclude any subsidies or tax incentives. Gas and coal costs in 2035 include
the cost of carbon at an assumed price of $40/tonne.
Energy Outlook 2035 70
© BP p.l.c. 2015
…keeps a lid on the growth of the subsidy burden
71 Energy Outlook 2035
The rapid growth of renewables currently depends on policy support in
most markets, as renewables tend to be more expensive than coal or
gas-fired power. As renewables grow in volume, the burden of this policy
support can become a constraint on growth. To maintain rapid growth,
the costs of renewable power need to keep falling, reducing the subsidy
required per unit of power.
The cost of renewables are expected to fall significantly over the Outlook,
due to technological advances, learning-by-doing, and economies of
scale. Both solar PV and wind appear to be following well-established
learning curves, with costs falling rapidly as production increases.
Onshore wind power in the best locations is increasingly able to
compete with new conventional fossil power plants, even without
subsidy and allowing for grid integration costs. Solar PV is also likely to
become competitive across an increasing number of market niches. But
even by 2035, grid-scale PV still requires a material carbon price to
compete with efficient gas combined cycle generation.
© BP p.l.c. 2015
0%
10%
20%
30%
40%
1990 2005 2020 2035
EU
US
China
0.0
0.3
0.6
0.9
1.2
China EU US OECD
Asia
India
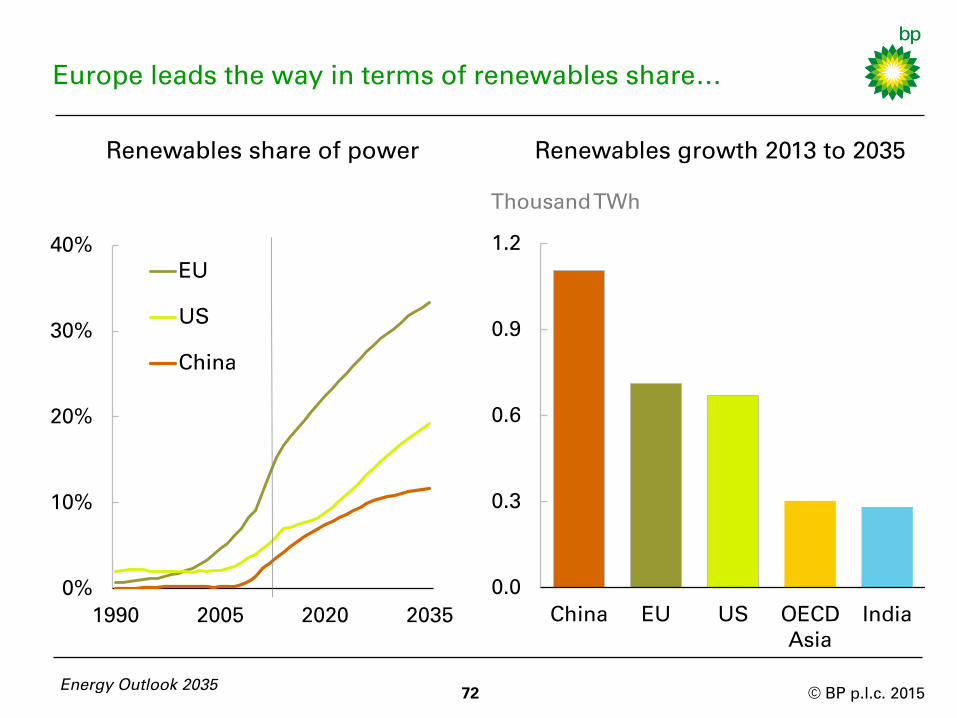
Europe leads the way in terms of renewables share…
Renewables share of power
Renewables growth 2013 to 2035
Thousand TWh
Energy Outlook 2035 72
© BP p.l.c. 2015
…but China is the largest source of growth
73 Energy Outlook 2035
Falling costs enable renewables to continue to gain share in Europe and
encourage the spread of renewables to other regions. The European
Union (EU) has led the way in promoting renewable power, but the size
of the subsidy burden has become a constraint on growth in some
markets. Falling costs will relax this constraint.
By 2035, the share of renewables is likely to be stretching the ability of
grid systems to handle intermittent sources of power in a number of EU
markets, adding a technical constraint to the growth rate of renewables.
Outside the EU, renewables are still scaling up – the US does not reach
the current EU level of renewables penetration until 2030, and it takes
even longer for China. However in terms of volume growth between 2013
and 2035, the EU is surpassed by China, and almost matched by the US.
© BP p.l.c. 2015
0
1
2
3
4
5
6
1965 2000 2035
Other
China
Brazil
Europe
North America
0
1
2
3
4
5
6
1965 2000 2035
Other
China
Other Asia
Europe
North America
Thousand TWh
Nuclear generation by region
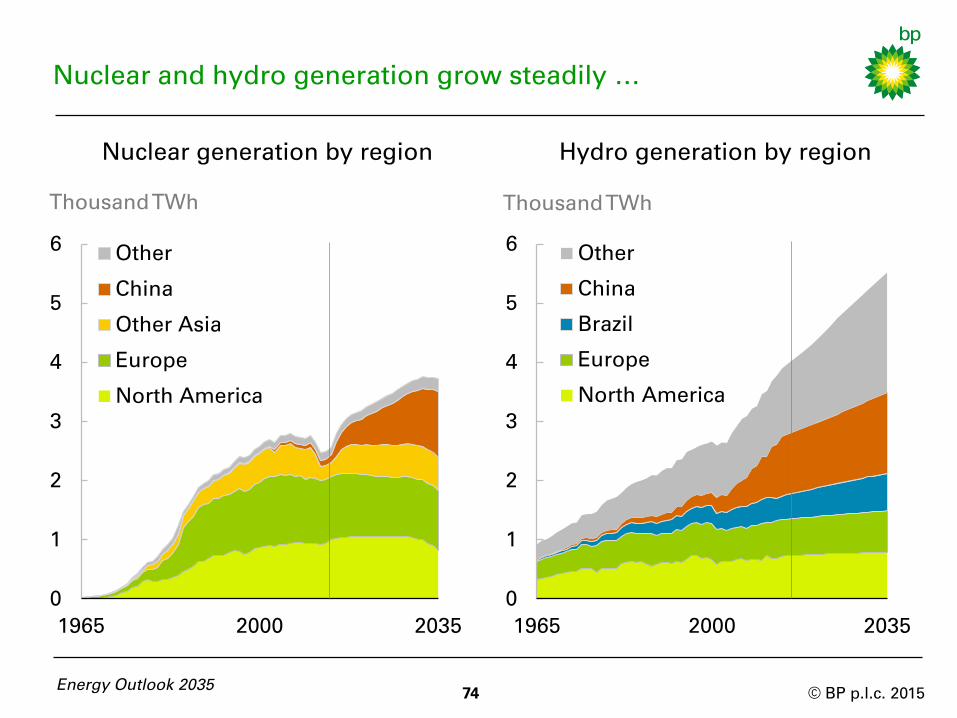
Nuclear and hydro generation grow steadily …
Energy Outlook 2035 74
Thousand TWh
Hydro generation by region
© BP p.l.c. 2015
…led by the non-OECD, particularly China
75 Energy Outlook 2035
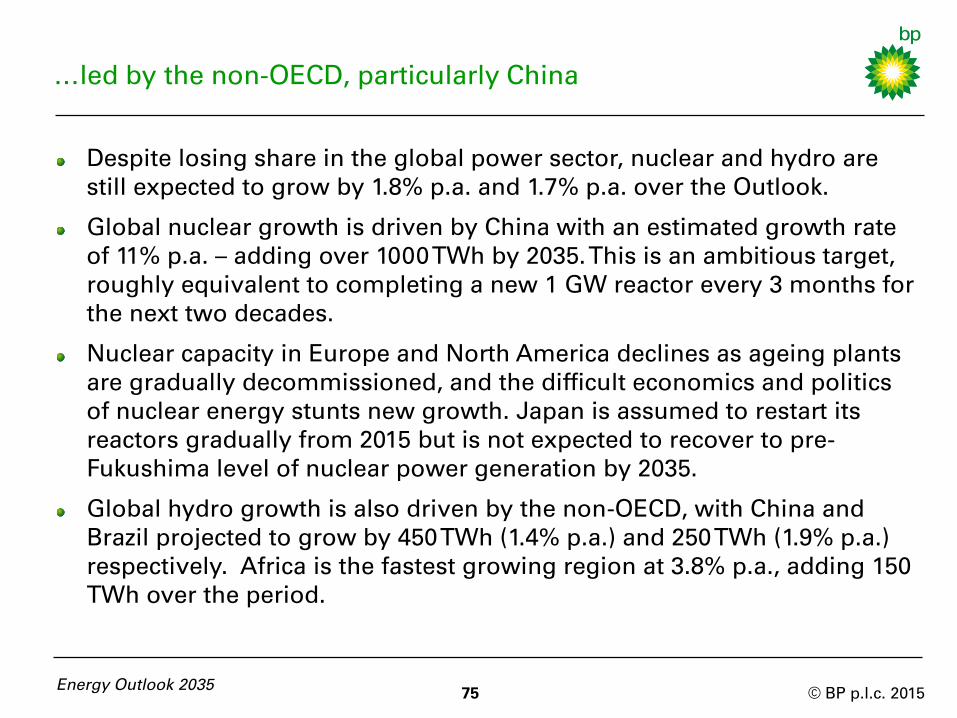
Despite losing share in the global power sector, nuclear and hydro are
still expected to grow by 1.8% p.a. and 1.7% p.a. over the Outlook.
Global nuclear growth is driven by China with an estimated growth rate
of 11% p.a. – adding over 1000 TWh by 2035. This is an ambitious target,
roughly equivalent to completing a new 1 GW reactor every 3 months for
the next two decades.
Nuclear capacity in Europe and North America declines as ageing plants
are gradually decommissioned, and the difficult economics and politics
of nuclear energy stunts new growth. Japan is assumed to restart its
reactors gradually from 2015 but is not expected to recover to pre-
Fukushima level of nuclear power generation by 2035.
Global hydro growth is also driven by the non-OECD, with China and
Brazil projected to grow by 450 TWh (1.4% p.a.) and 250 TWh (1.9% p.a.)
respectively. Africa is the fastest growing region at 3.8% p.a., adding 150
TWh over the period.

© BP p.l.c. 2015 Energy Outlook 2035
76
© BP p.l.c. 2015
Introduction
Global energy trends
Liquid fuels
Natural gas
Coal and non-fossil fuels
Key uncertainties
Appendix
Energy Outlook 2035 77
Page
4
7
29
49
63
77
93
© BP p.l.c. 2015
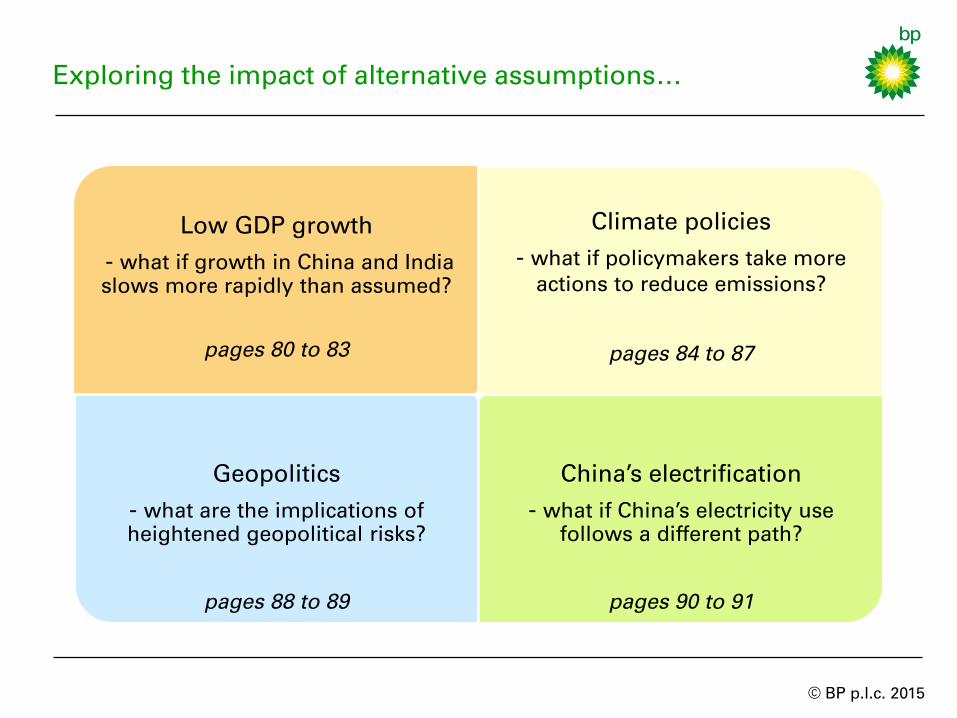
Low GDP growth
- what if growth in China and India
slows more rapidly than assumed?
pages 80 to 83
Climate policies
- what if policymakers take more
actions to reduce emissions?
pages 84 to 87
Geopolitics
- what are the implications of
heightened geopolitical risks?
pages 88 to 89
China’s electrification
- what if China’s electricity use
follows a different path?
pages 90 to 91
Exploring the impact of alternative assumptions…
© BP p.l.c. 2015
…illustrates the uncertainties around the Outlook
79 Energy Outlook 2035
This Outlook presents a single “most likely” view, constructed to
highlight the main trends which are likely to shape energy markets over
the next two decades. We believe this provides a robust basis for
discussion.
Building that single point projection necessarily requires making choices
about assumptions which are inherently uncertain. By exploring the
impact of alternative assumptions we can illustrate some of the
uncertainties around the Outlook, adding to the richness of the debate.
We have chosen four key uncertainties to explore here, which are
described in more detail in the following pages. This is not an exhaustive
list by any means – there are many other uncertainties surrounding the
Outlook.
© BP p.l.c. 2015
-25%
-20%
-15%
-10%
-5%
0%
World
GDP
Energy
demand
100
200
300
400
500
1990 2005 2020 2035
Low case
Index: 1990 = 100
The future path of growth in non-OECD Asia…
80 Energy Outlook 2035
GDP and energy demand in
base and low case
GDP
OECD Non-OECD
Asia
Differences from base case in 2035
%
Energy
Low GDP growth
Other
© BP p.l.c. 2015
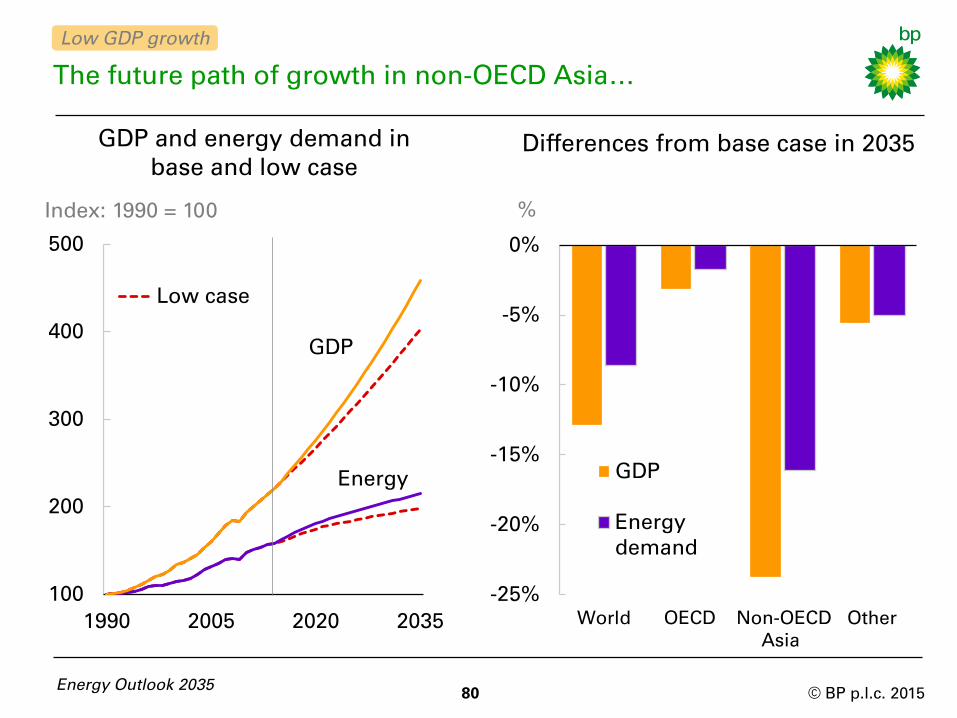
…is a major source of uncertainty for energy demand
The future growth paths of China and India represent a major source of
uncertainty. Our low GDP case assumes China and India grow at an
average rate of 4% p.a. over the projection period, compared with 5.5%
p.a. in the base case. It also includes the trade and other spill-over effects
of lower growth in these two countries on the rest of the world.
It is based on the recognition that prolonged periods of growth above
the global average are rare, and it is possible that the high growth rates
seen in these countries in recent years may slow more rapidly than
anticipated.
In the low growth case, GDP in non-OECD Asia is 25% lower than in the
base case by 2035, and world GDP is 13% lower. World GDP grows at a
little below 3% p.a., compared with 3.5% p.a. in the base case.
World energy consumption grows at 1% p.a. rather than 1.4% p.a. By
2035, global energy demand is 8.5% (1.5 billion toe) lower than in the
base case. This is roughly equivalent to the total energy demand of the
entire European Union in 2035.
81 Energy Outlook 2035
Low GDP growth
© BP p.l.c. 2015
-12%
-10%
-8%
-6%
-4%
-2%
0%
Oil Gas
Demand growth is slower for all fuels...
Energy Outlook 2035
Energy demand by fuel in 2035
% difference from base
82
Nuclear
& hydro
Renew.
Billion tonnes CO2
Global CO2 emissions
from energy use
0
6
12
18
24
30
36
42
1965 2000 2035
Low
GDP
Base
Low GDP growth
Coal
© BP p.l.c. 2015
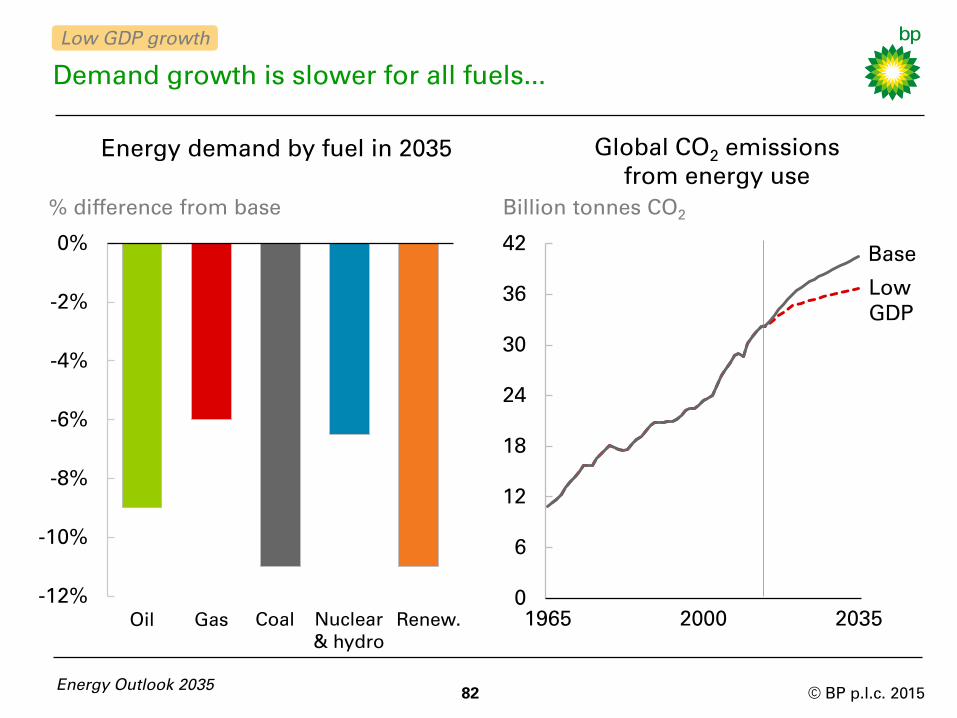
…resulting in lower carbon emissions
Within the fossil fuels, coal demand shows the largest decline versus the
base case (-11%), followed by oil (-9%) and gas (-6%). These differential
impacts reflect the fuel mix in China and India (the focus of the slower
grow), and assumptions about how quickly supplies would adjust.
The lower price of fossil fuels and increased financial pressures
(particularly in non-OECD Asia) that come with slower economic growth
mean that the growth of renewables, nuclear and hydro also decline.
In the low growth case, carbon emissions in 2035 are 9% lower than in
the base case; equivalent to 4 billion tonnes of CO2.
This would still leave the path of emissions above the IEA’s 450 Scenario
(see following page). Indeed, the increase in financial pressures in non-
OECD Asia may complicate the process of reaching a political consensus
on carbon reduction policies.
83 Energy Outlook 2035
Low GDP growth
© BP p.l.c. 2015
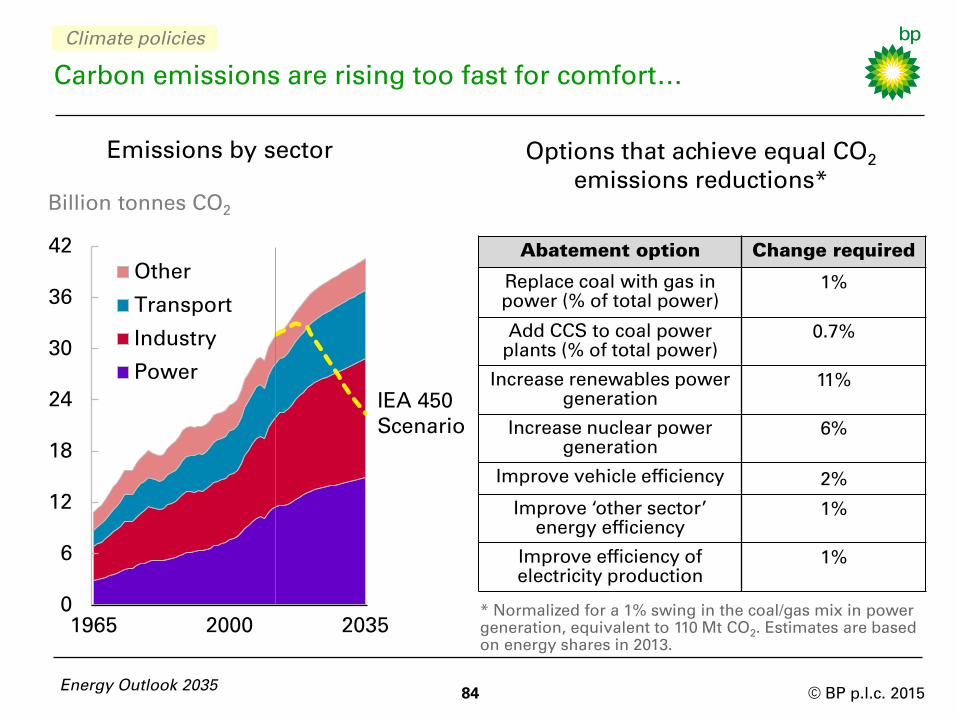
Carbon emissions are rising too fast for comfort…
84 Energy Outlook 2035
Options that achieve equal CO2
emissions reductions*
Billion tonnes CO2
Emissions by sector
0
6
12
18
24
30
36
42
1965 2000 2035
Other
Transport
Industry
Power
IEA 450
Scenario
Abatement option Change required
Replace coal with gas in
power (% of total power)
1%
Add CCS to coal power
plants (% of total power)
0.7%
Increase renewables power
generation
11%
Increase nuclear power
generation
6%
Improve vehicle efficiency 2%
Improve ‘other sector’
energy efficiency
1%
Improve efficiency of
electricity production
1%
* Normalized for a 1% swing in the coal/gas mix in power
generation, equivalent to 110 Mt CO2. Estimates are based
on energy shares in 2013.
Climate policies
© BP p.l.c. 2015
...which could trigger additional abatement policies
Global CO2 emissions from energy use grow by 25% (1% p.a.) over the
Outlook. Emissions remain well above the path recommended by
scientists, illustrated by the IEA’s “450 Scenario”. In 2035, CO2
emissions are 18 billion tonnes above the IEA’s 450 Scenario.
The projections are based on our view of the most likely evolution of
carbon related policies, but future climate policies are a key uncertainty
in the Outlook. There are a number of options open to policy makers if
they decide to further abate carbon emissions.
The table considers a list of potential options, with a comparison of the
extent of change required to achieve the same emissions savings as a
1% shift in the coal/gas mix of the power sector.
The list is not exhaustive. The options include those that: limit
emissions from coal in the power sector; increase non-fossil fuel use;
and improve energy efficiency.
Energy Outlook 2035 85
Climate policies
© BP p.l.c. 2015
0%
10%
20%
30%
40%
Gas Coal with
CCS
Renewables Nuclear
2013
2035 base case
2035 lower CO₂
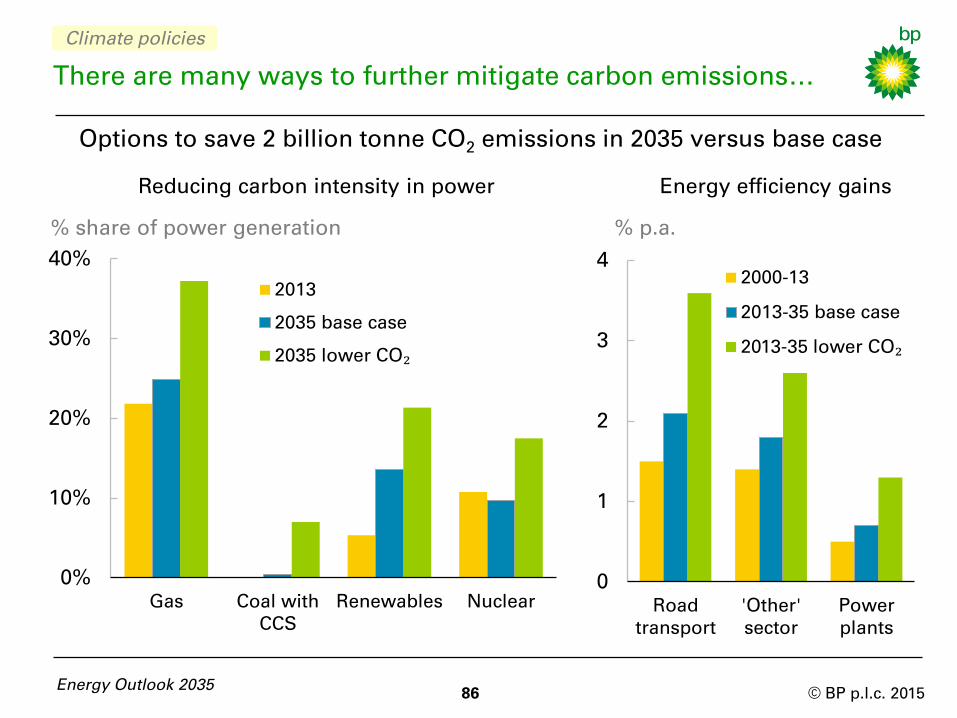
There are many ways to further mitigate carbon emissions…
Energy efficiency gains Reducing carbon intensity in power
Options to save 2 billion tonne CO2 emissions in 2035 versus base case
% share of power generation
0
1
2
3
4
Road
transport
'Other'
sector
Power
plants
2000-13
2013-35 base case
2013-35 lower CO₂
% p.a.
Energy Outlook 2035 86
Climate policies
© BP p.l.c. 2015
… all of which involve significant challenges
The charts show the change required for each option to achieve a 2
billion tonne CO2 saving in 2035 relative to the base case – roughly 10%
of the gap between projected emissions and the IEA 450 Scenario in
that year.
No single change or improvement is likely to be sufficient, and none of
these options are easy. The required improvement in vehicle efficiency
by 2035, for example, is almost 50% more than the efficiency gain which
is already in the base case. That is a considerable challenge.
Each option has its own challenges: cost, technological limits, slow
turnover of existing capital stock, the ability to implement policy
globally and inertia in behavioural change. A comparison of the
required change relative to recent history and to the “most likely”
outcome may provide some guidance. But given the complexities, it is
difficult to pick ‘winners’.
A meaningful global carbon price would provide the right incentives for
the most cost-effective decisions and investments to be made.
Energy Outlook 2035 87
Climate policies
© BP p.l.c. 2015
0%
20%
40%
1965 1980 1995
0
1
2
3
1975 1980 1985 1990 1995 2000
42
44
46
2005 2008 2011 2014
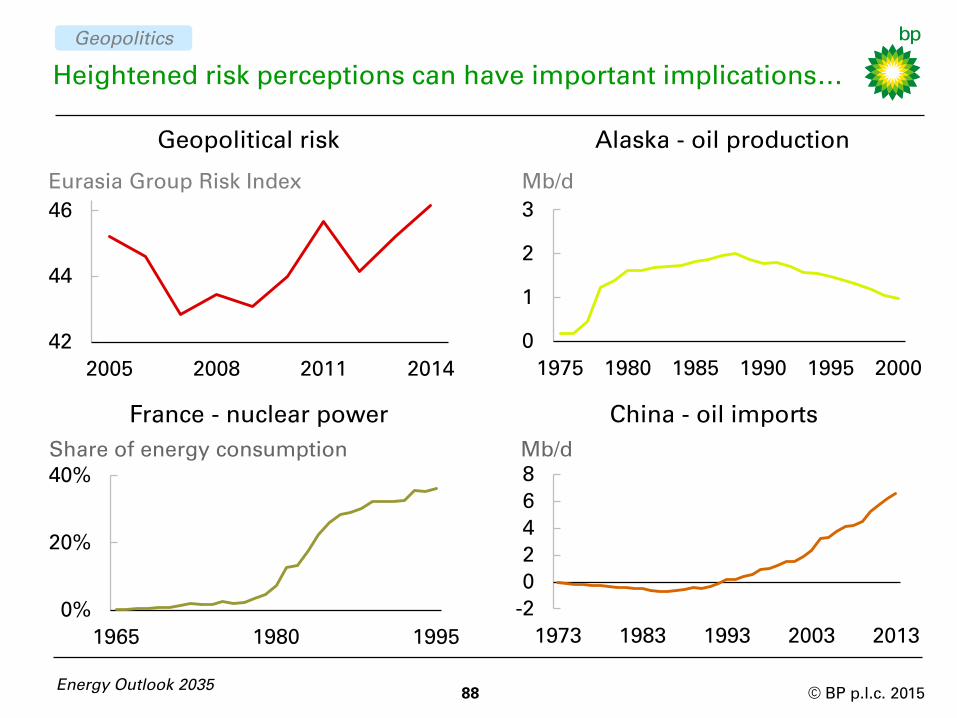
Heightened risk perceptions can have important implications…
88
Eurasia Group Risk Index
Geopolitical risk
Energy Outlook 2035
Share of energy consumption
France - nuclear power
Mb/d
Alaska - oil production
Mb/d
China - oil imports
-2
0
2
4
6
8
1973 1983 1993 2003 2013
Geopolitics
© BP p.l.c. 2015
…for both energy supply and demand
Geopolitical risks – which on some measures have increased in recent
years – have potentially important implications for energy markets.
On the supply side, the level of disruptions to oil in recent years has been
well above the historical average. We have marked up the likely
incidence of supply disruptions over the medium term (see pages 40-41).
Changing perceptions of geopolitical risks may also spur policy choices
that lead to lasting changes to energy demand as well as supply.
Historical examples include: the French decision to increase its
dependence on nuclear energy, and the approval of the Trans-Alaska
pipeline in the US (both following the early 1970s oil shocks); and China’s
acceptance of growing oil imports to fuel economic development (after
an extended period of policy focused on maintaining self-sufficiency).
We have built substantial evolution of both energy markets and policy
into this Outlook, but heightened geopolitical risk perceptions could drive
additional policy interventions beyond those anticipated.
Energy Outlook 2035 89
Geopolitics
© BP p.l.c. 2015
0
2
4
6
8
10
China
2013
China
2035
EU
2013
Japan
2006
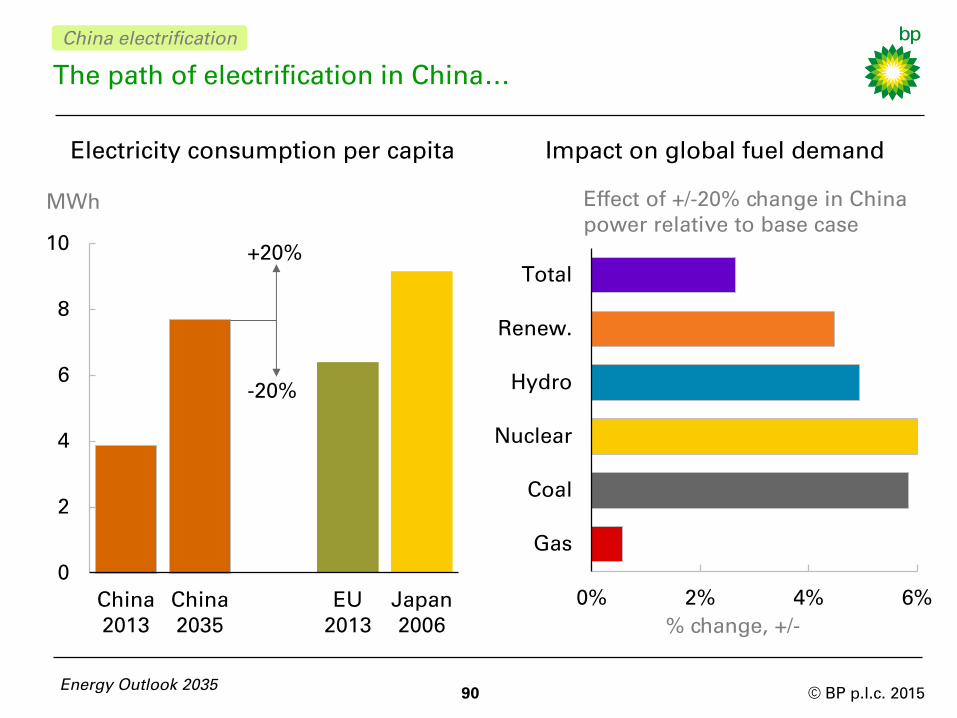
The path of electrification in China…
Electricity consumption per capita
Impact on global fuel demand
MWh
Energy Outlook 2035 90
+20%
-20%
0% 2% 4% 6%
Gas
Coal
Nuclear
Hydro
Renew.
Total
Effect of +/-20% change in China
power relative to base case
% change, +/-
China electrification
© BP p.l.c. 2015
…has significant implications for global energy
91 Energy Outlook 2035
The future path of electrification in China is a key uncertainty. China’s
power sector accounted for nearly 30% of global energy growth over the
past decade. In our base case, China’s per capita electricity consumption
grows by 3.2% p.a. reaching 7.7 MWh by 2035.
A sensitivity band around that base case can be constructed by looking
at the per capita electricity consumption of the EU and Japan at the point
where their GDP per capita broadly matched that projected for China in
2035 (2006 for Japan, 2013 for the EU).
A +/-20% change in China’s power generation (assuming no change in
the shares of fuels in Chinese power) would change global energy
demand in 2035 by +/-2.7%. That is roughly equivalent to two years of
global energy growth, or an energy market the size of Japan.
There is no impact on global oil demand and little impact on gas from
this sensitivity. There is a significant impact on global coal use (+/-5.8%),
and similar magnitude impacts on nuclear, hydro and renewables. The
impact on carbon emissions is +/-1.6% (+/-0.7 billion tonnes of CO2).
China electrification
© BP p.l.c. 2015
Conclusion
92 Energy Outlook 2035
Continuous change is the norm for energy markets
Changing energy mix
- gas fastest growing fossil fuel, coal the slowest
- continued rapid growth in renewables
Changing energy trade patterns
- increasingly flowing from West to East
Changing the carbon emissions path?
- no silver bullet, need action on many fronts
- let the market pick the winners
© BP p.l.c. 2015
Introduction
Global energy trends
Liquid fuels
Natural gas
Coal and non-fossil fuels
Key uncertainties
Appendix
Energy Outlook 2035 93
Page
4
7
29
49
63
77
93
© BP p.l.c. 2015
-250 -200 -150 -100 -50 0 50 100 150 200 250 300
N America industrial demand
Non-OECD industrial demand
Inputs into power generation
Transport consumption
Asia Pacific fossil fuel supply
N America fossil fuel supply
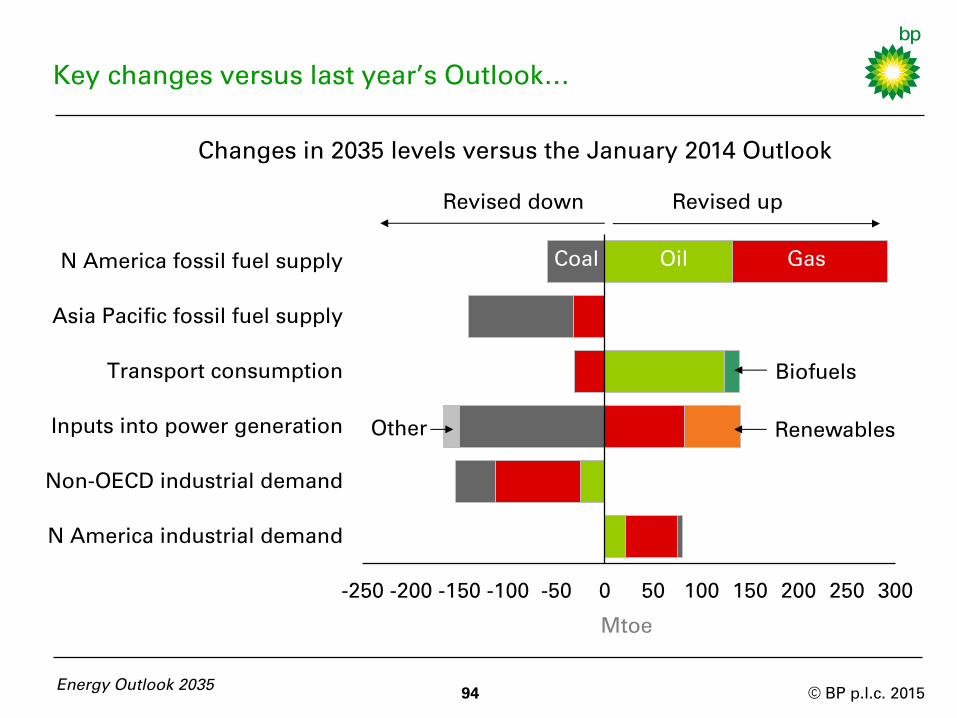
Key changes versus last year’s Outlook…
Changes in 2035 levels versus the January 2014 Outlook
Mtoe
Revised down Revised up
Oil Gas
Energy Outlook 2035 94
Coal
Renewables Other
Biofuels
© BP p.l.c. 2015
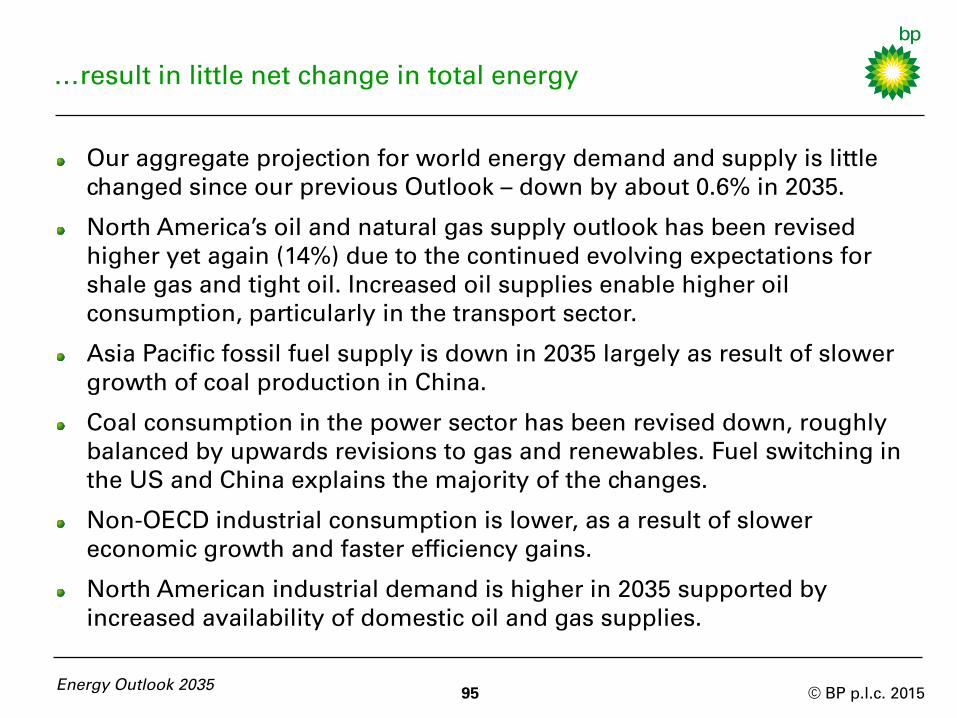
…result in little net change in total energy
Our aggregate projection for world energy demand and supply is little
changed since our previous Outlook – down by about 0.6% in 2035.
North America’s oil and natural gas supply outlook has been revised
higher yet again (14%) due to the continued evolving expectations for
shale gas and tight oil. Increased oil supplies enable higher oil
consumption, particularly in the transport sector.
Asia Pacific fossil fuel supply is down in 2035 largely as result of slower
growth of coal production in China.
Coal consumption in the power sector has been revised down, roughly
balanced by upwards revisions to gas and renewables. Fuel switching in
the US and China explains the majority of the changes.
Non-OECD industrial consumption is lower, as a result of slower
economic growth and faster efficiency gains.
North American industrial demand is higher in 2035 supported by
increased availability of domestic oil and gas supplies.
Energy Outlook 2035 95
© BP p.l.c. 2015
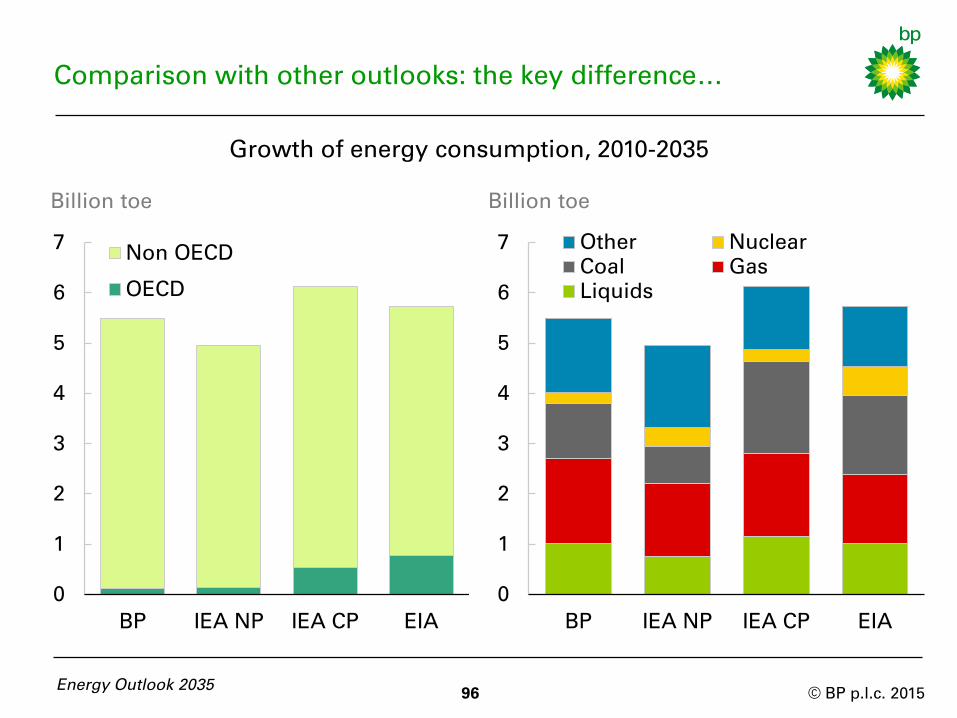
Comparison with other outlooks: the key difference…
Billion toe
0
1
2
3
4
5
6
7
BP IEA NP IEA CP EIA
Other Nuclear
Coal Gas
Liquids
Energy Outlook 2035 96
Growth of energy consumption, 2010-2035
Billion toe
0
1
2
3
4
5
6
7
BP IEA NP IEA CP EIA
Non OECD
OECD
© BP p.l.c. 2015
…lies in different views on non-OECD prospects
Our Outlook is based on a “most likely” assessment of future policy
trends. In that respect it differs from the energy projections published by
the IEA and the EIA, which are based on specific policy scenarios and
which make no judgements about the likelihood of those scenarios.
Our policy assumptions are closest to those in the IEA’s “New Policies
Scenario” (NP), which assumes that announced national policy
objectives are implemented. Yet our outcomes are closest to the IEA’s
“Current Policies Scenario” (CP) and the EIA’s reference case, both of
which assume no change in policy settings.
Our Outlook shows more growth in non-OECD energy demand than the
IEA NP; it also shows more growth for fossil fuels, especially for coal.
This probably reflects differing views on the outlook for rapidly
industrializing economies, in particular on the speed with which they can
move to a less energy-intensive growth path.
Energy Outlook 2035
97
© BP p.l.c. 2015
Data sources
BP p.l.c., BP Statistical Review of World Energy, London, United Kingdom, June 2014
Energy Information Administration, Drilling Productivity Report, Washington, D.C., United States, 2014
Energy Information Administration, International Energy Outlook, Washington, D.C., United States, 2013
Energy Information Administration, Short-Term Energy Outlook, Washington, D.C., United States, 2014
Energy Security Analysis, Inc., Wakefield, MA, United States
Eurasia Group, New York, United States
European Environment Agency, Monitoring CO2 from new passenger cars in the EU, Copenhagen, Denmark, April 2014
ICIS ATEC 4th
Update , Vergiate, Italy, 2014
IHS Automotive, International Database World Car and Truck Data 1970-2023, Englewood, CO , United States, Dec 2014
International Council for Clean Transportation, Global passenger vehicle standards, Washington D.C., United States, 2014
International Energy Agency, CO2 Emissions from Fuel Combustion, Paris, France, 2014
International Energy Agency, Energy Balances of Non-OECD Countries, Paris, France, 2014
International Energy Agency, Energy Balances of OECD Countries, Paris, France, 2014
International Energy Agency, World Energy Outlook 2014, Paris, France, 2014
Mitchell, B.R., International Historical Statistics 1750-2005, Palgrave Macmillan, New York, United States, 2007
Oxford Economics Ltd, Oxford, United Kingdom
UN Population Division, World Population Prospects: The 2012 Revision, New York, United States, 2013
US Environmental Protection Agency, Light-Duty Automotive Technology, Carbon Dioxide Emissions, and Fuel Economy
Trends: 1975 through 2012, Washington D.C., United States, March 2013
World Bank, Global Purchasing Power Parities and Real Expenditures, Washington D.C., United States, 2014
Energy Outlook 2035 98


![+9-7>79 (Effi) BP 2010 2015 2020 2025 2030 2035 2040 Energy Future SUPPLY AND DEMAND PROJECTIONS TO 2040] 201 2040¥) 92005 2010 2015 2020 2025 2030 2035 2040 EIA Energy Outlook 2ffr](https://img.pdfslide.us/doc/110x75/5fe02966a84f7a4d132d5036/9-779-effi-bp-2010-2015-2020-2025-2030-2035-2040-energy-future-supply-and.jpg)