Embed Size (px)
Citation preview

Baxter International 2000 Annual Report

Around the world, the number of people with hemophilia, kidney disease, immune deficiencies and otherlife-threatening conditions is escalating at an unprecedented rate. The aging population also is creating anincreasing need for health care. The greatest need is in developing countries, where today, many people currently go untreated. As economic expansion continues in these countries, treatment rates will increase.Baxter is poised to meet this growing demand for health care worldwide—today and into the future.
Is the world prepared for the explosive growth in life-threatening conditions?
[Our Mission] Baxter team members around the world are dedicated to a common mission: to provide critical therapies forpeople with life-threatening conditions. The company manufacturesand markets products and services used to treat patients withhemophilia, immune deficiencies, infectious diseases, cancer,kidney disease, trauma and other disorders. All of these conditionscan cause severe physical, emotional and financial burdens topatients and their families. Baxter’s role is to help alleviate theseburdens by developing innovative technologies that improvethe patient’s quality of life and medical outcome, and lower theoverall cost of patient care. The majority of Baxter’s businessesare pioneers in their fields, with nearly 80 percent of sales comingfrom products with leading market positions.
[Core Capabilities] Baxter’s businesses share several corestrengths that uniquely position the company to serve the health-care needs of people around the world. These “core capabilities”include technological expertise, manufacturing and qualityexcellence, and global presence. The company has unmatchedexpertise in plastic-container technologies, sterile-fluid technologies,and plasma-based and recombinant processing technologies.Baxter’s global manufacturing network allows the company to provide cost-effective, high-quality health-care products to patientsworldwide. Baxter also allies with leading scientific and technicalexperts outside the company to complement its internal capabilities.
[Building for the Future] The new millennium will bringmedical breakthroughs that will extend the average life spanand make significant inroads in the treatment and prevention ofdisease. Baxter is involved in a number of these activities. Forexample, Baxter researchers are developing new recombinantproteins for use in a number of clinical therapies, and new vaccinesfor the prevention of infectious diseases. The company is workingto enhance the safety of the blood supply with technologies toinactivate pathogens in collected blood components. Companyresearchers also are developing new technologies for renal therapyand medication delivery, with the intent of bringing quality healthcare to more and more people around the globe.
Baxter overview
< Baxter Chairman and Chief Executive Officer Harry M. Jansen Kraemer, Jr., in Tokyo with (left to right) Dr. Kiyoshi Kurokawa, dean of Tokai University School of Medicine; Noriyuki Kubo, medical representative, Baxter Limited inJapan; and Noriko Wakasone, deputy director, regulatory affairs, Baxter Limited.

[A Successful Year: 2000] In Baxter’s 1999 annual report, I discussedour focus on three key goals: building the Best Team in health care; beingthe Best Partner to customers and patients; and being the Best Investmentfor you, our shareholders. I am very pleased with our progress on thesethree goals. I also discussed our Shared Values of respect, responsiveness,and results as the foundation of everything we do. Our passion to achievethese goals and live our values makes it possible for us to achieve ourbusiness objectives.
As a shareholder, your interests, of course, are focused on the success of your investment. We are very proud of our investment results. The bestbarometer of our performance is Baxter’s total return (the sum of stockappreciation plus dividends) compared to other indices. In the year 2000,the combination of the increase in Baxter’s stock price and the dividendfrom the spin-off of Edwards Lifesciences gave you a return of more than49 percent. Baxter’s performance surpassed that of our peer group, the S&PHealthcare Composite Index, and was far higher than the S&P 500 andDow Jones Industrial Average, both of which yielded negative returns in2000. Our compound annual return since 1993 is 29 percent.
Also last year, I outlined for you specific financial commitments for theyear 2000. They included increasing sales approximately 10 percent, growingearnings in the mid-teens, and generating at least $500 million in opera-tional cash flow after investing more than $1 billion in capital expendituresand research and development. I am happy to report that we met all of our commitments, and I am confident that the momentum we have generatedwill continue into 2001 and beyond.
[Growth and Innovation] We have made tremendous progress in recentyears in sharpening our operational focus, improving our financial position,and positioning Baxter for the future. We are now entering a phase inwhich our focus is to significantly increase the sales and earnings growthof the company while continuing to introduce medical breakthroughs thatwill make significant inroads in the treatment and prevention of disease.
Nearly 80 percent of our sales are in markets in which we hold leadingpositions. Yet, even in these markets, there are tremendous growth oppor-tunities. As noted on the opening page of this report, many people in the
4 [shareholders’ letter]
Dear Shareholders: A year ago, I wrote to you after completing my first 12 months asBaxter’s chief executive officer, andshared with you my vision for Baxter.This year, having completed my firstyear as chairman of Baxter’s board of directors, I am even more excited,based on the results of a successfulyear 2000, and more importantly, what I believe are even better prospects for a dynamic decade of acceleratinggrowth for your company.
First, let me remind you that Baxterserves an extremely important role. Theproducts and services that we providehelp people with hemophilia, kidneydisease, cancer, immune deficienciesand other disorders. Our mission is to provide critical therapies for peoplewith life-threatening conditions. Wecontinue to enhance these therapiesand make quality health care availableto more and more people around theworld. All of us on the Baxter team arevery proud of our mission.

products and services that will contributeto the accelerated growth of the com-pany; E-business, giving us the abilityto significantly increase productivity andget closer to our customers, businesspartners and patients; and speed indecision-making, reducing bureaucracyand making us more agile in under-standing and meeting customer andpatient needs.
I believe we are strongly positionedfor a great 2001, and equally important,for a great decade ahead. Thank youfor your support. I can promise you thatthe dedicated Baxter team of 45,000members around the world will continueto focus their energy and attention onmaking Baxter even better in the futurethan it has been in the past. Given ourgreat heritage, this is no small task. Butwe are up to it. As you read the pagesthat follow, I’m sure you will agree thatthis is a special company, and the bestis yet to come.
As shareholders, this is your company.I am very interested in hearing yourviews, comments and questions. Pleasedo not hesitate to leave me an e-mailat [email protected].
Harry M. Jansen Kraemer, Jr.Chairman and Chief Executive Officer
5
world with life-threatening diseases currently go untreated or are undertreatedbecause their countries have not yet reached a stage of economic develop-ment to provide broad access to quality health care. The aging populationis creating additional needs, as people require a disproportionate amountof health care in their later years. This creates a tremendous opportunityfor Baxter.
Given our global presence, Baxter is uniquely positioned to meet thesehealth-care needs around the world. Currently, more than 50 percent of oursales are generated outside the United States. Another advantage is ourmanufacturing strength. Today, we manufacture more than 85 percent ofwhat we sell, and we are the highest-quality, best-cost manufacturer in virtually everything we produce.
Baxter also is uniquely positioned because of our focus on critical therapiesfor life-threatening conditions. We are increasing our investments in researchand development to provide the best and most cost-effective therapies forthese conditions in the years ahead.
[The Future] So, when we look to Baxter’s future, there are several thingsyou can expect. First, we will continue to develop our leadership positionsin the critical therapies we’re involved in today. For example, in hemophilia,we will continue to advance technologies used to produce clotting factor,while increasing our production capacity to meet a tremendous global need.In renal therapy, we will continue to develop new solutions and technologiesfor peritoneal dialysis while expanding our capabilities in hemodialysis andopening renal treatment centers.
You also will see us move into new areas that build off of or expand ourcore capabilities. One recent example of this is our growing vaccines busi-ness, where we continue to expand our expertise in recombinant technology.Another is anesthesia, the fastest-growing area of our Medication Deliverybusiness, which builds on relationships we have with hospital pharmacistsand others involved in drug delivery. We expect sales in each of these areasto exceed $1 billion by the end of the decade.
We also will continue to increase shareholder value by focusing on talentmanagement, allowing us to attract, retain and develop the best talent in all functional areas; innovation, enabling us to develop new and better

In 2001, Baxter expects its operational performance to once againbe very strong. Given the expansion of capacity in Thousand Oaks,California, where the company produces recombinant Factor VIIIfor people with hemophilia; new product introductions, which arecovered in the following pages of this report; and the successfulintegration of recent acquisitions, Baxter expects its 2001 sales togrow at an accelerated rate, in the low double digits. Excluding theimpact of foreign exchange, the company’s sales growth rate willbe even higher. Specifically:
– Sales growth in the company’s BioScience business will be in the high teens, driven by the recombinant business growingmore than 20 percent and the continuing trend toward leuko-reduction.
– Continuing efforts to grow peritoneal dialysis and expand thehemodialysis business, along with continued growth in theRenal Therapy Services (RTS) and RMS Disease Managementbusinesses, will drive sales growth in the Renal business tothe low to mid-teens in 2001.
– Sales growth in the Medication Delivery business will be in thehigh single digits, driven by continued growth of the anesthesiabusiness, which will reach $500 million in sales in 2001.
As a result of Baxter’s accelerated sales growth and continuedfocus on increasing its operating profit margin, the companyexpects its earnings growth rate for 2001 to be in the mid-teens.
The company also expects to once again generate more than $500million in operational cash flow, after investing more than $1 billionin research and development and capital expenditures.
2001 commitments

2000 highlights
stock price[as of December 31]
net sales 1
[in billions of dollars]
net income1, 2
[in millions of dollars]
operational cash flow 1, 3
[in millions of dollars]
1. Excludes Edwards Lifesciences Corporation.
2. Net income excludes the cumulative effect of an accounting change, special chargesfor spin-off costs, in-process research and development and acquisition-related costs,net litigation, and exit and other reorganization costs, as applicable in each year.
3. See definition on page 24.
1998 1999 2000
$61.49 $60.06
$88.31
compound annual return[through December 31, 2000]
1 year
49%
7 year
29%
3 year
24%
5 year
22%
1998 1999 2000
$5.7$6.4
$6.9
$688$779
$915
$379
$588 $588
1998 1999 2000
1998 1999 2000
Hemophilia is a genetic disorder that affects approximately onein every 10,000 males born around the world. It is characterizedby the absence of one or more proteins, specifically thoseresponsible for clotting, in blood plasma. People with hemophiliarisk spontaneous internal bleeding episodes, which may resultin joint damage or even death if not treated. The most commonform of hemophilia is hemophilia A, characterized by the absenceof the clotting factor known as Factor VIII protein. Baxter is aleading provider of Factor VIII derived from both human plasmaand recombinant methods.
While hemophilia A affects as many as 300,000 people worldwide,approximately three-quarters of this population receive little orno treatment. The situation is most acute in developing countries,but even in the industrialized nations of France, Germany andthe United States, many patients continue to receive sub-optimallevels of treatment.
Demand for Factor VIII continues to grow for a number of reasons.These include improving access to quality care in developingnations; the aging of adolescent patients who, as they grow,require larger quantities of Factor VIII; and the increasing use ofFactor VIII to prevent bleeding episodes versus only infusing itwhen bleeding episodes occur.
Baxter is well positioned to address the growing demand forFactor VIII and to enhance its leadership position in this market-place. One reason is the company’s history of innovation inhemophilia therapy. Baxter was the first company to introduceboth a monoclonal-purified plasma and recombinant Factor VIII,and expects to be first with a next-generation recombinant FactorVIII using a totally protein-free manufacturing process. Secondly,the company’s broad portfolio of products and services forhemophilia provides patients with the widest range of therapyand technology choices. A third reason is Baxter’s strong presencein developing markets, where the need for hemophilia therapyis greatest. And finally, the company’s extensive capabilities inboth plasma fractionation and recombinant processing makeBaxter a reliable source for meeting the therapeutic needs of the world’s hemophilia population in a market where demandcontinues to outstrip supply.
bioscience
Historically, therapeutic proteins like Factor VIII were manufactured byplasma fractionation. Recombinant Factor VIII, produced in cell culture,does not depend on the availability or use of human plasma in the produc-tion process. Therefore, the amount of recombinant Factor VIII that can be produced is not limited by the availability of source plasma—which is very important given the tremendous need for Factor VIII by the world’shemophilia community.
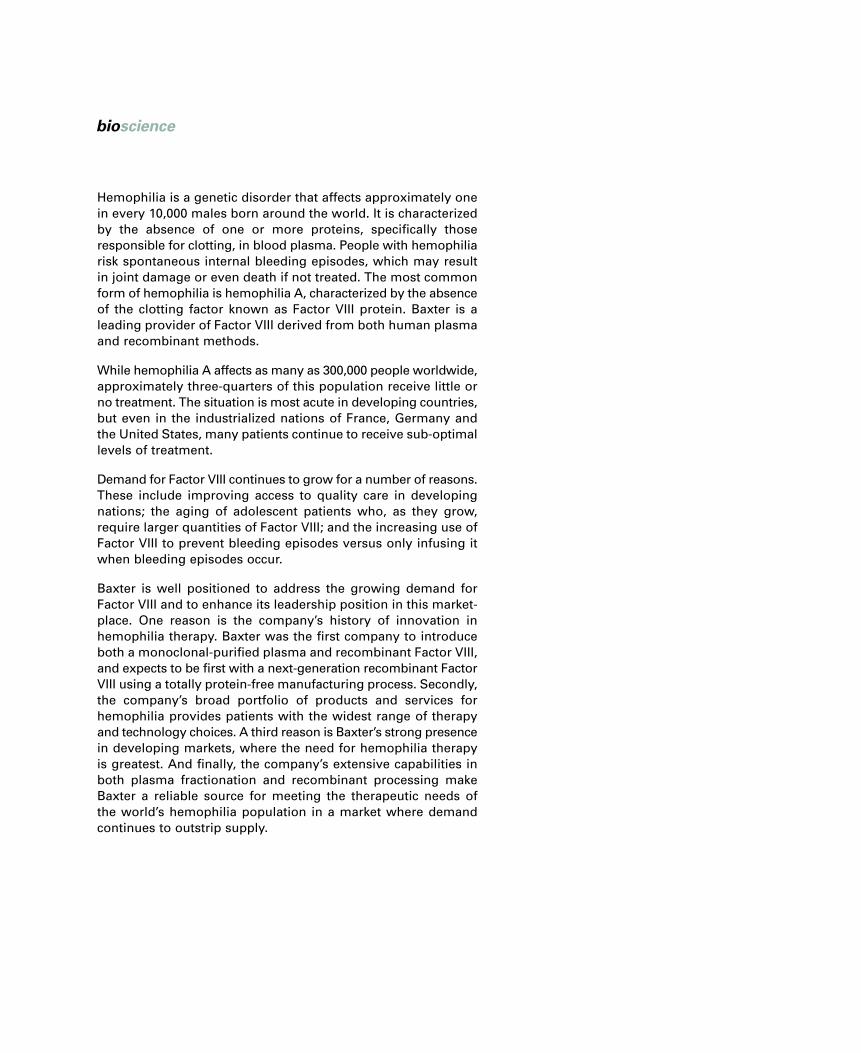
Baxter is committed to increasing the supply of recombinant Factor VIIIin the marketplace. In 2000, the company tripled its production capacity for its own recombinant Factor VIII, Recombinate Antihemophilic Factor(rAHF). This will lead to significant growth in sales of Recombinate FactorVIII, which already is the leading genetically engineered Factor VIII on the market. In Neuchâtel, Switzerland, Baxter is building a multi-purposefacility that will produce Baxter’s next-generation recombinant Factor VIIIusing a totally protein-free manufacturing process, as well as additionalrecombinant proteins.
With recombinant products representing a greater portion of Baxter’sBioScience business in the years ahead, the company will continue to investin recombinant production capacity and technology. These investmentswill lead to future sales growth of products and services for the treatmentof hemophilia, as well as from the introduction of new biopharmaceuticalsand vaccines.
8 [bioscience]
Plasma is a straw-colored liquid derivedfrom blood that contains a number ofcomponents that play important rolesin the body. These components includevarious proteins that regulate theblood’s ability to clot, and others, suchas albumin, a blood-volume expander,and gammaglobulins, which bolsterweakened immune systems. For years,Baxter has been a leader in the process-ing of therapeutic proteins from humanplasma. Increasingly, the company hasexpanded its expertise in recombinanttechnology to produce a widening rangeof therapeutic proteins.
Baxter plans to grow its BioSciencebusiness aggressively in the yearsahead. The company’s current thera-peutic proteins, leaders in their markets,have considerable growth potential.The company also has a robust futurepipeline that will include recombinantreplacements for current plasma-derivedtherapies, new biopharmaceuticals andeventually gene therapies.
bioscience
Baxter’s Recombinate Antihemophilic Factor (rAHF), produced in Thousand Oaks,California, is the leading genetically engineered Factor VIII on the market.
Recombinate AntihemophilicFactor (rAHF)
Baxter’s acquisition of North AmericanVaccine Inc. in 2000 enhanced Baxter’spresence in the $7-billion global vaccinesmarket—a market that is expected togrow 13 percent annually over the nextfive years, resulting in a $13-billion market by 2005. More than 80 percentof future vaccines will be produced usingrecombinant technology.
Baxter will continue to build itsexpertise in recombinant technologythrough both internal development and alliances with outside partners.Other examples of recombinant proteinscurrently under development includealpha-1-antitrypsin for treatment ofhereditary emphysema and other res-piratory diseases; C1 Esterase Inhibitorfor treatment of hereditary angioedema;a bactericidal permeability increasing(BPI) protein to treat a range of diseasescaused by bacteria; and recombinanthemoglobin, to deliver oxygen to vital organs.
9
[Business Description] Baxter is a leading producer of biophar-maceuticals for the treatment of hemophilia, immune deficiencies and other life-threatening disorders. These products include coagulation factors, immune globulins, biosurgery products and
vaccines. The company also is a leading manufacturer of manual and automatedblood-collection, processing and storage systems. These products are used byhospitals, blood banks and plasma-collection centers to collect and process bloodcomponents for therapeutic use. Therapeutic blood components are used to treatpatients undergoing surgery, cancer therapy and other critical therapies.
[Growth Strategy] Baxter will continue to grow its global leadershipin biopharmaceuticals for the treatment of hemophilia and immune deficiencies by broadening its portfolio, advancing technology and increasing production capacity. Growth opportunities are presented
by the tremendous need for and increasing use of these products around the world, and the continued growth of both plasma-derived and recombinant-derived therapies. Baxter will continue to expand its pipeline of innovative biopharmaceuticals and vaccines through both internal development and acquisitions and alliances. Baxter also continues to focus on increased productionand safety of transfusion products through advanced automation, leukoreductionand pathogen inactivation.
[Product Development] In 2000, Baxter received approval in the United Kingdom for NeisVac-C, a new meningococcemia vaccine.The company also received approval from the U.S. Food and DrugAdministration (FDA) for a new application device for its Tisseel
fibrin sealant. In the next 12 months, Baxter expects FDA approval for a liquidform of IGIV, and European approval for a new therapeutic protein for protein C deficiency and pathogen-inactivation technology for platelets. Other productsin development include a next-generation recombinant Factor VIII using a totallyprotein-free manufacturing process; a cell culture-derived vaccine for influenza;a new tetanus, diphtheria and acellular pertussis vaccine; a European vaccine forLyme disease; pathogen-inactivation technology for plasma and red cells; and a recombinant form of hemoglobin that may be used instead of blood to carryoxygen to vital organs.
[Acquisitions and Alliances] In 2000, Baxter completed its acquisition of North American Vaccine Inc., based in Columbia,Maryland, broadening its position in the global vaccines market. The company also established an equity position in British vaccine
developer Acambis (formerly known as Peptide Therapeutics Group), which willbetter position each company to develop and commercialize their respectivevaccine pipelines. In addition, Baxter formed alliances with XOMA Ltd. for therights to a recombinant protein for treatment of a range of diseases caused bybacteria; Arriva Pharmaceuticals (formerly known as AlphaOne Pharmaceuticals,Inc.) to co-develop a recombinant alpha-1-antitrypsin protein to treat hereditaryemphysema and other respiratory diseases; and Pharming Group N.V. to collaborateon the development of a recombinant, transgenic C1 inhibitor to treat hereditaryangioedema.

Fifty years ago, people with end-stage renal disease (ESRD), orkidney failure, faced certain death. There was no treatment thatcould replicate the function of the kidneys— to remove toxins,waste and excess water from the bloodstream—and transplantswere not yet a viable option. In 1956, Baxter introduced the firstcommercial hemodialysis (HD) machine, making life-saving dialysistherapy possible for thousands of people worldwide.
Today, there are approximately one million dialysis patients world-wide. Approximately 86 percent of them use HD as their primarytherapy. The other 14 percent use peritoneal dialysis (PD), a newer,home-based therapy pioneered by Baxter in the late 1970s. Today,Baxter is a world leader in providing products and services topeople with ESRD, serving patients in more than 100 countries.
In developing countries, many people with ESRD currently gountreated. For example, dialysis-treatment rates in Latin America,parts of Asia, Eastern Europe and other developing regions lagfar behind those of more developed countries. In Latin America,dialysis-treatment rates average approximately 250 patients permillion. By contrast, the United States has nearly 1,000 dialysispatients per million, and Japan, which has a very high incidenceof kidney disease, has more than 1,600 per million.
Fortunately, dialysis-treatment rates are expected to grow significantly in developing countries in the years ahead as economic growth occurs. In Latin America, for example, dialysis-treatment rates are expected to double over the next several yearsdue to the aging population, increasing health-care coverageand greater diagnosis of kidney disease. Baxter already has apresence in many developing regions and is poised to bring life-saving dialysis therapy to the millions who need it.
There is no cure for ESRD. Without either dialysis or a kidneytransplant, a person with ESRD will die. Baxter is committed toproviding a full range of products and services for patients withkidney disease in the years to come.
kidneytherapy
A tremendous opportunity also exists for Baxter in HD. Recently, thecompany has made significant investments to increase its presence in theHD market while continuing its commitment to growing PD. A major stepwas the recent acquisition of Althin Medical AB, a Swedish manufacturerof dialyzers and instrumentation for HD. Baxter also plans to introduce afirst-generation instrument for home hemodialysis in 2001. By strengtheningits portfolio in both PD and HD, Baxter provides products and services alongthe entire continuum of care for patients, many of whom may benefit fromboth therapies during the course of their treatment.
Baxter has several initiatives to ensure that patients are aware of thera-peutic advances and treatment options. For example, last year Baxterlaunched an educational Web site (kidneydirections.com) worldwide, whichhas been visited by tens of thousands of people. This program providesrelevant information to patients as they progress through the phases ofkidney disease. Another example is the company’s Kidney Patient Educatorprogram. Baxter employs nurses as kidney patient educators in the UnitedStates to whom nephrologists refer their patients in the early phase ofend-stage kidney disease. The kidney patient educators provide informationon a patient’s treatment options, enabling them to make informed choicesabout which treatment modality they might prefer.
12 [kidney therapy]
Baxter introduced peritoneal dialysis(PD) in the late 1970s and continues to focus on increasing the number ofpatients using PD as a complementary option to the more traditional treatmentof hemodialysis (HD). As a home therapy, PD presents lifestyle advantages,allowing patients to work or be athome while administering their therapy.It also does not require a capital-intensiveinfrastructure (clinics and personnel),making it ideal for use in developingcountries, where many people with kidney disease currently go untreated.
PD growth continues to be a signifi-cant priority for Baxter. One challengeis to continue to educate patients, themedical community and reimbursementauthorities about the cost, lifestyle,clinical outcomes and other advantagesof the therapy. For example, not only is the average annual total cost of PDto the health-care system less than HD,current research reveals clinical advan-tages, as well. Recent studies showlower mortality rates among PD patientscompared to patients on HD during thefirst two years of therapy, with equivalentoutcomes after two years.
kidneytherapy
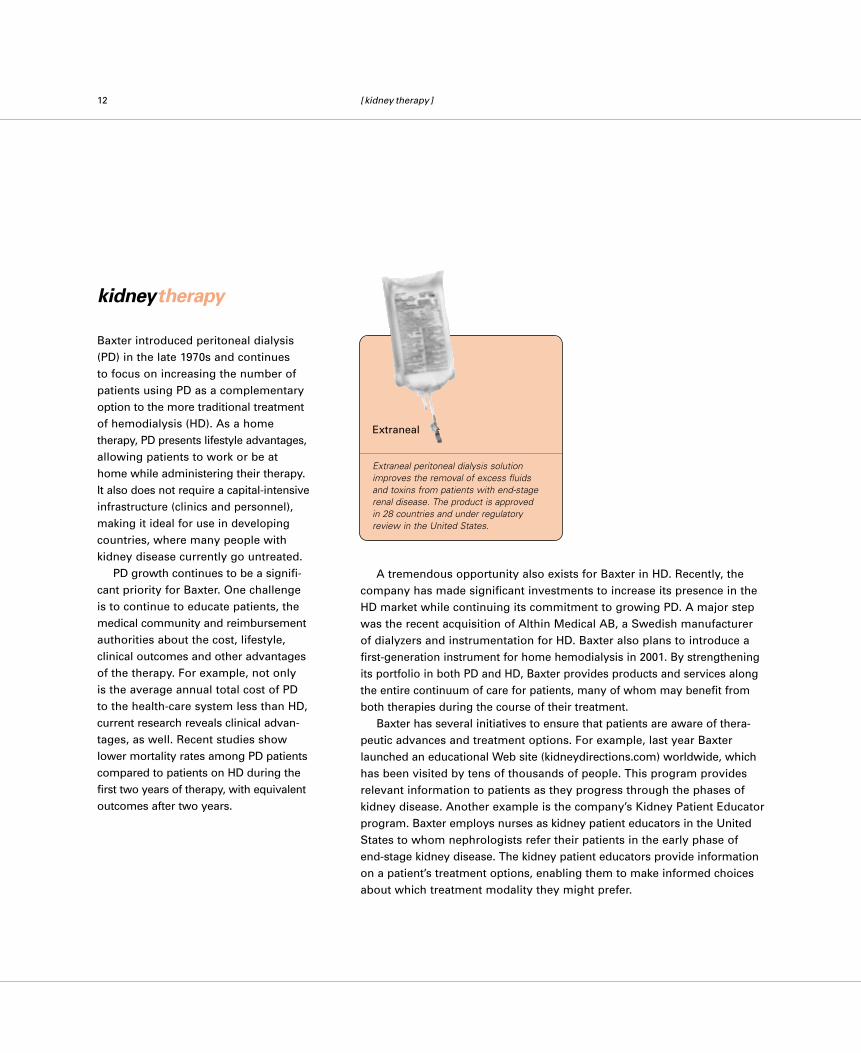
Extraneal peritoneal dialysis solutionimproves the removal of excess fluidsand toxins from patients with end-stagerenal disease. The product is approved in 28 countries and under regulatoryreview in the United States.
Extraneal

According to a recent study, wheninformed of their choices, nearly half of the patients say they would preferPD over HD. Over the past three years,Baxter’s kidney patient educators havemet with more than 20,000 U.S. patients,of which approximately 6,000 have initiated dialysis, with about one-thirdof them starting on PD therapy. Thecurrent national average for patientsinitiating PD across the United States is approximately 10 percent.
Baxter is fully committed to helpingpeople with kidney disease live betterlives through innovative products andservices, and through timely and com-prehensive education programs. Bymeeting the needs of the kidney patient,Baxter is continually improving thequality and availability of renal care forpeople around the world.
13
[Business Description] Baxter provides a range of products andservices for the treatment of kidney disease. These include productsfor both peritoneal dialysis (PD) and hemodialysis (HD) as well asresearch initiatives in xenotransplantation. Baxter is the world’s leading
manufacturer of PD products, which include dialysis solutions, container systemsand automated cyclers. For HD, Baxter manufactures dialyzers and HD machines.The company’s Renal Therapy Services (RTS) business operates dialysis clinicsin partnership with local physicians in 13 countries outside the United States,while RMS Disease Management Inc. partners with U.S. nephrologists to providea kidney disease management program to health-care payers. Baxter’s RMSLifeline Inc. helps to improve the delivery and outcomes of interventional renalcare in the United States through dedicated outpatient centers.
[Growth Strategy] The company’s strategy is to continue to drivePD growth while also investing in significant expansion of HD productsand services. New products will come from internal development,acquisitions, alliances and e-health initiatives. The company also
continues to grow its RTS business and expand its product lines globally, particularly in developing markets where many people with end-stage renal disease are currently under-treated. In addition, Baxter intends to continue developing technology-based products and services that improve therapeuticoutcomes.
[Product Development] Baxter continues to develop new PD solutions to better manage specific patient needs. One example isExtraneal, which improves the removal of excess fluids and toxinsfrom patients with end-stage renal disease. Introduced in Europe in
1997 and approved in 28 countries, Extraneal today is being used by more than6,000 European patients—more than a third of Baxter’s European PD population—and is currently under regulatory review in the United States. Another solution,Physioneal, was introduced in Europe and began clinical trials in Japan in 2000.Also in 2000, as a result of Baxter’s acquisition of Althin Medical, the companybegan selling an HD machine globally called the Tina. Baxter also introduced anew HD machine called Meridian in the United States. Future products includeseveral new HD dialyzers and the Aurora home HD machine. The company alsois continuing research in the area of xenotransplantation.
[Acquisitions and Alliances] In March 2000, Baxter completed its acquisition of Althin Medical AB, a leading manufacturer of HD products,based in Ronneby, Sweden. The acquisition greatly expands Baxter’sproduct offering for HD and strengthens its position in the global HD
marketplace. The company’s joint venture with Gambro AB of Sweden for themanufacture of dialyzers for both Baxter and Gambro at Baxter’s renal-productsplant in Mountain Home, Arkansas, continues to perform well, with more than 3 million dialyzers manufactured in 2000.
Before 1931, hospitals considered intravenous (IV) therapy a lastresort due to inadequate quality control in the preparation of IVsolutions. In 1931, Baxter revolutionized health care by inventingan innovative process to manufacture large, carefully controlledbatches of IV solutions premixed in glass, and later, flexible containers. Since then, the company has expanded its capabilitiesto include a broad range of technologies to help physicians,pharmacists, nurses and anesthesiologists effectively and efficientlytreat countless patients worldwide. These and other medication-delivery products replenish fluids, provide nutrition, prevent pain,and deliver antibiotics and other drugs to patients through a widerange of containers, access systems and electronic infusion pumps.
More than 15,000 employees in approximately 30 Baxter manufacturing plants around the world— from Toongabbie,Australia, to Alliston, Canada—produce more than a billion finished goods for this business a year. They fill nearly two and ahalf million units of IV solutions a day. Baxter also manufacturesthe majority of its access systems and electronic infusion pumpsthrough its worldwide network of manufacturing plants. These plantshave consistently reduced manufacturing costs while improvingproduct quality through high-speed automation, more efficientsupply-chain practices and other measures.
With a growing array of new products, continuous inroads in globalexpansion and ongoing manufacturing excellence, Baxter’sMedication Delivery business has a bright future. Consistentwith its rich past, it is ready to continue making medical history.
medicationdelivery
In just over two years, Baxter’s anesthesia business has grown from $80 million in sales to more than $450 million today, and is expected to bea $1-billion business for Baxter by 2005. This growth is built on the acquisi-tion in 1998 of Ohmeda Pharmaceutical Products, a U.S.-based manufacturerof inhalation agents and acute-care injectible drugs, whose product linewas a perfect complement to Baxter’s existing line of anesthesia-deliverydevices; geographic expansion; and the broadening of the product offeringand call points within the critical-care setting.
Greatly contributing to the financial success of the anesthesia business in 2000 was Baxter’s launch in 1999 of the first generic propofol, suppliedthrough an alliance with Sicor Inc. (formerly GensiaSicor Pharmaceuticals).This injectible, generic form of the drug, which previously had been underpatent, offered customers, for the first time, a comparable product at a lowerprice. Sales of propofol exceeded $100 million in 2000.
In the area of anesthesia devices, the company acquired the U.S. rightsto the PSA 4000 Patient State Analyzer, manufactured by Physiometrix Inc.of North Billerica, Massachusetts. The device monitors a patient’s responseto anesthesia, providing the anesthesiologist with a real-time picture ofbrain-wave activity to optimize the delivery of anesthetic agents. Baxter alsolaunched a new anesthesia pump, called the Ipump Pain ManagementSystem, which delivers pain medication epidurally.
16 [medication delivery]
Baxter is known worldwide as a leadingmanufacturer of intravenous (IV) solu-tions. But standard IVs—used primarilyfor fluid replenishment, electrolyte therapy and vein access—make up only about a quarter of Baxter’s sales in the area of medication delivery.Higher-margin “specialty products,”such as anesthetic agents, premixeddrugs and reconstitution devices, nutri-tion products, and delivery devices,such as the Colleague pump and others,make up the rest and represent thegreatest areas of growth for Baxter.
Anesthesia, the fastest-growing areaof Baxter’s Medication Delivery business,has played a major role in making surgical intervention a viable therapeuticoption in health care. Certainly, no surgical procedure could take place ifnot for a way to keep the patient fromfeeling pain.
medicationdelivery
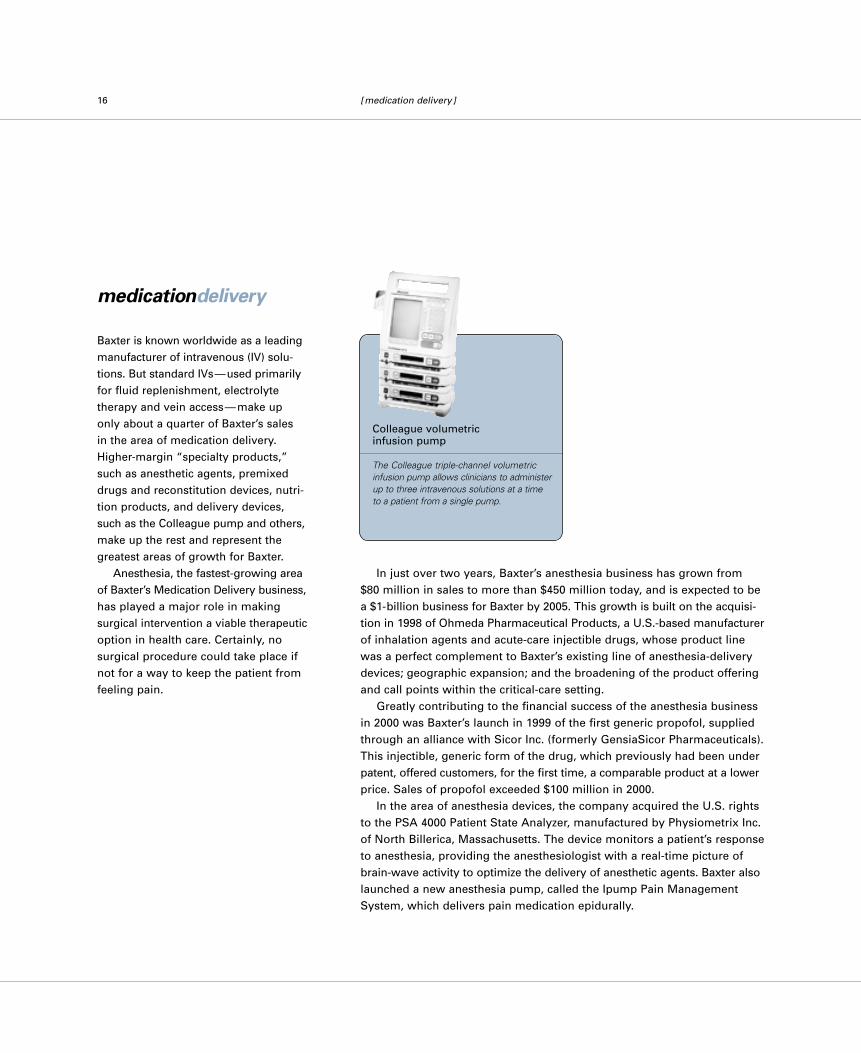
The Colleague triple-channel volumetric infusion pump allows clinicians to administerup to three intravenous solutions at a time to a patient from a single pump.
Colleague volumetric infusion pump
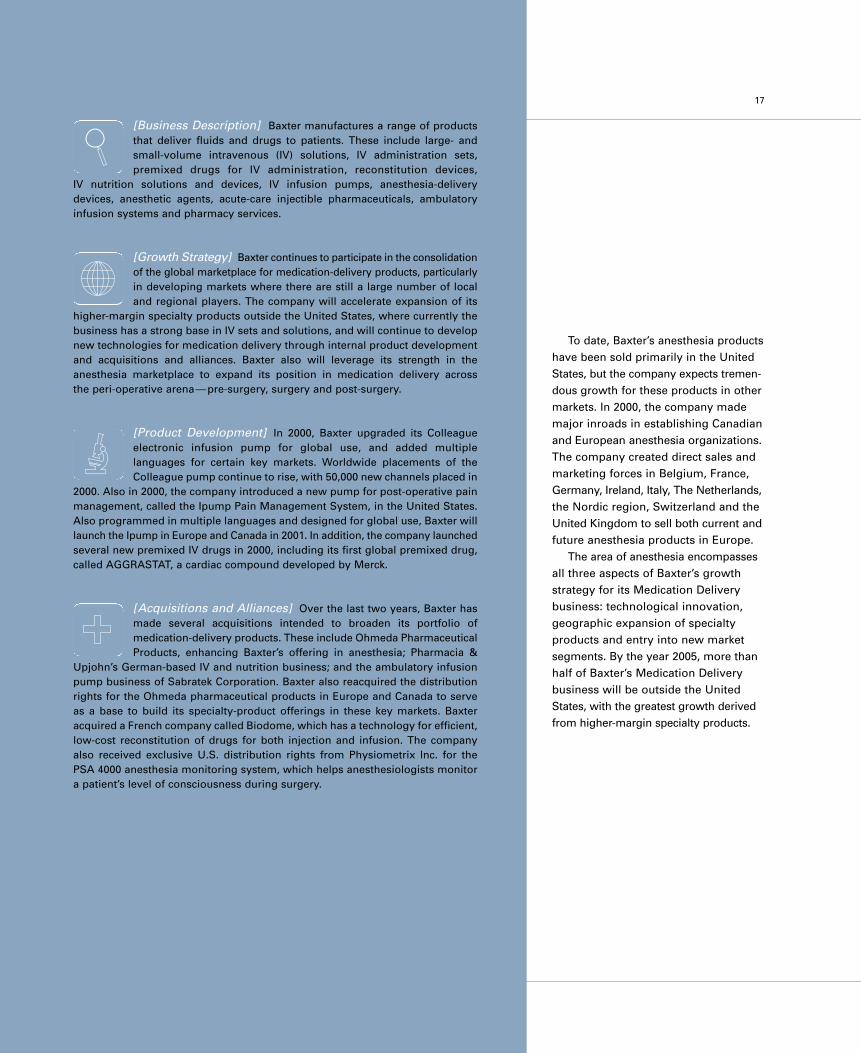
To date, Baxter’s anesthesia productshave been sold primarily in the UnitedStates, but the company expects tremen-dous growth for these products in othermarkets. In 2000, the company mademajor inroads in establishing Canadianand European anesthesia organizations.The company created direct sales andmarketing forces in Belgium, France,Germany, Ireland, Italy, The Netherlands,the Nordic region, Switzerland and theUnited Kingdom to sell both current andfuture anesthesia products in Europe.
The area of anesthesia encompassesall three aspects of Baxter’s growthstrategy for its Medication Deliverybusiness: technological innovation,geographic expansion of specialtyproducts and entry into new marketsegments. By the year 2005, more thanhalf of Baxter’s Medication Deliverybusiness will be outside the UnitedStates, with the greatest growth derivedfrom higher-margin specialty products.
17
[Business Description] Baxter manufactures a range of productsthat deliver fluids and drugs to patients. These include large- andsmall-volume intravenous (IV) solutions, IV administration sets, premixed drugs for IV administration, reconstitution devices,
IV nutrition solutions and devices, IV infusion pumps, anesthesia-deliverydevices, anesthetic agents, acute-care injectible pharmaceuticals, ambulatoryinfusion systems and pharmacy services.
[Growth Strategy] Baxter continues to participate in the consolidationof the global marketplace for medication-delivery products, particularlyin developing markets where there are still a large number of local and regional players. The company will accelerate expansion of its
higher-margin specialty products outside the United States, where currently thebusiness has a strong base in IV sets and solutions, and will continue to developnew technologies for medication delivery through internal product developmentand acquisitions and alliances. Baxter also will leverage its strength in the anesthesia marketplace to expand its position in medication delivery across the peri-operative arena—pre-surgery, surgery and post-surgery.
[Product Development] In 2000, Baxter upgraded its Colleague electronic infusion pump for global use, and added multiple languages for certain key markets. Worldwide placements of the Colleague pump continue to rise, with 50,000 new channels placed in
2000. Also in 2000, the company introduced a new pump for post-operative painmanagement, called the Ipump Pain Management System, in the United States.Also programmed in multiple languages and designed for global use, Baxter willlaunch the Ipump in Europe and Canada in 2001. In addition, the company launchedseveral new premixed IV drugs in 2000, including its first global premixed drug,called AGGRASTAT, a cardiac compound developed by Merck.
[Acquisitions and Alliances] Over the last two years, Baxter hasmade several acquisitions intended to broaden its portfolio of medication-delivery products. These include Ohmeda PharmaceuticalProducts, enhancing Baxter’s offering in anesthesia; Pharmacia &
Upjohn’s German-based IV and nutrition business; and the ambulatory infusionpump business of Sabratek Corporation. Baxter also reacquired the distributionrights for the Ohmeda pharmaceutical products in Europe and Canada to serveas a base to build its specialty-product offerings in these key markets. Baxteracquired a French company called Biodome, which has a technology for efficient,low-cost reconstitution of drugs for both injection and infusion. The companyalso received exclusive U.S. distribution rights from Physiometrix Inc. for thePSA 4000 anesthesia monitoring system, which helps anesthesiologists monitora patient’s level of consciousness during surgery.

financial information
19 Management’s Discussion and Analysis
28 Management’s Responsibilities for Financial Reporting
28 Report of Independent Accountants
29 Consolidated Balance Sheets
30 Consolidated Statements of Income
31 Consolidated Statements of Cash Flows
32 Consolidated Statements of Stockholders’ Equity and Comprehensive Income
33 Notes to Consolidated Financial Statements
49 Directors and Executive Officers
50 Company Information

19
Management’s Discussion and Analysis
This discussion and analysis presents the factors that had a material effect on Baxter International Inc.’s (Baxter or the company)
results of operations and cash flows during the three years ended December 31, 2000, and the company’s financial position at that
date. This discussion and analysis should be read in conjunction with the consolidated financial statements of the company and
related notes.
The matters discussed in this Annual Report include forward-looking statements that involve risks and uncertainties, including,
but not limited to, currency exchange rates, interest rates, technological advances in the medical field, economic conditions, demand
and market acceptance risks for new and existing products, technologies and health-care services, the impact of competitive products
and pricing, manufacturing capacity, new plant start-ups, global regulatory, trade and tax policies, continued price competition, product
development risks, including technological difficulties, ability to enforce patents, unforeseen commercialization and regulatory factors,
and other risks more completely reflected in the company’s filings with the Securities and Exchange Commission. In particular, the
company, as well as other companies in its industry, has experienced increased regulatory activity by the U.S. Food and Drug
Administration with respect to its plasma-based biologicals. It is not possible to predict the extent to which the company or the
health-care industry might be adversely affected by these factors in the future.
Management’s financial objectives for 2000, which were outlined in last year’s Annual Report and are summarized below, were
established based on Baxter’s results excluding the cardiovascular business, the stock of which was distributed to
shareholders on March 31, 2000. Refer to Note 2 to the consolidated financial statements for further information regarding the
spin-off of the cardiovascular business. The company’s consolidated financial statements and related notes have been restated
to reflect the financial position, results of operations and cash flows of the cardiovascular business as a discontinued operation.
The results presented below reflect the results of continuing operations only.
Key Financial Objectives and Results
2000 OBJECTIVES RESULTS
Increase net sales approximately 10 percent. Net sales increased eight percent in 2000. Excluding fluctuations
in currency exchange rates, net sales increased 12 percent.
Grow net earnings in the mid-teens. Net earnings from continuing operations increased 17 percent
in 2000, excluding the cumulative effect of a change in accounting
principle in 1999 and the charge for in-process research and
development (IPR&D) and acquisition-related costs in 2000.
Generate a minimum of $500 million in operational The company generated operational cash flow of $588 million
cash flow after investing more than $1 billion in during 2000. The total of capital expenditures and research and
capital improvements and research and development. development expenses was more than $1 billion.
Company and Industry Overview
Baxter is a global leader in providing critical therapies for life-threatening conditions and operates in three segments, which are
described in Note 13. The company manufactures and markets products and services used to treat patients with hemophilia,
immune deficiencies, infectious diseases, cancer, kidney disease, trauma and other disorders. The company generates more than 50
percent of its revenues outside the United States. While health-care cost containment continues to be a focus around the world,
demand for health-care products and services continues to be strong worldwide, particularly in developing markets. The company’s
strategies emphasize global expansion and technological innovation to advance medical care worldwide.
The company’s primary markets are highly competitive and subject to substantial regulation. There has been consolidation in the
company’s customer base and by its competitors, which has resulted in pricing and market share pressures. The company has
experienced increases in its labor and material costs, which are partly influenced by general inflationary trends. Competitive market
conditions have minimized inflation’s impact on the selling prices of the company’s products and services. Management expects
these trends to continue. The company will continue to manage these issues by capitalizing on its market-leading positions,
developing innovative products and services, investing in human resources, upgrading and expanding facilities, leveraging its cost
structure, making acquisitions, and entering into alliances and joint venture arrangements.
20
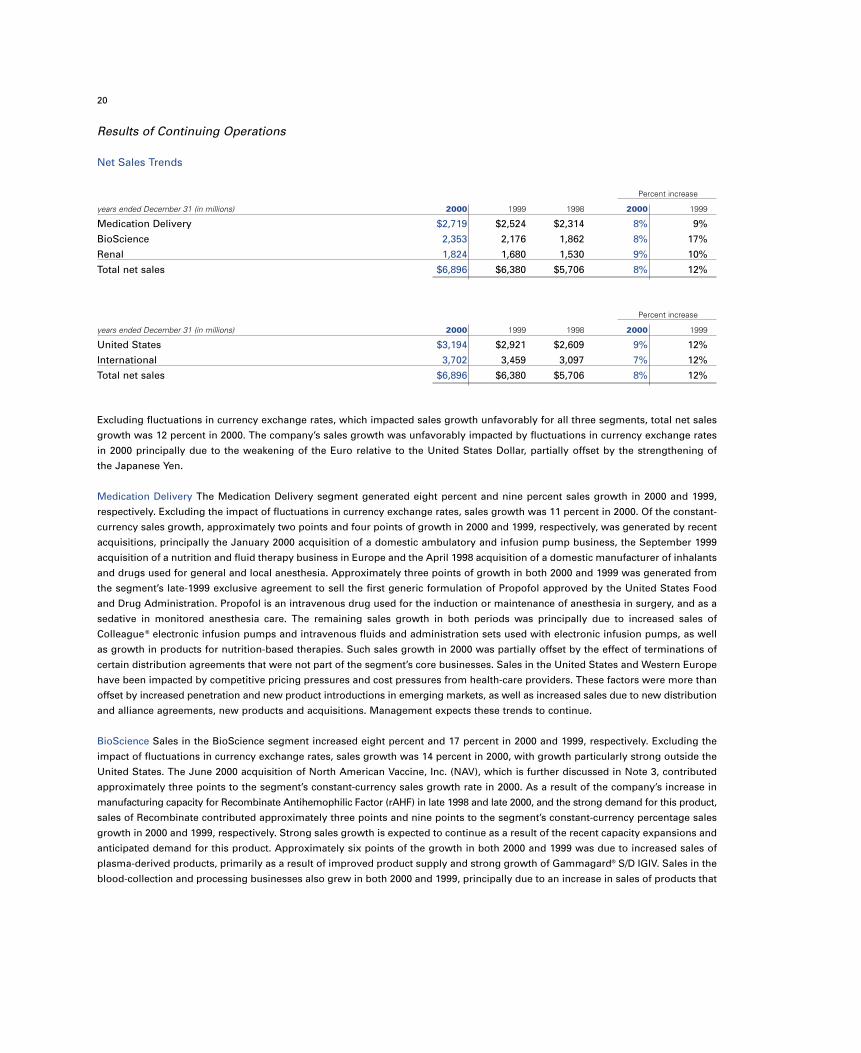
Results of Continuing Operations
Net Sales Trends
Percent increase
years ended December 31 (in millions) 2000 1999 1998 2000 1999
Medication Delivery $2,719 $2,524 $2,314 8% 9%
BioScience 2,353 2,176 1,862 8% 17%
Renal 1,824 1,680 1,530 9% 10%
Total net sales $6,896 $6,380 $5,706 8% 12%
Percent increase
years ended December 31 (in millions) 2000 1999 1998 2000 1999
United States $3,194 $2,921 $2,609 9% 12%
International 3,702 3,459 3,097 7% 12%
Total net sales $6,896 $6,380 $5,706 8% 12%
Excluding fluctuations in currency exchange rates, which impacted sales growth unfavorably for all three segments, total net sales
growth was 12 percent in 2000. The company’s sales growth was unfavorably impacted by fluctuations in currency exchange rates
in 2000 principally due to the weakening of the Euro relative to the United States Dollar, partially offset by the strengthening of
the Japanese Yen.
Medication Delivery The Medication Delivery segment generated eight percent and nine percent sales growth in 2000 and 1999,
respectively. Excluding the impact of fluctuations in currency exchange rates, sales growth was 11 percent in 2000. Of the constant-
currency sales growth, approximately two points and four points of growth in 2000 and 1999, respectively, was generated by recent
acquisitions, principally the January 2000 acquisition of a domestic ambulatory and infusion pump business, the September 1999
acquisition of a nutrition and fluid therapy business in Europe and the April 1998 acquisition of a domestic manufacturer of inhalants
and drugs used for general and local anesthesia. Approximately three points of growth in both 2000 and 1999 was generated from
the segment’s late-1999 exclusive agreement to sell the first generic formulation of Propofol approved by the United States Food
and Drug Administration. Propofol is an intravenous drug used for the induction or maintenance of anesthesia in surgery, and as a
sedative in monitored anesthesia care. The remaining sales growth in both periods was principally due to increased sales of
Colleague ® electronic infusion pumps and intravenous fluids and administration sets used with electronic infusion pumps, as well
as growth in products for nutrition-based therapies. Such sales growth in 2000 was partially offset by the effect of terminations of
certain distribution agreements that were not part of the segment’s core businesses. Sales in the United States and Western Europe
have been impacted by competitive pricing pressures and cost pressures from health-care providers. These factors were more than
offset by increased penetration and new product introductions in emerging markets, as well as increased sales due to new distribution
and alliance agreements, new products and acquisitions. Management expects these trends to continue.
BioScience Sales in the BioScience segment increased eight percent and 17 percent in 2000 and 1999, respectively. Excluding the
impact of fluctuations in currency exchange rates, sales growth was 14 percent in 2000, with growth particularly strong outside the
United States. The June 2000 acquisition of North American Vaccine, Inc. (NAV), which is further discussed in Note 3, contributed
approximately three points to the segment’s constant-currency sales growth rate in 2000. As a result of the company’s increase in
manufacturing capacity for Recombinate Antihemophilic Factor (rAHF) in late 1998 and late 2000, and the strong demand for this product,
sales of Recombinate contributed approximately three points and nine points to the segment’s constant-currency percentage sales
growth in 2000 and 1999, respectively. Strong sales growth is expected to continue as a result of the recent capacity expansions and
anticipated demand for this product. Approximately six points of the growth in both 2000 and 1999 was due to increased sales of
plasma-derived products, primarily as a result of improved product supply and strong growth of Gammagard® S/D IGIV. Sales in the
blood-collection and processing businesses also grew in both 2000 and 1999, principally due to an increase in sales of products that

21
provide for leukoreduction, which is the removal of white blood cells from blood products used for transfusion. Sales growth in
these businesses has been negatively affected by regulatory and production issues facing certain of the company’s customers in the
plasma-fractionation industry. The effects of regulatory, supply, competitive and other pressures on the BioScience segment are
expected to continue to be more than offset by the effects of global expansion, technological advancement and innovation,
increases in manufacturing capacity, and strategic alliances, joint ventures and acquisitions.
Renal The Renal segment generated sales growth of nine percent and 10 percent in 2000 and 1999, respectively. Excluding the
impact of fluctuations in currency exchange rates, sales growth was 11 percent in 2000 and six percent in 1999. Sales related to the
March 2000 acquisition of Althin Medical A.B. (Althin), a manufacturer of hemodialysis products, contributed approximately four
points to the segment’s growth rate in 2000. Significant growth was generated by the segment’s Renal Therapy Services business,
which operates dialysis clinics in partnership with local physicians in international markets, and the Renal Management Strategies
business, which is a renal-disease management organization, with revenues from these businesses increasing over $60 million in
2000 and over $80 million in 1999. The remaining sales growth in the Renal segment was driven principally by continued penetration
of products for peritoneal dialysis. Penetration of products used for peritoneal dialysis continues to be strongest in emerging
markets such as Latin America and Asia, where many people with end-stage renal disease are currently under-treated. Sales in
certain geographic markets continue to be affected by strong pricing pressures and the effects of market consolidation. These issues
are expected to continue to be more than offset by increased penetration of peritoneal dialysis, growth in sales of hemodialysis
products, continued expansion into developing markets, and alliances and acquisitions.
Gross Margin and Expense Ratios
years ended December 31 (as a percent of sales) 2000 1999 1998
Gross margin 44.4% 44.1% 44.9%
Marketing and administrative expenses 20.1% 20.5% 21.2%
The change in the gross margin in both 2000 and 1999 was partly due to changes in the products and services mix and fluctuations
in currency exchange rates. The improved sales mix in 2000 was principally due to significantly higher sales of Recombinate and
vaccines within the BioScience segment. The reduction in 1999 was impacted by higher costs related to increased investments
and reduced production in the BioScience segment in response to heightened FDA regulatory activity with respect to safety and
quality systems.
The reduction in the expense ratio in both 2000 and 1999 was due to a number of factors. The company has been making significant
investments in order to attract and retain a highly talented workforce. Such investments include increased cash compensation
as well as increased long-term Baxter stock incentives. The effect of these strategic investments was more than offset by
the company’s aggressive management of expenses, leveraging of recent acquisitions, improved pension plan asset returns and
hedging activities.
In addition, various recently implemented e-business and strategic sourcing initiatives have resulted in significant efficiencies and
cost savings to the company, which has contributed to an improved gross margin and expense ratio, particularly in 2000, and have
allowed management to redeploy valuable resources within the company. Management expects to continue to make strategic
investments while leveraging and closely managing costs in 2001.
Research and Development
Percent increase
years ended December 31 (in millions) 2000 1999 1998 2000 1999
Research and development expenses $379 $332 $323 14% 3%
as a percent of sales 5% 5% 6%
22
Research and development (R&D) expenses above exclude in-process R&D (IPR&D) charges, which principally consisted of a $250
million IPR&D charge relating to the acquisition of NAV in 2000 and a $116 million IPR&D charge relating to the acquisition of
Somatogen, Inc. in 1998. Refer to Note 3 for a discussion of significant acquisitions, along with related IPR&D charges. R&D expenses
increased in all three segments in both 2000 and 1999. The overall increase was primarily due to spending in the BioScience
segment, principally relating to the next-generation recombinant product, the next-generation oxygen-therapeutics
program, initiatives in the wound management and plasma-based products areas, and, in 2000, to the acquisition of NAV.
Management plans to continue to make significant investments in the R&D initiatives mentioned above as well as other projects
across the three segments in 2001.
Exit and Other Reorganization CostsRefer to Note 4 for a discussion of a charge recorded in 1998 for exit and other reorganization costs. The company recorded a $122
million charge in 1998 principally related to the decisions to end the clinical development of the company’s first-generation oxygen-
carrying therapeutic program, exit certain non-strategic investments, primarily in Asia, and reorganize certain other activities. The
program is substantially complete as originally planned. Management believes remaining reserves for exit and other reorganization
programs are adequate to complete the actions contemplated by the programs. Future cash expenditures will be funded with cash
generated from operations. Management anticipates employee compensation and other cost savings from the programs will be
invested in R&D, new business initiatives, and expansion into growing international markets.
Acquisition Reserves Based on plans formulated at acquisition date, reserves have been established for certain acquisitions as part
of the allocation of purchase price. The reserves, which are further discussed in Note 3, principally consisted of employee severance
costs associated with headcount reductions at the acquired companies, and the costs of exiting activities and terminating distribution,
lease and other contracts of the acquired companies that existed prior to the respective dates of acquisition and either continued
with no economic benefit or required payment of a cancellation penalty. Management believes remaining reserves are adequate to
complete the actions contemplated by the plans.
Net Litigation ChargeAs further discussed in Note 12, the company recorded $29 million of income in 2000, which was principally a result of favorable
adjustments to the mammary implant insurance receivables due to settlements negotiated with certain insurance companies during
2000. The company recorded a $178 million net litigation charge in 1998 relating to mammary implants, plasma-based therapies
(relating to the BioScience segment) and other litigation.
Goodwill AmortizationGoodwill amortization increased in 2000 principally due to the acquisition of NAV.
Other Income and ExpenseNet interest expense declined in 2000 and 1999 due principally to the impact of a greater mix of foreign currency denominated debt,
which bears a lower average interest rate, and to lower average debt levels. In 2000, these factors were partially offset by the impact
of increased interest rates, principally in the United States and Europe. Management does not expect net interest expense to change
significantly in 2001.
As further discussed in Note 10, other income in 2000 consisted principally of net gains relating to foreign currency hedging
instruments, partially offset by losses relating to the early termination of debt. Other expense in 1999 principally related to losses
on disposals of nonstrategic investments and fluctuations in currency exchange rates. Included in other income in 1998 was a pretax
gain of $20 million relating to the disposal of a nonstrategic investment in the Medication Delivery segment.
Pretax Income Refer to Note 13 for a summary of financial results by segment. Certain items are maintained at the company’s corporate headquarters
and are not allocated to the segments. They primarily include hedging activities, certain foreign currency fluctuations, net interest
expense, corporate headquarters costs, and certain nonrecurring gains and losses.
23
Medication Delivery Growth in pretax income of one percent and eight percent in 2000 and 1999, respectively, was primarily a result
of strong sales, and the leveraging of expenses in conjunction with recent acquisitions, partially offset by the unfavorable impact of
fluctuations in currency exchange rates in both periods, increased pump service costs in 2000 and the termination of certain
non-core distribution agreements in 2000.
BioScience The 23 percent and eight percent growth in pretax income in 2000 and 1999, respectively, was principally driven by
strong sales, improved manufacturing efficiencies, and the leveraging and close management of marketing and administrative
expenses, partially offset by the unfavorable impact of fluctuations in currency exchange rates and significantly increased R&D
expenditures. The impact of eased supply constraints and manufacturing capacity expansions for Recombinate also contributed to
the growth in pretax income.
Renal Pretax income declined three percent and increased 43 percent in 2000 and 1999, respectively. A significant contributor to the
increase in 1999 was the impact of the strengthening Japanese Yen. In 2000, the effect of the strengthening Japanese Yen was more
than offset by the effect of the significantly weakening Euro. Excluding the effects of currency exchange rate fluctuations, pretax
income increased due to strong sales, partially offset by a less favorable mix of sales and services, and higher R&D and sales and
marketing investments in the business.
Income TaxesExcluding the 2000 charge for IPR&D and acquisition-related costs and the 1998 charges for IPR&D, exit and other reorganization
costs and net litigation, along with a related provision in 1998 for U.S. taxes on previously unremitted foreign earnings (collectively,
“special charges”), the effective income tax rate from continuing operations was approximately 26 percent, 26 percent and 24 percent
in 2000, 1999 and 1998, respectively. Management does not expect a significant change in the effective tax rate in 2001.
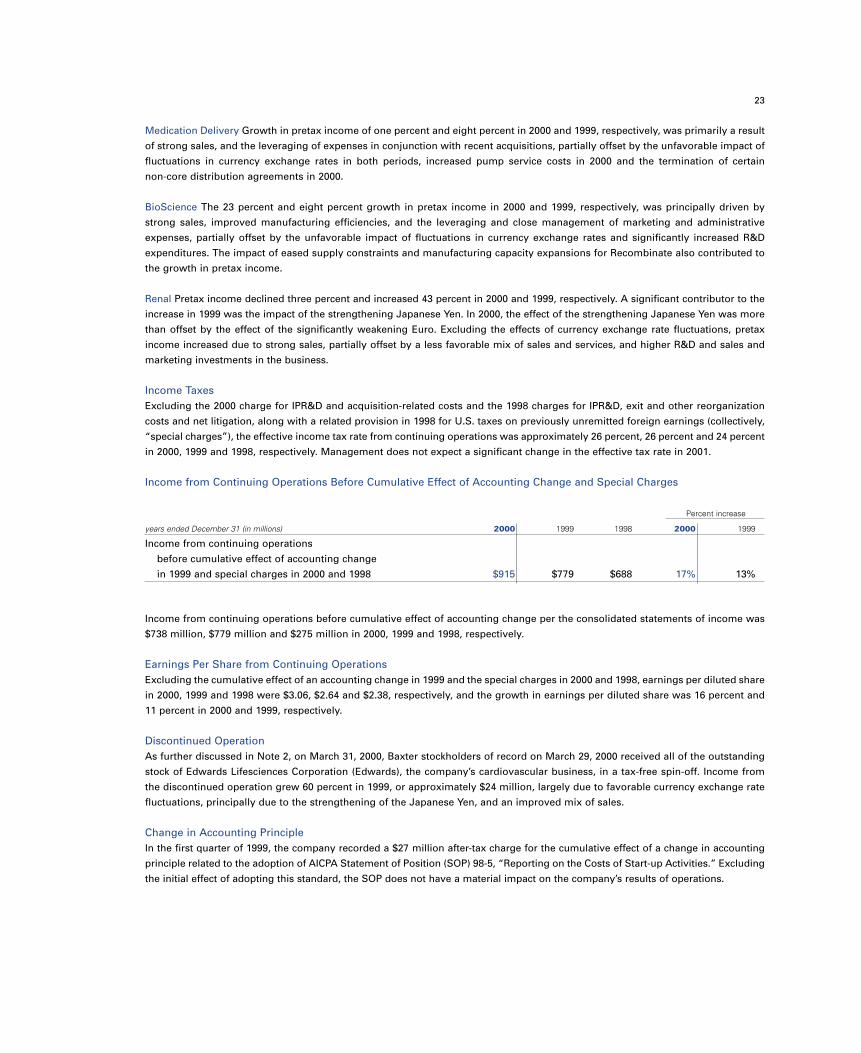
Income from Continuing Operations Before Cumulative Effect of Accounting Change and Special Charges
Percent increase
years ended December 31 (in millions) 2000 1999 1998 2000 1999
Income from continuing operations
before cumulative effect of accounting change
in 1999 and special charges in 2000 and 1998 $915 $779 $688 17% 13%
Income from continuing operations before cumulative effect of accounting change per the consolidated statements of income was
$738 million, $779 million and $275 million in 2000, 1999 and 1998, respectively.
Earnings Per Share from Continuing OperationsExcluding the cumulative effect of an accounting change in 1999 and the special charges in 2000 and 1998, earnings per diluted share
in 2000, 1999 and 1998 were $3.06, $2.64 and $2.38, respectively, and the growth in earnings per diluted share was 16 percent and
11 percent in 2000 and 1999, respectively.
Discontinued Operation As further discussed in Note 2, on March 31, 2000, Baxter stockholders of record on March 29, 2000 received all of the outstanding
stock of Edwards Lifesciences Corporation (Edwards), the company’s cardiovascular business, in a tax-free spin-off. Income from
the discontinued operation grew 60 percent in 1999, or approximately $24 million, largely due to favorable currency exchange rate
fluctuations, principally due to the strengthening of the Japanese Yen, and an improved mix of sales.
Change in Accounting PrincipleIn the first quarter of 1999, the company recorded a $27 million after-tax charge for the cumulative effect of a change in accounting
principle related to the adoption of AICPA Statement of Position (SOP) 98-5, “Reporting on the Costs of Start-up Activities.” Excluding
the initial effect of adopting this standard, the SOP does not have a material impact on the company’s results of operations.

24
Liquidity and Capital Resources
Cash flows from continuing operations per the consolidated statements of cash flows increased during 2000 principally as a result of
higher earnings (before non-cash items), decreased cash payments pertaining to the company’s litigation, a decrease in receivables
and a higher liabilities balance. These increases in cash flows were partially offset by the effect of higher inventories. Cash flows
from continuing operations increased in 1999 due principally to higher earnings, lower inventories and lower other asset balances.
These increases were partially offset principally by higher net cash outflows relating to litigation and lower liabilities balances.
Accounts receivable balances generally increase as the company generates sales growth in certain regions outside the United States,
which have longer collection periods. As further discussed in Note 6, cash flows benefited from the sales of certain trade accounts
receivable whereby the company realized net cash inflows of $195 million, $65 million and $150 million in 2000, 1999 and 1998,
respectively. Such receivables were sold to reduce the overall costs of financing the receivables.
Cash flows related to the discontinued operation decreased in 2000 due to the effect of the spin-off of Edwards on March 31, 2000.
Cash outflows from investing activities increased in 2000 and decreased in 1999. Capital expenditures (including additions to the
pool of equipment leased or rented to customers) increased three and 13 percent in 2000 and 1999, respectively, as the company
increased its investments in various capital projects across all three segments. The growth in capital expenditures principally reflected
increases in manufacturing capacity in the BioScience segment, and, in 1999, to the implementation of a new integrated operational
system. Capital expenditures are made at a sufficient level to support the strategic and operating needs of the businesses. Management
expects to invest between $600 million and $700 million in capital expenditures in 2001.
Net cash outflows relating to acquisitions increased in 2000 and decreased in 1999. In 2000, net cash outflows relating to acquisitions
included approximately $55 million related to the acquisition of Althin and approximately $63 million related to the acquisition of
NAV. As further discussed in Note 3, a portion of the purchase price for both of these acquisitions was paid in Baxter International
Inc. common stock. Approximately $131 million of the total outflows in 2000 related to several acquisitions and investments in the
Medication Delivery segment, principally the acquisition of a domestic ambulatory and infusion pump business and a contingent
purchase price payment associated with the 1998 acquisition of a domestic manufacturer of inhalants and drugs used for general
and local anesthesia. Approximately $15 million of the company’s net cash outflows relating to acquisitions in 2000 related to the
acquisition of dialysis centers in international markets. In 1999, net cash outflows relating to acquisitions included approximately
$36 million for a contingent purchase price payment pertaining to the 1997 acquisition of Immuno International AG. Approximately
$22 million of the 1999 total related to acquisitions of dialysis centers in international markets and approximately $88 million related
to the acquisition of a nutrition and fluid therapy business in Europe. In 1998, net cash outflows relating to acquisitions included
approximately $142 million pertaining to the acquisition of Bieffe Medital S.p.A., a manufacturer of dialysis and intravenous solutions
and containers, approximately $94 million related to an acquisition of a domestic manufacturer of inhalants and drugs used for
general and local anesthesia, and the remainder primarily related to acquisitions of dialysis centers in international markets. Refer
to Note 3 for further information regarding significant acquisitions.
The cash flows relating to divestitures and other asset dispositions in 2000 principally related to the spin-off of Edwards on March 31,
2000. In 1999, the company generated approximately $30 million of cash relating to a prior year divestiture in the BioScience segment
and approximately $42 million of cash relating to the sale and leaseback of certain assets.
Cash flows from financing activities increased in 2000 and decreased in 1999. Common stock dividends decreased in 2000 due to
the company’s change from a quarterly to an annual dividend payout schedule effective at the beginning of the year, and increased
in 1999 due to a higher number of shares outstanding. As further discussed in Note 8, included in total outflows in 1999 was $198
million in cash inflows relating to the Shared Investment Plan. Cash received for stock issued under employee benefit plans
increased in 2000 and 1999 primarily due to a higher level of employee stock option exercises, coupled with a higher average stock
option exercise price. A portion of the increase in 2000 was due to required exercises of stock options by employees transferring
to Edwards as a result of the March 31, 2000 spin-off of that business, as well as to increased stock purchases by employees.
Purchases of treasury stock increased in both 2000 and 1999, as more shares were purchased at higher market prices.
Management assesses the company’s liquidity in terms of its overall ability to mobilize cash to support ongoing business levels and
to fund its growth. Management uses an internal performance measure called operational cash flow that evaluates each operating
business and geographic region on all aspects of cash flow under its direct control. Operational cash flow, as defined, reflects all
litigation payments and related insurance recoveries except for those payments and recoveries relating to mammary implants, which
the company never manufactured or sold. The company expects to generate more than $500 million in operational cash flow in 2001.

25
The following table reconciles cash flows from continuing operations, as determined by generally accepted accounting principles
(GAAP), to operational cash flow, which is not a measure defined by GAAP:
Brackets denote cash outflows
years ended December 31 (in millions) 2000 1999 1998
Cash flows from continuing operations per the $1,233 $977 $837
company’s consolidated statements of cash flows
Capital expenditures (648) (631) (556)
Net interest after tax 51 52 74
Other (48) 190 24
Operational cash flow–continuing operations $ 588 $588 $379
The company’s net-debt-to-capital ratio was 40.1 percent and 40.2 percent at December 31, 2000 and 1999, respectively. In order to
better match the currency denomination of its assets and liabilities, the company rebalanced certain of its debt during 2000. The
company acquired approximately $878 million of its U.S. Dollar denominated debt securities during 2000 and increased its non-U.S.
Dollar denominated debt. During 1998, a wholly-owned subsidiary of the company entered into an $800 million revolving credit
facility. Due to the subsidiary’s covenants under the facility, certain assets are restricted to the parent company. Refer to Note 5 for
further information regarding the company’s credit facilities, long-term debt and lease obligations, and related restrictions and covenants.
As authorized by the board of directors, the company repurchases its stock to optimize its capital structure depending upon its
operational cash flows, net debt level and current market conditions. In November 1995, the company’s board of directors authorized
the repurchase of up to $500 million of common stock over a period of several years, all of which was repurchased by early 2000.
In November 1999, the board of directors authorized the repurchase of an additional $500 million over a period of several years,
of which approximately two-thirds has been repurchased as of December 31, 2000.
As of December 31, 2000, the company can issue up to $550 million in aggregate principal amount of additional senior unsecured
debt securities under effective registration statements filed with the Securities and Exchange Commission. The company’s debt ratings
on senior debt are A3 by Moody’s, A by Standard & Poor’s and A by Duff & Phelps. The company intends to fund its short-term and
long-term obligations as they mature by issuing additional debt or through cash flow from operations. The company believes it has
lines of credit adequate to support ongoing operational requirements. Beyond that, the company believes it has sufficient financial
flexibility to attract long-term capital on acceptable terms as may be needed to support its growth objectives.
In November 2000, the board of directors declared an annual dividend on the company’s common stock of $1.164 per share.
The dividend, which was payable on January 8, 2001 to stockholders of record as of December 15, 2000, is a continuation of the
current annual rate.
Euro Conversion
On January 1, 1999, certain member countries of the European Union introduced a new currency called the “Euro.” The conversion
rates between the Euro and the participating nations’ currencies were fixed irrevocably as of January 1, 1999. Prior to full implementation
of the new currency on January 1, 2002, there is a transition period during which parties may use either the existing currencies or
the Euro for financial transactions.
Action plans are currently being implemented which are expected to result in compliance with all laws and regulations relating to
the Euro conversion. Management expects that the adaptation of its information technology and other systems to accommodate
Euro-denominated transactions as well as the requirements of the transition period will not have a material impact on the company’s
results of operations or financial condition. The company is also addressing the impact of the Euro on currency exchange-rate risk,
taxation, contracts, competition and pricing. While it is not possible to accurately predict the impact the Euro will have on the company’s
business, management does not anticipate that the Euro conversion will have a material adverse impact on the company’s results
of operations or financial condition.
26
Financial Instrument Market Risk
The company’s business and financial results are affected by fluctuations in world financial markets, including currency exchange
rates and interest rates. The company’s hedging policy attempts to manage these risks to an acceptable level based on management’s
judgment of the appropriate trade-off between risk, opportunity and costs. In hedging its currency and interest rate risks, the
company utilizes primarily forward contracts, options and swaps. The company does not hold financial instruments for trading
or speculative purposes. Refer to Note 6 for further information regarding the company’s financial instruments.
Currency Risk The company operates on a global basis and is exposed to the risk that its earnings, cash flows and equity could be
adversely impacted by fluctuations in currency exchange rates. The company is primarily exposed to currency exchange-rate risk
with respect to its transactions and net assets denominated in Japanese Yen, Euro, British Pound and Swiss Franc. The company
manages its foreign currency exposures and capital structure on a consolidated basis, which allows the company to net exposures
and take advantage of any natural offsets. The company also utilizes derivative financial instruments to further reduce the net
exposure to currency fluctuations. The company principally enters into foreign currency option and forward agreements to hedge
firm commitments and anticipated but not yet committed sales expected to be denominated in foreign currencies. The company
enters into foreign currency forward agreements to hedge certain receivables and payables denominated in foreign currencies. The
company also hedges certain of its net investments in international affiliates principally using cross-currency swap agreements.
As part of its risk-management program, the company performs sensitivity analyses to assess potential changes in fair value
relating to hypothetical movements in currency exchange rates. A sensitivity analysis of changes in the fair value of foreign exchange
option and forward contracts outstanding at December 31, 2000 indicated that, if the U.S. Dollar uniformly fluctuated unfavorably
by 10 percent against all currencies, the fair value of those contracts would decrease by $20 million. A similar analysis performed
with respect to option and forward contracts outstanding at December 31, 1999 indicated that the fair value of such contracts would
decrease by $16 million. With respect to the company’s cross-currency swap agreements, if the U.S. Dollar uniformly weakened by
10 percent, the fair value of the contracts would decrease by $83 million and $295 million as of December 31, 2000 and 1999, respectively.
Any increase or decrease in the fair value of cross-currency swap agreements as a result of fluctuations in currency exchange rates
is offset almost completely by the change in the value of the hedged net investments in foreign affiliates. The amount above for
2000 is less than that for 1999 due to the significantly lower notional amount of cross-currency swap agreements outstanding at
December 31, 2000 as compared to the prior year-end. These sensitivity analyses disregard the possibility that currency exchange
rates can move in opposite directions and that gains from one currency may or may not be offset by losses from another currency.
Interest Rate Risk As part of its risk-management program, the company performs sensitivity analyses to assess potential gains and
losses in earnings relating to hypothetical movements in interest rates. A 44 basis-point increase in interest rates (approximately 10
percent of the company’s weighted-average interest rate) affecting the company’s financial instruments, including debt obligations
and related derivatives, and investments, would have an immaterial effect on the company’s 2000 and 1999 earnings and on the fair
value of the company’s fixed-rate financial instruments as of the end of such fiscal years.
As discussed in Note 6, the fair values of the company’s long-term litigation liabilities and related insurance receivables were
computed by discounting the expected cash flows based on currently available information. A 10 percent movement in the assumed
discount rate would have an immaterial effect on the fair values of those assets and liabilities.
Other Risks With respect to the company’s unconsolidated investments, management believes any reasonably possible near-term
losses in earnings, cash flows and fair values would not be material to the company’s consolidated financial position.

27
Legal Proceedings
See Note 12 for a discussion of the company’s legal contingencies and related insurance coverage with respect to cases and claims
relating to the company’s plasma-based therapies and mammary implants, as well as other matters. Upon resolution of any of these
uncertainties, the company may incur charges in excess of presently established reserves. While such a future charge could have a
material adverse effect on the company’s net income or cash flows in the period in which it is recorded or paid, based on the advice
of counsel, management believes that any outcome of these actions, individually or in the aggregate, will not have a material adverse
effect on the company’s consolidated financial position.
Based on the company’s assessment of the costs associated with its environmental responsibilities, including recurring administrative
costs, capital expenditures and other compliance costs, such costs have not had, and in management’s opinion, will not have in the
foreseeable future, a material effect on the company’s financial position, results of operations, cash flows or competitive position.
New Accounting and Disclosure Standards
Statement of Financial Accounting Standards No. 133, “Accounting for Derivative Instruments and Hedging Activities,” as amended
by SFAS No. 137, “Accounting for Derivative Instruments and Hedging Activities—Deferral of the Effective Date of FASB Statement
No. 133” and SFAS No. 138, “Accounting for Certain Hedging Activities” (collectively, SFAS No. 133), is effective for the company
as of January 1, 2001. SFAS No. 133 requires that a company recognize all derivatives as assets or liabilities measured at fair value.
The accounting for changes in the fair value of a derivative depends on the use of the derivative. Adoption of SFAS No. 133 will
result in a cumulative after-tax reduction in net income of approximately $52 million and a cumulative after-tax increase in other
comprehensive income of approximately $8 million, both of which will be recorded at the beginning of fiscal year 2001. The ongoing
impact of SFAS No. 133 is not expected to be material.
SFAS No. 140, “Accounting for Transfers and Servicing of Financial Assets and Extinguishments of Liabilities” (SFAS No. 140) was
issued in September 2000 and is effective for transfers, servicings and extinguishments occurring after March 31, 2001. SFAS
No. 140 replaces SFAS No. 125, “Accounting for Transfers and Servicing of Financial Assets and Extinguishments of Liabilities”
(SFAS No. 125). Although SFAS No. 140 clarifies or amends various aspects of SFAS No. 125, most of the fundamental concepts from
SFAS No. 125 have been brought forward without modification. SFAS No. 140 is not expected to have a material impact on the
company’s consolidated financial statements.
28
Management’s Responsibilities for Financial Reporting
The accompanying financial statements and other financial data have been prepared by management, which is responsible for their
integrity and objectivity. The statements have been prepared in conformity with accounting principles generally accepted in the
United States and include amounts that are based upon management's best estimates and judgments.
Management is responsible for establishing and maintaining a system of internal control over financial reporting and safeguarding
assets against unauthorized acquisition, use or disposition. This system is designed to provide reasonable assurance as to the integrity
and reliability of financial reporting and safeguarding of assets. The concept of reasonable assurance is based on the recognition that
there are inherent limitations in all systems of internal control, and that the cost of such systems should not exceed the benefits to be
derived from them.
Management believes that the foundation of an appropriate system of internal control is a strong ethical company culture and
climate. The Corporate Responsibility Office, which reports to the Public Policy Committee of the board of directors, is responsible
for developing and communicating appropriate business practices, policies and initiatives; maintaining independent channels
of communication for providing guidance and reporting potential business practice violations; and monitoring compliance with the
company’s business practices, including annual compliance certifications by senior managers worldwide. Additionally, a professional
staff of corporate auditors reviews the design of the related internal control system and the accounting policies and procedures
supporting this system and compliance with them. The results of these reviews are reported at least annually to the Public Policy
and/or Audit Committees of the board of directors.
PricewaterhouseCoopers LLP performs audits, in accordance with generally accepted auditing standards, which include a review
of the system of internal controls and result in assurance that the financial statements are, in all material respects, fairly presented.
The board of directors, through its Audit Committee comprised solely of non-employee directors, is responsible for overseeing
the integrity and reliability of the company's accounting and financial reporting practices and the effectiveness of its system of internal
controls. PricewaterhouseCoopers LLP and the corporate auditors meet regularly with, and have access to, this committee, with
and without management present, to discuss the results of the audit work.
Harry M. Jansen Kraemer, Jr. Brian P. AndersonChairman and Chief Senior Vice President andExecutive Officer Chief Financial Officer
Report of Independent Accountants
To the Board of Directors and Stockholders of Baxter International Inc.:
In our opinion, the accompanying consolidated balance sheets and the related consolidated statements of income, cash flows and
stockholders’ equity and comprehensive income present fairly, in all material respects, the financial position of Baxter International
Inc. (the company) and its subsidiaries at December 31, 2000 and 1999, and the results of their operations and their cash flows for
each of the three years in the period ended December 31, 2000, in conformity with accounting principles generally accepted in the
United States of America. These financial statements are the responsibility of the company’s management; our responsibility is to
express an opinion on these financial statements based on our audits. We conducted our audits of these statements in accordance
with auditing standards generally accepted in the United States of America, which require that we plan and perform the audit
to obtain reasonable assurance about whether the financial statements are free of material misstatement. An audit includes
examining, on a test basis, evidence supporting the amounts and disclosures in the financial statements, assessing the accounting
principles used and significant estimates made by management, and evaluating the overall financial statement presentation.
We believe that our audits provide a reasonable basis for our opinion.
PricewaterhouseCoopers LLPChicago, IllinoisFebruary 16, 2001, except for Note 14,which is as of February 28, 2001
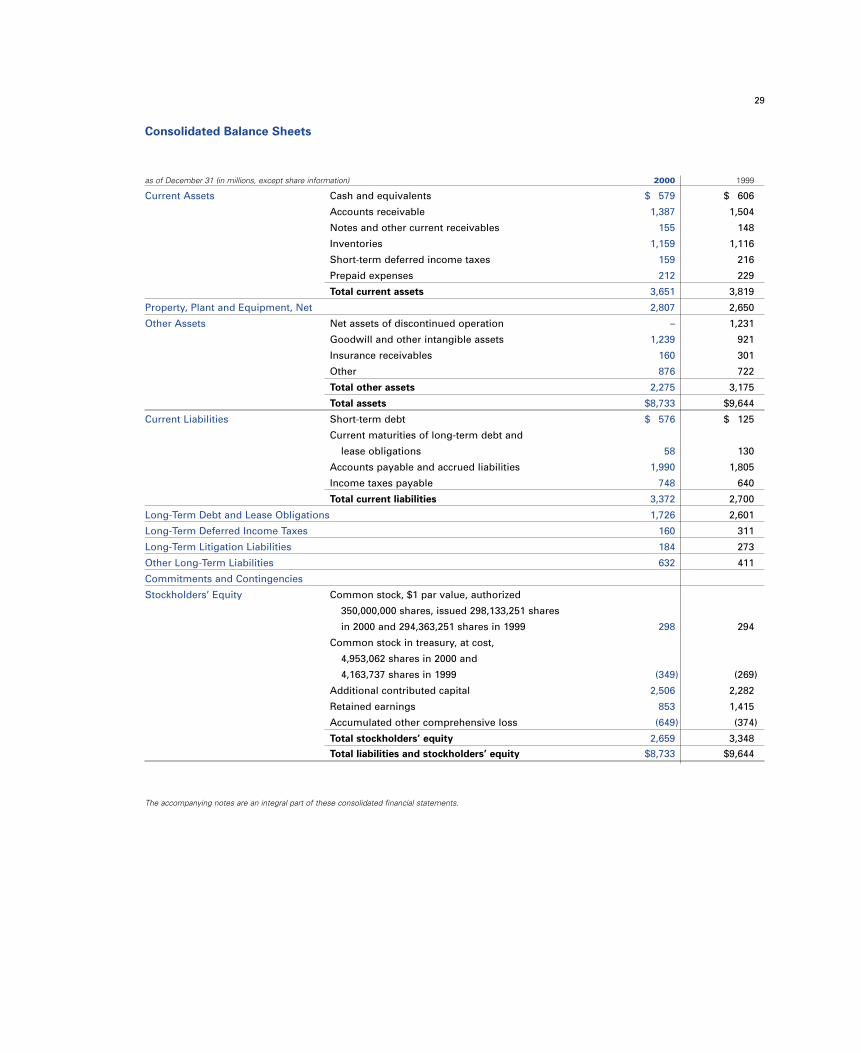
29
Consolidated Balance Sheets
as of December 31 (in millions, except share information) 2000 1999
Current Assets Cash and equivalents $ 579 $ 606
Accounts receivable 1,387 1,504
Notes and other current receivables 155 148
Inventories 1,159 1,116
Short-term deferred income taxes 159 216
Prepaid expenses 212 229
Total current assets 3,651 3,819
Property, Plant and Equipment, Net 2,807 2,650
Other Assets Net assets of discontinued operation – 1,231
Goodwill and other intangible assets 1,239 921
Insurance receivables 160 301
Other 876 722
Total other assets 2,275 3,175
Total assets $8,733 $9,644
Current Liabilities Short-term debt $ 576 $ 125
Current maturities of long-term debt and
lease obligations 58 130
Accounts payable and accrued liabilities 1,990 1,805
Income taxes payable 748 640
Total current liabilities 3,372 2,700
Long-Term Debt and Lease Obligations 1,726 2,601
Long-Term Deferred Income Taxes 160 311
Long-Term Litigation Liabilities 184 273
Other Long-Term Liabilities 632 411
Commitments and Contingencies
Stockholders’ Equity Common stock, $1 par value, authorized
350,000,000 shares, issued 298,133,251 shares
in 2000 and 294,363,251 shares in 1999 298 294
Common stock in treasury, at cost,
4,953,062 shares in 2000 and
4,163,737 shares in 1999 (349) (269)
Additional contributed capital 2,506 2,282
Retained earnings 853 1,415
Accumulated other comprehensive loss (649) (374)
Total stockholders’ equity 2,659 3,348
Total liabilities and stockholders’ equity $8,733 $9,644
The accompanying notes are an integral part of these consolidated financial statements.

30
Consolidated Statements of Income
years ended December 31 (in millions, except per share data) 2000 1999 1998
Operations Net sales $6,896 $6,380 $5,706
Costs and expenses
Cost of goods sold 3,833 3,568 3,142
Marketing and administrative expenses 1,385 1,311 1,208
Research and development expenses 379 332 323
In-process research and development
and acquisition-related costs 286 – 116
Exit and other reorganization costs – – 122
Net litigation (income) costs (29) – 178
Goodwill amortization 31 19 18
Operating income 1,011 1,150 599
Interest expense, net 85 87 124
Other (income) expense (20) 11 (18)
Income from continuing operations
before income taxes and cumulative
effect of accounting change 946 1,052 493
Income tax expense 208 273 218
Income from continuing operations before
cumulative effect of accounting change 738 779 275
Discontinued operation 2 45 40
Income before cumulative effect
of accounting change 740 824 315
Cumulative effect of accounting change,
net of income tax benefit of $7 – (27) –
Net income $ 740 $ 797 $ 315
Per Share Data Earnings per basic common share
Continuing operations $ 2.52 $ 2.69 $ 0.97
Discontinued operation 0.01 0.15 0.14
Cumulative effect of accounting change – (0.09) –
Net income $ 2.53 $ 2.75 $ 1.11
Earnings per diluted common share
Continuing operations $ 2.47 $ 2.64 $ 0.95
Discontinued operation 0.01 0.15 0.14
Cumulative effect of accounting change – (0.09) –
Net income $ 2.48 $ 2.70 $ 1.09
Weighted average number of
common shares outstanding
Basic 292 290 284
Diluted 299 295 289
The accompanying notes are an integral part of these consolidated financial statements.

31
Consolidated Statements of Cash Flows
as of or for the years ended December 31 (in millions) (brackets denote cash outflows) 2000 1999 1998
Cash Flows from Operations Income from continuing operations before
cumulative effect of accounting change $738 $779 $275
Adjustments
Depreciation and amortization 405 372 344
Deferred income taxes (170) 92 (56)
Loss (gain) on asset dispositions 6 13 (23)
In-process research and development
and acquisition-related costs 286 – 116
Exit and other reorganization costs – – 122
Net litigation (income) charge (29) – 178
Other 55 20 2
Changes in balance sheet items
Accounts receivable 54 (103) (153)
Inventories (114) 17 (79)
Accounts payable and accrued liabilities 60 30 165
Net litigation payments and other (58) (243) (54)
Cash flows from continuing operations 1,233 977 837
Cash flows from discontinued operation (19) 106 102
Cash flows from operations 1,214 1,083 939
Cash Flows from Investing Activities Capital expenditures (547) (529) (461)
Additions to the pool of equipment leased
or rented to customers (101) (102) (95)
Acquisitions (net of cash received)
and investments in affiliates (345) (179) (319)
Divestitures and other asset dispositions (60) 75 3
Cash flows from investing activities (1,053) (735) (872)
Cash Flows from Financing Activities Issuances of debt obligations 1,180 764 1,143
Redemption of debt obligations (1,953) (481) (598)
Increase (decrease) in debt with
maturities of three months or less, net 879 (552) (159)
Common stock cash dividends (84) (338) (331)
Stock issued under Shared Investment Plan – 198 –
Stock issued under employee
benefit plans 233 148 118
Purchases of treasury stock (375) (184) –
Cash flows from financing activities (120) (445) 173
Effect of Foreign Exchange Rate Changes on Cash and Equivalents (68) (6) 4
Increase (Decrease) in Cash and Equivalents (27) (103) 244
Cash and Equivalents at Beginning of Year 606 709 465
Cash and Equivalents at End of year $579 $606 $709
Supplemental information:
Interest paid, net of portion capitalized $110 $150 $191
Income taxes paid $279 $197 $143
The accompanying notes are an integral part of these consolidated financial statements.
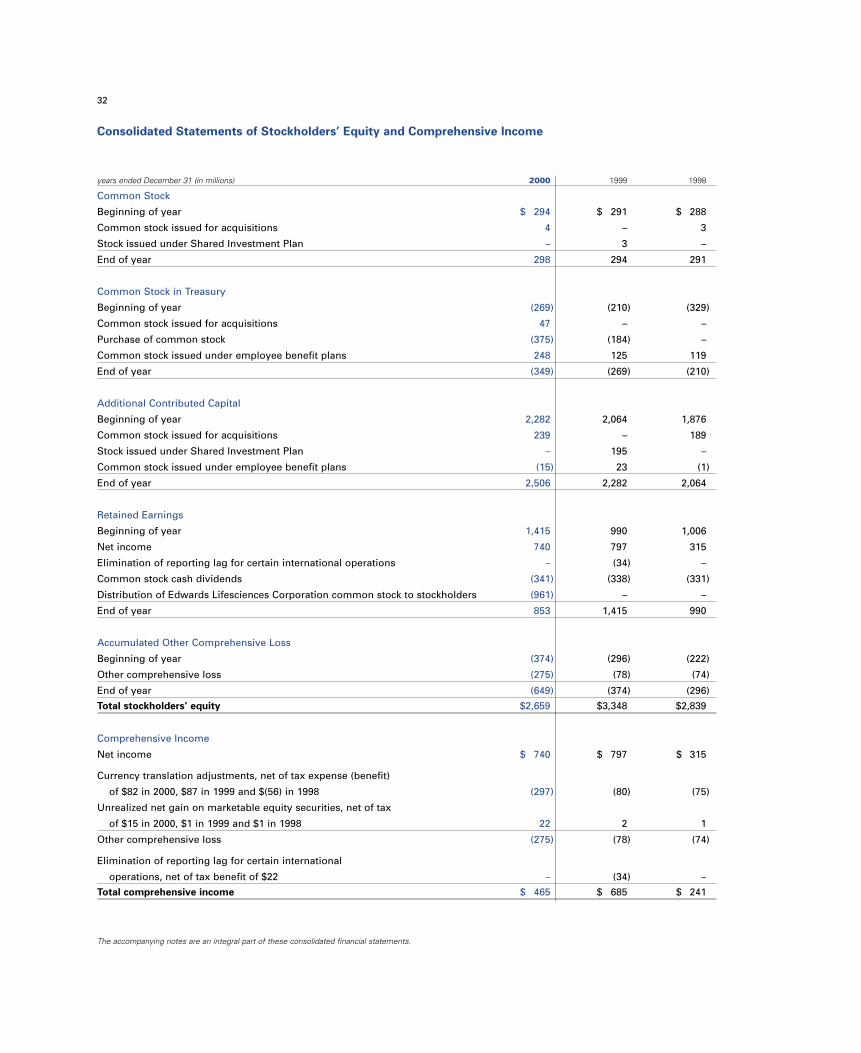
32
Consolidated Statements of Stockholders’ Equity and Comprehensive Income
years ended December 31 (in millions) 2000 1999 1998
Common Stock
Beginning of year $ 294 $ 291 $ 288
Common stock issued for acquisitions 4 – 3
Stock issued under Shared Investment Plan – 3 –
End of year 298 294 291
Common Stock in Treasury
Beginning of year (269) (210) (329)
Common stock issued for acquisitions 47 – –
Purchase of common stock (375) (184) –
Common stock issued under employee benefit plans 248 125 119
End of year (349) (269) (210)
Additional Contributed Capital
Beginning of year 2,282 2,064 1,876
Common stock issued for acquisitions 239 – 189
Stock issued under Shared Investment Plan – 195 –
Common stock issued under employee benefit plans (15) 23 (1)
End of year 2,506 2,282 2,064
Retained Earnings
Beginning of year 1,415 990 1,006
Net income 740 797 315
Elimination of reporting lag for certain international operations – (34) –
Common stock cash dividends (341) (338) (331)
Distribution of Edwards Lifesciences Corporation common stock to stockholders (961) – –
End of year 853 1,415 990
Accumulated Other Comprehensive Loss
Beginning of year (374) (296) (222)
Other comprehensive loss (275) (78) (74)
End of year (649) (374) (296)
Total stockholders’ equity $2,659 $3,348 $2,839
Comprehensive Income
Net income $ 740 $ 797 $ 315
Currency translation adjustments, net of tax expense (benefit)
of $82 in 2000, $87 in 1999 and $(56) in 1998 (297) (80) (75)
Unrealized net gain on marketable equity securities, net of tax
of $15 in 2000, $1 in 1999 and $1 in 1998 22 2 1
Other comprehensive loss (275) (78) (74)
Elimination of reporting lag for certain international
operations, net of tax benefit of $22 – (34) –
Total comprehensive income $ 465 $ 685 $ 241
The accompanying notes are an integral part of these consolidated financial statements.

Warranty expenseThe company provides for the estimated costs that may be
incurred under its warranty programs at the time revenue
is recognized.
Inventories
as of December 31 (in millions) 2000 1999
Raw materials $ 261 $ 251Work in process 174 193Finished products 724 672Total inventories $1,159 $1,116
Inventories are stated at the lower of cost (first-in, first-out
method) or market value. Market value for raw materials is based
on replacement costs and, for other inventory classifications, on
net realizable value. Reserves for excess and obsolete inventory
were $110 million and $78 million at December 31, 2000 and
1999, respectively.
Property, plant and equipment
as of December 31 (in millions) 2000 1999
Land $ 113 $ 93 Buildings and leasehold improvements 967 987 Machinery and equipment 2,822 2,615 Equipment with customers 484 489 Construction in progress 592 525 Total property, plant and equipment, at cost 4,978 4,709 Accumulated depreciation and amortization (2,171) (2,059)Property, plant and equipment, net $2,807 $2,650
Depreciation and amortization are principally calculated on the
straight-line method over the estimated useful lives of the related
assets, which range from 20 to 50 years for buildings and
improvements and from three to 15 years for machinery and
equipment. Leasehold improvements are amortized over the life
of the related facility lease or the asset, whichever is shorter.
Straight-line and accelerated methods of depreciation are used
for income tax purposes. Accumulated amortization for assets
under capital lease was $11 million and $10 million at December
31, 2000 and 1999, respectively. Depreciation expense was $308
million, $290 million and $269 million in 2000, 1999 and 1998,
respectively. Repairs and maintenance expense was $105 million,
$97 million and $93 million in 2000, 1999 and 1998, respectively.
Notes to Consolidated Financial Statements
Summary of Significant Accounting Policies
Financial statement presentationThe preparation of the financial statements in conformity with
generally accepted accounting principles (GAAP) requires
management to make estimates and assumptions that affect
reported amounts and related disclosures. Actual results could
differ from those estimates.
Basis of consolidationThe consolidated financial statements include the accounts
of Baxter International Inc. and its majority-owned, controlled
subsidiaries (Baxter or the company). Effective in the first
quarter of 1999 and in conjunction with the implementation
of new financial systems, the company eliminated the one-month
lag in reporting certain international operations to facilitate more
timely consolidation. The December 1998 net loss of $34 million
for these operations was recorded directly to retained earnings
in the first fiscal quarter of 1999. Effective in the first quarter
of 2001, the one-month lag was eliminated for the remaining
international operations.
Foreign currency translationThe results of operations for non-U.S. subsidiaries, other than
those located in highly inflationary countries, are translated into
U.S. dollars using the average exchange rates during the year,
while assets and liabilities are translated using period-end rates.
Resulting translation adjustments are recorded as currency
translation adjustments within other comprehensive income.
Where foreign affiliates operate in highly inflationary economies,
non-monetary amounts are remeasured at historical exchange
rates while monetary assets and liabilities are remeasured at
the current rate with the related adjustments reflected in the
consolidated statements of income.
Revenue recognitionThe company’s policy is to recognize revenues from product
sales and services when earned, as defined by GAAP, and in
accordance with SEC Staff Accounting Bulletin No. 101. Revenue
is recognized when persuasive evidence of the arrangement
exists, delivery has occurred or services have been rendered, the
price is fixed or determinable, and collectibility is reasonably
assured. For product sales, revenue is not recognized until title
and risk of loss have transferred. Prior to revenue recognition,
the company substantially completes the terms specified in the
arrangement, and any remaining obligations are inconsequential
or perfunctory. Provisions for discounts, rebates to customers,
and returns are provided for at the time the related sales are
recorded, and are classified as adjustments to sales.
1
33

34
Goodwill and other intangible assets
as of December 31 (in millions) 2000 1999
Goodwill $1,094 $737 Accumulated amortization (138) (113)Net goodwill 956 624 Other intangible assets 701 677 Accumulated amortization (418) (380)Net other intangible assets 283 297 Goodwill and other intangible assets $1,239 $921
Intangible assets are amortized on a straight-line basis. Goodwill
is amortized over estimated useful lives ranging from 15 to 40
years; other intangible assets, consisting of purchased patents,
trademarks and other identified rights, are amortized over their
legal or estimated useful lives, whichever is shorter (generally not
exceeding 17 years). The company’s policy is to review the
carrying amounts of goodwill and other intangibles whenever
events or changes in circumstances indicate that the carrying
amount of an asset may not be recoverable. Such events or
circumstances might include a significant decline in market
share, a significant decline in profits, rapid changes in technology,
significant litigation or other items. In evaluating the recoverability
of goodwill and other intangible assets, management’s policy is
to compare the carrying amounts of such assets with the estimated
undiscounted future operating cash flows. In the event impairment
exists, an impairment charge would be determined by comparing
the carrying amounts of the asset to the applicable estimated
future cash flows, discounted at a risk-adjusted interest rate. In
addition, the remaining amortization period for the impaired asset
would be reassessed and revised if necessary. Management
does not believe the carrying amounts of goodwill and other
intangible assets are impaired at December 31, 2000.
Earnings per share (EPS)The numerator for both basic and diluted EPS is net earnings
available to common shareholders. The denominator for basic EPS
is the weighted-average number of common shares outstanding
during the period. The following is a reconciliation of the shares
(denominator) of the basic and diluted per-share computations.
years ended December 31(in million of shares) 2000 1999 1998
Basic 292 290 284 Effect of dilutive securities
Employee stock options 6 4 5 Employee stock purchase plans
and equity forward agreements 1 1 – Diluted 299 295 289
Comprehensive incomeComprehensive income encompasses all changes in stockholders’
equity other than those arising from stockholders, and generally
consists of net income, currency translation adjustments and
unrealized net gains and losses on marketable equity securities.
Accumulated currency translation adjustments were ($674) million
and ($377) million at December 31, 2000 and 1999, respectively.
Accumulated unrealized net gains on unrestricted marketable
equity securities were $25 million and $3 million at December 31,
2000 and 1999, respectively.
Start-up costsEffective at the beginning of 1999, the company adopted AICPA
Statement of Position (SOP) 98-5, “Reporting on the Costs of
Start-up Activities.” This SOP required that the costs of start-up
and organization activities previously capitalized be expensed
and reported as a cumulative effect of a change in accounting
principle and that such costs subsequent to adoption be
expensed as incurred. The after-tax cumulative effect of this
accounting change was $27 million.
DerivativesGains and losses relating to foreign currency purchased options
and forward agreements that are designated and effective as
hedges of firm commitments and anticipated transactions are
deferred and recognized in income as offsets of gains and losses
resulting from the underlying hedged items. Purchased option
premiums are deferred and recognized in income to the extent
considered effective. Premiums and discounts related to forward
agreements are capitalized and amortized over the period of
the underlying agreement. Deferred amounts are classified in
inventories. Gains, losses and option premiums relating to
foreign currency derivative instruments not qualifying as hedges
for accounting purposes are recognized in income immediately.
Such instruments are classified in accounts payable and accrued
liabilities. Gains, losses relating to terminations of qualifying
hedges are generally deferred and recognized consistent with
the income or loss recognition of the underlying hedged items.
In circumstances where the underlying hedged items are sold or
no longer exist, any remaining gains or losses are recognized
immediately in income. The effective portions of gains and losses
on hedges of net investments in foreign affiliates are reported as
currency translation adjustments in stockholders’ equity. The
interest rate differentials relating to interest rate swaps used to
hedge debt obligations and cross-currency swap contracts used
to hedge net investments in foreign affiliates are reflected as an
adjustment to interest expense over the lives of the financial
instruments. Gains or losses relating to terminations of
cross-currency swap contracts used to hedge net investments in
foreign affiliates are recognized immediately and recorded
in other income or expense. Instruments that are indexed to and
potentially settled in the company’s stock are accounted for in
accordance with Emerging Issues Task Force Issue Nos. 00-7
and 00-19. Cash flows from derivatives are classified in the same
category as the cash flows from the related hedged activity.
35
Cash and equivalentsCash and equivalents include cash, certificates of deposit
and marketable securities with an original maturity of three
months or less.
Shipping and handling costsShipping and handling costs are classified in either cost of goods
sold or marketing and administrative expenses based on their
nature. Approximately $200 million of shipping and handling
costs were classified in marketing and administrative expenses
in each of 2000, 1999 and 1998.
ReclassificationsCertain reclassifications have been made to conform the 1999 and
1998 financial statements and notes to the 2000 presentation.
New accounting pronouncementsStatement of Financial Accounting Standards No. 133, “Accounting
for Derivative Instruments and Hedging Activities,” as amended
by SFAS No. 137, “Accounting for Derivative Instruments and
Hedging Activities—Deferral of the Effective Date of FASB
Statement No. 133” and SFAS No. 138, “Accounting for Certain
Hedging Activities” (collectively, SFAS No. 133), is effective for
the company as of January 1, 2001. SFAS No. 133 requires that
a company recognize all derivatives as assets or liabilities
measured at fair value. The accounting for changes in the fair
value of a derivative depends on the use of the derivative.
Adoption of SFAS No. 133 will result in a cumulative after-tax
reduction in net income of approximately $52 million and a
cumulative after-tax increase in other comprehensive income of
approximately $8 million, both of which will be recorded at the
beginning of fiscal year 2001. The ongoing impact of SFAS
No. 133 is not expected to be material.
SFAS No. 140, “Accounting for Transfers and Servicing of
Financial Assets and Extinguishments of Liabilities” (SFAS No.
140) was issued in September 2000 and is effective for transfers,
servicings and extinguishments occurring after March 31, 2001.
SFAS No. 140 replaces SFAS No. 125, “Accounting for Transfers
and Servicing of Financial Assets and Extinguishments of
Liabilities” (SFAS No. 125). Although SFAS No. 140 clarifies or
amends various aspects of SFAS No. 125, most of the fundamental
concepts from SFAS No. 125 have been brought forward without
modification. SFAS No. 140 is not expected to have a material
impact on the company’s consolidated financial statements.
Discontinued Operation
On March 31, 2000, Baxter stockholders of record on March 29,
2000, received all of the outstanding stock of Edwards
Lifesciences Corporation (Edwards), the company’s cardiovascular
business, in a tax-free spin-off. The company’s consolidated
financial statements and related notes have been adjusted and
restated to reflect the financial position, results of operations
and cash flows of Edwards as a discontinued operation.
2
In 2000, 1999 and 1998, the company recorded income from the
discontinued operation of $14 million, $64 million and $40 million,
respectively, which was net of income tax expense of $5 million,
$19 million and $16 million, respectively. In addition, in 2000 and
1999 the company recorded $12 million (including tax of $6 million)
and $19 million, respectively, of net costs directly associated with
effecting the business distribution. The impact of these costs on
basic earnings per share was $.04 and $.07 in 2000 and 1999,
respectively, and the impact on diluted earnings per share was
$.04 and $.06 in 2000 and 1999, respectively. Net sales of the
discontinued operation were $906 million in 1999, $893 million
in 1998, and $252 million for the three-month period ended
March 31, 2000.
Through the issuance of new third-party debt, approximately
$502 million of Baxter’s debt was indirectly assumed by Edwards
upon spin-off. The distribution of Edwards stock totaled $961 million.
The cardiovascular business in Japan was not transferred to
Edwards at the time of distribution due to Japanese regulatory
requirements and business culture considerations. The business
is operated pursuant to a contractual joint venture under which
a Japanese subsidiary of Baxter retains ownership of the business
assets, but a subsidiary of Edwards holds a 90 percent profit
interest. Edwards has an option to purchase the Japanese
assets, which option may be exercised no earlier than 28 months
following the spin-off date and no later than 60 months following
the spin-off date. The exercise price of the option is approximately
26.4 billion Japanese Yen, of which Edwards would obtain
approximately 23.2 billion Japanese Yen upon termination of the
joint venture for the return of its fair value in the joint venture at
inception. Included in Baxter’s consolidated balance sheet at
December 31, 2000 was a $203 million liability relating to this
contractual joint venture, which was established in connection
with the accounting for the spin-off of Edwards.
Acquisitions and Divestitures
Accounting for acquisitionsAll acquisitions during the three years ended December 31, 2000
were accounted for under the purchase method. Results of
operations of acquired companies are included in the company’s
results of operations as of the respective acquisition dates. The
purchase price of each acquisition was allocated to the net assets
acquired based on estimates of their fair values at the date of the
acquisition. The excess of the purchase price over the fair values
of the net tangible assets, identifiable intangible assets and
liabilities acquired was allocated to goodwill. As further discussed
below, a portion of the purchase price for certain of the acquisitions
was allocated to in-process research and development (IPR&D)
which, under GAAP, was immediately expensed.
3
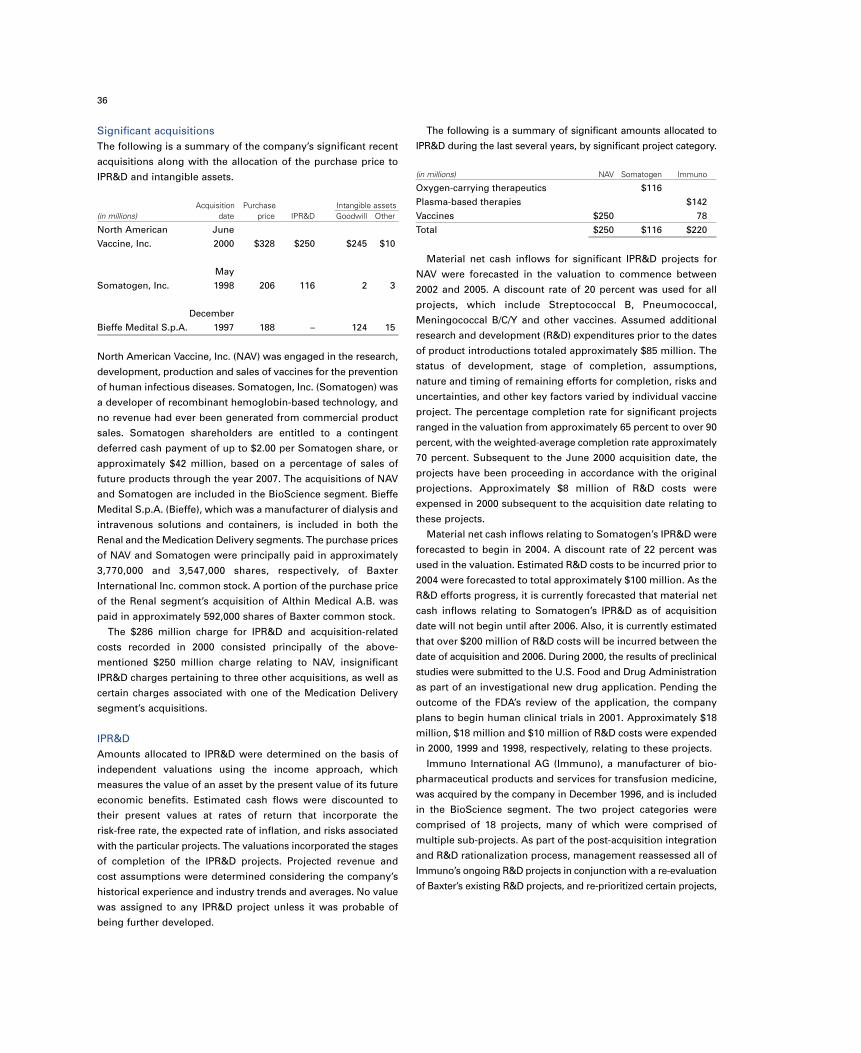
36
Significant acquisitionsThe following is a summary of the company’s significant recent
acquisitions along with the allocation of the purchase price to
IPR&D and intangible assets.
Acquisition Purchase Intangible assets (in millions) date price IPR&D Goodwill Other
North American JuneVaccine, Inc. 2000 $328 $250 $245 $10
MaySomatogen, Inc. 1998 206 116 2 3
DecemberBieffe Medital S.p.A. 1997 188 – 124 15
North American Vaccine, Inc. (NAV) was engaged in the research,
development, production and sales of vaccines for the prevention
of human infectious diseases. Somatogen, Inc. (Somatogen) was
a developer of recombinant hemoglobin-based technology, and
no revenue had ever been generated from commercial product
sales. Somatogen shareholders are entitled to a contingent
deferred cash payment of up to $2.00 per Somatogen share, or
approximately $42 million, based on a percentage of sales of
future products through the year 2007. The acquisitions of NAV
and Somatogen are included in the BioScience segment. Bieffe
Medital S.p.A. (Bieffe), which was a manufacturer of dialysis and
intravenous solutions and containers, is included in both the
Renal and the Medication Delivery segments. The purchase prices
of NAV and Somatogen were principally paid in approximately
3,770,000 and 3,547,000 shares, respectively, of Baxter
International Inc. common stock. A portion of the purchase price
of the Renal segment’s acquisition of Althin Medical A.B. was
paid in approximately 592,000 shares of Baxter common stock.
The $286 million charge for IPR&D and acquisition-related
costs recorded in 2000 consisted principally of the above-
mentioned $250 million charge relating to NAV, insignificant
IPR&D charges pertaining to three other acquisitions, as well as
certain charges associated with one of the Medication Delivery
segment’s acquisitions.
IPR&DAmounts allocated to IPR&D were determined on the basis of
independent valuations using the income approach, which
measures the value of an asset by the present value of its future
economic benefits. Estimated cash flows were discounted to
their present values at rates of return that incorporate the
risk-free rate, the expected rate of inflation, and risks associated
with the particular projects. The valuations incorporated the stages
of completion of the IPR&D projects. Projected revenue and
cost assumptions were determined considering the company’s
historical experience and industry trends and averages. No value
was assigned to any IPR&D project unless it was probable of
being further developed.
The following is a summary of significant amounts allocated to
IPR&D during the last several years, by significant project category.
(in millions) NAV Somatogen Immuno
Oxygen-carrying therapeutics $116Plasma-based therapies $142 Vaccines $250 78 Total $250 $116 $220
Material net cash inflows for significant IPR&D projects for
NAV were forecasted in the valuation to commence between
2002 and 2005. A discount rate of 20 percent was used for all
projects, which include Streptococcal B, Pneumococcal,
Meningococcal B/C/Y and other vaccines. Assumed additional
research and development (R&D) expenditures prior to the dates
of product introductions totaled approximately $85 million. The
status of development, stage of completion, assumptions,
nature and timing of remaining efforts for completion, risks and
uncertainties, and other key factors varied by individual vaccine
project. The percentage completion rate for significant projects
ranged in the valuation from approximately 65 percent to over 90
percent, with the weighted-average completion rate approximately
70 percent. Subsequent to the June 2000 acquisition date, the
projects have been proceeding in accordance with the original
projections. Approximately $8 million of R&D costs were
expensed in 2000 subsequent to the acquisition date relating to
these projects.
Material net cash inflows relating to Somatogen’s IPR&D were
forecasted to begin in 2004. A discount rate of 22 percent was
used in the valuation. Estimated R&D costs to be incurred prior to
2004 were forecasted to total approximately $100 million. As the
R&D efforts progress, it is currently forecasted that material net
cash inflows relating to Somatogen’s IPR&D as of acquisition
date will not begin until after 2006. Also, it is currently estimated
that over $200 million of R&D costs will be incurred between the
date of acquisition and 2006. During 2000, the results of preclinical
studies were submitted to the U.S. Food and Drug Administration
as part of an investigational new drug application. Pending the
outcome of the FDA’s review of the application, the company
plans to begin human clinical trials in 2001. Approximately $18
million, $18 million and $10 million of R&D costs were expended
in 2000, 1999 and 1998, respectively, relating to these projects.
Immuno International AG (Immuno), a manufacturer of bio-
pharmaceutical products and services for transfusion medicine,
was acquired by the company in December 1996, and is included
in the BioScience segment. The two project categories were
comprised of 18 projects, many of which were comprised of
multiple sub-projects. As part of the post-acquisition integration
and R&D rationalization process, management reassessed all of
Immuno’s ongoing R&D projects in conjunction with a re-evaluation
of Baxter’s existing R&D projects, and re-prioritized certain projects,

37
resulting in modifications to originally planned timetables for
certain of the projects and terminations of other projects. Such
revisions to original plans were also significantly influenced by
marketplace trends and competitive factors occurring since the
acquisition date. Most significantly, the timetables for certain of
the plasma-based therapies projects have been altered in order to
accelerate the development of the next-generation recombinant
Factor VIII concentrate for hemophilia treatment, given the
strong and accelerating demand for recombinant products in
the marketplace. As a result of the timetable revisions and
terminations, actual R&D expenditures since acquisition date
have been over 40 percent lower than that assumed in the
model. Total additional R&D expenditures are currently forecasted
to be less than those assumed in the model. Approximately
$15 million, $30 million and $25 million of R&D costs have
been expensed in 2000, 1999 and 1998, respectively, relating
to these projects.
With respect to NAV, Somatogen and Immuno IPR&D, the
products currently under development are at various stages of
development, and substantial further research and development,
pre-clinical testing and clinical trials will be required to determine
their technical feasibility and commercial viability. There can
be no assurance such efforts will be successful. Delays in the
development, introduction or marketing of the products under
development could result either in such products being marketed
at a time when their cost and performance characteristics would
not be competitive in the market-place or in a shortening of their
commercial lives. If the products are not completed on time,
the expected return on the company’s investments could be
significantly and unfavorably impacted.
Pro forma informationThe following unaudited pro forma information presents a
summary of the company’s consolidated results of operations
as if acquisitions had occurred as of the beginning of
fiscal years 2000 and 1999, respectively, giving effect to purchase
accounting adjustments but excluding the 2000 charge for
IPR&D and acquisition-related costs.
years ended December 31 (in millions, except per share data) 2000 1999
Net sales $7,005 $6,614 Income from continuing operations before
cumulative effect of accounting change $ 896 $ 781Net income $ 896 $ 754 Net income per diluted common share $ 2.99 $ 2.52
These pro forma results of operations have been presented for
comparative purposes only and do not purport to be indicative
of the results of operations which actually would have resulted
had the acquisitions occurred on the date indicated, or which
may result in the future. The diluted pro forma earnings and
per-share earnings included in the table above primarily reflect
the historical pre-acquisition net losses reported by NAV.
Acquisition reservesBased on plans formulated at acquisition date, as part of the
allocation of purchase price, reserves have been established for
certain acquisitions. The following is a summary of the reserves
and related activity pertaining to the acquisition of Immuno.
Reserves established for certain of the company’s acquisitions
during the period are not included below as such reserves were
not material. Actions executed to date and anticipated in the future
with respect to the acquisition-related plans are substantially
consistent with the original plans. Management believes remaining
reserves are adequate to complete the actions contemplated
by the plans.
as of or for the years endedDecember 31 (in millions) Immuno
Original reserveEmployee-related costs $38Contract termination and other costs 41
Total original reserve 79 1998 and prior reserve utilization (26)1999 reserve utilization (11)2000 reserve utilization (16)Balance at December 31, 2000 $26
Employee-related costs consisted principally of employee
severance associated with headcount reductions in Europe and
primarily impacted the sales and marketing functions. Utilization
of reserves for employee-related costs totaled $3 million, $6 million
and $16 million in 2000, 1999 and 1998, respectively. Contract
termination and other costs related principally to the exiting of
activities and termination of distribution, lease and other contracts
of the acquired company that existed prior to the acquisition
date that either continued with no economic benefit or required
payment of a cancellation penalty.

38
Exit and Other Reorganization Costs
In 1998, the company decided to end the clinical development of
the BioScience segment’s first-generation oxygen-carrying
therapeutic, HemAssist (DCLHb), which was based on human
hemoglobin, and focus on the next-generation program, which
is based on genetically engineered hemoglobin molecules. The
company also decided to exit certain non-strategic investments,
primarily in Asia, and reorganize certain other activities. As a
result of these decisions, the company recorded a $122 million
pretax charge in 1998. Included in the total charge was a $74
million charge to write down certain assets to estimated sales or
salvage value due to impairment. The majority of the asset
writedowns related to machinery and equipment located in a
manufacturing facility in Neuchâtel, Switzerland, that were used
solely in the development and manufacture of HemAssist
(DCLHb), and had no alternative future use. Activities ceased upon
the decision to end the clinical development of HemAssist (DCLHb).
In 1999, the company began modifications to this manufacturing
facility, which was designed to manufacture a human hemoglobin
product, to produce recombinant biopharmaceutical products.
Such alternate production is expected to commence at the
Neuchâtel facility in the next two years.
The following is a summary of the components of the remainder
of the charge and the utilization of such reserves.
as of or for the years ended Employee- OtherDecember 31 (in millions) related costs costs Total
Original charge $34 $14 $48 1998 utilization (12) (6) (18)1999 utilization (16) (7) (23)2000 utilization (4) – (4)Reserves at December 31, 2000 $ 2 $ 1 $ 3
Employee-related costs consisted principally of employee
severance resulting from the elimination of approximately
375 positions worldwide. The headcount reductions affected
various functions and pertained principally to the BioScience
and Medication Delivery segments. Approximately 360 positions
have been eliminated through December 31, 2000. The other
costs related principally to contractual obligations that existed
prior to the date of the charge that either continued with no
economic benefit or required payment of a cancellation penalty.
The majority of such costs related to the terminated HemAssist
(DCLHb) program and included cancellation costs associated
with a minimum purchase agreement.
4 Long-Term Debt, Credit Facilities and Lease Obligations
Effectiveas of December 31 (in millions) interest rate 2000 1999
Commercial paper 6.4% $ 800 $ 668 Short-term notes 3.5% 513 646 Zero coupon notes
due 2000 (unamortized originalissue discount of $9) 10.3% – 120
8.125% notes due 2001 6.2% 40 155 7.625% notes due 2002 7.5% 46 151 7.125% notes due 2007 7.1% 54 251 7.25% notes due 2008 7.5% 29 198 9.5% notes due 2008 9.5% 75 75 7.65% debentures due 2027 7.6% 5 202 6.625% debentures due 2028 6.7% 147 249 Other 75 16 Total long-term debt and
lease obligations 1,784 2,731 Current portion (58) (130)Long-term portion $1,726 $2,601
In order to better match the currency denomination of its assets
and liabilities, the company rebalanced certain of its debt during
2000. The company acquired approximately $878 million of its
U.S. Dollar denominated debt securities during 2000 and
increased its Japanese Yen and Euro denominated debt. The net
costs associated with the early termination of the U.S. Dollar
denominated debt of $15 million were recorded in other expense
as they were not material. The increase in debt denominated in
Japanese Yen and Euro was classified in short-term debt as of
December 31, 2000. Management intends to replace the majority
of this short-term debt with long-term debt during 2001.
The company leases certain facilities and equipment under
capital and operating leases expiring at various dates. Most of
the operating leases contain renewal options. Rent expense
under operating leases was $99 million, $91 million and
$79 million in 2000, 1999 and 1998, respectively.
5

39
Future minimum lease payments and debt maturities
Aggregate debtmaturities
as of and for the years ended Operating and capitalDecember 31 (in millions) leases leases
2001 $ 82 $ 622002 66 502003 52 1,3361
2004 42 32005 36 2 Thereafter 70 341 Total obligations and commitments $348 1,794 Amounts representing interest,
discounts, premiums and deferredfinancing costs (10)
Total long-term debt and presentvalue of lease obligations $1,784
1. Includes approximately $1.3 billion of commercial paper and short-term notes supported by long-term credit facilities expiring in 2003.
The company maintains two revolving credit facilities, which
total $1.5 billion. Of this total, $700 million will expire in 2001
and $800 million will expire in 2003. The facilities enable
the company to borrow funds in U.S. Dollars or Euros on an
unsecured basis at variable interest rates and contain various
covenants, including a maximum debt-to-capital ratio and a
minimum interest coverage ratio. There were no borrowings
outstanding under these facilities at December 31, 2000 or 1999.
Baxter also maintains or guarantees other short-term credit
arrangements which totaled approximately $418 million at
December 31, 2000. Approximately $61 million and $93 million
of borrowings were outstanding under these facilities at
December 31, 2000 and 1999, respectively.
During 1998, a wholly-owned subsidiary of the company
entered into an $800 million revolving credit facility, which expires
in 2003 and enables the subsidiary to borrow funds at variable
interest rates. The agreement contains various covenants,
including a minimum interest coverage ratio, a maximum debt-
to-adjusted earnings ratio and a minimum adjusted net worth
amount. There were $513 million and $596 million in borrowings
outstanding under this facility at December 31, 2000 and 1999,
respectively, and they were denominated in Swiss Francs. These
borrowings are secured and guaranteed by a pledge of the
shares of the borrower and certain of its subsidiaries.
At December 31, 2000 and 1999, commercial paper and short-
term notes together totaling approximately $1.3 billion have
been classified with long-term debt as they are supported by the
long-term credit facilities discussed above, which management
intends to continue to refinance.
Financial Instruments and Risk Management
Accounts receivableIn the normal course of business, the company provides credit to
customers in the health-care industry, performs credit evaluations
of these customers and maintains reserves for potential credit
losses which, when realized, have been within the range of
management’s allowance for doubtful accounts. The allowance
for doubtful accounts was $43 million and $34 million at
December 31, 2000 and 1999, respectively.
In order to reduce its overall financing costs, the company
periodically sells its trade accounts receivable. In 2000, the
company generated net operating cash inflows of approximately
$195 million relating to such sales. Under the terms of the sales
arrangements, the company has the ability to sell certain accounts
receivable on an ongoing basis, continues to service the sold
receivables, and is subject to recourse provisions. Management
believes the company is adequately reserved with respect to the
recourse provisions. In 2000, proceeds from new sales totaled
approximately $1.5 billion and cash collections reinvested totaled
approximately $1.3 billion. The portfolio of accounts receivable
that the company services totaled approximately $590 million at
December 31, 2000. The net gains and losses recognized upon
sale of the receivables, amounts relating to the company’s servicing
of the receivables, and delinquencies were not material to the
consolidated financial statements.
Other concentrations of riskThe company invests the majority of its excess cash in certificates
of deposit or money market accounts and, where appropriate,
diversifies the concentration of cash among different financial
institutions. With respect to financial instruments, where
appropriate, the company has diversified its selection of
counterparties, and has arranged collateralization and master-
netting agreements to minimize the risk of loss.
Interest rate risk managementBaxter uses interest rate swaps generally from less than one year
to three years in duration to manage the company’s exposure to
adverse movements in interest rates. The book values of debt at
December 31, 2000 and 1999 reflect deferred hedge gains of $2
million and $11 million, respectively, offset by $2 million of
deferred hedge losses at December 31, 1999.
Foreign exchange risk managementThe company enters into various types of foreign exchange
contracts to protect the company from risks associated with the
fluctuation in currency exchange rates. The company principally
enters into foreign currency option and forward contracts, with
terms generally less than three years, to hedge firm commitments
and anticipated but not yet committed sales expected to be
6

40
denominated in foreign currencies. Deferred hedging gains on
hedges of anticipated but not yet committed sales totaled
$20 million and $7 million at December 31, 2000 and 1999,
respectively. The company also enters into foreign currency
forward agreements to hedge certain receivables and payables
denominated in foreign currencies. The company principally
hedges the following currencies: Japanese Yen, Euro, British
Pound and Swiss Franc.
The company also enters into cross-currency swap agreements,
with original maturities up to 10 years, to hedge certain of its net
investments in foreign affiliates. In conjunction with the company’s
rebalancing of its debt portfolio and in anticipation of the adoption
of SFAS No. 133, certain of such contracts were terminated in
2000, and a gain was recognized in other income. Refer to Note
10 for further information. In order to hedge certain of its net
investments in foreign affiliates in the future, the company
plans to designate a portion of its debt denominated in foreign
currencies as hedges of these net investments, as well as use
cross-currency swap agreements.
Interest rate and foreign exchange contracts
2000 1999Notional Market Notional Market
as of December 31 (in millions) amounts values amounts values
Interest rate contractsFloating to fixed rate swaps $ 100 $ – $ 300 $ 3
Average pay rate 5.1% in 2000 and 7.4% in 1999
Average receive rate 6.3% in 2000 and 5.8% in 1999
Foreign exchange contractsForwards and options used to
hedge firm commitments and anticipated sales
Japanese Yen $ 578 $ 26 $ 483 $ (1)Euro 439 12 610 15 Other currencies 69 2 34 1
Total $1,086 $ 40 $1,127 $ 15 Forwards and swaps used to
hedge net investments inforeign affiliates
Japanese Yen $ 115 $ (6) $ 315 $(113)Euro 650 (64) 2,650 175 Other currencies 68 (3) 15 –
Total $ 833 $(73) $2,980 $ 62 Forwards used to hedge certain
receivables and payables(primarily Japanese Yen, Euro and Swiss Franc) $ 21 $ 14 $ 58 $ –
Equity risk managementIn order to partially offset the potentially dilutive effect of
employee stock options, the company has entered into forward
agreements with independent third parties related to the
company’s common stock. The forward agreements require the
company to purchase its common stock from the counterparties
on specified future dates and at specified prices. The company
can, at its option, require settlement of the agreements with
shares of its common stock or, in some cases, cash, in lieu of
physical settlement. The company may, at its option, terminate
and settle these agreements early at any time before maturity.
At December 31, 2000, agreements related to approximately
2.5 million shares mature in 2001 at an average exercise price
of approximately $58 per share and agreements related to
approximately 3.7 million shares mature in 2002 at exercise
prices ranging from $70 to $78 per share. At December 31, 1999,
agreements related to approximately 7.0 million shares were
outstanding.
In connection with the company’s stock repurchase program,
during 2000 the company issued put options and purchased call
options on shares of its common stock. The put options give
the purchaser the right to sell Baxter common stock to the
company at contractually specified prices. The call options give
the company the right to purchase Baxter common stock at
contractually specified prices. The agreements were executed
with independent third parties, and the cost of the call options
was offset by the premium from the put options. The company
can, at its option, require settlement of the agreements with
shares of its common stock or, in some cases, cash, in lieu of
physical settlement. The company may, at its option, terminate
and settle these agreements at any time before maturity. In
conjunction with its stock repurchase program, the company
terminated certain of these contracts during the 2000. At
December 31, 2000, put options for approximately 1.5 million
shares of common stock and call options for approximately 1.0
million shares of common stock were outstanding. The exercise
prices of the outstanding put options were $56 per share and
the exercise prices of the outstanding call options were $62
per share. The contracts mature in 2001.
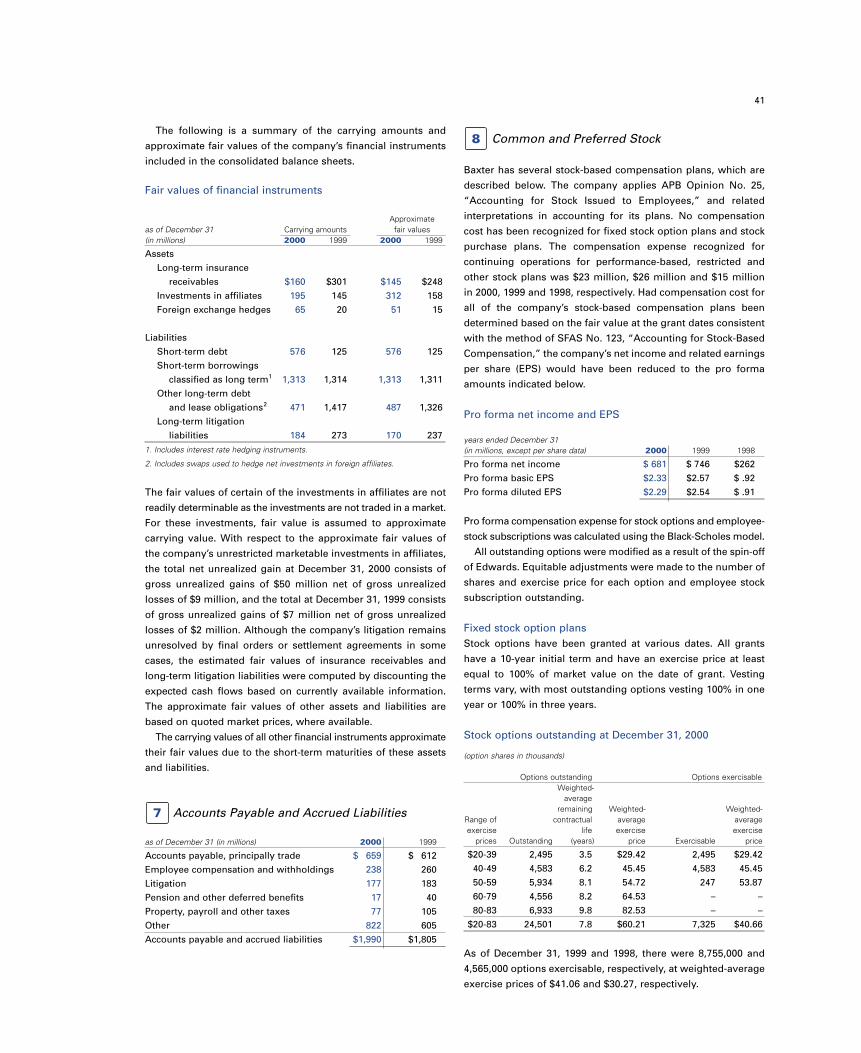
41
The following is a summary of the carrying amounts and
approximate fair values of the company’s financial instruments
included in the consolidated balance sheets.
Fair values of financial instruments
Approximate as of December 31 Carrying amounts fair values (in millions) 2000 1999 2000 1999
AssetsLong-term insurance
receivables $160 $301 $145 $248 Investments in affiliates 195 145 312 158 Foreign exchange hedges 65 20 51 15
LiabilitiesShort-term debt 576 125 576 125 Short-term borrowings
classified as long term1 1,313 1,314 1,313 1,311 Other long-term debt
and lease obligations2 471 1,417 487 1,326 Long-term litigation
liabilities 184 273 170 237 1. Includes interest rate hedging instruments.
2. Includes swaps used to hedge net investments in foreign affiliates.
The fair values of certain of the investments in affiliates are not
readily determinable as the investments are not traded in a market.
For these investments, fair value is assumed to approximate
carrying value. With respect to the approximate fair values of
the company’s unrestricted marketable investments in affiliates,
the total net unrealized gain at December 31, 2000 consists of
gross unrealized gains of $50 million net of gross unrealized
losses of $9 million, and the total at December 31, 1999 consists
of gross unrealized gains of $7 million net of gross unrealized
losses of $2 million. Although the company’s litigation remains
unresolved by final orders or settlement agreements in some
cases, the estimated fair values of insurance receivables and
long-term litigation liabilities were computed by discounting the
expected cash flows based on currently available information.
The approximate fair values of other assets and liabilities are
based on quoted market prices, where available.
The carrying values of all other financial instruments approximate
their fair values due to the short-term maturities of these assets
and liabilities.
Accounts Payable and Accrued Liabilities
as of December 31 (in millions) 2000 1999
Accounts payable, principally trade $ 659 $ 612 Employee compensation and withholdings 238 260 Litigation 177 183 Pension and other deferred benefits 17 40 Property, payroll and other taxes 77 105 Other 822 605 Accounts payable and accrued liabilities $1,990 $1,805
7
Common and Preferred Stock
Baxter has several stock-based compensation plans, which are
described below. The company applies APB Opinion No. 25,
“Accounting for Stock Issued to Employees,” and related
interpretations in accounting for its plans. No compensation
cost has been recognized for fixed stock option plans and stock
purchase plans. The compensation expense recognized for
continuing operations for performance-based, restricted and
other stock plans was $23 million, $26 million and $15 million
in 2000, 1999 and 1998, respectively. Had compensation cost for
all of the company’s stock-based compensation plans been
determined based on the fair value at the grant dates consistent
with the method of SFAS No. 123, “Accounting for Stock-Based
Compensation,” the company’s net income and related earnings
per share (EPS) would have been reduced to the pro forma
amounts indicated below.
Pro forma net income and EPS
years ended December 31(in millions, except per share data) 2000 1999 1998
Pro forma net income $ 681 $ 746 $262 Pro forma basic EPS $2.33 $2.57 $ .92 Pro forma diluted EPS $2.29 $2.54 $ .91
Pro forma compensation expense for stock options and employee-
stock subscriptions was calculated using the Black-Scholes model.
All outstanding options were modified as a result of the spin-off
of Edwards. Equitable adjustments were made to the number of
shares and exercise price for each option and employee stock
subscription outstanding.
Fixed stock option plansStock options have been granted at various dates. All grants
have a 10-year initial term and have an exercise price at least
equal to 100% of market value on the date of grant. Vesting
terms vary, with most outstanding options vesting 100% in one
year or 100% in three years.
Stock options outstanding at December 31, 2000
(option shares in thousands)
Options outstanding Options exercisable Weighted-
averageremaining Weighted- Weighted-
Range of contractual average average exercise life exercise exercise
prices Outstanding (years) price Exercisable price
$20-39 2,495 3.5 $29.42 2,495 $29.4240-49 4,583 6.2 45.45 4,583 45.4550-59 5,934 8.1 54.72 247 53.8760-79 4,556 8.2 64.53 – –80-83 6,933 9.8 82.53 – –
$20-83 24,501 7.8 $60.21 7,325 $40.66
As of December 31, 1999 and 1998, there were 8,755,000 and
4,565,000 options exercisable, respectively, at weighted-average
exercise prices of $41.06 and $30.27, respectively.
8

42
Stock option activity
Weighted- average exercise
(option shares in thousands) Shares price
Options outstanding at January 1, 1998 13,882 $39.64 Granted 4,806 59.83 Exercised (1,728) 28.69 Forfeited (587) 49.51 Options outstanding at December 31, 1998 16,373 46.37 Granted 5,013 66.73 Exercised (1,958) 39.18 Forfeited (619) 56.73 Options outstanding at December 31, 1999 18,809 52.20 Granted 9,520 75.32 Exercised (2,853) 39.47 Forfeited (1,921) 57.81 Equitable adjustment 946 – Options outstanding at December 31, 2000 24,501 $60.21
Included in the tables above are certain premium-priced
options. During 1998, approximately 470,000 premium-priced
stock options were granted with a weighted-average exercise
price of $73 and a weighted-average fair value of approximately
$13 per option. During 1996, approximately 2.5 million premium-
stock options were granted with an exercise price of $49 and a
weighted-average fair value of approximately $11 per option. All
of such options granted in 1998 and 1.4 million of such options
granted in 1996 are outstanding at December 31, 2000.
Pro forma compensation expense was calculated with the
following weighted-average assumptions for grants in 2000,
1999 and 1998, respectively: dividend yield of 1.25%, 1.5% and
1.5%; expected life of six years for all periods; expected volatility
of 31%, 29% and 29%; and risk-free interest rates of 6.1%, 5.4%
and 5.3%. The weighted-average fair value of options granted
during the year were $27.49, $22.59 and $18.58 in 2000, 1999
and 1998, respectively.
Employees of Edwards were required to exercise any vested
options within 90 days from the date of spin-off, which occurred
on March 31, 2000. All unvested options were canceled 90 days
after the date of spin-off.
Employee stock purchase plansThe company has employee stock purchase plans whereby it is
authorized, as of December 31, 2000, to issue up to 10 million
shares of common stock to its employees, nearly all of whom
are eligible to participate. The purchase price is the lower of 85
percent of the closing market price on the date of subscription
or 85 percent of the closing market price as defined by the plans.
The total subscription amount for each participant cannot exceed
25 percent of current annual pay. Under the plans, the company
sold 1,387,022 and 777,618 and 810,855 shares to employees in
2000, 1999 and 1998, respectively. Pro forma compensation
expense was estimated with the following weighted-average
assumptions for 2000, 1999 and 1998, respectively: dividend yield
of 1.4%, 1.5% and 1.5%: expected volatility of 33% for all periods,
and risk-free interest rates of 6.2%, 5.4% and 4.4%. The weighted-
average fair value of those purchase rights granted in 2000, 1999
and 1998 was $22.98, $20.09 and $15.16, respectively.
Restricted stock and performance-share plansThe long-term incentive plan includes both stock options
and restricted stock. Under the plan, grants of restricted stock
are generally made annually and are earned based on the
achievement of financial performance targets. The restricted
stock component of the long-term incentive plan is being
eliminated effective in 2001 and, instead, a greater number of
stock options will be granted to participants in the plan with
terms and conditions similar to existing stock option plans.
The year 2000 was a transition year whereby most participants
in the plan elected to receive incremental stock options and
were no longer eligible to earn restricted stock. The number of
stock options granted pursuant to the revised plan is based on
the achievement of financial performance objectives.
The company also has other incentive compensation plans
whereby grants of restricted stock and performance shares are
made to key employees and non-employee directors. At
December 31, 2000, approximately 84,000 shares of stock were
subject to restrictions, the majority of which lapse in 2001 and
2002. During 2000, 1999 and 1998, approximately 249,500,
542,500 and 242,700 shares, respectively, of restricted stock and
performance shares were granted at weighted-average grant-date
fair values of $65.75, $63.99 and $58.74 per share, respectively.
The majority of the restricted stock granted in 2000 was forfeited
pursuant to the long-term incentive plan transition discussed above.
Shared Investment PlanIn 1999, the company sold approximately 3.1 million shares
of the company’s common stock to 142 of Baxter’s senior
managers for approximately $198 million in cash. This plan
directly aligns management and shareholder interests. The
Baxter managers used full-recourse personal bank loans to
purchase the stock at the May 3, 1999 closing price of $63.63.
Baxter has agreed to guarantee repayment to the banks in the
event of default by a participant in the plan. The total outstanding
participant loan amount at December 31, 2000 was $188 million.
Stock repurchase programsIn November 1995, the company’s board of directors authorized
the repurchase of up to $500 million of common stock over a
period of several years, all of which was repurchased by early
2000. In November 1999, the board of directors authorized the
repurchase of an additional $500 million over a period of several
years, of which approximately two-thirds has been repurchased
as of December 31, 2000.
OtherApproximately 100 million shares of no par value preferred
stock are authorized for issuance in series with varying terms
as determined by the board of directors.

43
In March 1999, common stockholders received a dividend of
one preferred stock purchase right (collectively, the Rights) for
each share of common stock. These Rights replaced similar
rights that expired in March 1999. The Rights may become
exercisable at a specified time after (1) a person or group
acquires 15 percent or more of the company’s common stock or
(2) a tender or exchange offer for 15 percent or more of the
company’s common stock. Once exercisable, the holder of each
Right is entitled to purchase, upon payment of the exercise
price, shares of the company’s common stock having a market
value equal to two times the exercise price of the Rights. The
Rights have a current exercise price of $275. The Rights expire
on March 23, 2009, unless earlier redeemed by the company
under certain circumstances at a price of $0.01 per Right.
Retirement and Other Benefit Programs
The company sponsors several qualified and nonqualified pension
plans for its employees. The company also sponsors certain
unfunded contributory health-care and life insurance benefits
for substantially all domestic retired employees.
Reconciliation of plans’ benefit obligations, assets and funded status
as of and for the years Pension benefits Other benefitsended December 31 (in millions) 2000 1999 2000 1999
Benefit obligations Beginning of year $1,344 $1,427 $ 175 $ 200 Service cost 41 48 3 3 Interest cost 113 102 14 12 Participant contributions 2 2 3 3 Actuarial loss (gain) 147 (148) 35 (30)Acquisitions (divestitures), net (10) 1 – – Curtailments and settlements (10) (7) – (3)Benefit payments (78) (76) (11) (11)Currency exchange-rate
changes and other 6 (5) – 1 End of year 1,555 1,344 219 175 Fair value of plan assetsBeginning of year 1,724 1,472 – – Actual return on plan assets 173 302 – – Employer contributions 19 13 8 8 Participant contributions 2 2 3 3 Acquisitions (divestitures), net (8) 11 – – Curtailments and settlements (11) – – –Benefit payments (78) (76) (11) (11)Currency exchange-rate
changes and other (14) – – – End of year 1,807 1,724 – – Funded statusFunded status at December 31 252 380 (219) (175)Unrecognized
transition obligation 4 9 – – Unrecognized net gains (252) (390) (56) (98)Unrecognized prior-service cost – (3) – – Net amount recognized $ 4 $ (4) $(275) $(273)Prepaid benefit cost $ 143 $ 121 $ – $ – Accrued benefit liability (139) (125) (275) (273)Net amount recognized $ 4 $ (4) $(275) $(273)
9
Assets held by the trusts of the plans consist primarily of equity
securities. The accumulated benefit obligation is in excess of
plan assets for certain of the company’s pension plans. The
projected benefit obligation, accumulated benefit obligation,
and fair value of plan assets for these plans was $159 million,
$142 million and $17 million, respectively, at December 31, 2000,
and $140 million, $128 million and $23 million, respectively, at
December 31, 1999.
Net periodic benefit cost
years ended December 31 (in millions) 2000 1999 1998
Pension benefitsService cost $41 $48 $41 Interest cost 113 102 96 Expected return on plan assets (159) (133) (117)Amortization of prior service cost – 1 1Amortization of transition obligation 5 6 6 Net periodic pension benefit cost $ – $24 $27
Other benefitsService cost $ 3 $ 3 $ 3 Interest cost 14 12 14 Recognized actuarial gain (7) (7) (6)Net periodic other benefit cost $10 $ 8 $11
The net periodic benefit cost amounts principally pertain to continuing operations.
Assumptions used in determining benefit obligations
Pension benefits Other benefits2000 1999 2000 1999
Discount rateU.S. and Puerto Rico plans 7.75% 8.25% 7.75% 8.25% International plans (average) 5.8% 5.7% n/a n/a
Expected return on plan assetsU.S. and Puerto Rico plans 11.0% 10.5% n/a n/a International plans (average) 8.1% 6.9% n/a n/a
Rate of compensation increaseU.S. and Puerto Rico plans 4.5% 4.5% n/a n/a International plans (average) 4.0% 4.1% n/a n/a
Annual rate of increase in theper-capita cost n/a n/a 7.5% 7.5% Rate decreased to n/a n/a 5.5% 5.5% by the year ended n/a n/a 2003 2002
Effect of a one-percent change in assumed health-care cost trend rate
One percent One percentincrease decrease
(in millions) 2000 1999 2000 1999
Effect on total of service andinterest cost components $ 3 $ 2 $ 2 $ 2
Effect on postretirementbenefit obligation $29 $21 $24 $18
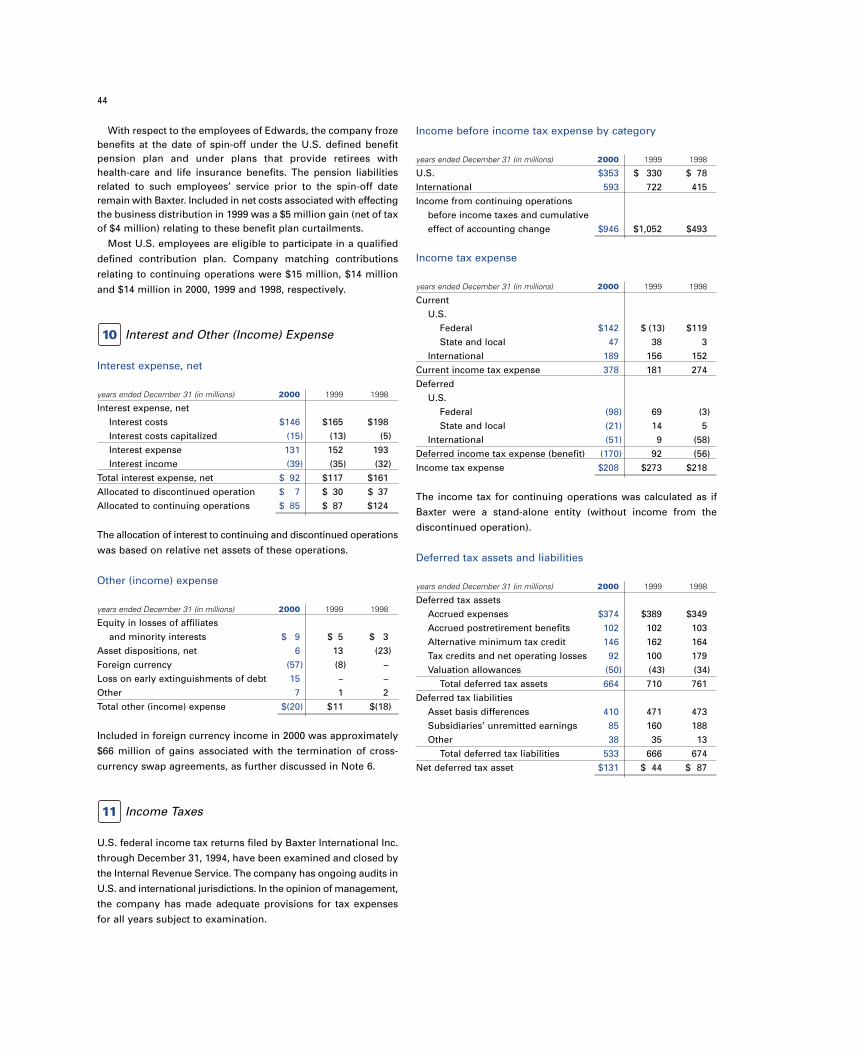
44
With respect to the employees of Edwards, the company frozebenefits at the date of spin-off under the U.S. defined benefitpension plan and under plans that provide retirees with health-care and life insurance benefits. The pension liabilitiesrelated to such employees’ service prior to the spin-off dateremain with Baxter. Included in net costs associated with effectingthe business distribution in 1999 was a $5 million gain (net of taxof $4 million) relating to these benefit plan curtailments.
Most U.S. employees are eligible to participate in a qualified
defined contribution plan. Company matching contributions
relating to continuing operations were $15 million, $14 million
and $14 million in 2000, 1999 and 1998, respectively.
Interest and Other (Income) Expense
Interest expense, net
years ended December 31 (in millions) 2000 1999 1998
Interest expense, netInterest costs $146 $165 $198 Interest costs capitalized (15) (13) (5)Interest expense 131 152 193 Interest income (39) (35) (32)
Total interest expense, net $ 92 $117 $161 Allocated to discontinued operation $ 7 $ 30 $ 37 Allocated to continuing operations $ 85 $ 87 $124
The allocation of interest to continuing and discontinued operations
was based on relative net assets of these operations.
Other (income) expense
years ended December 31 (in millions) 2000 1999 1998
Equity in losses of affiliates and minority interests $ 9 $ 5 $ 3
Asset dispositions, net 6 13 (23)Foreign currency (57) (8) – Loss on early extinguishments of debt 15 – –Other 7 1 2 Total other (income) expense $(20) $11 $(18)
Included in foreign currency income in 2000 was approximately
$66 million of gains associated with the termination of cross-
currency swap agreements, as further discussed in Note 6.
Income Taxes
U.S. federal income tax returns filed by Baxter International Inc.
through December 31, 1994, have been examined and closed by
the Internal Revenue Service. The company has ongoing audits in
U.S. and international jurisdictions. In the opinion of management,
the company has made adequate provisions for tax expenses
for all years subject to examination.
11
10
Income before income tax expense by category
years ended December 31 (in millions) 2000 1999 1998
U.S. $353 $ 330 $ 78 International 593 722 415 Income from continuing operations
before income taxes and cumulativeeffect of accounting change $946 $1,052 $493
Income tax expense
years ended December 31 (in millions) 2000 1999 1998
CurrentU.S.
Federal $142 $ (13) $119 State and local 47 38 3
International 189 156 152 Current income tax expense 378 181 274 Deferred
U.S.Federal (98) 69 (3)State and local (21) 14 5
International (51) 9 (58)Deferred income tax expense (benefit) (170) 92 (56)Income tax expense $208 $273 $218
The income tax for continuing operations was calculated as if
Baxter were a stand-alone entity (without income from the
discontinued operation).
Deferred tax assets and liabilities
years ended December 31 (in millions) 2000 1999 1998
Deferred tax assetsAccrued expenses $374 $389 $349 Accrued postretirement benefits 102 102 103 Alternative minimum tax credit 146 162 164 Tax credits and net operating losses 92 100 179 Valuation allowances (50) (43) (34)
Total deferred tax assets 664 710 761 Deferred tax liabilities
Asset basis differences 410 471 473 Subsidiaries’ unremitted earnings 85 160 188 Other 38 35 13
Total deferred tax liabilities 533 666 674 Net deferred tax asset $131 $ 44 $ 87
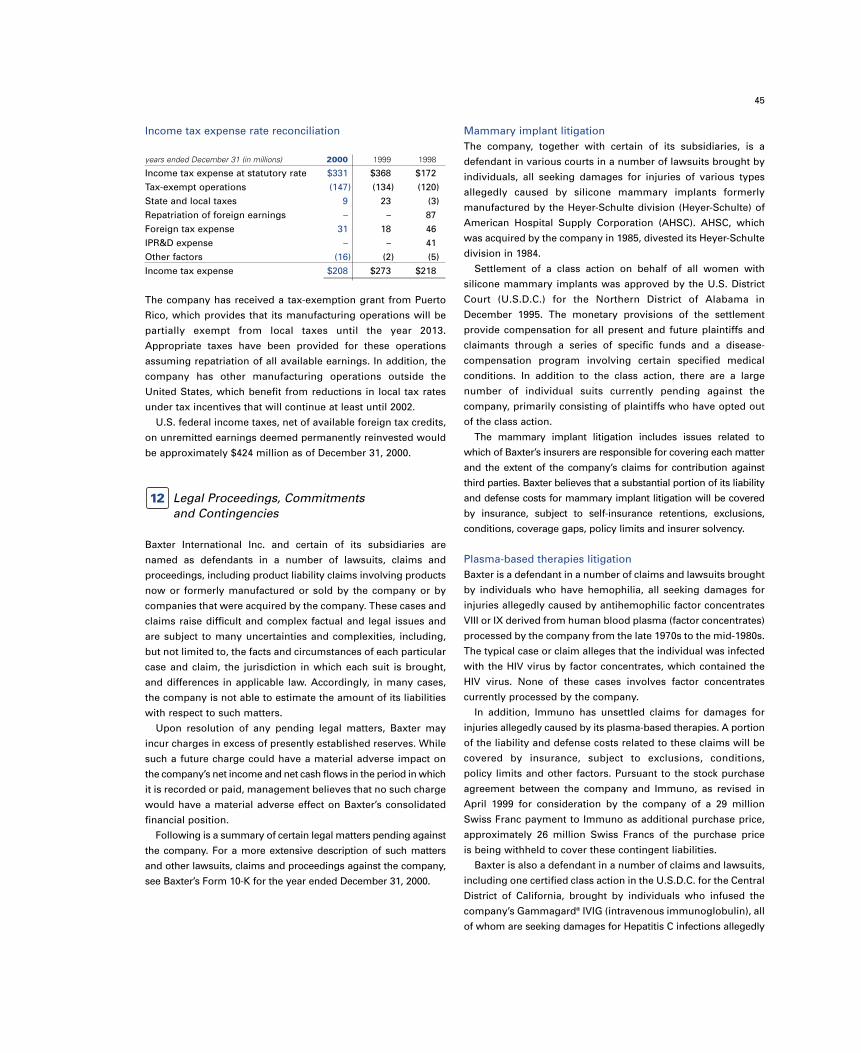
45
Income tax expense rate reconciliation
years ended December 31 (in millions) 2000 1999 1998
Income tax expense at statutory rate $331 $368 $172 Tax-exempt operations (147) (134) (120)State and local taxes 9 23 (3)Repatriation of foreign earnings – – 87 Foreign tax expense 31 18 46 IPR&D expense – – 41 Other factors (16) (2) (5)Income tax expense $208 $273 $218
The company has received a tax-exemption grant from Puerto
Rico, which provides that its manufacturing operations will be
partially exempt from local taxes until the year 2013.
Appropriate taxes have been provided for these operations
assuming repatriation of all available earnings. In addition, the
company has other manufacturing operations outside the
United States, which benefit from reductions in local tax rates
under tax incentives that will continue at least until 2002.
U.S. federal income taxes, net of available foreign tax credits,
on unremitted earnings deemed permanently reinvested would
be approximately $424 million as of December 31, 2000.
Legal Proceedings, Commitments and Contingencies
Baxter International Inc. and certain of its subsidiaries are
named as defendants in a number of lawsuits, claims and
proceedings, including product liability claims involving products
now or formerly manufactured or sold by the company or by
companies that were acquired by the company. These cases and
claims raise difficult and complex factual and legal issues and
are subject to many uncertainties and complexities, including,
but not limited to, the facts and circumstances of each particular
case and claim, the jurisdiction in which each suit is brought,
and differences in applicable law. Accordingly, in many cases,
the company is not able to estimate the amount of its liabilities
with respect to such matters.
Upon resolution of any pending legal matters, Baxter may
incur charges in excess of presently established reserves. While
such a future charge could have a material adverse impact on
the company’s net income and net cash flows in the period in which
it is recorded or paid, management believes that no such charge
would have a material adverse effect on Baxter’s consolidated
financial position.
Following is a summary of certain legal matters pending against
the company. For a more extensive description of such matters
and other lawsuits, claims and proceedings against the company,
see Baxter’s Form 10-K for the year ended December 31, 2000.
12
Mammary implant litigationThe company, together with certain of its subsidiaries, is a
defendant in various courts in a number of lawsuits brought by
individuals, all seeking damages for injuries of various types
allegedly caused by silicone mammary implants formerly
manufactured by the Heyer-Schulte division (Heyer-Schulte) of
American Hospital Supply Corporation (AHSC). AHSC, which
was acquired by the company in 1985, divested its Heyer-Schulte
division in 1984.
Settlement of a class action on behalf of all women with
silicone mammary implants was approved by the U.S. District
Court (U.S.D.C.) for the Northern District of Alabama in
December 1995. The monetary provisions of the settlement
provide compensation for all present and future plaintiffs and
claimants through a series of specific funds and a disease-
compensation program involving certain specified medical
conditions. In addition to the class action, there are a large
number of individual suits currently pending against the
company, primarily consisting of plaintiffs who have opted out
of the class action.
The mammary implant litigation includes issues related to
which of Baxter’s insurers are responsible for covering each matter
and the extent of the company’s claims for contribution against
third parties. Baxter believes that a substantial portion of its liability
and defense costs for mammary implant litigation will be covered
by insurance, subject to self-insurance retentions, exclusions,
conditions, coverage gaps, policy limits and insurer solvency.
Plasma-based therapies litigationBaxter is a defendant in a number of claims and lawsuits brought
by individuals who have hemophilia, all seeking damages for
injuries allegedly caused by antihemophilic factor concentrates
VIII or IX derived from human blood plasma (factor concentrates)
processed by the company from the late 1970s to the mid-1980s.
The typical case or claim alleges that the individual was infected
with the HIV virus by factor concentrates, which contained the
HIV virus. None of these cases involves factor concentrates
currently processed by the company.
In addition, Immuno has unsettled claims for damages for
injuries allegedly caused by its plasma-based therapies. A portion
of the liability and defense costs related to these claims will be
covered by insurance, subject to exclusions, conditions,
policy limits and other factors. Pursuant to the stock purchase
agreement between the company and Immuno, as revised in
April 1999 for consideration by the company of a 29 million
Swiss Franc payment to Immuno as additional purchase price,
approximately 26 million Swiss Francs of the purchase price
is being withheld to cover these contingent liabilities.
Baxter is also a defendant in a number of claims and lawsuits,
including one certified class action in the U.S.D.C. for the Central
District of California, brought by individuals who infused the
company’s Gammagard® IVIG (intravenous immunoglobulin), all
of whom are seeking damages for Hepatitis C infections allegedly
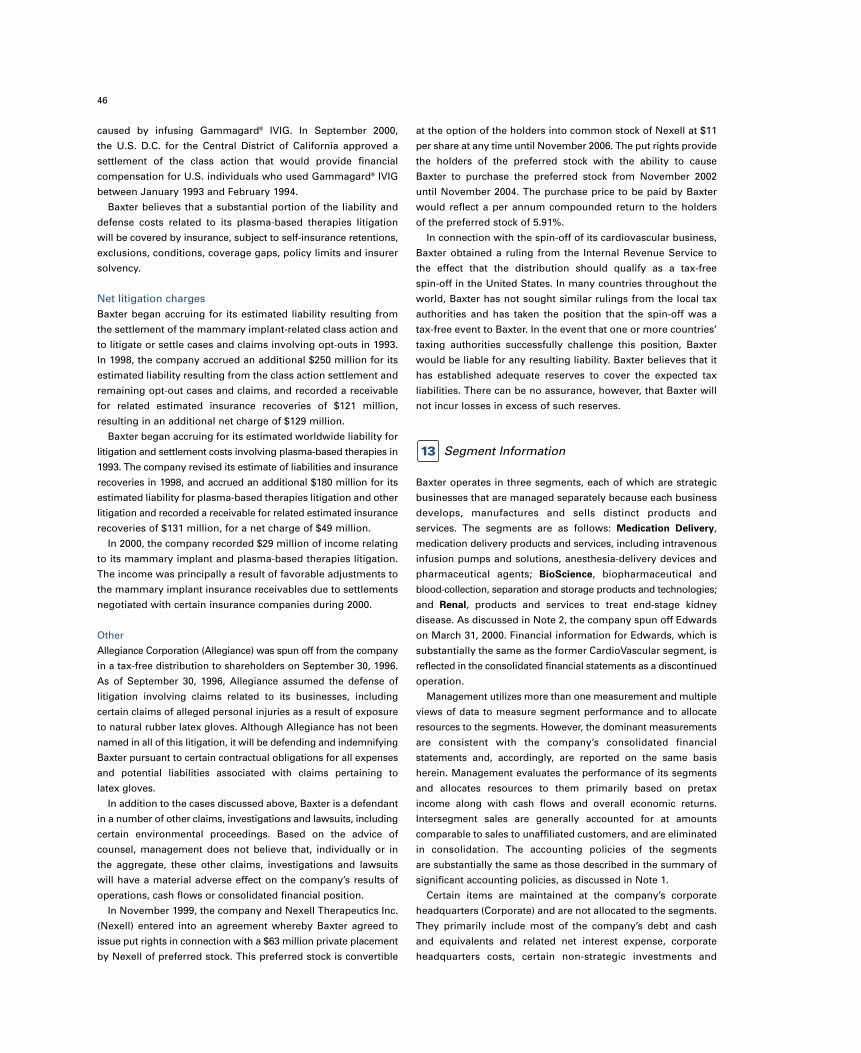
46
caused by infusing Gammagard® IVIG. In September 2000,
the U.S. D.C. for the Central District of California approved a
settlement of the class action that would provide financial
compensation for U.S. individuals who used Gammagard® IVIG
between January 1993 and February 1994.
Baxter believes that a substantial portion of the liability and
defense costs related to its plasma-based therapies litigation
will be covered by insurance, subject to self-insurance retentions,
exclusions, conditions, coverage gaps, policy limits and insurer
solvency.
Net litigation chargesBaxter began accruing for its estimated liability resulting from
the settlement of the mammary implant-related class action and
to litigate or settle cases and claims involving opt-outs in 1993.
In 1998, the company accrued an additional $250 million for its
estimated liability resulting from the class action settlement and
remaining opt-out cases and claims, and recorded a receivable
for related estimated insurance recoveries of $121 million,
resulting in an additional net charge of $129 million.
Baxter began accruing for its estimated worldwide liability for
litigation and settlement costs involving plasma-based therapies in
1993. The company revised its estimate of liabilities and insurance
recoveries in 1998, and accrued an additional $180 million for its
estimated liability for plasma-based therapies litigation and other
litigation and recorded a receivable for related estimated insurance
recoveries of $131 million, for a net charge of $49 million.
In 2000, the company recorded $29 million of income relating
to its mammary implant and plasma-based therapies litigation.
The income was principally a result of favorable adjustments to
the mammary implant insurance receivables due to settlements
negotiated with certain insurance companies during 2000.
Other
Allegiance Corporation (Allegiance) was spun off from the company
in a tax-free distribution to shareholders on September 30, 1996.
As of September 30, 1996, Allegiance assumed the defense of
litigation involving claims related to its businesses, including
certain claims of alleged personal injuries as a result of exposure
to natural rubber latex gloves. Although Allegiance has not been
named in all of this litigation, it will be defending and indemnifying
Baxter pursuant to certain contractual obligations for all expenses
and potential liabilities associated with claims pertaining to
latex gloves.
In addition to the cases discussed above, Baxter is a defendant
in a number of other claims, investigations and lawsuits, including
certain environmental proceedings. Based on the advice of
counsel, management does not believe that, individually or in
the aggregate, these other claims, investigations and lawsuits
will have a material adverse effect on the company’s results of
operations, cash flows or consolidated financial position.
In November 1999, the company and Nexell Therapeutics Inc.
(Nexell) entered into an agreement whereby Baxter agreed to
issue put rights in connection with a $63 million private placement
by Nexell of preferred stock. This preferred stock is convertible
at the option of the holders into common stock of Nexell at $11
per share at any time until November 2006. The put rights provide
the holders of the preferred stock with the ability to cause
Baxter to purchase the preferred stock from November 2002
until November 2004. The purchase price to be paid by Baxter
would reflect a per annum compounded return to the holders
of the preferred stock of 5.91%.
In connection with the spin-off of its cardiovascular business,
Baxter obtained a ruling from the Internal Revenue Service to
the effect that the distribution should qualify as a tax-free
spin-off in the United States. In many countries throughout the
world, Baxter has not sought similar rulings from the local tax
authorities and has taken the position that the spin-off was a
tax-free event to Baxter. In the event that one or more countries’
taxing authorities successfully challenge this position, Baxter
would be liable for any resulting liability. Baxter believes that it
has established adequate reserves to cover the expected tax
liabilities. There can be no assurance, however, that Baxter will
not incur losses in excess of such reserves.
Segment Information
Baxter operates in three segments, each of which are strategic
businesses that are managed separately because each business
develops, manufactures and sells distinct products and
services. The segments are as follows: Medication Delivery,
medication delivery products and services, including intravenous
infusion pumps and solutions, anesthesia-delivery devices and
pharmaceutical agents; BioScience, biopharmaceutical and
blood-collection, separation and storage products and technologies;
and Renal, products and services to treat end-stage kidney
disease. As discussed in Note 2, the company spun off Edwards
on March 31, 2000. Financial information for Edwards, which is
substantially the same as the former CardioVascular segment, is
reflected in the consolidated financial statements as a discontinued
operation.
Management utilizes more than one measurement and multiple
views of data to measure segment performance and to allocate
resources to the segments. However, the dominant measurements
are consistent with the company’s consolidated financial
statements and, accordingly, are reported on the same basis
herein. Management evaluates the performance of its segments
and allocates resources to them primarily based on pretax
income along with cash flows and overall economic returns.
Intersegment sales are generally accounted for at amounts
comparable to sales to unaffiliated customers, and are eliminated
in consolidation. The accounting policies of the segments
are substantially the same as those described in the summary of
significant accounting policies, as discussed in Note 1.
Certain items are maintained at the company’s corporate
headquarters (Corporate) and are not allocated to the segments.
They primarily include most of the company’s debt and cash
and equivalents and related net interest expense, corporate
headquarters costs, certain non-strategic investments and
13
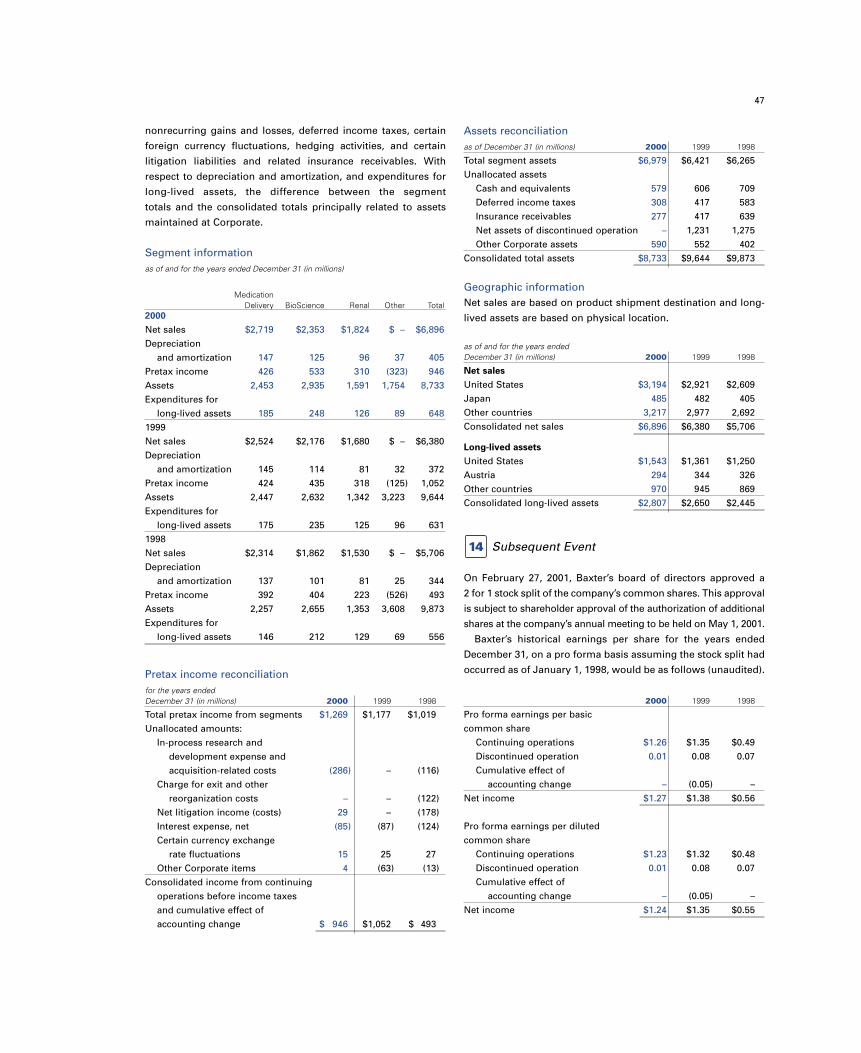
47
nonrecurring gains and losses, deferred income taxes, certain
foreign currency fluctuations, hedging activities, and certain
litigation liabilities and related insurance receivables. With
respect to depreciation and amortization, and expenditures for
long-lived assets, the difference between the segment
totals and the consolidated totals principally related to assets
maintained at Corporate.
Segment informationas of and for the years ended December 31 (in millions)
MedicationDelivery BioScience Renal Other Total
2000Net sales $2,719 $2,353 $1,824 $ – $6,896Depreciation
and amortization 147 125 96 37 405Pretax income 426 533 310 (323) 946Assets 2,453 2,935 1,591 1,754 8,733Expenditures for
long-lived assets 185 248 126 89 6481999Net sales $2,524 $2,176 $1,680 $ – $6,380 Depreciation
and amortization 145 114 81 32 372 Pretax income 424 435 318 (125) 1,052 Assets 2,447 2,632 1,342 3,223 9,644 Expenditures for
long-lived assets 175 235 125 96 631 1998Net sales $2,314 $1,862 $1,530 $ – $5,706 Depreciation
and amortization 137 101 81 25 344 Pretax income 392 404 223 (526) 493 Assets 2,257 2,655 1,353 3,608 9,873 Expenditures for
long-lived assets 146 212 129 69 556
Pretax income reconciliationfor the years endedDecember 31 (in millions) 2000 1999 1998
Total pretax income from segments $1,269 $1,177 $1,019 Unallocated amounts:
In-process research and development expense andacquisition-related costs (286) – (116)
Charge for exit and otherreorganization costs – – (122)
Net litigation income (costs) 29 – (178)Interest expense, net (85) (87) (124)Certain currency exchange
rate fluctuations 15 25 27 Other Corporate items 4 (63) (13)
Consolidated income from continuingoperations before income taxes and cumulative effect of accounting change $ 946 $1,052 $ 493
Assets reconciliationas of December 31 (in millions) 2000 1999 1998
Total segment assets $6,979 $6,421 $6,265 Unallocated assets
Cash and equivalents 579 606 709 Deferred income taxes 308 417 583 Insurance receivables 277 417 639 Net assets of discontinued operation – 1,231 1,275 Other Corporate assets 590 552 402
Consolidated total assets $8,733 $9,644 $9,873
Geographic informationNet sales are based on product shipment destination and long-
lived assets are based on physical location.
as of and for the years endedDecember 31 (in millions) 2000 1999 1998
Net salesUnited States $3,194 $2,921 $2,609 Japan 485 482 405 Other countries 3,217 2,977 2,692 Consolidated net sales $6,896 $6,380 $5,706
Long-lived assetsUnited States $1,543 $1,361 $1,250 Austria 294 344 326 Other countries 970 945 869 Consolidated long-lived assets $2,807 $2,650 $2,445
Subsequent Event
On February 27, 2001, Baxter’s board of directors approved a
2 for 1 stock split of the company’s common shares. This approval
is subject to shareholder approval of the authorization of additional
shares at the company’s annual meeting to be held on May 1, 2001.
Baxter’s historical earnings per share for the years ended
December 31, on a pro forma basis assuming the stock split had
occurred as of January 1, 1998, would be as follows (unaudited).
2000 1999 1998
Pro forma earnings per basic common share
Continuing operations $1.26 $1.35 $0.49Discontinued operation 0.01 0.08 0.07Cumulative effect of
accounting change – (0.05) –Net income $1.27 $1.38 $0.56
Pro forma earnings per diluted common share
Continuing operations $1.23 $1.32 $0.48Discontinued operation 0.01 0.08 0.07Cumulative effect of
accounting change – (0.05) –Net income $1.24 $1.35 $0.55
14

48
Quarterly Financial Results and Market for the Company’s Stock (Unaudited)
First Second Third Fourth Total years ended December 31 (in millions, except per share data) quarter quarter quarter quarter year
2000Net sales $1,583 $1,694 $1,687 $1,932 $6,896Gross profit 687 747 762 867 3,063 Income from continuing operations1 191 46 231 270 738Net income1 191 48 231 270 740Per common share
Income from continuing operations1
Basic .66 .15 .78 .92 2.52 Diluted .65 .15 .77 .90 2.47
Net income1
Basic .66 .16 .78 .92 2.53Diluted .65 .16 .77 .90 2.48
Dividends declared – – – 1.164 1.164Market price
High 67.56 72.00 84.75 88.62 88.62Low 51.81 56.44 69.50 75.75 51.81
1999Net sales $1,462 $1,560 $1,589 $1,769 $6,380 Gross profit 625 690 713 784 2,812 Income from continuing operations before cumulative
effect of accounting change 162 189 197 231 779 Net income2 151 207 210 229 797 Per common share
Income from continuing operations before cumulative effect of accounting change
Basic .56 .65 .67 .80 2.69 Diluted .55 .64 .67 .78 2.64
Net income2
Basic .53 .71 .72 .79 2.75 Diluted .52 .70 .71 .77 2.70
Dividends declared .2910 .2910 .2910 .2910 1.164 Market price
High 75.94 68.63 70.75 68.75 75.94 Low 62.56 60.38 58.69 59.31 58.69
1. The second quarter of 2000 includes a $286 million charge for in-process research and development and acquisition-related costs. The fourth quarter of 2000 includes income of $29 million relating to litigation.
2. The first quarter of 1999 includes a $27 million charge for the cumulative effect of an accounting change. The fourth quarter of 1999 includes a $19 million in net costs associated with effecting the distribution of the cardiovascular business.
Baxter common stock is listed on the New York, Chicago and Pacific Stock Exchanges, on the London Stock Exchange and on the
Swiss stock exchanges of Zurich, Basel and Geneva. The New York Stock Exchange is the principal market on which the company’s
common stock is traded. At January 31, 2001, there were approximately 58,800 holders of record of the company’s common stock.
15
49
Board of Directors
Walter E. BoomerPresident and Chief Executive OfficerRogers Corporation
Pei-yuan ChiaRetired Vice ChairmanCiticorp and Citibank, N.A.
John W. CollotonDirector EmeritusUniversity of Iowa Hospitals & Clinics
Susan CrownVice President Henry Crown and Company
Brian D. FinnPartner Clayton, Dubilier & Rice, Inc.
Frank R. FrameRetired Deputy ChairmanThe Hongkong and ShanghaiBanking Corporation Limited
Martha R. IngramChairman of the Board Ingram Industries Inc.
Harry M. Jansen Kraemer, Jr.Chairman andChief Executive OfficerBaxter International Inc.
Arnold J. Levine, Ph.D.PresidentThe Rockefeller University
Thomas T. StallkampVice Chairman and Chief Executive OfficerMSX International
Monroe E. Trout, M.D.Chairman of the BoardCytyc Corporation
Fred L. TurnerSenior ChairmanMcDonald's Corporation
Honorary Director
William B. GrahamChairman Emeritus of the BoardBaxter International Inc.
Executive Officers
Baxter International Inc.
Brian P. Anderson 1,2
Senior Vice President and Chief Financial Officer
Timothy B. Anderson 1,2
Group Vice PresidentCorporate Strategy andDevelopment
Neville J. JeharajahCorporate Vice President Investor Relations andFinancial Planning
Harry M. Jansen Kraemer, Jr. 1,2
Chairman and Chief Executive Officer
Karen J. MayCorporate Vice President Human Resources
Steven J. Meyer 1,2
Treasurer
J. Robert HurleyCorporate Vice President Integration Management
John L. QuickCorporate Vice PresidentQuality/Regulatory
Jan Stern Reed 1,2
Corporate Secretary andAssociate General Counsel
Thomas J. Sabatino, Jr. 1,2
Corporate Vice Presidentand General Counsel
Michael J. TuckerSenior Vice PresidentHuman Resources andCommunications
Baxter World Trade Corporation
Eric A. BeardCorporate Vice President and President– Europe, Africaand Middle East
Carlos del SaltoSenior Vice PresidentIntercontinental / Asia and President–Latin America
Thomas H. Glanzmann 1
Corporate Vice President and President–Hyland Immuno
Baxter Healthcare Corporation
David F. DrohanCorporate Vice President andPresident–Medication Delivery
J. Michael GatlingCorporate Vice PresidentGlobal ManufacturingOperations
Alan L. Heller 2
Group Vice President and President–Global Renal
David C. McKee 2
Corporate Vice President and Deputy General Counsel
Gregory P. YoungCorporate Vice President and President–Fenwal
1. Also an executive officer of Baxter Healthcare Corporation
2. Also an executive officer of Baxter World Trade Corporation
As of February 28, 2001
Directors and Executive Officers

50
Corporate Headquarters
Baxter International Inc.One Baxter ParkwayDeerfield, IL 60015-4633Telephone: (847) 948-2000Internet: www.baxter.com
Stock Exchange Listings
Ticker Symbols: BAX, BXL, baxBaxter common stock is listed on the New York, Chicago and Pacific Stock Exchanges, on the London Stock Exchangeand on the SWX Swiss Exchange. The New York StockExchange is the principal market on which the company’s common stock is traded.
Annual Meeting
The 2001 Annual Meeting of Shareholders will be held on Tuesday, May 1, at 10:30 a.m. at the Drury Lane Theatre in Oakbrook Terrace, Illinois.
Stock Transfer Agent
Correspondence concerning Baxter International stock holdings,lost or missing certificates or dividend checks, duplicate mailingsor changes of address should be directed to:
EquiserveP.O. Box 2500Jersey City, NJ 07303-2500
Telephone: (800) 446.2617 / (201) 324-0498Internet: www.equiserve.com
Correspondence concerning Baxter International ContingentPayment Rights related to the acquisition of Somatogen, Inc.should be directed to:
U.S. Bank Trust National AssociationTelephone: (800) 934-6802 / (312) 228-9455
Dividend Reinvestment
The company offers an automatic dividend-reinvestment program to all holders of Baxter International Inc. commonstock. A detailed brochure is available upon request from:
EquiserveP.O. Box 2598Jersey City, NJ 07303-2598
Telephone: (800) 446-2617 / (201) 324-0498Internet: www.equiserve.com
Information Resources
Internetwww.baxter.com
Please visit our Internet site for:
• General company information• Corporate news or earnings releases• Annual report• Form 10-Q• Form 10-K• Proxy statement• Annual environmental report
Shareholders may elect to receive future proxy materials and annual reports on-line via the Internet instead of receivingthem by mail. To sign up for this service, please go tohttp://www.econsent.com/bax. When the next proxy materialsand annual reports are distributed, you will be supplied with aproxy control number and a link to the Web site where you cancast your proxy vote on-line. Once you provide your consentto receive electronic delivery of proxy materials via the Internet,your consent will remain in effect until you revoke it.
Shareholders also may access personal account information on-line via the Internet by visiting www.equiserve.com andselecting the “Account Access” menu.
Investor Relations
Securities analysts, investment professionals and investorsseeking additional investor information should contact:
Baxter Investor Relations Telephone: (847) 948-4551
Customer Inquiries / General Information
Customers who would like general information about Baxter’s products and services may call the Center for One Baxter toll free in the United States at (800) 422-9837,or by dialing (847) 948-4770.
© Baxter International Inc., 2001. All rights reserved.
References in this report to Baxter are intended to refer collectively to Baxter International Inc. and its U.S. and international subsidiaries and their operating divisions.
Aurora, Colleague, Extraneal, Ipump, Meridian, NeisVac-C, Physioneal,Recombinate, Tina and Tisseel are trademarks of Baxter InternationalInc., its subsidiaries or affiliates.
PSA 4000 is a trademark of Physiometrix Inc.
AGGRASTAT is a trademark of Merck & Co.
Baxter would like to thank Cornerstone Medical in Wheaton, Illinois, for the use of its facility in taking the photo that appears on the cover of this report.
Design / Paragraphs Design Inc., Chicago
Printing / George Rice & Sons, Los Angeles
C Printed on Recycled Paper
Company Information
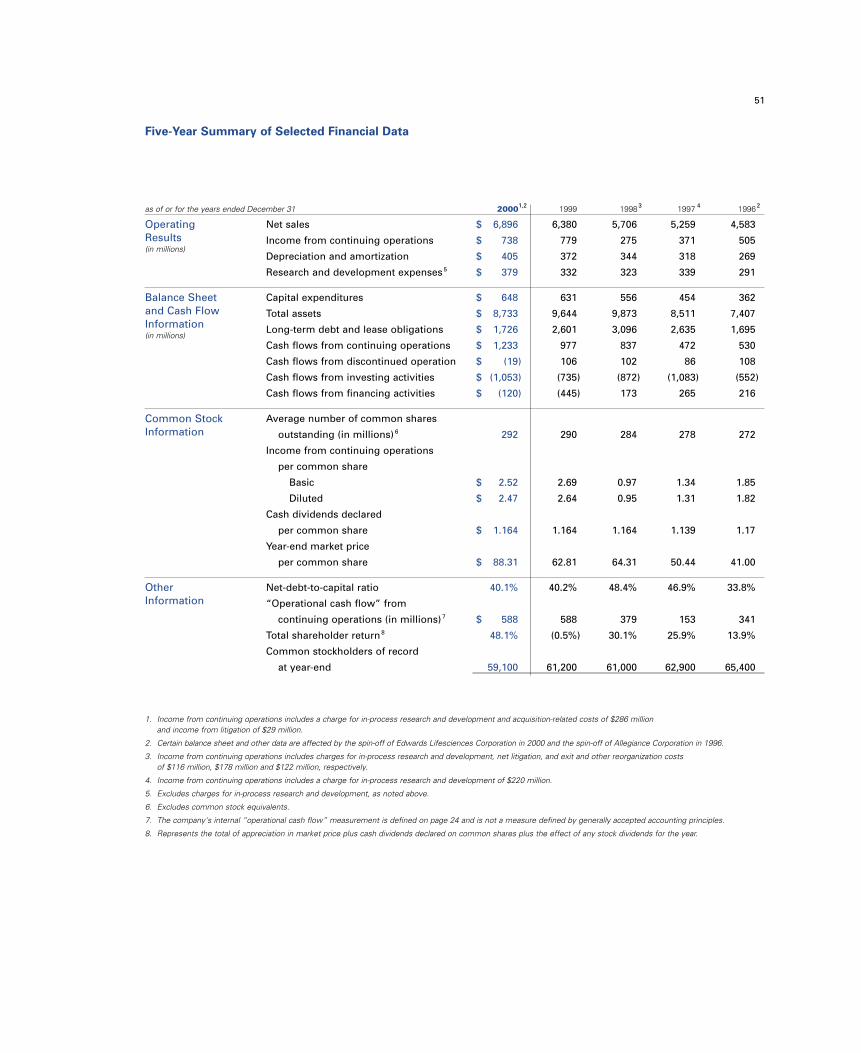
Five-Year Summary of Selected Financial Data
as of or for the years ended December 31 20001,2 1999 19983 1997 4 19962
Net sales $ 6,896 6,380 5,706 5,259 4,583
Income from continuing operations $ 738 779 275 371 505
Depreciation and amortization $ 405 372 344 318 269
Research and development expenses5 $ 379 332 323 339 291
Capital expenditures $ 648 631 556 454 362
Total assets $ 8,733 9,644 9,873 8,511 7,407
Long-term debt and lease obligations $ 1,726 2,601 3,096 2,635 1,695
Cash flows from continuing operations $ 1,233 977 837 472 530
Cash flows from discontinued operation $ (19) 106 102 86 108
Cash flows from investing activities $ (1,053) (735) (872) (1,083) (552)
Cash flows from financing activities $ (120) (445) 173 265 216
Average number of common shares
outstanding (in millions) 6 292 290 284 278 272
Income from continuing operations
per common share
Basic $ 2.52 2.69 0.97 1.34 1.85
Diluted $ 2.47 2.64 0.95 1.31 1.82
Cash dividends declared
per common share $ 1.164 1.164 1.164 1.139 1.17
Year-end market price
per common share $ 88.31 62.81 64.31 50.44 41.00
Net-debt-to-capital ratio 40.1% 40.2% 48.4% 46.9% 33.8%
“Operational cash flow” from
continuing operations (in millions) 7 $ 588 588 379 153 341
Total shareholder return8 48.1% (0.5%) 30.1% 25.9% 13.9%
Common stockholders of record
at year-end 59,100 61,200 61,000 62,900 65,400
1. Income from continuing operations includes a charge for in-process research and development and acquisition-related costs of $286 million and income from litigation of $29 million.
2. Certain balance sheet and other data are affected by the spin-off of Edwards Lifesciences Corporation in 2000 and the spin-off of Allegiance Corporation in 1996.
3. Income from continuing operations includes charges for in-process research and development, net litigation, and exit and other reorganization costs of $116 million, $178 million and $122 million, respectively.
4. Income from continuing operations includes a charge for in-process research and development of $220 million.
5. Excludes charges for in-process research and development, as noted above.
6. Excludes common stock equivalents.
7. The company's internal “operational cash flow” measurement is defined on page 24 and is not a measure defined by generally accepted accounting principles.
8. Represents the total of appreciation in market price plus cash dividends declared on common shares plus the effect of any stock dividends for the year.
Operating Results(in millions)
Balance Sheet and Cash Flow Information(in millions)
Common StockInformation
Other Information
51

Vaccines represent a major growth area for Baxter. The company’s acquisition of North American Vaccine Inc.in 2000 enhanced Baxter’s presence in the $7-billion global vaccines market—a market that is expected to grow 13 percentannually over the next five years.
Baxter International Inc.One Baxter ParkwayDeerfield, Illinois 60015
View this report online at www.baxter.com