Embed Size (px)
DESCRIPTION
Citation preview
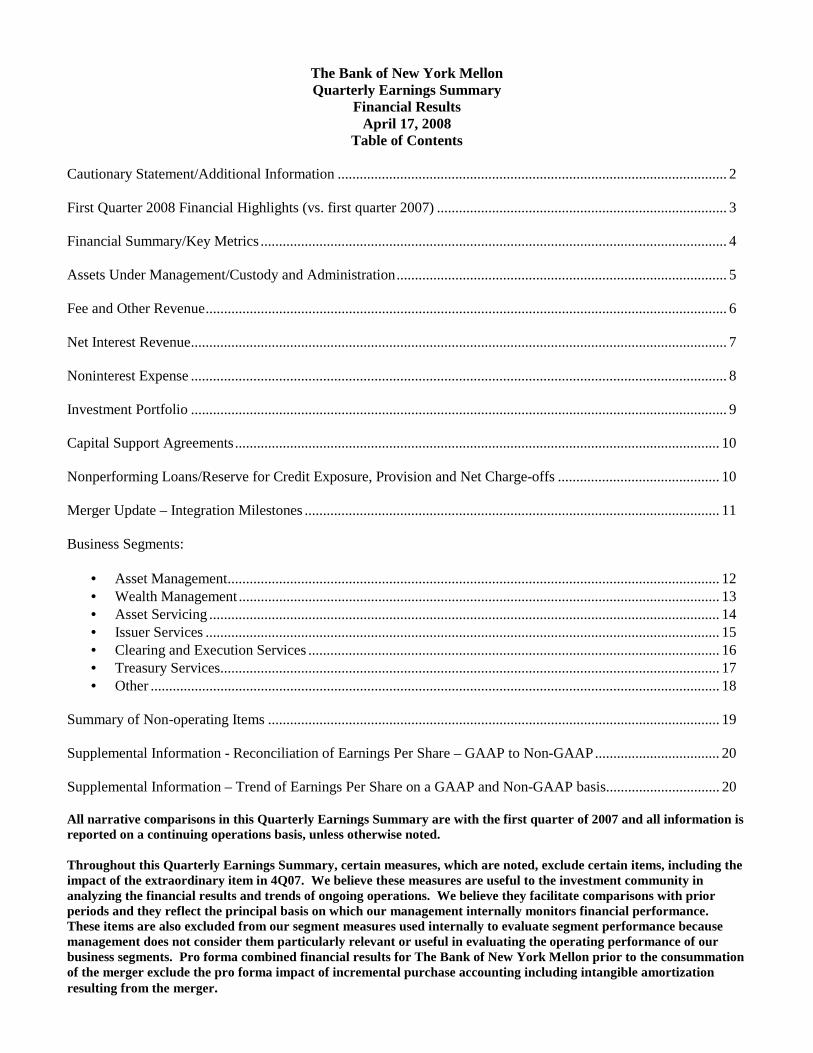
The Bank of New York Mellon Quarterly Earnings Summary
Financial Results April 17, 2008
Table of Contents Cautionary Statement/Additional Information .......................................................................................................... 2 First Quarter 2008 Financial Highlights (vs. first quarter 2007) ............................................................................... 3 Financial Summary/Key Metrics ............................................................................................................................... 4 Assets Under Management/Custody and Administration.......................................................................................... 5 Fee and Other Revenue.............................................................................................................................................. 6 Net Interest Revenue.................................................................................................................................................. 7 Noninterest Expense .................................................................................................................................................. 8 Investment Portfolio .................................................................................................................................................. 9 Capital Support Agreements.................................................................................................................................... 10 Nonperforming Loans/Reserve for Credit Exposure, Provision and Net Charge-offs ............................................ 10 Merger Update – Integration Milestones ................................................................................................................. 11 Business Segments:
• Asset Management...................................................................................................................................... 12 • Wealth Management ................................................................................................................................... 13 • Asset Servicing ........................................................................................................................................... 14 • Issuer Services ............................................................................................................................................ 15 • Clearing and Execution Services ................................................................................................................ 16 • Treasury Services........................................................................................................................................ 17 • Other ........................................................................................................................................................... 18
Summary of Non-operating Items ........................................................................................................................... 19 Supplemental Information - Reconciliation of Earnings Per Share – GAAP to Non-GAAP.................................. 20 Supplemental Information – Trend of Earnings Per Share on a GAAP and Non-GAAP basis............................... 20 All narrative comparisons in this Quarterly Earnings Summary are with the first quarter of 2007 and all information is reported on a continuing operations basis, unless otherwise noted. Throughout this Quarterly Earnings Summary, certain measures, which are noted, exclude certain items, including the impact of the extraordinary item in 4Q07. We believe these measures are useful to the investment community in analyzing the financial results and trends of ongoing operations. We believe they facilitate comparisons with prior periods and they reflect the principal basis on which our management internally monitors financial performance. These items are also excluded from our segment measures used internally to evaluate segment performance because management does not consider them particularly relevant or useful in evaluating the operating performance of our business segments. Pro forma combined financial results for The Bank of New York Mellon prior to the consummation of the merger exclude the pro forma impact of incremental purchase accounting including intangible amortization resulting from the merger.

The Bank of New York Mellon 1Q08 Quarterly Earnings Summary
Page 2
CAUTIONARY STATEMENT A number of statements (i) in this Quarterly Earnings Summary, (ii) in our presentations and (iii) in the responses to questions are “forward-looking statements” within the meaning of the Private Securities Litigation Reform Act of 1995. These statements, which may be expressed in a variety of ways, including the use of future or present tense language, relate to, among other things, the Corporation’s future financial goals, including future revenue, expenses and earnings, new business wins, and pipelines for new business; ability and intention to hold certain securities; possible future activities relating to further capital support agreements; statements with respect to the merger integration, including revenue synergies and targeted run rates, expense synergy targets and estimated merger and integration charges; anticipated completion date for the bank consolidation; and impact and anticipated closing date of sale of Mellon 1st Business Bank; as well as BNY Mellon’s overall plans, strategies, goals, objectives, expectations, estimates and intentions, and are based on assumptions that involve risks and uncertainties and are subject to change based on various important factors (some of which are beyond BNY Mellon’s control). Actual results may differ materially from those expressed or implied as a result of these risks and uncertainties, including, but not limited to, the businesses of Mellon and The Bank of New York may not be integrated successfully or the integration may be more difficult, time-consuming or costly than expected; the combined company may not realize, to the extent or at the time we expect, revenue synergies and cost savings from the transaction; service quality metrics in Asset Servicing may not be attained; revenue following the merger may be lower than expected as a result of losses of customers or other reasons; deposit attrition, operating costs, customer loss and business disruption following the merger, including, without limitation, difficulties in maintaining relationships with employees, may be greater than expected; as well as the risk factors and other uncertainties set forth in BNY Mellon’s annual report on Form 10-K for the year ended December 31, 2007 and BNY Mellon’s other filings with the SEC. Such forward-looking statements speak only as of April 17, 2008 and BNY Mellon undertakes no obligation to update any forward-looking statement to reflect events or circumstances after that date or to reflect the occurrence of unanticipated events. ADDITIONAL INFORMATION The results prior to the consummation of the merger on July 1, 2007, reflect the sum of The Bank of New York and Mellon’s historical results, but do not include the pro forma impact of purchase accounting adjustments. The business segment combined results for all periods reflect actions taken to report consistent transfer pricing and cost allocation methodologies as well as intercompany eliminations between The Bank of New York and Mellon.

The Bank of New York Mellon 1Q08 Quarterly Earnings Summary
Page 3
FIRST QUARTER 2008 FINANCIAL HIGHLIGHTS (vs. first quarter 2007) Income after-tax from EPS from EPS Growth vs. Continuing Operations Continuing Operations 1Q07 4Q07 $ millions GAAP $ 749 $ 0.65 7% 7% Non-GAAP adjusted: Ex. merger and integration $ 824 $ 0.72 16% 7% Ex. merger and integration / intangible amortization $ 899 $ 0.78 20% 5% • Results included four balance sheet items which, net, decreased EPS by approximately $0.04 Revenue – 1Q08 (a) Pre-tax Income – 1Q08 (a) % of Growth vs. % of Growth Total Total 1Q07 (b) Total Total 1Q07 (b) Asset & Wealth Management Sector: Asset Management $ 767 21% (3)% $ 205 14% (27)% Wealth Management 264 7 8 97 7 10 1,031 28 (1) 302 21 (18) Institutional Services Sector: Securities Servicing: Asset Servicing 1,316 35 42 571 39 131 Issuer Services 560 15 5 243 17 - Clearing and Execution Services 393 11 2 119 8 11 2,269 61 23 933 64 57 Treasury Services 416 11 19 211 15 37 2,685 72 22 1,144 79 53 Total Business Segments (c) $ 3,716 100% 15% $ 1,446 100% 29% KEY POINTS Pro forma Combined Basis (a) • Generating strong revenue and earnings momentum
• Revenue + 14%; Expense + 6% (page 4) • Approximately 750 basis points of positive operating leverage, 350 basis points sequentially
• Pre-tax operating margin 36% in 1Q08 vs. 33% in 1Q07 • 33% of revenues from outside the U.S. vs. 28% in 1Q07
• Return on tangible common equity + 49.7% • Asset Servicing/Clearing continue to benefit from higher market volumes and volatility • Assets under management of $1.105 trillion, + 8%; 1Q08 net asset flows totaled $23 billion • Assets under custody and administration of $23.1 trillion, + 9% • Liquidity very strong due to excellent deposit growth • Tier I capital ratio was 8.80% at 3/31/08 (preliminary) compared to 9.32% at 12/31/07; Adjusted tangible shareholders’
equity to assets ratio was 4.14% at 3/31/08, compared to 4.96% at 12/31/07; impacted by the unrealized mark-to-market losses in the securities portfolio and an increase in period end assets
• Continued to improve corporate risk profile and exit non-core businesses • Reducing loan commitments to lessen the impact of credit risk on earnings • Sold B-Trade and G-Trade execution businesses; announced the sale of 1st Business Bank (California)
• Merger synergies • 1Q08 expense synergies of $118 million ($472 million annualized); up 23% vs. 4Q07 level, exceeding targets
(a) Results exclude merger and integration expenses and intangible amortization expense. (b) Comparison is with pro forma results for 1Q07. (c) Excludes the Other segment.
The Bank of New York Mellon 1Q08 Quarterly Earnings Summary
Page 4
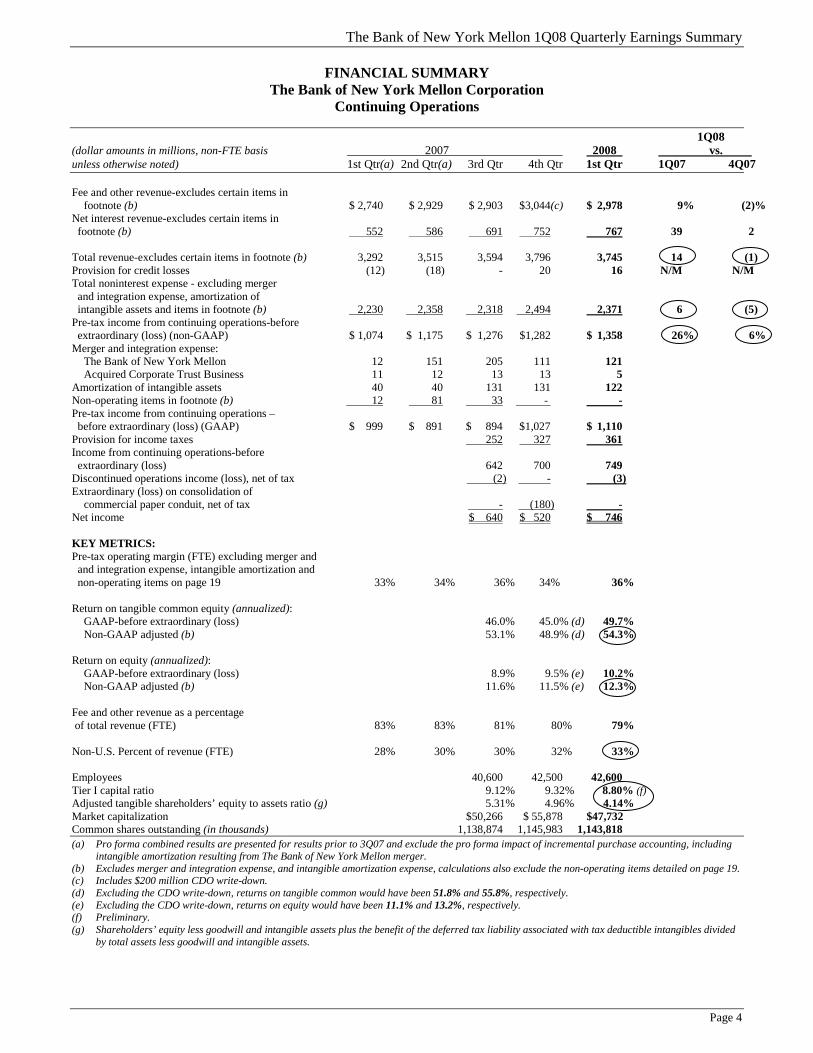
FINANCIAL SUMMARY The Bank of New York Mellon Corporation
Continuing Operations 1Q08 (dollar amounts in millions, non-FTE basis 2007 2008 vs. unless otherwise noted) 1st Qtr(a) 2nd Qtr(a) 3rd Qtr 4th Qtr 1st Qtr 1Q07 4Q07 Fee and other revenue-excludes certain items in footnote (b) $ 2,740 $ 2,929 $ 2,903 $3,044(c) $ 2,978 9% (2)% Net interest revenue-excludes certain items in footnote (b) 552 586 691 752 767 39 2 Total revenue-excludes certain items in footnote (b) 3,292 3,515 3,594 3,796 3,745 14 (1) Provision for credit losses (12) (18) - 20 16 N/M N/M Total noninterest expense - excluding merger and integration expense, amortization of intangible assets and items in footnote (b) 2,230 2,358 2,318 2,494 2,371 6 (5) Pre-tax income from continuing operations-before extraordinary (loss) (non-GAAP) $ 1,074 $ 1,175 $ 1,276 $1,282 $ 1,358 26% 6% Merger and integration expense: The Bank of New York Mellon 12 151 205 111 121 Acquired Corporate Trust Business 11 12 13 13 5 Amortization of intangible assets 40 40 131 131 122 Non-operating items in footnote (b) 12 81 33 - - Pre-tax income from continuing operations – before extraordinary (loss) (GAAP) $ 999 $ 891 $ 894 $1,027 $ 1,110 Provision for income taxes 252 327 361 Income from continuing operations-before extraordinary (loss) 642 700 749 Discontinued operations income (loss), net of tax (2) - (3) Extraordinary (loss) on consolidation of commercial paper conduit, net of tax - (180) - Net income $ 640 $ 520 $ 746 KEY METRICS: Pre-tax operating margin (FTE) excluding merger and
and integration expense, intangible amortization and non-operating items on page 19 33% 34% 36% 34% 36% Return on tangible common equity (annualized): GAAP-before extraordinary (loss) 46.0% 45.0% (d) 49.7% Non-GAAP adjusted (b) 53.1% 48.9% (d) 54.3% Return on equity (annualized): GAAP-before extraordinary (loss) 8.9% 9.5% (e) 10.2% Non-GAAP adjusted (b) 11.6% 11.5% (e) 12.3% Fee and other revenue as a percentage of total revenue (FTE) 83% 83% 81% 80% 79% Non-U.S. Percent of revenue (FTE) 28% 30% 30% 32% 33% Employees 40,600 42,500 42,600 Tier I capital ratio 9.12% 9.32% 8.80% (f) Adjusted tangible shareholders’ equity to assets ratio (g) 5.31% 4.96% 4.14% Market capitalization $50,266 $ 55,878 $47,732 Common shares outstanding (in thousands) 1,138,874 1,145,983 1,143,818 (a) Pro forma combined results are presented for results prior to 3Q07 and exclude the pro forma impact of incremental purchase accounting, including
intangible amortization resulting from The Bank of New York Mellon merger. (b) Excludes merger and integration expense, and intangible amortization expense, calculations also exclude the non-operating items detailed on page 19. (c) Includes $200 million CDO write-down. (d) Excluding the CDO write-down, returns on tangible common would have been 51.8% and 55.8%, respectively. (e) Excluding the CDO write-down, returns on equity would have been 11.1% and 13.2%, respectively. (f) Preliminary. (g) Shareholders’ equity less goodwill and intangible assets plus the benefit of the deferred tax liability associated with tax deductible intangibles divided
by total assets less goodwill and intangible assets.
The Bank of New York Mellon 1Q08 Quarterly Earnings Summary
Page 5
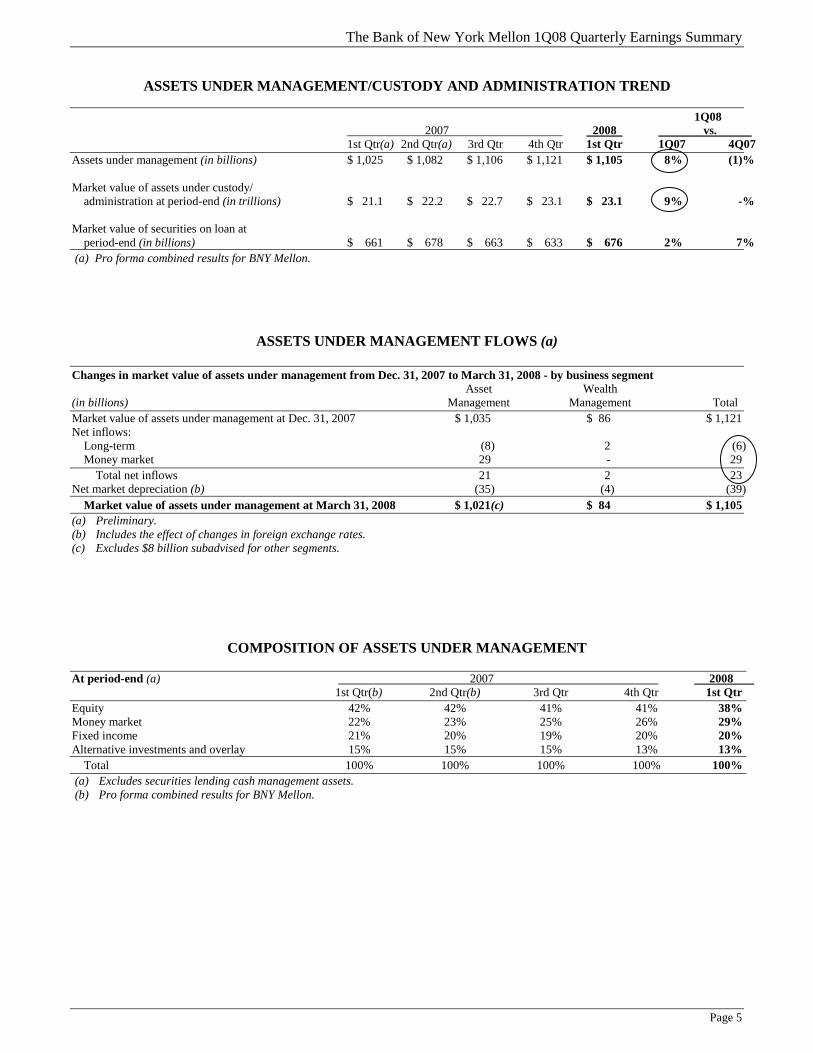
ASSETS UNDER MANAGEMENT/CUSTODY AND ADMINISTRATION TREND
1Q08 2007 2008 vs. 1st Qtr(a) 2nd Qtr(a) 3rd Qtr 4th Qtr 1st Qtr 1Q07 4Q07 Assets under management (in billions) $ 1,025 $ 1,082 $ 1,106 $ 1,121 $ 1,105 8% (1)% Market value of assets under custody/ administration at period-end (in trillions) $ 21.1 $ 22.2 $ 22.7 $ 23.1 $ 23.1 9% -% Market value of securities on loan at period-end (in billions) $ 661 $ 678 $ 663 $ 633 $ 676 2% 7% (a) Pro forma combined results for BNY Mellon.
ASSETS UNDER MANAGEMENT FLOWS (a)
Changes in market value of assets under management from Dec. 31, 2007 to March 31, 2008 - by business segment Asset Wealth (in billions) Management Management Total Market value of assets under management at Dec. 31, 2007 $ 1,035 $ 86 $ 1,121 Net inflows: Long-term (8) 2 (6) Money market 29 - 29 Total net inflows 21 2 23 Net market depreciation (b) (35) (4) (39) Market value of assets under management at March 31, 2008 $ 1,021(c) $ 84 $ 1,105 (a) Preliminary. (b) Includes the effect of changes in foreign exchange rates. (c) Excludes $8 billion subadvised for other segments.
COMPOSITION OF ASSETS UNDER MANAGEMENT At period-end (a) 2007 2008 1st Qtr(b) 2nd Qtr(b) 3rd Qtr 4th Qtr 1st Qtr Equity 42% 42% 41% 41% 38% Money market 22% 23% 25% 26% 29% Fixed income 21% 20% 19% 20% 20% Alternative investments and overlay 15% 15% 15% 13% 13% Total 100% 100% 100% 100% 100% (a) Excludes securities lending cash management assets. (b) Pro forma combined results for BNY Mellon.
The Bank of New York Mellon 1Q08 Quarterly Earnings Summary
Page 6
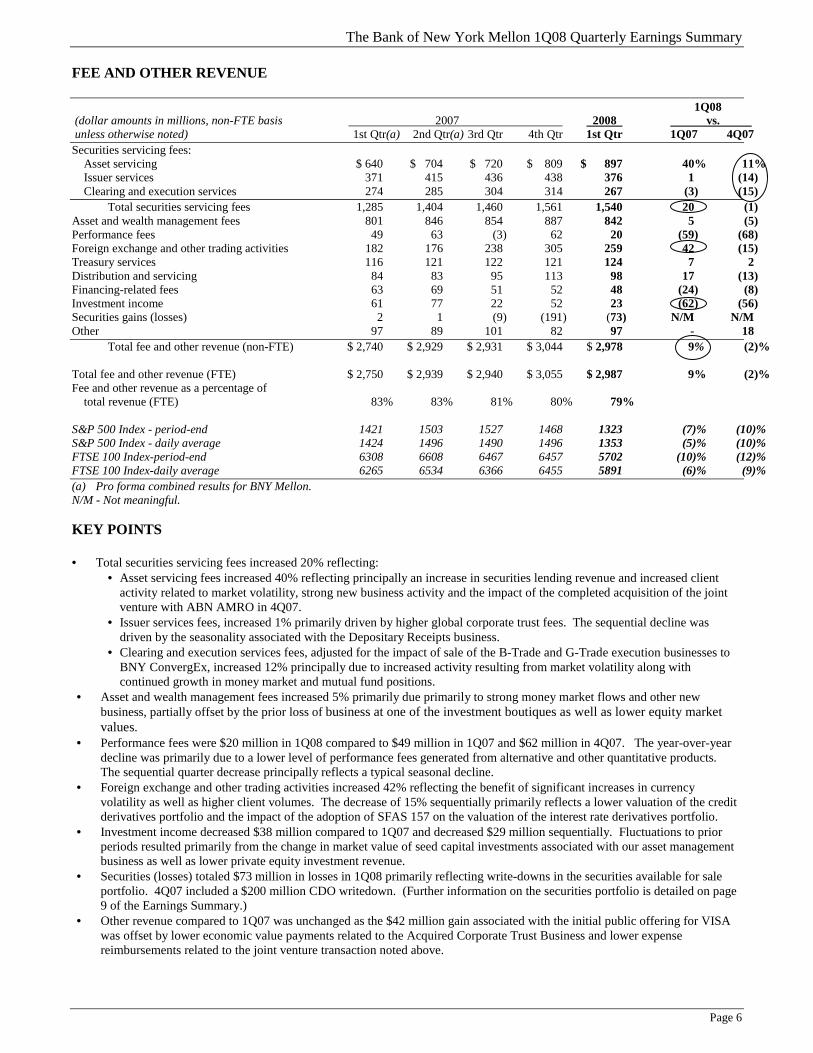
FEE AND OTHER REVENUE 1Q08 (dollar amounts in millions, non-FTE basis 2007 2008 vs. unless otherwise noted) 1st Qtr(a) 2nd Qtr(a) 3rd Qtr 4th Qtr 1st Qtr 1Q07 4Q07 Securities servicing fees: Asset servicing $ 640 $ 704 $ 720 $ 809 $ 897 40% 11% Issuer services 371 415 436 438 376 1 (14) Clearing and execution services 274 285 304 314 267 (3) (15) Total securities servicing fees 1,285 1,404 1,460 1,561 1,540 20 (1) Asset and wealth management fees 801 846 854 887 842 5 (5) Performance fees 49 63 (3) 62 20 (59) (68) Foreign exchange and other trading activities 182 176 238 305 259 42 (15) Treasury services 116 121 122 121 124 7 2 Distribution and servicing 84 83 95 113 98 17 (13) Financing-related fees 63 69 51 52 48 (24) (8) Investment income 61 77 22 52 23 (62) (56) Securities gains (losses) 2 1 (9) (191) (73) N/M N/M Other 97 89 101 82 97 - 18 Total fee and other revenue (non-FTE) $ 2,740 $ 2,929 $ 2,931 $ 3,044 $ 2,978 9% (2)% Total fee and other revenue (FTE) $ 2,750 $ 2,939 $ 2,940 $ 3,055 $ 2,987 9% (2)% Fee and other revenue as a percentage of total revenue (FTE) 83% 83% 81% 80% 79% S&P 500 Index - period-end 1421 1503 1527 1468 1323 (7)% (10)% S&P 500 Index - daily average 1424 1496 1490 1496 1353 (5)% (10)% FTSE 100 Index-period-end 6308 6608 6467 6457 5702 (10)% (12)% FTSE 100 Index-daily average 6265 6534 6366 6455 5891 (6)% (9)% (a) Pro forma combined results for BNY Mellon. N/M - Not meaningful. KEY POINTS • Total securities servicing fees increased 20% reflecting:
• Asset servicing fees increased 40% reflecting principally an increase in securities lending revenue and increased client activity related to market volatility, strong new business activity and the impact of the completed acquisition of the joint venture with ABN AMRO in 4Q07.
• Issuer services fees, increased 1% primarily driven by higher global corporate trust fees. The sequential decline was driven by the seasonality associated with the Depositary Receipts business.
• Clearing and execution services fees, adjusted for the impact of sale of the B-Trade and G-Trade execution businesses to BNY ConvergEx, increased 12% principally due to increased activity resulting from market volatility along with continued growth in money market and mutual fund positions.
• Asset and wealth management fees increased 5% primarily due primarily to strong money market flows and other new business, partially offset by the prior loss of business at one of the investment boutiques as well as lower equity market values.
• Performance fees were $20 million in 1Q08 compared to $49 million in 1Q07 and $62 million in 4Q07. The year-over-year decline was primarily due to a lower level of performance fees generated from alternative and other quantitative products. The sequential quarter decrease principally reflects a typical seasonal decline.
• Foreign exchange and other trading activities increased 42% reflecting the benefit of significant increases in currency volatility as well as higher client volumes. The decrease of 15% sequentially primarily reflects a lower valuation of the credit derivatives portfolio and the impact of the adoption of SFAS 157 on the valuation of the interest rate derivatives portfolio.
• Investment income decreased $38 million compared to 1Q07 and decreased $29 million sequentially. Fluctuations to prior periods resulted primarily from the change in market value of seed capital investments associated with our asset management business as well as lower private equity investment revenue.
• Securities (losses) totaled $73 million in losses in 1Q08 primarily reflecting write-downs in the securities available for sale portfolio. 4Q07 included a $200 million CDO writedown. (Further information on the securities portfolio is detailed on page 9 of the Earnings Summary.)
• Other revenue compared to 1Q07 was unchanged as the $42 million gain associated with the initial public offering for VISA was offset by lower economic value payments related to the Acquired Corporate Trust Business and lower expense reimbursements related to the joint venture transaction noted above.
The Bank of New York Mellon 1Q08 Quarterly Earnings Summary
Page 7
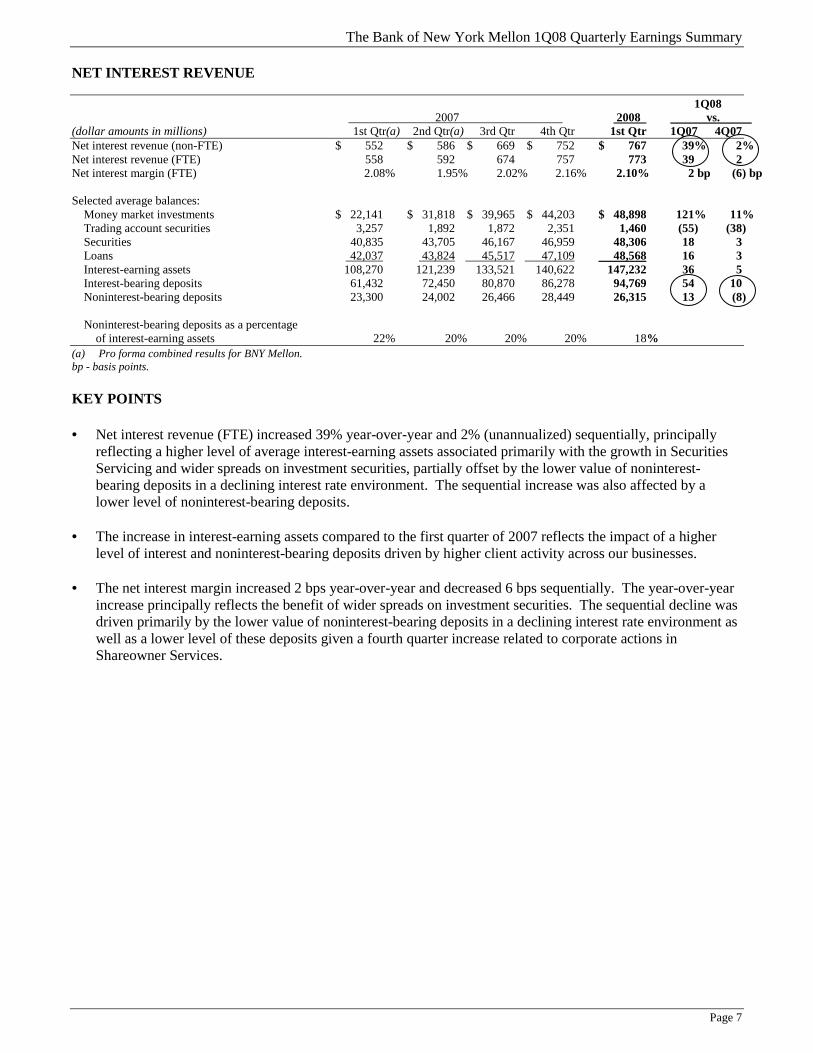
NET INTEREST REVENUE 1Q08 2007 2008 vs. (dollar amounts in millions) 1st Qtr(a) 2nd Qtr(a) 3rd Qtr 4th Qtr 1st Qtr 1Q07 4Q07 Net interest revenue (non-FTE) $ 552 $ 586 $ 669 $ 752 $ 767 39% 2% Net interest revenue (FTE) 558 592 674 757 773 39 2 Net interest margin (FTE) 2.08% 1.95% 2.02% 2.16% 2.10% 2 bp (6) bp Selected average balances: Money market investments $ 22,141 $ 31,818 $ 39,965 $ 44,203 $ 48,898 121% 11% Trading account securities 3,257 1,892 1,872 2,351 1,460 (55) (38) Securities 40,835 43,705 46,167 46,959 48,306 18 3 Loans 42,037 43,824 45,517 47,109 48,568 16 3 Interest-earning assets 108,270 121,239 133,521 140,622 147,232 36 5 Interest-bearing deposits 61,432 72,450 80,870 86,278 94,769 54 10 Noninterest-bearing deposits 23,300 24,002 26,466 28,449 26,315 13 (8) Noninterest-bearing deposits as a percentage of interest-earning assets 22% 20% 20% 20% 18% (a) Pro forma combined results for BNY Mellon. bp - basis points. KEY POINTS • Net interest revenue (FTE) increased 39% year-over-year and 2% (unannualized) sequentially, principally
reflecting a higher level of average interest-earning assets associated primarily with the growth in Securities Servicing and wider spreads on investment securities, partially offset by the lower value of noninterest-bearing deposits in a declining interest rate environment. The sequential increase was also affected by a lower level of noninterest-bearing deposits.
• The increase in interest-earning assets compared to the first quarter of 2007 reflects the impact of a higher
level of interest and noninterest-bearing deposits driven by higher client activity across our businesses. • The net interest margin increased 2 bps year-over-year and decreased 6 bps sequentially. The year-over-year
increase principally reflects the benefit of wider spreads on investment securities. The sequential decline was driven primarily by the lower value of noninterest-bearing deposits in a declining interest rate environment as well as a lower level of these deposits given a fourth quarter increase related to corporate actions in Shareowner Services.

The Bank of New York Mellon 1Q08 Quarterly Earnings Summary
Page 8
NONINTEREST EXPENSE 1Q08 2007 2008 vs. (dollar amounts in millions) 1st Qtr(a) 2nd Qtr(a) 3rd Qtr 4th Qtr 1st Qtr 1Q07 4Q07 Staff: Compensation $ 739 $ 754 $ 764 $ 758 $ 795 8% 5% Incentives 327 362 347 443 366 12 (17) Employee benefits 191 187 169 164 191 - 16 Total staff 1,257 1,303 1,280 1,365 1,352 8 (1) Professional, legal and other purchased services 245 253 241 272 252 3 (7) Net occupancy 135 172 144 145 129 (4) (11) Distribution and servicing 132 141 127 133 130 (2) (2) Software 72 77 91 78 79 10 1 Furniture and equipment 78 80 80 82 79 1 (4) Sub-custodian 50 60 58 66 61 22 (8) Business development 58 72 56 72 66 14 (8) Clearing and execution 37 44 52 49 9 (76) (82) Communications 25 33 33 34 32 28 (6) Other 153 204 195 198 182 19 (8) Subtotal 2,242 2,439 2,357 2,494 2,371 6 (5) Amortization of intangible assets 40 40 131 131 122 N/M (7) Merger & integration expense: The Bank of New York Mellon 12 151 205 111 121 N/M 9 Acquired Corporate Trust Business 11 12 13 13 5 (55) (62) Total noninterest expense $2,305 $2,642 $2,706 $2,749 $ 2,619 14% (5)% Total staff expense as a percentage of total revenue (FTE) 38% 37% 35% 36% 36% (a) Pro forma combined results for BNY Mellon. Results exclude the pro forma impact of incremental purchase accounting intangible
amortization resulting from The Bank of New York Mellon merger. N/M - Not meaningful. KEY POINTS • Strong revenue growth and overall expense control as well as the benefit of $118 million in merger-related
synergies resulted in approximately 750 basis points in positive operating leverage year-over-year, excluding merger and integration expense, intangible amortization expense and non-operating items.
• Total staff expense increased $95 million in support of business growth, the 4Q07 acquisition of the joint
venture with ABN AMRO as well as higher severence expense, partially offset by merger-related expense synergies.
• Increased professional, legal and other purchased services, software, sub-custodian, business development,
communications and other expenses primarily reflect business growth, strategic initiatives and higher legal fees, partially offset by merger-related expense synergies. The increase in other expense also reflects $25 million for the writedown of seed capital investments related to a formerly affiliated hedge fund manager and a $12 million expense associated with capital support agreements.
• Clearing and execution expenses declined $28 million reflecting lower DTC expenses as well as the impact of
the sale of the B-Trade and G-Trade execution businesses to BNY ConvergEx. • Noninterest expense decreased 5% sequentially, resulting in approximately 350 basis points of positive
operating leverage, excluding merger and integration and intangible amortization expense.
The Bank of New York Mellon 1Q08 Quarterly Earnings Summary
Page 9
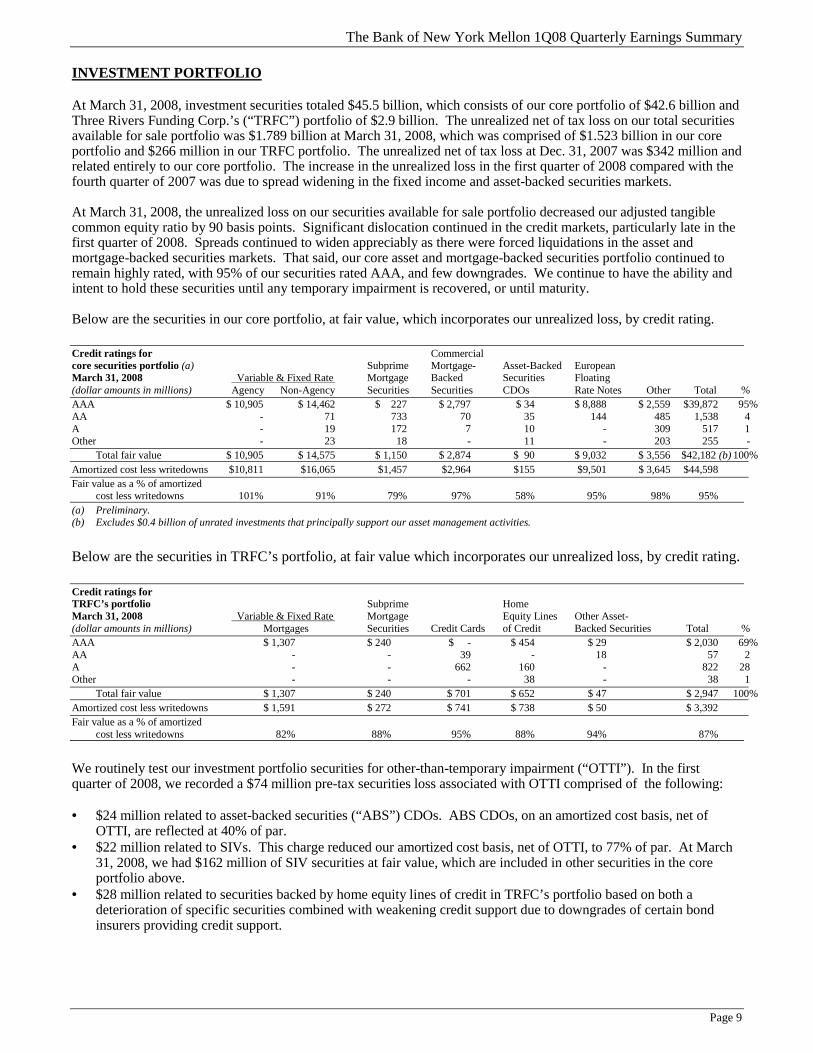
INVESTMENT PORTFOLIO At March 31, 2008, investment securities totaled $45.5 billion, which consists of our core portfolio of $42.6 billion and Three Rivers Funding Corp.’s (“TRFC”) portfolio of $2.9 billion. The unrealized net of tax loss on our total securities available for sale portfolio was $1.789 billion at March 31, 2008, which was comprised of $1.523 billion in our core portfolio and $266 million in our TRFC portfolio. The unrealized net of tax loss at Dec. 31, 2007 was $342 million and related entirely to our core portfolio. The increase in the unrealized loss in the first quarter of 2008 compared with the fourth quarter of 2007 was due to spread widening in the fixed income and asset-backed securities markets. At March 31, 2008, the unrealized loss on our securities available for sale portfolio decreased our adjusted tangible common equity ratio by 90 basis points. Significant dislocation continued in the credit markets, particularly late in the first quarter of 2008. Spreads continued to widen appreciably as there were forced liquidations in the asset and mortgage-backed securities markets. That said, our core asset and mortgage-backed securities portfolio continued to remain highly rated, with 95% of our securities rated AAA, and few downgrades. We continue to have the ability and intent to hold these securities until any temporary impairment is recovered, or until maturity. Below are the securities in our core portfolio, at fair value, which incorporates our unrealized loss, by credit rating. Credit ratings for Commercial core securities portfolio (a) Subprime Mortgage- Asset-Backed European March 31, 2008 Variable & Fixed Rate Mortgage Backed Securities Floating (dollar amounts in millions) Agency Non-Agency Securities Securities CDOs Rate Notes Other Total % AAA $ 10,905 $ 14,462 $ 227 $ 2,797 $ 34 $ 8,888 $ 2,559 $39,872 95% AA - 71 733 70 35 144 485 1,538 4 A - 19 172 7 10 - 309 517 1 Other - 23 18 - 11 - 203 255 - Total fair value $ 10,905 $ 14,575 $ 1,150 $ 2,874 $ 90 $ 9,032 $ 3,556 $42,182 (b) 100% Amortized cost less writedowns $10,811 $16,065 $1,457 $2,964 $155 $9,501 $ 3,645 $44,598 Fair value as a % of amortized cost less writedowns 101% 91% 79% 97% 58% 95% 98% 95% (a) Preliminary. (b) Excludes $0.4 billion of unrated investments that principally support our asset management activities. Below are the securities in TRFC’s portfolio, at fair value which incorporates our unrealized loss, by credit rating. Credit ratings for TRFC’s portfolio Subprime Home March 31, 2008 Variable & Fixed Rate Mortgage Equity Lines Other Asset- (dollar amounts in millions) Mortgages Securities Credit Cards of Credit Backed Securities Total % AAA $ 1,307 $ 240 $ - $ 454 $ 29 $ 2,030 69% AA - - 39 - 18 57 2 A - - 662 160 - 822 28 Other - - - 38 - 38 1 Total fair value $ 1,307 $ 240 $ 701 $ 652 $ 47 $ 2,947 100% Amortized cost less writedowns $ 1,591 $ 272 $ 741 $ 738 $ 50 $ 3,392 Fair value as a % of amortized cost less writedowns 82% 88% 95% 88% 94% 87%
We routinely test our investment portfolio securities for other-than-temporary impairment (“OTTI”). In the first quarter of 2008, we recorded a $74 million pre-tax securities loss associated with OTTI comprised of the following: • $24 million related to asset-backed securities (“ABS”) CDOs. ABS CDOs, on an amortized cost basis, net of
OTTI, are reflected at 40% of par. • $22 million related to SIVs. This charge reduced our amortized cost basis, net of OTTI, to 77% of par. At March
31, 2008, we had $162 million of SIV securities at fair value, which are included in other securities in the core portfolio above.
• $28 million related to securities backed by home equity lines of credit in TRFC’s portfolio based on both a deterioration of specific securities combined with weakening credit support due to downgrades of certain bond insurers providing credit support.

The Bank of New York Mellon 1Q08 Quarterly Earnings Summary
Page 10
CAPITAL SUPPORT AGREEMENTS During the first quarter of 2008, we executed a capital support agreement for a commingled short-term NAV fund (“CNAV Fund”), which is managed by securities lending in the Asset Servicing segment, of $55.5 million covering securities related to Whistle Jacket Capital/White Pine Financial, LLC (“Whistle Jacket”). Subsequently, we executed another capital support agreement for the same CNAV Fund of $30 million covering securities related to Thornburg Mortgage Capital Resources (“Thornburg”). Under these agreements, we will provide capital in specified circumstances to the CNAV Fund until June 30, 2008 in support of Whistle Jacket securities and April 2009 in support of Thornburg securities. Included in other expense during the first quarter of 2008 was $12 million associated with the current estimated fair value of the support agreements. We continue to monitor exposure to SIV senior note investments in the CNAV Funds we manage. On a case-by-case basis, depending on future circumstances, we could enter into further capital support agreements with the funds. NONPERFORMING LOANS
Nonperforming loans Quarter ended March 31, Dec. 31, March 31, (dollar amounts in millions) 2008 2007 2007 (a) Loans: Commercial $ 50 $ 39 $ 15 Commercial real estate 49 40 - Residential real estate 33 20 3 Foreign 78 87 9 Total nonperforming loans $ 210 $ 186 $ 27 Nonperforming loans ratio 0.4% 0.4% 0.1% Allowance for loan losses/nonperforming loans 149.5 175.8 1,074.1 Total allowance for credit losses/nonperforming loans 231.9 265.6 1,574.1 (a) Legacy The Bank of New York only. RESERVE FOR CREDIT EXPOSURE, PROVISION AND NET CHARGE-OFFS
Reserve for credit exposure, provision and net charge-offs Quarter ended March 31, Dec. 31, March 31, (dollar amounts in millions) 2008 2007 2007 (a) Reserve for credit exposure: Reserve for loan losses $ 314 $ 327 $ 290 Reserve for unfunded commitments 173 167 135 Total reserve for credit exposure $ 487 $ 494 $ 425 Provision for credit losses $ 16 $ 20 $ (15) Net charge-offs/(recoveries): Commercial $ 6 $ 16 $ 5 Leasing - - (8) Foreign 5 18 - Other 2 1 - Total net charge-offs/(recoveries) $ 13 $ 35 $ (3) (a) Legacy The Bank of New York only.
The unallocated reserve was 23% at March 31, 2008 compared with 23% at Dec. 31, 2007 and 27% at March 31, 2007.

The Bank of New York Mellon 1Q08 Quarterly Earnings Summary
Page 11
MERGER UPDATE - INTEGRATION MILESTONES
1) Revenue Synergies • Continue to meet interim targets • Targeted run rate of $250-400 million by 2011 • Ideas grouped into 3 major categories
- Revenue enhancements (best practices) - Within line of business - Across lines of business
Annual -----------------Actual-------------------- --------Cumulative Targets------- (dollar amounts in millions) 3Q07 4Q07 1Q08 2007 2008 2009 Goal
2) Expense Synergies - represents synergies achieved for the period $ 79 $ 96 $118 $105/15% $ 350/50% $ 595/85% $700(a) Actual results $175/25% # of net positions eliminated (cumulative) 1,368 1,723 1,873 1,723 (b) 3,900 (a) The $700 million represents a nominal amount; deal model assumes a 3% annual inflation factor. (b) Actual results. Business Segment Expense Synergies Achieved (in millions) 3Q07 4Q07 FY 2007 1Q08 Asset Management $ 6 $ 7 $ 13 $ 10 Wealth Management 4 5 9 6 Asset Servicing 28 32 60 44 Issuer Services 8 10 18 12 Clearing and Execution Services 1 2 3 2 Treasury Services 10 12 22 14 Subtotal 57 68 125 88 Other 22 28 50 30 Total $ 79 $ 96 $175 $118 Total – annualized $316 $384 N/A $472
3) Merger & Integration Charges (The Bank of New York Mellon)
(in millions) Cumulative Thru 1Q08(f) 1Q08 Included in Total Total Expense Goodwill Total Estimated Personnel-related (c) $ 34 $ 221 $ 105 $ 326 $ 575 Integration/conversion 82 237 - 237 350 One-time costs (d) 5 34 39 73 225 Transaction costs (e) - 117 45 162 175 Total $ 121 $ 609 $ 189 $ 798 $ 1,325 % of total estimated 9% 46% 60% (c) Includes severance, retention, relocation expenses and accelerated vesting of stock options and restricted stock. (d) Includes facilities related, balance sheet write-offs, vendor contract modifications, rebranding and net gain (loss) on disposals. (e) Includes investment banker and legal fees and foundation funding. (f) Represents total merger and integration charges from 4Q06 - 1Q08.
4) Service Quality Goals for 2010 - Asset Servicing • #1 vs. major peers in the three major external global client satisfaction surveys
- BNY Mellon #1 rated custodian among the large custodian peer group > R&M Global Custody Survey (March 2008) > Global Custodian Survey (January 2008)
• Expect 85% of our clients to be satisfied/highly satisfied with our service quality. 5) Consolidation of Banks – on track for completion by early 3Q08

The Bank of New York Mellon 1Q08 Quarterly Earnings Summary
Page 12
BUSINESS SEGMENTS ASSET MANAGEMENT (provides asset management services through a number of asset management companies to institutional and individual investors) • Represented 14% of pre-tax income in the first quarter of 2008 (a) 1Q08 (dollar amounts in millions, unless otherwise 2007 2008 vs. noted; presented on an FTE basis) 1st Qtr(b) 2nd Qtr(b) 3rd Qtr 4th Qtr 1st Qtr 1Q07 4Q07 Revenue: Asset and wealth management: Mutual funds $ 276 $ 291 $ 307 $ 323 $ 323 17% -% Institutional clients 320 341 331 342 304 (5) (11) Private clients 43 46 47 47 45 5 (4) Total asset and wealth management 639 678 685 712 672 5 (6) Performance fees 49 63 (3) 62 20 (59) (68) Distribution and servicing 82 82 89 104 86 5 (17) Other 16 41 (26) 10 (26) N/M N/M Total fee and other revenue 786 864 745 888 752 (4) (15) Net interest revenue (expense) 6 (6) (4) 17 15 N/M (12) Total revenue 792 858 741 905 767 (3) (15) Noninterest expense (ex. intangible amortization) 511 542 538 559 562 10 1 Income before taxes (ex. intangible amortization) 281 316 203 346 205 (27) (41) Amortization of intangible assets (c) 13 13 70 70 62 N/M (11) Income before taxes $ 268 $ 303 $ 133 $ 276 $ 143 (47)% (48)% Memo: Income before taxes (ex. intangible amortization) non-GAAP $ 281 $ 316 $ 235 (d) $ 346 $ 205 (27)% (41)% Pre-tax operating margin (ex. intangible amortization) – non-GAAP 35% 37% 32% (d) 38% 27% Adjusted pre-tax operation margin – non-GAAP (e) 42% 44% 38% (d) 45% 32% Market value of assets under management at period-end (in billions) $ 950 $1,006 $1,028 $1,044 $ 1,029 8% (1)% Assets under management-net inflows (outflows) Long-term (in billions) $ (4) $ 5 $ 1 $ (21) $ (8) Money market (in billions) $ 5 $ 17 $ 27 $ 39 $ 29
(a) Excluding intangible amortization and the Other segment. (b) Pro forma combined results for BNY Mellon. (c) Results prior to 3Q07 exclude the pro forma impact of incremental purchase accounting intangible amortization resulting from The Bank of New York
Mellon merger. (d) 3Q07 noninterest expense included a $32 million charge related to the write-off of the value of the remaining interest in a hedge fund manager that was
sold in 2006. The pre-tax operating margin and adjusted pre-tax operating margin have been adjusted for the items detailed in the table on page 19. (e) Calculation excludes amortization of intangible assets and nets distribution and servicing expense from revenue.
KEY POINTS • Asset and wealth management fees increased 5% compared to 1Q07 reflecting the benefit of strong money market flows
and growth in business outside the U.S., partially offset by the prior loss of business at one of the investment boutiques as well as lower equity market values.
• Other fee revenue decreased $42 million year-over-year and $36 million sequentially, due primarily to lower seed capital revenue as well as $24 million of writedowns in 1Q08 related to securities previously purchased from investment boutiques.
• 1Q08 noninterest expense (excluding intangible amortization) includes a $25 million write-down of seed capital investments related to a formerly affiliated hedge fund manager. Excluding this item, noninterest expense increased 5% primarily in support of business growth.
• Income before taxes (ex. intangible amortization), also excluding the securities and seed capital writedown noted above, would have been $254 million in the first quarter of 2008.
• Pre-tax operating margin (ex. intangible amortization) would have been 32% vs. 27% in the table above. • 39% non-U.S. revenue in 1Q08 vs. 33% in 1Q07. • Completed acquisition of ARX Capital Management, a Brazilian asset manager.
The Bank of New York Mellon 1Q08 Quarterly Earnings Summary
Page 13
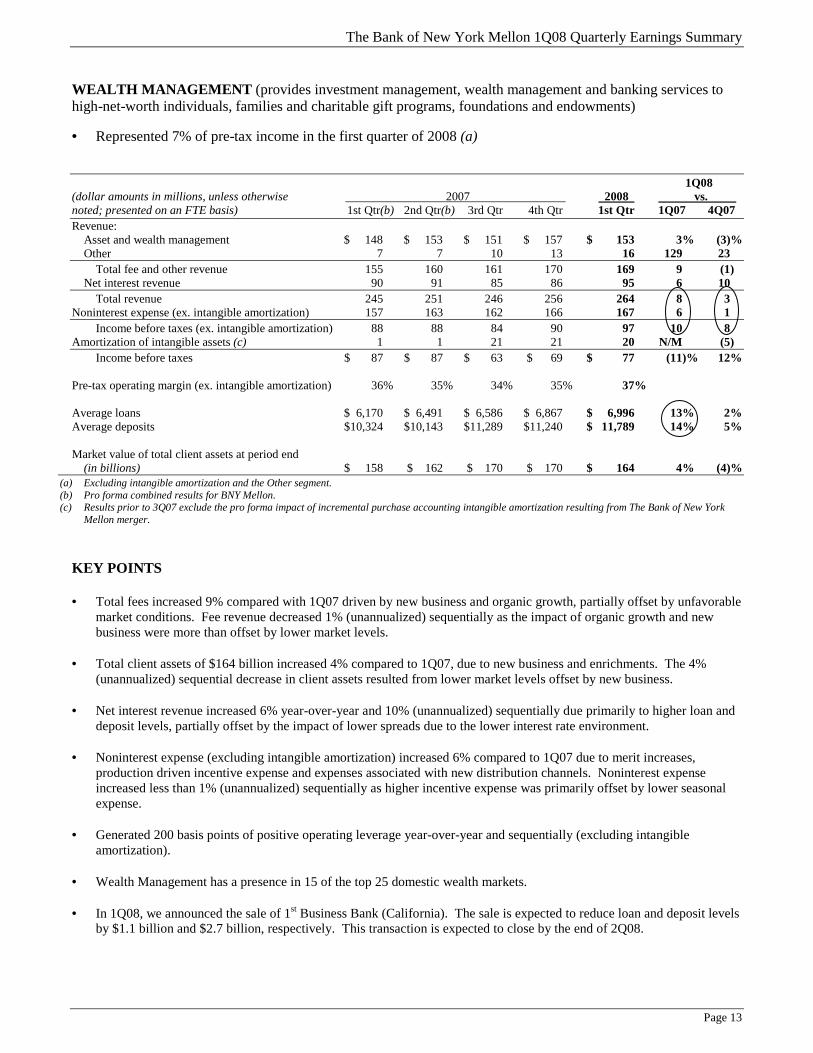
WEALTH MANAGEMENT (provides investment management, wealth management and banking services to high-net-worth individuals, families and charitable gift programs, foundations and endowments) • Represented 7% of pre-tax income in the first quarter of 2008 (a) 1Q08 (dollar amounts in millions, unless otherwise 2007 2008 vs. noted; presented on an FTE basis) 1st Qtr(b) 2nd Qtr(b) 3rd Qtr 4th Qtr 1st Qtr 1Q07 4Q07 Revenue: Asset and wealth management $ 148 $ 153 $ 151 $ 157 $ 153 3% (3)% Other 7 7 10 13 16 129 23 Total fee and other revenue 155 160 161 170 169 9 (1) Net interest revenue 90 91 85 86 95 6 10 Total revenue 245 251 246 256 264 8 3 Noninterest expense (ex. intangible amortization) 157 163 162 166 167 6 1 Income before taxes (ex. intangible amortization) 88 88 84 90 97 10 8 Amortization of intangible assets (c) 1 1 21 21 20 N/M (5) Income before taxes $ 87 $ 87 $ 63 $ 69 $ 77 (11)% 12% Pre-tax operating margin (ex. intangible amortization) 36% 35% 34% 35% 37% Average loans $ 6,170 $ 6,491 $ 6,586 $ 6,867 $ 6,996 13% 2% Average deposits $10,324 $10,143 $11,289 $11,240 $ 11,789 14% 5% Market value of total client assets at period end (in billions) $ 158 $ 162 $ 170 $ 170 $ 164 4% (4)%
(a) Excluding intangible amortization and the Other segment. (b) Pro forma combined results for BNY Mellon. (c) Results prior to 3Q07 exclude the pro forma impact of incremental purchase accounting intangible amortization resulting from The Bank of New York
Mellon merger. KEY POINTS • Total fees increased 9% compared with 1Q07 driven by new business and organic growth, partially offset by unfavorable
market conditions. Fee revenue decreased 1% (unannualized) sequentially as the impact of organic growth and new business were more than offset by lower market levels.
• Total client assets of $164 billion increased 4% compared to 1Q07, due to new business and enrichments. The 4%
(unannualized) sequential decrease in client assets resulted from lower market levels offset by new business. • Net interest revenue increased 6% year-over-year and 10% (unannualized) sequentially due primarily to higher loan and
deposit levels, partially offset by the impact of lower spreads due to the lower interest rate environment. • Noninterest expense (excluding intangible amortization) increased 6% compared to 1Q07 due to merit increases,
production driven incentive expense and expenses associated with new distribution channels. Noninterest expense increased less than 1% (unannualized) sequentially as higher incentive expense was primarily offset by lower seasonal expense.
• Generated 200 basis points of positive operating leverage year-over-year and sequentially (excluding intangible
amortization). • Wealth Management has a presence in 15 of the top 25 domestic wealth markets. • In 1Q08, we announced the sale of 1st Business Bank (California). The sale is expected to reduce loan and deposit levels
by $1.1 billion and $2.7 billion, respectively. This transaction is expected to close by the end of 2Q08.
The Bank of New York Mellon 1Q08 Quarterly Earnings Summary
Page 14
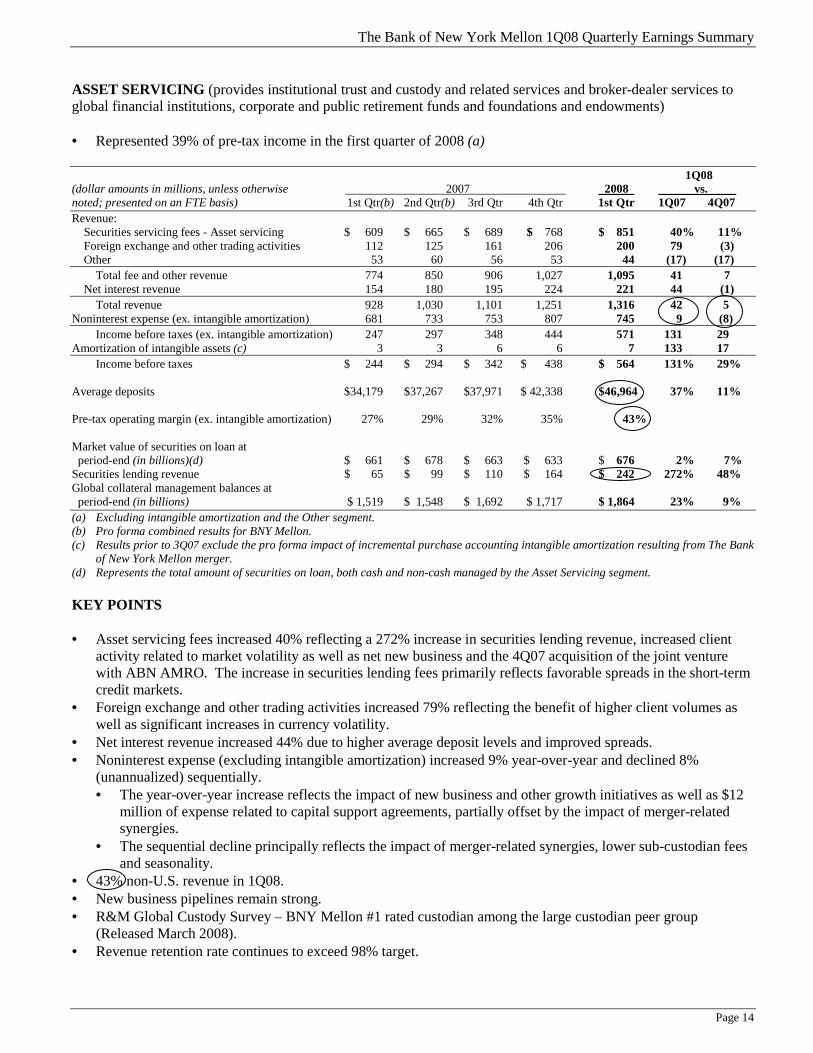
ASSET SERVICING (provides institutional trust and custody and related services and broker-dealer services to global financial institutions, corporate and public retirement funds and foundations and endowments) • Represented 39% of pre-tax income in the first quarter of 2008 (a)
1Q08 (dollar amounts in millions, unless otherwise 2007 2008 vs. noted; presented on an FTE basis) 1st Qtr(b) 2nd Qtr(b) 3rd Qtr 4th Qtr 1st Qtr 1Q07 4Q07 Revenue: Securities servicing fees - Asset servicing $ 609 $ 665 $ 689 $ 768 $ 851 40% 11% Foreign exchange and other trading activities 112 125 161 206 200 79 (3) Other 53 60 56 53 44 (17) (17) Total fee and other revenue 774 850 906 1,027 1,095 41 7 Net interest revenue 154 180 195 224 221 44 (1) Total revenue 928 1,030 1,101 1,251 1,316 42 5 Noninterest expense (ex. intangible amortization) 681 733 753 807 745 9 (8) Income before taxes (ex. intangible amortization) 247 297 348 444 571 131 29 Amortization of intangible assets (c) 3 3 6 6 7 133 17 Income before taxes $ 244 $ 294 $ 342 $ 438 $ 564 131% 29% Average deposits $34,179 $37,267 $37,971 $ 42,338 $46,964 37% 11% Pre-tax operating margin (ex. intangible amortization) 27% 29% 32% 35% 43% Market value of securities on loan at period-end (in billions)(d) $ 661 $ 678 $ 663 $ 633 $ 676 2% 7% Securities lending revenue $ 65 $ 99 $ 110 $ 164 $ 242 272% 48% Global collateral management balances at period-end (in billions) $ 1,519 $ 1,548 $ 1,692 $ 1,717 $ 1,864 23% 9% (a) Excluding intangible amortization and the Other segment. (b) Pro forma combined results for BNY Mellon. (c) Results prior to 3Q07 exclude the pro forma impact of incremental purchase accounting intangible amortization resulting from The Bank
of New York Mellon merger. (d) Represents the total amount of securities on loan, both cash and non-cash managed by the Asset Servicing segment. KEY POINTS • Asset servicing fees increased 40% reflecting a 272% increase in securities lending revenue, increased client
activity related to market volatility as well as net new business and the 4Q07 acquisition of the joint venture with ABN AMRO. The increase in securities lending fees primarily reflects favorable spreads in the short-term credit markets.
• Foreign exchange and other trading activities increased 79% reflecting the benefit of higher client volumes as well as significant increases in currency volatility.
• Net interest revenue increased 44% due to higher average deposit levels and improved spreads. • Noninterest expense (excluding intangible amortization) increased 9% year-over-year and declined 8%
(unannualized) sequentially. • The year-over-year increase reflects the impact of new business and other growth initiatives as well as $12
million of expense related to capital support agreements, partially offset by the impact of merger-related synergies.
• The sequential decline principally reflects the impact of merger-related synergies, lower sub-custodian fees and seasonality.
• 43% non-U.S. revenue in 1Q08. • New business pipelines remain strong. • R&M Global Custody Survey – BNY Mellon #1 rated custodian among the large custodian peer group
(Released March 2008). • Revenue retention rate continues to exceed 98% target.
The Bank of New York Mellon 1Q08 Quarterly Earnings Summary
Page 15
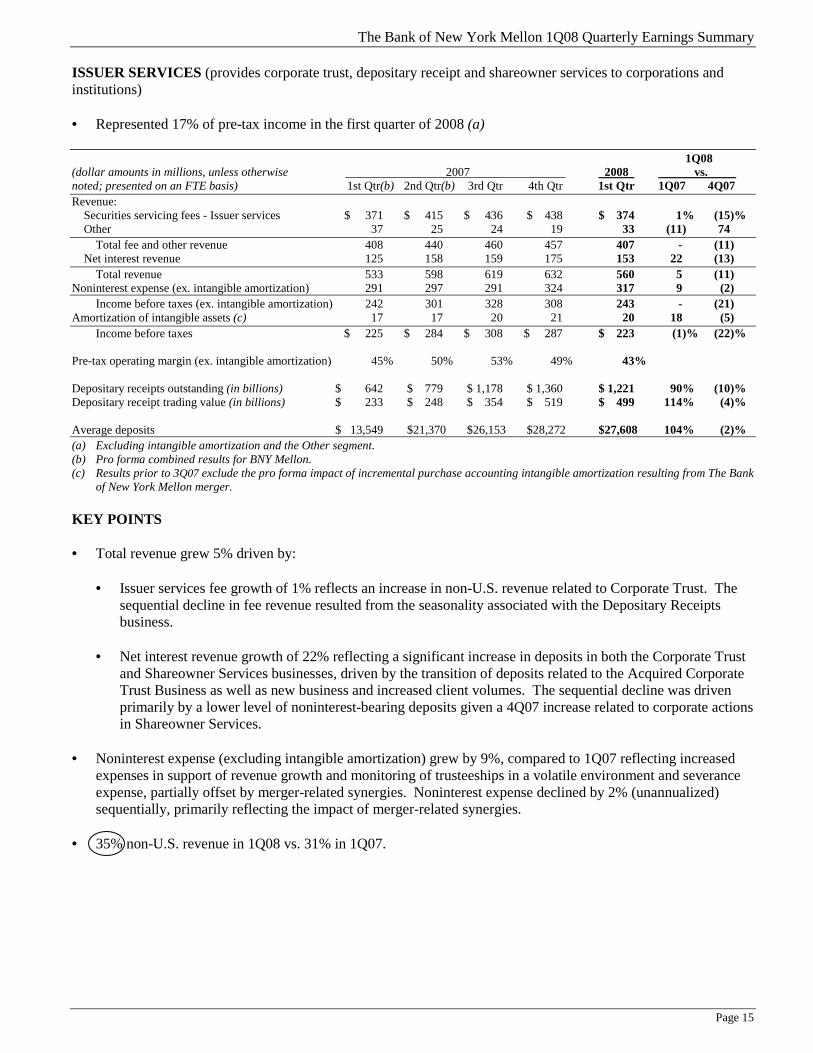
ISSUER SERVICES (provides corporate trust, depositary receipt and shareowner services to corporations and institutions) • Represented 17% of pre-tax income in the first quarter of 2008 (a)
1Q08 (dollar amounts in millions, unless otherwise 2007 2008 vs. noted; presented on an FTE basis) 1st Qtr(b) 2nd Qtr(b) 3rd Qtr 4th Qtr 1st Qtr 1Q07 4Q07 Revenue: Securities servicing fees - Issuer services $ 371 $ 415 $ 436 $ 438 $ 374 1% (15)% Other 37 25 24 19 33 (11) 74 Total fee and other revenue 408 440 460 457 407 - (11) Net interest revenue 125 158 159 175 153 22 (13) Total revenue 533 598 619 632 560 5 (11) Noninterest expense (ex. intangible amortization) 291 297 291 324 317 9 (2) Income before taxes (ex. intangible amortization) 242 301 328 308 243 - (21) Amortization of intangible assets (c) 17 17 20 21 20 18 (5) Income before taxes $ 225 $ 284 $ 308 $ 287 $ 223 (1)% (22)% Pre-tax operating margin (ex. intangible amortization) 45% 50% 53% 49% 43% Depositary receipts outstanding (in billions) $ 642 $ 779 $ 1,178 $ 1,360 $ 1,221 90% (10)% Depositary receipt trading value (in billions) $ 233 $ 248 $ 354 $ 519 $ 499 114% (4)% Average deposits $ 13,549 $21,370 $26,153 $28,272 $27,608 104% (2)% (a) Excluding intangible amortization and the Other segment. (b) Pro forma combined results for BNY Mellon. (c) Results prior to 3Q07 exclude the pro forma impact of incremental purchase accounting intangible amortization resulting from The Bank
of New York Mellon merger. KEY POINTS • Total revenue grew 5% driven by:
• Issuer services fee growth of 1% reflects an increase in non-U.S. revenue related to Corporate Trust. The sequential decline in fee revenue resulted from the seasonality associated with the Depositary Receipts business.
• Net interest revenue growth of 22% reflecting a significant increase in deposits in both the Corporate Trust
and Shareowner Services businesses, driven by the transition of deposits related to the Acquired Corporate Trust Business as well as new business and increased client volumes. The sequential decline was driven primarily by a lower level of noninterest-bearing deposits given a 4Q07 increase related to corporate actions in Shareowner Services.
• Noninterest expense (excluding intangible amortization) grew by 9%, compared to 1Q07 reflecting increased
expenses in support of revenue growth and monitoring of trusteeships in a volatile environment and severance expense, partially offset by merger-related synergies. Noninterest expense declined by 2% (unannualized) sequentially, primarily reflecting the impact of merger-related synergies.
• 35% non-U.S. revenue in 1Q08 vs. 31% in 1Q07.
The Bank of New York Mellon 1Q08 Quarterly Earnings Summary
Page 16
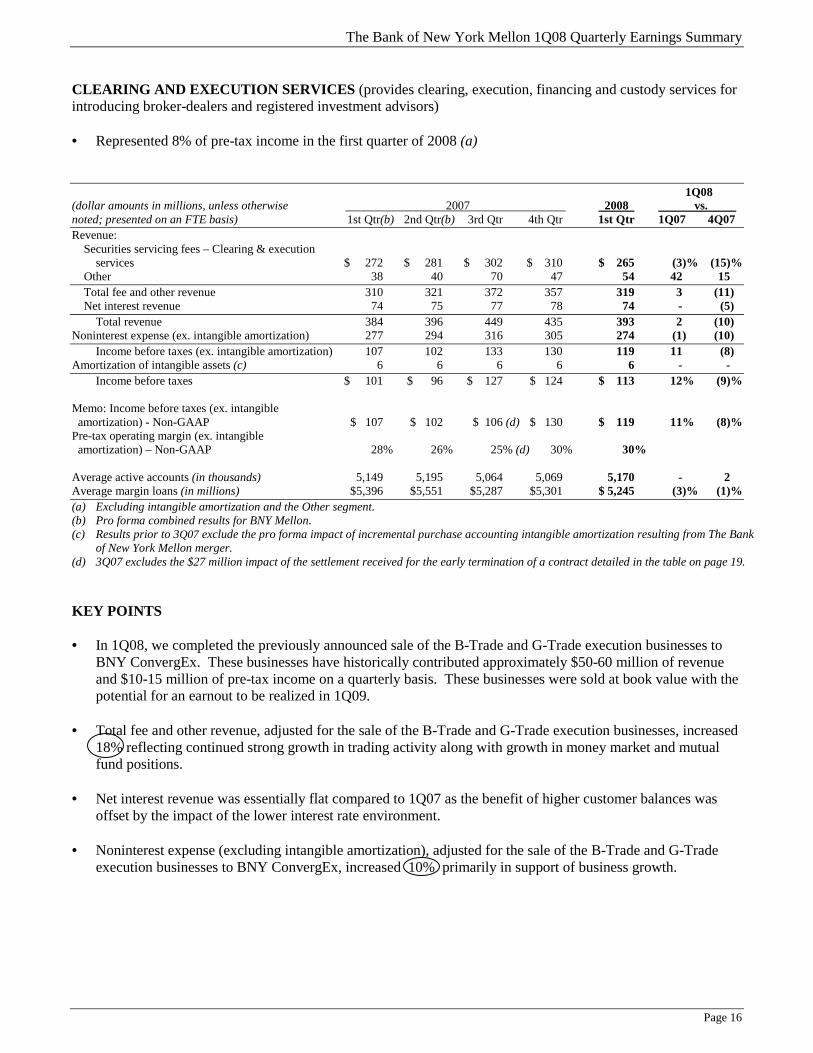
CLEARING AND EXECUTION SERVICES (provides clearing, execution, financing and custody services for introducing broker-dealers and registered investment advisors) • Represented 8% of pre-tax income in the first quarter of 2008 (a)
1Q08 (dollar amounts in millions, unless otherwise 2007 2008 vs. noted; presented on an FTE basis) 1st Qtr(b) 2nd Qtr(b) 3rd Qtr 4th Qtr 1st Qtr 1Q07 4Q07 Revenue: Securities servicing fees – Clearing & execution services $ 272 $ 281 $ 302 $ 310 $ 265 (3)% (15)% Other 38 40 70 47 54 42 15 Total fee and other revenue 310 321 372 357 319 3 (11) Net interest revenue 74 75 77 78 74 - (5) Total revenue 384 396 449 435 393 2 (10) Noninterest expense (ex. intangible amortization) 277 294 316 305 274 (1) (10) Income before taxes (ex. intangible amortization) 107 102 133 130 119 11 (8) Amortization of intangible assets (c) 6 6 6 6 6 - - Income before taxes $ 101 $ 96 $ 127 $ 124 $ 113 12% (9)% Memo: Income before taxes (ex. intangible amortization) - Non-GAAP $ 107 $ 102 $ 106 (d) $ 130 $ 119 11% (8)% Pre-tax operating margin (ex. intangible amortization) – Non-GAAP 28% 26% 25% (d) 30% 30% Average active accounts (in thousands) 5,149 5,195 5,064 5,069 5,170 - 2 Average margin loans (in millions) $5,396 $5,551 $5,287 $5,301 $ 5,245 (3)% (1)% (a) Excluding intangible amortization and the Other segment. (b) Pro forma combined results for BNY Mellon. (c) Results prior to 3Q07 exclude the pro forma impact of incremental purchase accounting intangible amortization resulting from The Bank
of New York Mellon merger. (d) 3Q07 excludes the $27 million impact of the settlement received for the early termination of a contract detailed in the table on page 19. KEY POINTS • In 1Q08, we completed the previously announced sale of the B-Trade and G-Trade execution businesses to
BNY ConvergEx. These businesses have historically contributed approximately $50-60 million of revenue and $10-15 million of pre-tax income on a quarterly basis. These businesses were sold at book value with the potential for an earnout to be realized in 1Q09.
• Total fee and other revenue, adjusted for the sale of the B-Trade and G-Trade execution businesses, increased
18% reflecting continued strong growth in trading activity along with growth in money market and mutual fund positions.
• Net interest revenue was essentially flat compared to 1Q07 as the benefit of higher customer balances was
offset by the impact of the lower interest rate environment. • Noninterest expense (excluding intangible amortization), adjusted for the sale of the B-Trade and G-Trade
execution businesses to BNY ConvergEx, increased 10% primarily in support of business growth.
The Bank of New York Mellon 1Q08 Quarterly Earnings Summary
Page 17
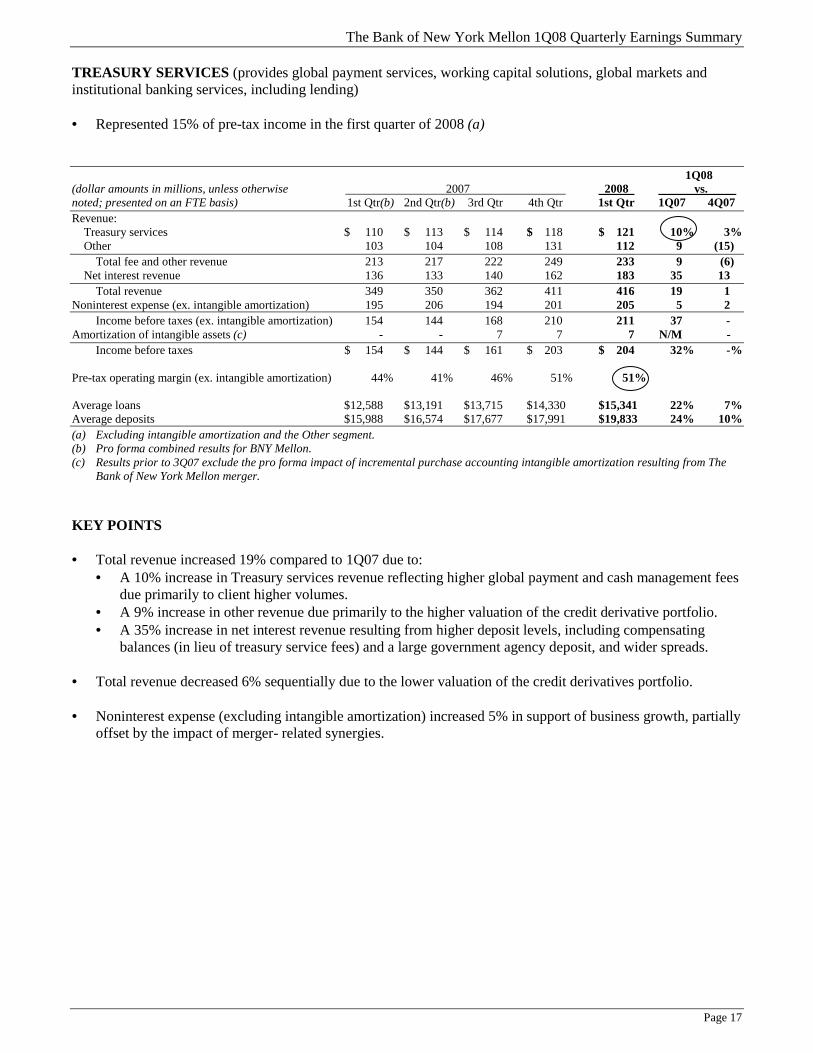
TREASURY SERVICES (provides global payment services, working capital solutions, global markets and institutional banking services, including lending) • Represented 15% of pre-tax income in the first quarter of 2008 (a)
1Q08 (dollar amounts in millions, unless otherwise 2007 2008 vs. noted; presented on an FTE basis) 1st Qtr(b) 2nd Qtr(b) 3rd Qtr 4th Qtr 1st Qtr 1Q07 4Q07 Revenue: Treasury services $ 110 $ 113 $ 114 $ 118 $ 121 10% 3% Other 103 104 108 131 112 9 (15) Total fee and other revenue 213 217 222 249 233 9 (6) Net interest revenue 136 133 140 162 183 35 13 Total revenue 349 350 362 411 416 19 1 Noninterest expense (ex. intangible amortization) 195 206 194 201 205 5 2 Income before taxes (ex. intangible amortization) 154 144 168 210 211 37 - Amortization of intangible assets (c) - - 7 7 7 N/M - Income before taxes $ 154 $ 144 $ 161 $ 203 $ 204 32% -% Pre-tax operating margin (ex. intangible amortization) 44% 41% 46% 51% 51% Average loans $12,588 $13,191 $13,715 $14,330 $15,341 22% 7% Average deposits $15,988 $16,574 $17,677 $17,991 $19,833 24% 10% (a) Excluding intangible amortization and the Other segment. (b) Pro forma combined results for BNY Mellon. (c) Results prior to 3Q07 exclude the pro forma impact of incremental purchase accounting intangible amortization resulting from The
Bank of New York Mellon merger. KEY POINTS • Total revenue increased 19% compared to 1Q07 due to:
• A 10% increase in Treasury services revenue reflecting higher global payment and cash management fees due primarily to client higher volumes.
• A 9% increase in other revenue due primarily to the higher valuation of the credit derivative portfolio. • A 35% increase in net interest revenue resulting from higher deposit levels, including compensating
balances (in lieu of treasury service fees) and a large government agency deposit, and wider spreads. • Total revenue decreased 6% sequentially due to the lower valuation of the credit derivatives portfolio.
• Noninterest expense (excluding intangible amortization) increased 5% in support of business growth, partially
offset by the impact of merger- related synergies.

The Bank of New York Mellon 1Q08 Quarterly Earnings Summary
Page - 18
OTHER (primarily includes the leasing portfolio, business exits, Corporate Treasury activities, merger and integration charges and other corporate revenue and expense items)
(dollar amounts in millions, unless otherwise 2007 2008 noted; presented on an FTE basis) 1st Qtr(a) 2nd Qtr(a) 3rd Qtr 4th Qtr 1st Qtr Revenue: Fee and other revenue $ 104 $ 87 $ 74 $ (93) $ 12 Net interest revenue (27) (39) 22 15 32 Total revenue 77 48 96 (78) 44 Provision for credit losses (12) (18) - 20 16 Noninterest expense (ex. intangible amortization/merger and integration expense) 130 204 103 132 101 Income (loss) before taxes (ex. intangible amortization/merger and integration expense) (41) (138) (7) (230) (73) Amortization of intangible assets (b) - - 1 - - Merger and integration expenses: The Bank of New York Mellon 12 151 205 111 121 Acquired Corporate Trust Business 11 12 13 13 5 Income (loss) before taxes $ (64) $ (301) $ (226) $ (354) $ (199) Memo: Income (loss) before taxes (ex. intangible amortization/ merger and integration expense) – non-GAAP (c) $ (29) $ (57) $ 21 $ (230) $ (73) (a) Pro forma combined results for BNY Mellon. (b) Results prior to 3Q07 exclude the pro forma impact of incremental purchase accounting intangible amortization resulting from The Bank
of New York Mellon merger. (c) Adjusted for items detailed in the table on page 19. KEY POINTS • Fee and other revenue decreased $92 million, due primarily to the writedown of certain investments in the
securities portfolio and the impact of SFAS 157, partially offset by the benefit associated with the initial public offering for VISA.
• Net interest revenue increased $59 million due to the impact of the changing interest rate environment on
Corporate Treasury allocations. • Noninterest expense (excluding intangible amortization/merger and integration expense) decreased $29 million
due primarily to lower pension expense and lower transition service agreement expense related to the Acquired Corporate Trust Business.
The Bank of New York Mellon 1Q08 Quarterly Earnings Summary
Page - 19
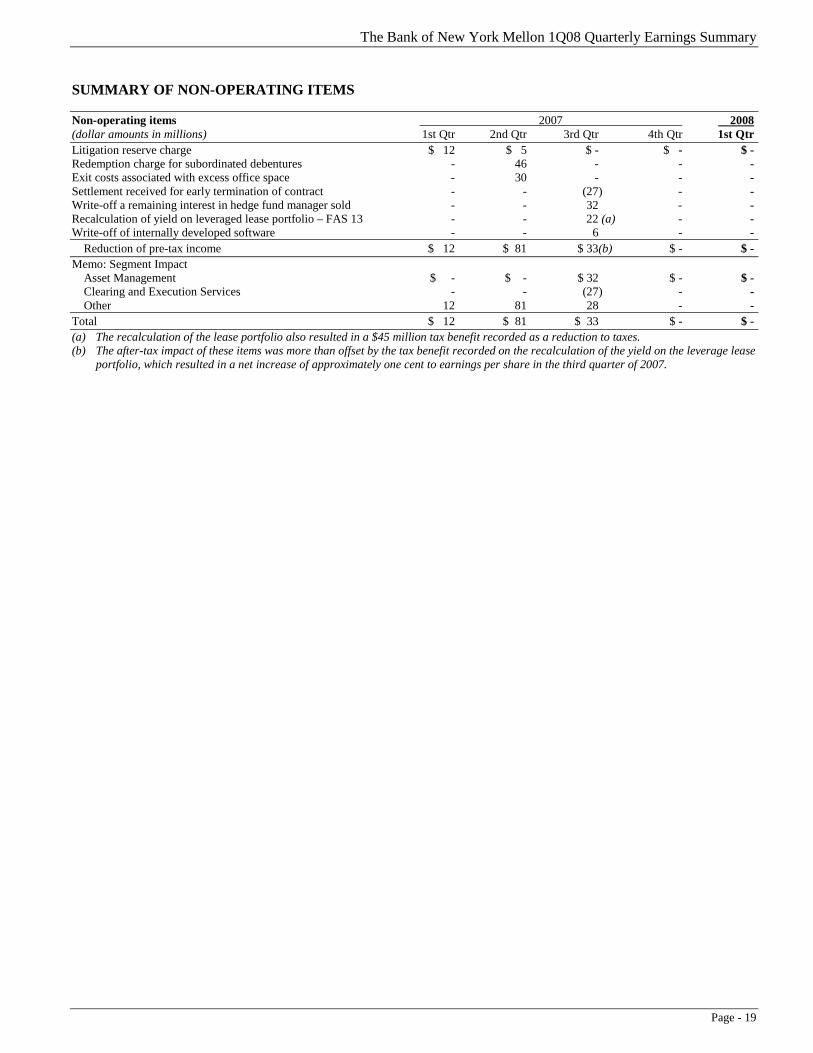
SUMMARY OF NON-OPERATING ITEMS Non-operating items 2007 2008 (dollar amounts in millions) 1st Qtr 2nd Qtr 3rd Qtr 4th Qtr 1st Qtr Litigation reserve charge $ 12 $ 5 $ - $ - $ - Redemption charge for subordinated debentures - 46 - - - Exit costs associated with excess office space - 30 - - - Settlement received for early termination of contract - - (27) - - Write-off a remaining interest in hedge fund manager sold - - 32 - - Recalculation of yield on leveraged lease portfolio – FAS 13 - - 22 (a) - - Write-off of internally developed software - - 6 - - Reduction of pre-tax income $ 12 $ 81 $ 33(b) $ - $ - Memo: Segment Impact Asset Management $ - $ - $ 32 $ - $ - Clearing and Execution Services - - (27) - - Other 12 81 28 - - Total $ 12 $ 81 $ 33 $ - $ - (a) The recalculation of the lease portfolio also resulted in a $45 million tax benefit recorded as a reduction to taxes. (b) The after-tax impact of these items was more than offset by the tax benefit recorded on the recalculation of the yield on the leverage lease
portfolio, which resulted in a net increase of approximately one cent to earnings per share in the third quarter of 2007.
The Bank of New York Mellon 1Q08 Quarterly Earnings Summary
Page - 20
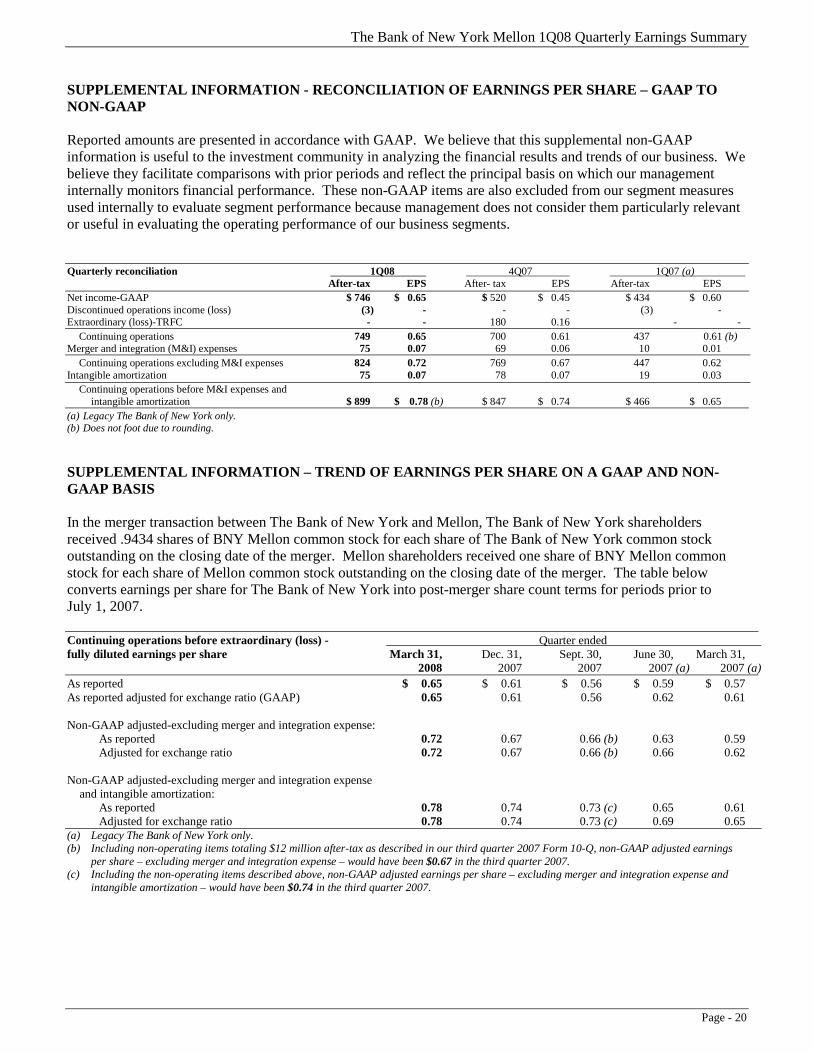
SUPPLEMENTAL INFORMATION - RECONCILIATION OF EARNINGS PER SHARE – GAAP TO NON-GAAP Reported amounts are presented in accordance with GAAP. We believe that this supplemental non-GAAP information is useful to the investment community in analyzing the financial results and trends of our business. We believe they facilitate comparisons with prior periods and reflect the principal basis on which our management internally monitors financial performance. These non-GAAP items are also excluded from our segment measures used internally to evaluate segment performance because management does not consider them particularly relevant or useful in evaluating the operating performance of our business segments. Quarterly reconciliation 1Q08 4Q07 1Q07 (a) After-tax EPS After- tax EPS After-tax EPS Net income-GAAP $ 746 $ 0.65 $ 520 $ 0.45 $ 434 $ 0.60 Discontinued operations income (loss) (3) - - - (3) - Extraordinary (loss)-TRFC - - 180 0.16 - - Continuing operations 749 0.65 700 0.61 437 0.61 (b) Merger and integration (M&I) expenses 75 0.07 69 0.06 10 0.01 Continuing operations excluding M&I expenses 824 0.72 769 0.67 447 0.62 Intangible amortization 75 0.07 78 0.07 19 0.03 Continuing operations before M&I expenses and intangible amortization $ 899 $ 0.78 (b) $ 847 $ 0.74 $ 466 $ 0.65 (a) Legacy The Bank of New York only. (b) Does not foot due to rounding. SUPPLEMENTAL INFORMATION – TREND OF EARNINGS PER SHARE ON A GAAP AND NON-GAAP BASIS In the merger transaction between The Bank of New York and Mellon, The Bank of New York shareholders received .9434 shares of BNY Mellon common stock for each share of The Bank of New York common stock outstanding on the closing date of the merger. Mellon shareholders received one share of BNY Mellon common stock for each share of Mellon common stock outstanding on the closing date of the merger. The table below converts earnings per share for The Bank of New York into post-merger share count terms for periods prior to July 1, 2007. Continuing operations before extraordinary (loss) - Quarter ended fully diluted earnings per share March 31, Dec. 31, Sept. 30, June 30, March 31, 2008 2007 2007 2007 (a) 2007 (a) As reported $ 0.65 $ 0.61 $ 0.56 $ 0.59 $ 0.57 As reported adjusted for exchange ratio (GAAP) 0.65 0.61 0.56 0.62 0.61 Non-GAAP adjusted-excluding merger and integration expense: As reported 0.72 0.67 0.66 (b) 0.63 0.59 Adjusted for exchange ratio 0.72 0.67 0.66 (b) 0.66 0.62 Non-GAAP adjusted-excluding merger and integration expense and intangible amortization: As reported 0.78 0.74 0.73 (c) 0.65 0.61 Adjusted for exchange ratio 0.78 0.74 0.73 (c) 0.69 0.65 (a) Legacy The Bank of New York only. (b) Including non-operating items totaling $12 million after-tax as described in our third quarter 2007 Form 10-Q, non-GAAP adjusted earnings
per share – excluding merger and integration expense – would have been $0.67 in the third quarter 2007. (c) Including the non-operating items described above, non-GAAP adjusted earnings per share – excluding merger and integration expense and
intangible amortization – would have been $0.74 in the third quarter 2007.