Embed Size (px)
Citation preview
Aggregate Data
Industry Size of Industry (Wages) Total $ Impact on Wages # Jobs Lost % Change $Architecture & Engineering $108,709,406,000 $9,075,548,000 158,600 8.35%
Arts, Entertainment, & Media $81,221,314,000 $3,649,825,000 67,000 4.49%Building & Grounds Cleaning $79,946,802,000 $0 0 0.00%
Business & Financial Operations $160,677,814,800 $111,367,405,600 1,771,980 69.31%Community & Social Services $8,795,039,000 $0 0 0.00%Computer & Mathematical $217,302,038,000 $0 0 0.00%Construction & Extraction $85,476,083,300 $50,586,164,300 1,274,470 59.18%
Education, Training, & Library $327,883,974,800 $283,704,800 5,360 0.09%Food Preparation & Serving Related $95,370,009,000 $90,452,417,000 4,420,890 94.84%Healthcare Practitioners & Technical $236,228,414,000 $0 0 0.00%
Healthcare Support $22,996,398,000 $0 0 0.00%Installation, Maintenance, & Repair $9,511,697,300 $9,326,823,900 185,860 98.06%
Legal $105,379,773,000 $13,016,230,000 277,000 12.35%Life, Physical, & Social Science $36,245,155,500 $0 0 0.00%
Management $246,444,712,000 $0 0 0.00%Office & Administrative Support $139,383,574,500 $123,458,667,400 3,621,140 88.57%
Personal Care & Service $65,852,120,500 $29,650,000,200 1,393,140 45.03%Production $55,744,698,500 $33,235,315,300 1,109,130 59.62%
Protective Service $49,287,746,400 $0 0 0.00%Sales & Related $298,832,238,200 $225,887,794,200 9,005,780 75.59%
Transportation & Material Moving $206,450,694,100 $183,275,281,600 6,571,150 88.77%
Total $2,637,739,702,900 $883,265,177,300 29,861,500 33.49%
1 © 2015 Parin J. Patel
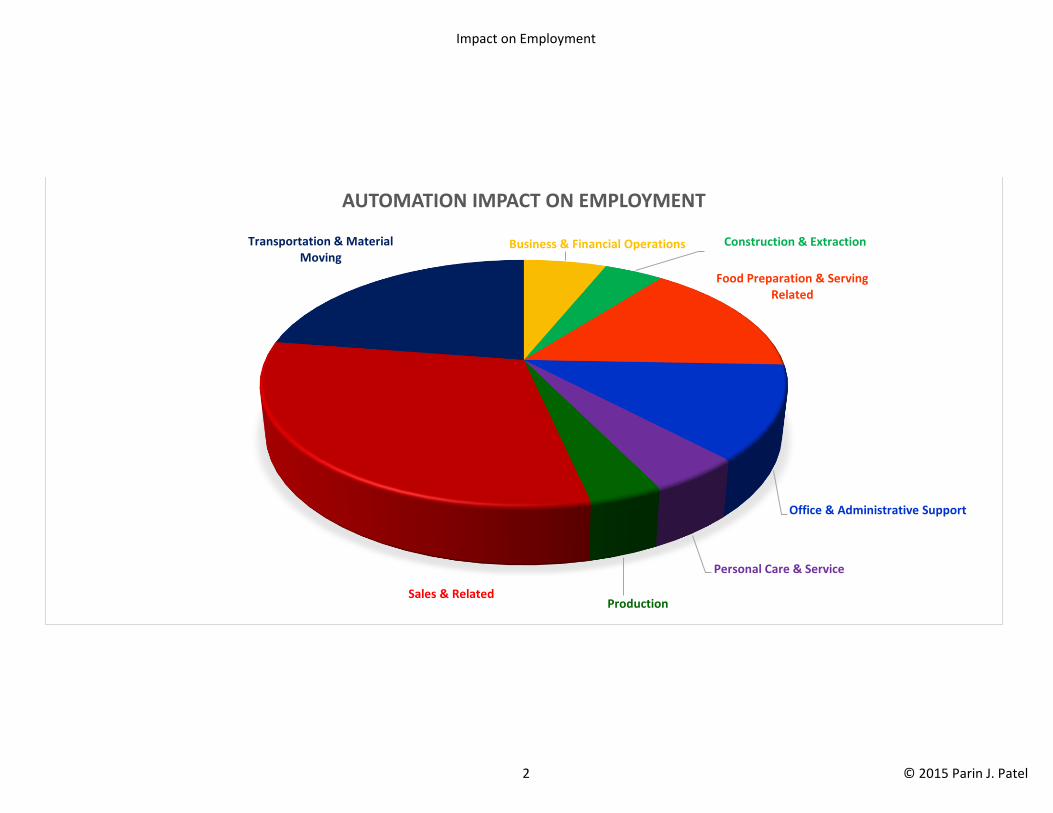
Impact on Employment
Business & Financial Operations Construction & Extraction
Food Preparation & Serving Related
Office & Administrative Support
Personal Care & Service
ProductionSales & Related
Transportation & Material Moving
AUTOMATION IMPACT ON EMPLOYMENT
2 © 2015 Parin J. Patel
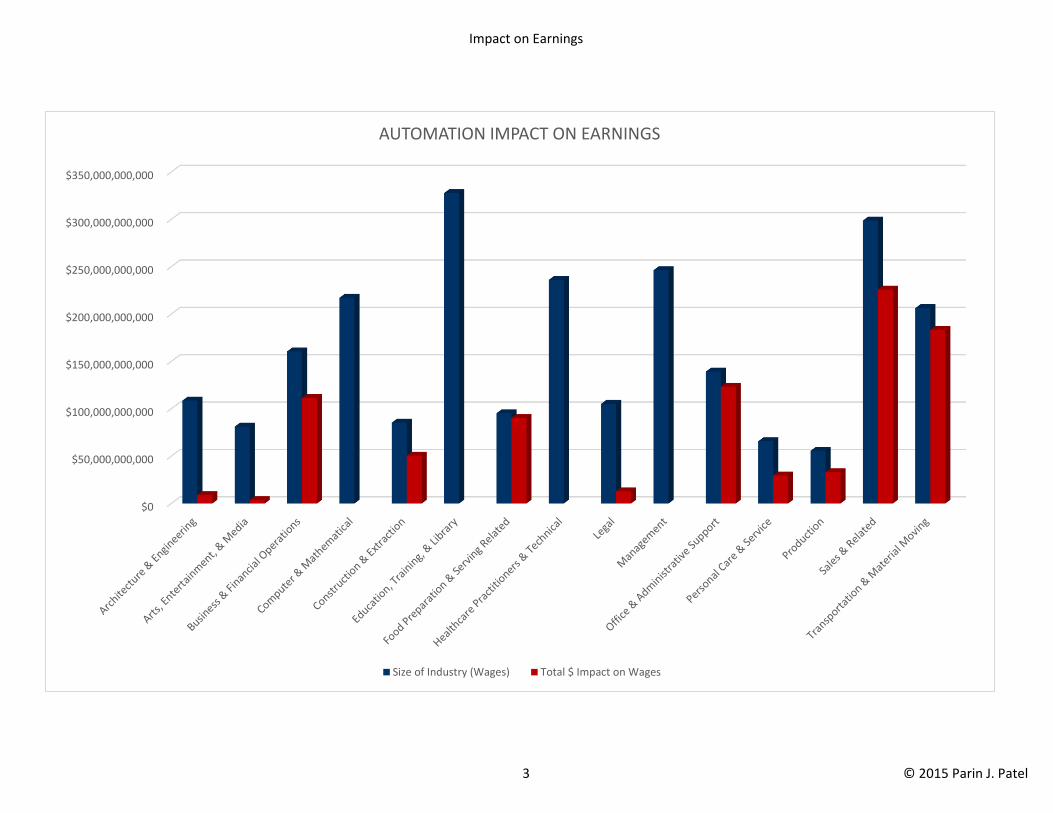
Impact on Earnings
$0
$50,000,000,000
$100,000,000,000
$150,000,000,000
$200,000,000,000
$250,000,000,000
$300,000,000,000
$350,000,000,000
AUTOMATION IMPACT ON EARNINGS
Size of Industry (Wages) Total $ Impact on Wages
3 © 2015 Parin J. Patel
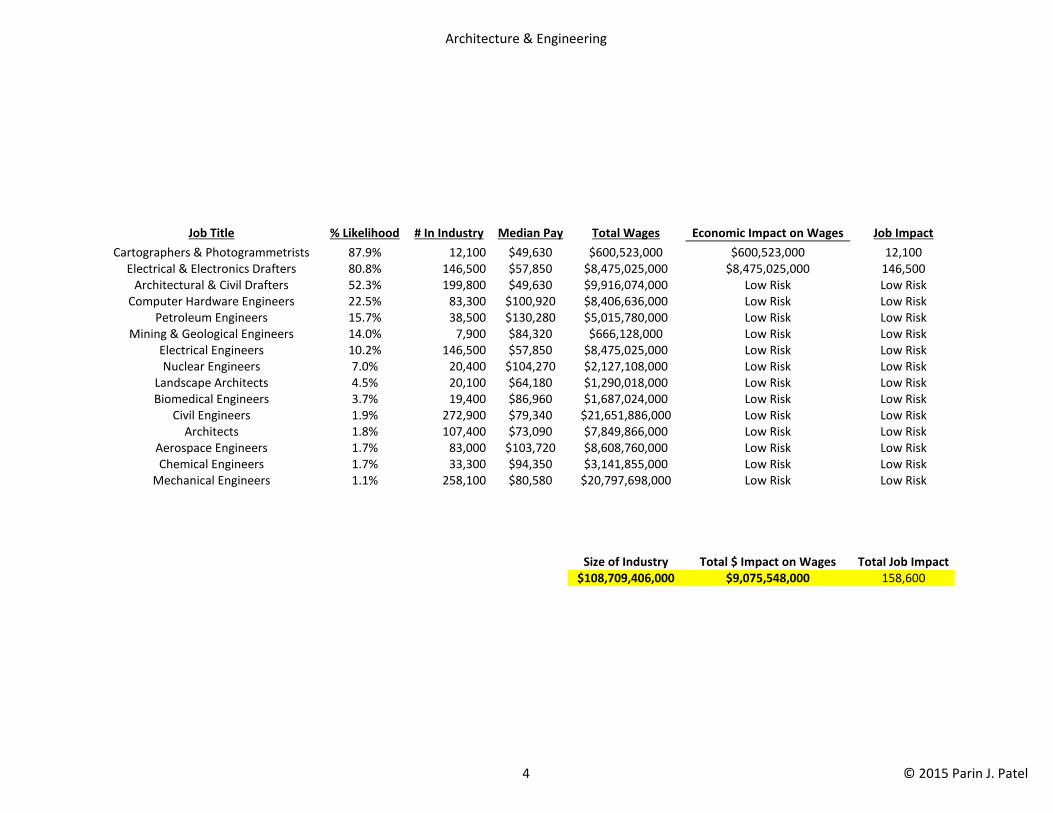
Architecture & Engineering
Job Title % Likelihood # In Industry Median Pay Total Wages Economic Impact on Wages Job Impact
Cartographers & Photogrammetrists 87.9% 12,100 $49,630 $600,523,000 $600,523,000 12,100Electrical & Electronics Drafters 80.8% 146,500 $57,850 $8,475,025,000 $8,475,025,000 146,500
Architectural & Civil Drafters 52.3% 199,800 $49,630 $9,916,074,000 Low Risk Low RiskComputer Hardware Engineers 22.5% 83,300 $100,920 $8,406,636,000 Low Risk Low Risk
Petroleum Engineers 15.7% 38,500 $130,280 $5,015,780,000 Low Risk Low RiskMining & Geological Engineers 14.0% 7,900 $84,320 $666,128,000 Low Risk Low Risk
Electrical Engineers 10.2% 146,500 $57,850 $8,475,025,000 Low Risk Low RiskNuclear Engineers 7.0% 20,400 $104,270 $2,127,108,000 Low Risk Low Risk
Landscape Architects 4.5% 20,100 $64,180 $1,290,018,000 Low Risk Low RiskBiomedical Engineers 3.7% 19,400 $86,960 $1,687,024,000 Low Risk Low Risk
Civil Engineers 1.9% 272,900 $79,340 $21,651,886,000 Low Risk Low RiskArchitects 1.8% 107,400 $73,090 $7,849,866,000 Low Risk Low Risk
Aerospace Engineers 1.7% 83,000 $103,720 $8,608,760,000 Low Risk Low RiskChemical Engineers 1.7% 33,300 $94,350 $3,141,855,000 Low Risk Low Risk
Mechanical Engineers 1.1% 258,100 $80,580 $20,797,698,000 Low Risk Low Risk
Size of Industry Total $ Impact on Wages Total Job Impact$108,709,406,000 $9,075,548,000 158,600
4 © 2015 Parin J. Patel
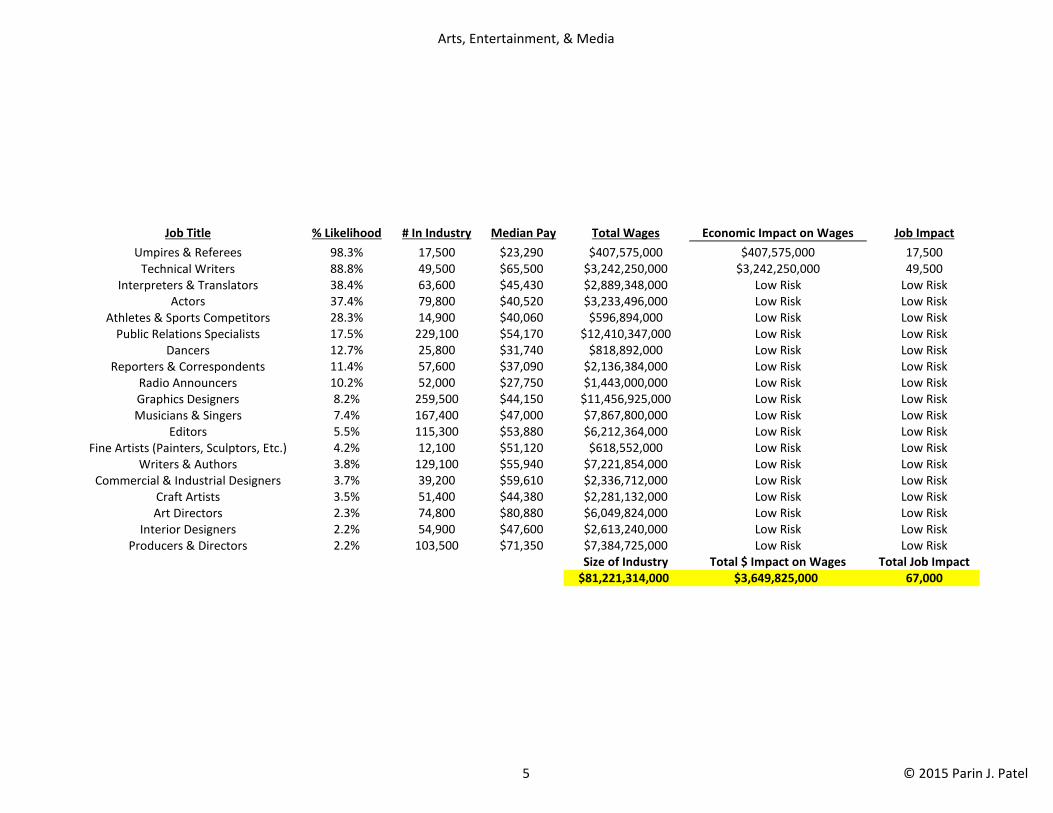
Arts, Entertainment, & Media
Job Title % Likelihood # In Industry Median Pay Total Wages Economic Impact on Wages Job Impact
Umpires & Referees 98.3% 17,500 $23,290 $407,575,000 $407,575,000 17,500Technical Writers 88.8% 49,500 $65,500 $3,242,250,000 $3,242,250,000 49,500
Interpreters & Translators 38.4% 63,600 $45,430 $2,889,348,000 Low Risk Low RiskActors 37.4% 79,800 $40,520 $3,233,496,000 Low Risk Low Risk
Athletes & Sports Competitors 28.3% 14,900 $40,060 $596,894,000 Low Risk Low RiskPublic Relations Specialists 17.5% 229,100 $54,170 $12,410,347,000 Low Risk Low Risk
Dancers 12.7% 25,800 $31,740 $818,892,000 Low Risk Low RiskReporters & Correspondents 11.4% 57,600 $37,090 $2,136,384,000 Low Risk Low Risk
Radio Announcers 10.2% 52,000 $27,750 $1,443,000,000 Low Risk Low RiskGraphics Designers 8.2% 259,500 $44,150 $11,456,925,000 Low Risk Low RiskMusicians & Singers 7.4% 167,400 $47,000 $7,867,800,000 Low Risk Low Risk
Editors 5.5% 115,300 $53,880 $6,212,364,000 Low Risk Low RiskFine Artists (Painters, Sculptors, Etc.) 4.2% 12,100 $51,120 $618,552,000 Low Risk Low Risk
Writers & Authors 3.8% 129,100 $55,940 $7,221,854,000 Low Risk Low RiskCommercial & Industrial Designers 3.7% 39,200 $59,610 $2,336,712,000 Low Risk Low Risk
Craft Artists 3.5% 51,400 $44,380 $2,281,132,000 Low Risk Low RiskArt Directors 2.3% 74,800 $80,880 $6,049,824,000 Low Risk Low Risk
Interior Designers 2.2% 54,900 $47,600 $2,613,240,000 Low Risk Low RiskProducers & Directors 2.2% 103,500 $71,350 $7,384,725,000 Low Risk Low Risk
Size of Industry Total $ Impact on Wages Total Job Impact$81,221,314,000 $3,649,825,000 67,000
5 © 2015 Parin J. Patel
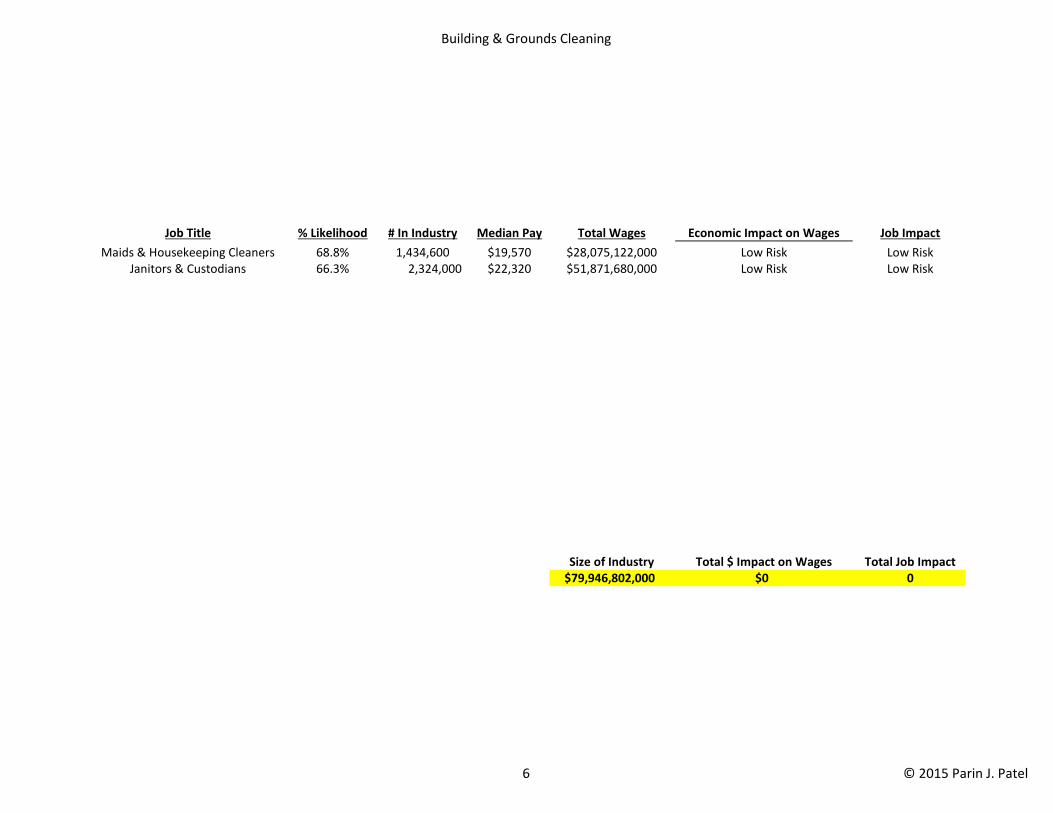
Building & Grounds Cleaning
Job Title % Likelihood # In Industry Median Pay Total Wages Economic Impact on Wages Job Impact
Maids & Housekeeping Cleaners 68.8% 1,434,600 $19,570 $28,075,122,000 Low Risk Low RiskJanitors & Custodians 66.3% 2,324,000 $22,320 $51,871,680,000 Low Risk Low Risk
Size of Industry Total $ Impact on Wages Total Job Impact$79,946,802,000 $0 0
6 © 2015 Parin J. Patel

Business & Financial Operations
Job Title % Likelihood # In Industry Median Pay Total Wages Economic Impact on Wages Job Impact
Tax Preparers 98.7% 68,590 $43,870 $3,009,043,300 $3,009,043,300 68,590Loan Officers 98.4% 296,900 $59,820 $17,760,558,000 $17,760,558,000 296,900
Credit Analysts 97.9% 69,390 $75,970 $5,271,558,300 $5,271,558,300 69,390Budget Analysts 93.8% 61,700 $69,280 $4,274,576,000 $4,274,576,000 61,700
Accountants & Auditors 93.5% 1,275,400 $63,550 $81,051,670,000 $81,051,670,000 1,275,400Market Research Analysts 61.3% 415,700 $60,300 $25,066,710,000 Low Risk Low Risk
Agents 24.3% 11,860 $97,220 $1,153,029,200 Low Risk Low RiskFinancial Analysts 23.3% 253,000 $76,950 $19,468,350,000 Low Risk Low Risk
Financial Examiners 17.0% 29,200 $75,800 $2,213,360,000 Low Risk Low RiskCredit Counselors 4.0% 29,600 $47,600 $1,408,960,000 Low Risk Low Risk
Size of Industry Total $ Impact on Wages Total Job Impact$160,677,814,800 $111,367,405,600 1,771,980
7 © 2015 Parin J. Patel
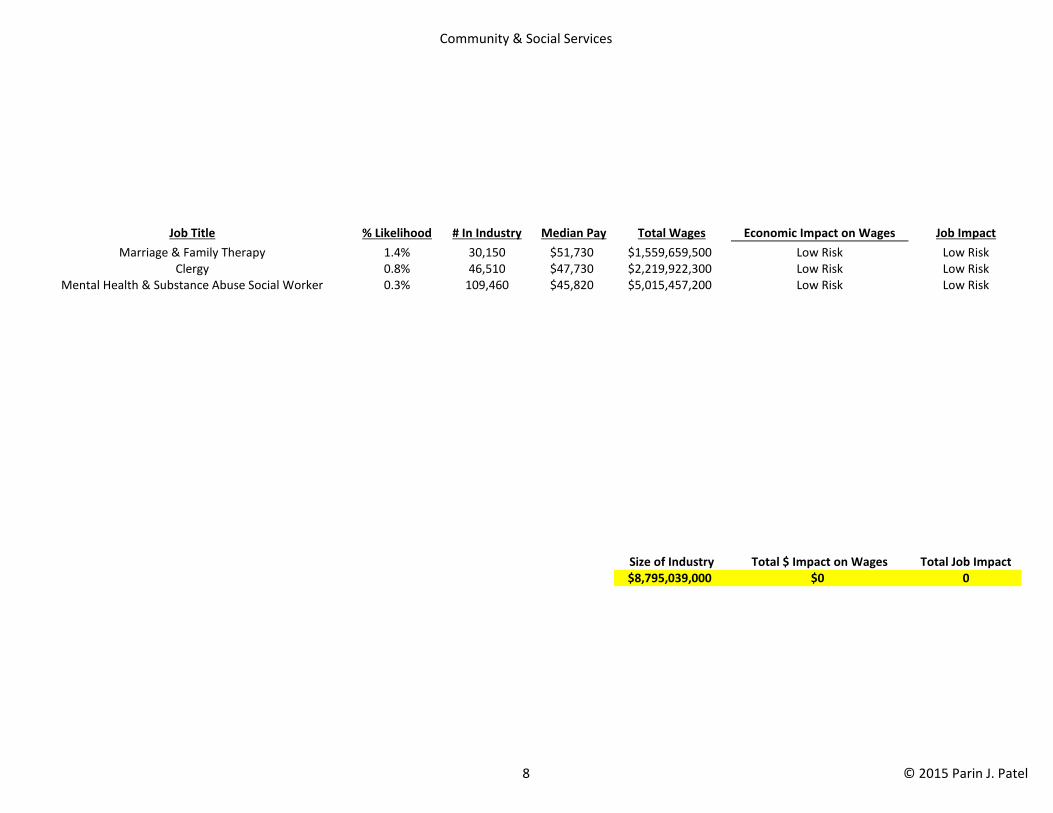
Community & Social Services
Job Title % Likelihood # In Industry Median Pay Total Wages Economic Impact on Wages Job Impact
Marriage & Family Therapy 1.4% 30,150 $51,730 $1,559,659,500 Low Risk Low RiskClergy 0.8% 46,510 $47,730 $2,219,922,300 Low Risk Low Risk
Mental Health & Substance Abuse Social Worker 0.3% 109,460 $45,820 $5,015,457,200 Low Risk Low Risk
Size of Industry Total $ Impact on Wages Total Job Impact$8,795,039,000 $0 0
8 © 2015 Parin J. Patel
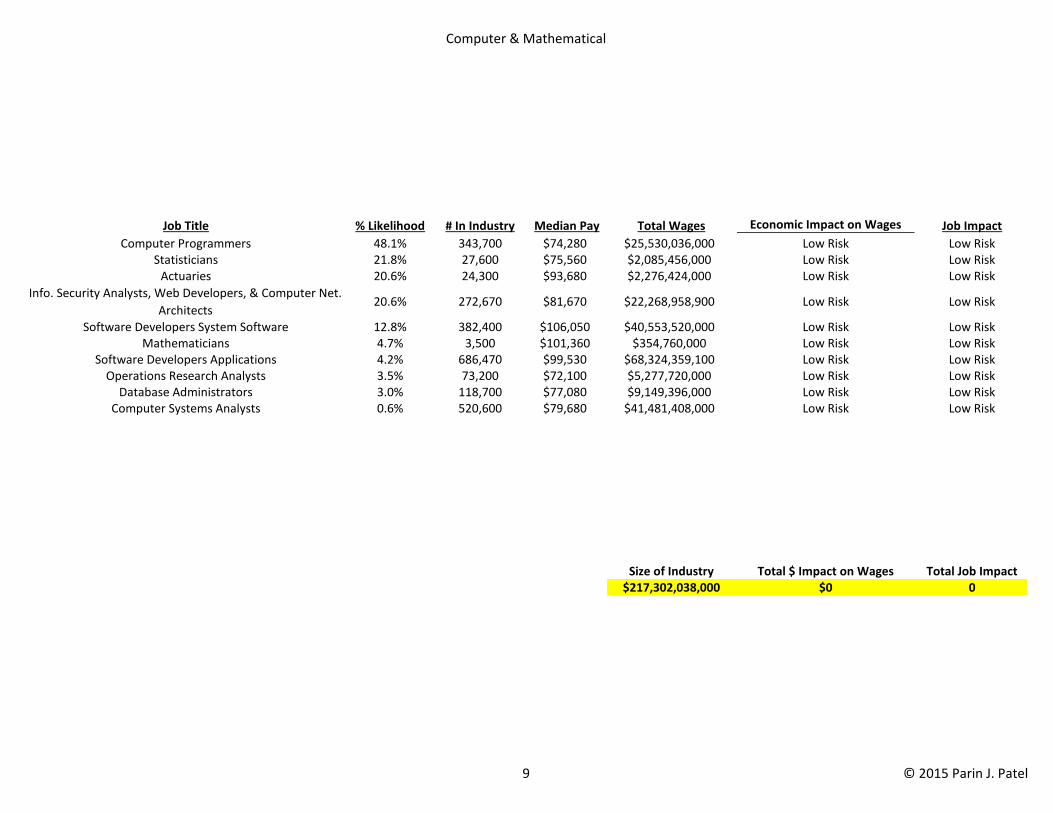
Computer & Mathematical
Job Title % Likelihood # In Industry Median Pay Total Wages Economic Impact on Wages Job Impact
Computer Programmers 48.1% 343,700 $74,280 $25,530,036,000 Low Risk Low RiskStatisticians 21.8% 27,600 $75,560 $2,085,456,000 Low Risk Low Risk
Actuaries 20.6% 24,300 $93,680 $2,276,424,000 Low Risk Low Risk
Info. Security Analysts, Web Developers, & Computer Net.
Architects20.6% 272,670 $81,670 $22,268,958,900 Low Risk Low Risk
Software Developers System Software 12.8% 382,400 $106,050 $40,553,520,000 Low Risk Low RiskMathematicians 4.7% 3,500 $101,360 $354,760,000 Low Risk Low Risk
Software Developers Applications 4.2% 686,470 $99,530 $68,324,359,100 Low Risk Low RiskOperations Research Analysts 3.5% 73,200 $72,100 $5,277,720,000 Low Risk Low Risk
Database Administrators 3.0% 118,700 $77,080 $9,149,396,000 Low Risk Low RiskComputer Systems Analysts 0.6% 520,600 $79,680 $41,481,408,000 Low Risk Low Risk
Size of Industry Total $ Impact on Wages Total Job Impact$217,302,038,000 $0 0
9 © 2015 Parin J. Patel
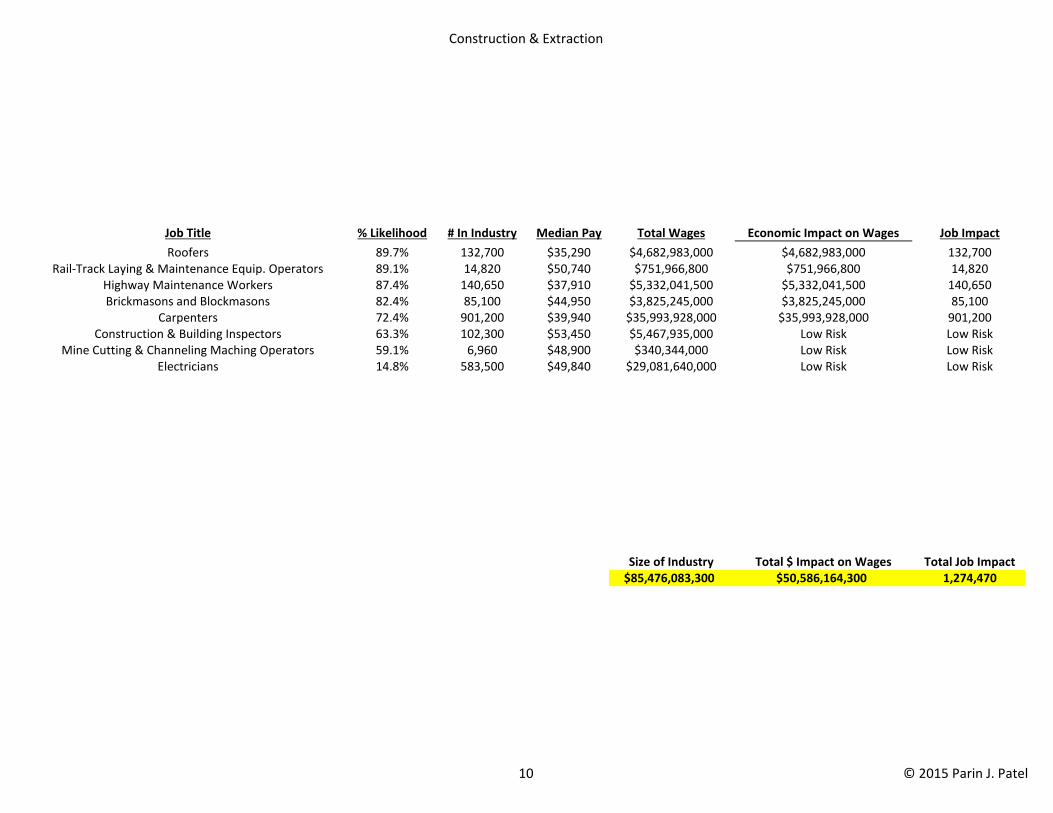
Construction & Extraction
Job Title % Likelihood # In Industry Median Pay Total Wages Economic Impact on Wages Job Impact
Roofers 89.7% 132,700 $35,290 $4,682,983,000 $4,682,983,000 132,700Rail-Track Laying & Maintenance Equip. Operators 89.1% 14,820 $50,740 $751,966,800 $751,966,800 14,820
Highway Maintenance Workers 87.4% 140,650 $37,910 $5,332,041,500 $5,332,041,500 140,650Brickmasons and Blockmasons 82.4% 85,100 $44,950 $3,825,245,000 $3,825,245,000 85,100
Carpenters 72.4% 901,200 $39,940 $35,993,928,000 $35,993,928,000 901,200Construction & Building Inspectors 63.3% 102,300 $53,450 $5,467,935,000 Low Risk Low Risk
Mine Cutting & Channeling Maching Operators 59.1% 6,960 $48,900 $340,344,000 Low Risk Low RiskElectricians 14.8% 583,500 $49,840 $29,081,640,000 Low Risk Low Risk
Size of Industry Total $ Impact on Wages Total Job Impact$85,476,083,300 $50,586,164,300 1,274,470
10 © 2015 Parin J. Patel
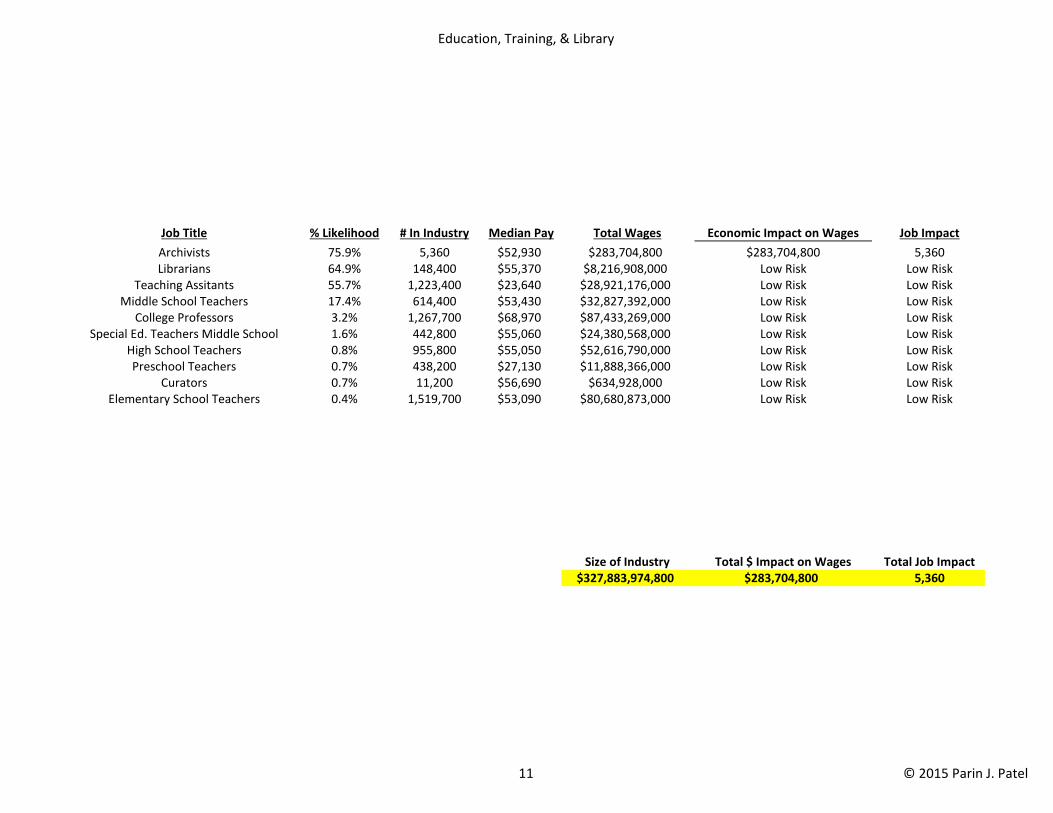
Education, Training, & Library
Job Title % Likelihood # In Industry Median Pay Total Wages Economic Impact on Wages Job Impact
Archivists 75.9% 5,360 $52,930 $283,704,800 $283,704,800 5,360Librarians 64.9% 148,400 $55,370 $8,216,908,000 Low Risk Low Risk
Teaching Assitants 55.7% 1,223,400 $23,640 $28,921,176,000 Low Risk Low RiskMiddle School Teachers 17.4% 614,400 $53,430 $32,827,392,000 Low Risk Low Risk
College Professors 3.2% 1,267,700 $68,970 $87,433,269,000 Low Risk Low RiskSpecial Ed. Teachers Middle School 1.6% 442,800 $55,060 $24,380,568,000 Low Risk Low Risk
High School Teachers 0.8% 955,800 $55,050 $52,616,790,000 Low Risk Low RiskPreschool Teachers 0.7% 438,200 $27,130 $11,888,366,000 Low Risk Low Risk
Curators 0.7% 11,200 $56,690 $634,928,000 Low Risk Low RiskElementary School Teachers 0.4% 1,519,700 $53,090 $80,680,873,000 Low Risk Low Risk
Size of Industry Total $ Impact on Wages Total Job Impact$327,883,974,800 $283,704,800 5,360
11 © 2015 Parin J. Patel
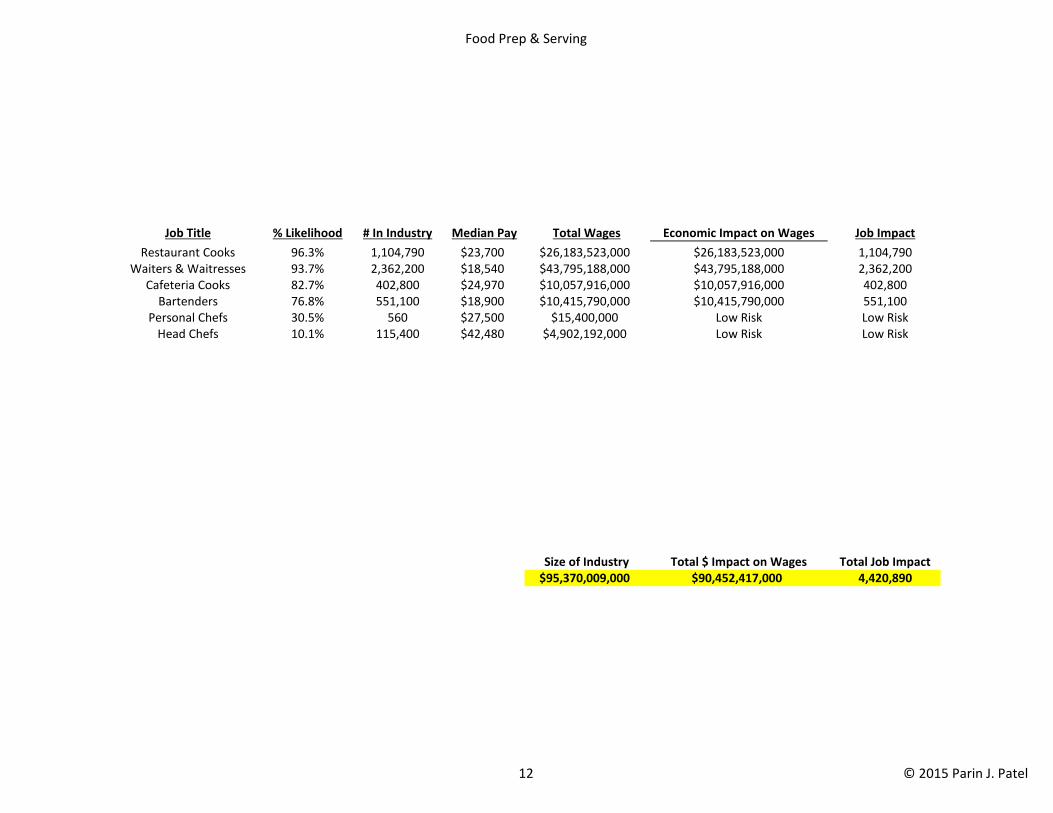
Food Prep & Serving
Job Title % Likelihood # In Industry Median Pay Total Wages Economic Impact on Wages Job Impact
Restaurant Cooks 96.3% 1,104,790 $23,700 $26,183,523,000 $26,183,523,000 1,104,790Waiters & Waitresses 93.7% 2,362,200 $18,540 $43,795,188,000 $43,795,188,000 2,362,200
Cafeteria Cooks 82.7% 402,800 $24,970 $10,057,916,000 $10,057,916,000 402,800Bartenders 76.8% 551,100 $18,900 $10,415,790,000 $10,415,790,000 551,100
Personal Chefs 30.5% 560 $27,500 $15,400,000 Low Risk Low RiskHead Chefs 10.1% 115,400 $42,480 $4,902,192,000 Low Risk Low Risk
Size of Industry Total $ Impact on Wages Total Job Impact$95,370,009,000 $90,452,417,000 4,420,890
12 © 2015 Parin J. Patel
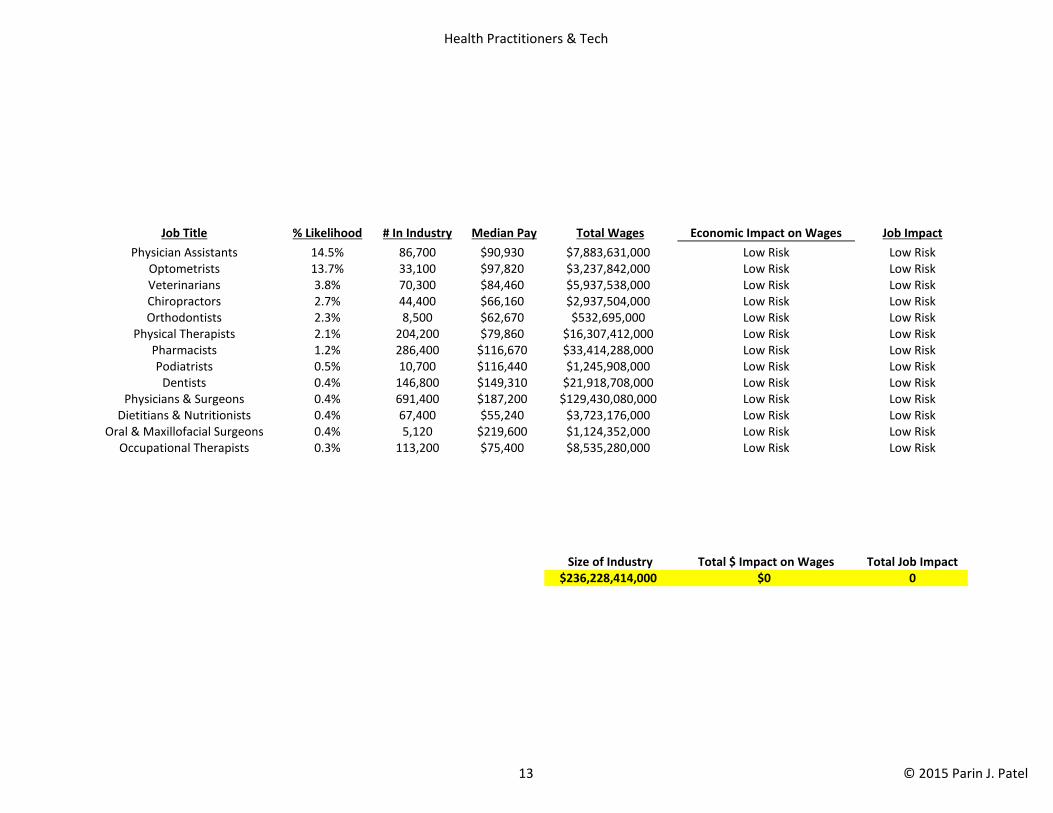
Health Practitioners & Tech
Job Title % Likelihood # In Industry Median Pay Total Wages Economic Impact on Wages Job Impact
Physician Assistants 14.5% 86,700 $90,930 $7,883,631,000 Low Risk Low RiskOptometrists 13.7% 33,100 $97,820 $3,237,842,000 Low Risk Low RiskVeterinarians 3.8% 70,300 $84,460 $5,937,538,000 Low Risk Low RiskChiropractors 2.7% 44,400 $66,160 $2,937,504,000 Low Risk Low RiskOrthodontists 2.3% 8,500 $62,670 $532,695,000 Low Risk Low Risk
Physical Therapists 2.1% 204,200 $79,860 $16,307,412,000 Low Risk Low RiskPharmacists 1.2% 286,400 $116,670 $33,414,288,000 Low Risk Low RiskPodiatrists 0.5% 10,700 $116,440 $1,245,908,000 Low Risk Low Risk
Dentists 0.4% 146,800 $149,310 $21,918,708,000 Low Risk Low RiskPhysicians & Surgeons 0.4% 691,400 $187,200 $129,430,080,000 Low Risk Low Risk
Dietitians & Nutritionists 0.4% 67,400 $55,240 $3,723,176,000 Low Risk Low RiskOral & Maxillofacial Surgeons 0.4% 5,120 $219,600 $1,124,352,000 Low Risk Low Risk
Occupational Therapists 0.3% 113,200 $75,400 $8,535,280,000 Low Risk Low Risk
Size of Industry Total $ Impact on Wages Total Job Impact$236,228,414,000 $0 0
13 © 2015 Parin J. Patel
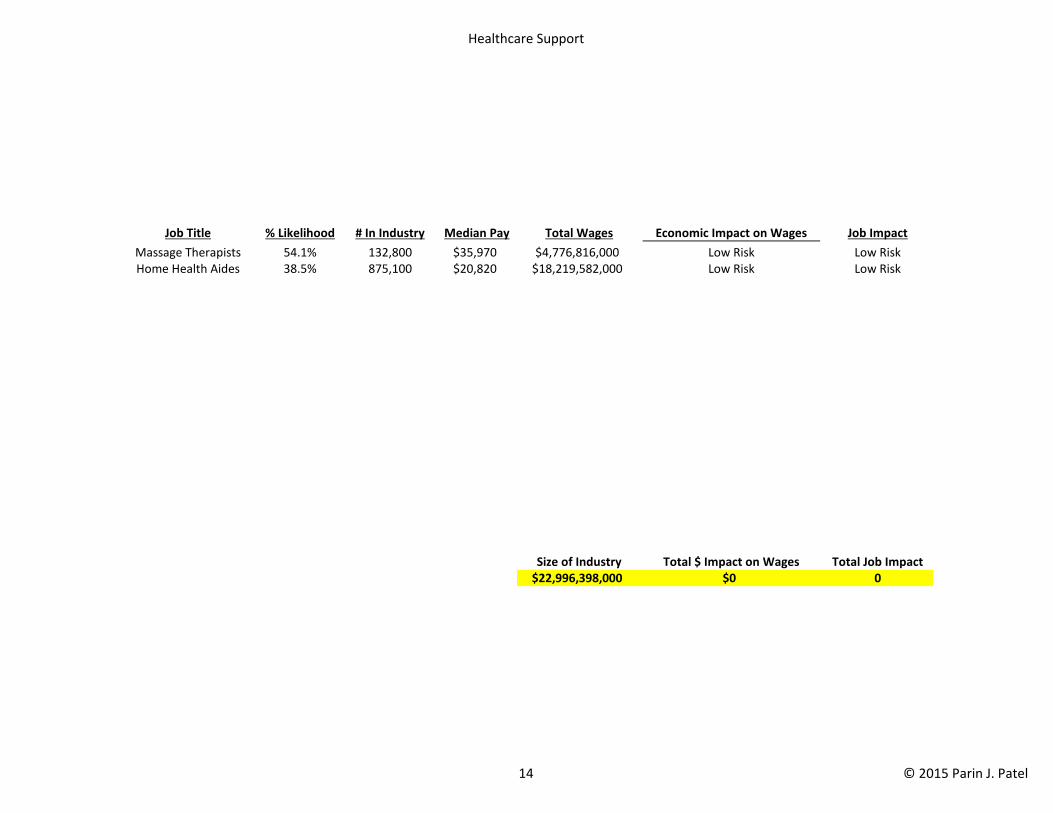
Healthcare Support
Job Title % Likelihood # In Industry Median Pay Total Wages Economic Impact on Wages Job Impact
Massage Therapists 54.1% 132,800 $35,970 $4,776,816,000 Low Risk Low RiskHome Health Aides 38.5% 875,100 $20,820 $18,219,582,000 Low Risk Low Risk
Size of Industry Total $ Impact on Wages Total Job Impact$22,996,398,000 $0 0
14 © 2015 Parin J. Patel
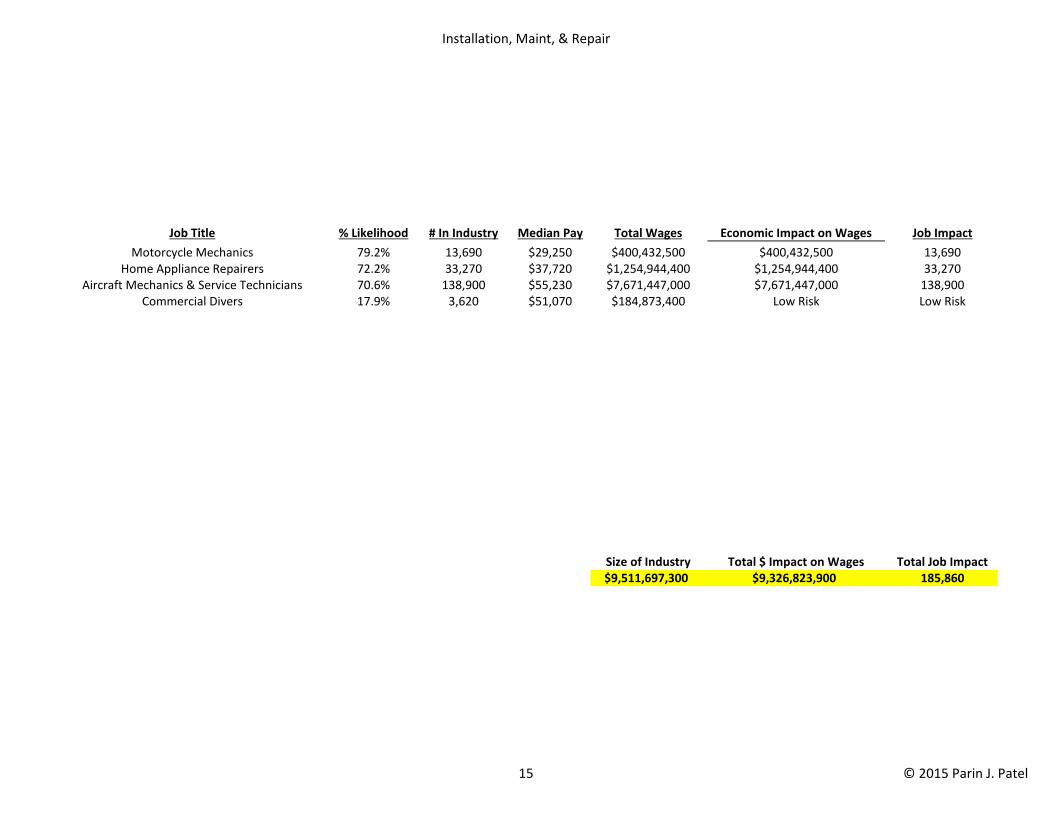
Installation, Maint, & Repair
Job Title % Likelihood # In Industry Median Pay Total Wages Economic Impact on Wages Job Impact
Motorcycle Mechanics 79.2% 13,690 $29,250 $400,432,500 $400,432,500 13,690Home Appliance Repairers 72.2% 33,270 $37,720 $1,254,944,400 $1,254,944,400 33,270
Aircraft Mechanics & Service Technicians 70.6% 138,900 $55,230 $7,671,447,000 $7,671,447,000 138,900Commercial Divers 17.9% 3,620 $51,070 $184,873,400 Low Risk Low Risk
Size of Industry Total $ Impact on Wages Total Job Impact$9,511,697,300 $9,326,823,900 185,860
15 © 2015 Parin J. Patel

Legal
Job Title % Likelihood # In Industry Median Pay Total Wages Economic Impact on Wages Job Impact
Paralegals & Legal Assistants 94.5% 277,000 $46,990 $13,016,230,000 $13,016,230,000 277,000Court Reporters 50.2% 21,200 $48,160 $1,020,992,000 Low Risk Low Risk
Judicial Law Clerks 40.9% 11,660 $54,350 $633,721,000 Low Risk Low RiskJudges 40.1% 43,200 $102,980 $4,448,736,000 Low Risk Low Risk
Lawyers 3.5% 759,800 $113,530 $86,260,094,000 Low Risk Low Risk
Size of Industry Total $ Impact on Wages Total Job Impact$105,379,773,000 $13,016,230,000 277,000
16 © 2015 Parin J. Patel
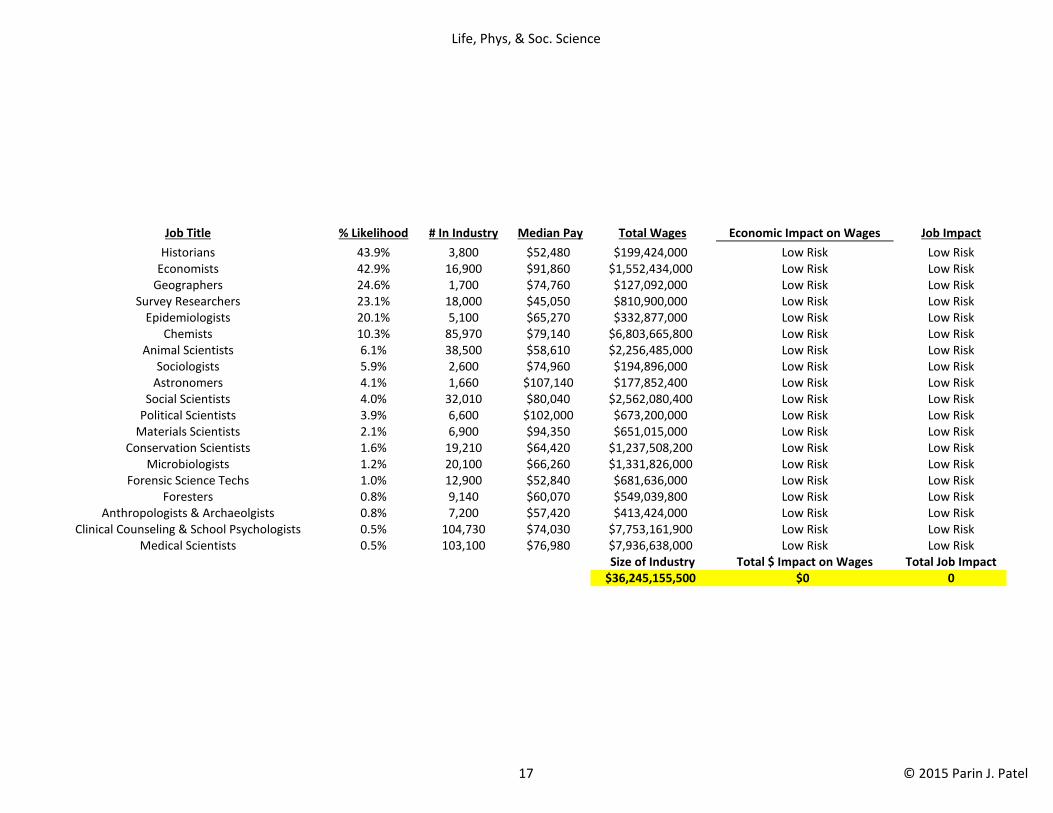
Life, Phys, & Soc. Science
Job Title % Likelihood # In Industry Median Pay Total Wages Economic Impact on Wages Job Impact
Historians 43.9% 3,800 $52,480 $199,424,000 Low Risk Low RiskEconomists 42.9% 16,900 $91,860 $1,552,434,000 Low Risk Low Risk
Geographers 24.6% 1,700 $74,760 $127,092,000 Low Risk Low RiskSurvey Researchers 23.1% 18,000 $45,050 $810,900,000 Low Risk Low Risk
Epidemiologists 20.1% 5,100 $65,270 $332,877,000 Low Risk Low RiskChemists 10.3% 85,970 $79,140 $6,803,665,800 Low Risk Low Risk
Animal Scientists 6.1% 38,500 $58,610 $2,256,485,000 Low Risk Low RiskSociologists 5.9% 2,600 $74,960 $194,896,000 Low Risk Low Risk
Astronomers 4.1% 1,660 $107,140 $177,852,400 Low Risk Low RiskSocial Scientists 4.0% 32,010 $80,040 $2,562,080,400 Low Risk Low Risk
Political Scientists 3.9% 6,600 $102,000 $673,200,000 Low Risk Low RiskMaterials Scientists 2.1% 6,900 $94,350 $651,015,000 Low Risk Low Risk
Conservation Scientists 1.6% 19,210 $64,420 $1,237,508,200 Low Risk Low RiskMicrobiologists 1.2% 20,100 $66,260 $1,331,826,000 Low Risk Low Risk
Forensic Science Techs 1.0% 12,900 $52,840 $681,636,000 Low Risk Low RiskForesters 0.8% 9,140 $60,070 $549,039,800 Low Risk Low Risk
Anthropologists & Archaeolgists 0.8% 7,200 $57,420 $413,424,000 Low Risk Low RiskClinical Counseling & School Psychologists 0.5% 104,730 $74,030 $7,753,161,900 Low Risk Low Risk
Medical Scientists 0.5% 103,100 $76,980 $7,936,638,000 Low Risk Low RiskSize of Industry Total $ Impact on Wages Total Job Impact
$36,245,155,500 $0 0
17 © 2015 Parin J. Patel
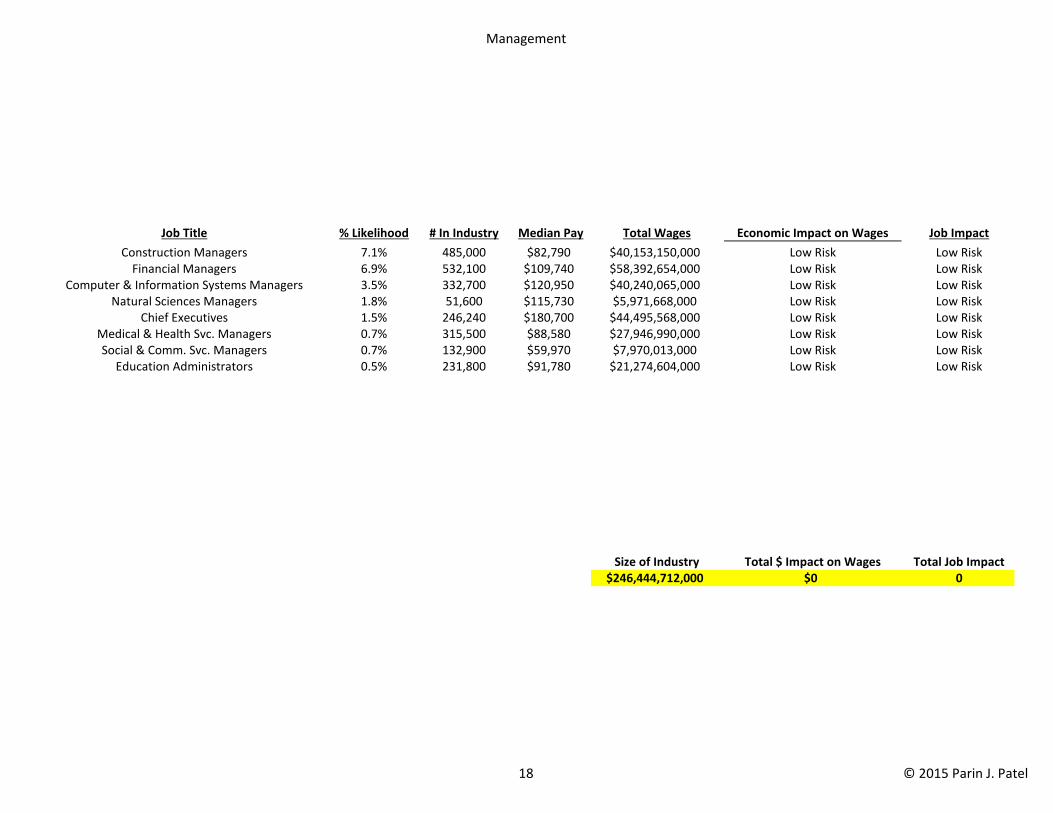
Management
Job Title % Likelihood # In Industry Median Pay Total Wages Economic Impact on Wages Job Impact
Construction Managers 7.1% 485,000 $82,790 $40,153,150,000 Low Risk Low RiskFinancial Managers 6.9% 532,100 $109,740 $58,392,654,000 Low Risk Low Risk
Computer & Information Systems Managers 3.5% 332,700 $120,950 $40,240,065,000 Low Risk Low RiskNatural Sciences Managers 1.8% 51,600 $115,730 $5,971,668,000 Low Risk Low Risk
Chief Executives 1.5% 246,240 $180,700 $44,495,568,000 Low Risk Low RiskMedical & Health Svc. Managers 0.7% 315,500 $88,580 $27,946,990,000 Low Risk Low RiskSocial & Comm. Svc. Managers 0.7% 132,900 $59,970 $7,970,013,000 Low Risk Low Risk
Education Administrators 0.5% 231,800 $91,780 $21,274,604,000 Low Risk Low Risk
Size of Industry Total $ Impact on Wages Total Job Impact$246,444,712,000 $0 0
18 © 2015 Parin J. Patel
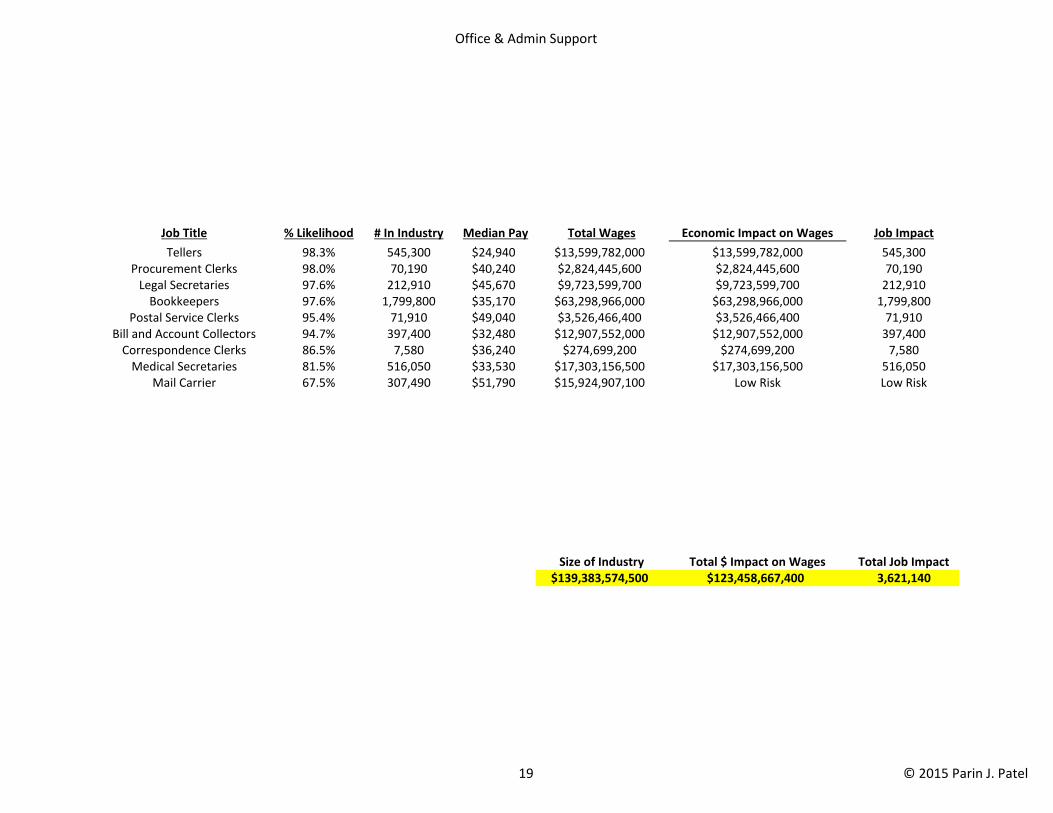
Office & Admin Support
Job Title % Likelihood # In Industry Median Pay Total Wages Economic Impact on Wages Job Impact
Tellers 98.3% 545,300 $24,940 $13,599,782,000 $13,599,782,000 545,300Procurement Clerks 98.0% 70,190 $40,240 $2,824,445,600 $2,824,445,600 70,190
Legal Secretaries 97.6% 212,910 $45,670 $9,723,599,700 $9,723,599,700 212,910Bookkeepers 97.6% 1,799,800 $35,170 $63,298,966,000 $63,298,966,000 1,799,800
Postal Service Clerks 95.4% 71,910 $49,040 $3,526,466,400 $3,526,466,400 71,910Bill and Account Collectors 94.7% 397,400 $32,480 $12,907,552,000 $12,907,552,000 397,400
Correspondence Clerks 86.5% 7,580 $36,240 $274,699,200 $274,699,200 7,580Medical Secretaries 81.5% 516,050 $33,530 $17,303,156,500 $17,303,156,500 516,050
Mail Carrier 67.5% 307,490 $51,790 $15,924,907,100 Low Risk Low Risk
Size of Industry Total $ Impact on Wages Total Job Impact$139,383,574,500 $123,458,667,400 3,621,140
19 © 2015 Parin J. Patel
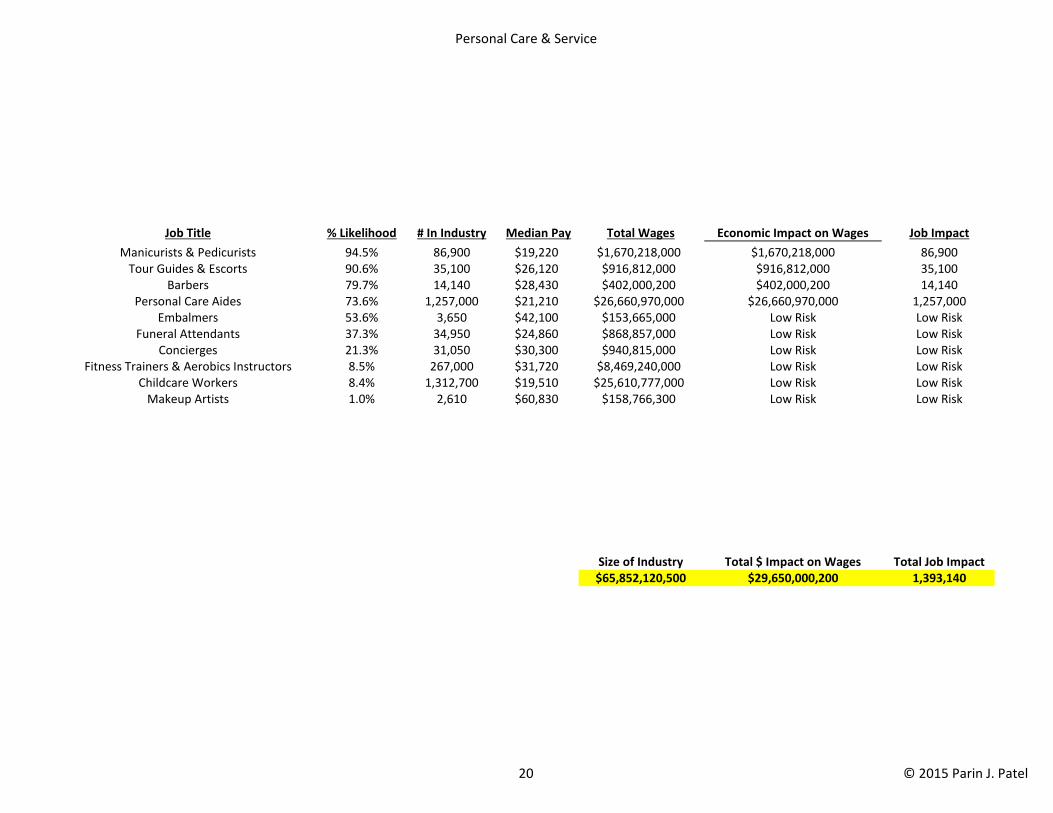
Personal Care & Service
Job Title % Likelihood # In Industry Median Pay Total Wages Economic Impact on Wages Job Impact
Manicurists & Pedicurists 94.5% 86,900 $19,220 $1,670,218,000 $1,670,218,000 86,900Tour Guides & Escorts 90.6% 35,100 $26,120 $916,812,000 $916,812,000 35,100
Barbers 79.7% 14,140 $28,430 $402,000,200 $402,000,200 14,140Personal Care Aides 73.6% 1,257,000 $21,210 $26,660,970,000 $26,660,970,000 1,257,000
Embalmers 53.6% 3,650 $42,100 $153,665,000 Low Risk Low RiskFuneral Attendants 37.3% 34,950 $24,860 $868,857,000 Low Risk Low Risk
Concierges 21.3% 31,050 $30,300 $940,815,000 Low Risk Low RiskFitness Trainers & Aerobics Instructors 8.5% 267,000 $31,720 $8,469,240,000 Low Risk Low Risk
Childcare Workers 8.4% 1,312,700 $19,510 $25,610,777,000 Low Risk Low RiskMakeup Artists 1.0% 2,610 $60,830 $158,766,300 Low Risk Low Risk
Size of Industry Total $ Impact on Wages Total Job Impact$65,852,120,500 $29,650,000,200 1,393,140
20 © 2015 Parin J. Patel
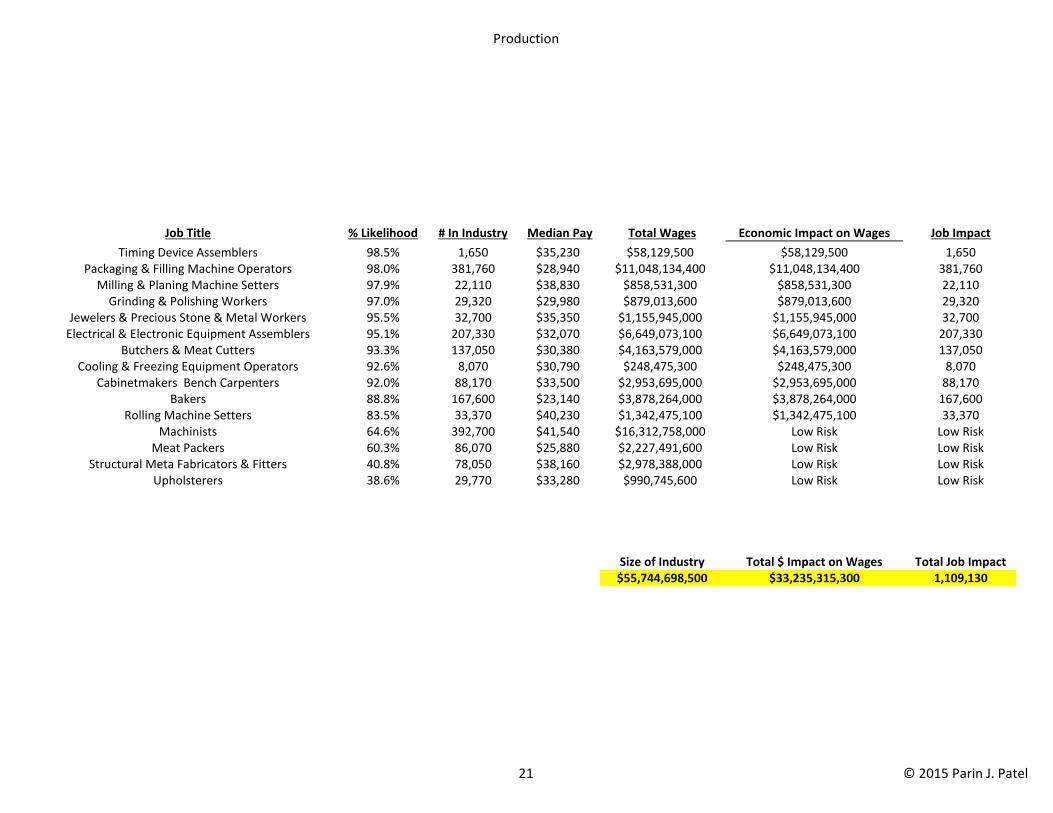
Production
Job Title % Likelihood # In Industry Median Pay Total Wages Economic Impact on Wages Job Impact
Timing Device Assemblers 98.5% 1,650 $35,230 $58,129,500 $58,129,500 1,650Packaging & Filling Machine Operators 98.0% 381,760 $28,940 $11,048,134,400 $11,048,134,400 381,760
Milling & Planing Machine Setters 97.9% 22,110 $38,830 $858,531,300 $858,531,300 22,110Grinding & Polishing Workers 97.0% 29,320 $29,980 $879,013,600 $879,013,600 29,320
Jewelers & Precious Stone & Metal Workers 95.5% 32,700 $35,350 $1,155,945,000 $1,155,945,000 32,700Electrical & Electronic Equipment Assemblers 95.1% 207,330 $32,070 $6,649,073,100 $6,649,073,100 207,330
Butchers & Meat Cutters 93.3% 137,050 $30,380 $4,163,579,000 $4,163,579,000 137,050Cooling & Freezing Equipment Operators 92.6% 8,070 $30,790 $248,475,300 $248,475,300 8,070
Cabinetmakers Bench Carpenters 92.0% 88,170 $33,500 $2,953,695,000 $2,953,695,000 88,170Bakers 88.8% 167,600 $23,140 $3,878,264,000 $3,878,264,000 167,600
Rolling Machine Setters 83.5% 33,370 $40,230 $1,342,475,100 $1,342,475,100 33,370Machinists 64.6% 392,700 $41,540 $16,312,758,000 Low Risk Low Risk
Meat Packers 60.3% 86,070 $25,880 $2,227,491,600 Low Risk Low RiskStructural Meta Fabricators & Fitters 40.8% 78,050 $38,160 $2,978,388,000 Low Risk Low Risk
Upholsterers 38.6% 29,770 $33,280 $990,745,600 Low Risk Low Risk
Size of Industry Total $ Impact on Wages Total Job Impact$55,744,698,500 $33,235,315,300 1,109,130
21 © 2015 Parin J. Patel
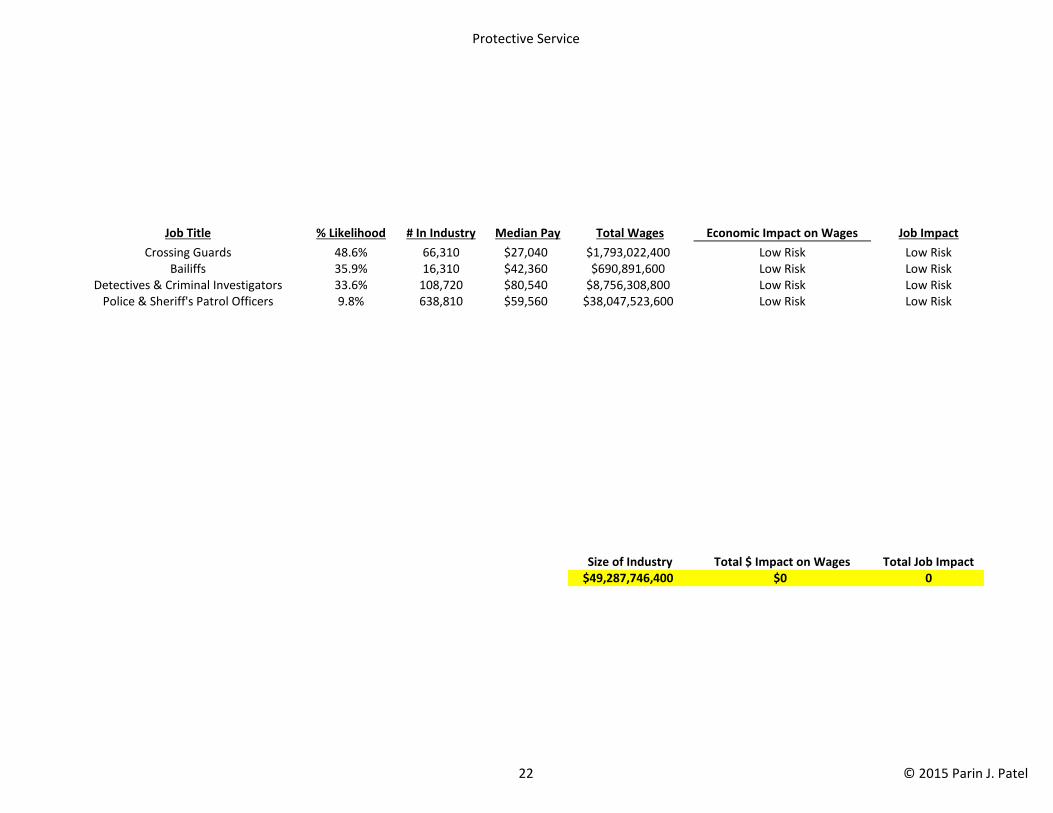
Protective Service
Job Title % Likelihood # In Industry Median Pay Total Wages Economic Impact on Wages Job Impact
Crossing Guards 48.6% 66,310 $27,040 $1,793,022,400 Low Risk Low RiskBailiffs 35.9% 16,310 $42,360 $690,891,600 Low Risk Low Risk
Detectives & Criminal Investigators 33.6% 108,720 $80,540 $8,756,308,800 Low Risk Low RiskPolice & Sheriff's Patrol Officers 9.8% 638,810 $59,560 $38,047,523,600 Low Risk Low Risk
Size of Industry Total $ Impact on Wages Total Job Impact$49,287,746,400 $0 0
22 © 2015 Parin J. Patel
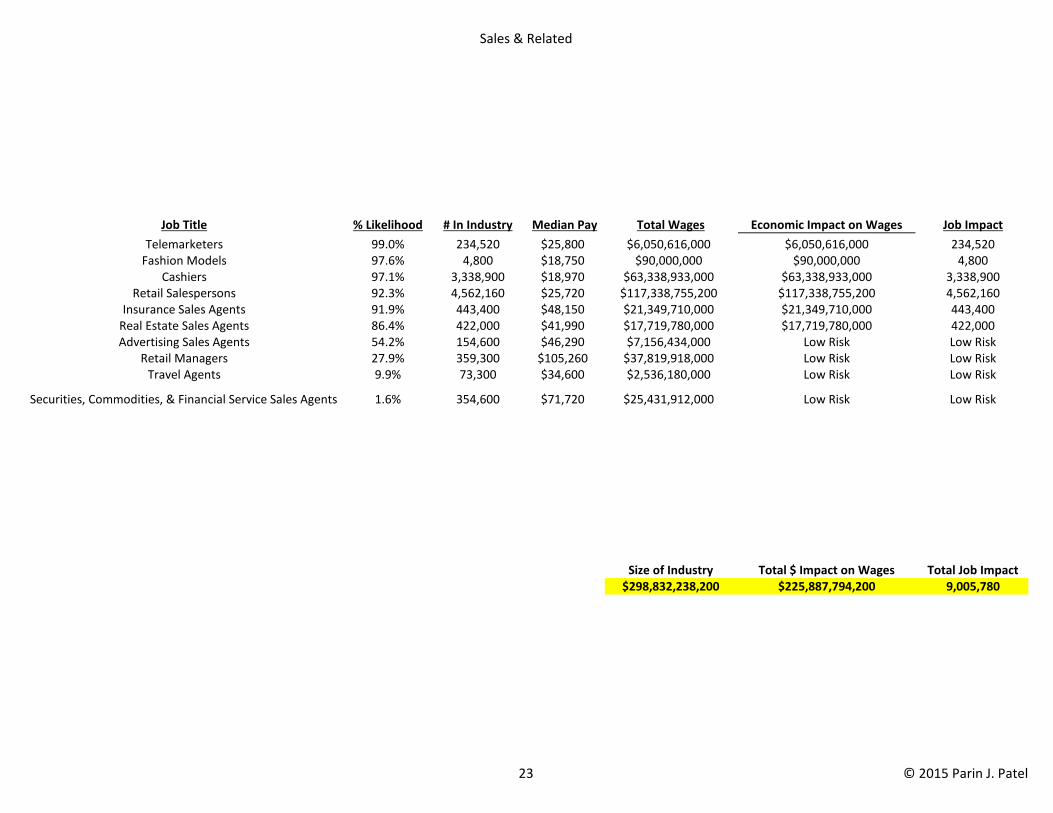
Sales & Related
Job Title % Likelihood # In Industry Median Pay Total Wages Economic Impact on Wages Job Impact
Telemarketers 99.0% 234,520 $25,800 $6,050,616,000 $6,050,616,000 234,520Fashion Models 97.6% 4,800 $18,750 $90,000,000 $90,000,000 4,800
Cashiers 97.1% 3,338,900 $18,970 $63,338,933,000 $63,338,933,000 3,338,900Retail Salespersons 92.3% 4,562,160 $25,720 $117,338,755,200 $117,338,755,200 4,562,160
Insurance Sales Agents 91.9% 443,400 $48,150 $21,349,710,000 $21,349,710,000 443,400Real Estate Sales Agents 86.4% 422,000 $41,990 $17,719,780,000 $17,719,780,000 422,000Advertising Sales Agents 54.2% 154,600 $46,290 $7,156,434,000 Low Risk Low Risk
Retail Managers 27.9% 359,300 $105,260 $37,819,918,000 Low Risk Low RiskTravel Agents 9.9% 73,300 $34,600 $2,536,180,000 Low Risk Low Risk
Securities, Commodities, & Financial Service Sales Agents 1.6% 354,600 $71,720 $25,431,912,000 Low Risk Low Risk
Size of Industry Total $ Impact on Wages Total Job Impact$298,832,238,200 $225,887,794,200 9,005,780
23 © 2015 Parin J. Patel
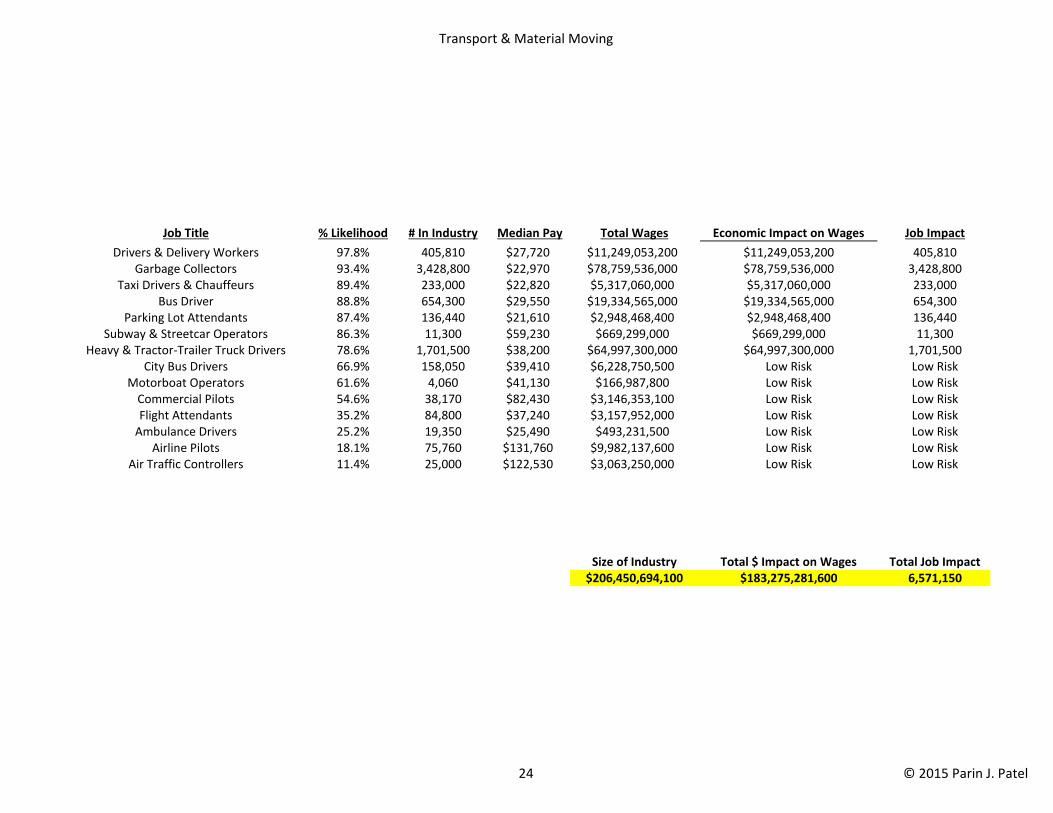
Transport & Material Moving
Job Title % Likelihood # In Industry Median Pay Total Wages Economic Impact on Wages Job Impact
Drivers & Delivery Workers 97.8% 405,810 $27,720 $11,249,053,200 $11,249,053,200 405,810Garbage Collectors 93.4% 3,428,800 $22,970 $78,759,536,000 $78,759,536,000 3,428,800
Taxi Drivers & Chauffeurs 89.4% 233,000 $22,820 $5,317,060,000 $5,317,060,000 233,000Bus Driver 88.8% 654,300 $29,550 $19,334,565,000 $19,334,565,000 654,300
Parking Lot Attendants 87.4% 136,440 $21,610 $2,948,468,400 $2,948,468,400 136,440Subway & Streetcar Operators 86.3% 11,300 $59,230 $669,299,000 $669,299,000 11,300
Heavy & Tractor-Trailer Truck Drivers 78.6% 1,701,500 $38,200 $64,997,300,000 $64,997,300,000 1,701,500City Bus Drivers 66.9% 158,050 $39,410 $6,228,750,500 Low Risk Low Risk
Motorboat Operators 61.6% 4,060 $41,130 $166,987,800 Low Risk Low RiskCommercial Pilots 54.6% 38,170 $82,430 $3,146,353,100 Low Risk Low RiskFlight Attendants 35.2% 84,800 $37,240 $3,157,952,000 Low Risk Low Risk
Ambulance Drivers 25.2% 19,350 $25,490 $493,231,500 Low Risk Low RiskAirline Pilots 18.1% 75,760 $131,760 $9,982,137,600 Low Risk Low Risk
Air Traffic Controllers 11.4% 25,000 $122,530 $3,063,250,000 Low Risk Low Risk
Size of Industry Total $ Impact on Wages Total Job Impact$206,450,694,100 $183,275,281,600 6,571,150
24 © 2015 Parin J. Patel
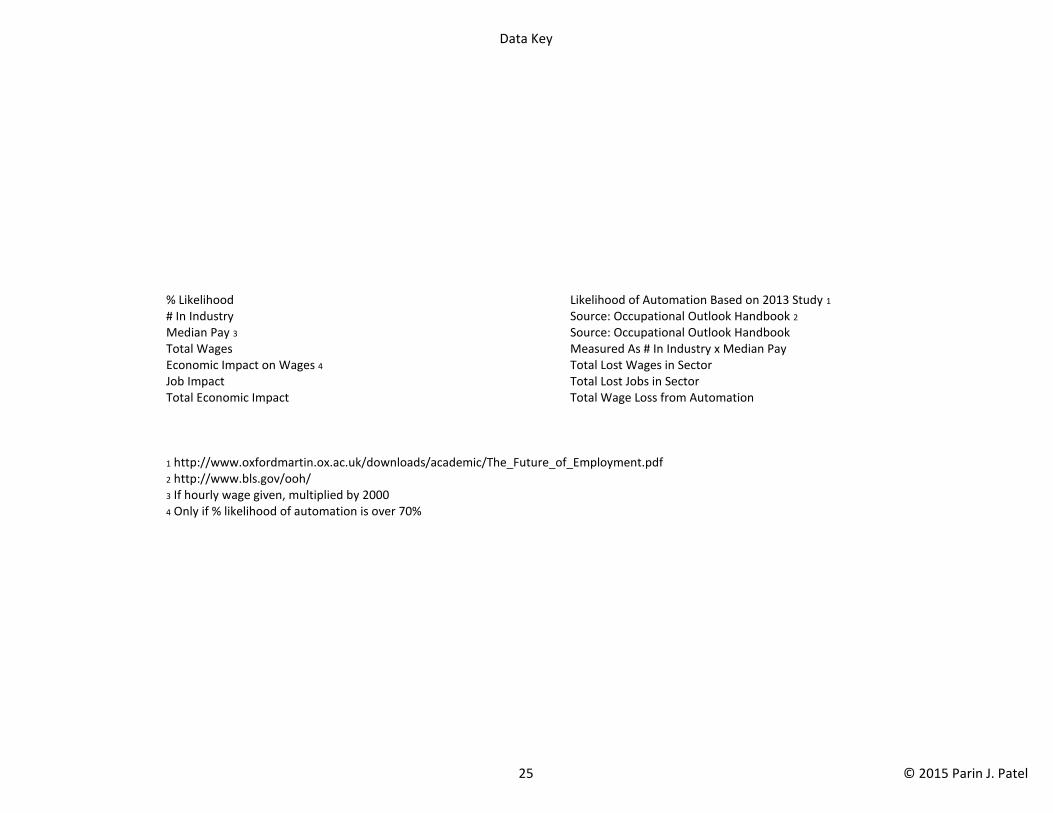
Data Key
% Likelihood Likelihood of Automation Based on 2013 Study 1# In Industry Source: Occupational Outlook Handbook 2Median Pay 3 Source: Occupational Outlook HandbookTotal Wages Measured As # In Industry x Median PayEconomic Impact on Wages 4 Total Lost Wages in SectorJob Impact Total Lost Jobs in SectorTotal Economic Impact Total Wage Loss from Automation
4 Only if % likelihood of automation is over 70%
2 http://www.bls.gov/ooh/3 If hourly wage given, multiplied by 2000
1 http://www.oxfordmartin.ox.ac.uk/downloads/academic/The_Future_of_Employment.pdf
25 © 2015 Parin J. Patel