Embed Size (px)
Citation preview
1
The Australian Share Ownership StudyProviding the latest research on share ownership and the attitudes, knowledge and behaviour of retail investors in relation to shares and investing in Australia.
2 3
Disclaimer of Liability
Information provided is for educational purposes and does not constitute financial product advice. You should obtain independent advice from an Australian financial services licensee before making any financial decisions. Although ASX Limited ABN 98 008 624 691 and its related bodies corporate (“ASX”) has made every effort to ensure the accuracy of the information as at the date of publication, ASX does not give any warranty or representation as to the accuracy, reliability or completeness of the information. To the extent permitted by law, ASX and its employees, officers and contractors shall not be liable for any loss or damage arising in any way (including by way of negligence) from or in connection with any information provided or omitted or from any one acting or refraining to act in reliance on this information.
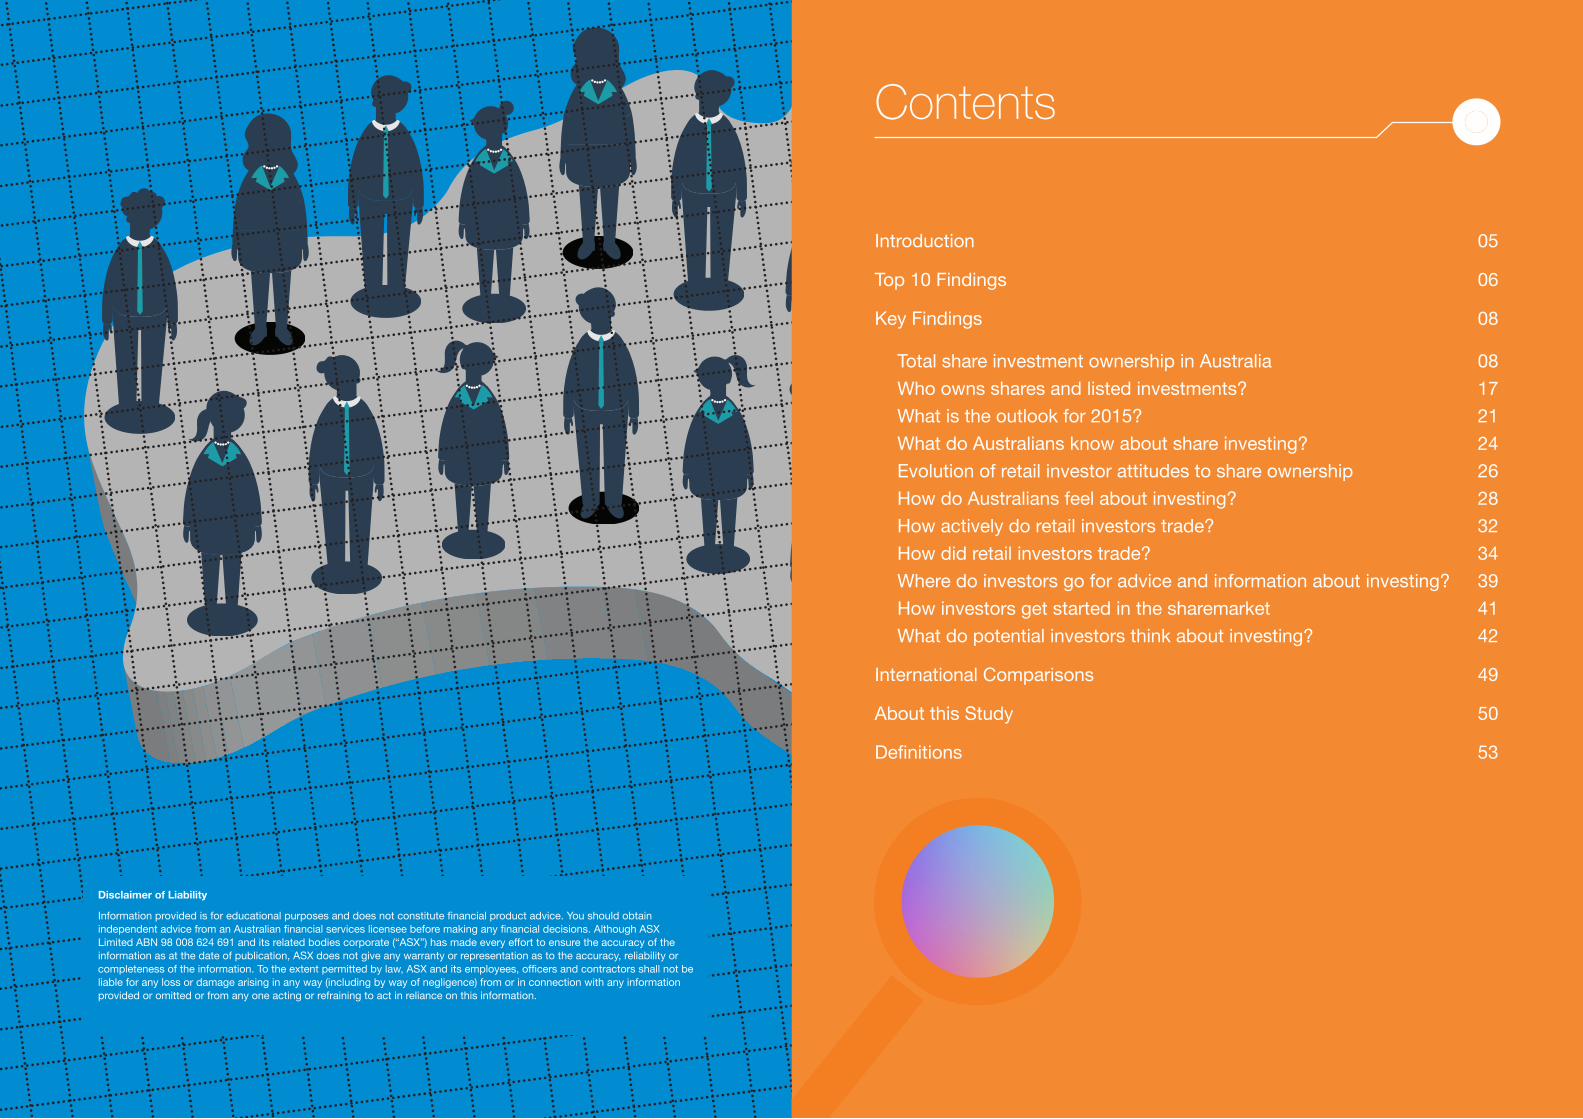
Introduction 05
Top 10 Findings 06
Key Findings 08
Total share investment ownership in Australia 08
Who owns shares and listed investments? 17
What is the outlook for 2015? 21
What do Australians know about share investing? 24
Evolution of retail investor attitudes to share ownership 26
How do Australians feel about investing? 28
How actively do retail investors trade? 32
How did retail investors trade? 34
Where do investors go for advice and information about investing? 39
How investors get started in the sharemarket 41
What do potential investors think about investing? 42
International Comparisons 49
About this Study 50
Definitions 53
Contents
54
This Study is produced by ASX with the assistance of the Finance Industry Development Account of the National Guarantee Fund.
ASX also acknowledges Creative Catalyst Insights and Q&A Market Research who were commissioned in 2014 to conduct the Study for ASX. Their detailed understanding of the factors influencing the retail market is reflected in this Study. ASX is especially grateful to the 6,409 adult Australians who gave their time to participate in the 2014 Study and share their thoughts, attitudes and behaviours. They are invaluable to ASX in identifying the needs and priorities of investors.
As technology and the investor marketplace have both changed, it became necessary to update the Study’s methodology. The changes are explained in detail in the ‘About this Study’ section. In this report, we draw comparisons with previous years’ findings where appropriate. We caution however against comparing the 2014 data to data provided in earlier reports because changes may be attributable to changes in question wording or survey method.
Most data in the Share Ownership Study relates to the quantitative phase of research. Selected insights from our qualitative research have also been included where beneficial to enrich the quantitative results.
We hope you find this publication valuable.
Introduction
Welcome to the Australian Share Ownership Study, conducted between September and November 2014. It is the latest in a series of reports on share ownership that ASX has been producing since 1986. ASX is pleased to provide a comprehensive insight into the behaviours, attitudes and knowledge of retail sharemarket investors in Australia.
Published June 2015
ASX Registered Office, Australian Securities Exchange
Exchange Centre, 20 Bridge Street, Sydney NSW 2000
ASX Customer Service 131 279. www.asx.com.au
© Copyright 2015 ASX Limited ABN 98 008 624 691. All rights reserved
6 7
Top 10 Findings
54+46+L54%
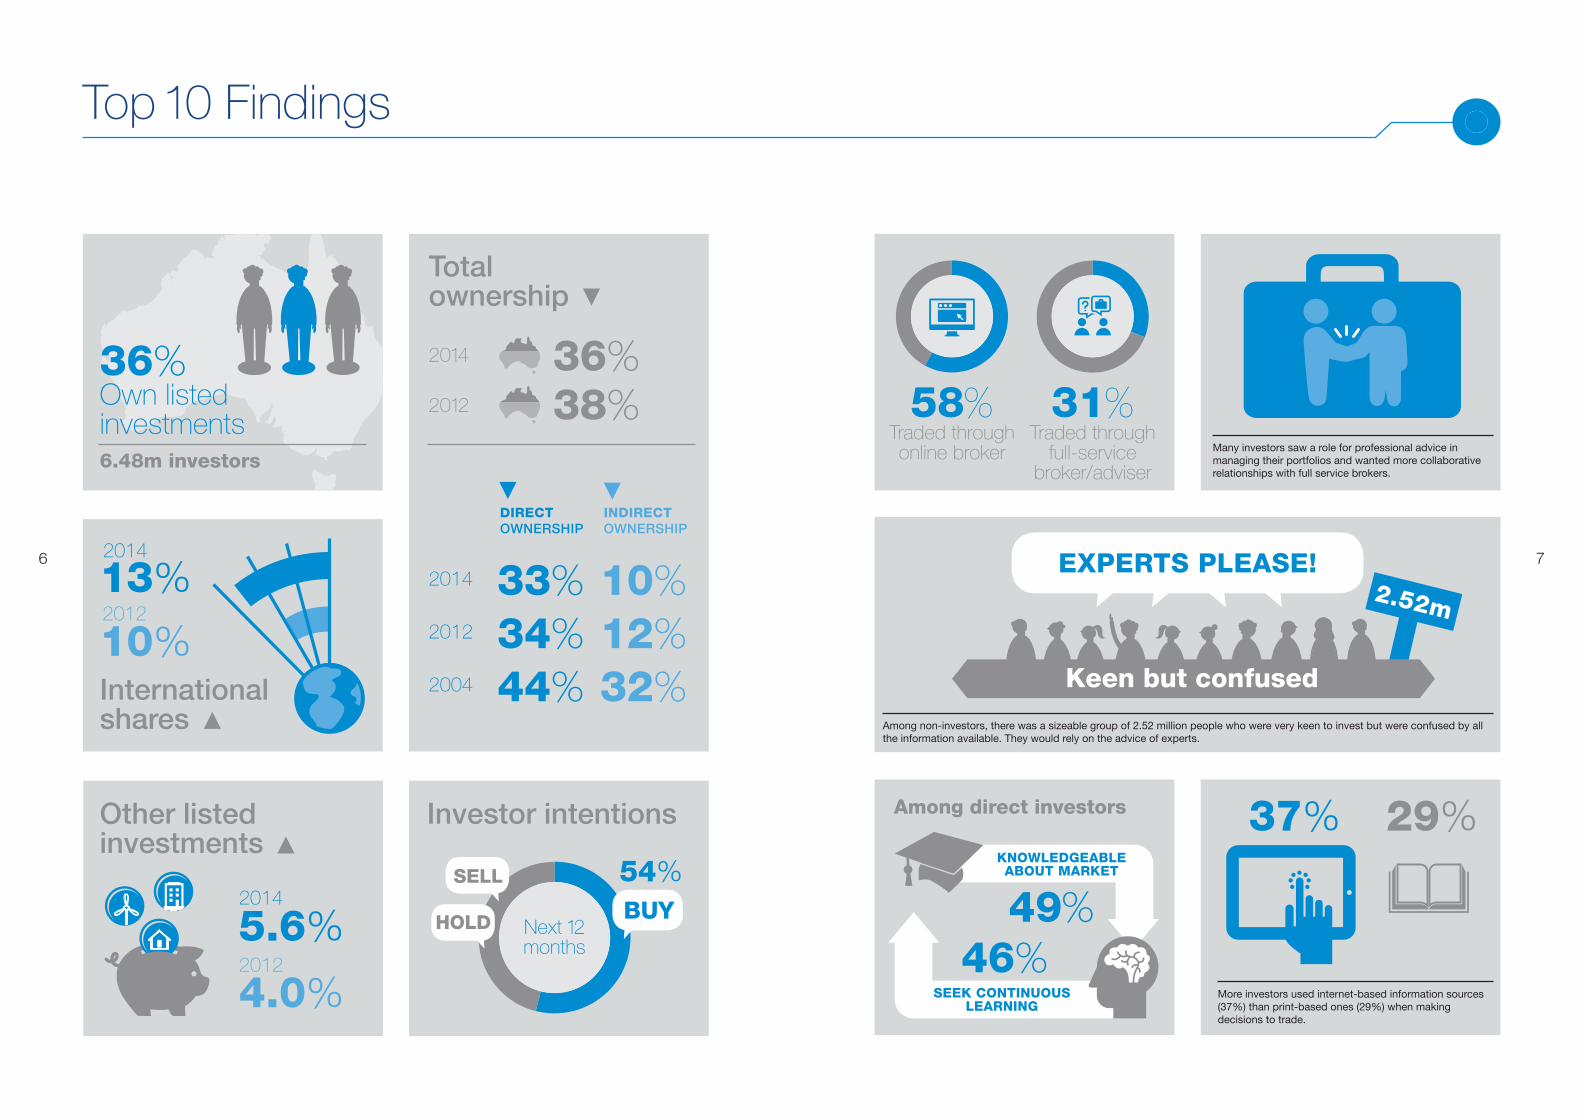
Many investors saw a role for professional advice in managing their portfolios and wanted more collaborative relationships with full service brokers.
More investors used internet-based information sources (37%) than print-based ones (29%) when making decisions to trade.
EXPERTS PLEASE!
DIRECT OWNERSHIP
33% 34%44%
INDIRECT OWNERSHIP
10% 12% 32%
36%38%
37% 29%
2.52m
Among non-investors, there was a sizeable group of 2.52 million people who were very keen to invest but were confused by all the information available. They would rely on the advice of experts.
Keen but confused
6.48m investors
36% Own listed investments
International shares
Other listed investments
Investor intentions
Total ownership
5.6%2014
13%2014
4.0%2012
10%2012
2014
2014
2012
2004
2012
Next 12 months
Traded through online broker
Traded through full-service
broker/adviser
58% 31%31+69L58+42++L
46%SEEK CONTINUOUS
LEARNING
49%KNOWLEDGEABLE ABOUT MARKET
Among direct investors
8 9
Total share investment ownership in Australia
Key Findings
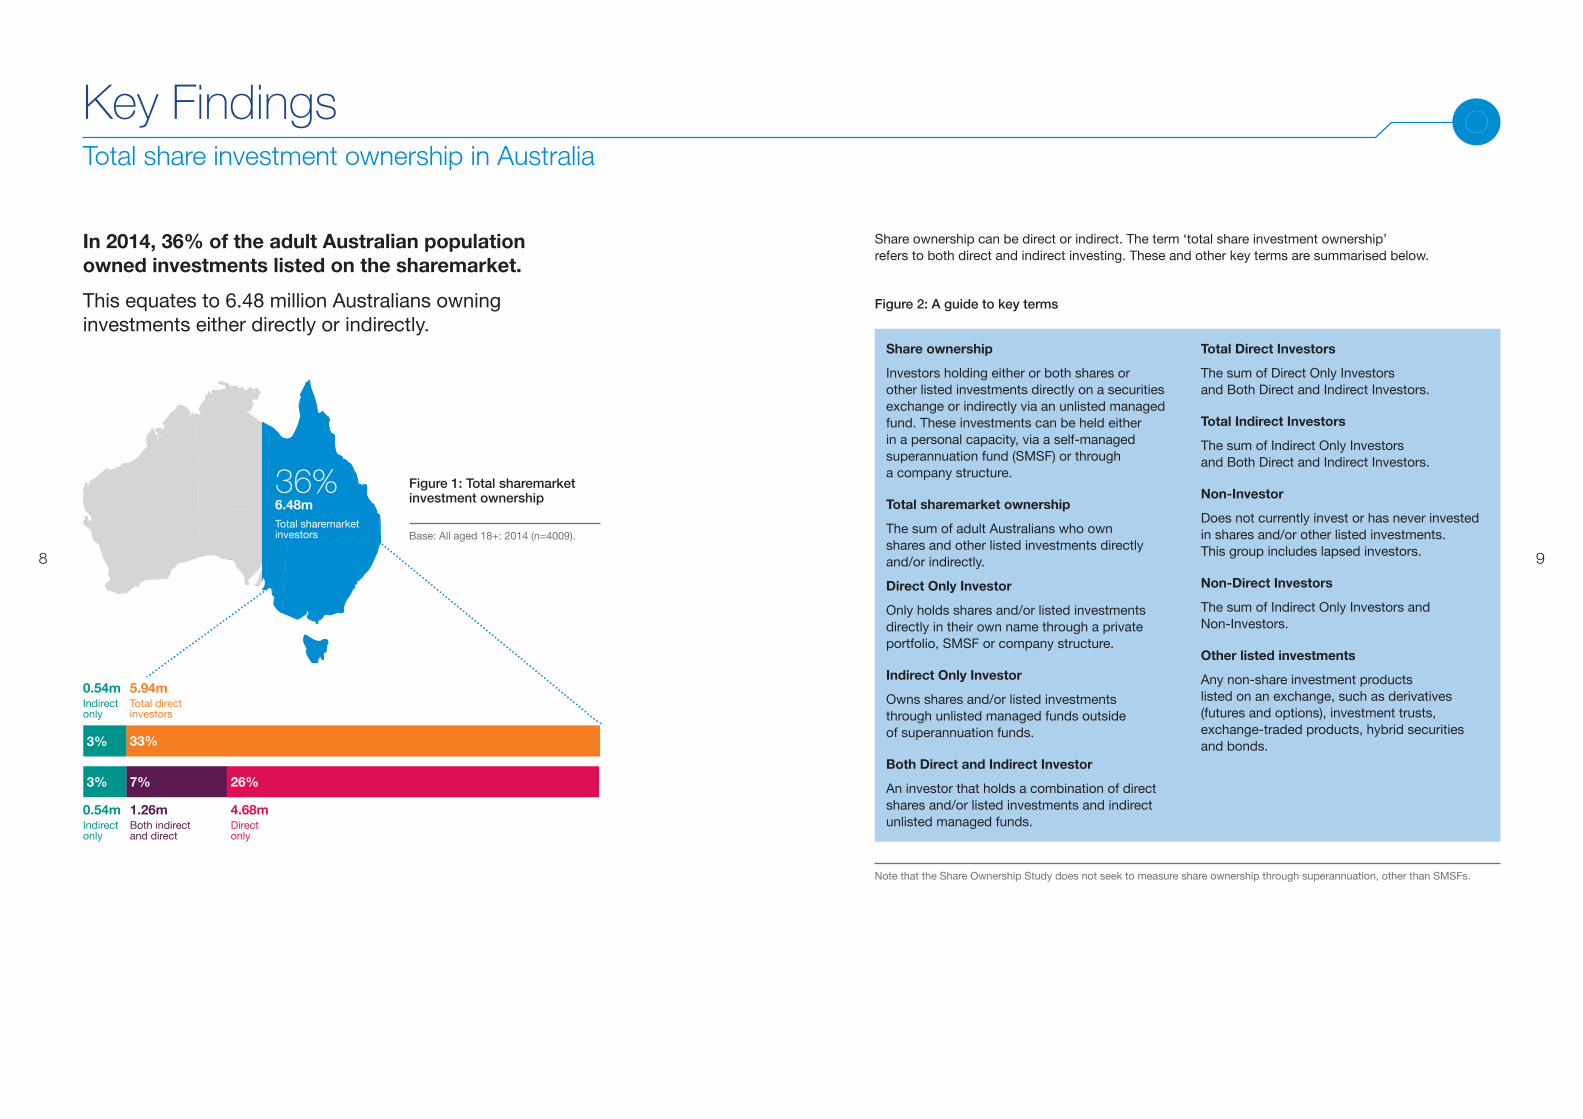
In 2014, 36% of the adult Australian population owned investments listed on the sharemarket.
This equates to 6.48 million Australians owning investments either directly or indirectly.
Note that the Share Ownership Study does not seek to measure share ownership through superannuation, other than SMSFs.
Figure 2: A guide to key terms
Base: All aged 18+: 2014 (n=4009).
Figure 1: Total sharemarket investment ownership
36%6.48m Total sharemarket investors
Share ownership
Investors holding either or both shares or other listed investments directly on a securities exchange or indirectly via an unlisted managed fund. These investments can be held either in a personal capacity, via a self-managed superannuation fund (SMSF) or through a company structure.
Total sharemarket ownership
The sum of adult Australians who own shares and other listed investments directly and/or indirectly.
Direct Only Investor
Only holds shares and/or listed investments directly in their own name through a private portfolio, SMSF or company structure.
Indirect Only Investor
Owns shares and/or listed investments through unlisted managed funds outside of superannuation funds.
Both Direct and Indirect Investor
An investor that holds a combination of direct shares and/or listed investments and indirect unlisted managed funds.
Total Direct Investors
The sum of Direct Only Investors and Both Direct and Indirect Investors.
Total Indirect Investors
The sum of Indirect Only Investors and Both Direct and Indirect Investors.
Non-Investor
Does not currently invest or has never invested in shares and/or other listed investments. This group includes lapsed investors.
Non-Direct Investors
The sum of Indirect Only Investors and Non-Investors.
Other listed investments
Any non-share investment products listed on an exchange, such as derivatives (futures and options), investment trusts, exchange-traded products, hybrid securities and bonds.
Share ownership can be direct or indirect. The term ‘total share investment ownership’ refers to both direct and indirect investing. These and other key terms are summarised below.
0.54m Indirect only
1.26m Both indirect and direct
4.68m Direct only
33%
26%7%3%
3%
5.94m Total direct investors
0.54m Indirect only
10 11
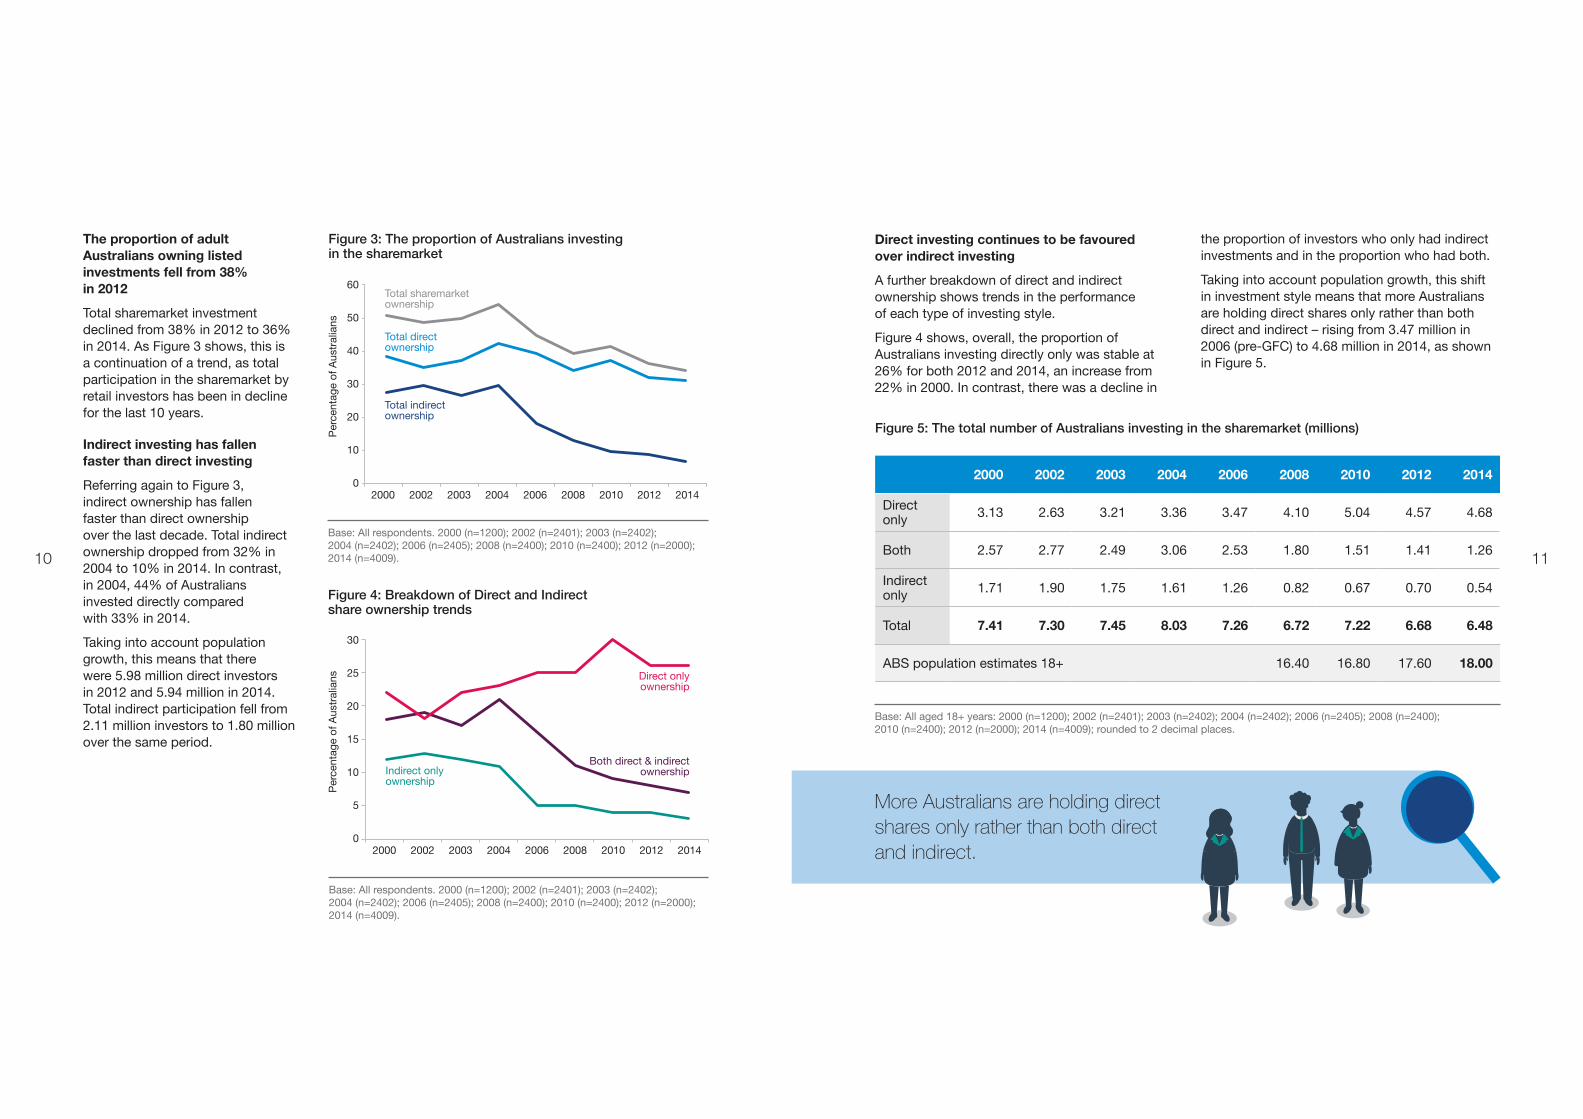
The proportion of adult Australians owning listed investments fell from 38% in 2012
Total sharemarket investment declined from 38% in 2012 to 36% in 2014. As Figure 3 shows, this is a continuation of a trend, as total participation in the sharemarket by retail investors has been in decline for the last 10 years.
Indirect investing has fallen faster than direct investing
Referring again to Figure 3, indirect ownership has fallen faster than direct ownership over the last decade. Total indirect ownership dropped from 32% in 2004 to 10% in 2014. In contrast, in 2004, 44% of Australians invested directly compared with 33% in 2014.
Taking into account population growth, this means that there were 5.98 million direct investors in 2012 and 5.94 million in 2014. Total indirect participation fell from 2.11 million investors to 1.80 million over the same period.
Figure 3: The proportion of Australians investing in the sharemarket
20142000 20042002 2006 20102003 2008 2012
Per
cent
age
of A
ustr
alia
ns
Base: All respondents. 2000 (n=1200); 2002 (n=2401); 2003 (n=2402); 2004 (n=2402); 2006 (n=2405); 2008 (n=2400); 2010 (n=2400); 2012 (n=2000); 2014 (n=4009).
Total sharemarket ownership
Total direct ownership
Total indirect ownership
Figure 4: Breakdown of Direct and Indirect share ownership trends
2000 2002 2003 2004 2006 2008 2010 2012 2014
Direct only 3.13 2.63 3.21 3.36 3.47 4.10 5.04 4.57 4.68
Both 2.57 2.77 2.49 3.06 2.53 1.80 1.51 1.41 1.26
Indirect only 1.71 1.90 1.75 1.61 1.26 0.82 0.67 0.70 0.54
Total 7.41 7.30 7.45 8.03 7.26 6.72 7.22 6.68 6.48
ABS population estimates 18+ 16.40 16.80 17.60 18.00
Figure 5: The total number of Australians investing in the sharemarket (millions)
Base: All aged 18+ years: 2000 (n=1200); 2002 (n=2401); 2003 (n=2402); 2004 (n=2402); 2006 (n=2405); 2008 (n=2400); 2010 (n=2400); 2012 (n=2000); 2014 (n=4009); rounded to 2 decimal places.
Direct investing continues to be favoured over indirect investing
A further breakdown of direct and indirect ownership shows trends in the performance of each type of investing style.
Figure 4 shows, overall, the proportion of Australians investing directly only was stable at 26% for both 2012 and 2014, an increase from 22% in 2000. In contrast, there was a decline in
10
20
40
50
30
60
0
20142000 20042002 2006 20102003 2008 2012
Per
cent
age
of A
ustr
alia
ns
Both direct & indirect ownership
Direct only ownership
Indirect only ownership
Base: All respondents. 2000 (n=1200); 2002 (n=2401); 2003 (n=2402); 2004 (n=2402); 2006 (n=2405); 2008 (n=2400); 2010 (n=2400); 2012 (n=2000); 2014 (n=4009).
5
10
20
25
15
30
0
the proportion of investors who only had indirect investments and in the proportion who had both.
Taking into account population growth, this shift in investment style means that more Australians are holding direct shares only rather than both direct and indirect – rising from 3.47 million in 2006 (pre-GFC) to 4.68 million in 2014, as shown in Figure 5.
More Australians are holding direct shares only rather than both direct and indirect.
12 13
Managed funds give investors the opportunity to diversify their portfolios, but as the data has shown, only a relatively small proportion of investors used this strategy in 2014. The qualitative research showed that it was only the most knowledgeable investors who considered using managed funds as a strategy to diversify their portfolio. The survey also showed that investors who invested both directly and indirectly had larger share portfolios than those who invested directly only. It is possible therefore that increased portfolio size has been a trigger to investors considering the need to diversify.
Other listed investments
5.6% (net)
Figure 6: Age profile of sharemarket investors
Direct only
Both direct and indirect
Indirect only
Base n = 1035 281 139
Under 35 20% 25% 30%
35-44 18% 22% 11%
45-64 40% 39% 30%
65 plus 22% 14% 29%
100% 100% 100% 100%
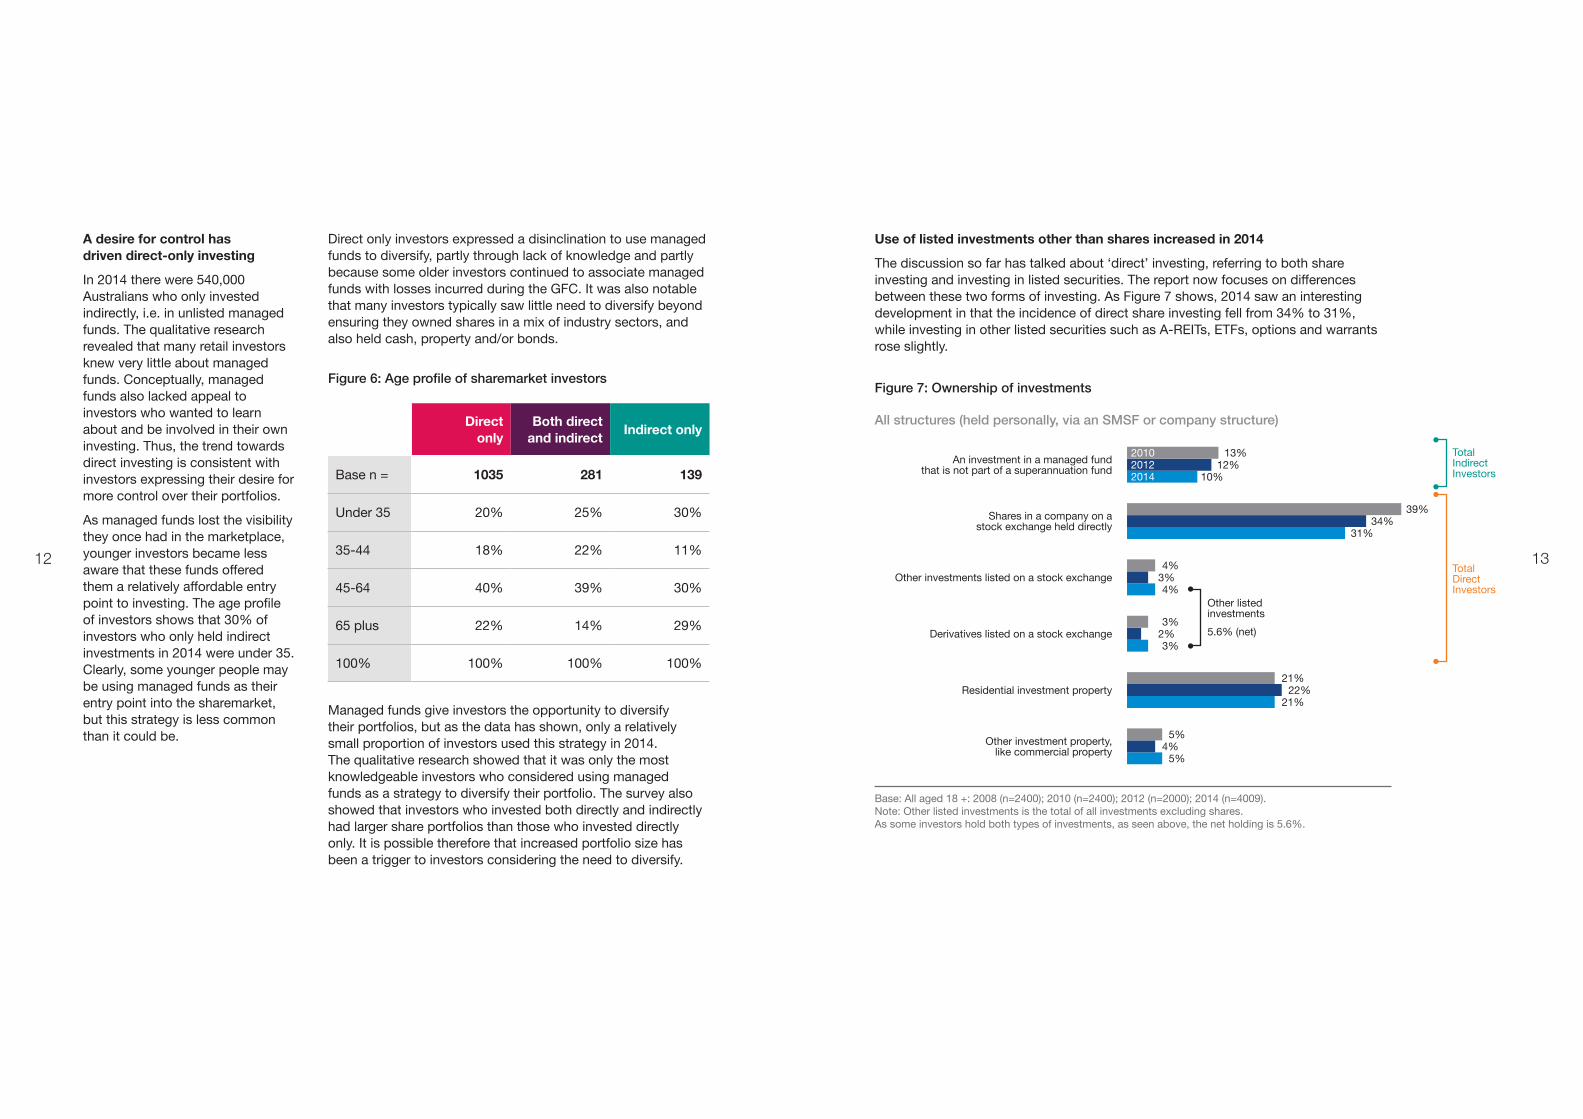
Use of listed investments other than shares increased in 2014
The discussion so far has talked about ‘direct’ investing, referring to both share investing and investing in listed securities. The report now focuses on differences between these two forms of investing. As Figure 7 shows, 2014 saw an interesting development in that the incidence of direct share investing fell from 34% to 31%, while investing in other listed securities such as A-REITs, ETFs, options and warrants rose slightly.
Base: All aged 18 +: 2008 (n=2400); 2010 (n=2400); 2012 (n=2000); 2014 (n=4009). Note: Other listed investments is the total of all investments excluding shares. As some investors hold both types of investments, as seen above, the net holding is 5.6%.
An investment in a managed fund that is not part of a superannuation fund
Total Indirect Investors
Total Direct Investors
201020122014
13%12%
10%
Other investments listed on a stock exchange4%
3%4%
Derivatives listed on a stock exchange3%
2%3%
Residential investment property 21%
22%21%
Other investment property, like commercial property
5%4%
5%
Shares in a company on a stock exchange held directly
39%34%
31%
Figure 7: Ownership of investments
All structures (held personally, via an SMSF or company structure)
A desire for control has driven direct-only investing
In 2014 there were 540,000 Australians who only invested indirectly, i.e. in unlisted managed funds. The qualitative research revealed that many retail investors knew very little about managed funds. Conceptually, managed funds also lacked appeal to investors who wanted to learn about and be involved in their own investing. Thus, the trend towards direct investing is consistent with investors expressing their desire for more control over their portfolios.
As managed funds lost the visibility they once had in the marketplace, younger investors became less aware that these funds offered them a relatively affordable entry point to investing. The age profile of investors shows that 30% of investors who only held indirect investments in 2014 were under 35. Clearly, some younger people may be using managed funds as their entry point into the sharemarket, but this strategy is less common than it could be.
Direct only investors expressed a disinclination to use managed funds to diversify, partly through lack of knowledge and partly because some older investors continued to associate managed funds with losses incurred during the GFC. It was also notable that many investors typically saw little need to diversify beyond ensuring they owned shares in a mix of industry sectors, and also held cash, property and/or bonds.
14 15
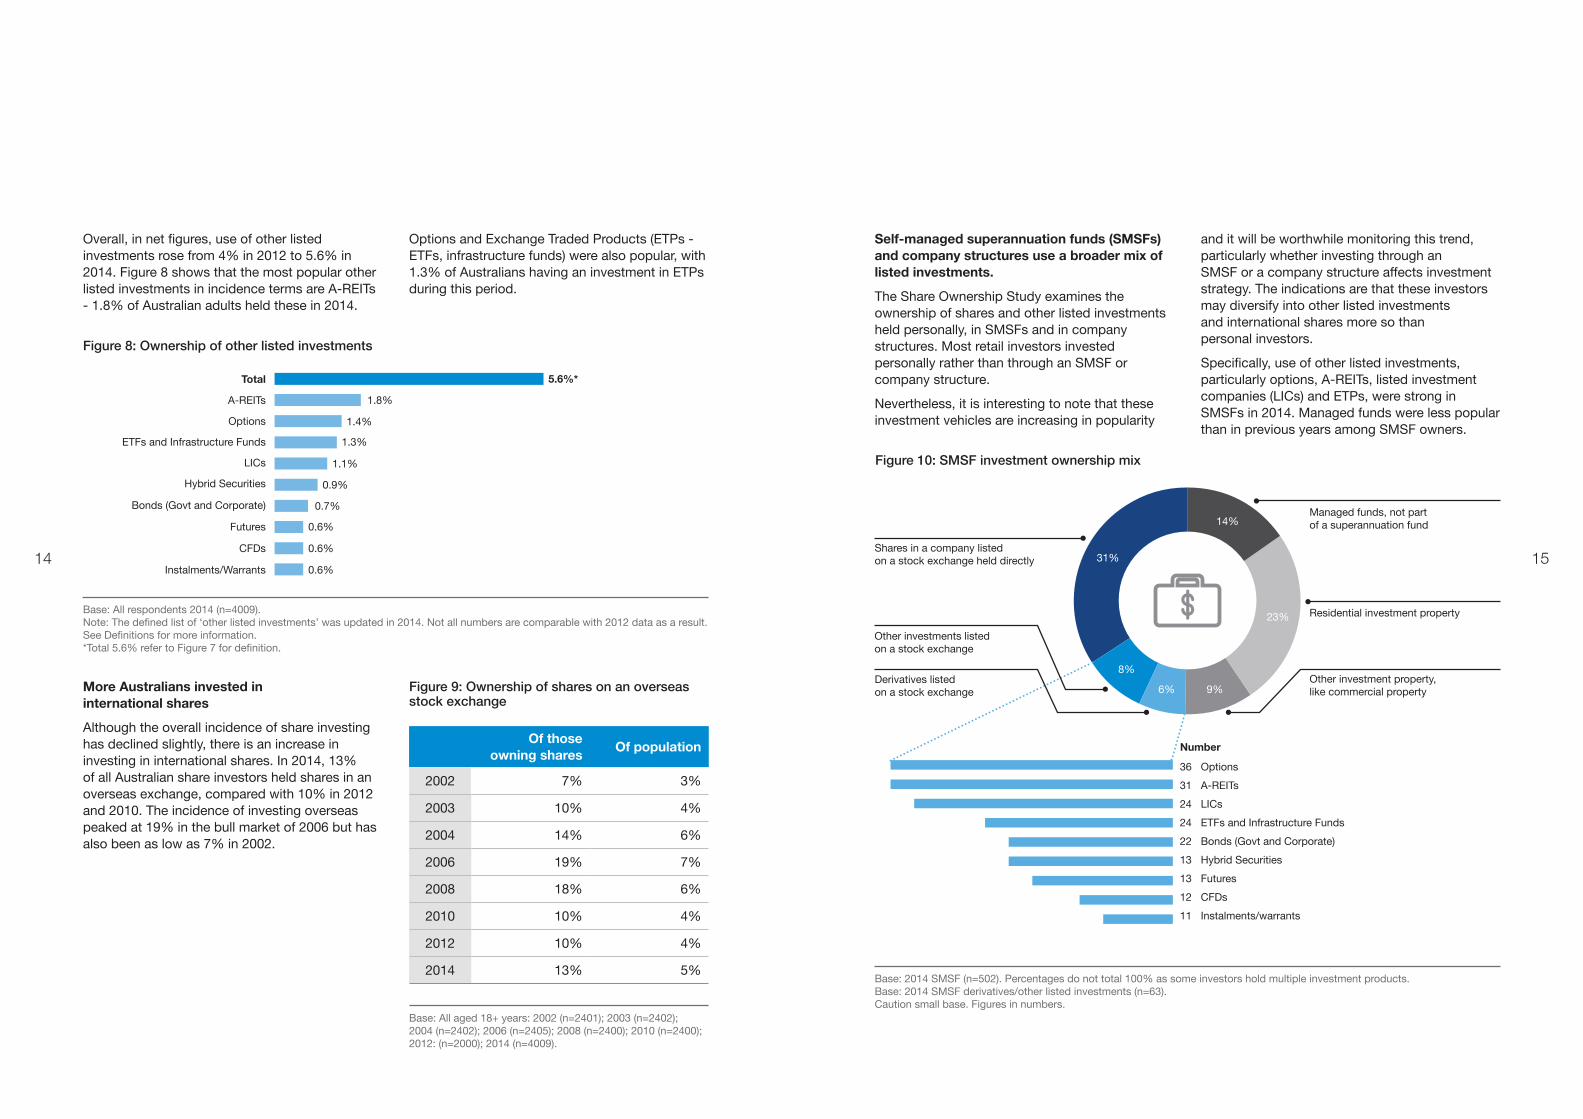
More Australians invested in international shares
Although the overall incidence of share investing has declined slightly, there is an increase in investing in international shares. In 2014, 13% of all Australian share investors held shares in an overseas exchange, compared with 10% in 2012 and 2010. The incidence of investing overseas peaked at 19% in the bull market of 2006 but has also been as low as 7% in 2002.
Figure 8: Ownership of other listed investments
Figure 9: Ownership of shares on an overseas stock exchange
Of those
owning shares Of population
2002 7% 3%
2003 10% 4%
2004 14% 6%
2006 19% 7%
2008 18% 6%
2010 10% 4%
2012 10% 4%
2014 13% 5%
Total
A-REITs
ETFs and Infrastructure Funds
Instalments/Warrants
CFDs
Futures
Hybrid Securities
Bonds (Govt and Corporate)
LICs
Options
Base: All respondents 2014 (n=4009). Note: The defined list of ‘other listed investments’ was updated in 2014. Not all numbers are comparable with 2012 data as a result. See Definitions for more information. *Total 5.6% refer to Figure 7 for definition.
Overall, in net figures, use of other listed investments rose from 4% in 2012 to 5.6% in 2014. Figure 8 shows that the most popular other listed investments in incidence terms are A-REITs - 1.8% of Australian adults held these in 2014.
5.6%*
1.8%
1.4%
1.3%
1.1%
0.9%
0.7%
0.6%
0.6%
0.6%
Base: All aged 18+ years: 2002 (n=2401); 2003 (n=2402); 2004 (n=2402); 2006 (n=2405); 2008 (n=2400); 2010 (n=2400); 2012: (n=2000); 2014 (n=4009).
Options and Exchange Traded Products (ETPs - ETFs, infrastructure funds) were also popular, with 1.3% of Australians having an investment in ETPs during this period.
31%
14%
23%
9%
8%
6%
Self-managed superannuation funds (SMSFs) and company structures use a broader mix of listed investments.
The Share Ownership Study examines the ownership of shares and other listed investments held personally, in SMSFs and in company structures. Most retail investors invested personally rather than through an SMSF or company structure.
Nevertheless, it is interesting to note that these investment vehicles are increasing in popularity
and it will be worthwhile monitoring this trend, particularly whether investing through an SMSF or a company structure affects investment strategy. The indications are that these investors may diversify into other listed investments and international shares more so than personal investors.
Specifically, use of other listed investments, particularly options, A-REITs, listed investment companies (LICs) and ETPs, were strong in SMSFs in 2014. Managed funds were less popular than in previous years among SMSF owners.
Options
A-REITs
LICs
ETFs and Infrastructure Funds
Bonds (Govt and Corporate)
Hybrid Securities
Futures
CFDs
Instalments/warrants
Shares in a company listed on a stock exchange held directly
Managed funds, not part of a superannuation fund
Other investment property, like commercial property
Number
Derivatives listed on a stock exchange
Residential investment property
Other investments listed on a stock exchange
Figure 10: SMSF investment ownership mix
Base: 2014 SMSF (n=502). Percentages do not total 100% as some investors hold multiple investment products. Base: 2014 SMSF derivatives/other listed investments (n=63). Caution small base. Figures in numbers.
36
31
24
24
22
13
13
12
11
1716
Hybrid Securities
CFDs
ETFs and Infrastructure Funds
Futures
A-REITs
LICs
Options
Bonds (Govt and Corporate)
Instalments/Warrants
12
12
11
8
7
7
6
4
3
Who owns shares and listed investments?
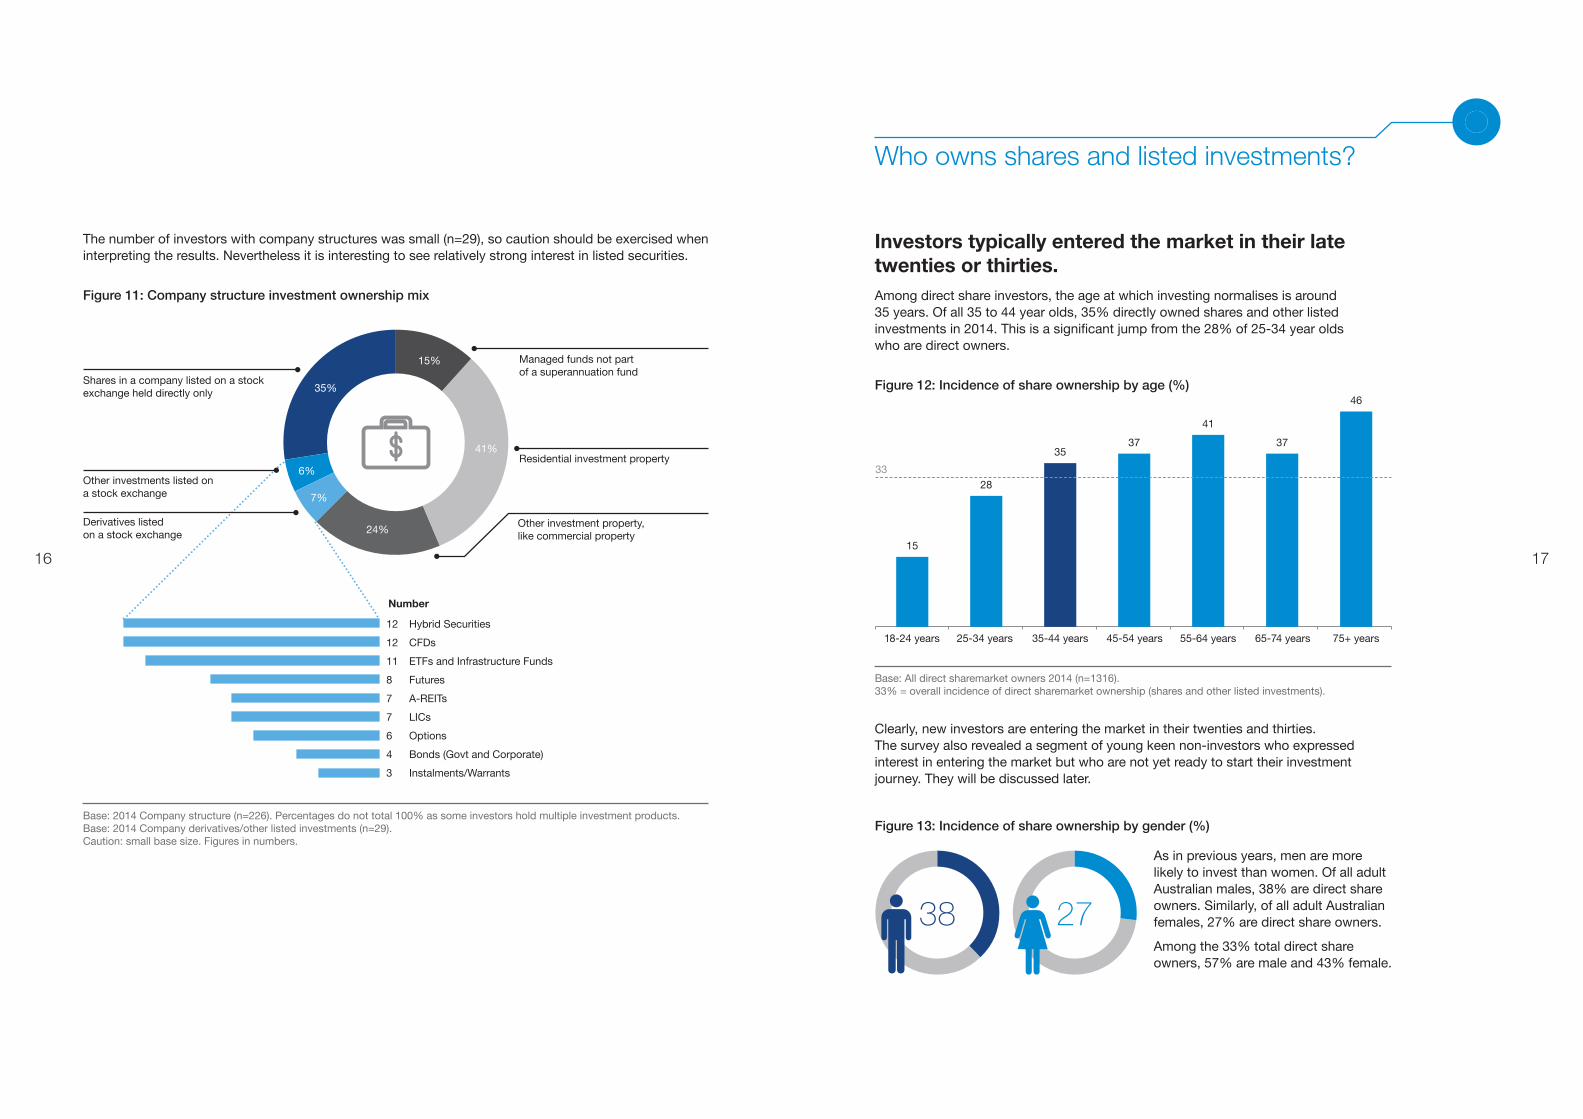
Investors typically entered the market in their late twenties or thirties.Among direct share investors, the age at which investing normalises is around 35 years. Of all 35 to 44 year olds, 35% directly owned shares and other listed investments in 2014. This is a significant jump from the 28% of 25-34 year olds who are direct owners.
Base: 2014 Company structure (n=226). Percentages do not total 100% as some investors hold multiple investment products. Base: 2014 Company derivatives/other listed investments (n=29). Caution: small base size. Figures in numbers.
Figure 11: Company structure investment ownership mix
The number of investors with company structures was small (n=29), so caution should be exercised when interpreting the results. Nevertheless it is interesting to see relatively strong interest in listed securities.
Clearly, new investors are entering the market in their twenties and thirties. The survey also revealed a segment of young keen non-investors who expressed interest in entering the market but who are not yet ready to start their investment journey. They will be discussed later.
Figure 12: Incidence of share ownership by age (%)
Base: All direct sharemarket owners 2014 (n=1316). 33% = overall incidence of direct sharemarket ownership (shares and other listed investments).
15
28
3537
41
37
46
33
Figure 13: Incidence of share ownership by gender (%)
2738
As in previous years, men are more likely to invest than women. Of all adult Australian males, 38% are direct share owners. Similarly, of all adult Australian females, 27% are direct share owners.
Among the 33% total direct share owners, 57% are male and 43% female.
7%
35%
15%
41%
24%
6%
Shares in a company listed on a stock exchange held directly only
Managed funds not part of a superannuation fund
Derivatives listed on a stock exchange
Residential investment property
Other investment property, like commercial property
Other investments listed on a stock exchange
Number
18 19
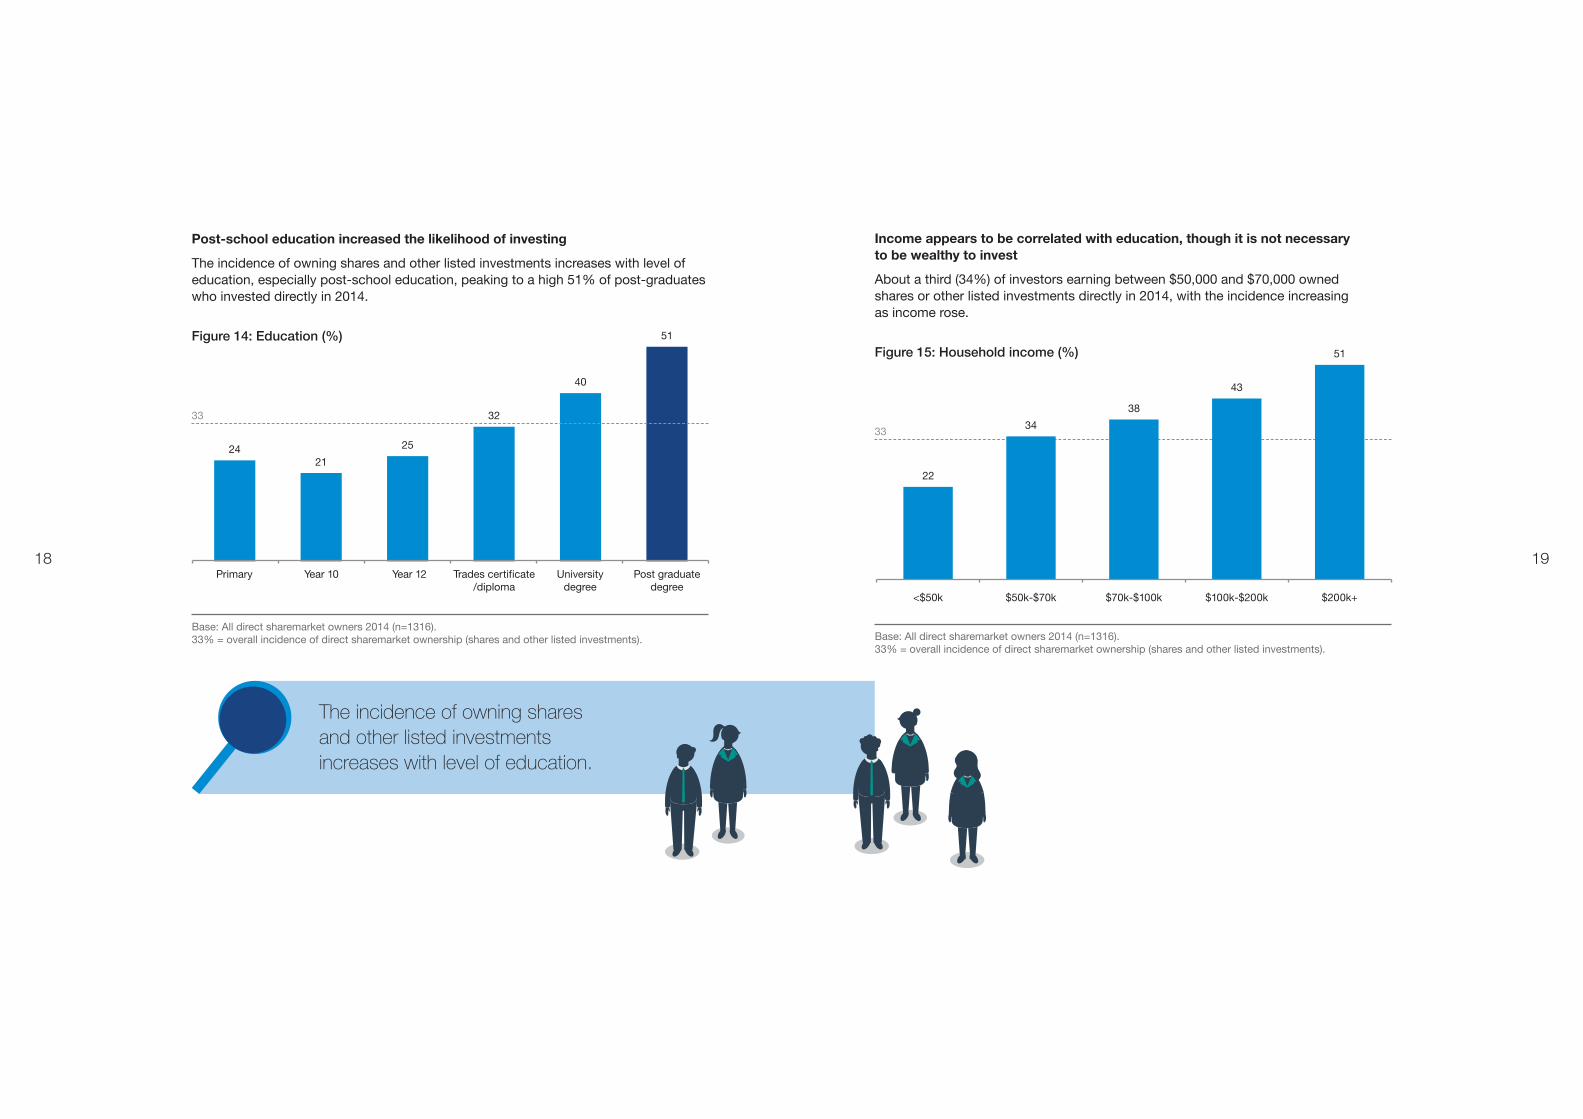
Income appears to be correlated with education, though it is not necessary to be wealthy to invest
About a third (34%) of investors earning between $50,000 and $70,000 owned shares or other listed investments directly in 2014, with the incidence increasing as income rose.
Figure 15: Household income (%)
Post-school education increased the likelihood of investing
The incidence of owning shares and other listed investments increases with level of education, especially post-school education, peaking to a high 51% of post-graduates who invested directly in 2014.
Figure 14: Education (%)
2421
25
32
40
51
33
Base: All direct sharemarket owners 2014 (n=1316). 33% = overall incidence of direct sharemarket ownership (shares and other listed investments). Base: All direct sharemarket owners 2014 (n=1316).
33% = overall incidence of direct sharemarket ownership (shares and other listed investments).
22
34
38
43
51
33
The incidence of owning shares and other listed investments increases with level of education.
2120
What is the outlook for 2015?
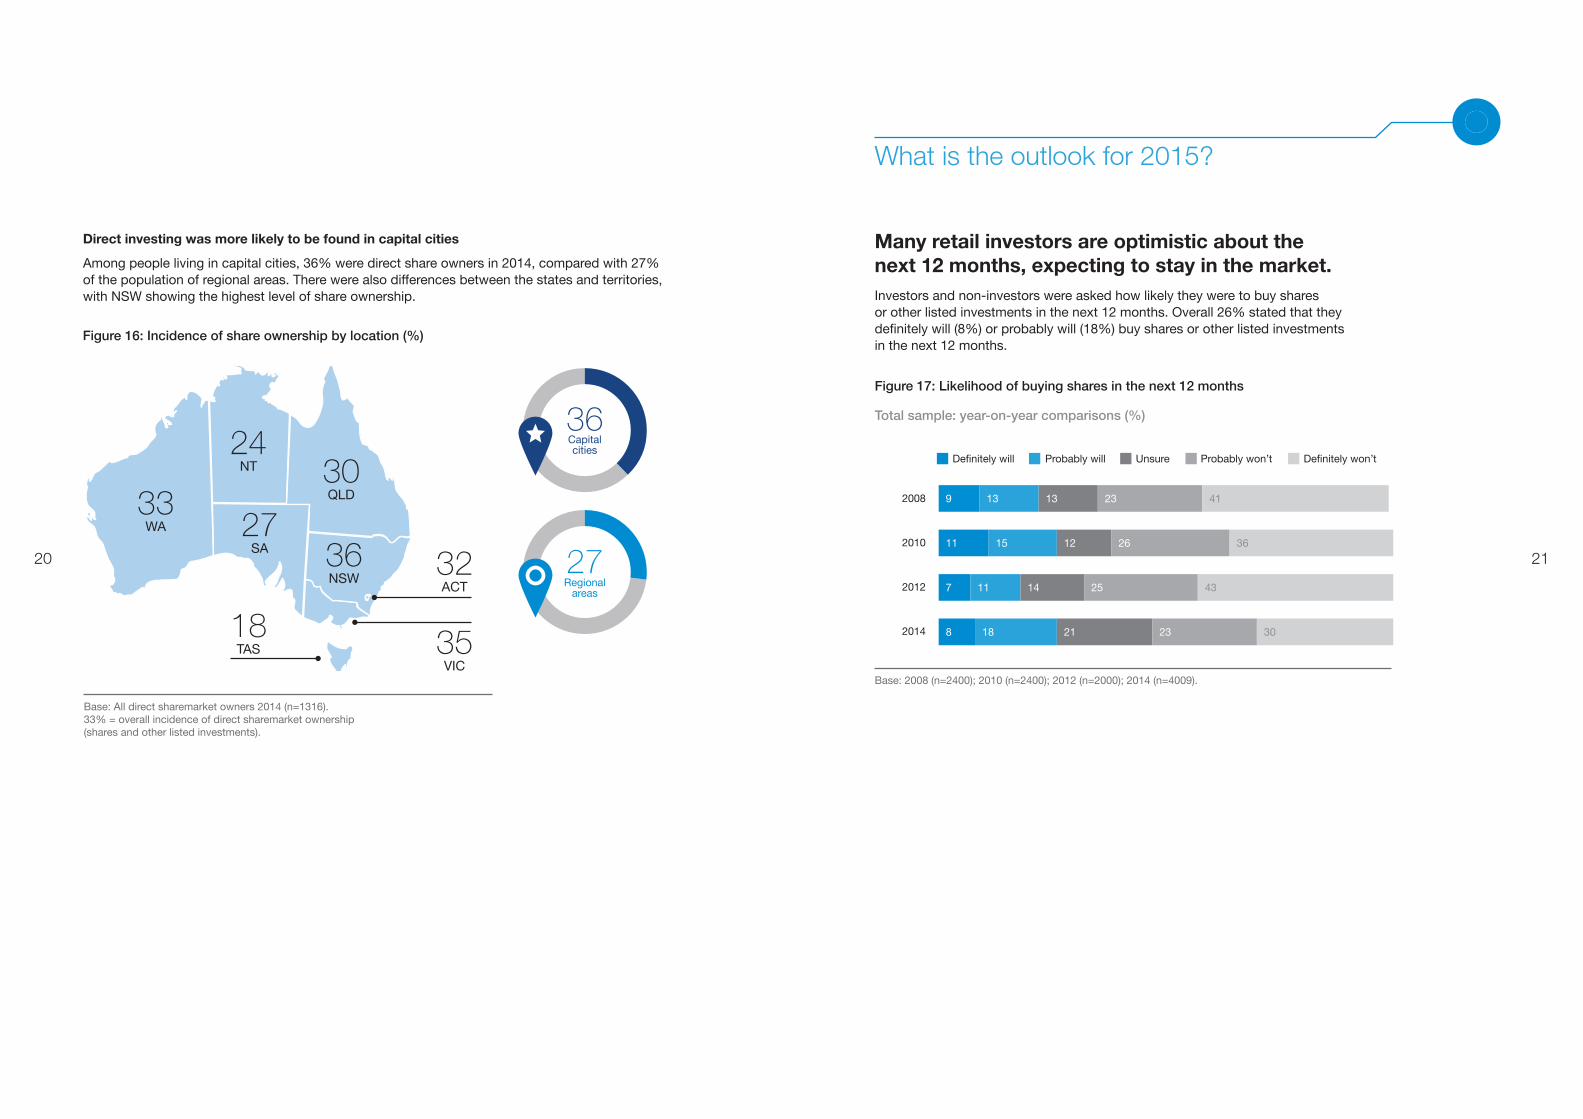
Direct investing was more likely to be found in capital cities
Among people living in capital cities, 36% were direct share owners in 2014, compared with 27% of the population of regional areas. There were also differences between the states and territories, with NSW showing the highest level of share ownership.
36NSW
30QLD
24NT
33WA 27
SA
35VIC
32ACT
18TAS
Figure 16: Incidence of share ownership by location (%)
Base: All direct sharemarket owners 2014 (n=1316). 33% = overall incidence of direct sharemarket ownership (shares and other listed investments).
36Capital cities
27Regional
areas
Figure 17: Likelihood of buying shares in the next 12 months
Total sample: year-on-year comparisons (%)
Many retail investors are optimistic about the next 12 months, expecting to stay in the market.Investors and non-investors were asked how likely they were to buy shares or other listed investments in the next 12 months. Overall 26% stated that they definitely will (8%) or probably will (18%) buy shares or other listed investments in the next 12 months.
Base: 2008 (n=2400); 2010 (n=2400); 2012 (n=2000); 2014 (n=4009).
2008
2010
2012
2014
36
43
30
26
25
23
12
14
21
15
11
18
412313139
11
7
8
Definitely will Probably will Unsure Probably won’t Definitely won’t
22 23
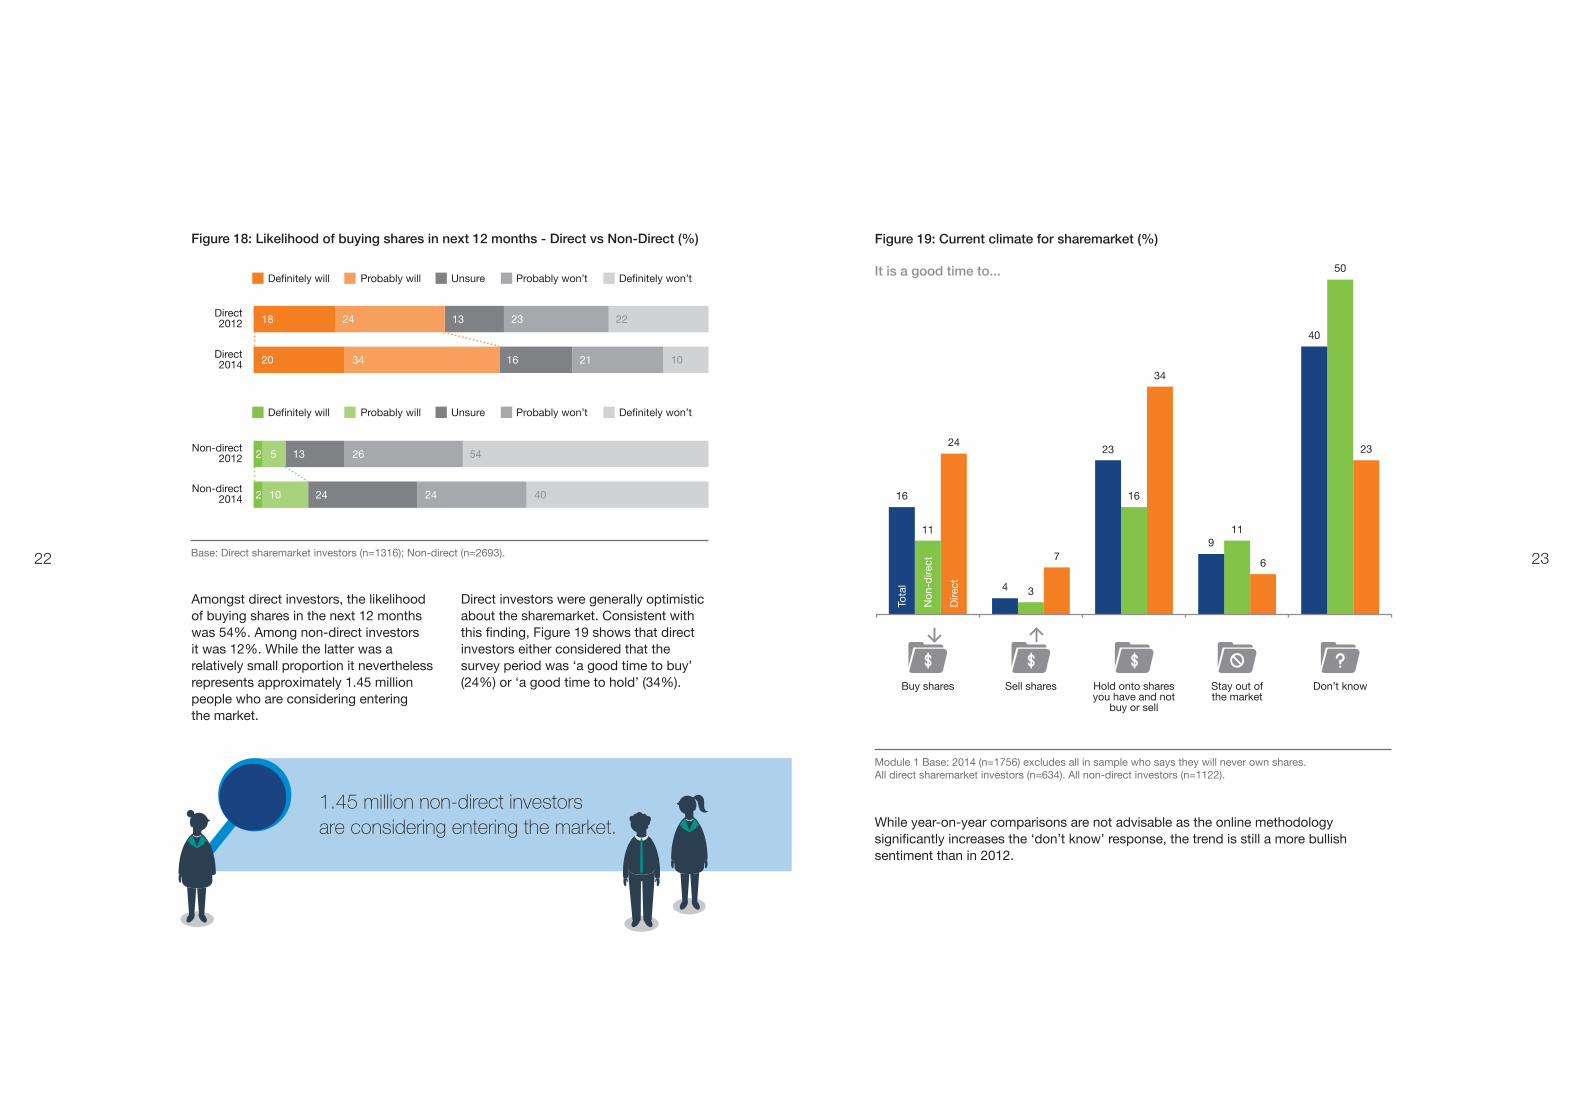
Amongst direct investors, the likelihood of buying shares in the next 12 months was 54%. Among non-direct investors it was 12%. While the latter was a relatively small proportion it nevertheless represents approximately 1.45 million people who are considering entering the market.
Figure 19: Current climate for sharemarket (%)
It is a good time to...
Module 1 Base: 2014 (n=1756) excludes all in sample who says they will never own shares. All direct sharemarket investors (n=634). All non-direct investors (n=1122).
While year-on-year comparisons are not advisable as the online methodology significantly increases the ‘don’t know’ response, the trend is still a more bullish sentiment than in 2012.
Buy shares Sell shares Hold onto shares you have and not
buy or sell
Stay out of the market
Don’t know
Tota
l
Non
-dire
ct
Dire
ct
16
11
24
4 3
7
23
16
34
40
50
23
911
6
1.45 million non-direct investors are considering entering the market.
Definitely will Probably will Unsure Probably won’t Definitely won’t
Definitely will Probably will Unsure Probably won’t Definitely won’t
Figure 18: Likelihood of buying shares in next 12 months - Direct vs Non-Direct (%)
Direct 2012
Direct 2014
Non-direct 2012
Non-direct 2014
18
20
2
2
24
34
13
24
13
16
26
24
23
21
5
10
22
10
54
40
Base: Direct sharemarket investors (n=1316); Non-direct (n=2693).
Direct investors were generally optimistic about the sharemarket. Consistent with this finding, Figure 19 shows that direct investors either considered that the survey period was ‘a good time to buy’ (24%) or ‘a good time to hold’ (34%).
24 25
What do Australians know about share investing?
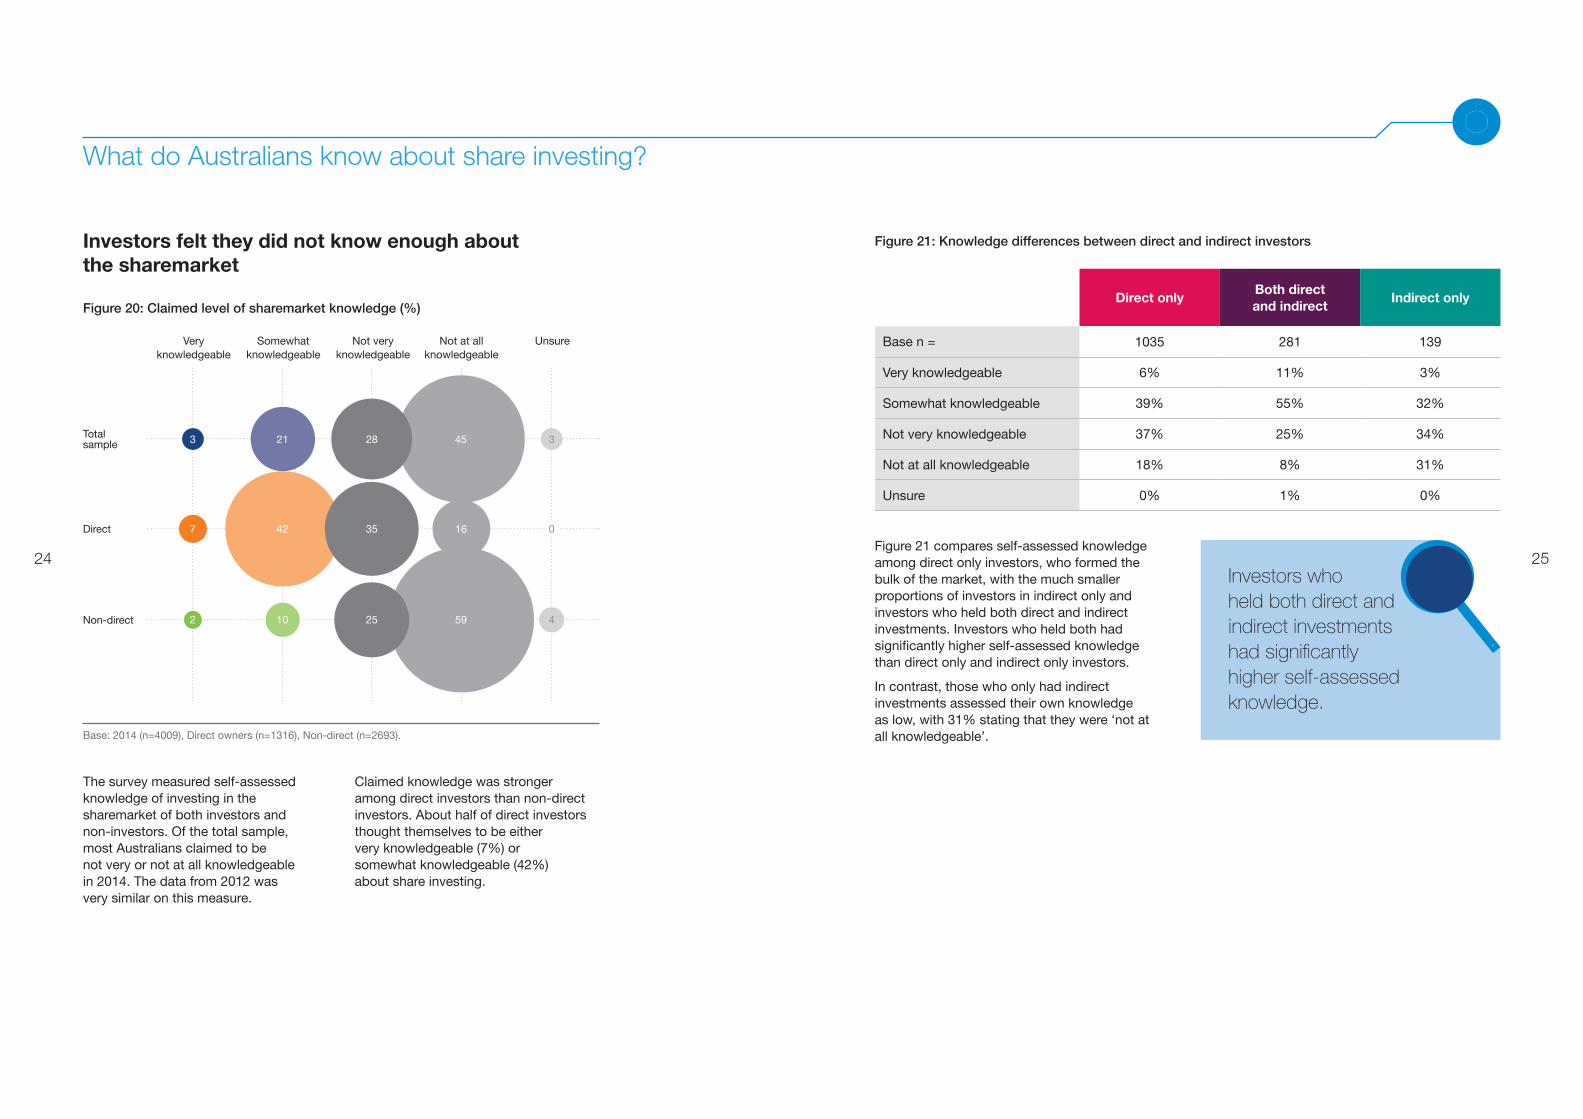
Figure 21 compares self-assessed knowledge among direct only investors, who formed the bulk of the market, with the much smaller proportions of investors in indirect only and investors who held both direct and indirect investments. Investors who held both had significantly higher self-assessed knowledge than direct only and indirect only investors.
In contrast, those who only had indirect investments assessed their own knowledge as low, with 31% stating that they were ‘not at all knowledgeable’.
Direct onlyBoth direct and indirect
Indirect only
Base n = 1035 281 139
Very knowledgeable 6% 11% 3%
Somewhat knowledgeable 39% 55% 32%
Not very knowledgeable 37% 25% 34%
Not at all knowledgeable 18% 8% 31%
Unsure 0% 1% 0%
Figure 21: Knowledge differences between direct and indirect investors
The survey measured self-assessed knowledge of investing in the sharemarket of both investors and non-investors. Of the total sample, most Australians claimed to be not very or not at all knowledgeable in 2014. The data from 2012 was very similar on this measure.
Claimed knowledge was stronger among direct investors than non-direct investors. About half of direct investors thought themselves to be either very knowledgeable (7%) or somewhat knowledgeable (42%) about share investing.
Figure 20: Claimed level of sharemarket knowledge (%)
Very knowledgeable
Somewhat knowledgeable
Not very knowledgeable
Not at all knowledgeable
Unsure
Total sample
Direct
Non-direct
3 452821 3
7 42 35 16 0
2 10 25 59 4
Base: 2014 (n=4009), Direct owners (n=1316), Non-direct (n=2693).
Investors who held both direct and indirect investments had significantly higher self-assessed knowledge.
Investors felt they did not know enough about the sharemarket
26 27Those in the market – Getting on with it
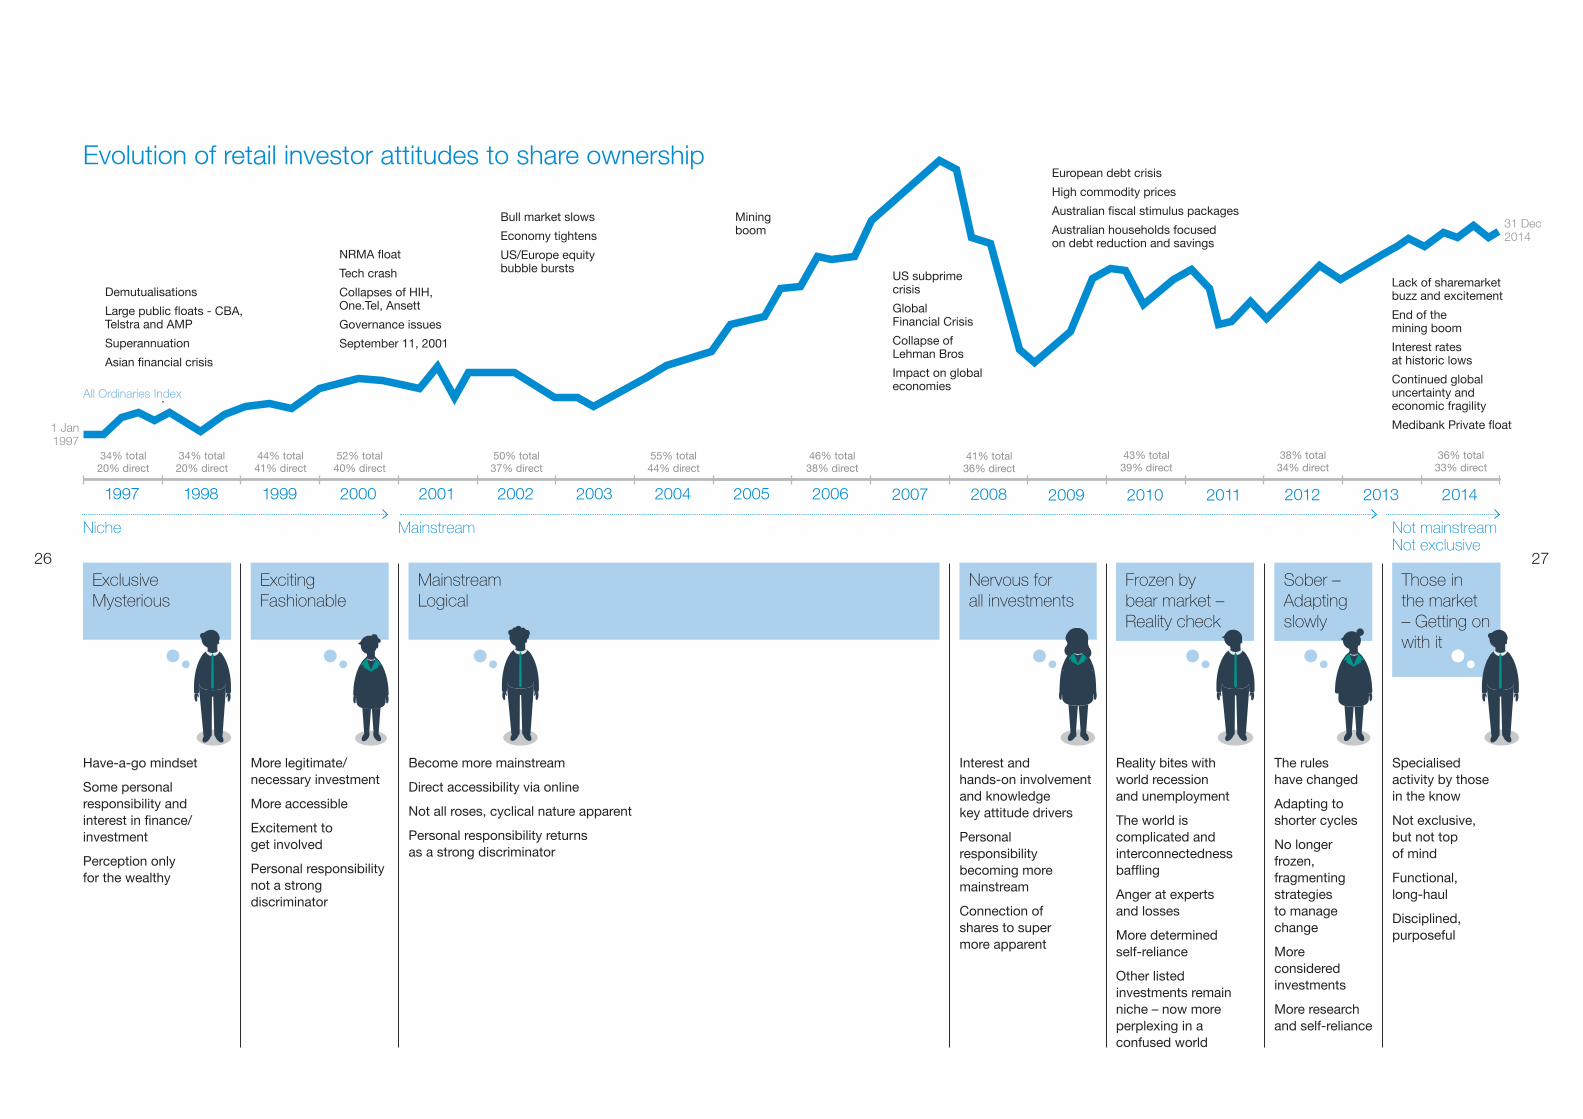
Evolution of retail investor attitudes to share ownership
Demutualisations
Large public floats - CBA, Telstra and AMP
Superannuation
Asian financial crisis
All Ordinaries Index
1 Jan 1997
31 Dec 2014
NRMA float
Tech crash
Collapses of HIH, One.Tel, Ansett
Governance issues
September 11, 2001
Bull market slows
Economy tightens
US/Europe equity bubble bursts
Mining boom
European debt crisis
High commodity prices
Australian fiscal stimulus packages
Australian households focused on debt reduction and savings
Lack of sharemarket buzz and excitement
End of the mining boom
Interest rates at historic lows
Continued global uncertainty and economic fragility
Medibank Private float
Have-a-go mindset
Some personal responsibility and interest in finance/investment
Perception only for the wealthy
More legitimate/necessary investment
More accessible
Excitement to get involved
Personal responsibility not a strong discriminator
Exclusive Mysterious
Exciting Fashionable
Become more mainstream
Direct accessibility via online
Not all roses, cyclical nature apparent
Personal responsibility returns as a strong discriminator
Interest and hands-on involvement and knowledge key attitude drivers
Personal responsibility becoming more mainstream
Connection of shares to super more apparent
Mainstream Logical
Nervous for all investments
Reality bites with world recession and unemployment
The world is complicated and interconnectedness baffling
Anger at experts and losses
More determined self-reliance
Other listed investments remain niche – now more perplexing in a confused world
The rules have changed
Adapting to shorter cycles
No longer frozen, fragmenting strategies to manage change
More considered investments
More research and self-reliance
Specialised activity by those in the know
Not exclusive, but not top of mind
Functional, long-haul
Disciplined, purposeful
Frozen by bear market – Reality check
Sober – Adapting slowly
1997 20082007 2001 2010 1999 2003 2012 2005 1998 2002 2011 2000 2009 2004 2013 2006 2014
34% total 20% direct
41% total 36% direct
34% total 20% direct
44% total 41% direct
52% total 40% direct
43% total 39% direct
50% total 37% direct
55% total 44% direct
38% total 34% direct
46% total 38% direct
36% total 33% direct
Niche Mainstream Not mainstreamNot exclusive
US subprime crisis
Global Financial Crisis
Collapse of Lehman Bros
Impact on global economies
28 29
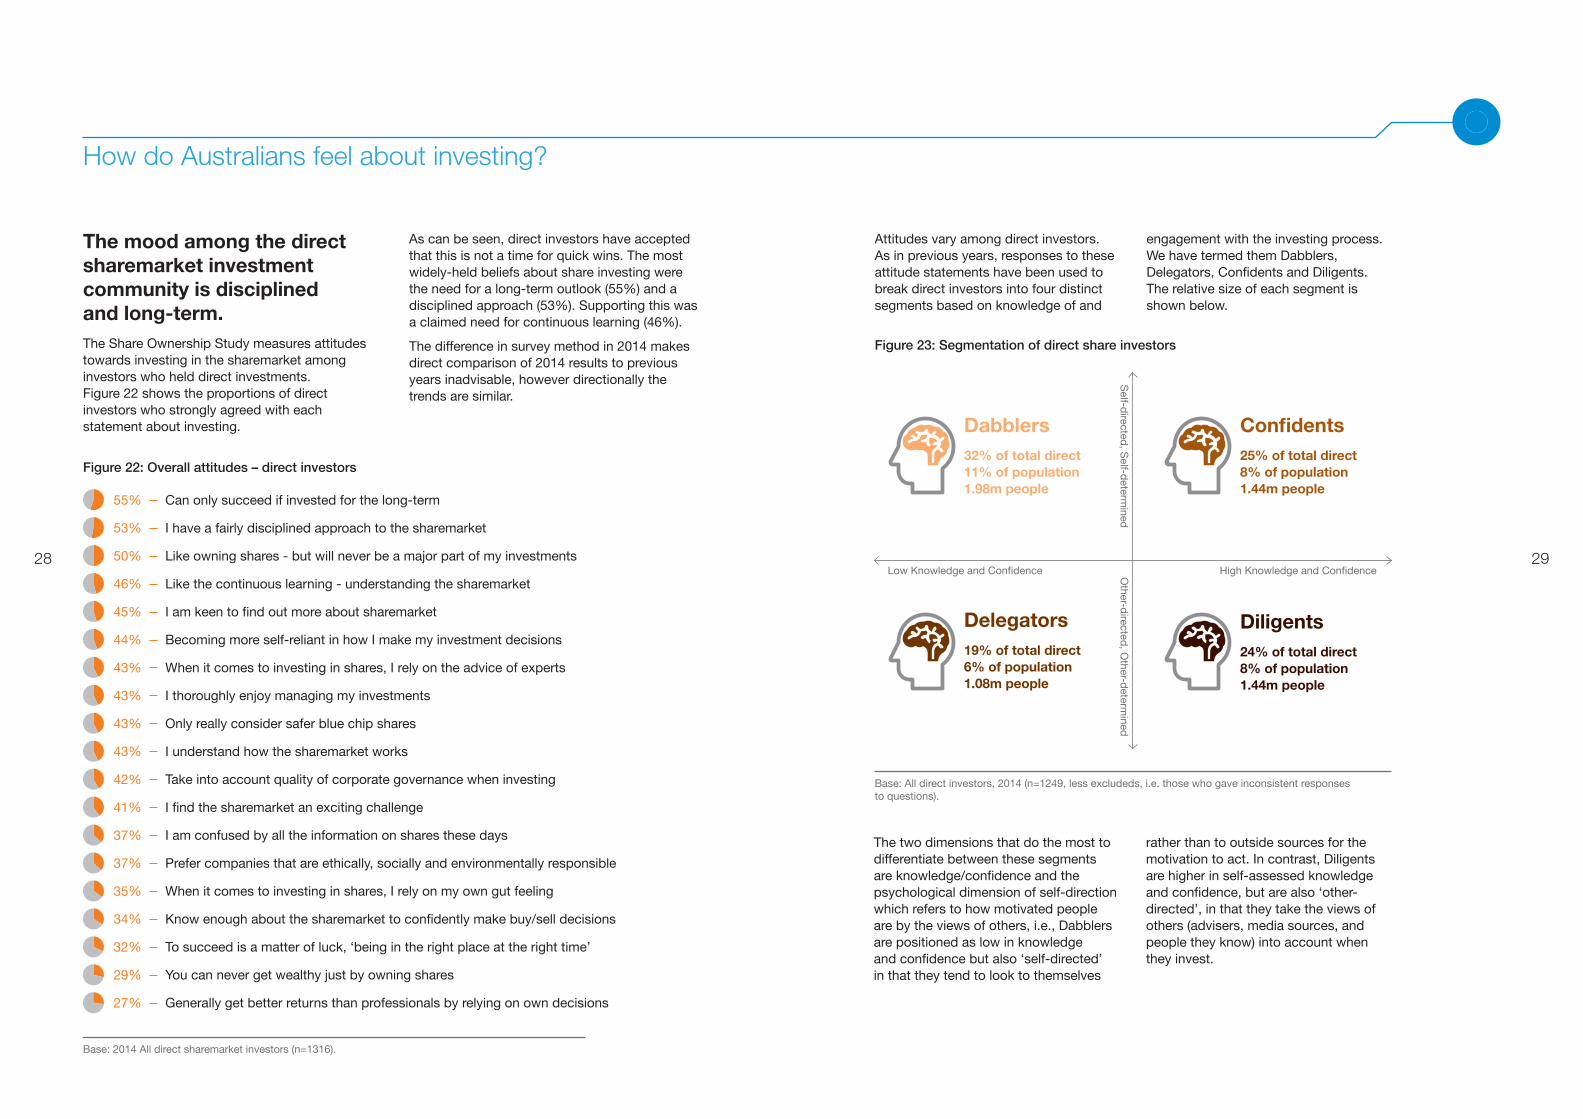
How do Australians feel about investing?
The mood among the direct sharemarket investment community is disciplined and long-term.The Share Ownership Study measures attitudes towards investing in the sharemarket among investors who held direct investments. Figure 22 shows the proportions of direct investors who strongly agreed with each statement about investing.
As can be seen, direct investors have accepted that this is not a time for quick wins. The most widely-held beliefs about share investing were the need for a long-term outlook (55%) and a disciplined approach (53%). Supporting this was a claimed need for continuous learning (46%).
The difference in survey method in 2014 makes direct comparison of 2014 results to previous years inadvisable, however directionally the trends are similar.
Figure 22: Overall attitudes – direct investors
Base: 2014 All direct sharemarket investors (n=1316).
Can only succeed if invested for the long-term
I have a fairly disciplined approach to the sharemarket
Like owning shares - but will never be a major part of my investments
Like the continuous learning - understanding the sharemarket
I am keen to find out more about sharemarket
Becoming more self-reliant in how I make my investment decisions
When it comes to investing in shares, I rely on the advice of experts
I thoroughly enjoy managing my investments
Only really consider safer blue chip shares
I understand how the sharemarket works
Take into account quality of corporate governance when investing
I find the sharemarket an exciting challenge
I am confused by all the information on shares these days
Prefer companies that are ethically, socially and environmentally responsible
When it comes to investing in shares, I rely on my own gut feeling
Know enough about the sharemarket to confidently make buy/sell decisions
To succeed is a matter of luck, ‘being in the right place at the right time’
You can never get wealthy just by owning shares
Generally get better returns than professionals by relying on own decisions
Figure 23: Segmentation of direct share investors
Base: All direct investors, 2014 (n=1249, less excludeds, i.e. those who gave inconsistent responses to questions).
Low Knowledge and Confidence High Knowledge and ConfidenceOther-d
irected, O
ther-determ
inedS
elf-directed
, Self-d
etermined
Dabblers32% of total direct 11% of population 1.98m people
Diligents24% of total direct 8% of population 1.44m people
Confidents25% of total direct 8% of population 1.44m people
Delegators19% of total direct 6% of population 1.08m people
Attitudes vary among direct investors. As in previous years, responses to these attitude statements have been used to break direct investors into four distinct segments based on knowledge of and
engagement with the investing process. We have termed them Dabblers, Delegators, Confidents and Diligents. The relative size of each segment is shown below.
The two dimensions that do the most to differentiate between these segments are knowledge/confidence and the psychological dimension of self-direction which refers to how motivated people are by the views of others, i.e., Dabblers are positioned as low in knowledge and confidence but also ‘self-directed’ in that they tend to look to themselves
rather than to outside sources for the motivation to act. In contrast, Diligents are higher in self-assessed knowledge and confidence, but are also ‘other-directed’, in that they take the views of others (advisers, media sources, and people they know) into account when they invest.
30 31
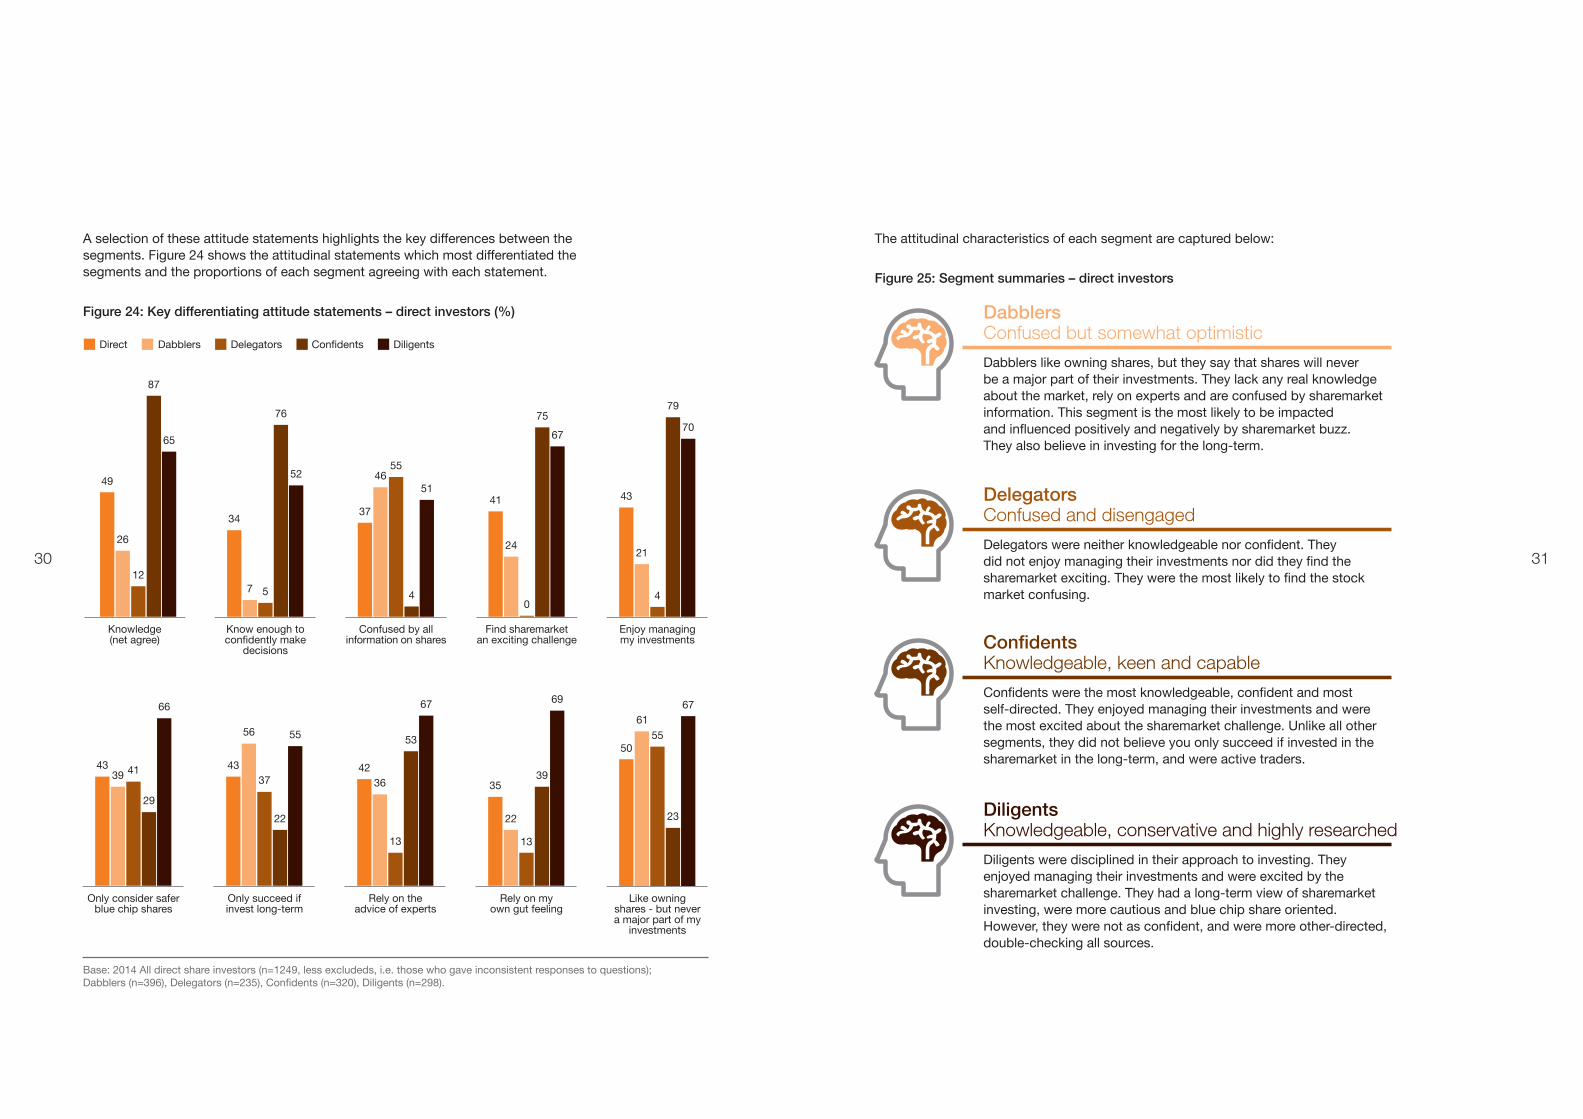
The attitudinal characteristics of each segment are captured below:
Figure 25: Segment summaries – direct investors
Dabblers Confused but somewhat optimistic
Dabblers like owning shares, but they say that shares will never be a major part of their investments. They lack any real knowledge about the market, rely on experts and are confused by sharemarket information. This segment is the most likely to be impacted and influenced positively and negatively by sharemarket buzz. They also believe in investing for the long-term.
Confidents Knowledgeable, keen and capable
Confidents were the most knowledgeable, confident and most self-directed. They enjoyed managing their investments and were the most excited about the sharemarket challenge. Unlike all other segments, they did not believe you only succeed if invested in the sharemarket in the long-term, and were active traders.
Delegators Confused and disengaged
Delegators were neither knowledgeable nor confident. They did not enjoy managing their investments nor did they find the sharemarket exciting. They were the most likely to find the stock market confusing.
Diligents
Knowledgeable, conservative and highly researched
Diligents were disciplined in their approach to investing. They enjoyed managing their investments and were excited by the sharemarket challenge. They had a long-term view of sharemarket investing, were more cautious and blue chip share oriented. However, they were not as confident, and were more other-directed, double-checking all sources.
A selection of these attitude statements highlights the key differences between the segments. Figure 24 shows the attitudinal statements which most differentiated the segments and the proportions of each segment agreeing with each statement.
Figure 24: Key differentiating attitude statements – direct investors (%)
Knowledge (net agree)
Know enough to confidently make
decisions
Confused by all information on shares
Find sharemarket an exciting challenge
Enjoy managing my investments
Base: 2014 All direct share investors (n=1249, less excludeds, i.e. those who gave inconsistent responses to questions); Dabblers (n=396), Delegators (n=235), Confidents (n=320), Diligents (n=298).
Only consider safer blue chip shares
Only succeed if invest long-term
Rely on the advice of experts
Rely on my own gut feeling
Like owning shares - but never a major part of my
investments
Direct Dabblers Delegators Confidents Diligents
65
5251
6770
87
76
4
7579
12
5
55
04
49
3437
41 43
26
7
46
2421
29
22
53
39
23
4137
13 13
55
39
56
36
22
61
43 43 42
35
50
66
55
67 69 67
3332
How actively do retail investors trade?
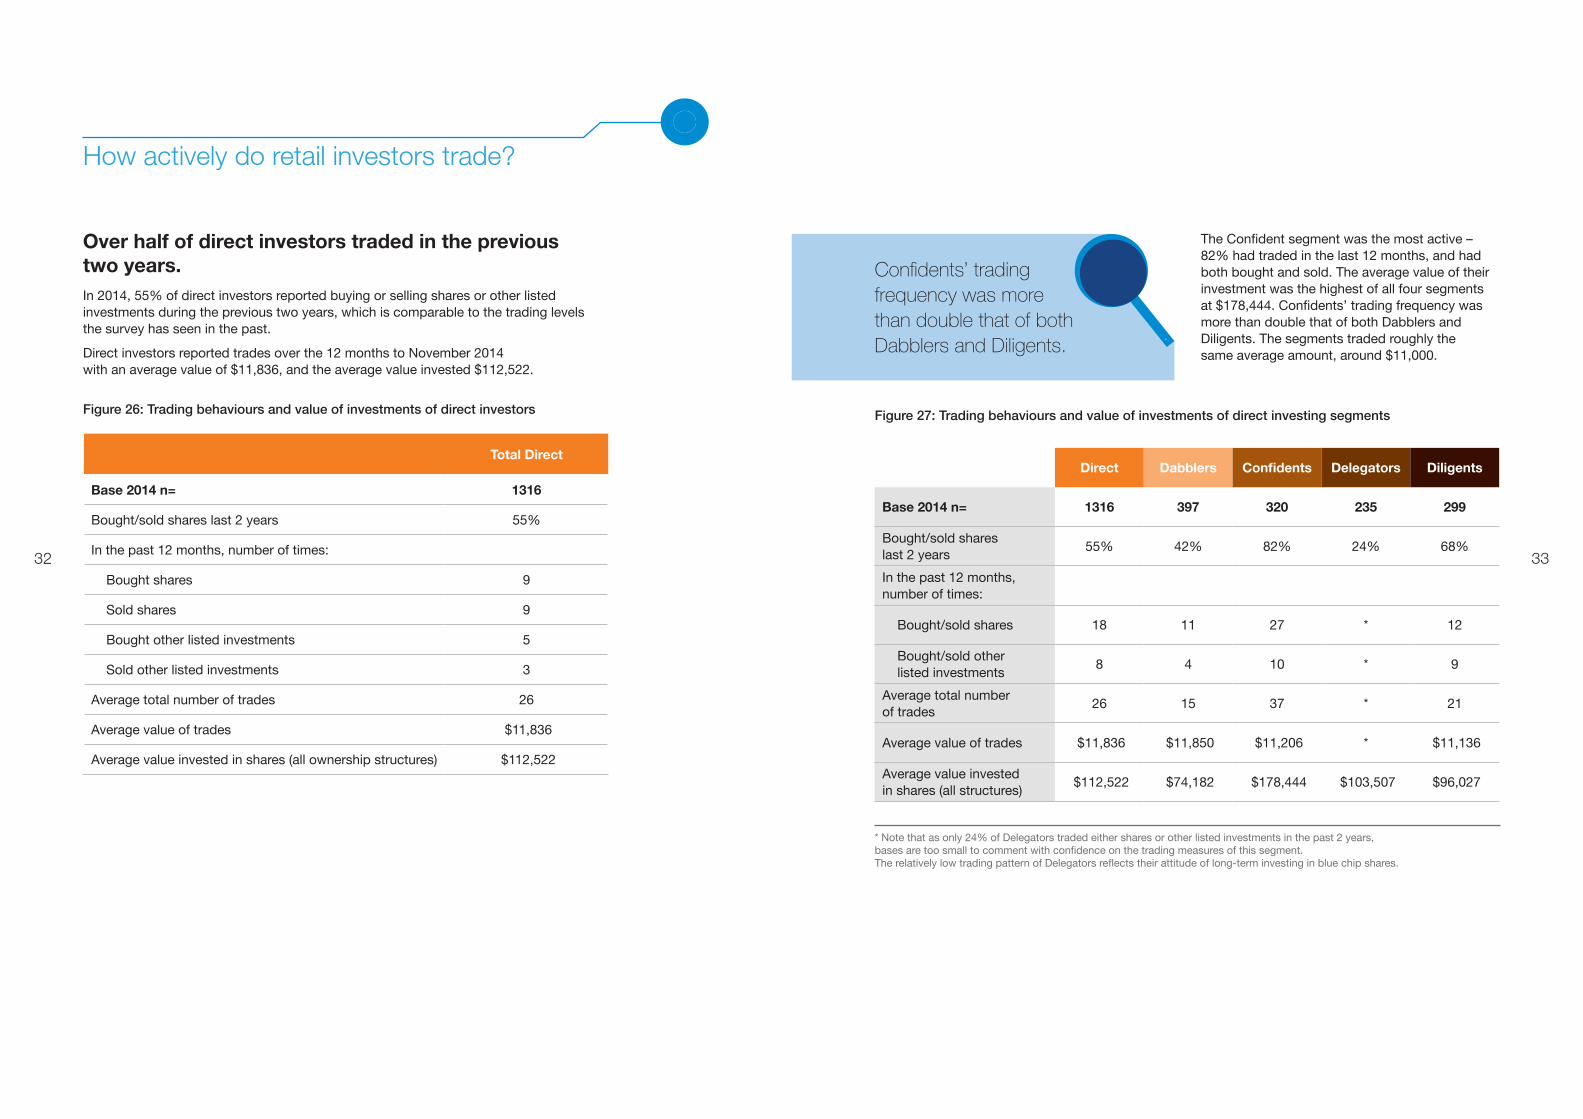
Over half of direct investors traded in the previous two years.In 2014, 55% of direct investors reported buying or selling shares or other listed investments during the previous two years, which is comparable to the trading levels the survey has seen in the past.
Direct investors reported trades over the 12 months to November 2014 with an average value of $11,836, and the average value invested $112,522.
Figure 26: Trading behaviours and value of investments of direct investors
Total Direct
Base 2014 n= 1316
Bought/sold shares last 2 years 55%
In the past 12 months, number of times:
Bought shares 9
Sold shares 9
Bought other listed investments 5
Sold other listed investments 3
Average total number of trades 26
Average value of trades $11,836
Average value invested in shares (all ownership structures) $112,522
Figure 27: Trading behaviours and value of investments of direct investing segments
Direct Dabblers Confidents Delegators Diligents
Base 2014 n= 1316 397 320 235 299
Bought/sold shares last 2 years
55% 42% 82% 24% 68%
In the past 12 months, number of times:
Bought/sold shares 18 11 27 * 12
Bought/sold other listed investments
8 4 10 * 9
Average total number of trades
26 15 37 * 21
Average value of trades $11,836 $11,850 $11,206 * $11,136
Average value invested in shares (all structures)
$112,522 $74,182 $178,444 $103,507 $96,027
* Note that as only 24% of Delegators traded either shares or other listed investments in the past 2 years, bases are too small to comment with confidence on the trading measures of this segment. The relatively low trading pattern of Delegators reflects their attitude of long-term investing in blue chip shares.
The Confident segment was the most active – 82% had traded in the last 12 months, and had both bought and sold. The average value of their investment was the highest of all four segments at $178,444. Confidents’ trading frequency was more than double that of both Dabblers and Diligents. The segments traded roughly the same average amount, around $11,000.
Confidents’ trading frequency was more than double that of both Dabblers and Diligents.
3534
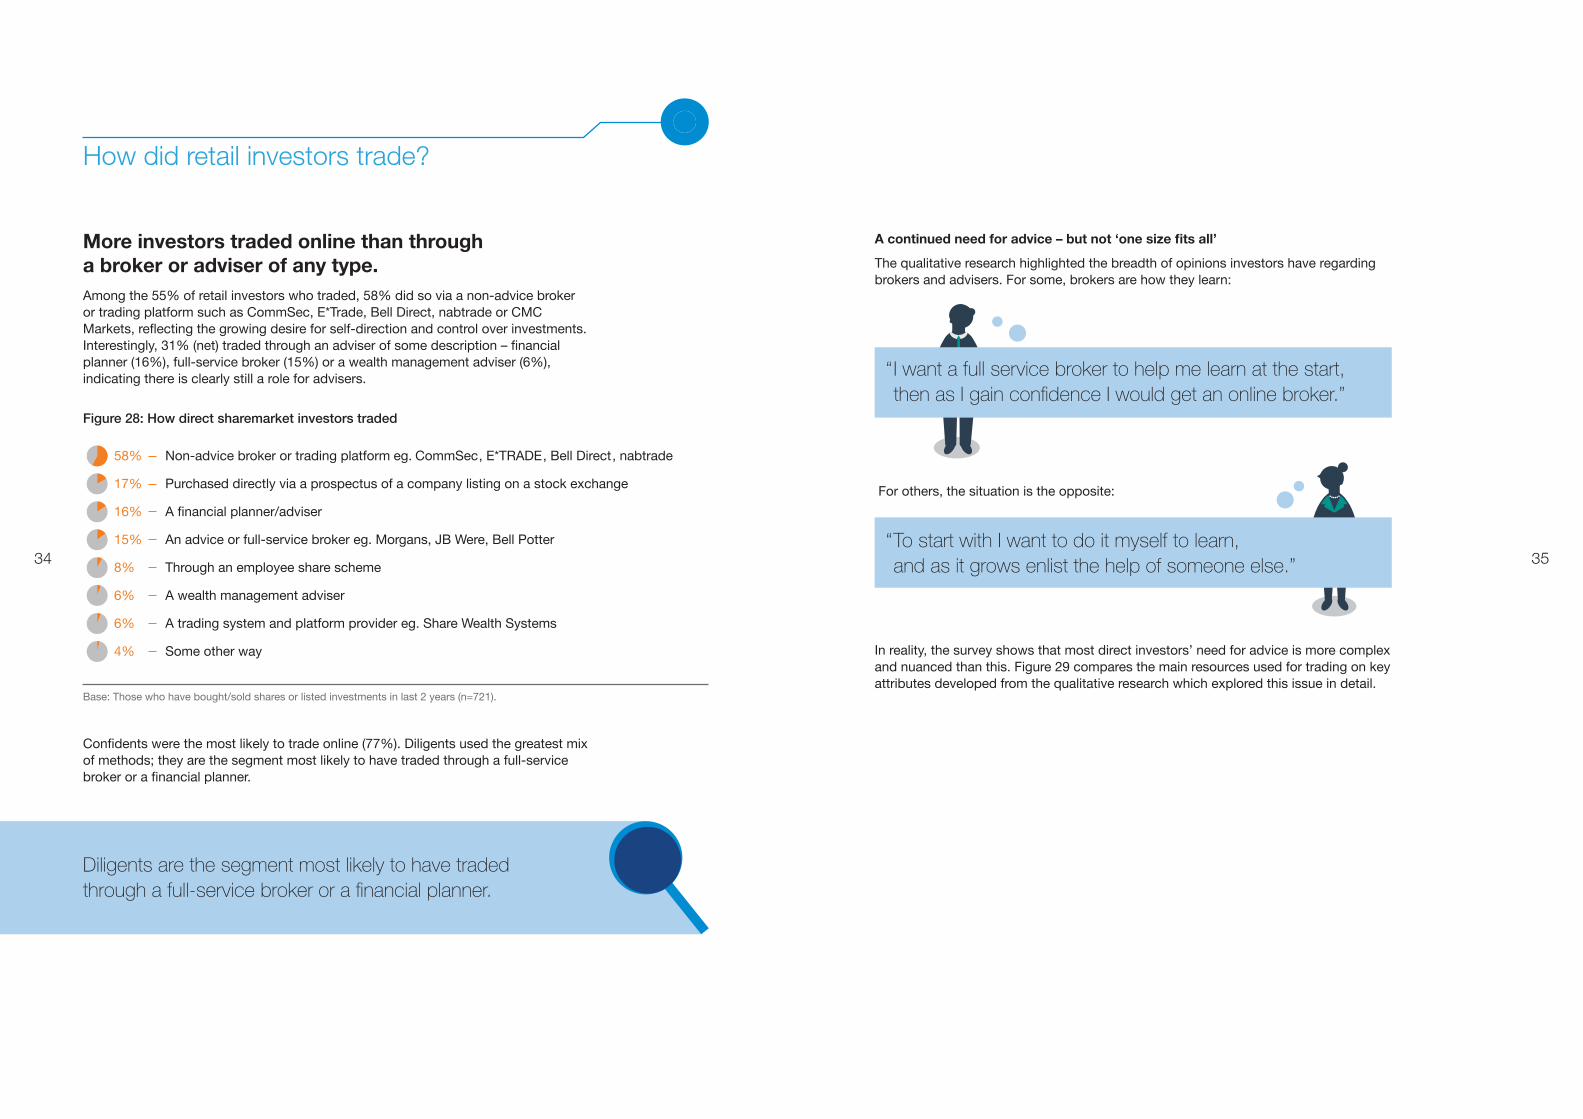
A continued need for advice – but not ‘one size fits all’
The qualitative research highlighted the breadth of opinions investors have regarding brokers and advisers. For some, brokers are how they learn:
In reality, the survey shows that most direct investors’ need for advice is more complex and nuanced than this. Figure 29 compares the main resources used for trading on key attributes developed from the qualitative research which explored this issue in detail.
“ I want a full service broker to help me learn at the start, then as I gain confidence I would get an online broker.”
“ To start with I want to do it myself to learn, and as it grows enlist the help of someone else.”
For others, the situation is the opposite:
How did retail investors trade?
Confidents were the most likely to trade online (77%). Diligents used the greatest mix of methods; they are the segment most likely to have traded through a full-service broker or a financial planner.
More investors traded online than through a broker or adviser of any type.Among the 55% of retail investors who traded, 58% did so via a non-advice broker or trading platform such as CommSec, E*Trade, Bell Direct, nabtrade or CMC Markets, reflecting the growing desire for self-direction and control over investments. Interestingly, 31% (net) traded through an adviser of some description – financial planner (16%), full-service broker (15%) or a wealth management adviser (6%), indicating there is clearly still a role for advisers.
Figure 28: How direct sharemarket investors traded
58%
17%
16%
15%
8%
6%
6%
4%
Non-advice broker or trading platform eg. CommSec, E*TRADE, Bell Direct, nabtrade
Purchased directly via a prospectus of a company listing on a stock exchange
A financial planner/adviser
An advice or full-service broker eg. Morgans, JB Were, Bell Potter
Through an employee share scheme
A wealth management adviser
A trading system and platform provider eg. Share Wealth Systems
Some other way
Base: Those who have bought/sold shares or listed investments in last 2 years (n=721).
Diligents are the segment most likely to have traded through a full-service broker or a financial planner.
36 37
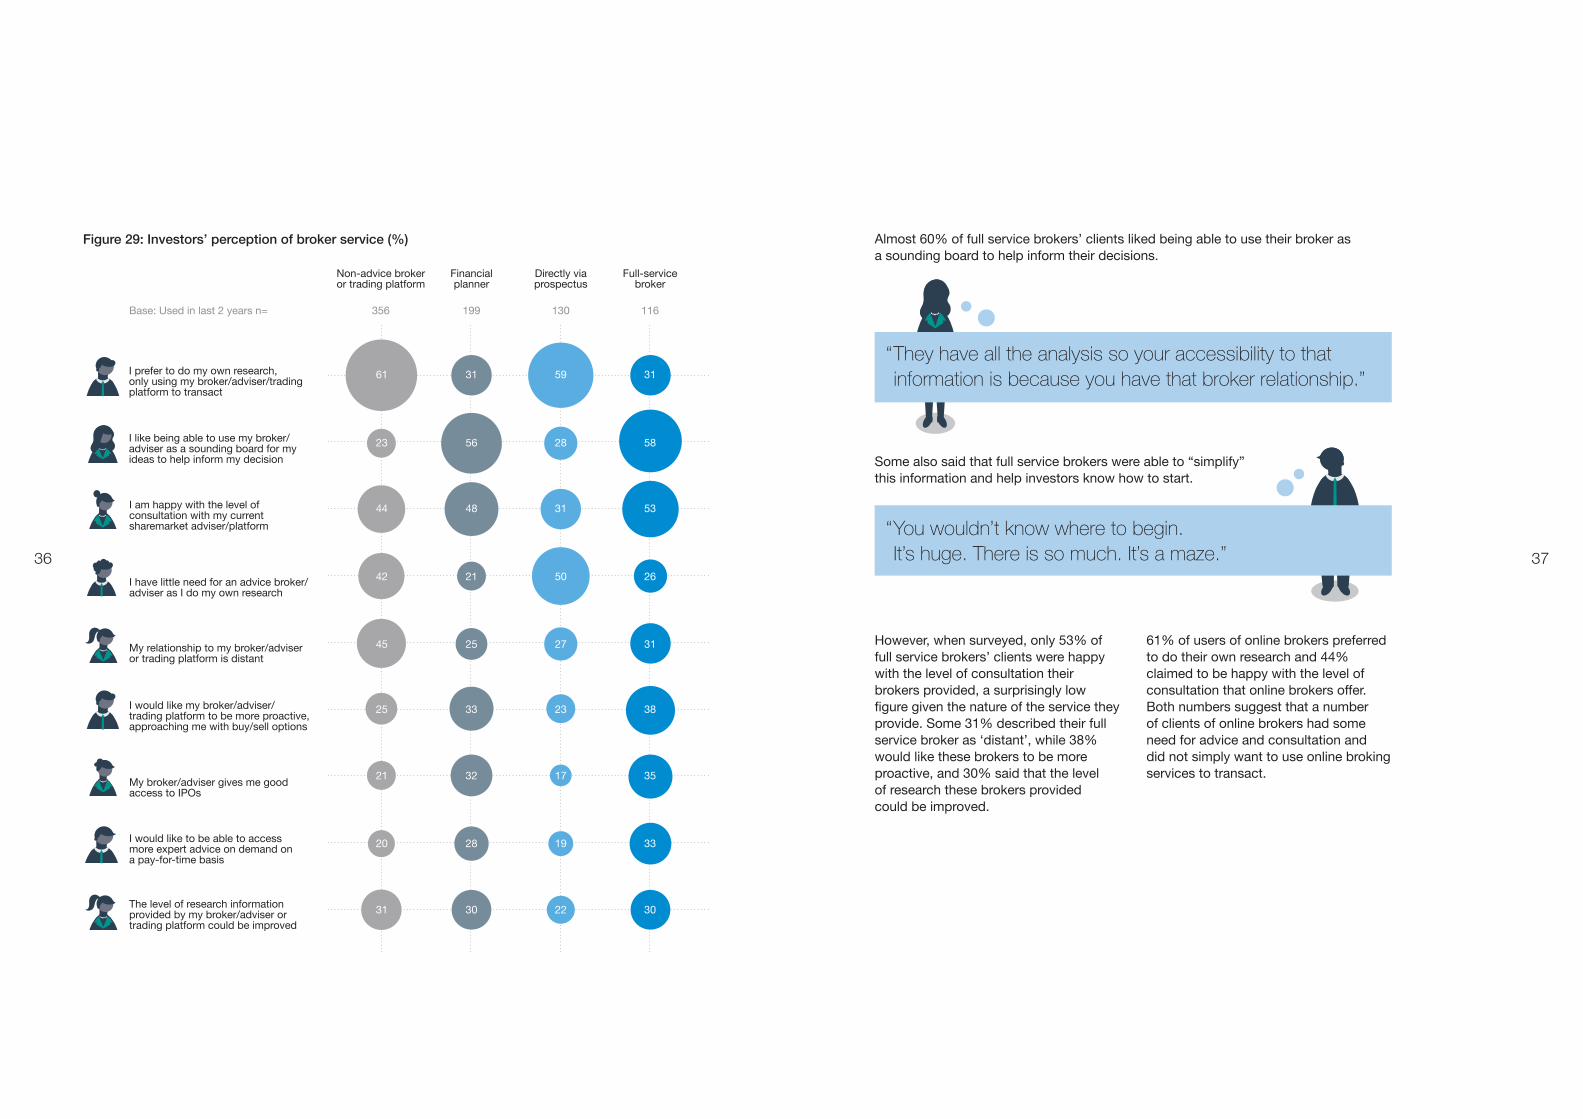
However, when surveyed, only 53% of full service brokers’ clients were happy with the level of consultation their brokers provided, a surprisingly low figure given the nature of the service they provide. Some 31% described their full service broker as ‘distant’, while 38% would like these brokers to be more proactive, and 30% said that the level of research these brokers provided could be improved.
61% of users of online brokers preferred to do their own research and 44% claimed to be happy with the level of consultation that online brokers offer. Both numbers suggest that a number of clients of online brokers had some need for advice and consultation and did not simply want to use online broking services to transact.
Almost 60% of full service brokers’ clients liked being able to use their broker as a sounding board to help inform their decisions.
“ They have all the analysis so your accessibility to that information is because you have that broker relationship.”
“ You wouldn’t know where to begin. It’s huge. There is so much. It’s a maze.”
Some also said that full service brokers were able to “simplify” this information and help investors know how to start.
Figure 29: Investors’ perception of broker service (%)
Non-advice broker or trading platform
Financial planner
Directly via prospectus
Full-service broker
356 199 130 116Base: Used in last 2 years n=
I prefer to do my own research, only using my broker/adviser/trading platform to transact
I would like my broker/adviser/trading platform to be more proactive, approaching me with buy/sell options
My broker/adviser gives me good access to IPOs
I have little need for an advice broker/adviser as I do my own research
I would like to be able to access more expert advice on demand on a pay-for-time basis
My relationship to my broker/adviser or trading platform is distant
The level of research information provided by my broker/adviser or trading platform could be improved
I like being able to use my broker/adviser as a sounding board for my ideas to help inform my decision
I am happy with the level of consultation with my current sharemarket adviser/platform
61 31 59 31
23 56 28 58
44 48 31 53
42 21 50 26
45 25 27 31
25 33 23 38
21 32 17 35
20 28 19 33
31 30 22 30
3938
Where do investors go for advice and information about investing?
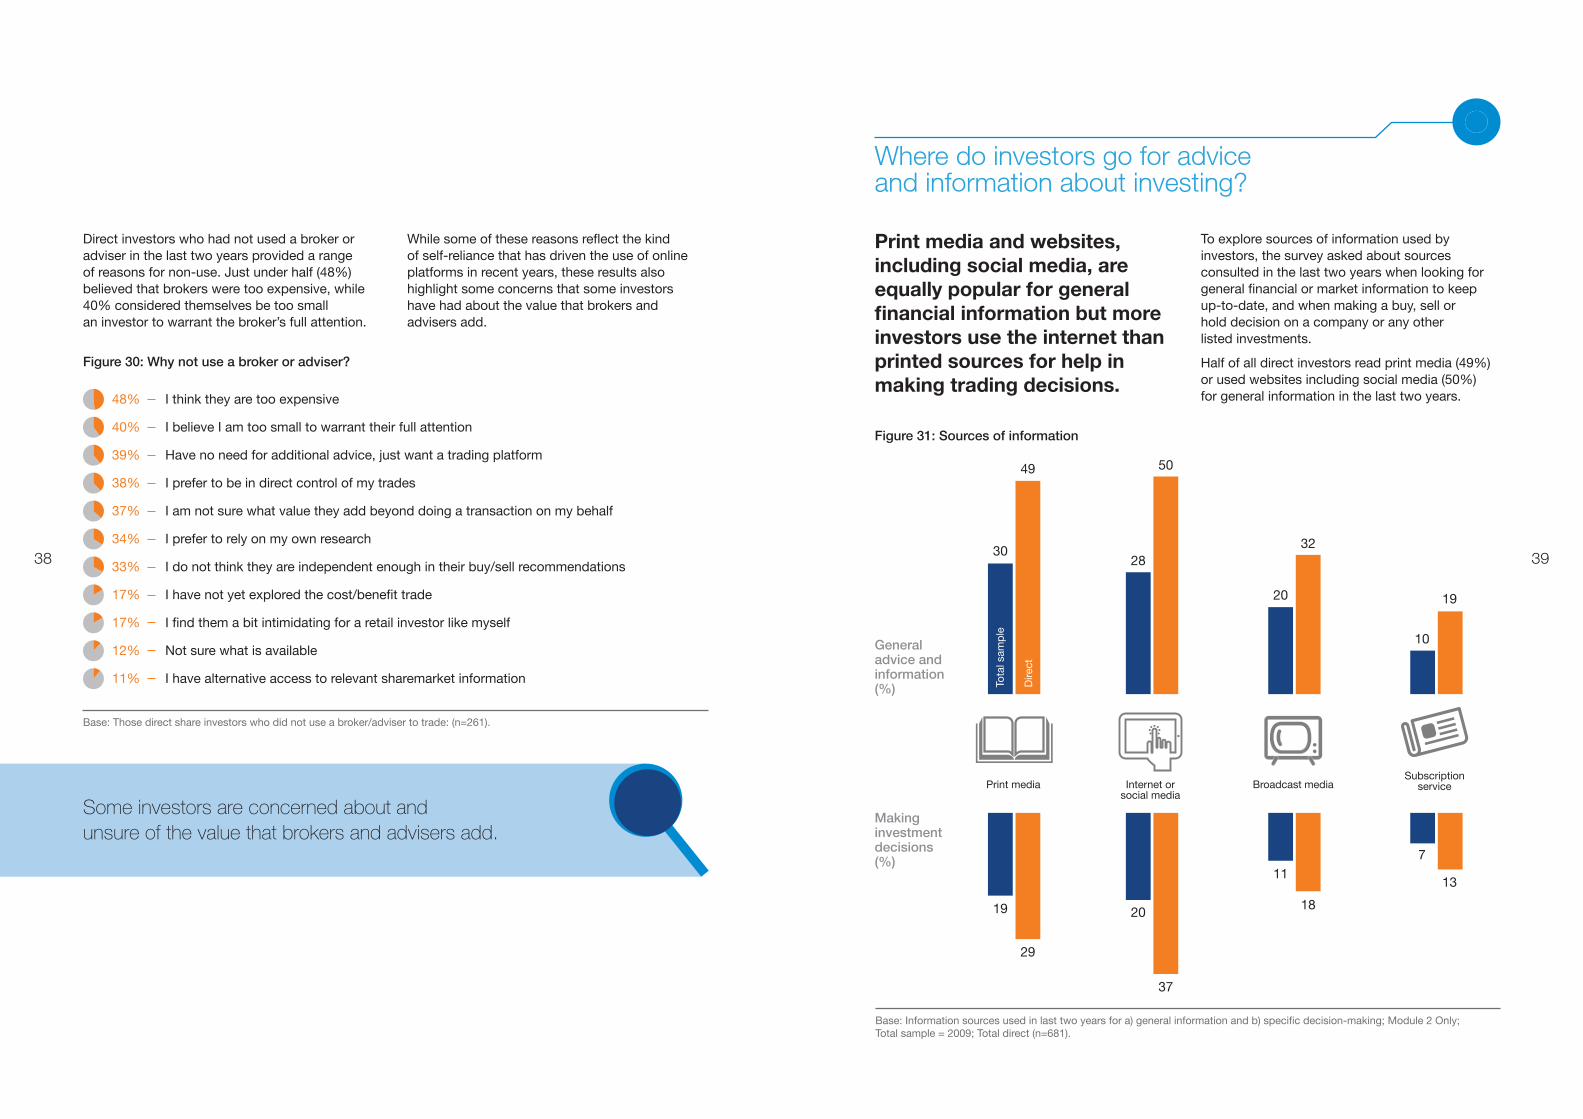
Print media and websites, including social media, are equally popular for general financial information but more investors use the internet than printed sources for help in making trading decisions.
Base: Information sources used in last two years for a) general information and b) specific decision-making; Module 2 Only; Total sample = 2009; Total direct (n=681).
Figure 31: Sources of information
To explore sources of information used by investors, the survey asked about sources consulted in the last two years when looking for general financial or market information to keep up-to-date, and when making a buy, sell or hold decision on a company or any other listed investments.
Half of all direct investors read print media (49%) or used websites including social media (50%) for general information in the last two years.
19 20
29
37
11
18
7
13
General advice and information (%)
Making investment decisions (%)
Print media Internet or social media
Broadcast media Subscription
service
30
49
20
32
10
19
28
50
Tota
l sam
ple
Dire
ct
Figure 30: Why not use a broker or adviser?
48%
40%
39%
38%
37%
34%
33%
17%
17%
12%
11%
I think they are too expensive
I believe I am too small to warrant their full attention
Have no need for additional advice, just want a trading platform
I prefer to be in direct control of my trades
I am not sure what value they add beyond doing a transaction on my behalf
I prefer to rely on my own research
I do not think they are independent enough in their buy/sell recommendations
I have not yet explored the cost/benefit trade
I find them a bit intimidating for a retail investor like myself
Not sure what is available
I have alternative access to relevant sharemarket information
Base: Those direct share investors who did not use a broker/adviser to trade: (n=261).
Direct investors who had not used a broker or adviser in the last two years provided a range of reasons for non-use. Just under half (48%) believed that brokers were too expensive, while 40% considered themselves be too small an investor to warrant the broker’s full attention.
While some of these reasons reflect the kind of self-reliance that has driven the use of online platforms in recent years, these results also highlight some concerns that some investors have had about the value that brokers and advisers add.
Some investors are concerned about and unsure of the value that brokers and advisers add.
4140
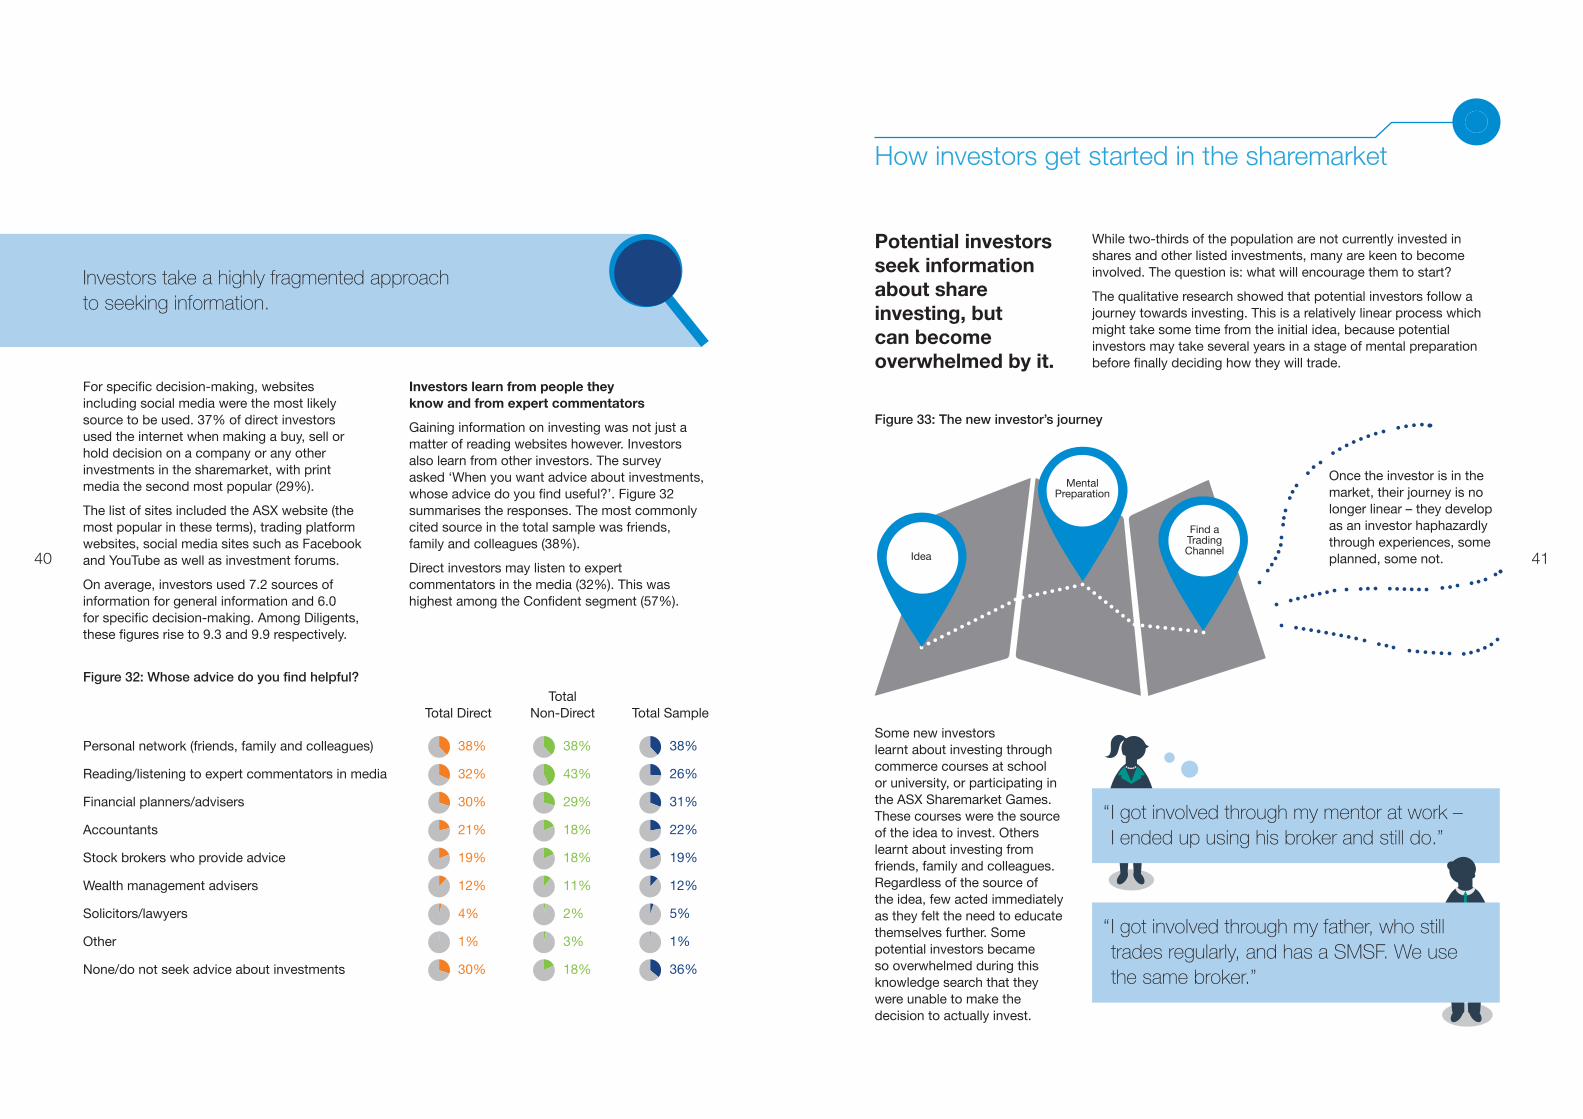
For specific decision-making, websites including social media were the most likely source to be used. 37% of direct investors used the internet when making a buy, sell or hold decision on a company or any other investments in the sharemarket, with print media the second most popular (29%).
The list of sites included the ASX website (the most popular in these terms), trading platform websites, social media sites such as Facebook and YouTube as well as investment forums.
On average, investors used 7.2 sources of information for general information and 6.0 for specific decision-making. Among Diligents, these figures rise to 9.3 and 9.9 respectively.
Investors learn from people they know and from expert commentators
Gaining information on investing was not just a matter of reading websites however. Investors also learn from other investors. The survey asked ‘When you want advice about investments, whose advice do you find useful?’. Figure 32 summarises the responses. The most commonly cited source in the total sample was friends, family and colleagues (38%).
Direct investors may listen to expert commentators in the media (32%). This was highest among the Confident segment (57%).
Investors take a highly fragmented approach to seeking information.
Figure 32: Whose advice do you find helpful?
Personal network (friends, family and colleagues)
Reading/listening to expert commentators in media
Financial planners/advisers
Accountants
Stock brokers who provide advice
Wealth management advisers
Solicitors/lawyers
Other
None/do not seek advice about investments
Total Direct
38%
32%
30%
21%
19%
12%
4%
1%
30%
Total Non-Direct
38%
43%
29%
18%
18%
11%
2%
3%
18%
Total Sample
38%
26%
31%
22%
19%
12%
5%
1%
36%
How investors get started in the sharemarket
Potential investors seek information about share investing, but can become overwhelmed by it.
Once the investor is in the market, their journey is no longer linear – they develop as an investor haphazardly through experiences, some planned, some not.
Mental Preparation
Find a Trading Channel
Figure 33: The new investor’s journey
Some new investors learnt about investing through commerce courses at school or university, or participating in the ASX Sharemarket Games. These courses were the source of the idea to invest. Others learnt about investing from friends, family and colleagues. Regardless of the source of the idea, few acted immediately as they felt the need to educate themselves further. Some potential investors became so overwhelmed during this knowledge search that they were unable to make the decision to actually invest.
While two-thirds of the population are not currently invested in shares and other listed investments, many are keen to become involved. The question is: what will encourage them to start?
The qualitative research showed that potential investors follow a journey towards investing. This is a relatively linear process which might take some time from the initial idea, because potential investors may take several years in a stage of mental preparation before finally deciding how they will trade.
Idea
“ I got involved through my mentor at work – I ended up using his broker and still do.”
“ I got involved through my father, who still trades regularly, and has a SMSF. We use the same broker.”
4342
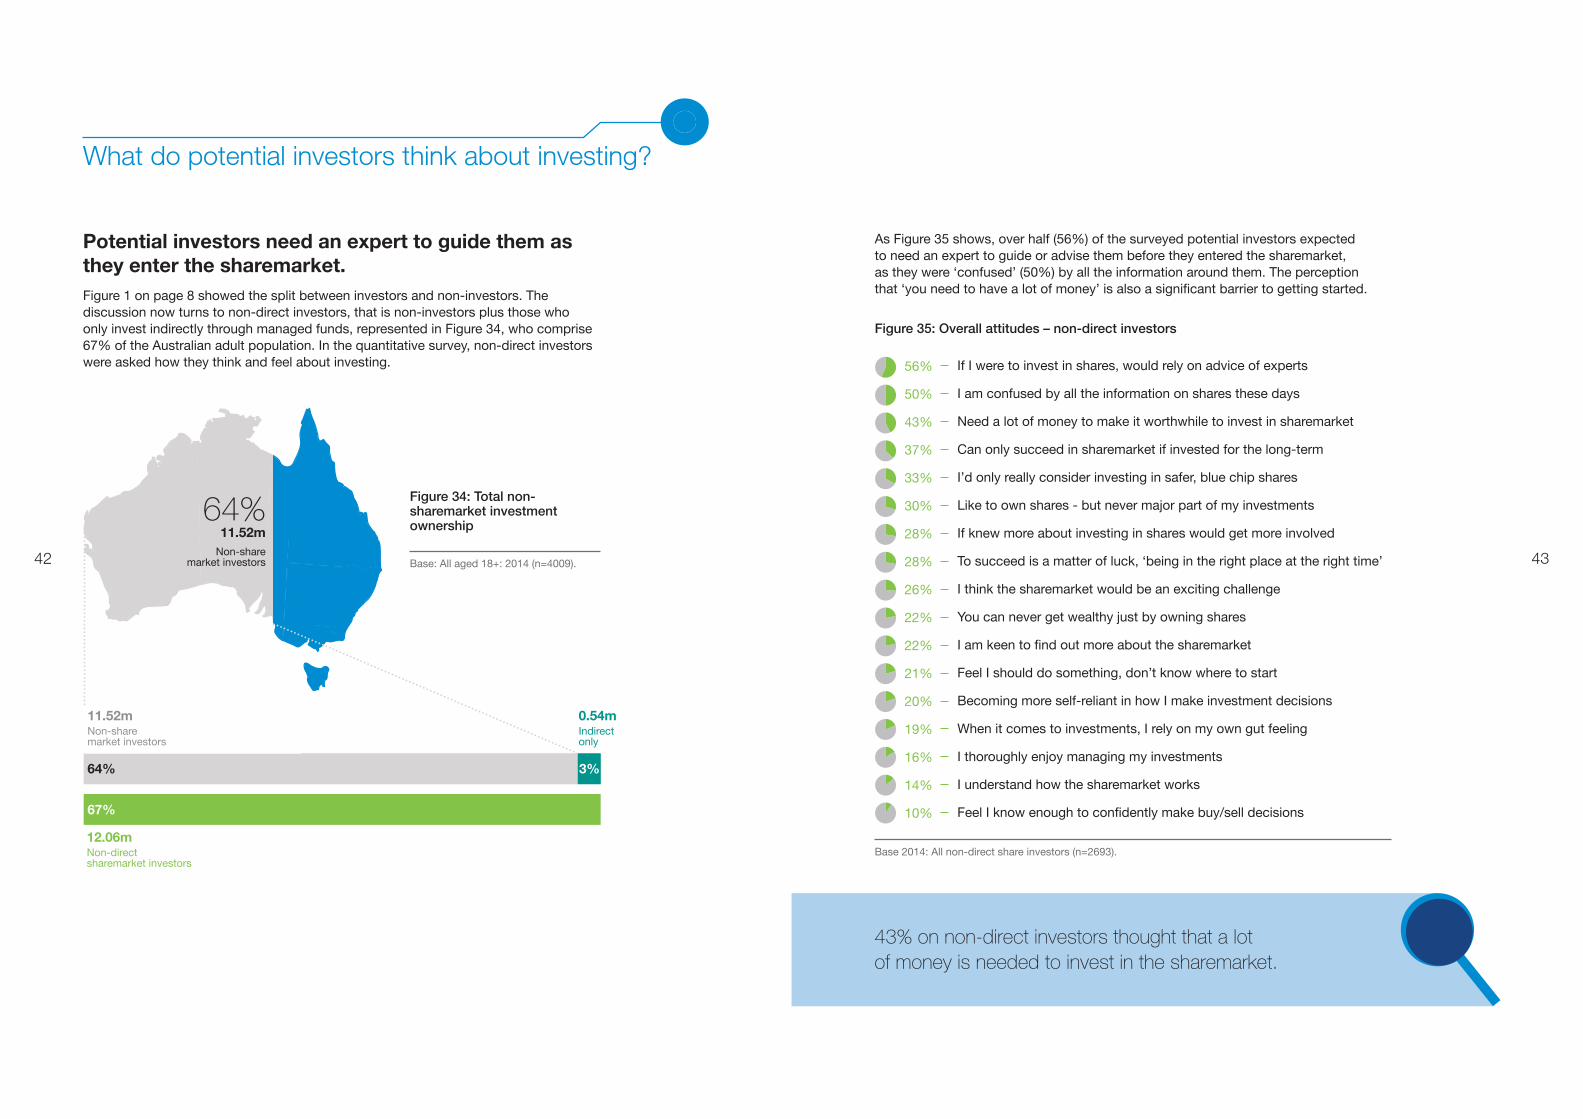
What do potential investors think about investing?
Potential investors need an expert to guide them as they enter the sharemarket.Figure 1 on page 8 showed the split between investors and non-investors. The discussion now turns to non-direct investors, that is non-investors plus those who only invest indirectly through managed funds, represented in Figure 34, who comprise 67% of the Australian adult population. In the quantitative survey, non-direct investors were asked how they think and feel about investing.
As Figure 35 shows, over half (56%) of the surveyed potential investors expected to need an expert to guide or advise them before they entered the sharemarket, as they were ‘confused’ (50%) by all the information around them. The perception that ‘you need to have a lot of money’ is also a significant barrier to getting started.
Figure 35: Overall attitudes – non-direct investors
If I were to invest in shares, would rely on advice of experts
I am confused by all the information on shares these days
Need a lot of money to make it worthwhile to invest in sharemarket
Can only succeed in sharemarket if invested for the long-term
I’d only really consider investing in safer, blue chip shares
Like to own shares - but never major part of my investments
If knew more about investing in shares would get more involved
To succeed is a matter of luck, ‘being in the right place at the right time’
I think the sharemarket would be an exciting challenge
You can never get wealthy just by owning shares
I am keen to find out more about the sharemarket
Feel I should do something, don’t know where to start
Becoming more self-reliant in how I make investment decisions
When it comes to investments, I rely on my own gut feeling
I thoroughly enjoy managing my investments
I understand how the sharemarket works
Feel I know enough to confidently make buy/sell decisions
Base 2014: All non-direct share investors (n=2693).
43% on non-direct investors thought that a lot of money is needed to invest in the sharemarket.
Base: All aged 18+: 2014 (n=4009).
Figure 34: Total non-sharemarket investment ownership
64%11.52m
Non-share market investors
64%
12.06m Non-direct sharemarket investors
67%
3%
11.52m Non-share market investors
0.54m Indirect only
44 45
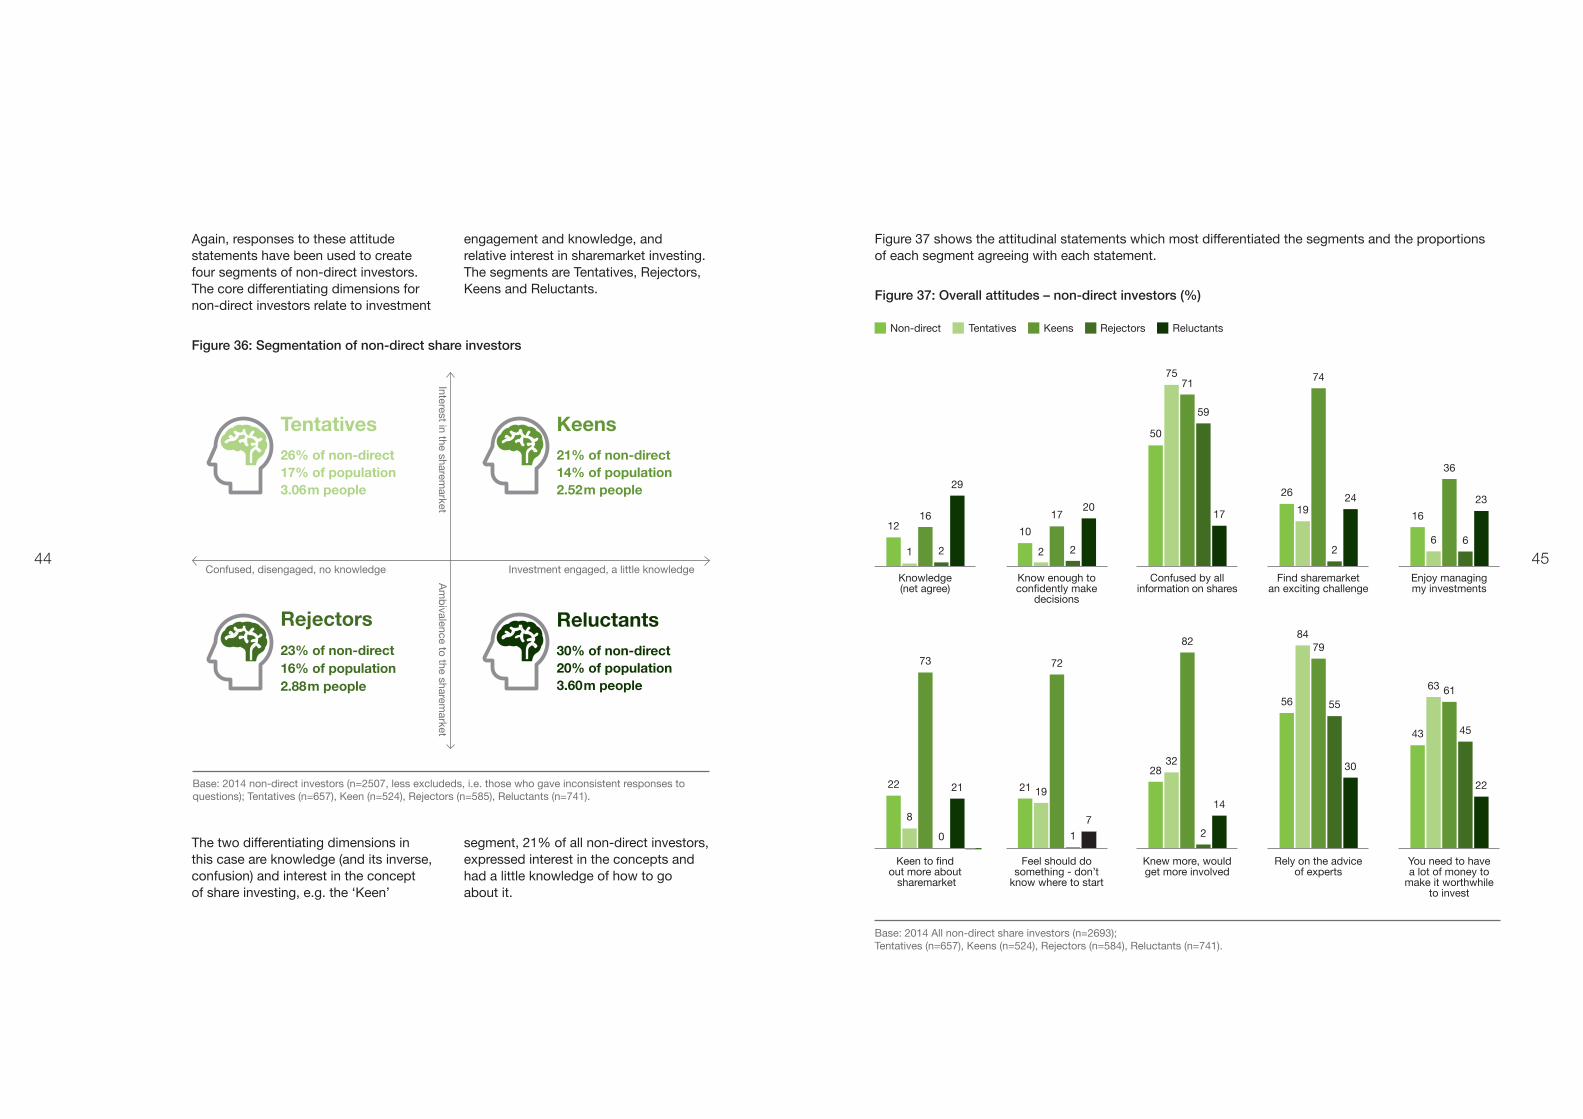
The two differentiating dimensions in this case are knowledge (and its inverse, confusion) and interest in the concept of share investing, e.g. the ‘Keen’
segment, 21% of all non-direct investors, expressed interest in the concepts and had a little knowledge of how to go about it.
Tentatives26% of non-direct 17% of population 3.06m people
Reluctants30% of non-direct 20% of population 3.60m people
Keens21% of non-direct 14% of population 2.52m people
Rejectors23% of non-direct 16% of population 2.88m people
Figure 36: Segmentation of non-direct share investors
Again, responses to these attitude statements have been used to create four segments of non-direct investors. The core differentiating dimensions for non-direct investors relate to investment
engagement and knowledge, and relative interest in sharemarket investing. The segments are Tentatives, Rejectors, Keens and Reluctants.
Base: 2014 non-direct investors (n=2507, less excludeds, i.e. those who gave inconsistent responses to questions); Tentatives (n=657), Keen (n=524), Rejectors (n=585), Reluctants (n=741).
Confused, disengaged, no knowledge Investment engaged, a little knowledge
Am
bivalence to the sharem
arketInterest in the sharem
arket
Figure 37: Overall attitudes – non-direct investors (%)
Figure 37 shows the attitudinal statements which most differentiated the segments and the proportions of each segment agreeing with each statement.
Base: 2014 All non-direct share investors (n=2693); Tentatives (n=657), Keens (n=524), Rejectors (n=584), Reluctants (n=741).
26
16
50
1012
19
6
75
21
24 2317
20
29
74
36
71
1716
26
59
22
Knowledge (net agree)
Know enough to confidently make
decisions
Confused by all information on shares
Find sharemarket an exciting challenge
Enjoy managing my investments
22
30
14
7
21
43
56
28
2122
63
84
32
19
8
61
7982
7273
45
55
210
Keen to find out more about sharemarket
Feel should do something - don’t
know where to start
Knew more, would get more involved
Rely on the advice of experts
You need to have a lot of money to
make it worthwhile to invest
Non-direct Tentatives Keens Rejectors Reluctants
46 47
The highest level of agreement was to statements about confusion, reliance on expert advice and the perception that a lot of money is needed to be in the market. This speaks to the role that brokers and advisers can play in educating investors, getting them started and partnering with them on their journey. It is also worth noting that one traditional entry path for new investors, managed funds, is less visible than in previous years and has potential to be revitalised as an introduction to investing.
The attitudes of the Keen segment (21% or 2.52 million people) demonstrate the opportunity that exists to bring new investors to the market, given the right support. They expressed an eagerness to learn and wanted to be involved in the market but they also acknowledged that they needed support and valued the role of advice. Demographically Keens were young, with 55% under the age of 35, and 50% were female. In general, younger non-investors prefered to consult people they know, as well as expert advisers. They seemed to want mentoring.
The attitudes of the Keen segment, comprising 2.52 million people, demonstrate the opportunity that exists to bring new investors to the market, given the right support.
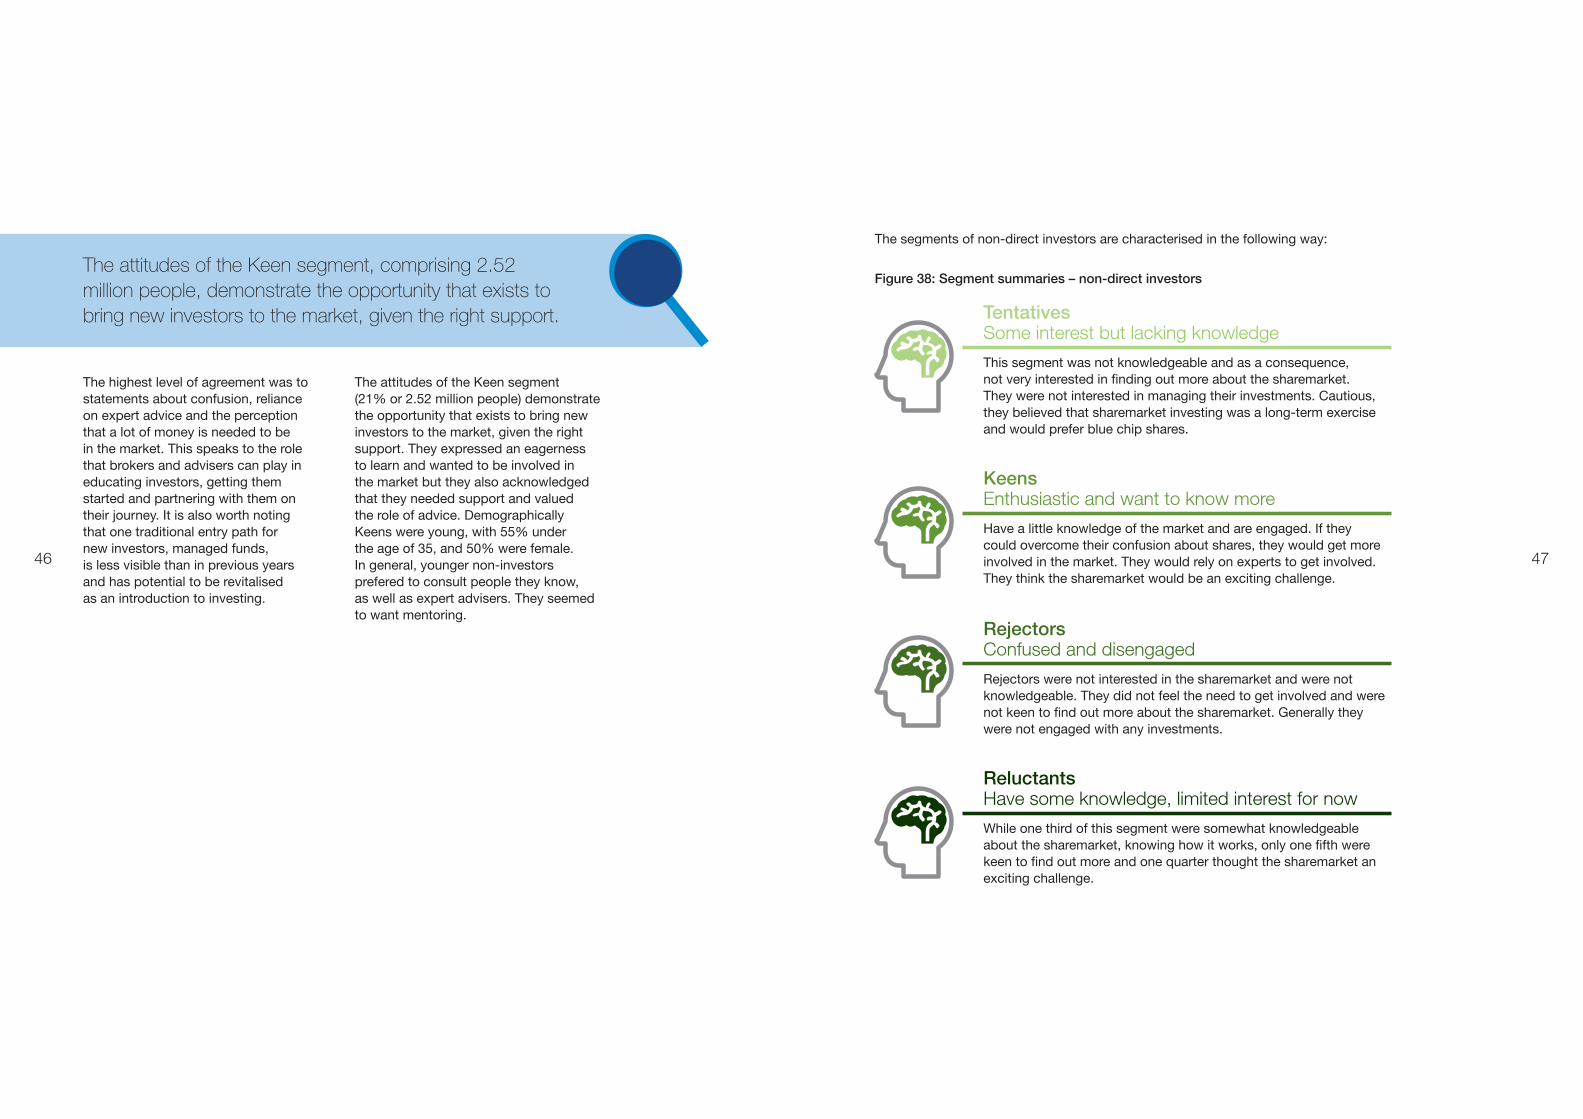
Figure 38: Segment summaries – non-direct investors
Tentatives
Some interest but lacking knowledge
This segment was not knowledgeable and as a consequence, not very interested in finding out more about the sharemarket. They were not interested in managing their investments. Cautious, they believed that sharemarket investing was a long-term exercise and would prefer blue chip shares.
Rejectors Confused and disengaged
Rejectors were not interested in the sharemarket and were not knowledgeable. They did not feel the need to get involved and were not keen to find out more about the sharemarket. Generally they were not engaged with any investments.
Keens Enthusiastic and want to know more
Have a little knowledge of the market and are engaged. If they could overcome their confusion about shares, they would get more involved in the market. They would rely on experts to get involved. They think the sharemarket would be an exciting challenge.
Reluctants
Have some knowledge, limited interest for now
While one third of this segment were somewhat knowledgeable about the sharemarket, knowing how it works, only one fifth were keen to find out more and one quarter thought the sharemarket an exciting challenge.
The segments of non-direct investors are characterised in the following way:
4948
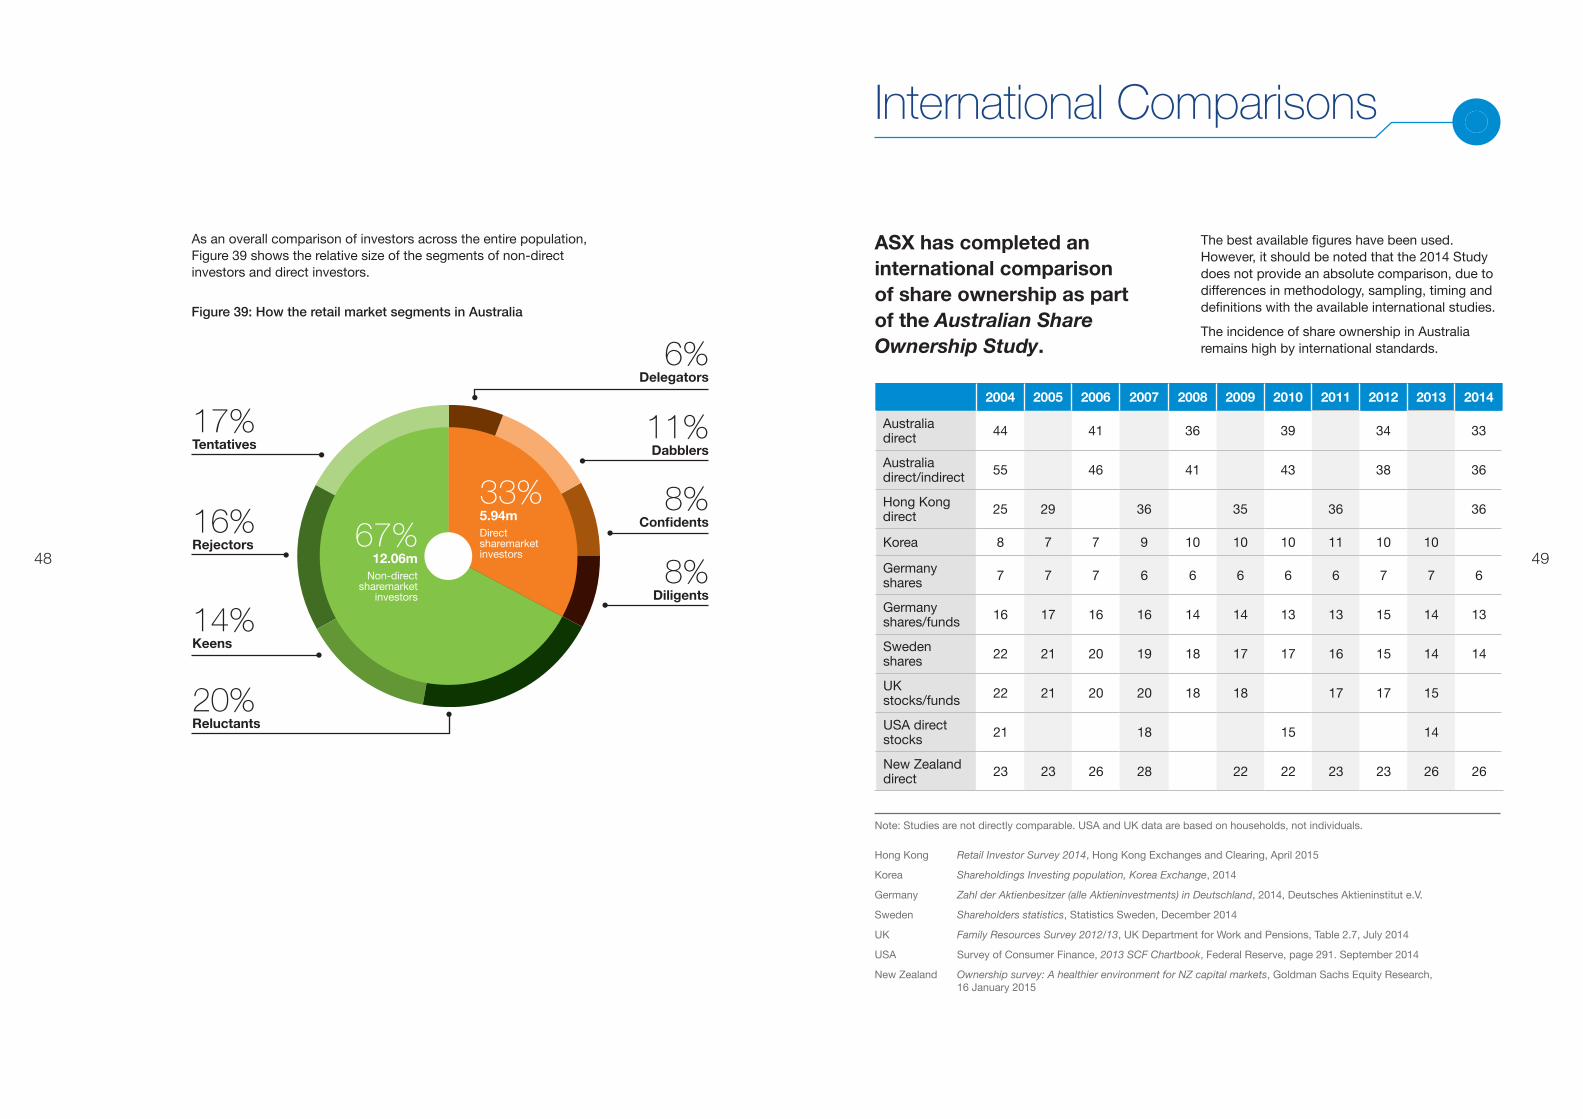
As an overall comparison of investors across the entire population, Figure 39 shows the relative size of the segments of non-direct investors and direct investors.
Figure 39: How the retail market segments in Australia
6%Delegators
17%Tentatives
16%Rejectors
14%Keens
20%Reluctants
11%Dabblers
8%Confidents
8%Diligents
67%12.06m
Non-direct sharemarket
investors
33%5.94m Direct sharemarket investors
2004 2005 2006 2007 2008 2009 2010 2011 2012 2013 2014
Australia direct 44 41 36 39 34 33
Australia direct/indirect 55 46 41 43 38 36
Hong Kong direct 25 29 36 35 36 36
Korea 8 7 7 9 10 10 10 11 10 10
Germany shares 7 7 7 6 6 6 6 6 7 7 6
Germany shares/funds 16 17 16 16 14 14 13 13 15 14 13
Sweden shares 22 21 20 19 18 17 17 16 15 14 14
UK stocks/funds 22 21 20 20 18 18 17 17 15
USA direct stocks 21 18 15 14
New Zealand direct 23 23 26 28 22 22 23 23 26 26
International Comparisons
ASX has completed an international comparison of share ownership as part of the Australian Share Ownership Study.
The best available figures have been used. However, it should be noted that the 2014 Study does not provide an absolute comparison, due to differences in methodology, sampling, timing and definitions with the available international studies.
The incidence of share ownership in Australia remains high by international standards.
Note: Studies are not directly comparable. USA and UK data are based on households, not individuals.
Hong Kong Retail Investor Survey 2014, Hong Kong Exchanges and Clearing, April 2015
Korea Shareholdings Investing population, Korea Exchange, 2014
Germany Zahl der Aktienbesitzer (alle Aktieninvestments) in Deutschland, 2014, Deutsches Aktieninstitut e.V.
Sweden Shareholders statistics, Statistics Sweden, December 2014
UK Family Resources Survey 2012/13, UK Department for Work and Pensions, Table 2.7, July 2014
USA Survey of Consumer Finance, 2013 SCF Chartbook, Federal Reserve, page 291. September 2014
New Zealand Ownership survey: A healthier environment for NZ capital markets, Goldman Sachs Equity Research, 16 January 2015
50 51
BackgroundThe Australian Share Ownership Study has become a benchmark for profiling share owners in Australia. ASX undertook its first share ownership study of the Australian population in 1986. The Study continues to provide valuable information to a variety of stakeholders and to ASX.
The overall aims of the 2014 Study were to:
• Track the incidence of share ownership among the Australian population and the factors driving this;
• Profile share owners and non-share owners demographically, attitudinally and behaviourally; and
• Update/revisit the current share investor segments.
This Study was made possible with the funding of the Financial Industry Development Account of the National Guarantee Fund.
About this Study
ApproachASX commenced the 2014 Study with a qualitative research phase to ensure it was aware of the main implications of current economic, environmental and market changes, and emerging issues for share owner behaviour prior to finalising the questionnaire for the quantitative phase. The qualitative research process was used to validate the wording, language and attitudinal dimensions used in the Study.
Key issues explored in the qualitative phase included:
• Market dynamics – are they changing?
• Key drivers of market behaviour;
• Share investment journeys, triggers and barriers to entry; and
• The nature of advice in sharemarket investing and share broker relationships and experiences.
The qualitative phase resulted in some fine-tuning of the Study to ensure it would measure the mindset of the 2014 Australian population appropriately.
Assisting ASX with the qualitative research study was Creative Catalyst Insights (CCI), which has worked with ASX on previous Australian Share Ownership Studies.
ASX commissioned Creative Catalyst Insights and Q&A Market Research (fieldwork specialist) to conduct the quantitative study. In the 2014 Study, the data collection methodology was migrated from a CATI (computer assisted telephone interviewing) survey to an online survey methodology. This change was precipitated by a combination of declining landline usage, long surveys being untenable on mobiles, and an online format suiting current lifestyles. The online methodology makes reaching a sizeable, robust sample more cost-effective and facilitates a split sample modular approach to the questionnaire, making questionnaire length reasonable for participants.
To ensure that a representative online sample was achieved, the 2014 Study included a short CATI Control survey on key incidence measures (comparable to 2012 and previous surveys). The demographic outcome of the CATI sample was used to post-weight the online sample to make it as representative as a CATI sample, had that methodology been retained. To manage questionnaire length, a split sample modular approach was used in the online survey:
Answering questions online and answering them over the phone are different experiences. For this reason, in this report comparisons against previous years has been restricted only to the data where confidence in comparability was justified.
As this Study was based on a sample of people and not the entire population (i.e. census) the data was weighted to reflect the known Australian adult population by gender, age and state as per the latest Australian Bureau of Statistics information.
Being derived from a sample, and consistent with all sample-based research, the data is also subject to sampling error. Any analysis of this Study should therefore take into account the likely variability of findings using the table overleaf.
CATI Control survey (n=2,400)
27 October – 17 November 2014
Online survey (n=4,009)
4 – 25 November 2014
Standard measures (incidence, attitudinal segmentation and demographic measures) (n=4,009)
Module 1 (n=2,000) Module 2 (n=2,009)
50 51
5352
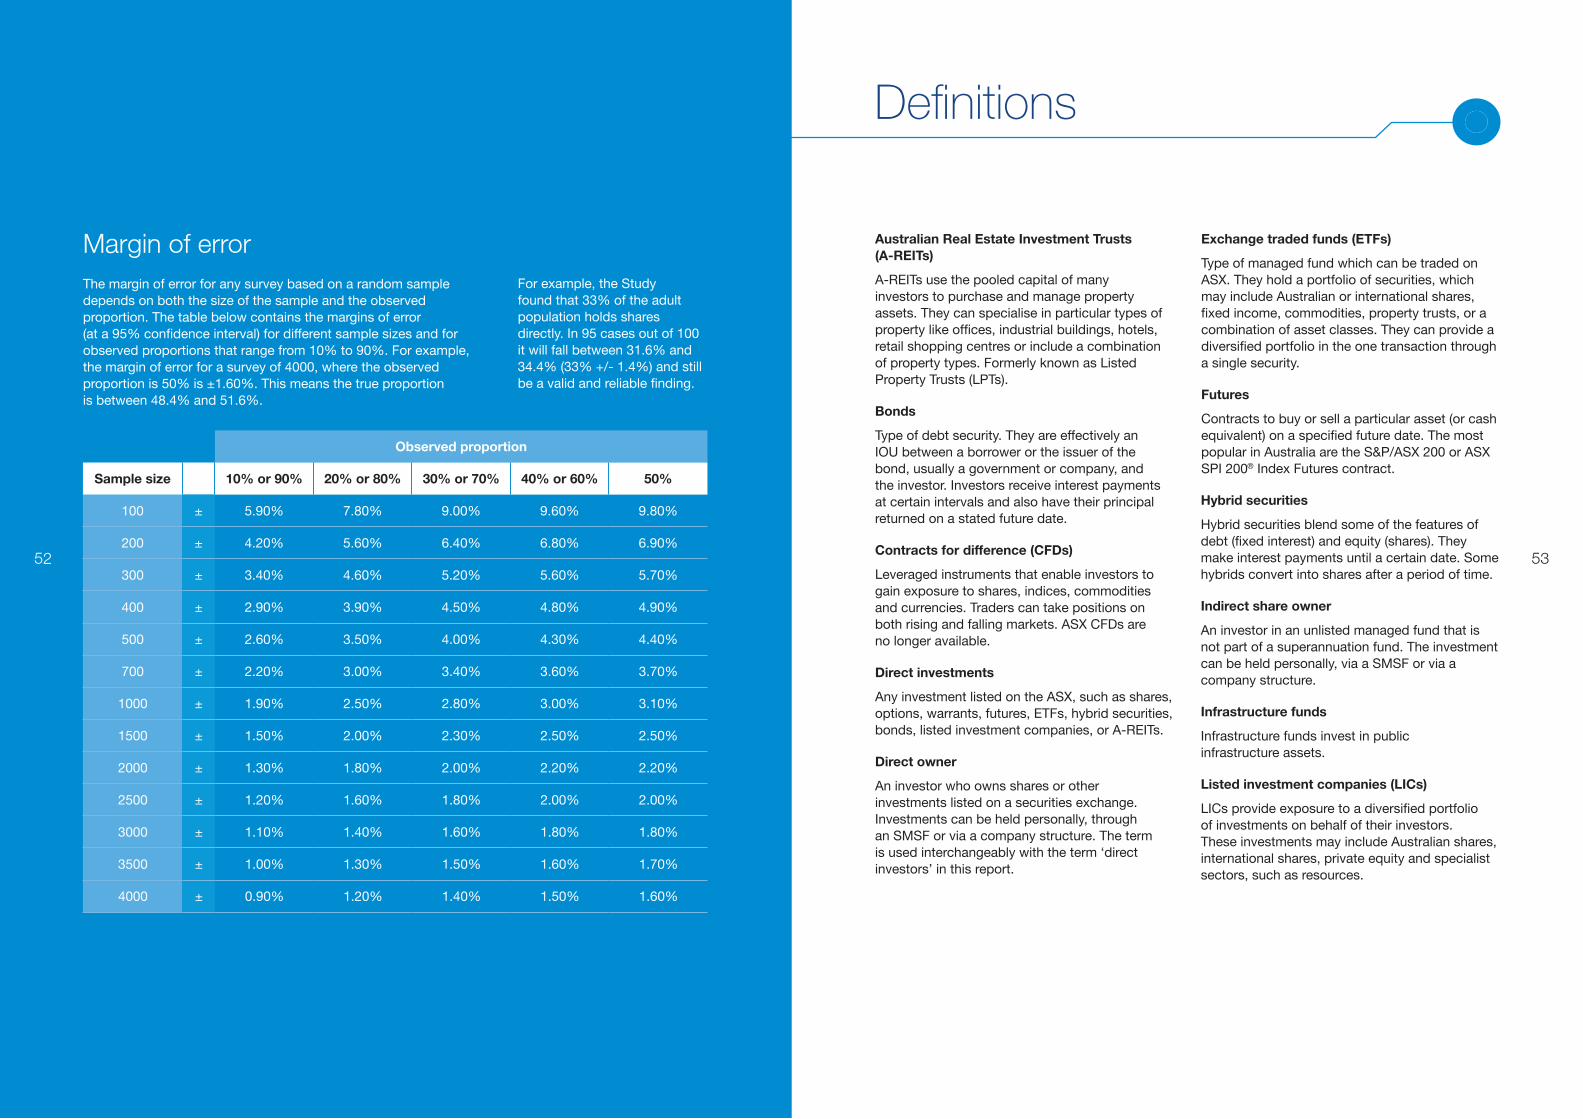
Margin of errorThe margin of error for any survey based on a random sample depends on both the size of the sample and the observed proportion. The table below contains the margins of error (at a 95% confidence interval) for different sample sizes and for observed proportions that range from 10% to 90%. For example, the margin of error for a survey of 4000, where the observed proportion is 50% is ±1.60%. This means the true proportion is between 48.4% and 51.6%.
For example, the Study found that 33% of the adult population holds shares directly. In 95 cases out of 100 it will fall between 31.6% and 34.4% (33% +/- 1.4%) and still be a valid and reliable finding.
Observed proportion
Sample size 10% or 90% 20% or 80% 30% or 70% 40% or 60% 50%
100 ± 5.90% 7.80% 9.00% 9.60% 9.80%
200 ± 4.20% 5.60% 6.40% 6.80% 6.90%
300 ± 3.40% 4.60% 5.20% 5.60% 5.70%
400 ± 2.90% 3.90% 4.50% 4.80% 4.90%
500 ± 2.60% 3.50% 4.00% 4.30% 4.40%
700 ± 2.20% 3.00% 3.40% 3.60% 3.70%
1000 ± 1.90% 2.50% 2.80% 3.00% 3.10%
1500 ± 1.50% 2.00% 2.30% 2.50% 2.50%
2000 ± 1.30% 1.80% 2.00% 2.20% 2.20%
2500 ± 1.20% 1.60% 1.80% 2.00% 2.00%
3000 ± 1.10% 1.40% 1.60% 1.80% 1.80%
3500 ± 1.00% 1.30% 1.50% 1.60% 1.70%
4000 ± 0.90% 1.20% 1.40% 1.50% 1.60%
Australian Real Estate Investment Trusts (A-REITs)
A-REITs use the pooled capital of many investors to purchase and manage property assets. They can specialise in particular types of property like offices, industrial buildings, hotels, retail shopping centres or include a combination of property types. Formerly known as Listed Property Trusts (LPTs).
Bonds
Type of debt security. They are effectively an IOU between a borrower or the issuer of the bond, usually a government or company, and the investor. Investors receive interest payments at certain intervals and also have their principal returned on a stated future date.
Contracts for difference (CFDs)
Leveraged instruments that enable investors to gain exposure to shares, indices, commodities and currencies. Traders can take positions on both rising and falling markets. ASX CFDs are no longer available.
Direct investments
Any investment listed on the ASX, such as shares, options, warrants, futures, ETFs, hybrid securities, bonds, listed investment companies, or A-REITs.
Direct owner
An investor who owns shares or other investments listed on a securities exchange. Investments can be held personally, through an SMSF or via a company structure. The term is used interchangeably with the term ‘direct investors’ in this report.
Exchange traded funds (ETFs)
Type of managed fund which can be traded on ASX. They hold a portfolio of securities, which may include Australian or international shares, fixed income, commodities, property trusts, or a combination of asset classes. They can provide a diversified portfolio in the one transaction through a single security.
Futures
Contracts to buy or sell a particular asset (or cash equivalent) on a specified future date. The most popular in Australia are the S&P/ASX 200 or ASX SPI 200® Index Futures contract.
Hybrid securities
Hybrid securities blend some of the features of debt (fixed interest) and equity (shares). They make interest payments until a certain date. Some hybrids convert into shares after a period of time.
Indirect share owner
An investor in an unlisted managed fund that is not part of a superannuation fund. The investment can be held personally, via a SMSF or via a company structure.
Infrastructure funds
Infrastructure funds invest in public infrastructure assets.
Listed investment companies (LICs)
LICs provide exposure to a diversified portfolio of investments on behalf of their investors. These investments may include Australian shares, international shares, private equity and specialist sectors, such as resources.
Definitions
52

54 55
For further information on ASX products and services, including online education, please visit http://www.asx.com.au
Options
Contracts between two parties, giving the buyer the right – but not an obligation – to buy or sell an underlying security at a predetermined price at a particular time in the future.
Total sharemarket ownership
The sum of adult Australians who own shares directly and/or indirectly.
Warrants
Instalment warrants let you buy an investment over a period of time. You make a part payment on the shares and pay the balance in one or more payments over time. You get all the benefits of owning the shares from day one, such as receiving full dividends. Used for investing.
Ordinary warrants are issued by a bank or other financial institution and are traded on ASX. They are similar to an option. They give you the right to buy an asset such as a share at a set price until a date in the future. Used for speculation.
56
Exchange Centre, 20 Bridge Street, Sydney 2000 • Telephone: 131279 • www.asx.com.au