Embed Size (px)
Citation preview
Country ReportAsia Pacific – January 2017
Contents
2
STAR Political Risk Rating 3
Asia Pacific main economies
China 4
India 7
Indonesia 10
Japan 13
Malaysia 15
The Philippines 17
Singapore 19
South Korea 21
Taiwan 23
Thailand 25
Vietnam 28
3
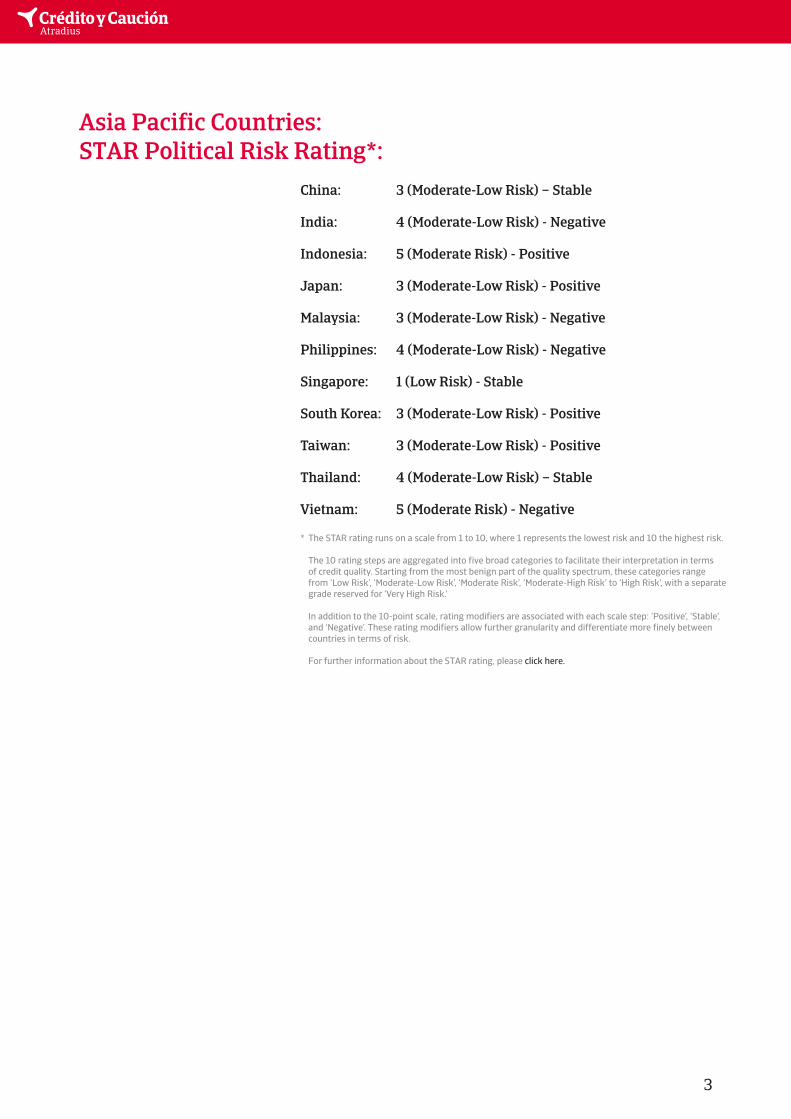
Asia Pacific Countries:STAR Political Risk Rating*:
China: 3 (Moderate-Low Risk) – Stable
India: 4 (Moderate-Low Risk) - Negative
Indonesia: 5 (Moderate Risk) - Positive
Japan: 3 (Moderate-Low Risk) - Positive
Malaysia: 3 (Moderate-Low Risk) - Negative
Philippines: 4 (Moderate-Low Risk) - Negative
Singapore: 1 (Low Risk) - Stable
South Korea: 3 (Moderate-Low Risk) - Positive
Taiwan: 3 (Moderate-Low Risk) - Positive
Thailand: 4 (Moderate-Low Risk) – Stable
Vietnam: 5 (Moderate Risk) - Negative
* The STAR rating runs on a scale from 1 to 10, where 1 represents the lowest risk and 10 the highest risk.
The 10 rating steps are aggregated into five broad categories to facilitate their interpretation in terms of credit quality. Starting from the most benign part of the quality spectrum, these categories range from ‘Low Risk’, ‘Moderate-Low Risk’, ‘Moderate Risk’, ‘Moderate-High Risk’ to ‘High Risk’, with a separate grade reserved for ‘Very High Risk.’
In addition to the 10-point scale, rating modifiers are associated with each scale step: ‘Positive’, ‘Stable’, and ‘Negative’. These rating modifiers allow further granularity and differentiate more finely between countries in terms of risk.
For further information about the STAR rating, please click here.
Good:The credit risk situation in the sector is benign / business performance in the sector is above its long-term trend.
Fair:The credit risk credit situation in the sector is average / business performance in the sector is stable.
Poor: The credit risk situation in the sector is relatively high / business performance in the sector is below long-term trend.
Bleak:The cedit risk situation in the sector is poor / business performance in the sector is weak compared to its long-term trend.
Excellent:The credit risk situation in the sector is strong / business performance in the sector is strong compared to its long-term trend.
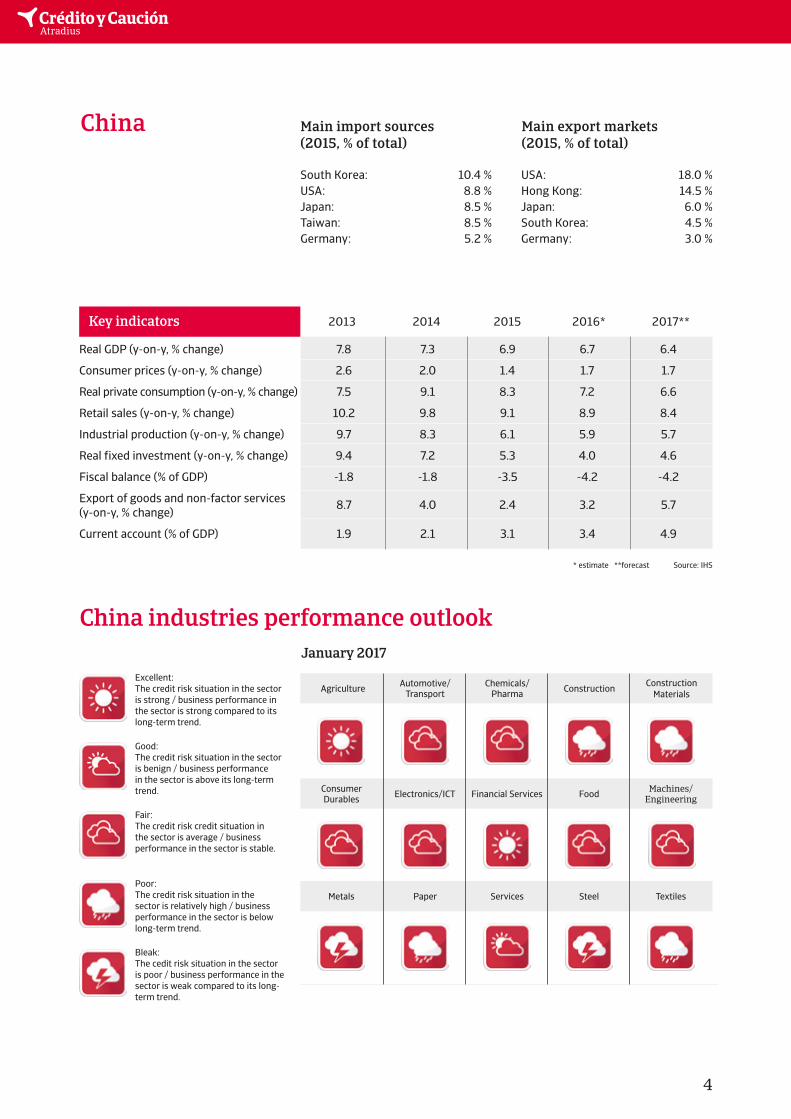
China Main import sources (2015, % of total)
Main export markets (2015, % of total)
Key indicators 2013 2014 2015 2016* 2017**
Real GDP (y-on-y, % change) 7.8 7.3 6.9 6.7 6.4
Consumer prices (y-on-y, % change) 2.6 2.0 1.4 1.7 1.7
Real private consumption (y-on-y, % change) 7.5 9.1 8.3 7.2 6.6
Retail sales (y-on-y, % change) 10.2 9.8 9.1 8.9 8.4
Industrial production (y-on-y, % change) 9.7 8.3 6.1 5.9 5.7
Real fixed investment (y-on-y, % change) 9.4 7.2 5.3 4.0 4.6
Fiscal balance (% of GDP) -1.8 -1.8 -3.5 -4.2 -4.2
Export of goods and non-factor services 8.7 4.0 2.4 3.2 5.7(y-on-y, % change)
Current account (% of GDP) 1.9 2.1 3.1 3.4 4.9
* estimate **forecast Source: IHS
4
China industries performance outlook
Agriculture
Electronics/ICT
Automotive/Transport
Financial Services
Chemicals/Pharma
Food
Construction
Machines/Engineering
ConstructionMaterials
ConsumerDurables
Paper Services Steel TextilesMetals
January 2017
South Korea: 10.4 % USA: 18.0 %USA: 8.8 % Hong Kong: 14.5 %Japan: 8.5 % Japan: 6.0 %Taiwan: 8.5 % South Korea: 4.5 % Germany: 5.2 % Germany: 3.0 %
5
President Xi is firmly in power
Overall, the domestic political situation in China is stable, with the ChineseCommunist Party (CCP) firmly in power. President Xi Jinping continues toconsolidate his power within the CCP and is seen as the most powerful Chinese leader since Deng Xiaoping. The government under Xi has launched a campaign against corruption and extravagance by top party officials, leading to the con-viction of several prominent party members. To prevent any major social unrest, the administration’s main aim is to preserve economic growth, create jobs and develop a public welfare safety net. So far, protests have flared up only locally and have been swiftly contained by the security forces.
Internationally Sino-US relations have been generally stable, but it cannot be ruled out that tensions increase due to potential shifts in the US China policy under the new Trump administration. Regionally, China´s grown assertiveness in the South China Sea conflict and the conflict over the Senkaku/Diaoyu islands with Japan will remain issues.
Political situationHead of state:President and General Secretary of the Chinese Communist Party (CCP) Xi Jinping (since March 2013)
Head of government:Prime Minister Li Keqiang (since March 2013)
Form of government:One-party system, ruled by the CCP
Population:1.38 billion
Insolvencies expected to increase further in 2017
The current economic slowdown has led to increasing overdue invoices and businesses requesting longer payment terms – a trend that is expected to continue in 2017.
Insolvencies are also expected to rise further after a substantial increase in 2016, as overcapacity and high indebtedness remain an issue in many sectors (especially construction, steel and metals, shipping, mining, paper). While listed and state-owned businesses still benefit from stronger support from banks and shareholders, more caution is recommended when dealing with small and medium-sized private businesses, as many of them - even those active in bet-ter-performing industries - often suffer from limited financing facilities.
Industries performance:
Economic situation
10
8
6
4
2
0
2013 2014 2015 2016e 2017f
7.8 7.3 6.9 6.7 6.4
Source: IHS
Real GDP growth (y-on-y, % change)
Growth expected to slow down further in 2017
China’s economic slowdown continued in 2016, although at a slower pace thanestimated at the beginning of last year, dampening international worries of a hard landing. In 2017 GDP growth is expected to slow down again, to about 6.4%, with private consumption and industrial production growth cooling down further.
Chinese authorities have repeatedly stressed the willingness to use monetary and fiscal means to maintain the targeted growth levels of 6%-6.5%. Chinese policy communication has improved and the probability of a disorderly depre-ciation of the renminbi has become lower. Thus a hard landing is increasingly unrealistic, at least in 2017, but the risk has not completely disappeared.
6
2013 2014 2015 2016e 2017fSource: IHS
Real fixed investment (y-on-y, % change)
10
8
6
4
2
0
9.4
7.2
4.05.3 4.6
2013 2014 2015 2016e 2017fSource: IHS
Real private consumption (y-on-y, % change)
10
8
6
4
2
0
7.5
9.1
7.28.3
6.6
The main reason for the slowing annual growth since 2013 is not so much thededicated economic rebalancing – away from export-oriented investments to more consumption-led growth – but decreasing productivity growth, with labour productivity decreasing sharply since 2010. The progress towards rebal-ancing has been limited so far: consumption as a share of GDP has increased slightly, but is still very low (at about 38% of GDP), while investment remains the primary driver of growth.
The perils of high debt
While a sharp economic slowdown has been avoided, it is worrying that investment- driven GDP growth is helped by strong credit expansion, of which much is used for developments in the real estate sector and infrastructure projects. In 2008, debt (government, business and individual combined) was about 150% of GDP, and it grew to more than 250% of GDP in 2016. Because credit expansion is much higher than the economy’s growth rate, capital cannot be used in an efficient way for investment or consumption, and the sharp debt increase has raised fears of a potential financial crisis. The financial vulnerabilities visible in the financial, corporate, and real estate sectors and in the local government are interconnected - a shock in one sector could lead to a chain reaction and impact others.
That said, Chinese authorities are aware of those risks and have taken some actions, e.g. measures to restrain house prices. Most troubled are state-owned enterprises (SOEs), which account for just 20% of industrial output, but absorb about half of all bank lending. There is a need to restructure highly indebted companies, especially in industries with overcapacity, like aluminum, cement, coal, construction, and steel. While the authorities have started to address the issue by moderating credit growth and starting to restructure the sectors worst off, a more comprehensive and centrally-led approach is needed.
The tools the authorities have at hand will most likely allow China to avoid a debt crisis and a hard landing. The central government has tight control over the economic and financial activity in the country. As the bulk of the credits is public debt and lenders are often state-owned, banks can be instructed to refinance debt. Public and external debt are very low and China has huge international reserves, so there is room for both monetary and fiscal stimulus if needed. There are capital controls in place to limit the risk of capital flight. This all creates a cushion for the economy in the event of any external or internal shocks.
Decline of productivity affects long-term growth prospects
China’s total factor productivity, which is a measure of an economy´s long-termdynamism, has continuously weakened in recent years, and it seems this trend will continue until annual GDP growth stabilises at a level of about 4%.
The key to raising productivity growth and to create room for deleveraging would be to implement more economic and social reforms, in order to proceed from low-grade industrial production to a modern center of innovation. Howev-er, for the time being it seems rather improbable that the Chinese government will give market forces a large-enough role to stimulate innovation. The number of large and unprofitable SOEs remains too high and their role too dominant in certain sectors (e.g. oil, mining, telecom, utilities and transport). Another stumbling block for productivity growth is financial restrictions imposed by the government, which lead to misallocations of capital. Still, too much investment goes to the real estate sector and SOEs, and too little to the services sector.
10
8
6
4
2
0
2013 2014 2015 2016e 2017f
9.78.3
6.1 5.9 5.7
Industrial production (y-on-y, % change)
Source: IHS
10
8
6
4
2
0
2013 2014 2015 2016e 2017f
8.7
4.0
2.4 3.2
5.7
Export of goods and non-factor services (y-on-y, % change)
Source: IHS
Good:The credit risk situation in the sector is benign / business performance in the sector is above its long-term trend.
Fair:The credit risk credit situation in the sector is average / business performance in the sector is stable.
Poor: The credit risk situation in the sector is relatively high / business performance in the sector is below long-term trend.
Bleak:The cedit risk situation in the sector is poor / business performance in the sector is weak compared to its long-term trend.
Excellent:The credit risk situation in the sector is strong / business performance in the sector is strong compared to its long-term trend.
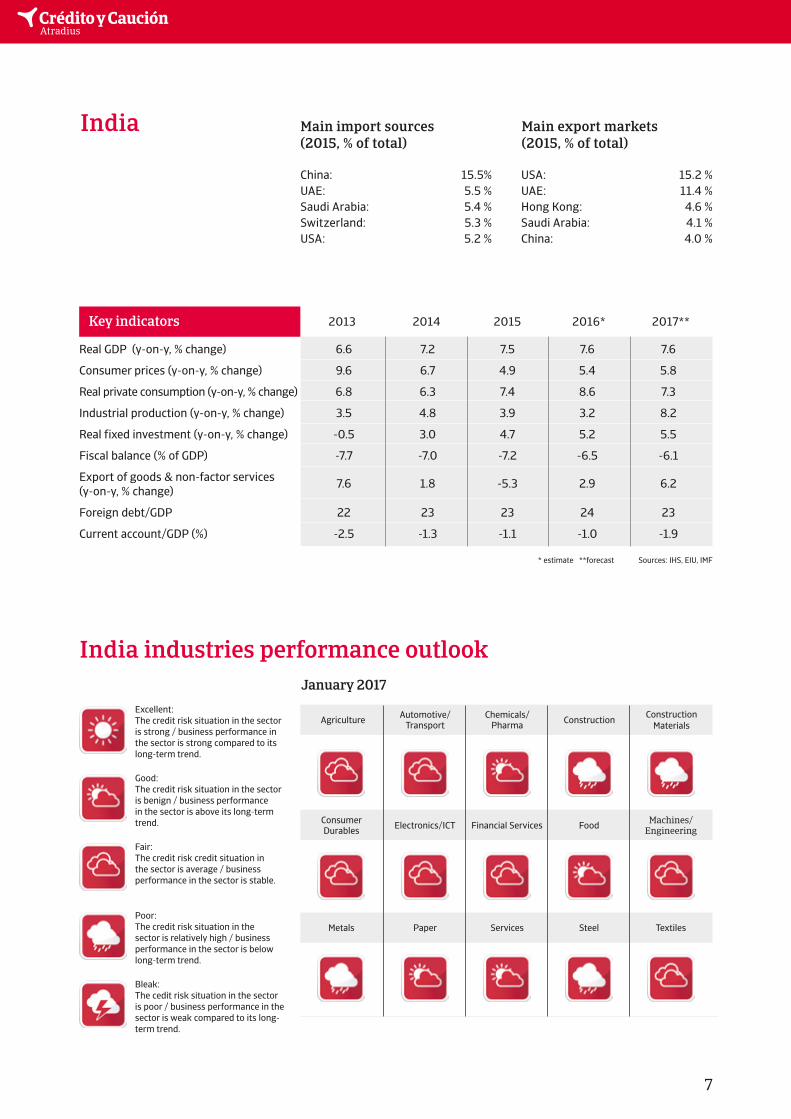
India Main import sources (2015, % of total)
Main export markets (2015, % of total)
Key indicators 2013 2014 2015 2016* 2017**
Real GDP (y-on-y, % change) 6.6 7.2 7.5 7.6 7.6
Consumer prices (y-on-y, % change) 9.6 6.7 4.9 5.4 5.8
Real private consumption (y-on-y, % change) 6.8 6.3 7.4 8.6 7.3
Industrial production (y-on-y, % change) 3.5 4.8 3.9 3.2 8.2
Real fixed investment (y-on-y, % change) -0.5 3.0 4.7 5.2 5.5
Fiscal balance (% of GDP) -7.7 -7.0 -7.2 -6.5 -6.1
Export of goods & non-factor services 7.6 1.8 -5.3 2.9 6.2(y-on-y, % change)
Foreign debt/GDP 22 23 23 24 23
Current account/GDP (%) -2.5 -1.3 -1.1 -1.0 -1.9
* estimate **forecast Sources: IHS, EIU, IMF
7
India industries performance outlook
Agriculture
Electronics/ICT
Automotive/Transport
Financial Services
Chemicals/Pharma
Food
Construction
Machines/Engineering
ConstructionMaterials
ConsumerDurables
Paper Services Steel TextilesMetals
January 2017
China: 15.5% USA: 15.2 %UAE: 5.5 % UAE: 11.4 % Saudi Arabia: 5.4 % Hong Kong: 4.6 %Switzerland: 5.3 % Saudi Arabia: 4.1 % USA: 5.2 % China: 4.0 %
8
A reform-minded government, but limited progress so far
In the 2014 general elections the BJP gained a landslide victory by winning an absolute majority in parliament (282 of the 543 seats in the Lower House); the first time since 1984 that any party has won a majority. The Modi legisla-ture has brought forward ambitious initiatives to promote urbanisation and improve connectivity and infrastructure, as well as finally unifying VAT across the country (a national goods-and-services tax would boost GDP substantially by removing barriers to trade between India’s many states and create a single market). Initiatives to improve foreign direct investment liberalisation, a modest reduction of the bureaucratic burden, merchandise output-enhancing initiatives and the activation of new power plants are likely to increase business confi-dence and stimulate investors’ appetite further.
However, the government still lacks a majority in the Upper House, where the opposition retains a strong position. As most of the major reform bills require approval from both chambers, reform progress in sensitive areas has been limited so far.
Political situation
Robust growth outlook in 2017
India´s 2017 economic outlook remains the most promising in Asia, with GDP forecast to increase around 7.5%. The economy benefits from a stable political climate, a reform-oriented government and low oil prices (India is a large net oil importer). Private consumption and government spending are the main drivers of economic growth. Lower inflation due to a tighter monetary policy has helped to increase consumer confidence, while the government is investing in power in-frastructure, one of the largest obstacles to India´s long-term economic growth potential.
After the budget deficit declined in 2016 and is expected to continue declining in 2017, the government´s budget discipline is not very strong. The deficit is expected not to decline much further in the coming years because of extensive government spending aimed at supporting state-owned enterprises, subsidy programmes, and infrastructure improvements, while revenues will stay sub-dued, despite the recent passing of a comprehensive reform of the Goods and Services (GST) tax system bill. However, the public deficit can be widely financed by domestic borrowing and its maturity is long, which mitigates the negative effects.
India´s external position is comfortable and the country and sovereign risks remain low. Foreign debt amounted to only 24% of GDP in 2016. The liquidity situation is comfortable with more than eight months of import cover, while the current account deficit is expected to remain modest in 2017, on the back of still low oil and commodity prices. India has an excellent payment record, with no missed payments since 1970, providing it good access to capital markets. This generates substantial short-term capital and portfolio inflows; enough to cover the current account deficit and to maintain external debt levels low, rendering debt resilient to exogenous shocks.
Economic situation
10
8
6
4
2
0
2013 2014 2015 2016e 2017fSource: IHS
6.6
7.2 7.5 7.6 7.6
Real GDP growth (y-on-y, % change)
Head of state:President Pranab Mukherjee (since July 2012)
Head of government:Prime Minister Narendra Modi (since May 2014)
Form of government:Centre-right coalition government of the National Democratic Alliance (NDA), led by the Bharatiya Janata Party (BJP).
Population:1.29 billion
10
8
6
4
2
02013 2014 2015 2016e 2017f
Source: IHS
9.6
6.7
4.9 5.4 5.8
Consumer prices (y-on-y, % change)
9
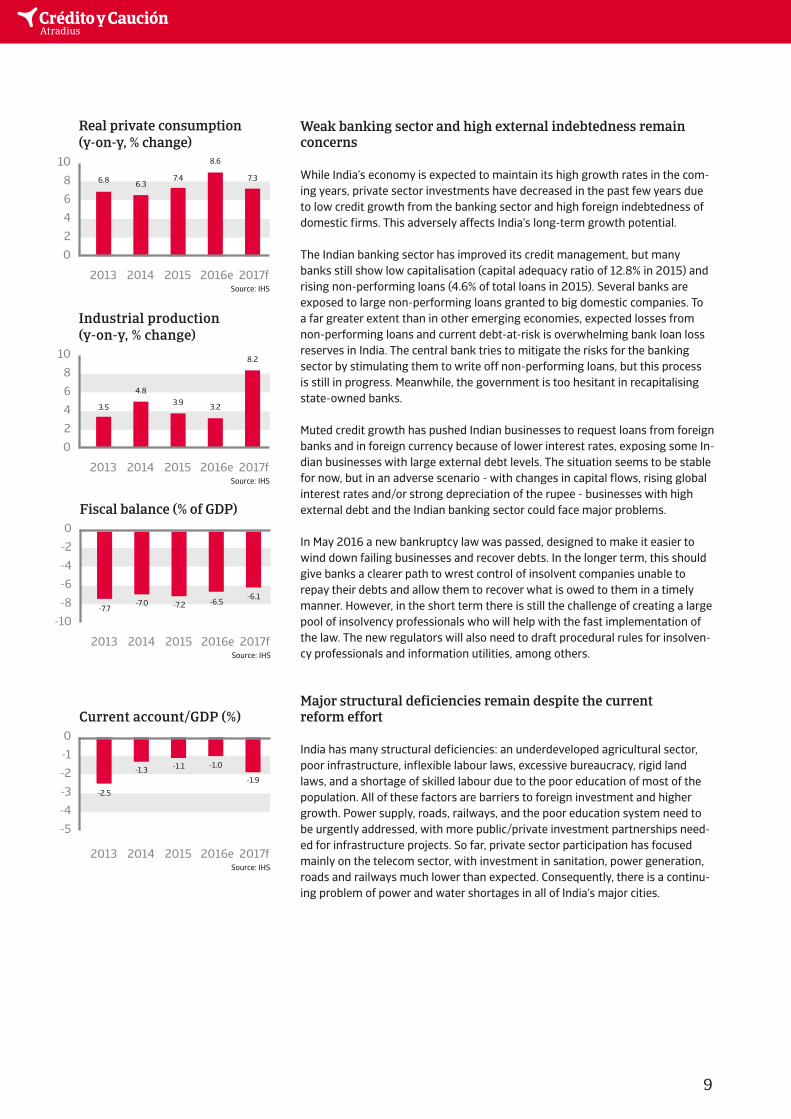
Weak banking sector and high external indebtedness remain concerns
While India’s economy is expected to maintain its high growth rates in the com-ing years, private sector investments have decreased in the past few years due to low credit growth from the banking sector and high foreign indebtedness of domestic firms. This adversely affects India’s long-term growth potential.
The Indian banking sector has improved its credit management, but many banks still show low capitalisation (capital adequacy ratio of 12.8% in 2015) and rising non-performing loans (4.6% of total loans in 2015). Several banks are exposed to large non-performing loans granted to big domestic companies. To a far greater extent than in other emerging economies, expected losses from non-performing loans and current debt-at-risk is overwhelming bank loan loss reserves in India. The central bank tries to mitigate the risks for the banking sector by stimulating them to write off non-performing loans, but this process is still in progress. Meanwhile, the government is too hesitant in recapitalising state-owned banks.
Muted credit growth has pushed Indian businesses to request loans from foreign banks and in foreign currency because of lower interest rates, exposing some In-dian businesses with large external debt levels. The situation seems to be stable for now, but in an adverse scenario - with changes in capital flows, rising global interest rates and/or strong depreciation of the rupee - businesses with high external debt and the Indian banking sector could face major problems.
In May 2016 a new bankruptcy law was passed, designed to make it easier to wind down failing businesses and recover debts. In the longer term, this should give banks a clearer path to wrest control of insolvent companies unable to repay their debts and allow them to recover what is owed to them in a timely manner. However, in the short term there is still the challenge of creating a large pool of insolvency professionals who will help with the fast implementation of the law. The new regulators will also need to draft procedural rules for insolven-cy professionals and information utilities, among others.
Major structural deficiencies remain despite the current reform effort
India has many structural deficiencies: an underdeveloped agricultural sector, poor infrastructure, inflexible labour laws, excessive bureaucracy, rigid land laws, and a shortage of skilled labour due to the poor education of most of the population. All of these factors are barriers to foreign investment and higher growth. Power supply, roads, railways, and the poor education system need to be urgently addressed, with more public/private investment partnerships need-ed for infrastructure projects. So far, private sector participation has focused mainly on the telecom sector, with investment in sanitation, power generation, roads and railways much lower than expected. Consequently, there is a continu-ing problem of power and water shortages in all of India’s major cities.
0
-2
-4
-6
-8
-10
2013 2014 2015 2016e 2017fSource: IHS
-7.7-7.0 -7.2 -6.5
-6.1
Fiscal balance (% of GDP)
0
-1
-2
-3
-4
-5
2013 2014 2015 2016e 2017fSource: IHS
-2.5
-1.3 -1.1 -1.0
-1.9
Current account/GDP (%)
10
8
6
4
2
0
2013 2014 2015 2016e 2017fSource: IHS
6.8 6.37.4
8.6
7.3
Real private consumption(y-on-y, % change)
10
8
6
4
2
0
2013 2014 2015 2016e 2017fSource: IHS
3.5
4.83.9 3.2
8.2
Industrial production (y-on-y, % change)
Good:The credit risk situation in the sector is benign / business performance in the sector is above its long-term trend.
Fair:The credit risk credit situation in the sector is average / business performance in the sector is stable.
Poor: The credit risk situation in the sector is relatively high / business performance in the sector is below long-term trend.
Bleak:The cedit risk situation in the sector is poor / business performance in the sector is weak compared to its long-term trend.
Excellent:The credit risk situation in the sector is strong / business performance in the sector is strong compared to its long-term trend.
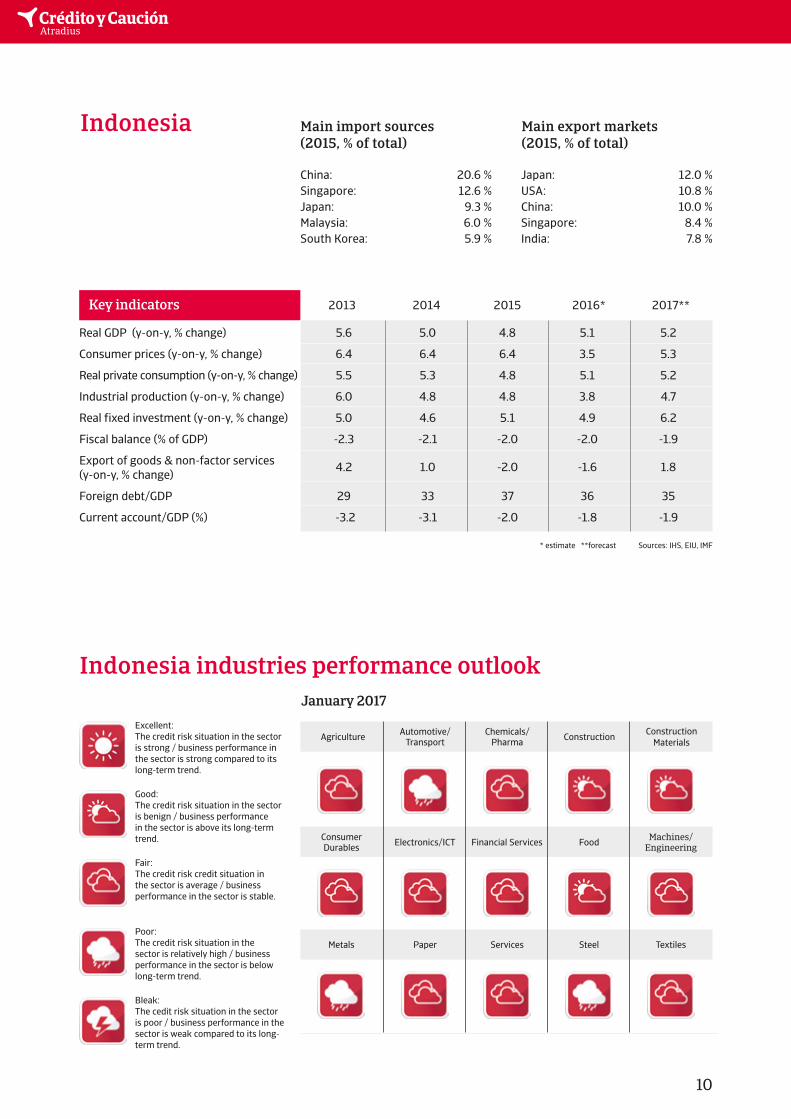
Indonesia Main import sources (2015, % of total)
Main export markets (2015, % of total)
Key indicators 2013 2014 2015 2016* 2017**
Real GDP (y-on-y, % change) 5.6 5.0 4.8 5.1 5.2
Consumer prices (y-on-y, % change) 6.4 6.4 6.4 3.5 5.3
Real private consumption (y-on-y, % change) 5.5 5.3 4.8 5.1 5.2
Industrial production (y-on-y, % change) 6.0 4.8 4.8 3.8 4.7
Real fixed investment (y-on-y, % change) 5.0 4.6 5.1 4.9 6.2
Fiscal balance (% of GDP) -2.3 -2.1 -2.0 -2.0 -1.9
Export of goods & non-factor services 4.2 1.0 -2.0 -1.6 1.8(y-on-y, % change)
Foreign debt/GDP 29 33 37 36 35
Current account/GDP (%) -3.2 -3.1 -2.0 -1.8 -1.9
* estimate **forecast Sources: IHS, EIU, IMF
10
Indonesia industries performance outlook
Agriculture
Electronics/ICT
Automotive/Transport
Financial Services
Chemicals/Pharma
Food
Construction
Machines/Engineering
ConstructionMaterials
ConsumerDurables
Paper Services Steel TextilesMetals
January 2017
China: 20.6 % Japan: 12.0 %Singapore: 12.6 % USA: 10.8 %Japan: 9.3 % China: 10.0 % Malaysia: 6.0 % Singapore: 8.4 % South Korea: 5.9 % India: 7.8 %
11
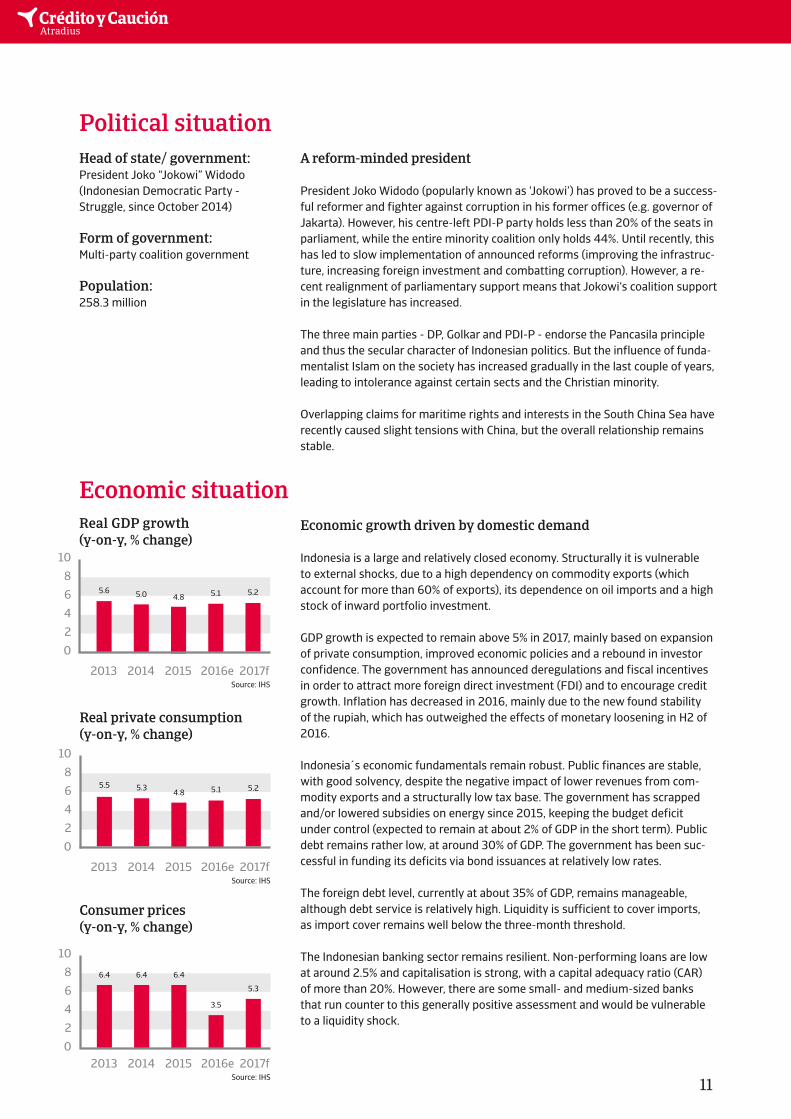
A reform-minded president
President Joko Widodo (popularly known as ‘Jokowi’) has proved to be a success-ful reformer and fighter against corruption in his former offices (e.g. governor of Jakarta). However, his centre-left PDI-P party holds less than 20% of the seats in parliament, while the entire minority coalition only holds 44%. Until recently, this has led to slow implementation of announced reforms (improving the infrastruc-ture, increasing foreign investment and combatting corruption). However, a re-cent realignment of parliamentary support means that Jokowi‘s coalition support in the legislature has increased.
The three main parties - DP, Golkar and PDI-P - endorse the Pancasila principle and thus the secular character of Indonesian politics. But the influence of funda-mentalist Islam on the society has increased gradually in the last couple of years, leading to intolerance against certain sects and the Christian minority.
Overlapping claims for maritime rights and interests in the South China Sea have recently caused slight tensions with China, but the overall relationship remains stable.
Political situation
Economic growth driven by domestic demand
Indonesia is a large and relatively closed economy. Structurally it is vulnerable to external shocks, due to a high dependency on commodity exports (which account for more than 60% of exports), its dependence on oil imports and a high stock of inward portfolio investment.
GDP growth is expected to remain above 5% in 2017, mainly based on expansion of private consumption, improved economic policies and a rebound in investor confidence. The government has announced deregulations and fiscal incentives in order to attract more foreign direct investment (FDI) and to encourage credit growth. Inflation has decreased in 2016, mainly due to the new found stability of the rupiah, which has outweighed the effects of monetary loosening in H2 of 2016.
Indonesia´s economic fundamentals remain robust. Public finances are stable, with good solvency, despite the negative impact of lower revenues from com-modity exports and a structurally low tax base. The government has scrapped and/or lowered subsidies on energy since 2015, keeping the budget deficit under control (expected to remain at about 2% of GDP in the short term). Public debt remains rather low, at around 30% of GDP. The government has been suc-cessful in funding its deficits via bond issuances at relatively low rates.
The foreign debt level, currently at about 35% of GDP, remains manageable, although debt service is relatively high. Liquidity is sufficient to cover imports, as import cover remains well below the three-month threshold.
The Indonesian banking sector remains resilient. Non-performing loans are low at around 2.5% and capitalisation is strong, with a capital adequacy ratio (CAR) of more than 20%. However, there are some small- and medium-sized banks that run counter to this generally positive assessment and would be vulnerable to a liquidity shock.
Economic situation
10
8
6
4
2
0
2013 2014 2015 2016e 2017fSource: IHS
5.6 5.0 4.8 5.1 5.2
Head of state/ government:President Joko “Jokowi” Widodo (Indonesian Democratic Party - Struggle, since October 2014)
Form of government:Multi-party coalition government
Population:258.3 million
Real GDP growth (y-on-y, % change)
10
8
6
4
2
0
2013 2014 2015 2016e 2017fSource: IHS
5.5 5.3 4.8 5.1 5.2
Real private consumption(y-on-y, % change)
10
8
6
4
2
02013 2014 2015 2016e 2017f
Source: IHS
6.4 6.4 6.4
3.5
5.3
Consumer prices (y-on-y, % change)
12
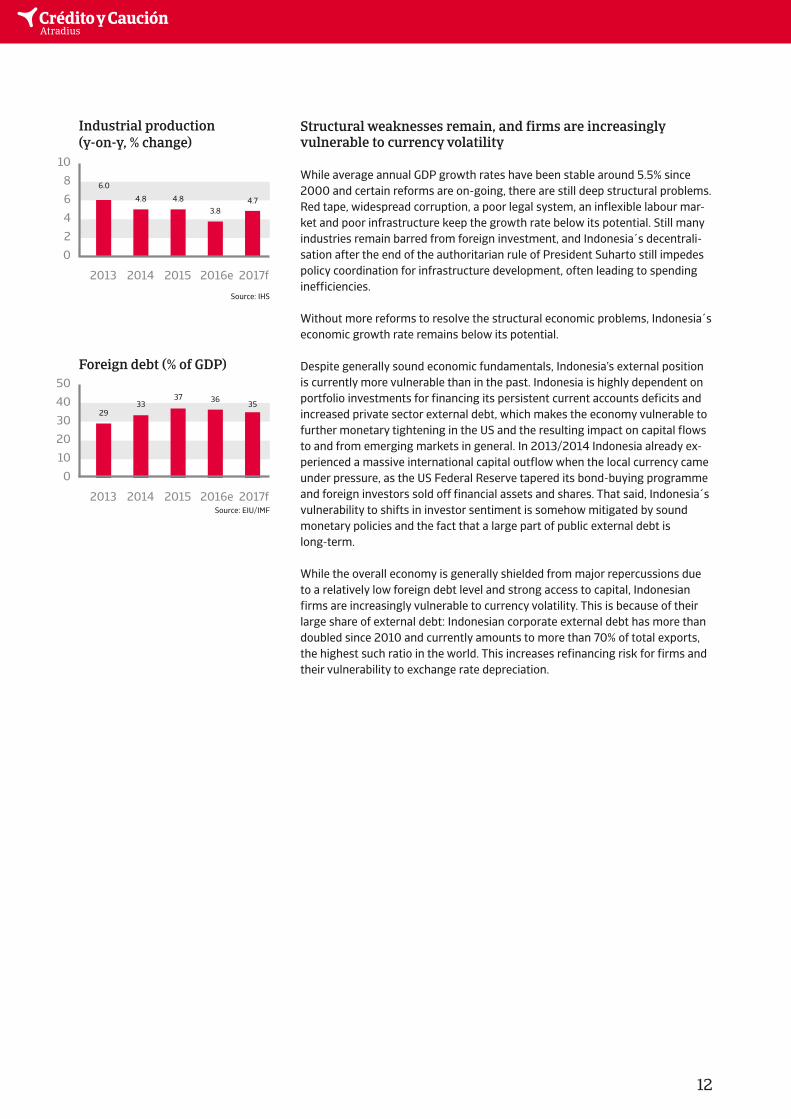
Structural weaknesses remain, and firms are increasingly vulnerable to currency volatility
While average annual GDP growth rates have been stable around 5.5% since 2000 and certain reforms are on-going, there are still deep structural problems. Red tape, widespread corruption, a poor legal system, an inflexible labour mar-ket and poor infrastructure keep the growth rate below its potential. Still many industries remain barred from foreign investment, and Indonesia´s decentrali-sation after the end of the authoritarian rule of President Suharto still impedes policy coordination for infrastructure development, often leading to spending inefficiencies.
Without more reforms to resolve the structural economic problems, Indonesia´s economic growth rate remains below its potential.
Despite generally sound economic fundamentals, Indonesia’s external position is currently more vulnerable than in the past. Indonesia is highly dependent on portfolio investments for financing its persistent current accounts deficits and increased private sector external debt, which makes the economy vulnerable to further monetary tightening in the US and the resulting impact on capital flows to and from emerging markets in general. In 2013/2014 Indonesia already ex-perienced a massive international capital outflow when the local currency came under pressure, as the US Federal Reserve tapered its bond-buying programme and foreign investors sold off financial assets and shares. That said, Indonesia´s vulnerability to shifts in investor sentiment is somehow mitigated by sound monetary policies and the fact that a large part of public external debt is long-term.
While the overall economy is generally shielded from major repercussions due to a relatively low foreign debt level and strong access to capital, Indonesian firms are increasingly vulnerable to currency volatility. This is because of their large share of external debt: Indonesian corporate external debt has more than doubled since 2010 and currently amounts to more than 70% of total exports, the highest such ratio in the world. This increases refinancing risk for firms and their vulnerability to exchange rate depreciation.
50
40
30
20
10
0
2013 2014 2015 2016e 2017fSource: EIU/IMF
2933
37 3635
Foreign debt (% of GDP)
10
8
6
4
2
0
2013 2014 2015 2016e 2017f
6.0
4.8 4.83.8
4.7
Industrial production (y-on-y, % change)
Source: IHS
Good:The credit risk situation in the sector is benign / business performance in the sector is above its long-term trend.
Fair:The credit risk credit situation in the sector is average / business performance in the sector is stable.
Poor: The credit risk situation in the sector is relatively high / business performance in the sector is below long-term trend.
Bleak:The cedit risk situation in the sector is poor / business performance in the sector is weak compared to its long-term trend.
Excellent:The credit risk situation in the sector is strong / business performance in the sector is strong compared to its long-term trend.
Key indicators 2013 2014 2015 2016* 2017**
Real GDP (y-on-y, % change) 1.4 -0.1 0.6 0.6 0.7
Consumer prices (y-on-y, % change) 0.3 2.7 0.8 -0.3 0.6
Real private consumption (y-on-y, % change) 1.7 -0.9 -1.2 0.6 1.0
Retail sales (y-on-y, % change) 1.7 -1.0 -1.2 -1.0 2.0
Industrial production (y-on-y, % change) -0.6 2.1 -1.2 -0.9 1.5
Unemployment rate (%) 4.0 3.6 3.4 3.2 3.3
Real fixed investment (y-on-y, % change) 2.6 1.1 0.2 0.5 1.4
Export of goods and non-factor services 1.1 8.3 2.8 -1.5 1.5(y-on-y, % change)
Fiscal balance (% of GDP) -7.1 -5.5 -5.4 -6.3 -6.5
Government debt (% of GDP) 218.5 224.1 226.9 230.7 229.9
* estimate **forecast Source: IHS
Japan Main import sources (2015, % of total)
Main export markets (2015, % of total)
13
Japan industries performance forecast
Agriculture
Electronics/ICT
Automotive/Transport
Financial Services
Chemicals/Pharma
Food
Construction
Machines/Engineering
ConstructionMaterials
ConsumerDurables
Paper Services Steel TextilesMetals
January 2017
China: 25.7 % USA: 20.2 %USA: 10.9 % China: 17.5 % Australia: 5.6 % South Korea: 7.0 % South Korea: 4.3 % Taiwan: 5.9 % United Arab Emirates: 3.8 % Hong Kong: 5.6 %
14
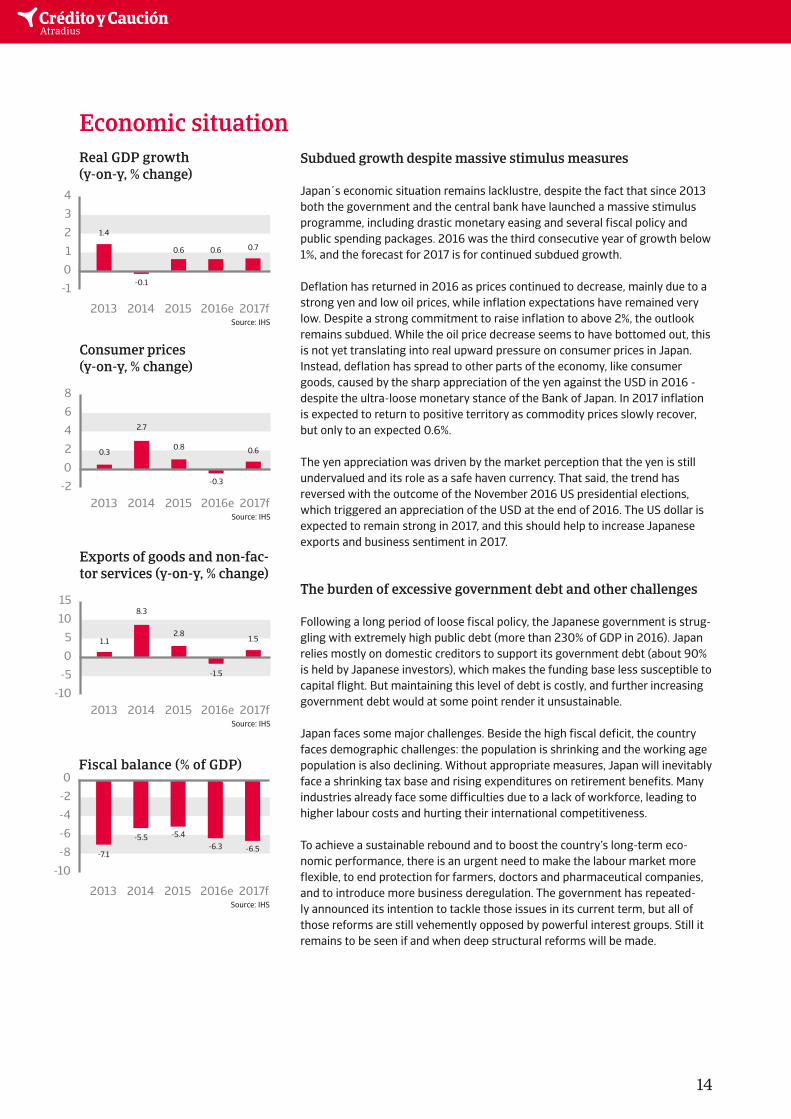
Subdued growth despite massive stimulus measures
Japan´s economic situation remains lacklustre, despite the fact that since 2013 both the government and the central bank have launched a massive stimulus programme, including drastic monetary easing and several fiscal policy and public spending packages. 2016 was the third consecutive year of growth below 1%, and the forecast for 2017 is for continued subdued growth.
Deflation has returned in 2016 as prices continued to decrease, mainly due to a strong yen and low oil prices, while inflation expectations have remained very low. Despite a strong commitment to raise inflation to above 2%, the outlook remains subdued. While the oil price decrease seems to have bottomed out, this is not yet translating into real upward pressure on consumer prices in Japan. Instead, deflation has spread to other parts of the economy, like consumer goods, caused by the sharp appreciation of the yen against the USD in 2016 - despite the ultra-loose monetary stance of the Bank of Japan. In 2017 inflation is expected to return to positive territory as commodity prices slowly recover, but only to an expected 0.6%.
The yen appreciation was driven by the market perception that the yen is still undervalued and its role as a safe haven currency. That said, the trend has reversed with the outcome of the November 2016 US presidential elections, which triggered an appreciation of the USD at the end of 2016. The US dollar is expected to remain strong in 2017, and this should help to increase Japanese exports and business sentiment in 2017.
The burden of excessive government debt and other challenges
Following a long period of loose fiscal policy, the Japanese government is strug-gling with extremely high public debt (more than 230% of GDP in 2016). Japan relies mostly on domestic creditors to support its government debt (about 90% is held by Japanese investors), which makes the funding base less susceptible to capital flight. But maintaining this level of debt is costly, and further increasing government debt would at some point render it unsustainable.
Japan faces some major challenges. Beside the high fiscal deficit, the country faces demographic challenges: the population is shrinking and the working age population is also declining. Without appropriate measures, Japan will inevitably face a shrinking tax base and rising expenditures on retirement benefits. Many industries already face some difficulties due to a lack of workforce, leading to higher labour costs and hurting their international competitiveness.
To achieve a sustainable rebound and to boost the country’s long-term eco-nomic performance, there is an urgent need to make the labour market more flexible, to end protection for farmers, doctors and pharmaceutical companies, and to introduce more business deregulation. The government has repeated-ly announced its intention to tackle those issues in its current term, but all of those reforms are still vehemently opposed by powerful interest groups. Still it remains to be seen if and when deep structural reforms will be made.
Economic situation
4
3
2
1
0
-1
2013 2014 2015 2016e 2017fSource: IHS
1.4
-0.1
0.6 0.6 0.7
Real GDP growth (y-on-y, % change)
8
6
4
2
0
-22013 2014 2015 2016e 2017f
Source: IHS
0.3
2.7
0.8
-0.3
0.6
Consumer prices (y-on-y, % change)
15
10
5
0
-5
-102013 2014 2015 2016e 2017f
Source: IHS
1.1
8.3
2.8
-1.5
1.5
Exports of goods and non-fac-tor services (y-on-y, % change)
0
-2
-4
-6
-8
-10
2013 2014 2015 2016e 2017fSource: IHS
Fiscal balance (% of GDP)
-7.1
-5.5 -5.4-6.3 -6.5

Good:The credit risk situation in the sector is benign / business performance in the sector is above its long-term trend.
Fair:The credit risk credit situation in the sector is average / business performance in the sector is stable.
Poor: The credit risk situation in the sector is relatively high / business performance in the sector is below long-term trend.
Bleak:The cedit risk situation in the sector is poor / business performance in the sector is weak compared to its long-term trend.
Excellent:The credit risk situation in the sector is strong / business performance in the sector is strong compared to its long-term trend.
Key indicators 2013 2014 2015 2016* 2017**
Real GDP (y-on-y, % change) 4.7 6.0 5.0 4.0 4.0
Consumer prices (y-on-y, % change) 2.1 3.1 2.1 2.3 3.0
Real private consumption (y-on-y, % change) 7.2 7.0 6.0 6.0 5.4
Industrial production (y-on-y, % change) 3.4 5.1 4.5 3.8 4.3
Real fixed investment (y-on-y, % change) 8.1 4.8 3.7 3.3 3.8
Fiscal balance (% of GDP) -3.9 -3.4 -3.2 -3.2 -3.4
Export of goods & non-factor services 0.3 5.0 0.6 0.0 1.9(y-on-y, % change)
Current account/GDP (%) 6.4 4.3 2.4 2.1 1.5
* estimate **forecast Sources: IHS Global Insight, EIU, IMF
Malaysia Main import sources (2015, % of total)
Main export markets (2015, % of total)
15
Malaysia industries performance outlook
Agriculture
Electronics/ICT
Automotive/Transport
Financial Services
Chemicals/Pharma
Food
Construction
Machines/Engineering
ConstructionMaterials
ConsumerDurables
Paper Services Steel TextilesMetals
January 2017
China: 18.9 % Singapore: 13.9 %Singapore: 12.0 % China: 13.0 %USA: 8.1 % Japan: 9.5 % Japan: 7.8 % USA: 9.5 % Thailand: 6.1 % Thailand: 5.7 %
16
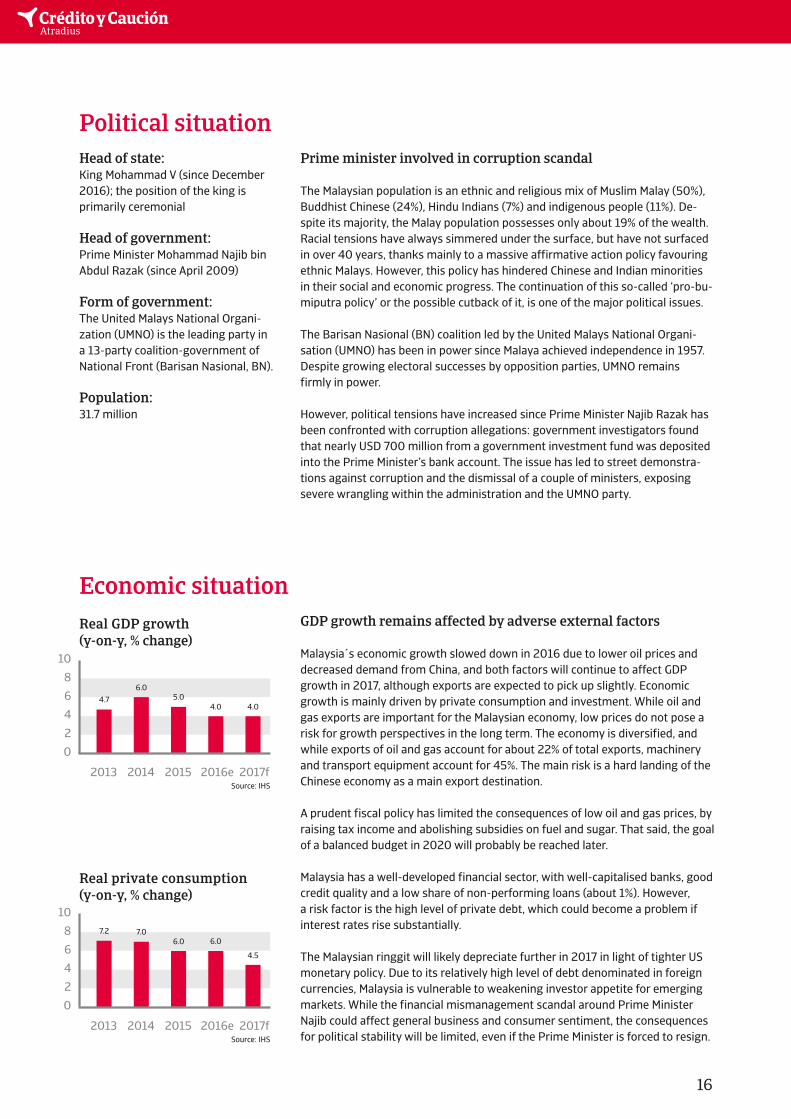
Prime minister involved in corruption scandal
The Malaysian population is an ethnic and religious mix of Muslim Malay (50%), Buddhist Chinese (24%), Hindu Indians (7%) and indigenous people (11%). De-spite its majority, the Malay population possesses only about 19% of the wealth. Racial tensions have always simmered under the surface, but have not surfaced in over 40 years, thanks mainly to a massive affirmative action policy favouring ethnic Malays. However, this policy has hindered Chinese and Indian minorities in their social and economic progress. The continuation of this so-called ‘pro-bu-miputra policy’ or the possible cutback of it, is one of the major political issues.
The Barisan Nasional (BN) coalition led by the United Malays National Organi-sation (UMNO) has been in power since Malaya achieved independence in 1957. Despite growing electoral successes by opposition parties, UMNO remains firmly in power.
However, political tensions have increased since Prime Minister Najib Razak has been confronted with corruption allegations: government investigators found that nearly USD 700 million from a government investment fund was deposited into the Prime Minister’s bank account. The issue has led to street demonstra-tions against corruption and the dismissal of a couple of ministers, exposing severe wrangling within the administration and the UMNO party.
Political situation
GDP growth remains affected by adverse external factors
Malaysia´s economic growth slowed down in 2016 due to lower oil prices and decreased demand from China, and both factors will continue to affect GDP growth in 2017, although exports are expected to pick up slightly. Economic growth is mainly driven by private consumption and investment. While oil and gas exports are important for the Malaysian economy, low prices do not pose a risk for growth perspectives in the long term. The economy is diversified, and while exports of oil and gas account for about 22% of total exports, machinery and transport equipment account for 45%. The main risk is a hard landing of the Chinese economy as a main export destination.
A prudent fiscal policy has limited the consequences of low oil and gas prices, by raising tax income and abolishing subsidies on fuel and sugar. That said, the goal of a balanced budget in 2020 will probably be reached later.
Malaysia has a well-developed financial sector, with well-capitalised banks, good credit quality and a low share of non-performing loans (about 1%). However, a risk factor is the high level of private debt, which could become a problem if interest rates rise substantially.
The Malaysian ringgit will likely depreciate further in 2017 in light of tighter US monetary policy. Due to its relatively high level of debt denominated in foreign currencies, Malaysia is vulnerable to weakening investor appetite for emerging markets. While the financial mismanagement scandal around Prime Minister Najib could affect general business and consumer sentiment, the consequences for political stability will be limited, even if the Prime Minister is forced to resign.
Economic situation
10
8
6
4
2
0
2013 2014 2015 2016e 2017fSource: IHS
4.76.0
5.04.0 4.0
Real GDP growth (y-on-y, % change)
Head of state:King Mohammad V (since December 2016); the position of the king is primarily ceremonial
Head of government:Prime Minister Mohammad Najib bin Abdul Razak (since April 2009)
Form of government:The United Malays National Organi- zation (UMNO) is the leading party in a 13-party coalition-government of National Front (Barisan Nasional, BN).
Population:31.7 million
Real private consumption (y-on-y, % change)
10
8
6
4
2
0
2013 2014 2015 2016e 2017fSource: IHS
7.2 7.06.0 6.0
4.5

Good:The credit risk situation in the sector is benign / business performance in the sector is above its long-term trend.
Fair:The credit risk credit situation in the sector is average / business performance in the sector is stable.
Poor: The credit risk situation in the sector is relatively high / business performance in the sector is below long-term trend.
Bleak:The cedit risk situation in the sector is poor / business performance in the sector is weak compared to its long-term trend.
Excellent:The credit risk situation in the sector is strong / business performance in the sector is strong compared to its long-term trend.
Key indicators 2013 2014 2015 2016* 2017**
Real GDP (y-on-y, % change) 7.1 6.2 5.9 6.0 5.8
Consumer prices (y-on-y, % change) 2.9 4.2 1.4 1.9 2.8
Real private consumption (y-on-y, % change) 5.8 5.5 6.3 6.1 5.6
Industrial production (y-on-y, % change) 13.9 7.3 2.5 8.7 6.0
Real fixed investment (y-on-y, % change) 11.8 6.2 15.2 13.0 7.0
Export of goods & non-factor services -1.0 11.7 9.0 7.3 5.8(y-on-y, % change)
Fiscal balance (% of GDP) -1.0 -0.6 -1.9 -2.2 -2.0
Foreign debt (% of GDP) 25 27 25 23 22
Current account (% of GDP) 2.8 3.8 3.6 3.3 3.3* estimate **forecast Sources: IHS, EIU, IMF
The Philippines Main import sources (2015, % of total)
Main export markets (2015, % of total)
17
Philippines industries performance outlook
Agriculture
Electronics/ICT
Automotive/Transport
Financial Services
Chemicals/Pharma
Food
Construction
Machines/Engineering
ConstructionMaterials
ConsumerDurables
Paper Services Steel TextilesMetals
January 2017
China: 16.4 % Japan: 21.1 %USA: 10.9 % USA: 15.0 %Japan: 9.6 % China: 10.9 % South Korea: 7.8 % Hong Kong: 10.6 % Singapore: 7.0 % Singapore: 6.2 %
18
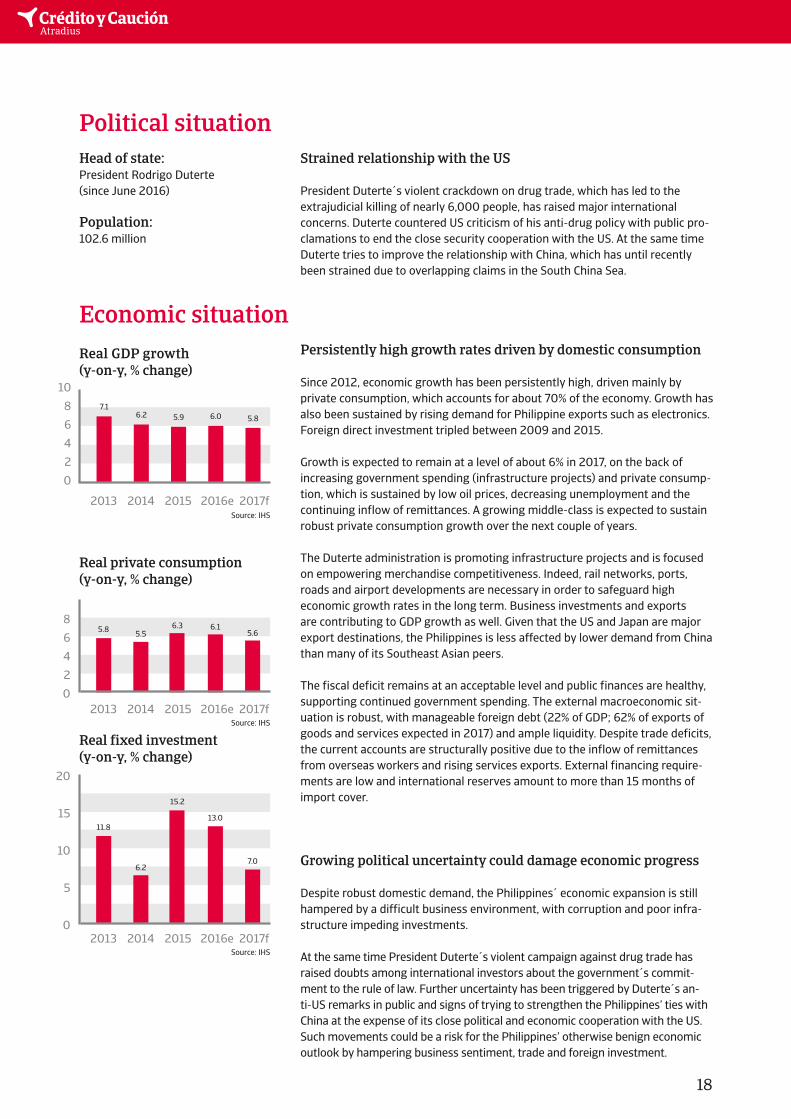
Strained relationship with the US
President Duterte´s violent crackdown on drug trade, which has led to the extrajudicial killing of nearly 6,000 people, has raised major international concerns. Duterte countered US criticism of his anti-drug policy with public pro-clamations to end the close security cooperation with the US. At the same time Duterte tries to improve the relationship with China, which has until recently been strained due to overlapping claims in the South China Sea.
Political situation
Persistently high growth rates driven by domestic consumption
Since 2012, economic growth has been persistently high, driven mainly by private consumption, which accounts for about 70% of the economy. Growth has also been sustained by rising demand for Philippine exports such as electronics. Foreign direct investment tripled between 2009 and 2015.
Growth is expected to remain at a level of about 6% in 2017, on the back of increasing government spending (infrastructure projects) and private consump-tion, which is sustained by low oil prices, decreasing unemployment and the continuing inflow of remittances. A growing middle-class is expected to sustain robust private consumption growth over the next couple of years.
The Duterte administration is promoting infrastructure projects and is focused on empowering merchandise competitiveness. Indeed, rail networks, ports, roads and airport developments are necessary in order to safeguard high economic growth rates in the long term. Business investments and exports are contributing to GDP growth as well. Given that the US and Japan are major export destinations, the Philippines is less affected by lower demand from China than many of its Southeast Asian peers.
The fiscal deficit remains at an acceptable level and public finances are healthy, supporting continued government spending. The external macroeconomic sit-uation is robust, with manageable foreign debt (22% of GDP; 62% of exports of goods and services expected in 2017) and ample liquidity. Despite trade deficits, the current accounts are structurally positive due to the inflow of remittances from overseas workers and rising services exports. External financing require-ments are low and international reserves amount to more than 15 months of import cover.
Growing political uncertainty could damage economic progress
Despite robust domestic demand, the Philippines´ economic expansion is still hampered by a difficult business environment, with corruption and poor infra-structure impeding investments.
At the same time President Duterte´s violent campaign against drug trade has raised doubts among international investors about the government´s commit-ment to the rule of law. Further uncertainty has been triggered by Duterte´s an-ti-US remarks in public and signs of trying to strengthen the Philippines’ ties with China at the expense of its close political and economic cooperation with the US. Such movements could be a risk for the Philippines’ otherwise benign economic outlook by hampering business sentiment, trade and foreign investment.
Economic situation
10
8
6
4
2
0
2013 2014 2015 2016e 2017fSource: IHS
7.16.2 5.9 6.0 5.8
Real GDP growth (y-on-y, % change)
Head of state:President Rodrigo Duterte (since June 2016)
Population:102.6 million
2013 2014 2015 2016e 2017fSource: IHS
Real private consumption (y-on-y, % change)
8
6
4
2
0
5.8 5.56.16.3
5.6
2013 2014 2015 2016e 2017fSource: IHS
Real fixed investment (y-on-y, % change)
20
15
10
5
0
11.8
6.2
13.0
15.2
7.0
Good:The credit risk situation in the sector is benign / business performance in the sector is above its long-term trend.
Fair:The credit risk credit situation in the sector is average / business performance in the sector is stable.
Poor: The credit risk situation in the sector is relatively high / business performance in the sector is below long-term trend.
Bleak:The cedit risk situation in the sector is poor / business performance in the sector is weak compared to its long-term trend.
Excellent:The credit risk situation in the sector is strong / business performance in the sector is strong compared to its long-term trend.
19
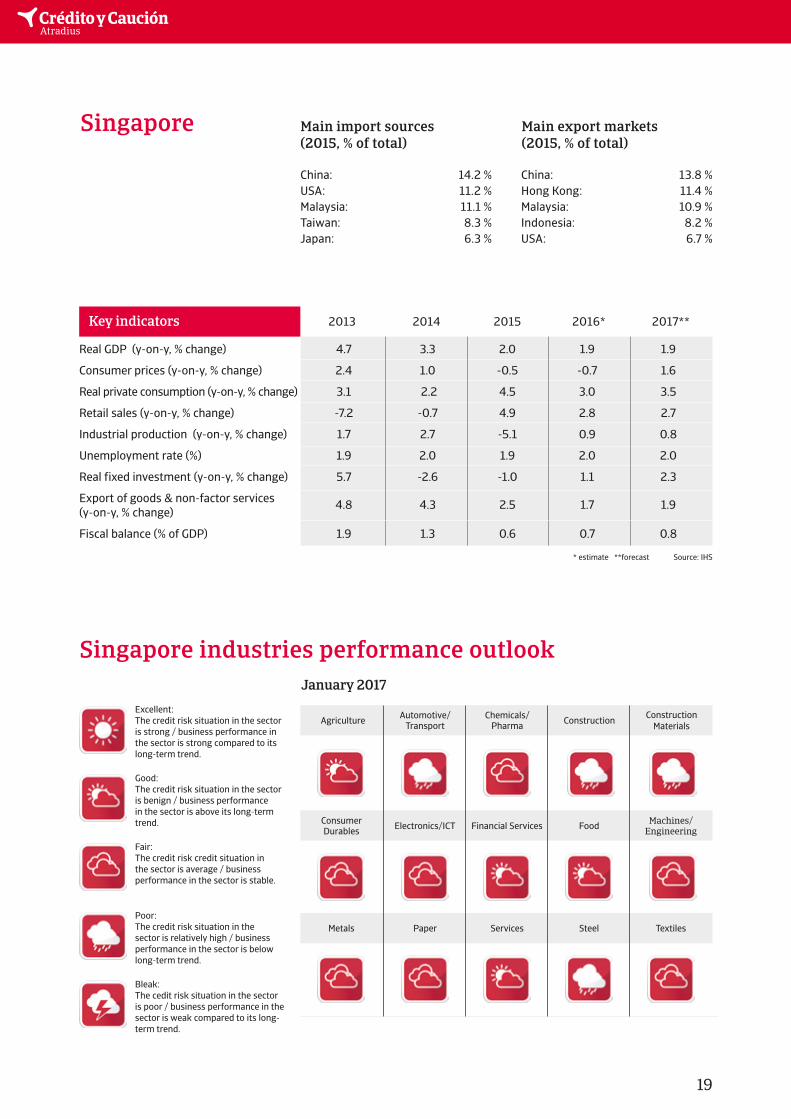
Key indicators 2013 2014 2015 2016* 2017**
Real GDP (y-on-y, % change) 4.7 3.3 2.0 1.9 1.9
Consumer prices (y-on-y, % change) 2.4 1.0 -0.5 -0.7 1.6
Real private consumption (y-on-y, % change) 3.1 2.2 4.5 3.0 3.5
Retail sales (y-on-y, % change) -7.2 -0.7 4.9 2.8 2.7
Industrial production (y-on-y, % change) 1.7 2.7 -5.1 0.9 0.8
Unemployment rate (%) 1.9 2.0 1.9 2.0 2.0
Real fixed investment (y-on-y, % change) 5.7 -2.6 -1.0 1.1 2.3
Export of goods & non-factor services 4.8 4.3 2.5 1.7 1.9(y-on-y, % change)
Fiscal balance (% of GDP) 1.9 1.3 0.6 0.7 0.8
* estimate **forecast Source: IHS
Singapore Main import sources (2015, % of total)
Main export markets (2015, % of total)
Singapore industries performance outlook
Agriculture
Electronics/ICT
Automotive/Transport
Financial Services
Chemicals/Pharma
Food
Construction
Machines/Engineering
ConstructionMaterials
ConsumerDurables
Paper Services Steel TextilesMetals
January 2017
China: 14.2 % China: 13.8 %USA: 11.2 % Hong Kong: 11.4 %Malaysia: 11.1 % Malaysia: 10.9 % Taiwan: 8.3 % Indonesia: 8.2 % Japan: 6.3 % USA: 6.7 %
Real GDP growth (y-on-y, % change)
20
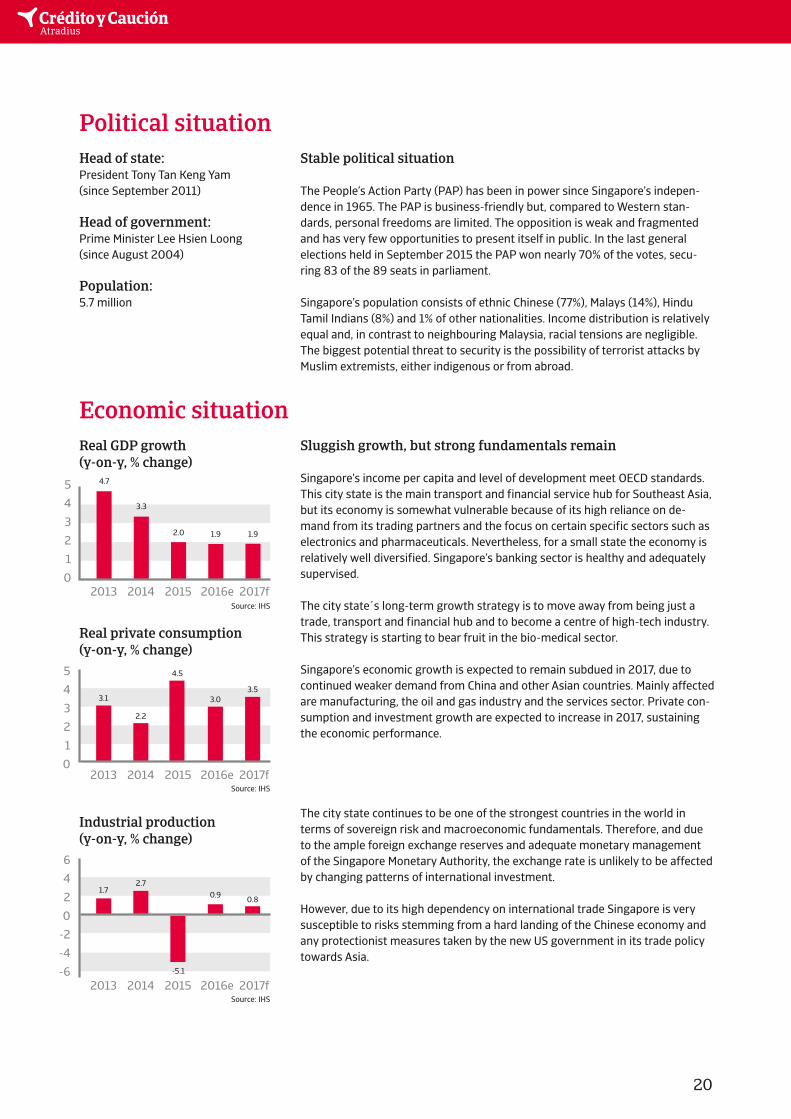
Stable political situation
The People’s Action Party (PAP) has been in power since Singapore’s indepen-dence in 1965. The PAP is business-friendly but, compared to Western stan-dards, personal freedoms are limited. The opposition is weak and fragmented and has very few opportunities to present itself in public. In the last general elections held in September 2015 the PAP won nearly 70% of the votes, secu-ring 83 of the 89 seats in parliament.
Singapore’s population consists of ethnic Chinese (77%), Malays (14%), Hindu Tamil Indians (8%) and 1% of other nationalities. Income distribution is relatively equal and, in contrast to neighbouring Malaysia, racial tensions are negligible. The biggest potential threat to security is the possibility of terrorist attacks by Muslim extremists, either indigenous or from abroad.
Political situation
Sluggish growth, but strong fundamentals remain
Singapore’s income per capita and level of development meet OECD standards. This city state is the main transport and financial service hub for Southeast Asia, but its economy is somewhat vulnerable because of its high reliance on de-mand from its trading partners and the focus on certain specific sectors such as electronics and pharmaceuticals. Nevertheless, for a small state the economy is relatively well diversified. Singapore’s banking sector is healthy and adequately supervised.
The city state´s long-term growth strategy is to move away from being just a trade, transport and financial hub and to become a centre of high-tech industry. This strategy is starting to bear fruit in the bio-medical sector.
Singapore’s economic growth is expected to remain subdued in 2017, due to continued weaker demand from China and other Asian countries. Mainly affected are manufacturing, the oil and gas industry and the services sector. Private con-sumption and investment growth are expected to increase in 2017, sustaining the economic performance.
The city state continues to be one of the strongest countries in the world in terms of sovereign risk and macroeconomic fundamentals. Therefore, and due to the ample foreign exchange reserves and adequate monetary management of the Singapore Monetary Authority, the exchange rate is unlikely to be affected by changing patterns of international investment.
However, due to its high dependency on international trade Singapore is very susceptible to risks stemming from a hard landing of the Chinese economy and any protectionist measures taken by the new US government in its trade policy towards Asia.
Economic situation
5
4
3
2
1
02013 2014 2015 2016e 2017f
Source: IHS
4.7
3.3
2.0 1.9 1.9
Head of state:President Tony Tan Keng Yam (since September 2011)
Head of government:Prime Minister Lee Hsien Loong (since August 2004)
Population:5.7 million
2013 2014 2015 2016e 2017fSource: IHS
Real private consumption (y-on-y, % change)
5
4
3
2
1
0
3.1
2.2
3.0
4.5
3.5
2013 2014 2015 2016e 2017fSource: IHS
Industrial production (y-on-y, % change)
6
4
2
0
-2
-4
-6
1.72.7
0.9
-5.1
0.8
Good:The credit risk situation in the sector is benign / business performance in the sector is above its long-term trend.
Fair:The credit risk credit situation in the sector is average / business performance in the sector is stable.
Poor: The credit risk situation in the sector is relatively high / business performance in the sector is below long-term trend.
Bleak:The cedit risk situation in the sector is poor / business performance in the sector is weak compared to its long-term trend.
Excellent:The credit risk situation in the sector is strong / business performance in the sector is strong compared to its long-term trend.
21
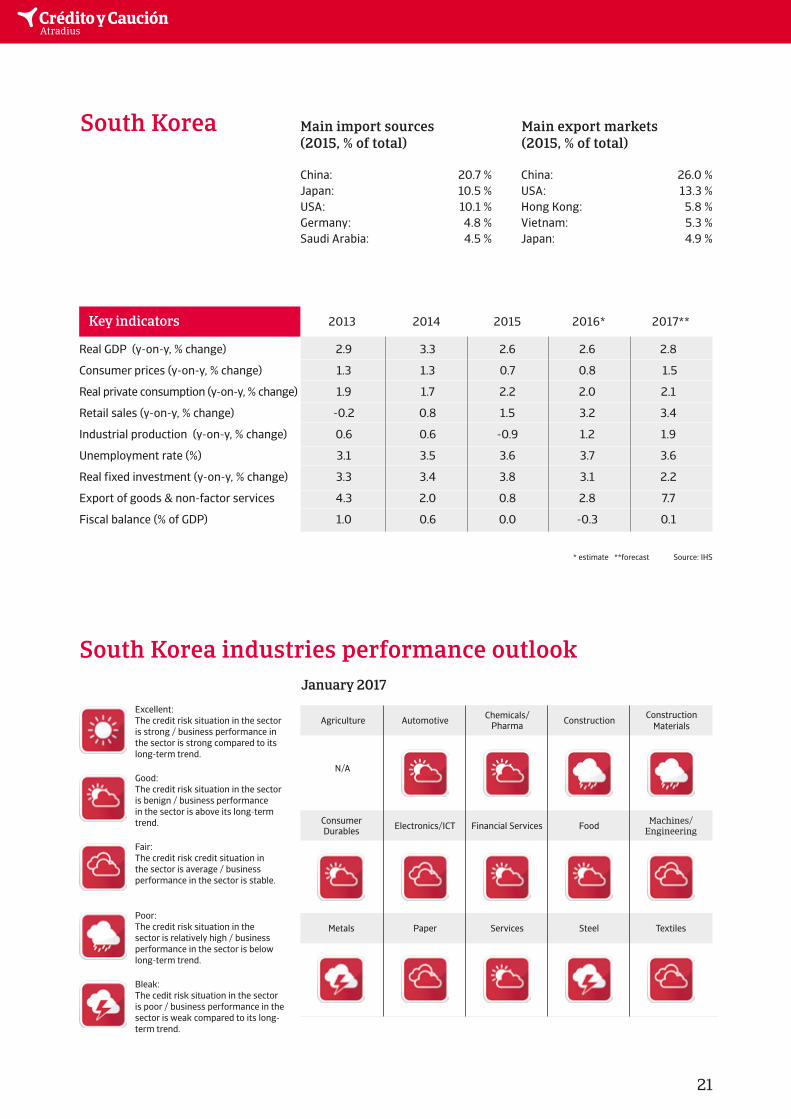
Key indicators 2013 2014 2015 2016* 2017**
Real GDP (y-on-y, % change) 2.9 3.3 2.6 2.6 2.8
Consumer prices (y-on-y, % change) 1.3 1.3 0.7 0.8 1.5
Real private consumption (y-on-y, % change) 1.9 1.7 2.2 2.0 2.1
Retail sales (y-on-y, % change) -0.2 0.8 1.5 3.2 3.4
Industrial production (y-on-y, % change) 0.6 0.6 -0.9 1.2 1.9
Unemployment rate (%) 3.1 3.5 3.6 3.7 3.6
Real fixed investment (y-on-y, % change) 3.3 3.4 3.8 3.1 2.2
Export of goods & non-factor services 4.3 2.0 0.8 2.8 7.7
Fiscal balance (% of GDP) 1.0 0.6 0.0 -0.3 0.1
* estimate **forecast Source: IHS
South Korea Main import sources (2015, % of total)
Main export markets (2015, % of total)
South Korea industries performance outlook
Agriculture
Electronics/ICT
Automotive
Financial Services
Chemicals/Pharma
Food
Construction
Machines/Engineering
ConstructionMaterials
ConsumerDurables
Paper Services Steel TextilesMetals
January 2017
China: 20.7 % China: 26.0 %Japan: 10.5 % USA: 13.3 %USA: 10.1 % Hong Kong: 5.8 % Germany: 4.8 % Vietnam: 5.3 % Saudi Arabia: 4.5 % Japan: 4.9 %
N/A
22
Increased political turmoil after the president´s impeachment
In December 2016 South Korea´s President Park Geun-hye was impeached by parliament over influence-peddling and dereliction of duty. A constitutional court is now deciding if the impeachment was warranted, leaving open the possibility that Park, who is now on suspension, could keep her office. In the meantime Prime Minister Hwang Kyo-ahn has been acting president.
The relation with North Korea remains very sensitive, and has deteriorated since Pyongyang has tested a hydrogen bomb in January 2016.
Political situation
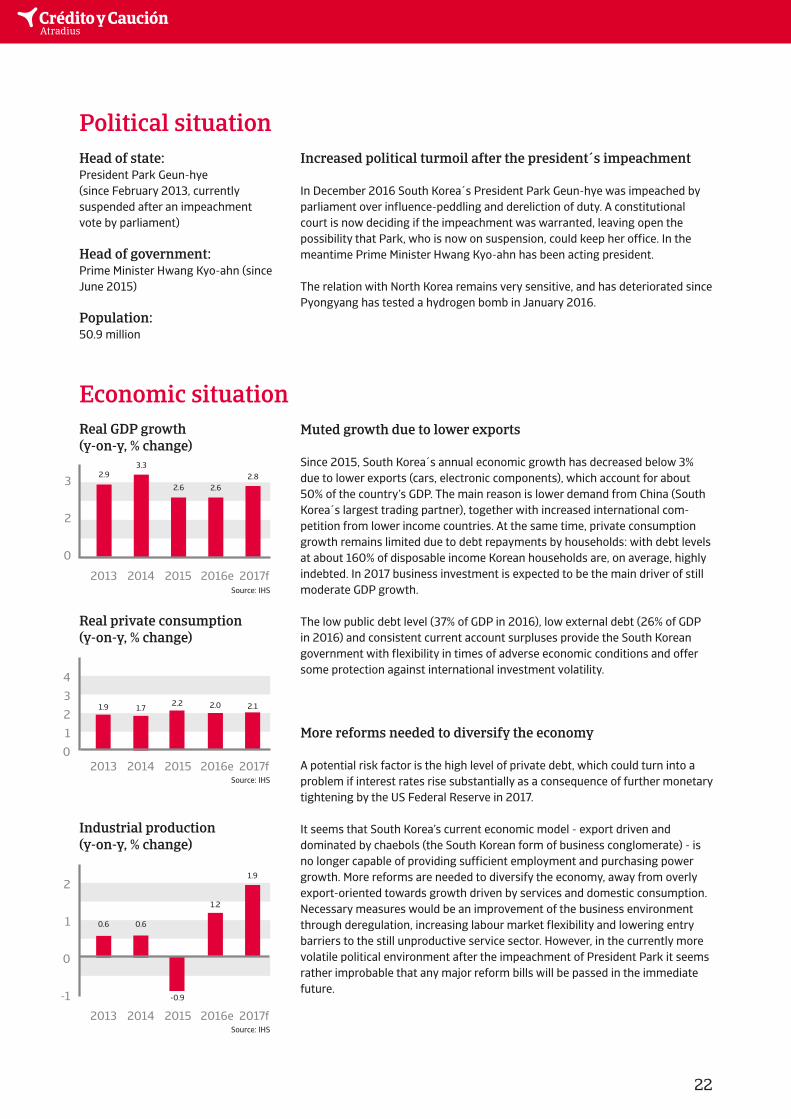
Muted growth due to lower exports
Since 2015, South Korea´s annual economic growth has decreased below 3% due to lower exports (cars, electronic components), which account for about 50% of the country’s GDP. The main reason is lower demand from China (South Korea´s largest trading partner), together with increased international com-petition from lower income countries. At the same time, private consumption growth remains limited due to debt repayments by households: with debt levels at about 160% of disposable income Korean households are, on average, highly indebted. In 2017 business investment is expected to be the main driver of still moderate GDP growth.
The low public debt level (37% of GDP in 2016), low external debt (26% of GDP in 2016) and consistent current account surpluses provide the South Korean government with flexibility in times of adverse economic conditions and offer some protection against international investment volatility.
More reforms needed to diversify the economy
A potential risk factor is the high level of private debt, which could turn into a problem if interest rates rise substantially as a consequence of further monetary tightening by the US Federal Reserve in 2017.
It seems that South Korea’s current economic model - export driven and dominated by chaebols (the South Korean form of business conglomerate) - is no longer capable of providing sufficient employment and purchasing power growth. More reforms are needed to diversify the economy, away from overly export-oriented towards growth driven by services and domestic consumption. Necessary measures would be an improvement of the business environment through deregulation, increasing labour market flexibility and lowering entry barriers to the still unproductive service sector. However, in the currently more volatile political environment after the impeachment of President Park it seems rather improbable that any major reform bills will be passed in the immediate future.
Economic situation
3
2
0
2013 2014 2015 2016e 2017fSource: IHS
2.93.3
2.6 2.62.8
Real GDP growth (y-on-y, % change)
Head of state:President Park Geun-hye (since February 2013, currently suspended after an impeachment vote by parliament)
Head of government:Prime Minister Hwang Kyo-ahn (since June 2015)
Population:50.9 million
2013 2014 2015 2016e 2017fSource: IHS
Industrial production (y-on-y, % change)
2
1
0
-1
0.6 0.6
1.2
-0.9
1.9
2013 2014 2015 2016e 2017fSource: IHS
Real private consumption (y-on-y, % change)
4
3
2
1
0
1.7 2.02.2 2.11.9
Good:The credit risk situation in the sector is benign / business performance in the sector is above its long-term trend.
Fair:The credit risk credit situation in the sector is average / business performance in the sector is stable.
Poor: The credit risk situation in the sector is relatively high / business performance in the sector is below long-term trend.
Bleak:The cedit risk situation in the sector is poor / business performance in the sector is weak compared to its long-term trend.
Excellent:The credit risk situation in the sector is strong / business performance in the sector is strong compared to its long-term trend.
23
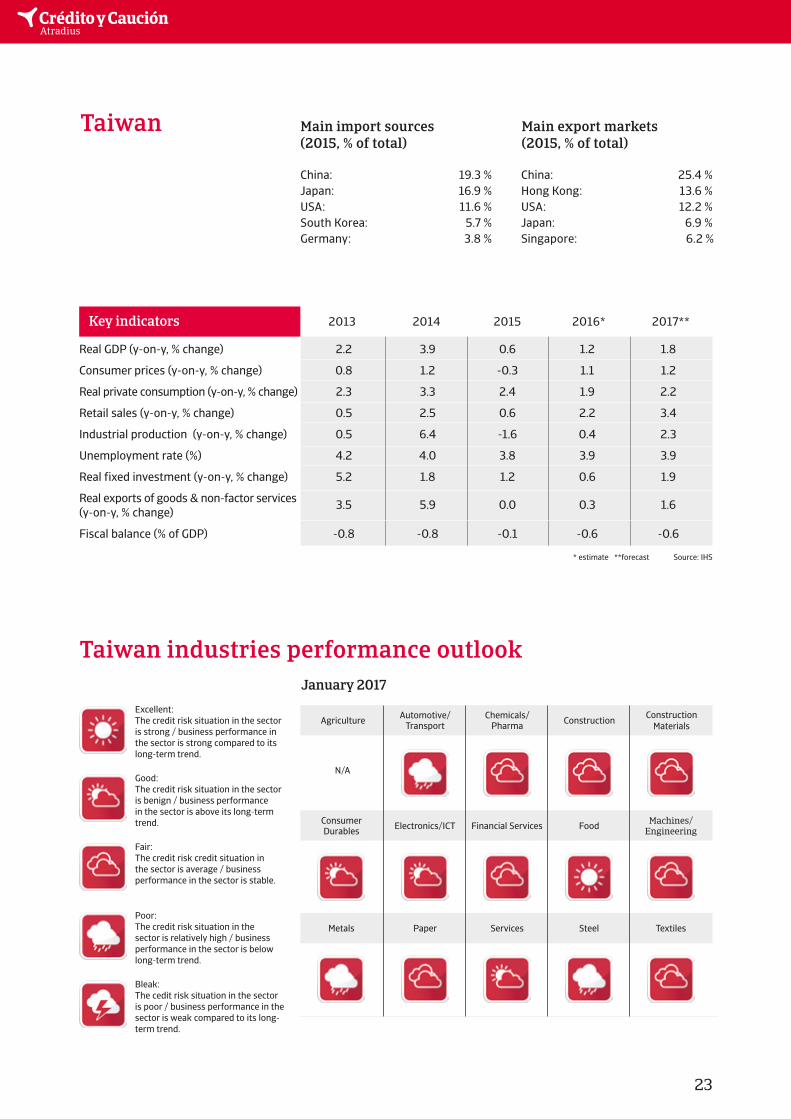
Key indicators 2013 2014 2015 2016* 2017**
Real GDP (y-on-y, % change) 2.2 3.9 0.6 1.2 1.8
Consumer prices (y-on-y, % change) 0.8 1.2 -0.3 1.1 1.2
Real private consumption (y-on-y, % change) 2.3 3.3 2.4 1.9 2.2
Retail sales (y-on-y, % change) 0.5 2.5 0.6 2.2 3.4
Industrial production (y-on-y, % change) 0.5 6.4 -1.6 0.4 2.3
Unemployment rate (%) 4.2 4.0 3.8 3.9 3.9
Real fixed investment (y-on-y, % change) 5.2 1.8 1.2 0.6 1.9
Real exports of goods & non-factor services 3.5 5.9 0.0 0.3 1.6(y-on-y, % change)
Fiscal balance (% of GDP) -0.8 -0.8 -0.1 -0.6 -0.6
* estimate **forecast Source: IHS
Taiwan Main import sources (2015, % of total)
Main export markets (2015, % of total)
Taiwan industries performance outlook
Agriculture
Electronics/ICT
Automotive/Transport
Financial Services
Chemicals/Pharma
Food
Construction
Machines/Engineering
ConstructionMaterials
ConsumerDurables
Paper Services Steel TextilesMetals
January 2017
China: 19.3 % China: 25.4 %Japan: 16.9 % Hong Kong: 13.6 %USA: 11.6 % USA: 12.2 % South Korea: 5.7 % Japan: 6.9 % Germany: 3.8 % Singapore: 6.2 %
N/A
24
Relationship with China remains the key issue in Taiwanese politics
Taiwan’s relationship with mainland China will remain the dominant political issue for the island. The political scene is polarised between pro-unification parties (KMT, PFP and New Party) and pro-independence parties, mainly the Democratic Progressive Party (DPP) and the DSU.
The mainland regards Taiwan as a ‘renegade province’ and has repeatedly threa-tened to invade the island in the event of a formal declaration of independence. After the DPP won the January 2016 presidential and general elections, Beijing has scaled down bilateral relations with the new, more pro-independence min-ded government.
Political situation
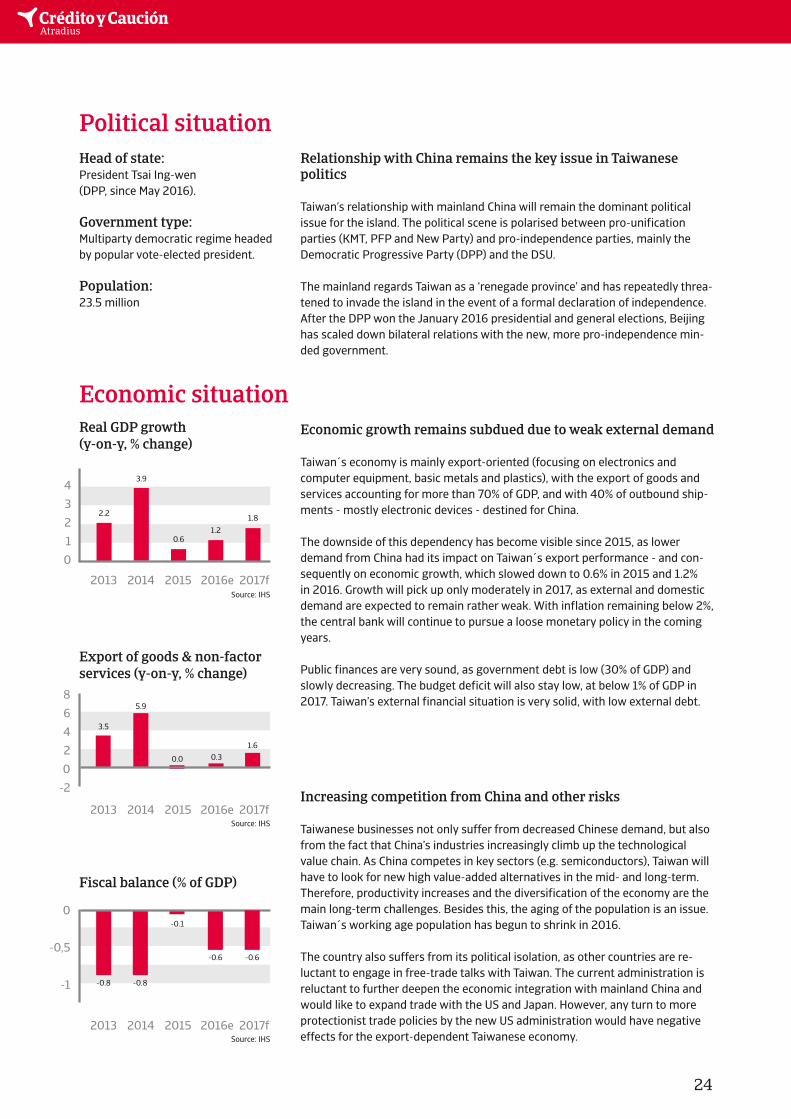
Economic growth remains subdued due to weak external demand
Taiwan´s economy is mainly export-oriented (focusing on electronics and computer equipment, basic metals and plastics), with the export of goods and services accounting for more than 70% of GDP, and with 40% of outbound ship-ments - mostly electronic devices - destined for China.
The downside of this dependency has become visible since 2015, as lower demand from China had its impact on Taiwan´s export performance - and con-sequently on economic growth, which slowed down to 0.6% in 2015 and 1.2% in 2016. Growth will pick up only moderately in 2017, as external and domestic demand are expected to remain rather weak. With inflation remaining below 2%, the central bank will continue to pursue a loose monetary policy in the coming years.
Public finances are very sound, as government debt is low (30% of GDP) and slowly decreasing. The budget deficit will also stay low, at below 1% of GDP in 2017. Taiwan’s external financial situation is very solid, with low external debt.
Increasing competition from China and other risks
Taiwanese businesses not only suffer from decreased Chinese demand, but also from the fact that China’s industries increasingly climb up the technological value chain. As China competes in key sectors (e.g. semiconductors), Taiwan will have to look for new high value-added alternatives in the mid- and long-term. Therefore, productivity increases and the diversification of the economy are the main long-term challenges. Besides this, the aging of the population is an issue. Taiwan´s working age population has begun to shrink in 2016.
The country also suffers from its political isolation, as other countries are re-luctant to engage in free-trade talks with Taiwan. The current administration is reluctant to further deepen the economic integration with mainland China and would like to expand trade with the US and Japan. However, any turn to more protectionist trade policies by the new US administration would have negative effects for the export-dependent Taiwanese economy.
Economic situation
4
3
2
1
0
2013 2014 2015 2016e 2017fSource: IHS
2.2
3.9
0.61.2
1.8
Real GDP growth (y-on-y, % change)
Head of state:President Tsai Ing-wen (DPP, since May 2016).
Government type:Multiparty democratic regime headed by popular vote-elected president.
Population:23.5 million
2013 2014 2015 2016e 2017fSource: IHS
Export of goods & non-factor services (y-on-y, % change)
8
6
4
2
0
-2
3.5
5.9
0.0
1.60.3
2013 2014 2015 2016e 2017fSource: IHS
Fiscal balance (% of GDP)
0
-0,5
-1 -0.8
-0.6
-0.1
-0.8
-0.6
Good:The credit risk situation in the sector is benign / business performance in the sector is above its long-term trend.
Fair:The credit risk credit situation in the sector is average / business performance in the sector is stable.
Poor: The credit risk situation in the sector is relatively high / business performance in the sector is below long-term trend.
Bleak:The cedit risk situation in the sector is poor / business performance in the sector is weak compared to its long-term trend.
Excellent:The credit risk situation in the sector is strong / business performance in the sector is strong compared to its long-term trend.
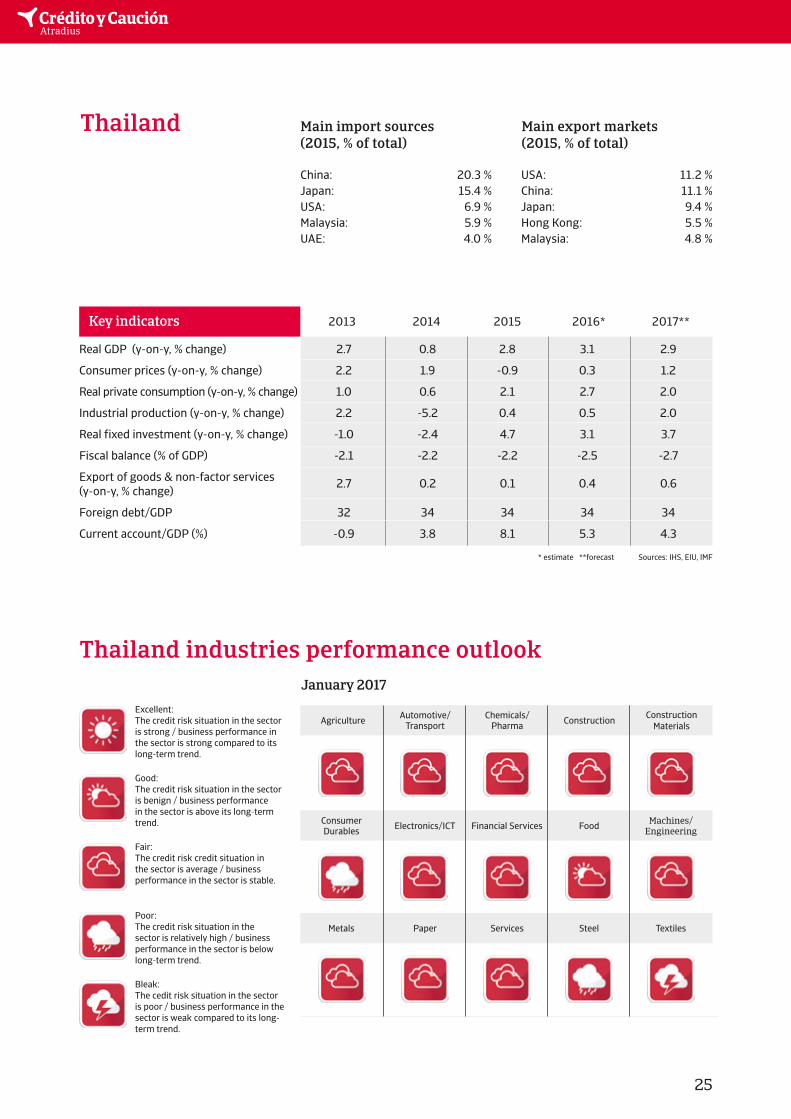
25
Key indicators 2013 2014 2015 2016* 2017**
Real GDP (y-on-y, % change) 2.7 0.8 2.8 3.1 2.9
Consumer prices (y-on-y, % change) 2.2 1.9 -0.9 0.3 1.2
Real private consumption (y-on-y, % change) 1.0 0.6 2.1 2.7 2.0
Industrial production (y-on-y, % change) 2.2 -5.2 0.4 0.5 2.0
Real fixed investment (y-on-y, % change) -1.0 -2.4 4.7 3.1 3.7
Fiscal balance (% of GDP) -2.1 -2.2 -2.2 -2.5 -2.7
Export of goods & non-factor services 2.7 0.2 0.1 0.4 0.6(y-on-y, % change)
Foreign debt/GDP 32 34 34 34 34
Current account/GDP (%) -0.9 3.8 8.1 5.3 4.3
* estimate **forecast Sources: IHS, EIU, IMF
Thailand Main import sources (2015, % of total)
Main export markets (2015, % of total)
Thailand industries performance outlook
Agriculture
Electronics/ICT
Automotive/Transport
Financial Services
Chemicals/Pharma
Food
Construction
Machines/Engineering
ConstructionMaterials
ConsumerDurables
Paper Services Steel TextilesMetals
January 2017
China: 20.3 % USA: 11.2 %Japan: 15.4 % China: 11.1 %USA: 6.9 % Japan: 9.4 % Malaysia: 5.9 % Hong Kong: 5.5 % UAE: 4.0 % Malaysia: 4.8 %
26
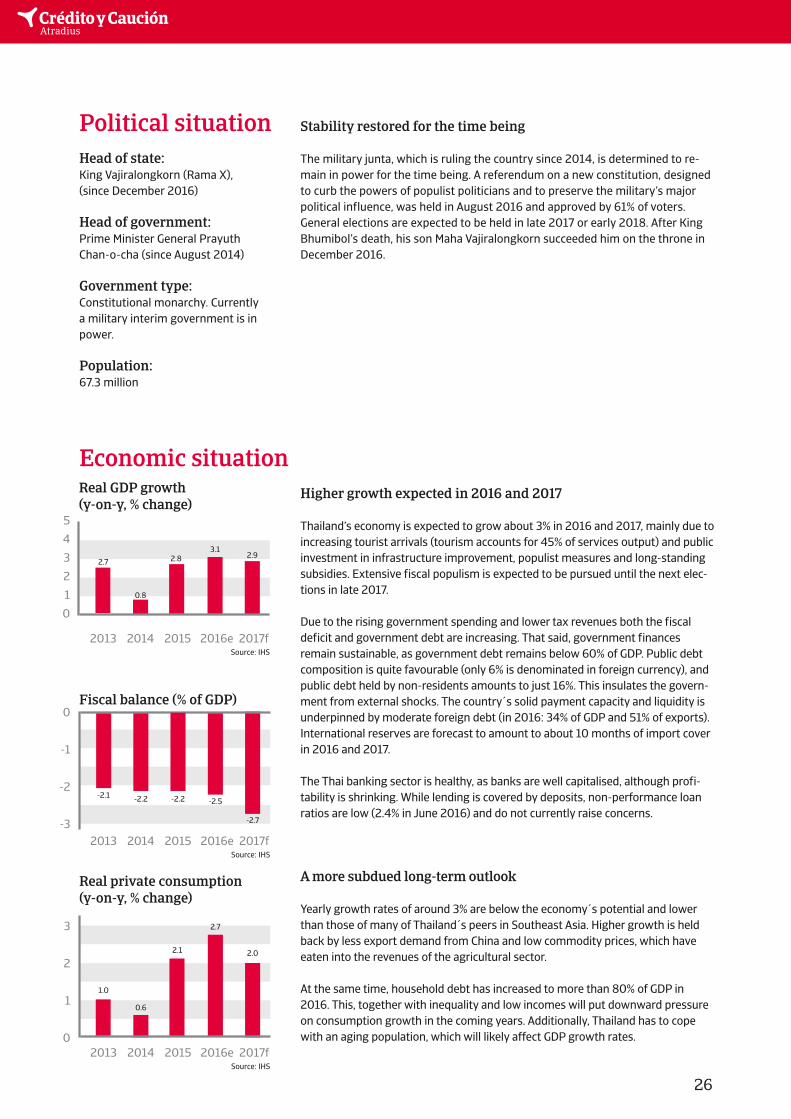
Stability restored for the time being
The military junta, which is ruling the country since 2014, is determined to re-main in power for the time being. A referendum on a new constitution, designed to curb the powers of populist politicians and to preserve the military’s major political influence, was held in August 2016 and approved by 61% of voters. General elections are expected to be held in late 2017 or early 2018. After King Bhumibol’s death, his son Maha Vajiralongkorn succeeded him on the throne in December 2016.
Political situation
Higher growth expected in 2016 and 2017
Thailand’s economy is expected to grow about 3% in 2016 and 2017, mainly due to increasing tourist arrivals (tourism accounts for 45% of services output) and public investment in infrastructure improvement, populist measures and long-standing subsidies. Extensive fiscal populism is expected to be pursued until the next elec-tions in late 2017.
Due to the rising government spending and lower tax revenues both the fiscal deficit and government debt are increasing. That said, government finances remain sustainable, as government debt remains below 60% of GDP. Public debt composition is quite favourable (only 6% is denominated in foreign currency), and public debt held by non-residents amounts to just 16%. This insulates the govern-ment from external shocks. The country´s solid payment capacity and liquidity is underpinned by moderate foreign debt (in 2016: 34% of GDP and 51% of exports). International reserves are forecast to amount to about 10 months of import cover in 2016 and 2017.
The Thai banking sector is healthy, as banks are well capitalised, although profi-tability is shrinking. While lending is covered by deposits, non-performance loan ratios are low (2.4% in June 2016) and do not currently raise concerns.
A more subdued long-term outlook
Yearly growth rates of around 3% are below the economy´s potential and lower than those of many of Thailand´s peers in Southeast Asia. Higher growth is held back by less export demand from China and low commodity prices, which have eaten into the revenues of the agricultural sector.
At the same time, household debt has increased to more than 80% of GDP in 2016. This, together with inequality and low incomes will put downward pressure on consumption growth in the coming years. Additionally, Thailand has to cope with an aging population, which will likely affect GDP growth rates.
Economic situation
Head of state:King Vajiralongkorn (Rama X),(since December 2016)
Head of government:Prime Minister General Prayuth Chan-o-cha (since August 2014)
Government type:Constitutional monarchy. Currently a military interim government is in power.
Population:67.3 million
2013 2014 2015 2016e 2017fSource: IHS
Fiscal balance (% of GDP)0
-1
-2
-3
-2.1 -2.2 -2.5
-2.7
-2.2
2013 2014 2015 2016e 2017fSource: IHS
Real private consumption (y-on-y, % change)
3
2
1
0
0.6
2.7
2.1 2.0
1.0
2013 2014 2015 2016e 2017fSource: IHS
Real GDP growth (y-on-y, % change)
5
4
3
2
1
0
0.8
3.12.8 2.9
2.7
27
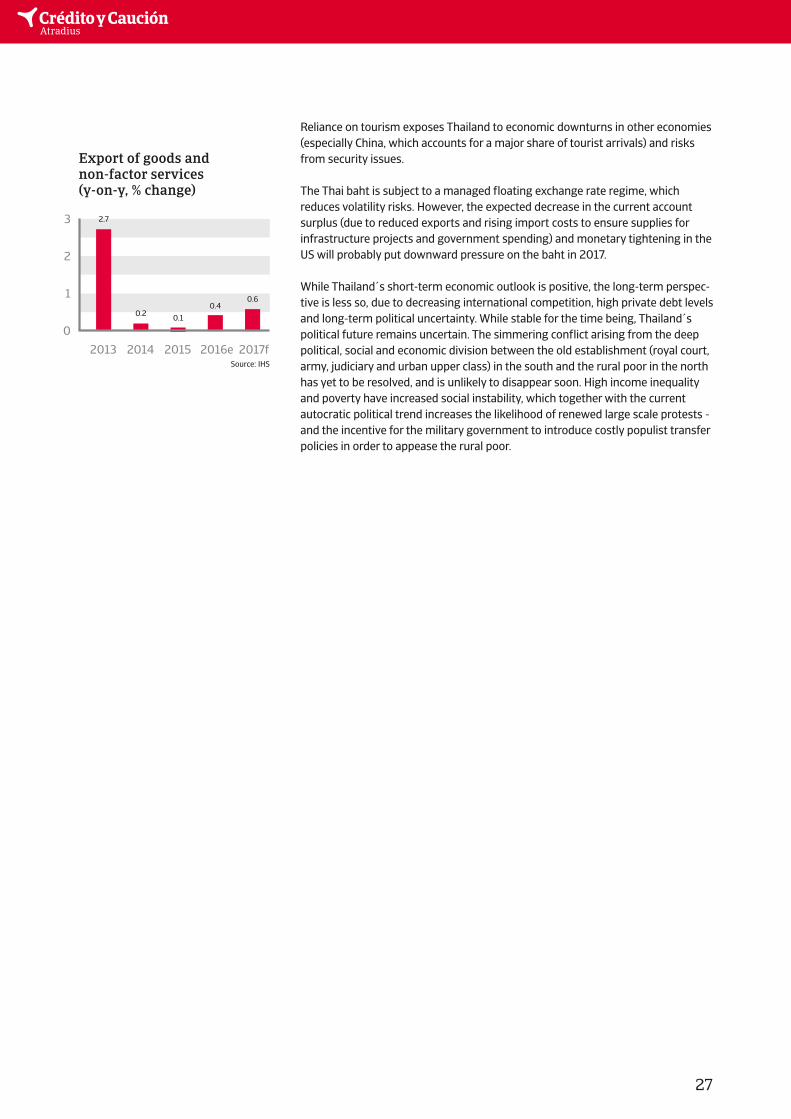
Reliance on tourism exposes Thailand to economic downturns in other economies (especially China, which accounts for a major share of tourist arrivals) and risks from security issues.
The Thai baht is subject to a managed floating exchange rate regime, which reduces volatility risks. However, the expected decrease in the current account surplus (due to reduced exports and rising import costs to ensure supplies for infrastructure projects and government spending) and monetary tightening in the US will probably put downward pressure on the baht in 2017.
While Thailand´s short-term economic outlook is positive, the long-term perspec-tive is less so, due to decreasing international competition, high private debt levels and long-term political uncertainty. While stable for the time being, Thailand´s political future remains uncertain. The simmering conflict arising from the deep political, social and economic division between the old establishment (royal court, army, judiciary and urban upper class) in the south and the rural poor in the north has yet to be resolved, and is unlikely to disappear soon. High income inequality and poverty have increased social instability, which together with the current autocratic political trend increases the likelihood of renewed large scale protests - and the incentive for the military government to introduce costly populist transfer policies in order to appease the rural poor.
3
2
1
0
2013 2014 2015 2016e 2017fSource: IHS
2.7
0.2 0.10.4
0.6
Export of goods and non-factor services (y-on-y, % change)
Good:The credit risk situation in the sector is benign / business performance in the sector is above its long-term trend.
Fair:The credit risk credit situation in the sector is average / business performance in the sector is stable.
Poor: The credit risk situation in the sector is relatively high / business performance in the sector is below long-term trend.
Bleak:The cedit risk situation in the sector is poor / business performance in the sector is weak compared to its long-term trend.
Excellent:The credit risk situation in the sector is strong / business performance in the sector is strong compared to its long-term trend.
28
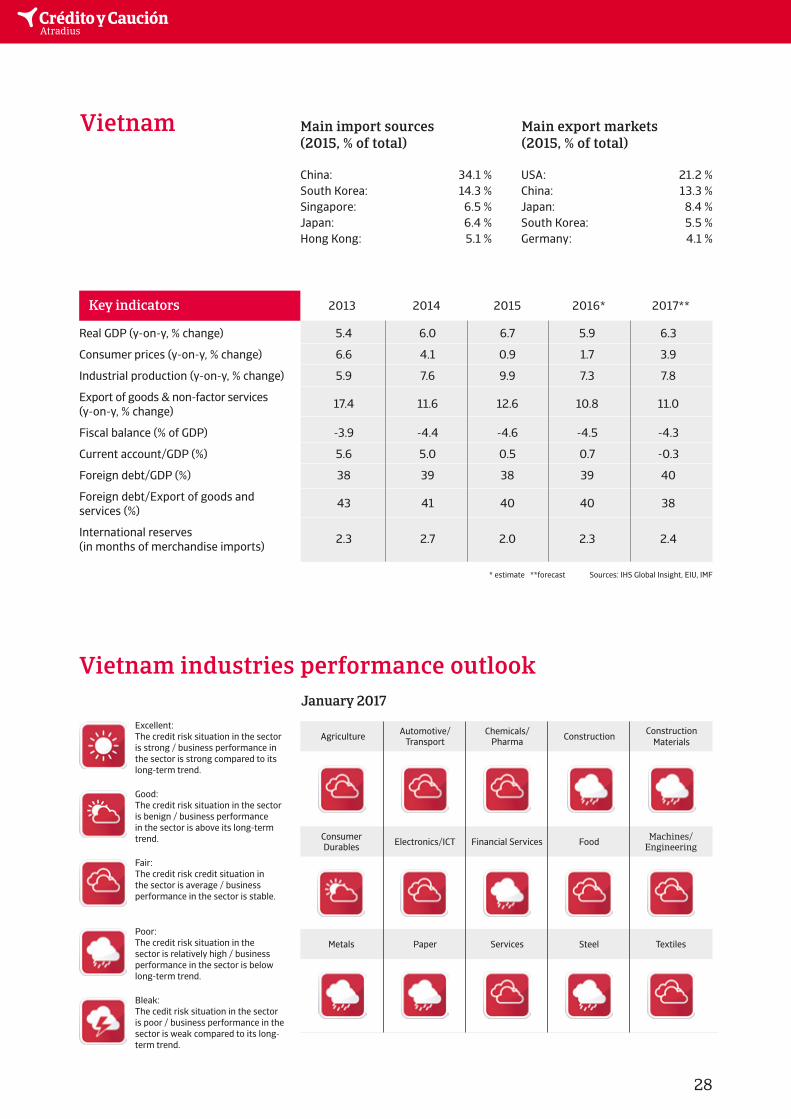
Key indicators 2013 2014 2015 2016* 2017**
Real GDP (y-on-y, % change) 5.4 6.0 6.7 5.9 6.3
Consumer prices (y-on-y, % change) 6.6 4.1 0.9 1.7 3.9
Industrial production (y-on-y, % change) 5.9 7.6 9.9 7.3 7.8
Export of goods & non-factor services 17.4 11.6 12.6 10.8 11.0(y-on-y, % change)
Fiscal balance (% of GDP) -3.9 -4.4 -4.6 -4.5 -4.3
Current account/GDP (%) 5.6 5.0 0.5 0.7 -0.3
Foreign debt/GDP (%) 38 39 38 39 40
Foreign debt/Export of goods and 43 41 40 40 38services (%)
International reserves 2.3 2.7 2.0 2.3 2.4(in months of merchandise imports)
* estimate **forecast Sources: IHS Global Insight, EIU, IMF
Vietnam Main import sources (2015, % of total)
Main export markets (2015, % of total)
Vietnam industries performance outlook
Agriculture
Electronics/ICT
Automotive/Transport
Financial Services
Chemicals/Pharma
Food
Construction
Machines/Engineering
ConstructionMaterials
ConsumerDurables
Paper Services Steel TextilesMetals
January 2017
China: 34.1 % USA: 21.2 %South Korea: 14.3 % China: 13.3 %Singapore: 6.5 % Japan: 8.4 % Japan: 6.4 % South Korea: 5.5 % Hong Kong: 5.1 % Germany: 4.1 %
29
Economic reforms not followed by political changes
The Vietnamese Communist Party remains firmly in power, despite rising public discontent over the lack of personal freedom, government corruption and land seizures by the administration. At the Communist Party’s five-yearly congress in January 2016 the conservative faction within the party seems to have gained more influence. While the new leadership has tightened its grip on the civil society, economic reforms continue.
The territorial dispute with China over conflicting claims in the South China Sea remains a serious issue in the bilateral relationship. In order to counter growing Chinese assertiveness, Vietnam is keen to improve its political and security cooperation with the US and Japan. However, Vietnam lacks the military capability to pose a serious challenge to Chinese actions, and its manufacturing sector depends heavily on raw materials imported from China. Moreover, given the ideological similarities of the regimes in both countries, there is still a strong pro-China faction within Vietnam’s Communist Party.
Political situation
High growth and inflation back under control
Since the early 1990s the government has been very open to international trade and investment. Foreign direct investment in Vietnam reached a record level in 2015, and foreign investors are responsible for about 25% of annual capital spending. Trade accounts for about 150% of national output.
Real GDP growth is expected to increase above 6% in 2017, as agricultural output is picking up again after a drought and exports will grow further, since Chinese merchandise is being substituted by cheaper Vietnamese products. Pri-vate consumption growth is supported by low inflation, low local interest rates and rising wages.
The persistently high inflation (with double-digit rates in 2010 and 2011) has, since 2013, finally decreased, enabling the central bank to lower the benchmark interest rate to the current rate of 6.5%. Inflation is expected to increase mo-destly in 2017 as the dong continues to depreciate and food prices rise.
Fiscal consolidation will progress only gradually with the budget deficit expected to remain at around 4.5% of GDP in the near term. Increasing tax receipts are counterbalancing infrastructure investments and growing welfare costs. Access to credit in order to fund these deficits is not a short-term concern. Government debt is forecast at around 55% of GDP in 2017.
Economic situation
8
6
4
2
0
2013 2014 2015 2016e 2017fSource: IHS
5.46.0
6.75.9 6.3
Real GDP growth (y-on-y, % change)
Head of state:President Tran Dai Quang (since April 2016)
Head of government:Prime Minister Nguyen Xuan Phuc (since April 2016)
Government type:Communist state with an increasingly market orientated economy.
Population:95.2 million
2013 2014 2015 2016e 2017fSource: IHS
Consumer prices (y-on-y, % change)
10
8
6
4
2
0
4.1
1.70.9
3.9
6.6
30
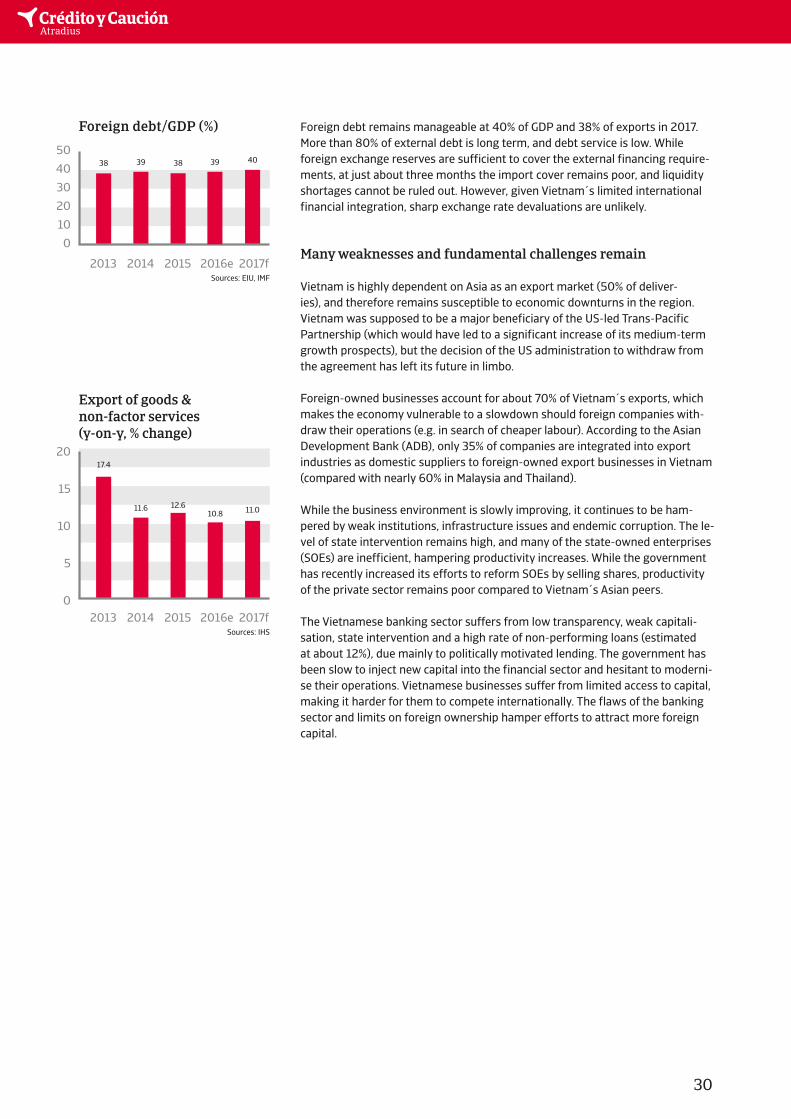
Foreign debt remains manageable at 40% of GDP and 38% of exports in 2017. More than 80% of external debt is long term, and debt service is low. While foreign exchange reserves are sufficient to cover the external financing require-ments, at just about three months the import cover remains poor, and liquidity shortages cannot be ruled out. However, given Vietnam´s limited international financial integration, sharp exchange rate devaluations are unlikely.
Many weaknesses and fundamental challenges remain
Vietnam is highly dependent on Asia as an export market (50% of deliver-ies), and therefore remains susceptible to economic downturns in the region. Vietnam was supposed to be a major beneficiary of the US-led Trans-Pacific Partnership (which would have led to a significant increase of its medium-term growth prospects), but the decision of the US administration to withdraw from the agreement has left its future in limbo.
Foreign-owned businesses account for about 70% of Vietnam´s exports, which makes the economy vulnerable to a slowdown should foreign companies with-draw their operations (e.g. in search of cheaper labour). According to the Asian Development Bank (ADB), only 35% of companies are integrated into export industries as domestic suppliers to foreign-owned export businesses in Vietnam (compared with nearly 60% in Malaysia and Thailand).
While the business environment is slowly improving, it continues to be ham-pered by weak institutions, infrastructure issues and endemic corruption. The le-vel of state intervention remains high, and many of the state-owned enterprises (SOEs) are inefficient, hampering productivity increases. While the government has recently increased its efforts to reform SOEs by selling shares, productivity of the private sector remains poor compared to Vietnam´s Asian peers.
The Vietnamese banking sector suffers from low transparency, weak capitali-sation, state intervention and a high rate of non-performing loans (estimated at about 12%), due mainly to politically motivated lending. The government has been slow to inject new capital into the financial sector and hesitant to moderni-se their operations. Vietnamese businesses suffer from limited access to capital, making it harder for them to compete internationally. The flaws of the banking sector and limits on foreign ownership hamper efforts to attract more foreign capital.
50
40
30
20
10
0
2013 2014 2015 2016e 2017fSources: EIU, IMF
38 39 38 40
Foreign debt/GDP (%)
Export of goods & non-factor services (y-on-y, % change)
20
15
10
5
02013 2014 2015 2016e 2017f
Sources: IHS
17.4
11.6 12.6 11.0
39
10.8
Disclaimer
This report is provided for information purposes only and is not intended as a recommendation as to particular transactions, investments or strategies in any way to any reader. Readers must make their own independent decisions, commercial or otherwise, regarding the information provided. While we have made every attempt to ensure that the information contained in this report has been obtained from reliable sources, Atradius is not responsible for any errors or omissions, or for the results obtained from the use of this information. All information in this report is provided ’as is’, with no guarantee of completeness, accuracy, timeliness or of the results obtained from its use, and without warranty of any kind, express or implied. In no event will Atradius, its related partnerships or corporations, or the partners, agents or employees thereof, be liable to you or anyone else for any decision made or action taken in reliance on the information in this report or for any consequential, special or similar damages, even if advised of the possibility of such damages.
Copyright Atradius N.V. 2017
Paseo de la Castellana, 4
28046 Madrid
T. +34 914 326 300
F. +34 914 326 501
creditoycaucion.es