Embed Size (px)
Citation preview

This Report is in conformity with the format as per the Securitiesand Exchange Board of India (Annual Report) Rules, 1994,
notifi ed in Offi cial Gaze� e on April 7, 1994


MEMBERS OF THE BOARD(As on March 31, 2014)
Appointed under Section 4(1) (a) of the SEBI Act, 1992 (15 of 1992)
U. K. SINHACHAIRMAN
Appointed under Section 4(1) (d) of the SEBI Act, 1992 (15 of 1992) PRASHANT SARANWHOLE TIME MEMBER
RAJEEV K. AGARWALWHOLE TIME MEMBER
S. RAMANWHOLE TIME MEMBER
P. C. CHHOTARAYPART TIME MEMBER
Nominated under Section 4(1) (b) of the SEBI Act, 1992 (15 of 1992)
DR. ARVIND MAYARAMFinance SecretaryMinistry of FinanceGovernment of India
NAVED MASOODSecretaryMinistry of Corporate Aff airsGovernment of India

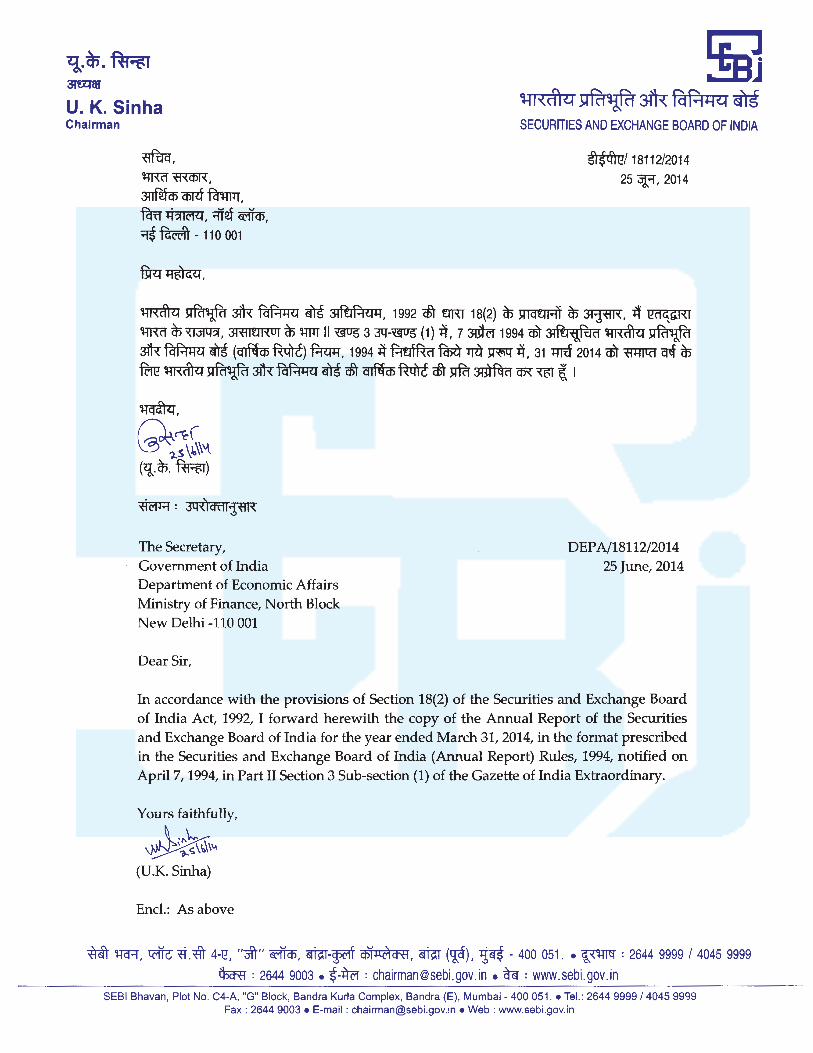
MEMBERS OF THE SEBI BOARD(As on March 31, 2014)
U. K. SINHAChairman
PRASHANT SARANWhole Time Member
RAJEEV K. AGARWALWhole Time Member
S. RAMANWhole Time Member
P. C. CHHOTARAYPart Time Member
DR. ARVIND MAYARAMFinance Secretary
Ministry of FinanceGovernment of India
NAVED MASOODSecretary
Ministry of Corporate Aff airsGovernment of India

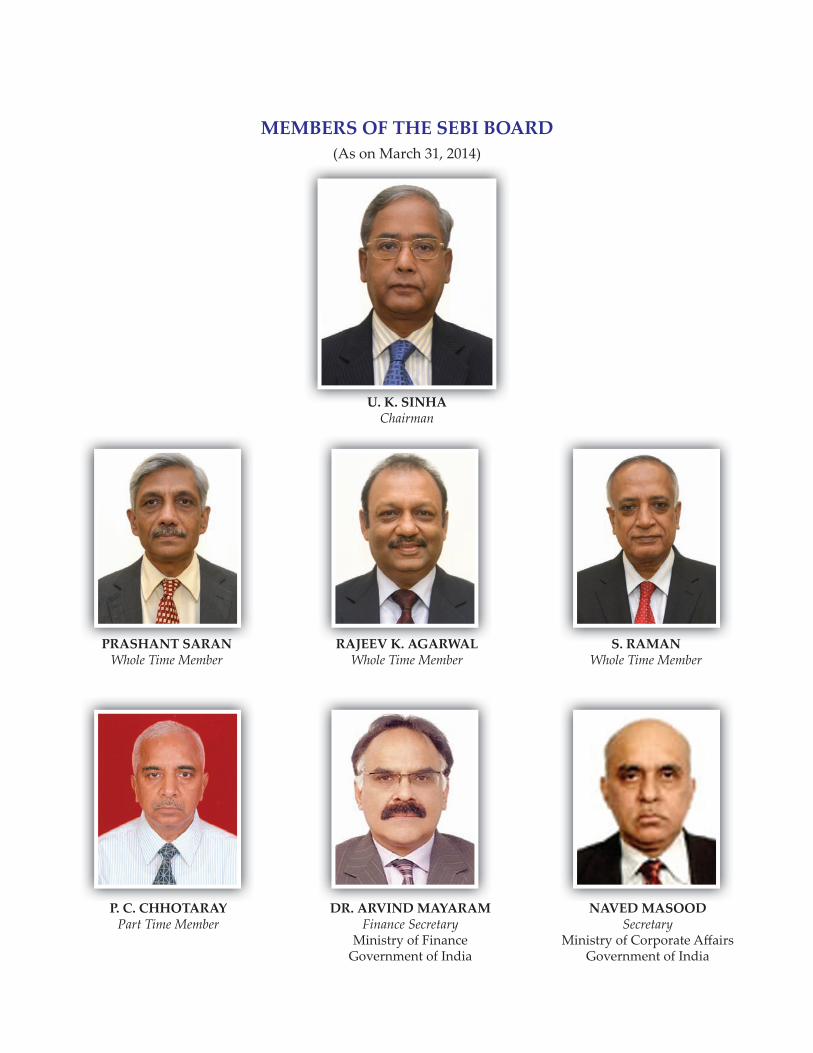
CHAIRMAN, WHOLE TIME MEMBERS AND EXECUTIVE DIRECTORS
Left to Right :
Sitting : Shri S. Raman, Whole Time Member; Shri Prashant Saran, Whole Time Member; Shri U K Sinha, Chairman; Shri Rajeev K Agarwal, Whole Time Member.
Standing : Shri Ananta Barua, Executive Director; Shri R K Padmanabhan, Executive Director; Shri J Ranganayakulu, Executive Director; Shri SVMD Rao, Executive Director; Shri S. Ravindran, Executive Director; Shri Gyan Bhushan, Executive Director; Shri P K Nagpal, Executive Director;


i
CONTENTS
List of Boxes ...............................................................................................................................................vi
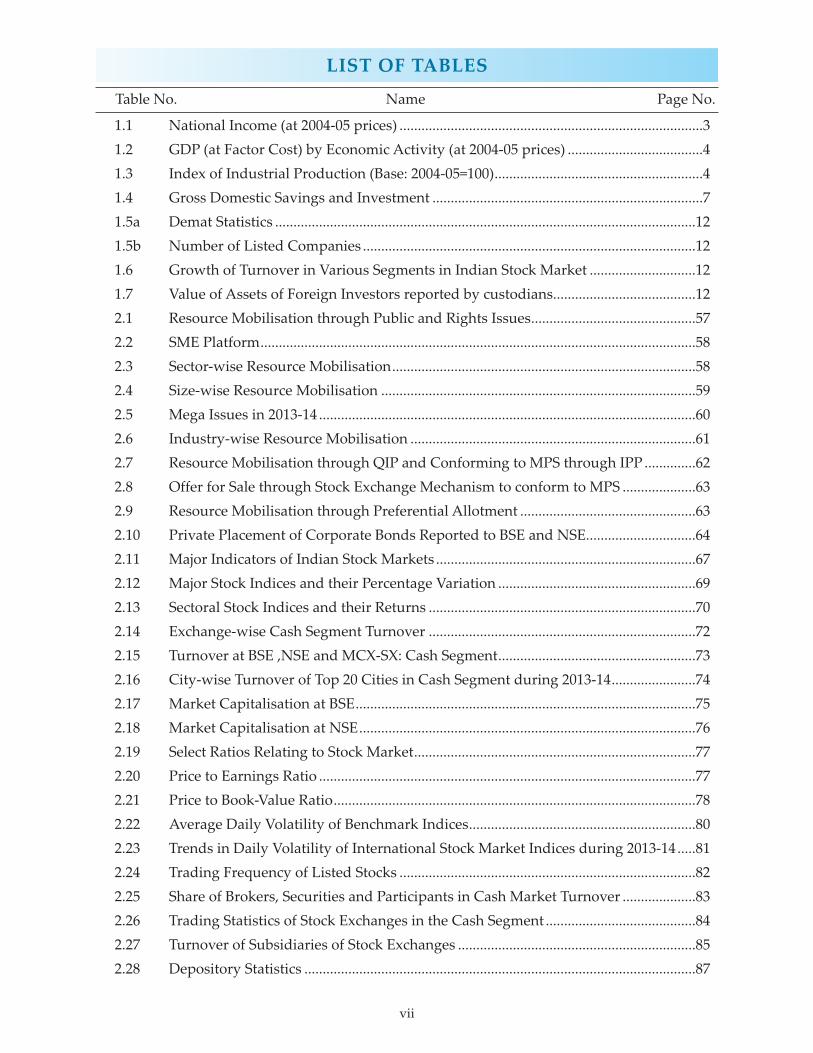
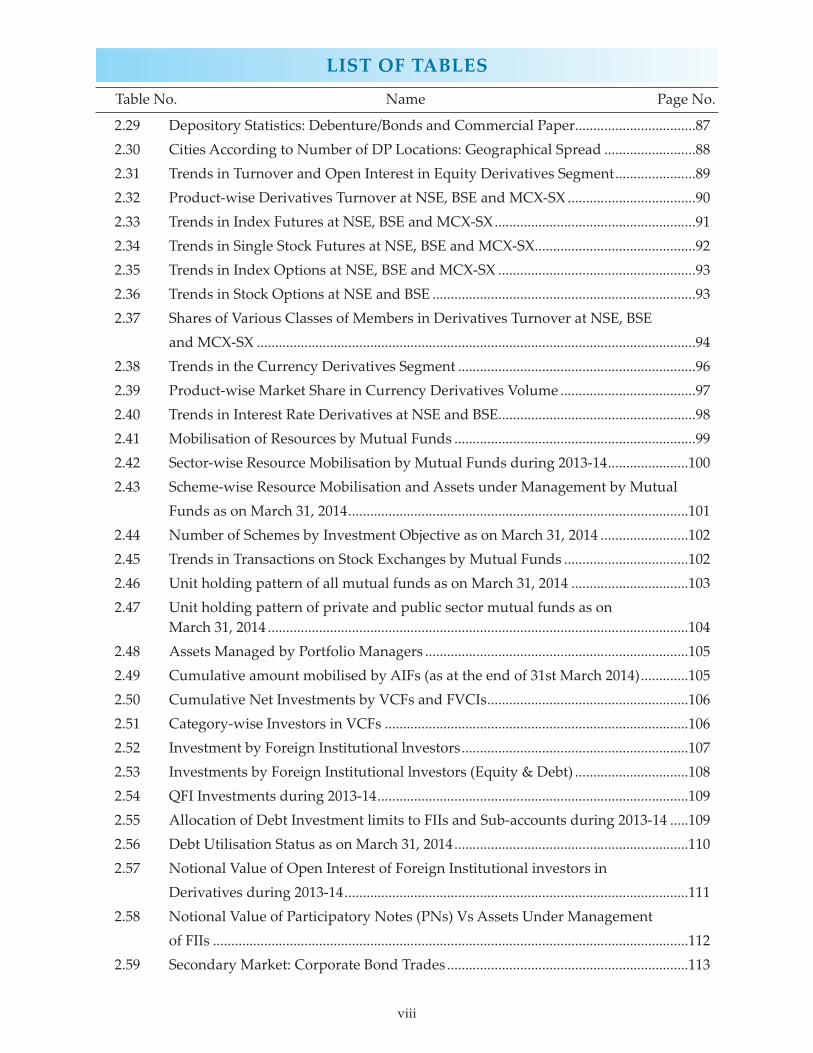
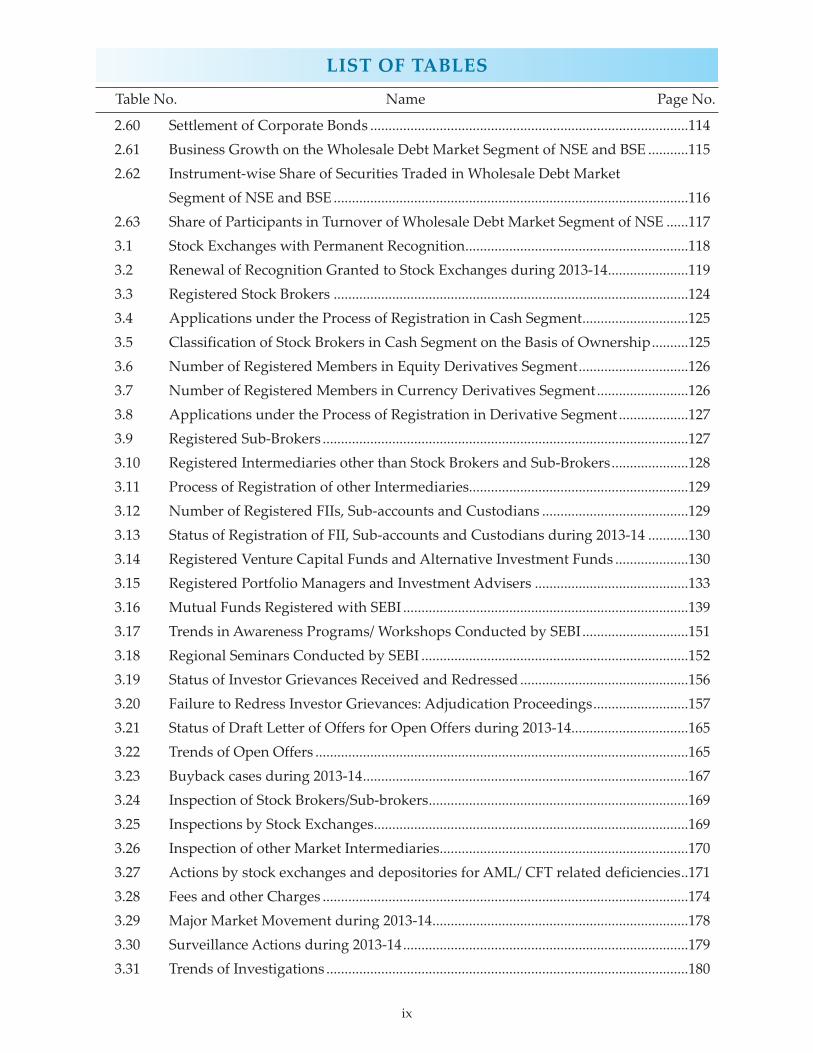
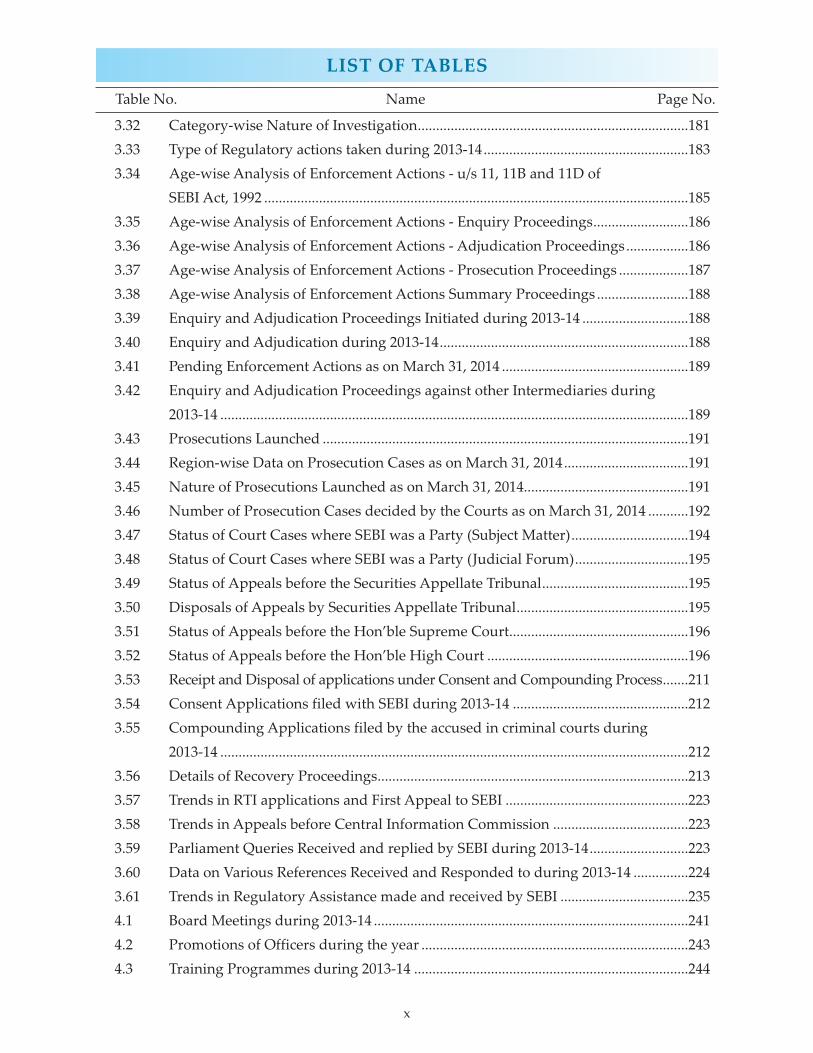
List of Tables ............................................................................................................................................ vii
List of Charts ..............................................................................................................................................xi
Abbreviations ...........................................................................................................................................xii
PART ONE: POLICIES AND PROGRAMMES
1. REVIEW OF THE GENERAL MACRO-ECONOMIC ENVIRONMENT AND THE INVESTMENT CLIMATE .............................................................................................................. 1
2. REVIEW OF POLICIES AND PROGRAMMES
I. Primary Securities Market ................................................................................................... 13
II. Secondary Securities Market............................................................................................... 20
III. Mutual Funds ........................................................................................................................ 36
IV. Intermediaries Associated with Securities Market .......................................................... 38
V. Foreign Institutional Investment ........................................................................................ 43
VI. Other Policies and Programmes having a bearing on the working of Securities Market .................................................................................................................. 46
VII. Assessment and Prospects .................................................................................................. 51
PART TWO: REVIEW OF WORKING AND OPERATIONS OF THE SECURITIES AND EXCHANGE BOARD OF INDIA IN THE SECURITIES MARKET
1. PRIMARY SECURITIES MARKET
I. Resource Mobilisation through Public and Rights Issues .............................................. 56
II. Resource Mobilisation through QIP and IPP ................................................................... 61
III. Resource Mobilisation through Preferential Allotment .................................................. 63
IV. Resource Mobilisation through Private Placement in Corporate Debt ........................ 64
2. SECONDARY SECURITIES MARKET
I. Equity Market ....................................................................................................................... 65
II. Performance of Major Stock Indices and Sectoral Indices .............................................. 69
III. Turnover in Indian Stock Market ....................................................................................... 71
IV. Market Capitalisation .......................................................................................................... 75
V. Stock Market Indicators ....................................................................................................... 76
VI. Volatility in Stock Markets .................................................................................................. 79
VII. Trading Frequency ............................................................................................................... 82
Page No.
ii
VIII. Activities of Stock Exchanges ............................................................................................. 83
IX. Dematerialisation ................................................................................................................. 86
X. Derivatives Segment ............................................................................................................ 88
3. MUTUAL FUNDS .......................................................................................................................... 98
4. INTERMEDIARIES ASSOCIATED WITH SECURITIES MARKET.. ............................... 104
I. Portfolio Managers ............................................................................................................. 104
II. Alternative Investment Funds .......................................................................................... 105
5. FOREIGN INSTITUTIONAL INVESTMENT ....................................................................... 106
6. OTHER ACTIVITIES HAVING A BEARING ON THE WORKING OF SECURITIES MARKET ........................................................................................................................................ 112
I. Corporate Bond Market ..................................................................................................... 112
II. Wholesale Debt Market ..................................................................................................... 115
PART THREE: FUNCTIONS OF SEBI IN RESPECT OF MATTERS SPECIFIED IN SECTION 11 OF SEBI ACT, 1992
1. REGULATION OF BUSINESS IN STOCK EXCHANGES .................................................. 118
I. Recognition of Stock Exchanges ....................................................................................... 118
II. Trading and Settlement Practices at Stock Exchanges .................................................. 119
III. Memorandum of Understanding (MoU) between Stock Exchanges .......................... 120
IV. Steps taken by SEBI to ring-fence MCX-SX .................................................................... 120
V. Exit of Stock Exchange ....................................................................................................... 121
VI. Measures adopted for Regulation of Stock Exchanges ................................................. 122
2. REGISTRATION AND REGULATION OF WORKING OF INTERMEDIARIES ASSOCIATED WITH THE SECURITIES MARKET ............................................................ 122
I. Streamlining the Process of Initial / Permanent Registration of Intermediaries ....... 123
II. Measures for Regulation of Intermediaries .................................................................... 124
III. Registration of Stock Brokers ............................................................................................ 124
IV. Registration of Sub-brokers .............................................................................................. 127
V. Registration of Other Intermediaries ............................................................................... 128
VI. Registration of Foreign Institutional Investors, Sub-Accounts and Custodians ....... 129
VII. Registration of Venture Capital Funds and Alternative Investment Funds .............. 130
VIII. Registration of Portfolio Managers and Investment Advisers ..................................... 133
CONTENTS
Page No.
iii
3. REGISTRATION AND REGULATION OF WORKING OF COLLECTIVE INVESTMENT SCHEMES INCLUDING MUTUAL FUNDS ............................................ 134
I. Registration of Collective Investment Schemes ............................................................. 134
II. Inspection of Collective Investment Schemes ................................................................ 134
III. Regulatory actions against Collective Investment Schemes ........................................ 134
IV. Registration and Regulation of Mutual Funds............................................................... 139
4. PROMOTION AND REGULATION OF SELF REGULATORY ORGANISATIONS .... 140
5. FRAUDULENT AND UNFAIR TRADE PRACTICES .......................................................... 140 I. Types of fraudulent and unfair trade practices .............................................................. 140
II. Fraudulent and unfair trade practices cases during 2013-14 ....................................... 141
III. Steps taken to prevent the occurrence of fraudulent and unfair trade practices ...... 150
6. INVESTOR EDUCATION AND TRAINING OF INTERMEDIARIES ............................ 151
I. Investor Education ............................................................................................................. 151
II. Training of Intermediaries ................................................................................................. 152
III. Financial Education ............................................................................................................ 154
IV. Investor Grievance Redressal ........................................................................................... 156
V. Regulatory action against companies and their directors for non-redressal of investor grievances ............................................................................................................. 157
VI. Issuance of No-objection Certificate ................................................................................ 157
7. PROHIBITION OF INSIDER TRADING ............................................................................... 158
I. Types of Insider trading practices .................................................................................... 158
II. Insider trading cases during 2013-14 ............................................................................... 158
III. Steps initiated to curb Insider Trading practices ........................................................... 164
8. SUBSTANTIAL ACQUISITION OF SHARES AND TAKEOVERS .................................. 164
I. Open Offer ........................................................................................................................... 164
II. Buyback ................................................................................................................................ 166
9. INFORMATION CALLED FROM, INSPECTION UNDERTAKEN, INQUIRIES AND AUDIT OF STOCK EXCHANGES AND INTERMEDIARIES AND SELF REGULATING ORGANISATIONS CONDUCTED BY SEBI ............................................ 167
I. Inspection of Stock Exchanges, Depositories and Clearing Corporations ................. 167
II. Inspection of Market Intermediaries……..………..………..………..………..… ......... 168
III. Prevention of Money Laundering .................................................................................... 170
CONTENTS
Page No.
iv
10. DELEGATED POWERS AND FUNCTIONS .......................................................................... 172
11. FEES AND OTHER CHARGES................................................................................................. 173
12. RESEARCH AND STUDIES ...................................................................................................... 175
I. Research Activities ............................................................................................................. 175
II. Systemic Stability Unit ...................................................................................................... 175
III. Academic Interactions ....................................................................................................... 176
IV. International Research Conference .................................................................................. 176
V. New Research Initiatives ................................................................................................... 176
13. OTHER FUNCTIONS ................................................................................................................. 177
I. Surveillance ......................................................................................................................... 177
II. Investigation ........................................................................................................................ 179
III. Enforcement of Regulations .............................................................................................. 184
IV. Prosecution .......................................................................................................................... 191
V. Litigations, Appeals and Court Pronouncements ......................................................... 194
VI. Consent and Compounding ............................................................................................. 211
VII. The Recovery Proceedings ................................................................................................ 212
VIII. Regulatory Changes ........................................................................................................... 213
IX. Right To Information Act, 2005......................................................................................... 221
X. Parliament Questions ......................................................................................................... 223
XI International Co-operation ............................................................................................... 224
XII. National Institute of Securities Markets .......................................................................... 237
PART FOUR: ORGANISATIONAL MATTERS OF SEBI
1. SEBI BOARD ................................................................................................................................. 241
2. AUDIT COMMITTEE ................................................................................................................. 241
3. ORGANISATION RESTRUCTURING CELL AND PROJECT MANAGEMENT OFFICE ........................................................................................................................................... 242
4. HUMAN RESOURCES ............................................................................................................... 242
I. Staff Strength, Recruitment, Resignation ........................................................................ 243
II. Benefits ................................................................................................................................. 243
III. Promotions .......................................................................................................................... 243
IV. Strengthening of Regional/Local Offices ........................................................................ 243
CONTENTS
Page No.
v
V. Job Rotation ......................................................................................................................... 243
VI. Disciplinary Matters ........................................................................................................... 243
VII. Training and Development ............................................................................................... 244
VIII. Internship............................................................................................................................. 244
IX. Extracurricular activities within SEBI ............................................................................. 245
X. Initiatives in the realm of corporate social responsibility ............................................ 245
XI. Scheme for recognizing and rewarding academic excellence of children of employees ............................................................................................................................ 245
5. PROMOTION OF OFFICIAL LANGUAGE ........................................................................... 245
I. Bilingualisation ................................................................................................................... 245
II. Rajbhasha Competitions .................................................................................................... 245
III. Aaj Ka Shabd ...................................................................................................................... 245
IV. Hindi Noting and Hindi Quotes ..................................................................................... 246
V. Incentive Schemes .............................................................................................................. 246
VI. Hindi Workshops ............................................................................................................... 246
VII. Rajbhasha Meetings and Seminars .................................................................................. 246
VIII. Investor Website and SCORES ........................................................................................ 246
IX. Regional Offices .................................................................................................................. 246
6. LOCAL OFFICES…….…….…….…….…….…….…….…….…….…….…….…................... 246
7. FACILITIES MANAGEMENT…….…….…….…….…….…….…….…….……. .................. 247
8. VIGILANCE CELL…….…….…….…….…….…….…….…….…….…….…….... ................. 247
9. INFORMATION TECHNOLOGY ............................................................................................ 247
I. Implementation of unified communication and up-gradation of SEBI Network ..... 247
II. Disaster Recovery Drill ...................................................................................................... 248
III. Software for Investigation Department ........................................................................... 248
IV. Connectivity to local offices .............................................................................................. 248
V. CIS Complaint System ....................................................................................................... 248
VI. System for managing Resource Persons ......................................................................... 248
VII. Software development for Recovery Division ............................................................... 248
VIII. Implementation of Centralised Biometric Attendance System ................................... 248
CHRONOLOGY OF MAJOR POLICY INITIATIVES BY SEBI ................................................. 249
CONTENTS
Page No.

vi
LIST OF BOXES
Box No. Name Page No.
1.1 Compliance with Minimum Public Shareholding Requirement ...........................................16
1.2 Powers conferred on SEBI vide the Securities Laws (Amendment) Ordinance, 2014 ........19
1.3 Institutional Trading Platform.....................................................................................................21
1.4 Exchange Traded Cash Settled Interest Rate Futures (IRF) on 10 year Government of India Security ...........................................................................................................................................22
1.5 Monetary relief from Investor Protection Fund (IPF) for investors .......................................24
1.6 International Research Conference on HFT, Algo and Co-location .......................................25
1.7 Principles of Financial Market Infrastructures (PFMIs) ..........................................................27
1.8 Third Meeting of the International Advisory Board of SEBI ..................................................35
1.9 Standardization and Simplification of Procedures for Transmission of Securities .............39
1.10 Foreign Portfolio Investor (FPI) Regime ....................................................................................43
2.1 Testing of software used in or related to trading and risk management ..............................86
3.1 Standard Operating Procedure (SOP) for stock exchanges for suspension and revocation of trading of shares of listed entities for non-compliance of certain listing conditions ....122
3.2 Simplification of Registration Requirements for Stock Brokers ...........................................123
3.3 SEBI (Alternative Investment Funds) Regulations, 2012 .......................................................130
3.4 SEBI (Investment Advisers) Regulations, 2013 .......................................................................133
3.5 IOSCO’s Asia-Pacific Regional Committee Meeting, New Delhi .........................................226
3.6 Conference on Investor Protection in Capital Markets .........................................................231
3.7 Asian Roundtable and SEBI-OECD Conference on Corporate Governance in Mumbai - February, 2014 ...........................................................................................................234
vii
LIST OF TABLES
Table No. Name Page No.
1.1 National Income (at 2004-05 prices) ...................................................................................31.2 GDP (at Factor Cost) by Economic Activity (at 2004-05 prices) .....................................4 1.3 Index of Industrial Production (Base: 2004-05=100) .........................................................4 1.4 Gross Domestic Savings and Investment ..........................................................................7 1.5a Demat Statistics ...................................................................................................................12 1.5b Number of Listed Companies ...........................................................................................12 1.6 Growth of Turnover in Various Segments in Indian Stock Market .............................12 1.7 Value of Assets of Foreign Investors reported by custodians .......................................12 2.1 Resource Mobilisation through Public and Rights Issues .............................................57 2.2 SME Platform .......................................................................................................................58 2.3 Sector-wise Resource Mobilisation ...................................................................................58 2.4 Size-wise Resource Mobilisation ......................................................................................59 2.5 Mega Issues in 2013-14 .......................................................................................................60 2.6 Industry-wise Resource Mobilisation ..............................................................................61 2.7 Resource Mobilisation through QIP and Conforming to MPS through IPP ..............62 2.8 Offer for Sale through Stock Exchange Mechanism to conform to MPS ....................63 2.9 Resource Mobilisation through Preferential Allotment ................................................63 2.10 Private Placement of Corporate Bonds Reported to BSE and NSE..............................64 2.11 Major Indicators of Indian Stock Markets .......................................................................67 2.12 Major Stock Indices and their Percentage Variation ......................................................69 2.13 Sectoral Stock Indices and their Returns .........................................................................70 2.14 Exchange-wise Cash Segment Turnover .........................................................................72 2.15 Turnover at BSE ,NSE and MCX-SX: Cash Segment ......................................................73 2.16 City-wise Turnover of Top 20 Cities in Cash Segment during 2013-14 .......................74 2.17 Market Capitalisation at BSE .............................................................................................75 2.18 Market Capitalisation at NSE ............................................................................................76 2.19 Select Ratios Relating to Stock Market .............................................................................77 2.20 Price to Earnings Ratio .......................................................................................................77 2.21 Price to Book-Value Ratio ...................................................................................................78 2.22 Average Daily Volatility of Benchmark Indices ..............................................................80 2.23 Trends in Daily Volatility of International Stock Market Indices during 2013-14 .....81 2.24 Trading Frequency of Listed Stocks .................................................................................82 2.25 Share of Brokers, Securities and Participants in Cash Market Turnover ....................83 2.26 Trading Statistics of Stock Exchanges in the Cash Segment .........................................84 2.27 Turnover of Subsidiaries of Stock Exchanges .................................................................85 2.28 Depository Statistics ...........................................................................................................87
viii
2.29 Depository Statistics: Debenture/Bonds and Commercial Paper .................................872.30 Cities According to Number of DP Locations: Geographical Spread .........................88 2.31 Trends in Turnover and Open Interest in Equity Derivatives Segment ......................89 2.32 Product-wise Derivatives Turnover at NSE, BSE and MCX-SX ...................................90 2.33 Trends in Index Futures at NSE, BSE and MCX-SX .......................................................91 2.34 Trends in Single Stock Futures at NSE, BSE and MCX-SX ............................................92 2.35 Trends in Index Options at NSE, BSE and MCX-SX ......................................................93 2.36 Trends in Stock Options at NSE and BSE ........................................................................932.37 Shares of Various Classes of Members in Derivatives Turnover at NSE, BSE and MCX-SX ........................................................................................................................942.38 Trends in the Currency Derivatives Segment .................................................................96 2.39 Product-wise Market Share in Currency Derivatives Volume .....................................972.40 Trends in Interest Rate Derivatives at NSE and BSE......................................................98 2.41 Mobilisation of Resources by Mutual Funds ..................................................................99 2.42 Sector-wise Resource Mobilisation by Mutual Funds during 2013-14 ......................100 2.43 Scheme-wise Resource Mobilisation and Assets under Management by Mutual Funds as on March 31, 2014 .............................................................................................1012.44 Number of Schemes by Investment Objective as on March 31, 2014 ........................102 2.45 Trends in Transactions on Stock Exchanges by Mutual Funds ..................................102 2.46 Unit holding pattern of all mutual funds as on March 31, 2014 ................................103 2.47 Unit holding pattern of private and public sector mutual funds as on March 31, 2014 ...................................................................................................................104 2.48 Assets Managed by Portfolio Managers ........................................................................105 2.49 Cumulative amount mobilised by AIFs (as at the end of 31st March 2014) .............105 2.50 Cumulative Net Investments by VCFs and FVCIs .......................................................106 2.51 Category-wise Investors in VCFs ...................................................................................106 2.52 Investment by Foreign Institutional lnvestors ..............................................................107 2.53 Investments by Foreign Institutional lnvestors (Equity & Debt) ...............................108 2.54 QFI Investments during 2013-14 .....................................................................................109 2.55 Allocation of Debt Investment limits to FIIs and Sub-accounts during 2013-14 .....109 2.56 Debt Utilisation Status as on March 31, 2014 ................................................................110 2.57 Notional Value of Open Interest of Foreign Institutional investors in Derivatives during 2013-14 ..............................................................................................1112.58 Notional Value of Participatory Notes (PNs) Vs Assets Under Management of FIIs ..................................................................................................................................1122.59 Secondary Market: Corporate Bond Trades ..................................................................113
LIST OF TABLES
Table No. Name Page No.
ix
2.60 Settlement of Corporate Bonds .......................................................................................114 2.61 Business Growth on the Wholesale Debt Market Segment of NSE and BSE ...........115 2.62 Instrument-wise Share of Securities Traded in Wholesale Debt Market Segment of NSE and BSE .................................................................................................1162.63 Share of Participants in Turnover of Wholesale Debt Market Segment of NSE ......1173.1 Stock Exchanges with Permanent Recognition .............................................................118 3.2 Renewal of Recognition Granted to Stock Exchanges during 2013-14 ......................1193.3 Registered Stock Brokers .................................................................................................124 3.4 Applications under the Process of Registration in Cash Segment .............................125 3.5 Classification of Stock Brokers in Cash Segment on the Basis of Ownership ..........125 3.6 Number of Registered Members in Equity Derivatives Segment ..............................126 3.7 Number of Registered Members in Currency Derivatives Segment .........................126 3.8 Applications under the Process of Registration in Derivative Segment ...................127 3.9 Registered Sub-Brokers ....................................................................................................127 3.10 Registered Intermediaries other than Stock Brokers and Sub-Brokers .....................128 3.11 Process of Registration of other Intermediaries............................................................129 3.12 Number of Registered FIIs, Sub-accounts and Custodians ........................................129 3.13 Status of Registration of FII, Sub-accounts and Custodians during 2013-14 ...........130 3.14 Registered Venture Capital Funds and Alternative Investment Funds ....................130 3.15 Registered Portfolio Managers and Investment Advisers ..........................................133 3.16 Mutual Funds Registered with SEBI ..............................................................................139 3.17 Trends in Awareness Programs/ Workshops Conducted by SEBI .............................151 3.18 Regional Seminars Conducted by SEBI .........................................................................152 3.19 Status of Investor Grievances Received and Redressed ..............................................156 3.20 Failure to Redress Investor Grievances: Adjudication Proceedings ..........................157 3.21 Status of Draft Letter of Offers for Open Offers during 2013-14 ................................165 3.22 Trends of Open Offers ......................................................................................................165 3.23 Buyback cases during 2013-14 .........................................................................................167 3.24 Inspection of Stock Brokers/Sub-brokers .......................................................................169 3.25 Inspections by Stock Exchanges ......................................................................................169 3.26 Inspection of other Market Intermediaries ....................................................................170 3.27 Actions by stock exchanges and depositories for AML/ CFT related deficiencies ..171 3.28 Fees and other Charges ....................................................................................................174 3.29 Major Market Movement during 2013-14 ......................................................................178 3.30 Surveillance Actions during 2013-14 ..............................................................................179 3.31 Trends of Investigations ...................................................................................................180
LIST OF TABLES
Table No. Name Page No.
x
3.32 Category-wise Nature of Investigation ..........................................................................181 3.33 Type of Regulatory actions taken during 2013-14 ........................................................183 3.34 Age-wise Analysis of Enforcement Actions - u/s 11, 11B and 11D of SEBI Act, 1992 ....................................................................................................................185 3.35 Age-wise Analysis of Enforcement Actions - Enquiry Proceedings ..........................186 3.36 Age-wise Analysis of Enforcement Actions - Adjudication Proceedings .................186 3.37 Age-wise Analysis of Enforcement Actions - Prosecution Proceedings ...................187 3.38 Age-wise Analysis of Enforcement Actions Summary Proceedings .........................188 3.39 Enquiry and Adjudication Proceedings Initiated during 2013-14 .............................188 3.40 Enquiry and Adjudication during 2013-14 ....................................................................188 3.41 Pending Enforcement Actions as on March 31, 2014 ...................................................189 3.42 Enquiry and Adjudication Proceedings against other Intermediaries during 2013-14 ................................................................................................................................1893.43 Prosecutions Launched ....................................................................................................191 3.44 Region-wise Data on Prosecution Cases as on March 31, 2014 ..................................191 3.45 Nature of Prosecutions Launched as on March 31, 2014.............................................191 3.46 Number of Prosecution Cases decided by the Courts as on March 31, 2014 ...........192 3.47 Status of Court Cases where SEBI was a Party (Subject Matter) ................................194 3.48 Status of Court Cases where SEBI was a Party (Judicial Forum) ...............................195 3.49 Status of Appeals before the Securities Appellate Tribunal ........................................195 3.50 Disposals of Appeals by Securities Appellate Tribunal ...............................................195 3.51 Status of Appeals before the Hon’ble Supreme Court .................................................196 3.52 Status of Appeals before the Hon’ble High Court .......................................................196 3.53 Receipt and Disposal of applications under Consent and Compounding Process .......211 3.54 Consent Applications filed with SEBI during 2013-14 ................................................212 3.55 Compounding Applications filed by the accused in criminal courts during 2013-14 ................................................................................................................................2123.56 Details of Recovery Proceedings .....................................................................................213 3.57 Trends in RTI applications and First Appeal to SEBI ..................................................223 3.58 Trends in Appeals before Central Information Commission .....................................223 3.59 Parliament Queries Received and replied by SEBI during 2013-14 ...........................223 3.60 Data on Various References Received and Responded to during 2013-14 ...............224 3.61 Trends in Regulatory Assistance made and received by SEBI ...................................235 4.1 Board Meetings during 2013-14 ......................................................................................241 4.2 Promotions of Officers during the year .........................................................................243 4.3 Training Programmes during 2013-14 ...........................................................................244
LIST OF TABLES
Table No. Name Page No.
xi
LIST OF CHARTS
Chart No. Name Page No.
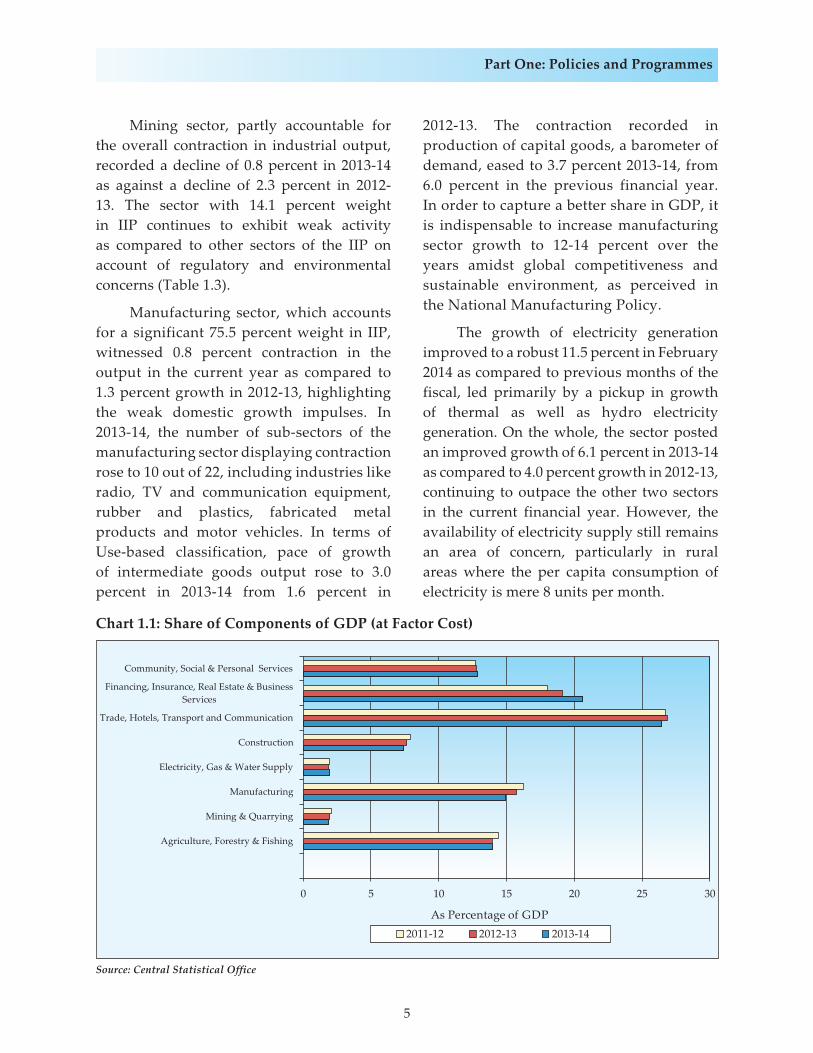
1.1 Share of Components of GDP (at Factor Cost) .................................................................. 5
2.1 Share of Broad Category of Issues in Resource Mobilisation ........................................ 57
2.2 Sector-wise Resource Mobilisation .................................................................................... 59
2.3 Movement of Benchmark Stock Market Indices .............................................................. 65
2.4 Value traded in Secondary Market (percent) ................................................................... 66
2.5 Year-on-Year Returns of International Indices ................................................................. 68
2.6 Movement of Sectoral Indices of BSE ................................................................................ 70
2.7 Movement of Sectoral Indices of NSE ............................................................................... 71
2.8 P/E Ratio of International Stock Market Indices .............................................................. 79
2.9 Annualised Volatility of International Stock Market Indices in 2013-14 ..................... 80
2.10 Derivatives Turnover vis-à-vis Cash Market Turnover .................................................. 89
2.11 Product-wise Share in Equity Derivatives Turnover at NSE and BSE ......................... 91
2.12 Participant-wise average share in F&O equity turnover in 2013-14 ............................. 95
2.13 Participant-wise share in equity derivative open interest at NSE at end of
the period .............................................................................................................................. 95
3.1 Trends in Financial Education Programs through Resource Persons ........................ 155
3.2 Trends of feedback for calls received in SEBI Helpline ................................................ 157
3.3 Category-wise Nature of Investigation Taken up ......................................................... 181
3.4 Category-wise Nature of Investigation Cases Completed ........................................... 182
3.5 Percentage share of type of Regulatory actions taken during 2013-14 ...................... 183
This Report can also be accessed on internet – http://www.sebi.gov.in
Conventions used in this Report` : RupeesLakh : Hundred thousandCrore : Ten millionMillion : Ten lakhBillion : Thousand million/hundred croreNA : Not AvailableNa : Not Applicable p.a. : Per annum
Differences in total are due to rounding off and sometimes they may not exactly add up to hundred per cent.
Source of Charts and Boxes where not mentioned, is SEBI.
xii
AAUM Average Assets Under ManagementADR American Depository ReceiptAGM Assistant General ManagerAIBI Association of Investment Bankers of IndiaAIF(s) Alternative Investment Fund(s)AMC(s) Asset Management Company/CompaniesAMFI Association of Mutual Funds in IndiaAML Anti-Money LaunderingAPs Authorised PersonsASCI Administrative Staff College of IndiaASJ Additional Sessions JudgeATR(s) Action Taken Report(s)AUC Assets Under CustodyAUM Assets Under ManagementBO Beneficial OwnerBSE Bombay Stock ExchangeCAD Current Account DeficitCBDT Central Board of Direct TaxesCBI Central Bureau of InvestigationCBLO Collateralized Borrowing and Lending ObligationCBOE Chicago Board Options ExchangeCBSE Central Board of Secondary EducationCC Clearing CorporationCCI Competition Commission of IndiaCCP Central Counter PartyCD(s) Certificate of Deposit(s)CDS Credit Default SwapsCDSL Central Depository Services (India) LimitedCFA Charted Financial AnalystCFERM Certificate in Financial Engineering and Risk ManagementCFT Countering Financing of TerrorismCGM Chief General ManagerCIC Central Information CommissionCIIA Certificate in International Investment AnalystCIS Collective Investment SchemesCISA Certified Information Systems AuditorCISM Certified Information Security ManagerCISO Chief Information Security OfficerCISSP Certified Information Systems Security Professional
ABBREVIATIONS
xiii
CM Clearing MemberCMB Cash Management BillsCoBoSAC Corporate Bonds and Securitization Advisory CommitteeCP(s) Commercial Paper(s)CPE Continuing Professional EducationCPI Consumer Price IndexCPSS Committee on Payments and Settlement SystemsCRA(s) Credit Rating Agency/AgenciesCRFR Committee on Rationalisation of Financial ResourcesCRR Cash Reserve RatioCSE Calcutta Stock ExchangeCSL Certificate in Securities LawCSO Central Statistical OfficeDC(s) Division Chief(s)DDPs Designated Depository ParticipantsDFIs Development Finance InstitutionsDGM Deputy General ManagerDIP Disclosure and Investor ProtectionDIS Delivery Instruction SlipsDISA Post Qualification Certification in Information Systems AuditDJIA Dow Jones Industrial AverageDLP Data Leakage ProtectionDMA Direct Market AccessDMS Document Management SystemDP(s) Depository Participant(s)DR Disaster RecoveryDRG Development Research GroupDRS Disaster Recovery SiteDSRC Depository System Review CommitteeDT(s) Debenture Trustee(s)DVP Delivery vs. PaymentDWBIS Data Warehousing and Business Intelligence SystemECL Eastern Coalfields LimitedECR Export Credit RefinanceED Executive Director/Enforcement DirectorateEDCE Equity Derivative Certification ExaminationEFD Enforcement DepartmentEGM Extraordinary General MeetingEOB Electronic Order Book
ABBREVIATIONS
xiv
EPFO Employee Provident Fund OrganisationETF Enforcement Task ForceETF(s) Exchange Traded Fund(s)F&O Futures and OptionsFAQ(s) Frequently Asked Question(s)FATF Financial Action Task ForceFCCB(s) Foreign Currency Convertible Bond(s)FCD Fully Convertible DebenturesFDI Foreign Direct InvestmentFEMA Foreign Exchange Management ActFEW Financial Education WebsiteFI(s) Financial Institution(s)FIA Futures Industry AssociationFII(s) Foreign Institutional Investor(s)FIMMDA Fixed Income Money Market and Derivatives Association of IndiaFINRA Financial Industry Regulatory AuthorityFLIS Financial Literacy and Inclusion SurveyFMC Forward Markets CommissionFMI Financial Market InfrastructureFMP(s) Fixed Maturity Plan(s)FPI Foreign Portfolio InvestorFPO(s) Further Public Offering(s)/Follow-on Public OfferFRRB Financial Reporting Review BoardFRTI Financial Regulators Training InitiativeFSAP Financial Sector Assessment ProgrammeFSB Financial Stability BoardFSDC Financial Stability and Development CouncilFSR Financial Stability ReportFSRB FATF-Style Regional BodyFSS Financial Supervisory Service, South KoreaFTIL Financial Technologies (India) LtdFUTP Fraudulent and Unfair Trade PracticesFVCI(s) Foreign Venture Capital Investor(s)FY Financial YearGAAP(s) Generally Accepted Accounting Principle(s)GDCF Gross Domestic Capital FormationGDP Gross Domestic ProductGDR(s) Global Depository Receipt(s)GDS Gross Domestic Savings/Gold Deposit Scheme
ABBREVIATIONS
xv
GETF(s) Gold Exchange Traded Fund(s)GID General Information DocumentGM General ManagerGNI Gross National IncomeGoI Government of IndiaGSE Gauhati Stock ExchangeG-Sec Government SecuritiesHFC(s) Housing Finance Company/CompaniesHFT High Frequency TradingHNIs High Net Worth IndividualsHRD Human Resource DevelopmentHSD High Speed DieselHUF Hindu Undivided FamilyIA Investment AdvisersIAD Investor Awareness DivisionIAFE International Association of Financial EngineersIAIS International Association of Insurance SupervisorsIASB International Accounting Standards BoardIBC India Business CentreIBT Internet Based TradingICAI Institute of Chartered Accountants of IndiaICAI-FRRB Financial Reporting Review Board of the Institute of Chartered Accountants
of IndiaICCL Indian Clearing Corporation LimitedICDR Issue of Capital and Disclosure RequirementsICLS Indian Corporate Law SeviceICSI The Institute of Company Secretaries of IndiaICWAI The Institute of Cost and Work Accountants of IndiaIDF Infrastructure Debt FundIDR(s) Indian Depository Receipt(s)IEFJ International Economics and Finance JournalIFC Infrastructure Finance CompaniesIFRSs International Financial Reporting StandardsIGRC Investor Grievance Redressal CommitteeIIP Index of Industrial ProductionIMD Investment Management DepartmentIMF International Monetary FundIMSS Integrated Market Surveillance SystemINR Indian RupeeIOSCO International Organisation of Securities Commissions
ABBREVIATIONS
xvi
IPC Indian Penal CodeIPEF Investor Protection and Education FundIPF Investor Protection FundIPO Initial Public OfferIPP Institutional Placement ProgrammeIPS Intrusion Detection and Prevention SystemIPV In-Person VerificationIRAS Indian Railway Accounts ServiceIRDA Insurance Regulatory and Development AuthorityIRF Interest Rate FuturesIRM Information Rights ManagementIRS Indian Revenue ServiceISD Integrated Surveillance DepartmentISE Inter-Connected Stock ExchangeISIN International Securities Identification NumberIT Information TechnologyITD Information Technology DepartmentITeS Information Technology Enabled ServicesITF Implementation Task ForceITP Institutional Trading PlatformJF Joint ForumJPY Japanese YenJSE Jaipur Stock ExchangeKIM Key Information MemorandumKRA KYC Registration AgencyKYC Know Your ClientL&T Larsen & ToubroLAF Liquidity Adjustment FacilityLES(s) Liquidity Enhancement Scheme(s)LLP Limited Liability PartnershipLSE Ludhiana Stock ExchangeLTP Last Traded PriceMB(s) Merchant Banker(s)MCA Ministry of Corporate AffairsMCR Monthly Cumulative ReportMCV Multi-class share VehiclesMCX Multi-Commodity Exchange of India LtdMCX-SX MCX Stock ExchangeMCX-SX CCL MCX-SX Clearing Corporation Limited
ABBREVIATIONS

xvii
ABBREVIATIONS
MD Managing DirectorMF(s) Mutual Fund(s)MFAC Advisory Committee on Mutual FundsMII(s) Market Infrastructure Institution(s)MMoU Multilateral Memorandum of UnderstandingMMTC Minerals and Metals Trading Corporation of IndiaMoF Ministry of FinanceMoU Memorandum of UnderstandingMPS Minimum Public ShareholdingMPSE Madhya Pradesh Stock Exchange LimitedMSE Madras Stock ExchangeMSF Marginal Standing FacilityMWPL Market Wide Position LimitNAV Net Asset ValueNBFCs Non-Banking Financial CompaniesNCAER National Council of Applied Economic ResearchNCD Non Convertible DebentureNCFE National Centre for Financial EducationNDP Net Domestic ProductNDUs Non Disposal UndertakingsNFLAT National Financial Literacy Assessment TestNFLIS National Financial Inclusion SurveyNGO Non-Government OrganisationNHB National Housing BankNHPC National Hydroelectric Power CorporationNIFM National Institute of Financial ManagementNII(s) Non-Institutional Investor(s)NISM National Institute of Securities MarketsNNI Net National IncomeNoC No Objection CertificateNRI Non-Resident IndianNRO Northern Regional OfficeNSCCL National Securities Clearing Corporation LimitedNSDL National Securities Depository LimitedNSE National Stock ExchangeNSEL National Spot Exchange LtdNSFE National Strategy for Financial EducationNSMD Network for Securities Markets DataNTPC National Thermal Power Corporation
xviii
ABBREVIATIONS
OCB Overseas Corporate BodyOCRES Online CPE Registration and Enrolment SystemODI(s) Offshore Derivative Instrument(s)OECD Organisation for Economic Co-operation and DevelopmentOFCD(s) Optionally Fully Convertible Debenture(s)OFS Offer for SaleOIAE Office of Investor Assistance and EducationOMOs Open Market OperationsOTC Over the CounterOTCEI Over the Counter Exchange of IndiaP.A. Per AnnumP/B Ratio Price to Book-Value RatioP/E Ratio Price to Earnings RatioPAN Permanent Account NumberPCC Protected Cell CompaniesPCD Partly Convertible DebenturePCI Press Council of IndiaPE Private EquityPF(s) Provident Fund(s)PFI Public Financial InstitutionPFMIs Principles of Financial Market InfrastructuresPFRDA Pension Fund Regulatory and Development AuthorityPFUTP Prohibition of Fraudulent and Unfair Trade PracticesPGCSM Post Graduate Certificate in Securities MarketsPGPSM Post Graduate Programme in Securities MarketsPID Public Interest DirectorsPIS Portfolio Investment SchemePIT Prohibition of Insider TradingPMAC Primary Market Advisory CommitteePMLA Prevention of Money Laundering ActPN Participatory NotesPSE Pune Stock ExchangePSUs Public Sector Undertaking(s)PTM Proprietary Trading MemberQARC Qualified Audit Review CommitteeQDP Qualified Depository ParticipantQE Quantitative EasingQFI(s) Qualified Foreign Investor(s)QIB(s) Qualified Institutional Buyer(s)
xix
QIP(s) Qualified Institutions’ Placement(s)RAIN Registrars Association of IndiaRBI Reserve Bank of IndiaRCG Regional Committee GroupRDDBFI Recovery of Debts due to Banks and Financial InstitutionsRE Revised EstimateREER Real Effective Exchange RateREIT Real Estate Investment TrustRFQ Request for QuoteRGESS Rajiv Gandhi Equity Savings SchemeRHP Red Herring ProspectusRII Retail Individual InvestorsRMRC Risk Management Review CommitteeRP(s) Resource Person(s)RRD Regulatory Research DivisionRSE(s) Regional Stock Exchange(s)RTI Right to InformationRTI/STA(s) Registrar to an Issue and Share Transfer Agent(s)SA(s) Sub Account(s)SAARC South Asian Association for Regional Co-operationSARFAESI Securitization and Reconstruction of Financial Assets and Enforcement of
Security Interest ActSAST Substantial Acquisition of Shares and TakeoversSAT Securities Appellate TribunalSC(R)A Securities Contracts (Regulation) ActSCG School for Corporate GovernanceSCI School for Certification of IntermediariesSCM Self Clearing MemberSCN Show Cause NoticeSCODA SEBI Committee on Disclosures and Accounting StandardsSCORES SEBI Complaints Redress SystemSCRR Securities Contracts (Regulation) RulesSCSB(s) Self Certified Syndicate Bank(s)SDIs Securitised Debt InstrumentsSEBI Securities and Exchange Board of IndiaSEC Securities and Exchange CommissionSECC Stock Exchanges and Clearing CorporationsSGF Settlement Guarantee FundSHA Shareholders’ Agreement
ABBREVIATIONS
xx
SICCE Securities Intermediaries Compliance (Non-Fund) Certification ExaminationSID Scheme Information DocumentSIDD Separately Identifiable Department or DivisionSIEFL School for Investor Education and Financial LiteracySLB Securities Lending and BorrowingSLR Statutory Liquidity RatioSMAC Secondary Market Advisory CommitteeSME Small and Medium EnterprisesSMS Short Message ServicesSOP Standard Operating ProcedureSPV(s) Special Purpose Vehicle(s)SRO(s) Self Regulatory Organisation(s)SRSS School for Regulatory Studies and SupervisionSSE School for Securities EducationSSIR School for Securities Information and ResearchSTT Securities Transaction TaxSTWT Securities Trading using Wireless TechnologySWFs Sovereign Wealth FundsTAC Technical Advisory CommitteeT-Bills Treasury BillsTC Technical CommitteeTER Total Expense RatioTM Trading MemberUAT User Acceptance TestUIDAI Unique Identification Authority of IndiaUIN Unique Identity NumberUK United KingdomUPSE Uttar Pradesh Stock Exchange LimitedUSA United States of AmericaUSD United States DollarUSE United Stock ExchangeUTI Unit Trust of IndiaVaR Value at RiskVCF(s) Venture Capital Fund(s)VPN Virtual Private NetworkWDM Wholesale Debt MarketWFE World Federation of ExchangesWPI Wholesale Price IndexWTM Whole Time Member
ABBREVIATIONS

PART ONE: POLICIES AND PROGRAMMES
The Annual Report of the Securities and Exchange Board of India (SEBI) for 2013-14 reviews significant developments in securities markets in the backdrop of an unprecedented spell of financial turbulence transmitted by the tapering concerns, and the subsequent restoration of normalcy in macro-economic fundamentals. Indian economy and financial markets came under acute stress by the turmoil in the global financial markets generated by the US Federal Reserve announcements on tapering. However with a swift and decisive policy response, India was able to minimise the fallout on the real economy and maintained financial stability.
SEBI Annual Report for 2013-14 articulates the policies and programmes embarked during the financial year while ensuring to fulfill its stated objective to strengthen the Indian regulatory framework of capital markets. This report has been prepared as per the format prescribed by the Securities and Exchange Board of India (Annual Report) Rules, 1994. SEBI continued to pursue its endeavour to achieve the three statutory objectives viz. (a) protection of the interests of investors in securities, (b) promotion of the development of the securities market and (c) regulation of the securities market.
In 2013-14, SEBI continued to channelise its efforts to achieve these objectives by reviewing its policies, implementing fresh initiatives, disciplining the market through a variety of appropriate enforcement actions, facilitating redressal of grievances of investors and nurturing a security culture for the orderly and expansive growth of capital market. The major policy issues are discussed in public domain through discussion papers to ensure transparency, efficiency, fairness, safety and integrity of the capital market. The various
quasi-judicial orders passed by the Board during the year are also posted on the website.
In line with the stated objectives, this Report provides the manner in which SEBI discharged its responsibilities and exercised its powers during the year in furtherance of the objectives enshrined in (a) the Securities and Exchange Board of India Act, 1992, (b) the Securities Contracts (Regulation) Act, 1956 (c) the Depositories Act, 1996 and (d) the relevant provisions of the Companies Act, and newly enacted Companies Act, 2013. It also covers the global developments relevant to the Indian securities market.
1. REVIEW OF THE GENERAL ECONOMIC ENVIRONMENT AND THE INVESTMENT CLIMATE
After the recovery of global economic conditions in late 2012-13, the current financial year unfolded an unprecedented stress to Indian economy and markets. The tightening of global liquidity increased external pressures and heightened the focus on India’s macroeconomic imbalances viz., high inflation, large current account and fiscal deficits and structural weaknesses particularly supply bottlenecks in infrastructure, power and mining. The impact of US Federal Reserve’s May 2013 announcement on Indian financial markets was one of the most severe amongst emerging markets with the rupee depreciation weighing on the stock market, foreign outflows from the debt market further aggravating the forex markets and impacting yields as also the equity market. Thus, the global developments since May 2013 have brought to the fore not just the stress in the financial markets and asset prices, but also their impact on other macroeconomic parameters, including growth, public finances
1
2
Annual Report 2013-14
and inflation, as also financial stability. In the wake of intense exchange rate pressures, stabilisation of the economy by restoring exchange rate stability was the foremost task. A series of exceptional monetary policy actions were taken to tighten interest rates to siphon off liquidity, to restrain the current account deficit (CAD) and to improve its financing. With the resultant improved stability in the foreign exchange market, exceptional liquidity and monetary measures were normalised.
Having built the buffers in the interim, Indian economy and markets withstood the December 2013 tapering announcement better than its emerging market peers. In spite of the recent improvements in statistics, country faces a challenging macro-economic situation with growth slowing down, persistent inflation and lingering structural bottlenecks.
The growth concerns remain dominant for Indian economy with GDP growth recording below 5 percent for seven successive quarters and index of industrial production (IIP) growth stagnating for two successive years. Even though the agriculture output and export performance strengthened, industrial growth continues to stagnate. The leading indicators of the services sector exhibited a mixed picture. During the year, growth picked up in emerging markets, but the momentum appeared to be weaker than
in the advanced economies mainly due to less favourable external environment and country specific concerns like high inflation and wide current account deficit producing weak investor sentiments for emerging markets.
I. Growth
The Indian economy, which witnessed a slowdown after a robust growth of over 8 percent in 2010-11, troughed to a decadal low rate of 4.5 percent in 2012-13 and the provisional estimate stood at a marginal high of 4.7 percent in 2013-14. As per the provisional estimates of Central Statistical Office (CSO), Gross Domestic Product (GDP) at factor cost at constant (2004-05) prices in the year 2013-14 is ̀ 57,41,791 crore, as against the first revised estimate of GDP for the year 2012-13 of `54,82,111 crore (Table 1.1).
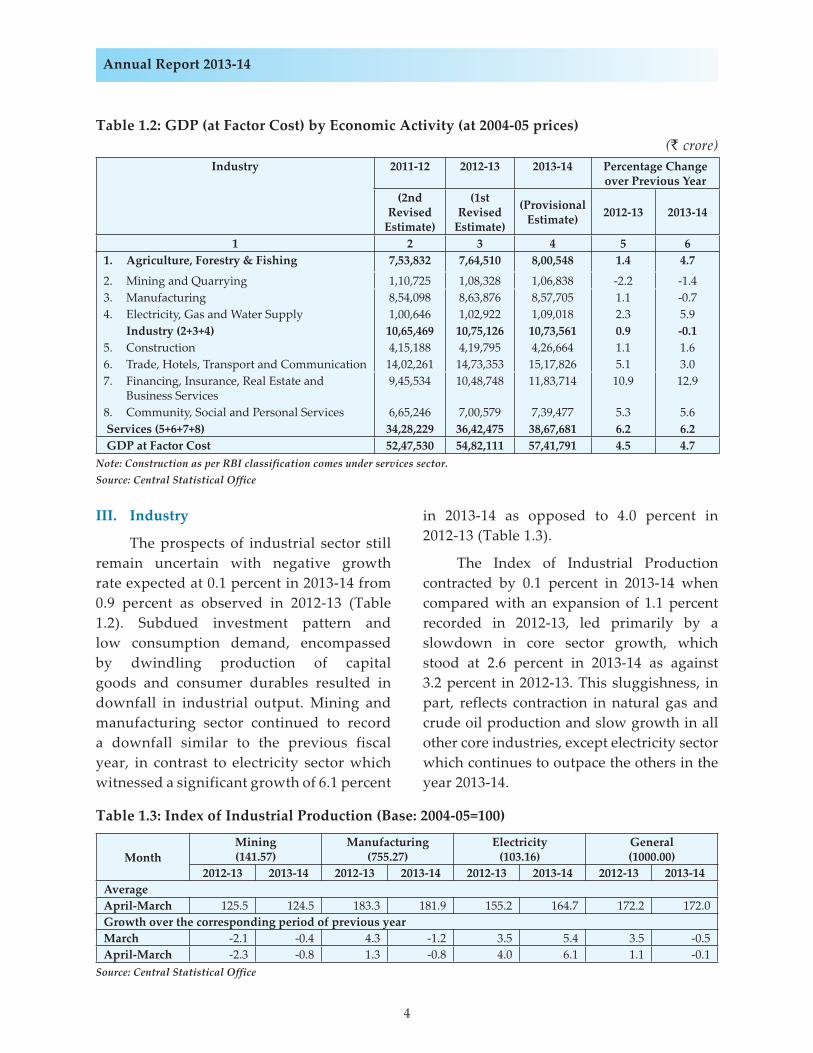
In 2013-14, the overall growth is expected to improve on the back of a reviving agriculture sector, with a growth rate of 4.7 percent as compared to 1.4 percent in 2012-13. However, Industry which recorded a growth of 0.9 percent continues to dampen further over the previous year. Service sector continued to maintain its momentum over the previous two years with a growth of 6.2 percent in 2013-14. However, sub-sectors trade, hotels, transport and communication recorded a sluggish growth of 3.0 percent in 2013-14.

3
Part One: Policies and Programmes
II. Agriculture
The post-monsoon rainfall and favourable progress of Rabi crops sown in the current financial year is expected to boost growth prospects in agriculture sector remarkably by 4.7 percent in 2013-14 from that of 1.4 percent seen in 2012-13. The production of food grains is expected to rise by 5.6 percent in 2013-14, unlike the previous year when the production grew at 2.8 percent (Table 1.2). However, unseasonal rains and the possible effects of El Nino in various parts of the country, makes the sector prone to uncertainties for future harvests. In this context, the ability of agriculture sector to
meet increased food demand and mounting input prices poses a challenge.
Although share of agriculture in the GDP accounts for approximately 14 percent since last three years, but it is still the main source of livelihood for majority of the rural population. The agricultural growth had accelerated significantly during 11th five year plan with an average growth rate of 3.7 percent as opposed to the achievement of 2.4 percent in the 10th five year plan. With new structural changes taking place within the sector, the 12th five year plan (2012-17) maintained the growth target for agriculture at 4.0 percent.
Table 1.1: National Income (at 2004-05 prices)(` crore)
Item 2011-12 2012-13 2013-14(2nd Revised
Estimate)( 1st Revised
Estimate)(Provisional
Estimate)1 2 3 4
A. Estimates at Aggregate Level 1. National Product 1.1 Gross National Income (GNI) at factor cost 52,01,163 54,16,659 56,73,857
(6.9) (4.1) (4.7) 1.2 Net National Income (NNI) at factor cost 45,73,328 47,28,776 49,20,183
(6.5) (3.4) (4.0) 2. Domestic Product 2.1 Gross Domestic Product (GDP) at factor cost 52,47,530 54,82,111 57,41,791
(6.7) (4.5) (4.7) 2.2 Net Domestic Product (NDP) at factor cost 4,619,695 47,94,228 49,88,116
(6.2) (3.8) (4.0)B. Estimates at Per Capita Level 1. Population (million) 1,202 1,217 1,233
(1.3) (1.2) (1.3)
2. Per Capita NNI at factor cost (`) 38,048 38,856 39,904(5.1) (2.1) (2.7)
3. Per Capita GDP at factor cost (`) 43,657 45,046 46,568(4.9) (3.2) (3.4)
Notes: 1. Figures in the parentheses are percentage change over the previous year. 2. Growth rates in 2011-12 are based on growth calculated over 3rd revised estimates of 2010-11.Source: Central Statistical Office
4
Annual Report 2013-14
III. Industry
The prospects of industrial sector still remain uncertain with negative growth rate expected at 0.1 percent in 2013-14 from 0.9 percent as observed in 2012-13 (Table 1.2). Subdued investment pattern and low consumption demand, encompassed by dwindling production of capital goods and consumer durables resulted in downfall in industrial output. Mining and manufacturing sector continued to record a downfall similar to the previous fiscal year, in contrast to electricity sector which witnessed a significant growth of 6.1 percent
in 2013-14 as opposed to 4.0 percent in 2012-13 (Table 1.3).
The Index of Industrial Production contracted by 0.1 percent in 2013-14 when compared with an expansion of 1.1 percent recorded in 2012-13, led primarily by a slowdown in core sector growth, which stood at 2.6 percent in 2013-14 as against 3.2 percent in 2012-13. This sluggishness, in part, reflects contraction in natural gas and crude oil production and slow growth in all other core industries, except electricity sector which continues to outpace the others in the year 2013-14.
Table 1.2: GDP (at Factor Cost) by Economic Activity (at 2004-05 prices)(` crore)
Industry 2011-12 2012-13 2013-14 Percentage Change over Previous Year
(2nd Revised
Estimate)
(1st Revised
Estimate)
(Provisional Estimate) 2012-13 2013-14
1 2 3 4 5 61. Agriculture, Forestry & Fishing 7,53,832 7,64,510 8,00,548 1.4 4.7
2. Mining and Quarrying 1,10,725 1,08,328 1,06,838 -2.2 -1.43. Manufacturing 8,54,098 8,63,876 8,57,705 1.1 -0.74. Electricity, Gas and Water Supply 1,00,646 1,02,922 1,09,018 2.3 5.9 Industry (2+3+4) 10,65,469 10,75,126 10,73,561 0.9 -0.15. Construction 4,15,188 4,19,795 4,26,664 1.1 1.66. Trade, Hotels, Transport and Communication 14,02,261 14,73,353 15,17,826 5.1 3.07. Financing, Insurance, Real Estate and
Business Services9,45,534 10,48,748 11,83,714 10.9 12.9
8. Community, Social and Personal Services 6,65,246 7,00,579 7,39,477 5.3 5.6 Services (5+6+7+8) 34,28,229 36,42,475 38,67,681 6.2 6.2 GDP at Factor Cost 52,47,530 54,82,111 57,41,791 4.5 4.7
Note: Construction as per RBI classification comes under services sector.Source: Central Statistical Office
Table 1.3: Index of Industrial Production (Base: 2004-05=100)
MonthMining(141.57)
Manufacturing(755.27)
Electricity(103.16)
General(1000.00)
2012-13 2013-14 2012-13 2013-14 2012-13 2013-14 2012-13 2013-14AverageApril-March 125.5 124.5 183.3 181.9 155.2 164.7 172.2 172.0Growth over the corresponding period of previous yearMarch -2.1 -0.4 4.3 -1.2 3.5 5.4 3.5 -0.5April-March -2.3 -0.8 1.3 -0.8 4.0 6.1 1.1 -0.1
Source: Central Statistical Office
5
Part One: Policies and Programmes
Mining sector, partly accountable for the overall contraction in industrial output, recorded a decline of 0.8 percent in 2013-14 as against a decline of 2.3 percent in 2012-13. The sector with 14.1 percent weight in IIP continues to exhibit weak activity as compared to other sectors of the IIP on account of regulatory and environmental concerns (Table 1.3).
Manufacturing sector, which accounts for a significant 75.5 percent weight in IIP, witnessed 0.8 percent contraction in the output in the current year as compared to 1.3 percent growth in 2012-13, highlighting the weak domestic growth impulses. In 2013-14, the number of sub-sectors of the manufacturing sector displaying contraction rose to 10 out of 22, including industries like radio, TV and communication equipment, rubber and plastics, fabricated metal products and motor vehicles. In terms of Use-based classification, pace of growth of intermediate goods output rose to 3.0 percent in 2013-14 from 1.6 percent in
2012-13. The contraction recorded in production of capital goods, a barometer of demand, eased to 3.7 percent 2013-14, from 6.0 percent in the previous financial year. In order to capture a better share in GDP, it is indispensable to increase manufacturing sector growth to 12-14 percent over the years amidst global competitiveness and sustainable environment, as perceived in the National Manufacturing Policy.
The growth of electricity generation improved to a robust 11.5 percent in February 2014 as compared to previous months of the fiscal, led primarily by a pickup in growth of thermal as well as hydro electricity generation. On the whole, the sector posted an improved growth of 6.1 percent in 2013-14 as compared to 4.0 percent growth in 2012-13, continuing to outpace the other two sectors in the current financial year. However, the availability of electricity supply still remains an area of concern, particularly in rural areas where the per capita consumption of electricity is mere 8 units per month.
Chart 1.1: Share of Components of GDP (at Factor Cost)
Source: Central Statistical Office
6
Annual Report 2013-14
IV. Services
Services sector has been a major contributor to India’s GDP and growth with a rising share of 67.3 percent in the GDP in 2013-14 as against 66.4 percent in 2012-13. The sector, however, is expected to grow at 6.2 percent in 2013-14, similar to growth observed in 2012-13 but much higher than the other two sectors of the economy.
The sector with high growth potential was largely hampered due to a tad increase of 3.0 percent observed in ‘Trade, Hotels, Transport and Communication’ sub -sector, as compared to 5.1 percent recorded in 2012-13. Weak consumer confidence has impacted the sale of passenger cars, commercial vehicles and three wheelers. Nonetheless, the reduction in excise duty on passenger vehicles and two wheelers, as announced in the interim budget for 2014-15, is expected to augur well for the sector.
‘Financing, Insurance, Real Estate and Business Services’ sub-sector has further increased its share in GDP from 19.1 percent in 2012-13 to 20.3 percent in the current year. The sub-sector continues to outperform the other three sub-sectors while recording a growth rate of 12.9 percent in 2013-14 as compared to 10.9 percent observed in 2012-13. Construction sub sector, with 7.4 percent weight in GDP, is expected to grow at 1.6 percent in 2013-14 as against 1.1 percent recorded in the previous financial year.
‘Community, Social and Personal Services’ sub-sector, which contributes 13.1 percent share in GDP, is estimated to grow at 5.6 percent in the current year, slightly higher than the growth rate of 5.3 percent achieved in 2012-13. India’s services sector has emerged as a prominent sector over a decade in terms of its contribution to national and states incomes, FDI inflows and employment.
V. Savings and Investments
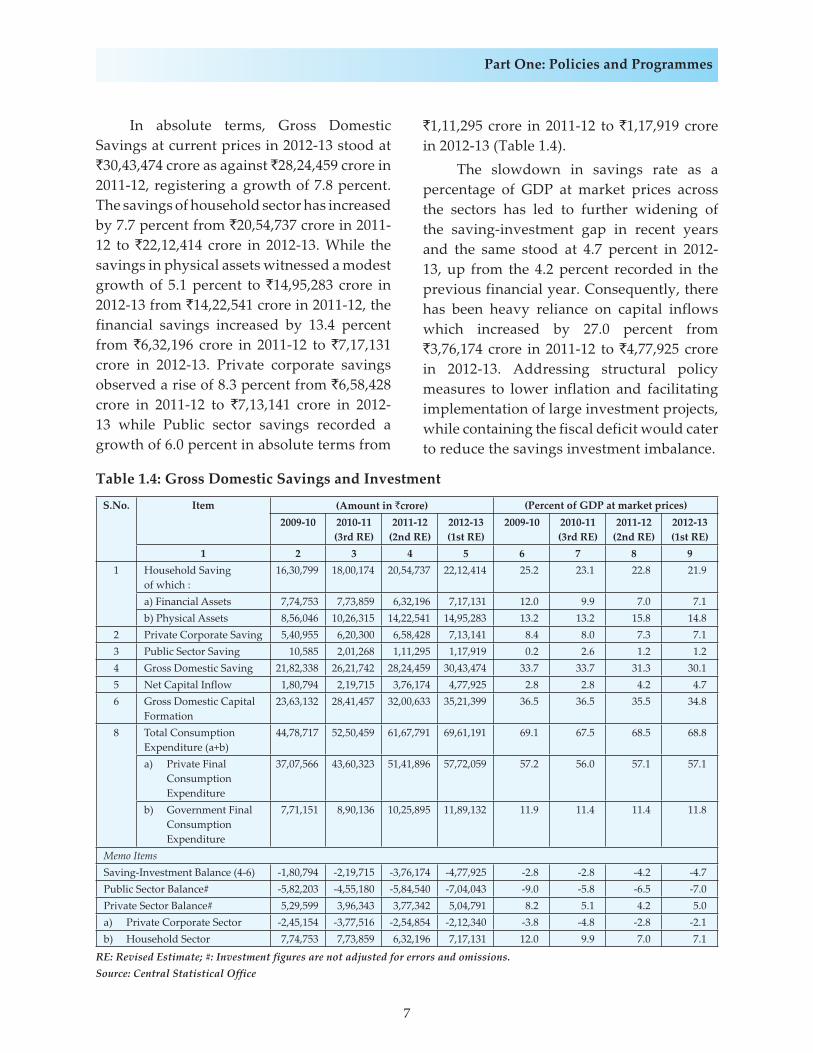
As per the update of Central Statistical Office (CSO), India’s Gross Domestic Savings as a percentage of GDP at market prices is reflecting a downward trend since 2009-10, sliding further to 30.1 percent in 2012-13 from 31.3 percent in 2011-12. The decrease came primarily on the back of reduced Private corporate savings from 7.3 percent in 2011-12 to 7.1 percent in 2012-13 accompanied by Household savings in physical assets moving from 15.8 percent in 2011-12 to 14.8 percent in 2012-13, which may be attributed to inflationary pressures experienced by the economy for most of the year. The mobilisation of financial savings impacted by low deposit rates in the face of high inflation saw a modest increase of 7.1 percent (as a percentage of GDP at market prices) in 2012-13 from 7.0 percent in 2011-12, while Public sector savings as a percentage of GDP at market prices stood at 1.2 percent in 2012-13 as well as in 2011-12. The investment too has seen a dwindling trend, declining to 34.8 percent in 2012-13 from 35.5 percent in 2011-12 and the peak of 36.5 percent recorded in 2009-10 and 2010-11.
The expenditure side of GDP at market prices indicates that the aggregate demand of the Indian economy during the year continued to remain weak even as net exports remained strong. Private final consumption expenditure, a principal component of GDP at market prices, decelerated from 17.9 percent in 2011-12 to 12.3 percent in 2012-13 in absolute terms on account of low agricultural production and insistent high consumer price inflation. On the contrary, the growth rate of government final consumption expenditure increased marginally from 15.3 percent in 2011-12 to 15.9 percent in 2012-13 due to fiscal consolidation.
7
Part One: Policies and Programmes
In absolute terms, Gross Domestic Savings at current prices in 2012-13 stood at `30,43,474 crore as against `28,24,459 crore in 2011-12, registering a growth of 7.8 percent. The savings of household sector has increased by 7.7 percent from `20,54,737 crore in 2011-12 to `22,12,414 crore in 2012-13. While the savings in physical assets witnessed a modest growth of 5.1 percent to `14,95,283 crore in 2012-13 from `14,22,541 crore in 2011-12, the financial savings increased by 13.4 percent from `6,32,196 crore in 2011-12 to `7,17,131 crore in 2012-13. Private corporate savings observed a rise of 8.3 percent from `6,58,428 crore in 2011-12 to `7,13,141 crore in 2012-13 while Public sector savings recorded a growth of 6.0 percent in absolute terms from
`1,11,295 crore in 2011-12 to `1,17,919 crore in 2012-13 (Table 1.4). The slowdown in savings rate as a percentage of GDP at market prices across the sectors has led to further widening of the saving-investment gap in recent years and the same stood at 4.7 percent in 2012-13, up from the 4.2 percent recorded in the previous financial year. Consequently, there has been heavy reliance on capital inflows which increased by 27.0 percent from `3,76,174 crore in 2011-12 to `4,77,925 crore in 2012-13. Addressing structural policy measures to lower inflation and facilitating implementation of large investment projects, while containing the fiscal deficit would cater to reduce the savings investment imbalance.
Table 1.4: Gross Domestic Savings and Investment
S.No. Item (Amount in `crore) (Percent of GDP at market prices)2009-10 2010-11
(3rd RE)2011-12
(2nd RE)2012-13 (1st RE)
2009-10 2010-11(3rd RE)
2011-12 (2nd RE)
2012-13 (1st RE)
1 2 3 4 5 6 7 8 91 Household Saving
of which :16,30,799 18,00,174 20,54,737 22,12,414 25.2 23.1 22.8 21.9
a) Financial Assets 7,74,753 7,73,859 6,32,196 7,17,131 12.0 9.9 7.0 7.1b) Physical Assets 8,56,046 10,26,315 14,22,541 14,95,283 13.2 13.2 15.8 14.8
2 Private Corporate Saving 5,40,955 6,20,300 6,58,428 7,13,141 8.4 8.0 7.3 7.13 Public Sector Saving 10,585 2,01,268 1,11,295 1,17,919 0.2 2.6 1.2 1.24 Gross Domestic Saving 21,82,338 26,21,742 28,24,459 30,43,474 33.7 33.7 31.3 30.15 Net Capital Inflow 1,80,794 2,19,715 3,76,174 4,77,925 2.8 2.8 4.2 4.76 Gross Domestic Capital
Formation23,63,132 28,41,457 32,00,633 35,21,399 36.5 36.5 35.5 34.8
8 Total Consumption Expenditure (a+b)
44,78,717 52,50,459 61,67,791 69,61,191 69.1 67.5 68.5 68.8
a) Private Final Consumption Expenditure
37,07,566 43,60,323 51,41,896 57,72,059 57.2 56.0 57.1 57.1
b) Government Final Consumption Expenditure
7,71,151 8,90,136 10,25,895 11,89,132 11.9 11.4 11.4 11.8
Memo ItemsSaving-Investment Balance (4-6) -1,80,794 -2,19,715 -3,76,174 -4,77,925 -2.8 -2.8 -4.2 -4.7Public Sector Balance# -5,82,203 -4,55,180 -5,84,540 -7,04,043 -9.0 -5.8 -6.5 -7.0Private Sector Balance# 5,29,599 3,96,343 3,77,342 5,04,791 8.2 5.1 4.2 5.0a) Private Corporate Sector -2,45,154 -3,77,516 -2,54,854 -2,12,340 -3.8 -4.8 -2.8 -2.1b) Household Sector 7,74,753 7,73,859 6,32,196 7,17,131 12.0 9.9 7.0 7.1
RE: Revised Estimate; #: Investment figures are not adjusted for errors and omissions.Source: Central Statistical Office
8
Annual Report 2013-14
VI. Current Account Deficit
The year 2013-14 for Indian economy reflected concerns with the current account deficit and it’s financing in the early months. However, circumstances improved and external risk mitigated in second half of the year. The narrowing of CAD followed a lower trade deficit due to the higher exports helped by a depreciating rupee as well as moderation in imports, by curbing the import demand arising from gold and other non-essential imports through tariff hikes and administrative measures and to boost capital flows through liberalisation and special schemes.
India’s Current Account Deficit (CAD) was USD 32.4 billion in 2013-14 (1.7 percent of GDP), much lower than USD 87.8 billion (4.7 percent of GDP) recorded in 2012-13 on account of narrowing trade deficit and rising net invisibles receipts. In Q4 of 2013-14, CAD stood at USD 1.2 billion (0.2 percent of GDP) compared to USD 4.2 billion (0.9 percent of GDP) during Q3 of 2013-14, which is much lower than USD 31.9 billion, a historic high of 6.5 percent of GDP, during Q3 of 2012-13. There has been a significant deceleration in valuables with curbs on gold imports and this is expected to positively impact household financial savings and help restrain CAD.
In Indian context, sustaining CAD to a comfortable level is not only desired but indispensable too as it would reduce economy’s dependence on volatile foreign capital inflows such as portfolio investments to fund current account deficit. This leads to a balanced situation funded through foreign direct investment that is highly stable.
In addition to containing the current account deficit, efforts have also been made to make the Indian economy more resilient by building buffers. Foreign exchange reserves
have been replenished by mobilising USD 34 billion by way of non-resident Indian (NRI) deposits and bank borrowings in the international market. India’s foreign exchange reserves, which stood at USD 303.7 billion as on March 28, 2014, are comfortable in terms of various reserve adequacy criteria. While India may still be vulnerable to debt outflows on account of disorderly exit from quantitative easing by major central banks, this risk has been mitigated due to the containment of the current account deficit, reduction in the stock of the volatile component of capital flows, and an increase in foreign exchange reserves.
VII. Fiscal Deficit
As the elevated fiscal deficit posed a major challenge to the economy, several measures for fiscal consolidation were adopted such as phased reduction of diesel subsidies. The fiscal performance in 2012-13 was better as the actual gross fiscal deficit declined to 4.9 percent of GDP in 2012-13 as against the budgeted level of 5.1 percent. For 2013-14, gross fiscal deficit stood at 4.5 percent of GDP. It has been budgeted at a further reduced level of 4.1 percent for 2014-15.
VIII. Liquidity
After tighter liquidity conditions observed in 2012-13, the Q1 of 2013-14 witnessed considerably improved scenario with liquidity deficit staying within the comfort zone together with a decline in deposit rate of SCBs, following a reduction in the repo rate. However, to restore stability in the foreign exchange market grounded by capital outflows subsequent to the announcement of tapering of US quantitative easing programme, exceptional liquidity measures were undertaken to tighten the

9
Part One: Policies and Programmes
monetary and liquidity conditions. Hike in Marginal Standing Facility (MSF) rate and Cash Reserve Ratio (CRR) requirement, cap on daily Liquidity Adjustment Facility (LAF) borrowing and weekly auctions of cash management bills (CMBs) were some of the measures carried to drain out liquidity from the economy.
Moderation of exchange rate pressures from September 2013 onwards and evolving macroeconomic situations significantly eased the tight liquidity conditions of Q2 witnessing ongoing normalisation in exceptional monetary measures. However, liquidity conditions altered during the last quarter of 2013-14 as it started with monetary tightening in the first half of February 2014 owing to frictional pressures primarily on account of government cash balances and a rise in currency in circulation. The situation was eased later due to injection of additional liquidity through term repos and forex swaps.
During the year, liquidity injection through the Open Market Operations (OMOs) has been to the tune of about `52,000 crore, while injecting an average daily net liquidity of `90,600 crore through LAF, MSF and term repos. Further to this, Export Credit Refinance (ECR) has inducted a liquidity of `29,400 crore during the year. In 2013-14, the policy repo rate under the Liquidity Adjustment Facility (LAF) has been increased by 25 basis points to stand at 8.0 percent.
IX. Credit Growth
The credit growth decelerated in early 2013-14 owing to slack in macroeconomic activity and deterioration in asset quality. However, later during the year, credit off-take accelerated on account of build-up in credit to services and personal loan category. Deployment of credit to industries
decelerated to 14.1 percent in 2013-14 led by sectors like gems and jewellery, petroleum and mining even though credit to agriculture, food processing, construction, glass and paper recorded a pick up.
Credit flow rate to large and medium sector industries has been lower as compared to micro and small industries. Improved macroeconomic outlook besides easing of liquidity conditions on account of rolling back of the policy rate corridor, has moderated the credit growth in line with the indicative trajectory.
X. Inflation
The inflationary pressures experienced during the financial year started moderating from December 2013. Both WPI and CPI inflation showed signs of easing from the elevated levels recorded during April-November 2013.
The y-o-y WPI inflation was 5.9 percent in 2013-14 compared to 7.4 percent in 2012-13. Commodity-wise break-up shows that inflation on primary articles remained high at 9.9 percent in 2013-14 compared to 9.8 percent in 2012-13. This was primarily due to ascending food prices in major part of the year due to supply-side pressures. The fuel and power segment inflation was 10.1 percent in 2013-14 compared to 10.3 percent in 2012-13. But there was significant moderation in the inflation of manufactured goods which was 2.9 percent in 2013-14 as against 5.4 percent in 2012-13. As the manufactured products constitute 64.97 percent in the WPI, their impact on the overall moderation in inflation level in 2013-14 has been significant.
Retail inflation measured by Consumer Price Index (CPI) moderated in the current year and stood at 8.9 percent as end March 2014 compared to 10.4 percent as end March
10
Annual Report 2013-14
2013, driven by the sharp disinflation observed in food prices primarily in last quarter of the year. Food and beverages group, which contributes 47.6 percent weight in CPI, may be held accountable for the overall CPI inflation as this segment witnessed double digit inflation during the year. However, second half of the year saw moderation in CPI inflation and the figure stood at 8.3 percent as on end March 2014. For the Indian economy to be on a disinflationary path guided by stable monetary policy, it is intended to maintain 8.0 percent CPI by 2015 and further attaining a level of 6.0 percent by 2016.
XI. Trade Balance
Cumulative value of exports in India for the current year stood at USD 312.3 billion as against USD 300.4 billion in 2012-13, registering a growth of 4.0 percent. Meanwhile, imports for the current year witnessed a decline of 8.9 percent over the previous year with a cumulative value of USD 450.1 billion in 2013-14 as against USD 490.7 billion in 2012-13. Consequently, India’s trade deficit narrowed to USD 137.8 billion, much lower than that of USD 190.3 billion in 2012-13.
Import of gold and silver in 2012-13 stood at USD 55.79 billion, which declined to USD 33.46 billion in 2013-14 mainly due to depreciation of the rupee and limitations imposed by the Government on inbound shipments of the precious metal in order to minimize the current account deficit in 2013-14. On the contrary, India’s exports have shown improvement during the year, however, it could not withhold the momentum in November 2013 and eventually turned negative in February 2014 on account of domestic and global factors. Improvement in global and domestic growth prospects in
the months to come would lead to a path of recovery in India’s exports growth.
The foreign exchange reserves replenished during the year and reached their highest during 2013-14 at USD 303.7 billion on March 28, 2014 indicating a rise of USD 11.7 billion from the level of USD 292.0 billion at end March 2013 enhancing India’s capacity to withstand spillovers from the global economy thereby reducing the macro instability risks.
XII. Exchange Rate
During the year, exchange rate movement of rupee in terms of dollar exhibited varied trends with intense pressure in the early months and later recovery owing to various policy reforms and narrowing of current account deficit. The exchange rate as on end March 2013 stood at 54.4 per USD and remained stable in the range of 53-55 per USD in May 2013. However, after May 2013, the monthly average exchange rate of the rupee started depreciating and stood at 68.36 per USD in August 2013. However, rupee survived the US Fed tapering announcement in December 2013 vis-a-vis peer emerging market currencies and the exchange rate stabilised in a narrow range and stood at 59.9 on March 31, 2014, depreciating 10.1 percent over the previous year.
XIII. Capital Markets
The year 2013-14 reaped accomplishments for Indian securities markets with benchmark indices, BSE Sensex and NSE Nifty registering all-time highs in the wake of high volatility observed throughout the year due to global headwinds. Indian stock markets extended their record-breaking spree with the Sensex hitting a new peak and closing 22,386 on March 31, 2014, breaching the 20,000 mark touched during
11
Part One: Policies and Programmes
2012-13. Nifty, too, crossed the 6,000 mark of 2012-13 and logged to a new lifetime high by closing at 6,704 on March 31, 2014. While Sensex observed a growth of 18.8 percent, Nifty recorded a growth of 18.0 percent.
The market capitalisation of BSE stood at `74,15,296 crore as on last trading day of March 2014 as against ̀ 63,87,887 crore at end-March 2013 while its ratio to GDP stood at 65.3 percent for 2013-14. The market capitalisation of NSE was `72,77,720 crore at end-March 2014 compared to `62,39,035 crore as of end-March 2013 while its ratio to GDP stood at 64.1 percent for 2013-14. The third national level stock exchange, MCX-SX, recorded a market captilisation of `72,39,670 crore in 2013-14 and its ratio to GDP at 64.0 percent. The demat statistics at depositories, NSDL and CDSL exhibited an accelerating trend in terms of number of demat accounts and demat quantity. The number of demat accounts at CDSL and NSDL witnessed a growth of 5.4 percent and 2.9 percent respectively over the previous year. Moreover, the number of listed companies at NSE and BSE continued to rise. (Table 1.5a and 1.5b)
The trading activity rebounded slightly in the global listed derivatives markets in 2013, after suffering the largest decline in volumes in more than a decade. As per the Futures Industry Association (FIA) Annual Survey 2013, the total number of futures and options traded on exchanges worldwide reached to a level of 21.6 billion contracts, up by 2.1 percent compared to the previous year but still well below the levels seen in 2011 and 2010. Nonetheless, NSE’s CNX Nifty Index options were the world’s most traded options while, U.S. Dollar/Indian Rupee Futures at NSE and MCX-SX were ranked first and second respectively in terms of foreign exchange futures and options contracts traded in 2013.
The turnover in the Equity derivative segment exhibited an increase of 22.9 percent and stood at `4,75,75,571 crore in 2013-14. Amidst the volatile rupee during the year, the currency derivative segment turnover registered a decline of 23.9 percent to reach `69,80,855 crore in 2013-14. The oldest Stock Exchange, BSE, commenced its operations in currency derivative segment in November 2013 and recorded `2,44,312 crore turnover during November 2013 - March 2014. (Table 1.6)
The introduction of cash settled Interest rate futures on 10-year GoI security in January 2014 heralds the beginning of a new era in the fixed income derivatives market. This step towards integration of the Indian Securities Market with the rest of the world may be seen as a path breaking initiative as it is expected to pave the way for various innovations at the derivative front in the time to come. Interest Rate Derivative segment at NSE also picked up the momentum in 2013-14 and the combined turnover of NSE, BSE and MCX-SX stood at `39,944 crore.
The foreign investments in India contributed by the FIIs/SAs stood at ̀ 15,93,869 crore in 2013-14, an increase of 19.3 percent over the previous year. On the same lines, FDI investments also witnessed a rise of 22.5 percent and assets under custody valued at `2,94,945 crore in 2013-14. (Table 1.7)
SEBI also succeeded in promoting and sustaining an efficient and robust global financial infrastructure with a view to streamline investor protection and to make investors confident and aware while investing in securities market. Various policy reforms in the area of Investor Grievance Redressal Mechanism have been embarked during the financial year. Foreign Portfolio Investors Regulations were notified in order to harmonize the different routes

12
Annual Report 2013-14
for foreign portfolio investments along with introduction of Institutional Trading Platform (ITP) for SME including startups, adoption of new CPSS-IOSCO standards
of PFMIs, launch of cash settled Interest Rate Futures, dedicated debt segment and many such reforms, elaborated in upcoming sections.
Table 1.5 (a): Demat Statistics
YearNSDL CDSL NSDL CDSL
Quantity(million shares)
Quantity(million shares)
Demat Accounts(in lakh)
Demat Accounts(in lakh)
2011-12 5,79,801 1,33,570 120.5 79.0
2012-13 6,86,476 1,51,792 126.9 83.3
2013-14 7,95,503 1,77,311 130.6 87.8
Source: NSDL and CDSL
Table 1.5 (b): No. of Listed Companies
YearNSE BSE MCX-SX
No. of Companies Listed No. of Companies Listed No. of Companies Listed
2011-12 1,646 5,133 Na
2012-13 1,666 5,211 0
2013-14 1,688 5,336 12
Source: NSE, BSE and MCX-SX
Table 1.6 Growth of Turnover in Various Segments of Indian Stock Market
YearTurnover ( ` crore)
Cash Segment Equity Derivatives Currency Derivatives Interest Rate Derivatives
2011-12 34,78,391 3,21,58,208 98,96,413 0
2012-13 32,57,087 3,87,04,572 87,10,504 0
2013-14 33,41,338 4,75,75,571 69,80,855 39,944
Note: Cash segment of MCX-SX commenced its operations from February 11, 2013Source: BSE, NSE, MCX-SX and USE
Table 1.7 Value of Assets of Foreign Investors reported by Custodians
YearFIIs/SAs Foreign Depositories FDI Investments
Foreign Venture Capital Investments
Amount (` crore) Amount (` crore) Amount (` crore) Amount (` crore)
2011-12 11,07,399 1,43,370 2,31,841 35,041
2012-13 13,36,557 1,57,159 2,40,731 54,144
2013-14 15,93,869 1,90,529 2,94,945 48,854
Source: SEBI
13
Part One: Policies and Programmes
2. REVIEW OF POLICIES AND PROGRAMMES
With a view to keep the Indian securities market integrated with the worldwide regulatory regime, incessant developments are essential while in harmony with the objectives enshrined in the SEBI Act, 1992. Alike ever year, 2013-14 as well witnessed various policy reforms initiated by SEBI which are presented in this section.
The developments are categorized under seven major heads viz., Primary Securities Market, Secondary Securities Market, Mutual Funds, Intermediaries associated with Securities Market, Foreign Institutional Investors, Other policies and programmes having a bearing on the working of securities market and Assessment and Prospects.
I. Primary Securities Market
The primary market enables the government as well corporates in raising the capital that is required to meet their requirements of capital expenditure and/or discharge of other obligations such as exit opportunities for venture capitalist/PE firms. A well developed primary market is fundamental for an economy to prosper. In order to further refine the primary market design and boost investor confidence, various measures have been undertaken by SEBI in 2013-14. This section throws light on the policy measures initiated during the financial year:
A. Compliance With The Provisions Of Equity Listing Agreement By Listed Companies - Monitoring by Stock Exchanges
In order to improve the effectiveness of monitoring mechanism of stock exchanges to ascertain the adequacy and accuracy of disclosures made in compliance with the
Listing Agreement, the stock exchanges have been advised to put in place appropriate framework to effectively monitor the disclosures. The stock exchanges have also been advised to put in place an appropriate mechanism for handling complaints related to inadequate and inaccurate disclosures and non-compliances. Stock exchanges are further required to submit ‘exception reports’ to SEBI containing details of companies not responding to the clarifications sought by them and/or where the response submitted by the company is not satisfactory. Further, the stock exchanges have also been advised to disclose the details of promoters / directors / key managerial personnel of defaulting companies on their websites.
B. IPO Grading made voluntary
Considering the requests received from market participants, viz. Investor Associations and Association of Investment Bankers of India (AIBI), the recommendation of the advisory committee of SEBI, and to align with the principles laid down by the Financial Stability Board (FSB) on reducing the reliance on credit rating agencies, the IPO grading mechanism was made “voluntary” as against the earlier provision of the same being “mandatory”.
C. Introduction of General Information Document
The concept of General Information Document (GID) has been implemented. GID shall contain information which is of generic nature (like issue and allotment procedure) and not specific to the issuer, thereby eliminating the repetition of common information in abridged prospectus. This is expected to bring down the size of the abridged prospectus and ultimately reduce the cost of printing.
14
Annual Report 2013-14
D. Amendments to SEBI (Issue of Capital and Disclosure Requirements) Regulations, 2009 relating to preferential issue
With a view to enhance transparency, ensure adequate audit trail and apply lock-in for the shares allotted in preferential issues, the following amendments were carried out to SEBI (Issue of Capital and Disclosure Requirements) Regulations, 2009:
a. Preferential issue shall be subscribed only through the allottee’s own bank account. Further, the issuing company shall disclose the natural persons who are the ultimate beneficial owner of allotted shares and/or who ultimately control the allottee, subject to the condition that if in the ownership chain there is any listed company, mutual fund, bank or insurance company, no further disclosure will be necessary.
b. Allotments in preferential issues shall only be made in dematerialized form.
c. Shares allotted in the preferential issue shall not be transferred till trading approval is granted for such shares by the stock exchanges. Further, the lock-in period shall commence on the date of such trading approval.
E. Revised illustrative format of Statement of Assets and Liabilities in SEBI (Issue of Capital and Disclosure Requirements) Regulations, 2009
The illustrative format of Statement of Assets and Liabilities in offer document which is provided under Regulation - (2)(IX)(B)(9)(f) of Part-A of Schedule VIII of SEBI (Issue of Capital and Disclosure Requirements) Regulations, 2009 was updated and brought in line with the revised Schedule VI of the Companies Act, 1956 and Schedule III of the newly enacted Companies Act, 2013.
F. Format for Auditors’ Certificate required under Clause 24(i) of the Equity Listing Agreement
Clause 24(i) of the Equity Listing Agreement requires that the company, while filing for approval of any draft Scheme of amalgamation / merger / reconstruction, etc. with the stock exchange under clause 24(f) of the equity listing agreement, shall also file an auditors’ certificate to the effect that the accounting treatment contained in the scheme is in compliance with all the accounting standards specified by the Central Government in section 211(3C) of the Companies Act, 1956. It was observed that there is no uniform format for auditors’ certificate as required under clause 24(i) of the equity listing agreement. Auditors’ certificate in different formats was being submitted by the companies with the stock exchanges. In view of the same, a standard format for the same has been prescribed to ensure standardization.
G. Amendments to SEBI (Buy Back of Securities) Regulations, 1998 governing Buy-Back through Open Market Purchase
As part of SEBI’s constant endeavour to align regulatory requirements with the changing market realities as well as to enhance efficiency of the buy-back process, the following changes to buyback of shares or other specified securities from the open market through stock exchange mechanism have been carried out vide amendments to SEBI (Buy Back of Securities) Regulations, 1998:a. The minimum buy-back has been
mandated as 50 percent of the amount earmarked for the buy-back, failing which amount in the escrow account would be forfeited subject to a maximum
15
Part One: Policies and Programmes
of 2.5 percent of the total amount earmarked. However, companies may not be liable for penal action on failure to comply with this requirement in specified circumstances.
b. The maximum buy-back period has been reduced to 6 months from 12 months.
c. The companies shall create an escrow account towards security for performance with an amount equivalent to at least 25 percent of the amount earmarked for buy-back.
d. The company shall not raise further capital for a period of 1 year from the closure of the buy-back except in discharge of subsisting obligations as against the existing 6 months.
e. The company shall not make another buy-back offer within a period of 1 year from the date of closure of the preceding offer.
f. The disclosure requirements have been rationalized requiring disclosure of the shares bought back on a cumulative basis on the website of the company and the stock exchange, only on a daily basis instead of the current requirement of disclosure on daily, fortnightly and monthly basis.
g. The companies shall buy-back 15 percent or more of capital (paid-up capital and free reserves) only by way of tender offer.
h. The procedure for buy-back of physical shares (odd-lot) in open market purchase
method has been introduced which includes creation of separate window in the trading system for tendering the shares, requirement of PAN/Aadhaar for verification, etc.
i. The companies shall extinguish shares bought back during the month, on or before the fifteenth day of the succeeding month subject to the last extinguishment within seven days of the completion of the offer.
j. The promoters of the company shall not execute any transaction, either on-market or off-market, during the buy-back period.
H. Disclosure of Non Disposal Undertaking by Promoters
It was specified that all types of Non Disposal Undertakings (NDUs) by promoters will be covered under the scope of disclosures of “Encumbrances” under the SEBI (Substantial Acquisition of Shares and Takeovers) Regulations, 2011. These NDUs may, inter-alia, include undertaking for:a. not encumbering shares to another
party without the prior approval of the party with whom the shares have been encumbered;
b. non-disposal of shares beyond a certain threshold so as to retain control;
c. non-disposal of shares entailing risk of appropriation or invocation by the party with whom the shares have been encumbered or for its benefit.
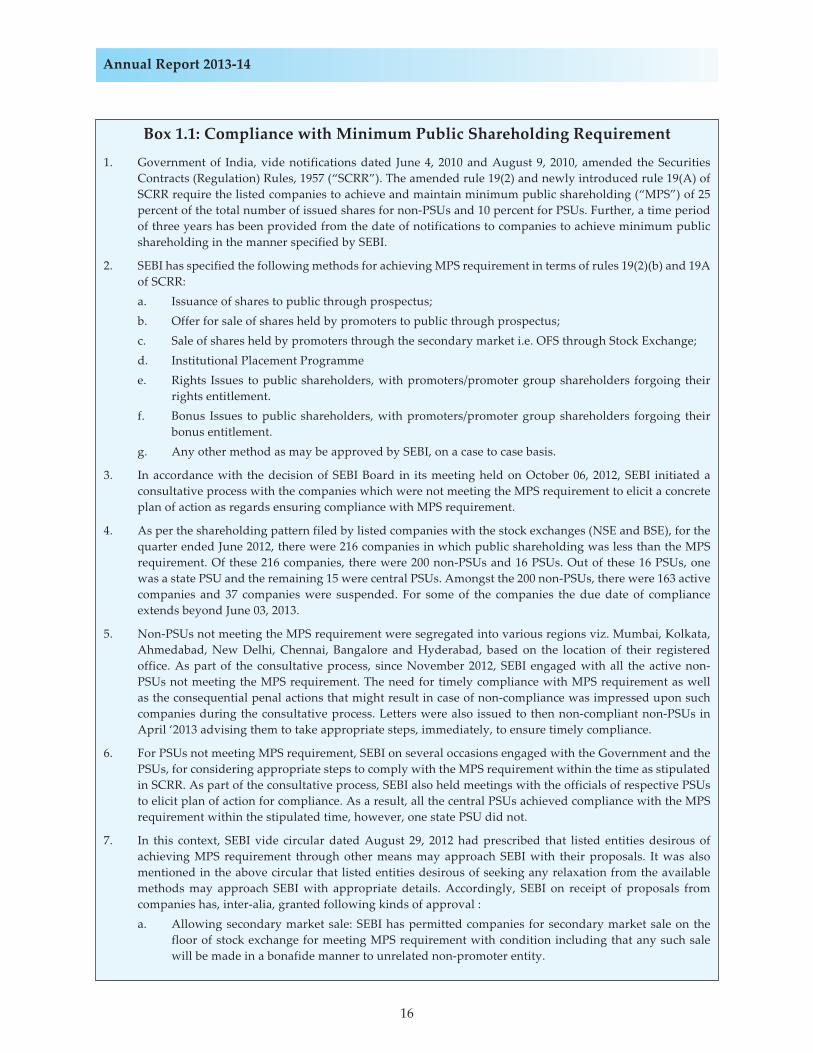
16
Annual Report 2013-14
Box 1.1: Compliance with Minimum Public Shareholding Requirement
1. Government of India, vide notifications dated June 4, 2010 and August 9, 2010, amended the Securities Contracts (Regulation) Rules, 1957 (“SCRR”). The amended rule 19(2) and newly introduced rule 19(A) of SCRR require the listed companies to achieve and maintain minimum public shareholding (“MPS”) of 25 percent of the total number of issued shares for non-PSUs and 10 percent for PSUs. Further, a time period of three years has been provided from the date of notifications to companies to achieve minimum public shareholding in the manner specified by SEBI.
2. SEBI has specified the following methods for achieving MPS requirement in terms of rules 19(2)(b) and 19A of SCRR:
a. Issuance of shares to public through prospectus; b. Offer for sale of shares held by promoters to public through prospectus; c. Sale of shares held by promoters through the secondary market i.e. OFS through Stock Exchange; d. Institutional Placement Programme e. Rights Issues to public shareholders, with promoters/promoter group shareholders forgoing their
rights entitlement. f. Bonus Issues to public shareholders, with promoters/promoter group shareholders forgoing their
bonus entitlement. g. Any other method as may be approved by SEBI, on a case to case basis.
3. In accordance with the decision of SEBI Board in its meeting held on October 06, 2012, SEBI initiated a consultative process with the companies which were not meeting the MPS requirement to elicit a concrete plan of action as regards ensuring compliance with MPS requirement.
4. As per the shareholding pattern filed by listed companies with the stock exchanges (NSE and BSE), for the quarter ended June 2012, there were 216 companies in which public shareholding was less than the MPS requirement. Of these 216 companies, there were 200 non-PSUs and 16 PSUs. Out of these 16 PSUs, one was a state PSU and the remaining 15 were central PSUs. Amongst the 200 non-PSUs, there were 163 active companies and 37 companies were suspended. For some of the companies the due date of compliance extends beyond June 03, 2013.
5. Non-PSUs not meeting the MPS requirement were segregated into various regions viz. Mumbai, Kolkata, Ahmedabad, New Delhi, Chennai, Bangalore and Hyderabad, based on the location of their registered office. As part of the consultative process, since November 2012, SEBI engaged with all the active non-PSUs not meeting the MPS requirement. The need for timely compliance with MPS requirement as well as the consequential penal actions that might result in case of non-compliance was impressed upon such companies during the consultative process. Letters were also issued to then non-compliant non-PSUs in April ‘2013 advising them to take appropriate steps, immediately, to ensure timely compliance.
6. For PSUs not meeting MPS requirement, SEBI on several occasions engaged with the Government and the PSUs, for considering appropriate steps to comply with the MPS requirement within the time as stipulated in SCRR. As part of the consultative process, SEBI also held meetings with the officials of respective PSUs to elicit plan of action for compliance. As a result, all the central PSUs achieved compliance with the MPS requirement within the stipulated time, however, one state PSU did not.
7. In this context, SEBI vide circular dated August 29, 2012 had prescribed that listed entities desirous of achieving MPS requirement through other means may approach SEBI with their proposals. It was also mentioned in the above circular that listed entities desirous of seeking any relaxation from the available methods may approach SEBI with appropriate details. Accordingly, SEBI on receipt of proposals from companies has, inter-alia, granted following kinds of approval :
a. Allowing secondary market sale: SEBI has permitted companies for secondary market sale on the floor of stock exchange for meeting MPS requirement with condition including that any such sale will be made in a bonafide manner to unrelated non-promoter entity.
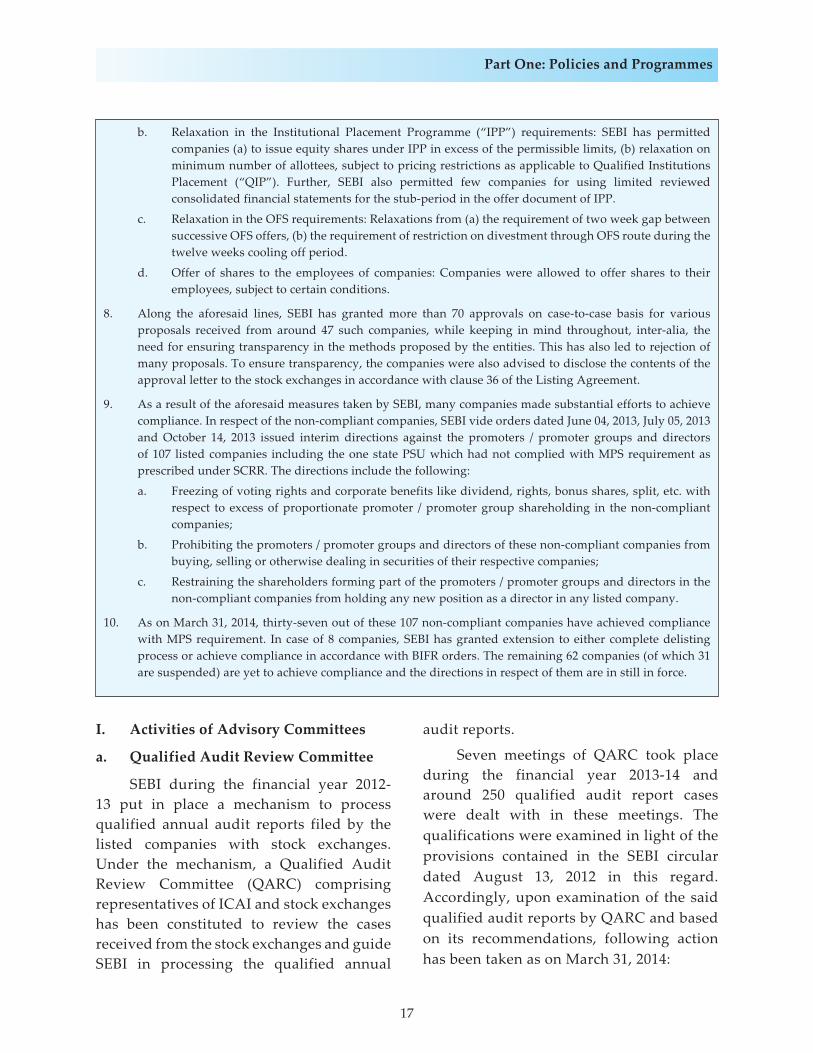
17
Part One: Policies and Programmes
I. Activities of Advisory Committees
a. Qualified Audit Review Committee
SEBI during the financial year 2012-13 put in place a mechanism to process qualified annual audit reports filed by the listed companies with stock exchanges. Under the mechanism, a Qualified Audit Review Committee (QARC) comprising representatives of ICAI and stock exchanges has been constituted to review the cases received from the stock exchanges and guide SEBI in processing the qualified annual
audit reports.
Seven meetings of QARC took place during the financial year 2013-14 and around 250 qualified audit report cases were dealt with in these meetings. The qualifications were examined in light of the provisions contained in the SEBI circular dated August 13, 2012 in this regard. Accordingly, upon examination of the said qualified audit reports by QARC and based on its recommendations, following action has been taken as on March 31, 2014:
b. Relaxation in the Institutional Placement Programme (“IPP”) requirements: SEBI has permitted companies (a) to issue equity shares under IPP in excess of the permissible limits, (b) relaxation on minimum number of allottees, subject to pricing restrictions as applicable to Qualified Institutions Placement (“QIP”). Further, SEBI also permitted few companies for using limited reviewed consolidated financial statements for the stub-period in the offer document of IPP.
c. Relaxation in the OFS requirements: Relaxations from (a) the requirement of two week gap between successive OFS offers, (b) the requirement of restriction on divestment through OFS route during the twelve weeks cooling off period.
d. Offer of shares to the employees of companies: Companies were allowed to offer shares to their employees, subject to certain conditions.
8. Along the aforesaid lines, SEBI has granted more than 70 approvals on case-to-case basis for various proposals received from around 47 such companies, while keeping in mind throughout, inter-alia, the need for ensuring transparency in the methods proposed by the entities. This has also led to rejection of many proposals. To ensure transparency, the companies were also advised to disclose the contents of the approval letter to the stock exchanges in accordance with clause 36 of the Listing Agreement.
9. As a result of the aforesaid measures taken by SEBI, many companies made substantial efforts to achieve compliance. In respect of the non-compliant companies, SEBI vide orders dated June 04, 2013, July 05, 2013 and October 14, 2013 issued interim directions against the promoters / promoter groups and directors of 107 listed companies including the one state PSU which had not complied with MPS requirement as prescribed under SCRR. The directions include the following:
a. Freezing of voting rights and corporate benefits like dividend, rights, bonus shares, split, etc. with respect to excess of proportionate promoter / promoter group shareholding in the non-compliant companies;
b. Prohibiting the promoters / promoter groups and directors of these non-compliant companies from buying, selling or otherwise dealing in securities of their respective companies;
c. Restraining the shareholders forming part of the promoters / promoter groups and directors in the non-compliant companies from holding any new position as a director in any listed company.
10. As on March 31, 2014, thirty-seven out of these 107 non-compliant companies have achieved compliance with MPS requirement. In case of 8 companies, SEBI has granted extension to either complete delisting process or achieve compliance in accordance with BIFR orders. The remaining 62 companies (of which 31 are suspended) are yet to achieve compliance and the directions in respect of them are in still in force.
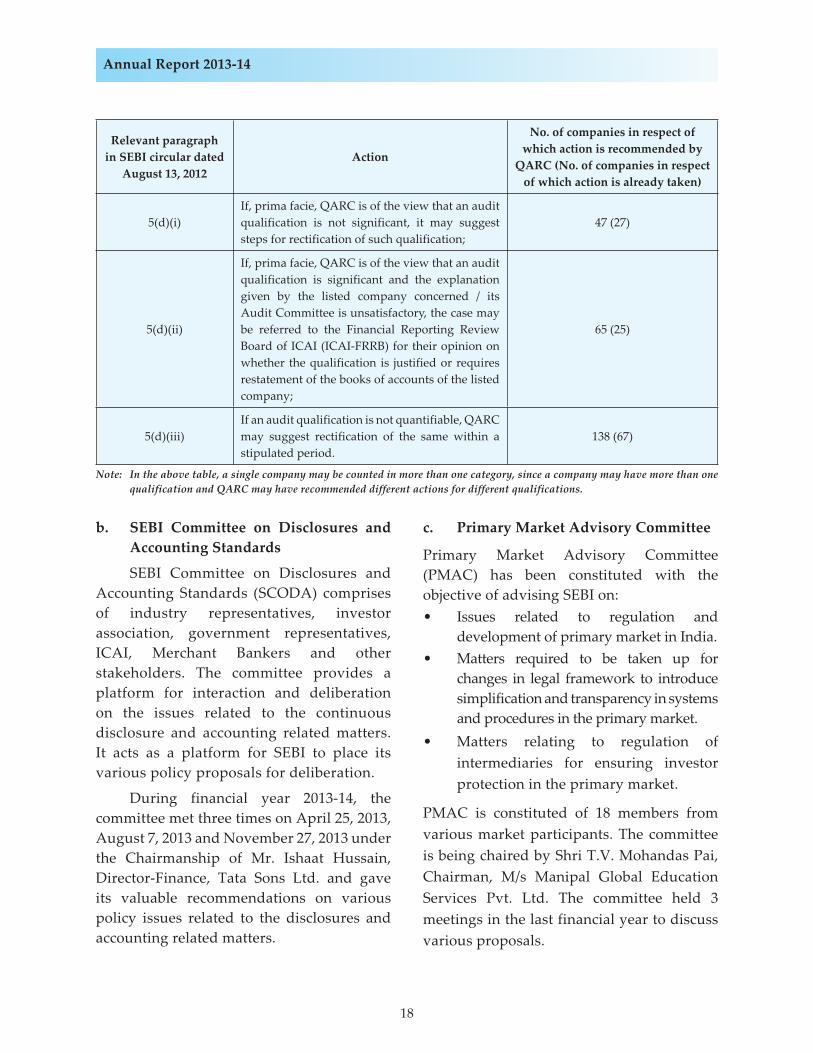
18
Annual Report 2013-14
Relevant paragraph in SEBI circular dated
August 13, 2012Action
No. of companies in respect of which action is recommended by
QARC (No. of companies in respect of which action is already taken)
5(d)(i)If, prima facie, QARC is of the view that an audit qualification is not significant, it may suggest steps for rectification of such qualification;
47 (27)
5(d)(ii)
If, prima facie, QARC is of the view that an audit qualification is significant and the explanation given by the listed company concerned / its Audit Committee is unsatisfactory, the case may be referred to the Financial Reporting Review Board of ICAI (ICAI-FRRB) for their opinion on whether the qualification is justified or requires restatement of the books of accounts of the listed company;
65 (25)
5(d)(iii)If an audit qualification is not quantifiable, QARC may suggest rectification of the same within a stipulated period.
138 (67)
Note: In the above table, a single company may be counted in more than one category, since a company may have more than one qualification and QARC may have recommended different actions for different qualifications.
b. SEBI Committee on Disclosures and Accounting Standards
SEBI Committee on Disclosures and Accounting Standards (SCODA) comprises of industry representatives, investor association, government representatives, ICAI, Merchant Bankers and other stakeholders. The committee provides a platform for interaction and deliberation on the issues related to the continuous disclosure and accounting related matters. It acts as a platform for SEBI to place its various policy proposals for deliberation.
During financial year 2013-14, the committee met three times on April 25, 2013, August 7, 2013 and November 27, 2013 under the Chairmanship of Mr. Ishaat Hussain, Director-Finance, Tata Sons Ltd. and gave its valuable recommendations on various policy issues related to the disclosures and accounting related matters.
c. Primary Market Advisory Committee
Primary Market Advisory Committee (PMAC) has been constituted with the objective of advising SEBI on:• Issues related to regulation and
development of primary market in India.• Matters required to be taken up for
changes in legal framework to introduce simplification and transparency in systems and procedures in the primary market.
• Matters relating to regulation of intermediaries for ensuring investor protection in the primary market.
PMAC is constituted of 18 members from various market participants. The committee is being chaired by Shri T.V. Mohandas Pai, Chairman, M/s Manipal Global Education Services Pvt. Ltd. The committee held 3 meetings in the last financial year to discuss various proposals.
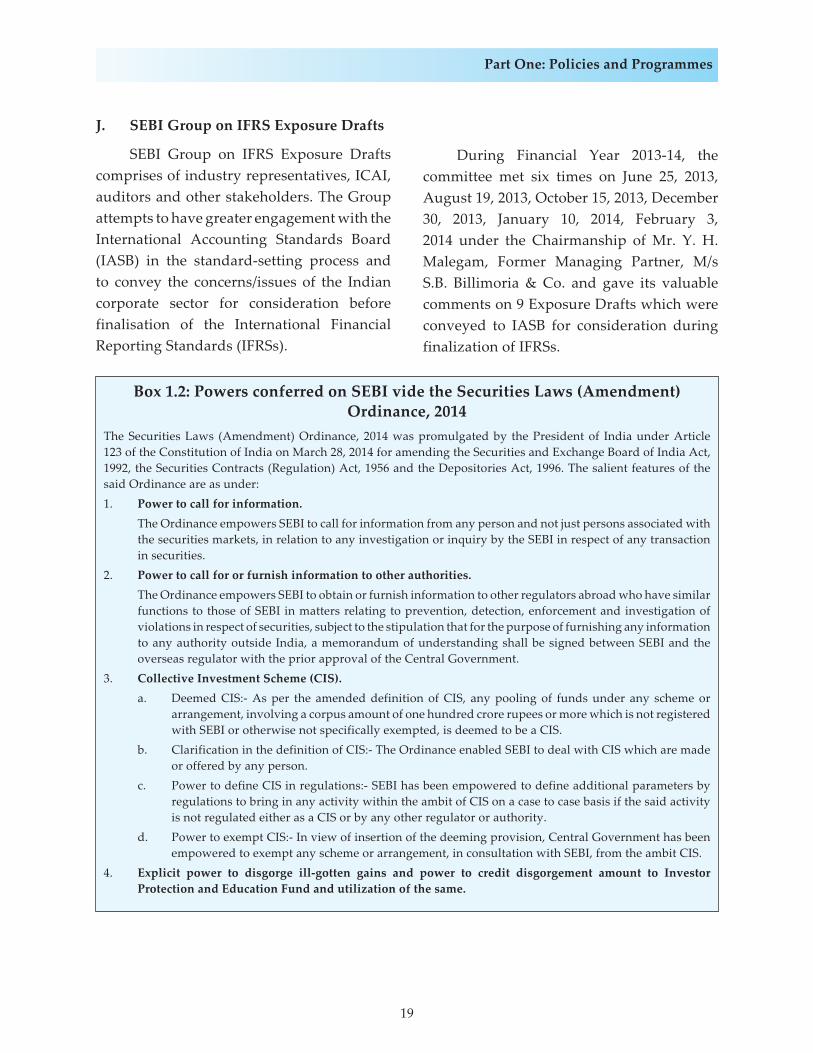
19
Part One: Policies and Programmes
J. SEBI Group on IFRS Exposure Drafts
SEBI Group on IFRS Exposure Drafts comprises of industry representatives, ICAI, auditors and other stakeholders. The Group attempts to have greater engagement with the International Accounting Standards Board (IASB) in the standard-setting process and to convey the concerns/issues of the Indian corporate sector for consideration before finalisation of the International Financial Reporting Standards (IFRSs).
During Financial Year 2013-14, the committee met six times on June 25, 2013, August 19, 2013, October 15, 2013, December 30, 2013, January 10, 2014, February 3, 2014 under the Chairmanship of Mr. Y. H. Malegam, Former Managing Partner, M/s S.B. Billimoria & Co. and gave its valuable comments on 9 Exposure Drafts which were conveyed to IASB for consideration during finalization of IFRSs.
Box 1.2: Powers conferred on SEBI vide the Securities Laws (Amendment) Ordinance, 2014
The Securities Laws (Amendment) Ordinance, 2014 was promulgated by the President of India under Article 123 of the Constitution of India on March 28, 2014 for amending the Securities and Exchange Board of India Act, 1992, the Securities Contracts (Regulation) Act, 1956 and the Depositories Act, 1996. The salient features of the said Ordinance are as under:1. Power to call for information. The Ordinance empowers SEBI to call for information from any person and not just persons associated with
the securities markets, in relation to any investigation or inquiry by the SEBI in respect of any transaction in securities.
2. Power to call for or furnish information to other authorities. The Ordinance empowers SEBI to obtain or furnish information to other regulators abroad who have similar
functions to those of SEBI in matters relating to prevention, detection, enforcement and investigation of violations in respect of securities, subject to the stipulation that for the purpose of furnishing any information to any authority outside India, a memorandum of understanding shall be signed between SEBI and the overseas regulator with the prior approval of the Central Government.
3. Collective Investment Scheme (CIS).a. Deemed CIS:- As per the amended definition of CIS, any pooling of funds under any scheme or
arrangement, involving a corpus amount of one hundred crore rupees or more which is not registered with SEBI or otherwise not specifically exempted, is deemed to be a CIS.
b. Clarification in the definition of CIS:- The Ordinance enabled SEBI to deal with CIS which are made or offered by any person.
c. Power to define CIS in regulations:- SEBI has been empowered to define additional parameters by regulations to bring in any activity within the ambit of CIS on a case to case basis if the said activity is not regulated either as a CIS or by any other regulator or authority.
d. Power to exempt CIS:- In view of insertion of the deeming provision, Central Government has been empowered to exempt any scheme or arrangement, in consultation with SEBI, from the ambit CIS.
4. Explicit power to disgorge ill-gotten gains and power to credit disgorgement amount to Investor Protection and Education Fund and utilization of the same.
20
Annual Report 2013-14
II. Secondary Securities Market
Secondary market witnessed volatility amidst global and domestic factors, but stock indices, Sensex and Nifty scaled new heights in 2013-14 as robust FII inflows and upbeat domestic market sentiment helped to overcome concerns over slowing economic growth and high inflation. Secondary markets, which serve as a barometer of the financial health of an Indian economy, entail continuous technological advancements accompanied by review of existing guidelines so as to maintain a competitive edge. Following were the major policy initiatives taken by SEBI relating to the secondary market during 2013-14:
A. Listing of Specified Securities of Small and Medium Enterprises on the Institutional Trading Platform in a SME Exchange without making an Initial Public Offer
In order to facilitate capital raising by small and medium enterprises including start-up companies which are in their early stages of growth and to provide for easier exit options for informed investors like angel investors, VCFs and PEs etc., from such companies, it has been decided to permit listing without an IPO and trading of specified securities of small and medium enterprises (SMEs) including start-up companies on Institutional Trading Platform (ITP) in SME Exchanges.
The legal framework for such listing and trading of the specified securities on the ITP was laid down vide SEBI (Listing of Specified Securities on Institutional Trading Platform) Regulations, 2013(ITP Regulations) vide Gazette notification No. LAD-NRO/GN/2013-14/27/6720 dated October 08, 2013. The salient features of the said amendments are listed below. (Box 1.3)
SEBI has been explicitly empowered to disgorge ill-gotten gains and credit the same to the Investor Protection and Education Fund and utilise the said monies in accordance with the regulations made in this behalf.
5. Power to conduct search and seizure. The Ordinance permits conduct of search and seizure with the authorization of Chairman, SEBI.6. Explicit powers for settlement. The Ordinance expressly empowers SEBI to settle administrative and civil proceedings on such terms as
may be determined by SEBI in accordance with procedures specified in the regulations.7. Power of review of orders passed by adjudicating officers. SEBI Board has now been empowered to suo moto review any order passed by the Adjudicating Officer and
impose a higher penalty in cases where it deems fit.8. Attachment and recovery. SEBI has now been empowered to attach and sell movable, immovable property and attach bank accounts
of the defaulters, in pursuance of any order or direction passed by SEBI or to recover fees due to it or recover penalties which are outstanding.
9. Special Courts and deemed public prosecutors. The Ordinance provides for constitution of Special Courts for prosecution of offences under securities laws.
The Ordinance further provides that councils engaged by SEBI in a trial before the special / sessions Court shall be deemed to be public prosecutors for such prosecution proceedings.
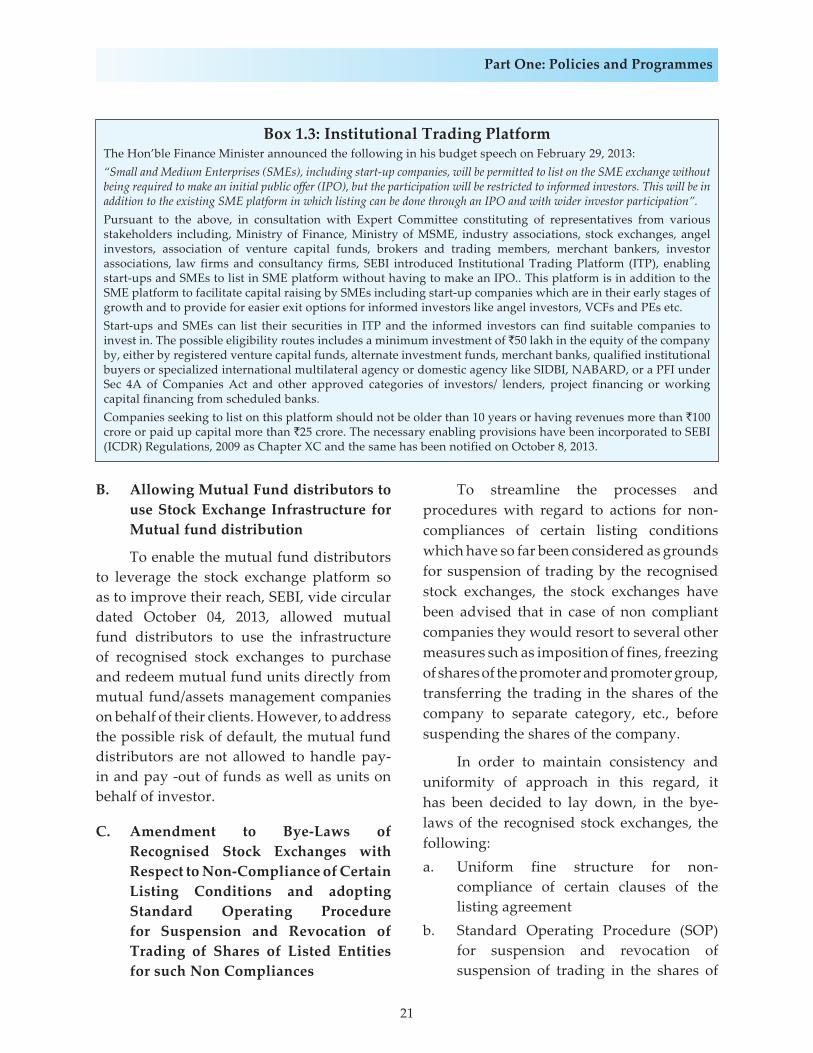
21
Part One: Policies and Programmes
Box 1.3: Institutional Trading PlatformThe Hon’ble Finance Minister announced the following in his budget speech on February 29, 2013:“Small and Medium Enterprises (SMEs), including start-up companies, will be permitted to list on the SME exchange without being required to make an initial public offer (IPO), but the participation will be restricted to informed investors. This will be in addition to the existing SME platform in which listing can be done through an IPO and with wider investor participation”.Pursuant to the above, in consultation with Expert Committee constituting of representatives from various stakeholders including, Ministry of Finance, Ministry of MSME, industry associations, stock exchanges, angel investors, association of venture capital funds, brokers and trading members, merchant bankers, investor associations, law firms and consultancy firms, SEBI introduced Institutional Trading Platform (ITP), enabling start-ups and SMEs to list in SME platform without having to make an IPO.. This platform is in addition to the SME platform to facilitate capital raising by SMEs including start-up companies which are in their early stages of growth and to provide for easier exit options for informed investors like angel investors, VCFs and PEs etc.Start-ups and SMEs can list their securities in ITP and the informed investors can find suitable companies to invest in. The possible eligibility routes includes a minimum investment of `50 lakh in the equity of the company by, either by registered venture capital funds, alternate investment funds, merchant banks, qualified institutional buyers or specialized international multilateral agency or domestic agency like SIDBI, NABARD, or a PFI under Sec 4A of Companies Act and other approved categories of investors/ lenders, project financing or working capital financing from scheduled banks.Companies seeking to list on this platform should not be older than 10 years or having revenues more than `100 crore or paid up capital more than `25 crore. The necessary enabling provisions have been incorporated to SEBI (ICDR) Regulations, 2009 as Chapter XC and the same has been notified on October 8, 2013.
B. Allowing Mutual Fund distributors to use Stock Exchange Infrastructure for Mutual fund distribution
To enable the mutual fund distributors to leverage the stock exchange platform so as to improve their reach, SEBI, vide circular dated October 04, 2013, allowed mutual fund distributors to use the infrastructure of recognised stock exchanges to purchase and redeem mutual fund units directly from mutual fund/assets management companies on behalf of their clients. However, to address the possible risk of default, the mutual fund distributors are not allowed to handle pay-in and pay -out of funds as well as units on behalf of investor.
C. Amendment to Bye-Laws of Recognised Stock Exchanges with Respect to Non-Compliance of Certain Listing Conditions and adopting Standard Operating Procedure for Suspension and Revocation of Trading of Shares of Listed Entities for such Non Compliances
To streamline the processes and procedures with regard to actions for non-compliances of certain listing conditions which have so far been considered as grounds for suspension of trading by the recognised stock exchanges, the stock exchanges have been advised that in case of non compliant companies they would resort to several other measures such as imposition of fines, freezing of shares of the promoter and promoter group, transferring the trading in the shares of the company to separate category, etc., before suspending the shares of the company.
In order to maintain consistency and uniformity of approach in this regard, it has been decided to lay down, in the bye-laws of the recognised stock exchanges, the following:a. Uniform fine structure for non-
compliance of certain clauses of the listing agreement
b. Standard Operating Procedure (SOP) for suspension and revocation of suspension of trading in the shares of
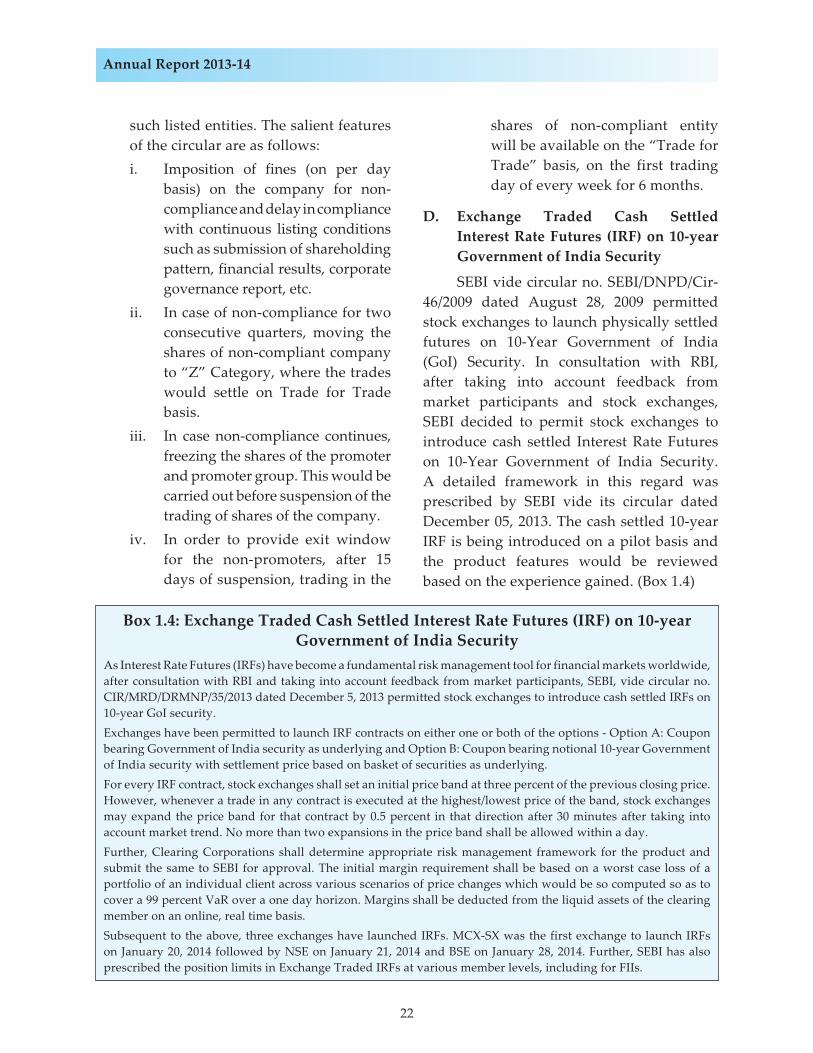
22
Annual Report 2013-14
such listed entities. The salient features of the circular are as follows:i. Imposition of fines (on per day
basis) on the company for non-compliance and delay in compliance with continuous listing conditions such as submission of shareholding pattern, financial results, corporate governance report, etc.
ii. In case of non-compliance for two consecutive quarters, moving the shares of non-compliant company to “Z” Category, where the trades would settle on Trade for Trade basis.
iii. In case non-compliance continues, freezing the shares of the promoter and promoter group. This would be carried out before suspension of the trading of shares of the company.
iv. In order to provide exit window for the non-promoters, after 15 days of suspension, trading in the
shares of non-compliant entity will be available on the “Trade for Trade” basis, on the first trading day of every week for 6 months.
D. Exchange Traded Cash Settled Interest Rate Futures (IRF) on 10-year Government of India Security
SEBI vide circular no. SEBI/DNPD/Cir-46/2009 dated August 28, 2009 permitted stock exchanges to launch physically settled futures on 10-Year Government of India (GoI) Security. In consultation with RBI, after taking into account feedback from market participants and stock exchanges, SEBI decided to permit stock exchanges to introduce cash settled Interest Rate Futures on 10-Year Government of India Security. A detailed framework in this regard was prescribed by SEBI vide its circular dated December 05, 2013. The cash settled 10-year IRF is being introduced on a pilot basis and the product features would be reviewed based on the experience gained. (Box 1.4)
Box 1.4: Exchange Traded Cash Settled Interest Rate Futures (IRF) on 10-yearGovernment of India Security
As Interest Rate Futures (IRFs) have become a fundamental risk management tool for financial markets worldwide, after consultation with RBI and taking into account feedback from market participants, SEBI, vide circular no. CIR/MRD/DRMNP/35/2013 dated December 5, 2013 permitted stock exchanges to introduce cash settled IRFs on 10-year GoI security.Exchanges have been permitted to launch IRF contracts on either one or both of the options - Option A: Coupon bearing Government of India security as underlying and Option B: Coupon bearing notional 10-year Government of India security with settlement price based on basket of securities as underlying.For every IRF contract, stock exchanges shall set an initial price band at three percent of the previous closing price. However, whenever a trade in any contract is executed at the highest/lowest price of the band, stock exchanges may expand the price band for that contract by 0.5 percent in that direction after 30 minutes after taking into account market trend. No more than two expansions in the price band shall be allowed within a day.Further, Clearing Corporations shall determine appropriate risk management framework for the product and submit the same to SEBI for approval. The initial margin requirement shall be based on a worst case loss of a portfolio of an individual client across various scenarios of price changes which would be so computed so as to cover a 99 percent VaR over a one day horizon. Margins shall be deducted from the liquid assets of the clearing member on an online, real time basis.Subsequent to the above, three exchanges have launched IRFs. MCX-SX was the first exchange to launch IRFs on January 20, 2014 followed by NSE on January 21, 2014 and BSE on January 28, 2014. Further, SEBI has also prescribed the position limits in Exchange Traded IRFs at various member levels, including for FIIs.
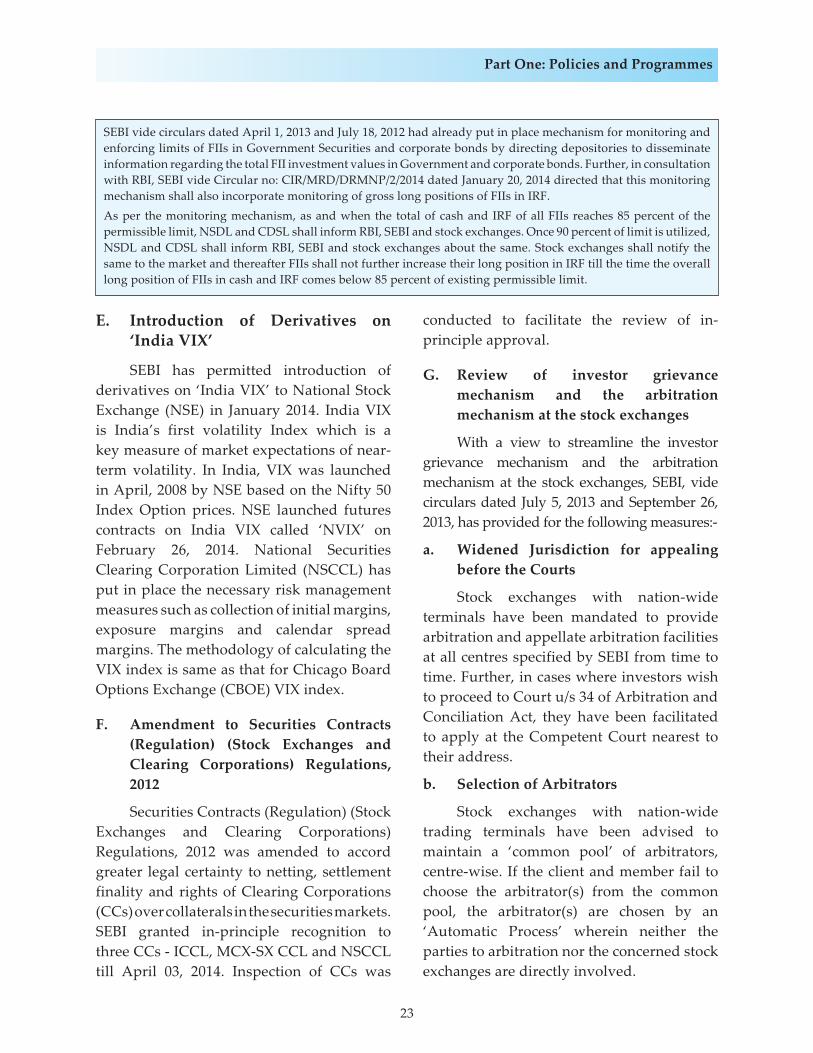
23
Part One: Policies and Programmes
SEBI vide circulars dated April 1, 2013 and July 18, 2012 had already put in place mechanism for monitoring and enforcing limits of FIIs in Government Securities and corporate bonds by directing depositories to disseminate information regarding the total FII investment values in Government and corporate bonds. Further, in consultation with RBI, SEBI vide Circular no: CIR/MRD/DRMNP/2/2014 dated January 20, 2014 directed that this monitoring mechanism shall also incorporate monitoring of gross long positions of FIIs in IRF.As per the monitoring mechanism, as and when the total of cash and IRF of all FIIs reaches 85 percent of the permissible limit, NSDL and CDSL shall inform RBI, SEBI and stock exchanges. Once 90 percent of limit is utilized, NSDL and CDSL shall inform RBI, SEBI and stock exchanges about the same. Stock exchanges shall notify the same to the market and thereafter FIIs shall not further increase their long position in IRF till the time the overall long position of FIIs in cash and IRF comes below 85 percent of existing permissible limit.
E. Introduction of Derivatives on ‘India VIX’
SEBI has permitted introduction of derivatives on ‘India VIX’ to National Stock Exchange (NSE) in January 2014. India VIX is India’s first volatility Index which is a key measure of market expectations of near-term volatility. In India, VIX was launched in April, 2008 by NSE based on the Nifty 50 Index Option prices. NSE launched futures contracts on India VIX called ‘NVIX’ on February 26, 2014. National Securities Clearing Corporation Limited (NSCCL) has put in place the necessary risk management measures such as collection of initial margins, exposure margins and calendar spread margins. The methodology of calculating the VIX index is same as that for Chicago Board Options Exchange (CBOE) VIX index.
F. Amendment to Securities Contracts (Regulation) (Stock Exchanges and Clearing Corporations) Regulations, 2012
Securities Contracts (Regulation) (Stock Exchanges and Clearing Corporations) Regulations, 2012 was amended to accord greater legal certainty to netting, settlement finality and rights of Clearing Corporations (CCs) over collaterals in the securities markets. SEBI granted in-principle recognition to three CCs - ICCL, MCX-SX CCL and NSCCL till April 03, 2014. Inspection of CCs was
conducted to facilitate the review of in-principle approval.
G. Review of investor grievance mechanism and the arbitration mechanism at the stock exchanges
With a view to streamline the investor grievance mechanism and the arbitration mechanism at the stock exchanges, SEBI, vide circulars dated July 5, 2013 and September 26, 2013, has provided for the following measures:-
a. Widened Jurisdiction for appealing before the Courts
Stock exchanges with nation-wide terminals have been mandated to provide arbitration and appellate arbitration facilities at all centres specified by SEBI from time to time. Further, in cases where investors wish to proceed to Court u/s 34 of Arbitration and Conciliation Act, they have been facilitated to apply at the Competent Court nearest to their address.
b. Selection of Arbitrators
Stock exchanges with nation-wide trading terminals have been advised to maintain a ‘common pool’ of arbitrators, centre-wise. If the client and member fail to choose the arbitrator(s) from the common pool, the arbitrator(s) are chosen by an ‘Automatic Process’ wherein neither the parties to arbitration nor the concerned stock exchanges are directly involved.
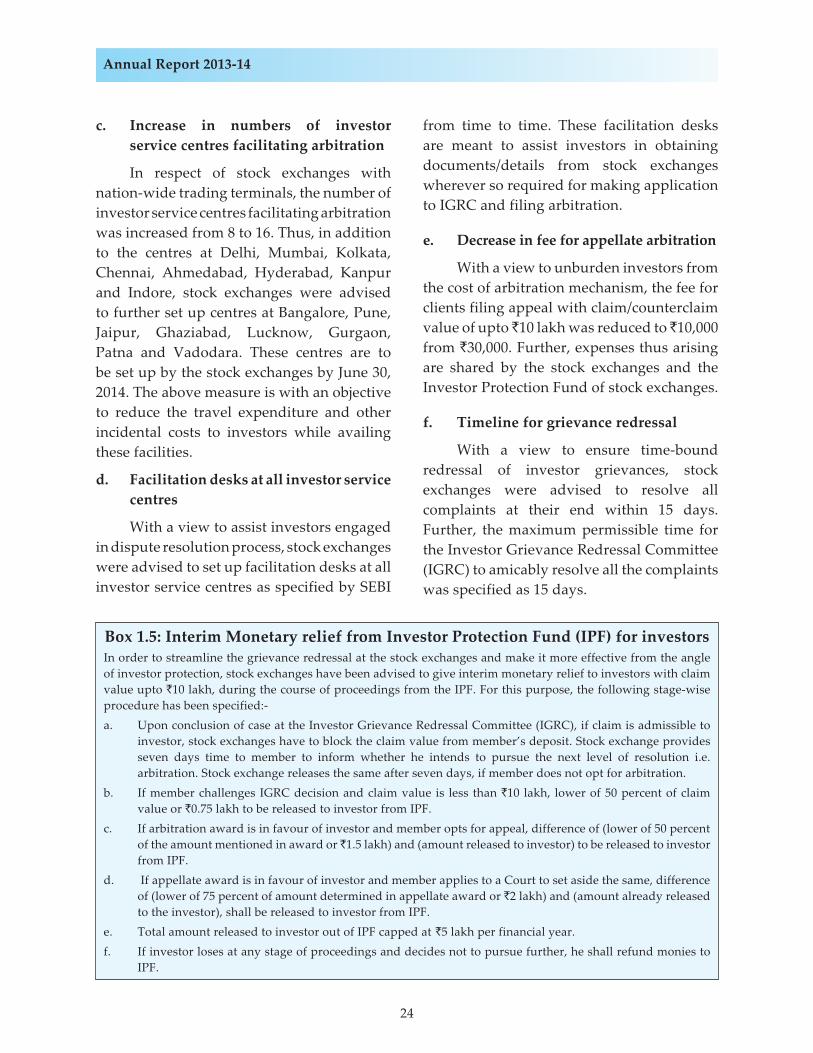
24
Annual Report 2013-14
c. Increase in numbers of investor service centres facilitating arbitration
In respect of stock exchanges with nation-wide trading terminals, the number of investor service centres facilitating arbitration was increased from 8 to 16. Thus, in addition to the centres at Delhi, Mumbai, Kolkata, Chennai, Ahmedabad, Hyderabad, Kanpur and Indore, stock exchanges were advised to further set up centres at Bangalore, Pune, Jaipur, Ghaziabad, Lucknow, Gurgaon, Patna and Vadodara. These centres are to be set up by the stock exchanges by June 30, 2014. The above measure is with an objective to reduce the travel expenditure and other incidental costs to investors while availing these facilities.
d. Facilitation desks at all investor service centres
With a view to assist investors engaged in dispute resolution process, stock exchanges were advised to set up facilitation desks at all investor service centres as specified by SEBI
from time to time. These facilitation desks are meant to assist investors in obtaining documents/details from stock exchanges wherever so required for making application to IGRC and filing arbitration.
e. Decrease in fee for appellate arbitration
With a view to unburden investors from the cost of arbitration mechanism, the fee for clients filing appeal with claim/counterclaim value of upto ̀ 10 lakh was reduced to ̀ 10,000 from `30,000. Further, expenses thus arising are shared by the stock exchanges and the Investor Protection Fund of stock exchanges.
f. Timeline for grievance redressal
With a view to ensure time-bound redressal of investor grievances, stock exchanges were advised to resolve all complaints at their end within 15 days. Further, the maximum permissible time for the Investor Grievance Redressal Committee (IGRC) to amicably resolve all the complaints was specified as 15 days.
Box 1.5: Interim Monetary relief from Investor Protection Fund (IPF) for investorsIn order to streamline the grievance redressal at the stock exchanges and make it more effective from the angle of investor protection, stock exchanges have been advised to give interim monetary relief to investors with claim value upto `10 lakh, during the course of proceedings from the IPF. For this purpose, the following stage-wise procedure has been specified:-a. Upon conclusion of case at the Investor Grievance Redressal Committee (IGRC), if claim is admissible to
investor, stock exchanges have to block the claim value from member’s deposit. Stock exchange provides seven days time to member to inform whether he intends to pursue the next level of resolution i.e. arbitration. Stock exchange releases the same after seven days, if member does not opt for arbitration.
b. If member challenges IGRC decision and claim value is less than `10 lakh, lower of 50 percent of claim value or `0.75 lakh to be released to investor from IPF.
c. If arbitration award is in favour of investor and member opts for appeal, difference of (lower of 50 percent of the amount mentioned in award or `1.5 lakh) and (amount released to investor) to be released to investor from IPF.
d. If appellate award is in favour of investor and member applies to a Court to set aside the same, difference of (lower of 75 percent of amount determined in appellate award or `2 lakh) and (amount already released to the investor), shall be released to investor from IPF.
e. Total amount released to investor out of IPF capped at `5 lakh per financial year.f. If investor loses at any stage of proceedings and decides not to pursue further, he shall refund monies to
IPF.
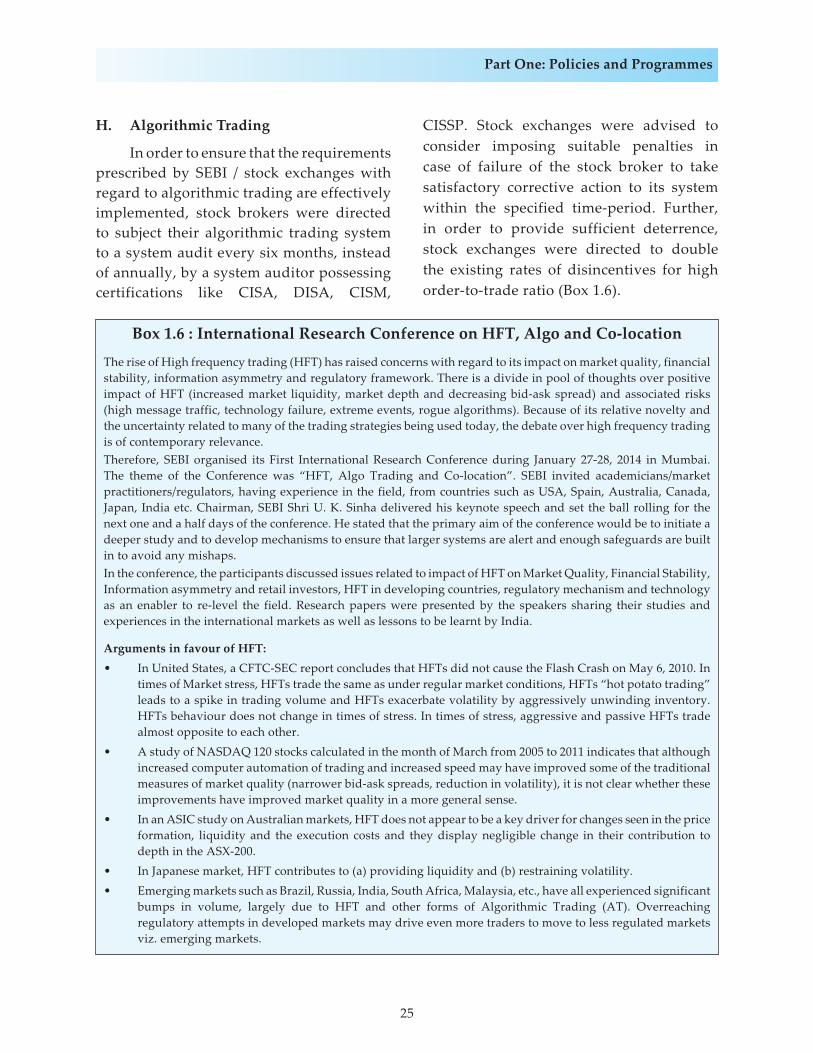
25
Part One: Policies and Programmes
Box 1.6 : International Research Conference on HFT, Algo and Co-location
The rise of High frequency trading (HFT) has raised concerns with regard to its impact on market quality, financial stability, information asymmetry and regulatory framework. There is a divide in pool of thoughts over positive impact of HFT (increased market liquidity, market depth and decreasing bid-ask spread) and associated risks (high message traffic, technology failure, extreme events, rogue algorithms). Because of its relative novelty and the uncertainty related to many of the trading strategies being used today, the debate over high frequency trading is of contemporary relevance.Therefore, SEBI organised its First International Research Conference during January 27-28, 2014 in Mumbai. The theme of the Conference was “HFT, Algo Trading and Co-location”. SEBI invited academicians/market practitioners/regulators, having experience in the field, from countries such as USA, Spain, Australia, Canada, Japan, India etc. Chairman, SEBI Shri U. K. Sinha delivered his keynote speech and set the ball rolling for the next one and a half days of the conference. He stated that the primary aim of the conference would be to initiate a deeper study and to develop mechanisms to ensure that larger systems are alert and enough safeguards are built in to avoid any mishaps.In the conference, the participants discussed issues related to impact of HFT on Market Quality, Financial Stability, Information asymmetry and retail investors, HFT in developing countries, regulatory mechanism and technology as an enabler to re-level the field. Research papers were presented by the speakers sharing their studies and experiences in the international markets as well as lessons to be learnt by India.
Arguments in favour of HFT:• In United States, a CFTC-SEC report concludes that HFTs did not cause the Flash Crash on May 6, 2010. In
times of Market stress, HFTs trade the same as under regular market conditions, HFTs “hot potato trading” leads to a spike in trading volume and HFTs exacerbate volatility by aggressively unwinding inventory. HFTs behaviour does not change in times of stress. In times of stress, aggressive and passive HFTs trade almost opposite to each other.
• A study of NASDAQ 120 stocks calculated in the month of March from 2005 to 2011 indicates that although increased computer automation of trading and increased speed may have improved some of the traditional measures of market quality (narrower bid-ask spreads, reduction in volatility), it is not clear whether these improvements have improved market quality in a more general sense.
• In an ASIC study on Australian markets, HFT does not appear to be a key driver for changes seen in the price formation, liquidity and the execution costs and they display negligible change in their contribution to depth in the ASX-200.
• In Japanese market, HFT contributes to (a) providing liquidity and (b) restraining volatility.• Emerging markets such as Brazil, Russia, India, South Africa, Malaysia, etc., have all experienced significant
bumps in volume, largely due to HFT and other forms of Algorithmic Trading (AT). Overreaching regulatory attempts in developed markets may drive even more traders to move to less regulated markets viz. emerging markets.
H. Algorithmic Trading
In order to ensure that the requirements prescribed by SEBI / stock exchanges with regard to algorithmic trading are effectively implemented, stock brokers were directed to subject their algorithmic trading system to a system audit every six months, instead of annually, by a system auditor possessing certifications like CISA, DISA, CISM,
CISSP. Stock exchanges were advised to consider imposing suitable penalties in case of failure of the stock broker to take satisfactory corrective action to its system within the specified time-period. Further, in order to provide sufficient deterrence, stock exchanges were directed to double the existing rates of disincentives for high order-to-trade ratio (Box 1.6).
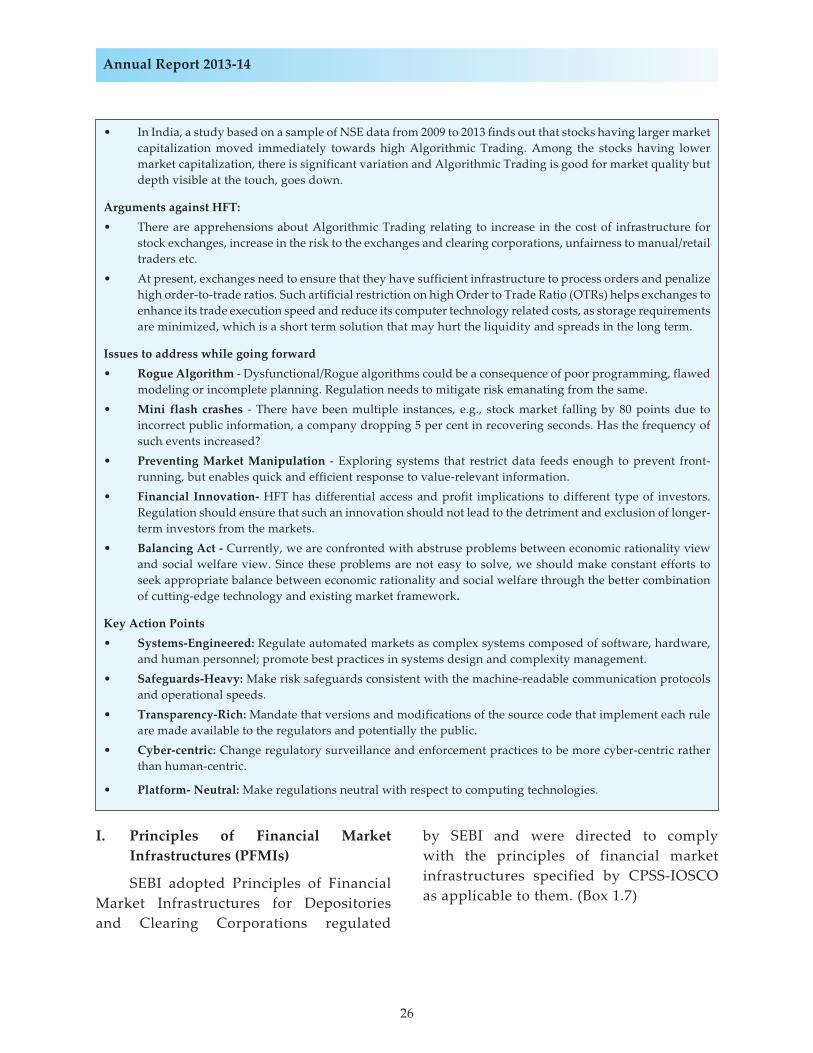
26
Annual Report 2013-14
• In India, a study based on a sample of NSE data from 2009 to 2013 finds out that stocks having larger market capitalization moved immediately towards high Algorithmic Trading. Among the stocks having lower market capitalization, there is significant variation and Algorithmic Trading is good for market quality but depth visible at the touch, goes down.
Arguments against HFT:• There are apprehensions about Algorithmic Trading relating to increase in the cost of infrastructure for
stock exchanges, increase in the risk to the exchanges and clearing corporations, unfairness to manual/retail traders etc.
• At present, exchanges need to ensure that they have sufficient infrastructure to process orders and penalize high order-to-trade ratios. Such artificial restriction on high Order to Trade Ratio (OTRs) helps exchanges to enhance its trade execution speed and reduce its computer technology related costs, as storage requirements are minimized, which is a short term solution that may hurt the liquidity and spreads in the long term.
Issues to address while going forward• Rogue Algorithm - Dysfunctional/Rogue algorithms could be a consequence of poor programming, flawed
modeling or incomplete planning. Regulation needs to mitigate risk emanating from the same.• Mini flash crashes - There have been multiple instances, e.g., stock market falling by 80 points due to
incorrect public information, a company dropping 5 per cent in recovering seconds. Has the frequency of such events increased?
• Preventing Market Manipulation - Exploring systems that restrict data feeds enough to prevent front-running, but enables quick and efficient response to value-relevant information.
• Financial Innovation- HFT has differential access and profit implications to different type of investors. Regulation should ensure that such an innovation should not lead to the detriment and exclusion of longer-term investors from the markets.
• Balancing Act - Currently, we are confronted with abstruse problems between economic rationality view and social welfare view. Since these problems are not easy to solve, we should make constant efforts to seek appropriate balance between economic rationality and social welfare through the better combination of cutting-edge technology and existing market framework.
Key Action Points• Systems-Engineered: Regulate automated markets as complex systems composed of software, hardware,
and human personnel; promote best practices in systems design and complexity management.• Safeguards-Heavy: Make risk safeguards consistent with the machine-readable communication protocols
and operational speeds.• Transparency-Rich: Mandate that versions and modifications of the source code that implement each rule
are made available to the regulators and potentially the public.• Cyber-centric: Change regulatory surveillance and enforcement practices to be more cyber-centric rather
than human-centric.
• Platform- Neutral: Make regulations neutral with respect to computing technologies.
I. Principles of Financial Market Infrastructures (PFMIs)
SEBI adopted Principles of Financial Market Infrastructures for Depositories and Clearing Corporations regulated
by SEBI and were directed to comply with the principles of financial market infrastructures specified by CPSS-IOSCO as applicable to them. (Box 1.7)
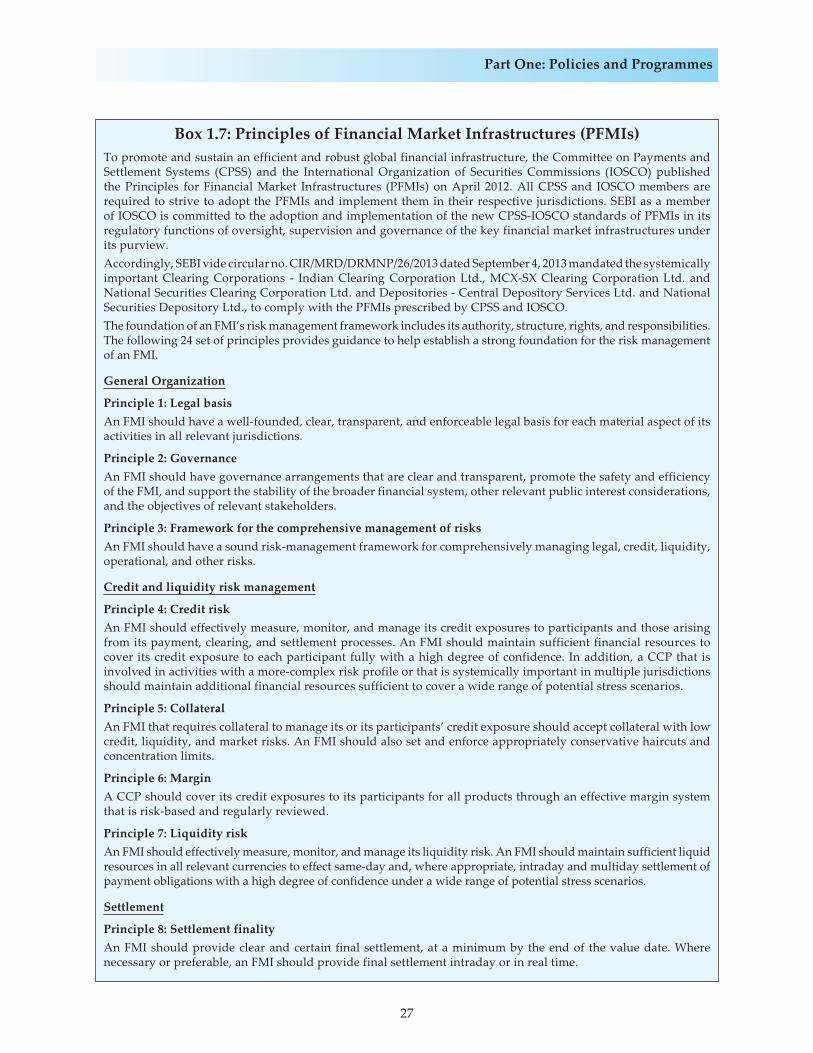
27
Part One: Policies and Programmes
Box 1.7: Principles of Financial Market Infrastructures (PFMIs)To promote and sustain an efficient and robust global financial infrastructure, the Committee on Payments and Settlement Systems (CPSS) and the International Organization of Securities Commissions (IOSCO) published the Principles for Financial Market Infrastructures (PFMIs) on April 2012. All CPSS and IOSCO members are required to strive to adopt the PFMIs and implement them in their respective jurisdictions. SEBI as a member of IOSCO is committed to the adoption and implementation of the new CPSS-IOSCO standards of PFMIs in its regulatory functions of oversight, supervision and governance of the key financial market infrastructures under its purview.Accordingly, SEBI vide circular no. CIR/MRD/DRMNP/26/2013 dated September 4, 2013 mandated the systemically important Clearing Corporations - Indian Clearing Corporation Ltd., MCX-SX Clearing Corporation Ltd. and National Securities Clearing Corporation Ltd. and Depositories - Central Depository Services Ltd. and National Securities Depository Ltd., to comply with the PFMIs prescribed by CPSS and IOSCO.The foundation of an FMI’s risk management framework includes its authority, structure, rights, and responsibilities. The following 24 set of principles provides guidance to help establish a strong foundation for the risk management of an FMI.
General Organization
Principle 1: Legal basisAn FMI should have a well-founded, clear, transparent, and enforceable legal basis for each material aspect of its activities in all relevant jurisdictions.
Principle 2: GovernanceAn FMI should have governance arrangements that are clear and transparent, promote the safety and efficiency of the FMI, and support the stability of the broader financial system, other relevant public interest considerations, and the objectives of relevant stakeholders.
Principle 3: Framework for the comprehensive management of risksAn FMI should have a sound risk-management framework for comprehensively managing legal, credit, liquidity, operational, and other risks.
Credit and liquidity risk management
Principle 4: Credit riskAn FMI should effectively measure, monitor, and manage its credit exposures to participants and those arising from its payment, clearing, and settlement processes. An FMI should maintain sufficient financial resources to cover its credit exposure to each participant fully with a high degree of confidence. In addition, a CCP that is involved in activities with a more-complex risk profile or that is systemically important in multiple jurisdictions should maintain additional financial resources sufficient to cover a wide range of potential stress scenarios.
Principle 5: CollateralAn FMI that requires collateral to manage its or its participants’ credit exposure should accept collateral with low credit, liquidity, and market risks. An FMI should also set and enforce appropriately conservative haircuts and concentration limits.
Principle 6: MarginA CCP should cover its credit exposures to its participants for all products through an effective margin system that is risk-based and regularly reviewed.
Principle 7: Liquidity riskAn FMI should effectively measure, monitor, and manage its liquidity risk. An FMI should maintain sufficient liquid resources in all relevant currencies to effect same-day and, where appropriate, intraday and multiday settlement of payment obligations with a high degree of confidence under a wide range of potential stress scenarios.
Settlement
Principle 8: Settlement finalityAn FMI should provide clear and certain final settlement, at a minimum by the end of the value date. Where necessary or preferable, an FMI should provide final settlement intraday or in real time.
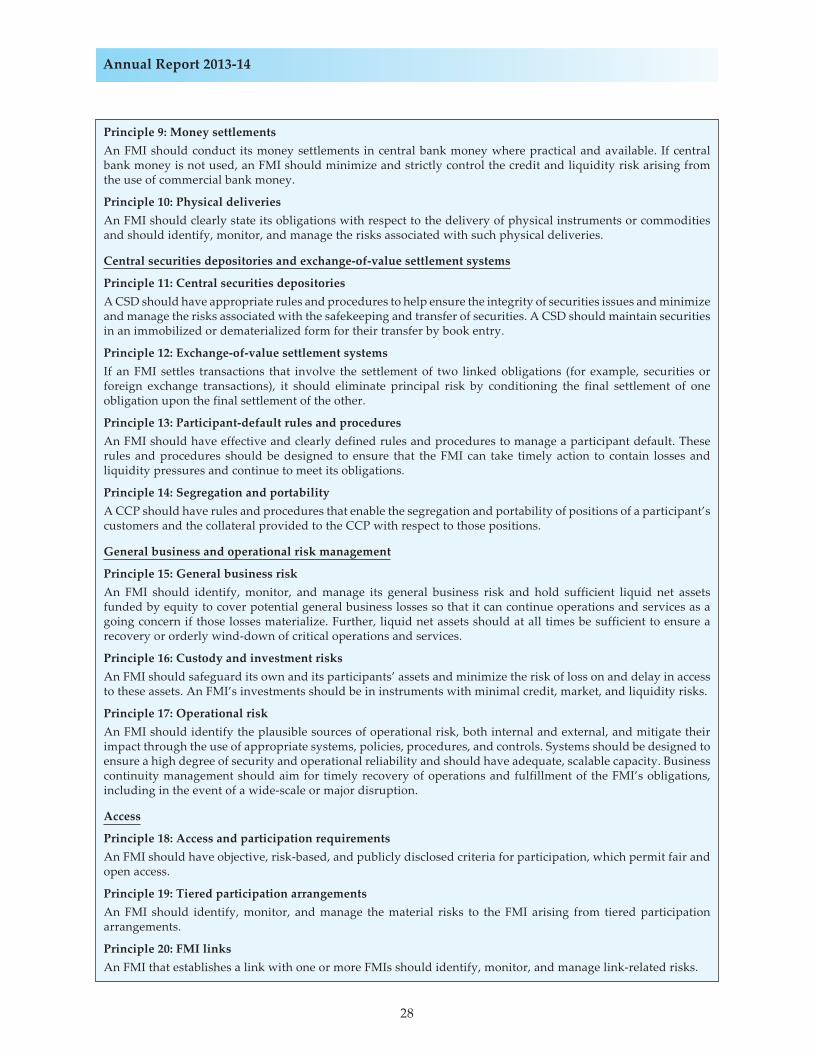
28
Annual Report 2013-14
Principle 9: Money settlementsAn FMI should conduct its money settlements in central bank money where practical and available. If central bank money is not used, an FMI should minimize and strictly control the credit and liquidity risk arising from the use of commercial bank money.
Principle 10: Physical deliveriesAn FMI should clearly state its obligations with respect to the delivery of physical instruments or commodities and should identify, monitor, and manage the risks associated with such physical deliveries.
Central securities depositories and exchange-of-value settlement systems
Principle 11: Central securities depositoriesA CSD should have appropriate rules and procedures to help ensure the integrity of securities issues and minimize and manage the risks associated with the safekeeping and transfer of securities. A CSD should maintain securities in an immobilized or dematerialized form for their transfer by book entry.
Principle 12: Exchange-of-value settlement systemsIf an FMI settles transactions that involve the settlement of two linked obligations (for example, securities or foreign exchange transactions), it should eliminate principal risk by conditioning the final settlement of one obligation upon the final settlement of the other.
Principle 13: Participant-default rules and proceduresAn FMI should have effective and clearly defined rules and procedures to manage a participant default. These rules and procedures should be designed to ensure that the FMI can take timely action to contain losses and liquidity pressures and continue to meet its obligations.
Principle 14: Segregation and portabilityA CCP should have rules and procedures that enable the segregation and portability of positions of a participant’s customers and the collateral provided to the CCP with respect to those positions.
General business and operational risk management
Principle 15: General business riskAn FMI should identify, monitor, and manage its general business risk and hold sufficient liquid net assets funded by equity to cover potential general business losses so that it can continue operations and services as a going concern if those losses materialize. Further, liquid net assets should at all times be sufficient to ensure a recovery or orderly wind-down of critical operations and services.
Principle 16: Custody and investment risksAn FMI should safeguard its own and its participants’ assets and minimize the risk of loss on and delay in access to these assets. An FMI’s investments should be in instruments with minimal credit, market, and liquidity risks.
Principle 17: Operational riskAn FMI should identify the plausible sources of operational risk, both internal and external, and mitigate their impact through the use of appropriate systems, policies, procedures, and controls. Systems should be designed to ensure a high degree of security and operational reliability and should have adequate, scalable capacity. Business continuity management should aim for timely recovery of operations and fulfillment of the FMI’s obligations, including in the event of a wide-scale or major disruption.
Access
Principle 18: Access and participation requirementsAn FMI should have objective, risk-based, and publicly disclosed criteria for participation, which permit fair and open access.
Principle 19: Tiered participation arrangementsAn FMI should identify, monitor, and manage the material risks to the FMI arising from tiered participation arrangements.
Principle 20: FMI linksAn FMI that establishes a link with one or more FMIs should identify, monitor, and manage link-related risks.
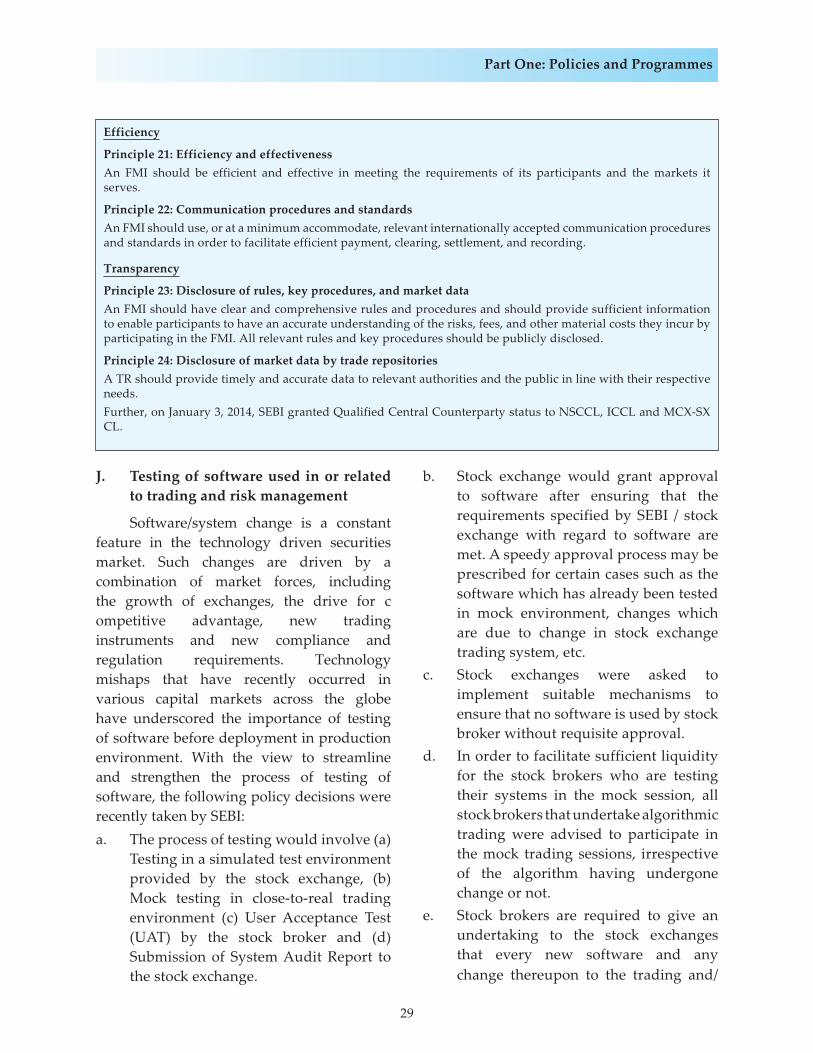
29
Part One: Policies and Programmes
J. Testing of software used in or related to trading and risk management
Software/system change is a constant feature in the technology driven securities market. Such changes are driven by a combination of market forces, including the growth of exchanges, the drive for competitive advantage, new trading instruments and new compliance and regulation requirements. Technology mishaps that have recently occurred in various capital markets across the globe have underscored the importance of testing of software before deployment in production environment. With the view to streamline and strengthen the process of testing of software, the following policy decisions were recently taken by SEBI:a. The process of testing would involve (a)
Testing in a simulated test environment provided by the stock exchange, (b) Mock testing in close-to-real trading environment (c) User Acceptance Test (UAT) by the stock broker and (d) Submission of System Audit Report to the stock exchange.
b. Stock exchange would grant approval to software after ensuring that the requirements specified by SEBI / stock exchange with regard to software are met. A speedy approval process may be prescribed for certain cases such as the software which has already been tested in mock environment, changes which are due to change in stock exchange trading system, etc.
c. Stock exchanges were asked to implement suitable mechanisms to ensure that no software is used by stock broker without requisite approval.
d. In order to facilitate sufficient liquidity for the stock brokers who are testing their systems in the mock session, all stock brokers that undertake algorithmic trading were advised to participate in the mock trading sessions, irrespective of the algorithm having undergone change or not.
e. Stock brokers are required to give an undertaking to the stock exchanges that every new software and any change thereupon to the trading and/
Efficiency
Principle 21: Efficiency and effectivenessAn FMI should be efficient and effective in meeting the requirements of its participants and the markets it serves.
Principle 22: Communication procedures and standardsAn FMI should use, or at a minimum accommodate, relevant internationally accepted communication procedures and standards in order to facilitate efficient payment, clearing, settlement, and recording.
Transparency
Principle 23: Disclosure of rules, key procedures, and market dataAn FMI should have clear and comprehensive rules and procedures and should provide sufficient information to enable participants to have an accurate understanding of the risks, fees, and other material costs they incur by participating in the FMI. All relevant rules and key procedures should be publicly disclosed.
Principle 24: Disclosure of market data by trade repositoriesA TR should provide timely and accurate data to relevant authorities and the public in line with their respective needs.Further, on January 3, 2014, SEBI granted Qualified Central Counterparty status to NSCCL, ICCL and MCX-SX CL.
30
Annual Report 2013-14
or risk management functionalities of the software will be tested as per the framework prescribed by SEBI/stock exchange before deployment of such new / modified software in securities market.
f. With the view to inculcate high standards of technology risk management among stock brokers, stock exchanges were advised to apply deterrent penalties in form of fines and suspension to the stock broker whose system malfunctioned.
K. Safeguards to avoid trading disruption in case of failure of software vendor
In view of the risk caused by the inability on the part of software vendors to provide software or related services in timely and continuous manner, it was suggested that stock exchanges may advise the stock brokers to consider taking the following measures:a. Explore the possibility of establishing
a ‘software escrow arrangement’ with their existing software vendors.
b. In case of large stock brokers, consider reducing dependence on a single software vendor for trading and risk management systems, by engaging more than one software vendor
c. Consider inclusion of the following clauses in contracts with software vendors:i. Access to documents related
to design and development specifications in the event software vendor fails to provide continuous and timely services to the stock broker
ii. Development of expertise at the end of the stock broker through
appropriate training with regard to software usage and maintenance.
iii. Appropriate penalty clauses for cases of disruptions to the trading system of the stock broker on account of (a) software vendor failing to provide continuous and timely services to the stock broker or (b) glitches to the software provided by the software vendor.
iv. Obligation on the part of the software vendor to cooperate in case of audit of software including forensic audit, if required.
L. Review of the Securities Lending and Borrowing (SLB) framework
In order to extend the benefits of SLB, the eligibility criteria of the scrips for introduction of SLB contracts was expanded to include such scrips that fulfill the following criteria:a. Scrip classified as ‘Group I security’,
andb. Market Wide Position Limit (MWPL)
of the scrip, shall not be less than `100 crore, and
c. Average monthly trading turnover in the scrip in the cash market shall not be less than `100 crore in the previous six months.
Stock exchanges were advised to review the scrips eligible for SLB on a half-yearly basis and no SLB transactions in the scrip would be permitted from the next trading day in the event of scrip failing to meet the eligibility criteria.
Further, in order to facilitate efficient use of margin collateral, the category of eligible collateral to meet margin obligations for SLB transactions was brought at par with the cash market.
31
Part One: Policies and Programmes
M. Index based market-wide circuit breaker mechanism
The mechanism of translating the 10 percent, 15 percent and 20 percent circuit breaker limits to absolute points of variation of market-wide index at the end of each quarter was reviewed and modified to a daily fixing of limits based on the previous day’s closing level of the index. In addition, it was advised to resume trading in the cash market with a fifteen minutes pre-open call auction session after observing the trading halt.
N. Individual scrip wise price bands on non-F&O eligible scrip’s in Index Derivatives
In order to protect against excessive price movements in scrips on which no derivatives products are available but which are part of index derivatives, stock exchanges were directed to implement appropriate individual scrip wise price bands up to 20 percent on such scrips.
O. Amendment in comprehensive guidelines on Offer For Sale (OFS) of Shares by Promoters through the Stock Exchange Mechanism
In order to align OFS with secondary market trades, it was decided that seller(s) shall announce the intention of sale of shares at least on the day prior to the offer for sale, instead of one clearing day prior to the offer for sale.
P. Rationalization of Periodic Call Auction for Illiquid Scrips
Based on the feedback received from market participants, the periodic call auction mechanism for illiquid scrips was rationalized by modifying the criteria for scrips eligible for periodic call auction mechanism, number of auction sessions, order placement and validity of orders throughout the trading
day. This process has rationalised the number of scrips that are trading in the periodic call auction mechanism in the stock exchanges.
Q. Issuance and Processing of Delivery Instruction Slips (DIS)
With an objective to safeguard the interest of the investors, it was decided to strengthen the supervisory and monitoring role of the depositories and their participants with respect to issuance and processing of Delivery Instruction Slips (DIS) and following major actions were taken:
a. Standardization of DIS
Format and size of DIS were standardized across all DPs to enable system level checks by the depositories and to facilitate scanning and easy retrievability of records. It was mandated that the DIS should bear a pre-printed unique serial number, DP ID, and a pre-printed/pre-stamped Beneficial Owner (BO) ID. Usage of same DIS for giving both market and off-market instructions was disallowed.
b. Monitoring of DIS
Entry of serial number of DIS in the depository system for validation was made mandatory for execution of DIS. This was done to ensure no instructions accompanied by a used DIS or unissued DIS are processed.
c. Scanning of DIS
Scanning of every DIS executed during a day was made mandatory so that archived scanned images may be used by depositories for off site inspection.
R. Systems Audit for Stock Brokers
SEBI, vide circular dated November 6, 2013, has specified the guidelines for systems audit of stock brokers outlining the System audit process, auditor selection norms and terms of reference for the same.
32
Annual Report 2013-14
S. Information Technology (IT) Governance for Depositories
Based on the recommendations of Depository System Review Committee (DSRC), SEBI vide circular dated January 21, 2014 has specified the guidelines to strengthen the Information Technology (IT) governance framework of depositories. Depositories were advised to formulate IT Strategy and Steering Committees, formulate IT Strategy document and IT Security policy as well as create an Office of Information Security and designate a senior official as Chief Information Security Officer (CISO).
T. Guidelines for Inspection of Depository Participants (DPs) by Depositories
SEBI vide circular dated February 07, 2014 has specified the broad guidelines for inspection of DPs by depositories, highlighting the inspection areas, sample size , categorization of DPs and a risk model for determining frequency of Inspections.
U. Revised Position Limits for Exchange Traded Currency Derivatives
In view of extreme volatility in USD-INR exchange rates, margins requirements and position limits in exchange traded currency derivatives were modified in consultation with RBI as under:a. Margins: Initial and extreme loss
margins was increased by 100 percent of the prevailing market rates for USD-INR contracts in currency derivative.
b. Client level position limits: The gross open position of a client across all contracts was capped at 6 percent of the total open interest or 10 million USD, whichever is lower.
c. Non-bank Trading Member position limits: For the trading member who is
not a bank, the gross open position limit across all contracts was capped at 15 percent of the total open interest or 50 million USD whichever is lower.
V. Dedicated Debt Segment in Stock Exchanges
SEBI vide circular CIR/MRD/DP/03/2013 dated January 24, 2013 and circular CIR/MRD/DP/27/2013 dated September 12, 2013 prescribed guidelines for providing dedicated debt segment on stock exchanges. Subsequent to introduction of debt segment on stock exchanges, appropriate risk management framework was implemented for settlement on DVP-3 basis. It was decided that the trades settled on DVP-3 basis in debt segment shall have settlement cycle of T+1. In case of trades settled on DVP-1 basis, stock exchanges were given the flexibility to settle trades on T+0 or T+1. Risk management guidelines were framed by providing details for SGF, initial margin and extreme loss margin. It was also advised that the reporting platform made available by stock exchanges shall be merged with the negotiated window or facility for RFQ or other such similar facility provided by debt segment of exchanges for enabling reporting of OTC trades or facilitating OTC trades. This platform shall be available for reporting of trades by both members and non-members. Further, SEBI vide Circular CIR/MRD/DRMNP/37/2013 dated December 19, 2013 prescribed the deposit requirements for the members of the debt segment viz.: a) stock broker / proprietary trading member b) clearing member / self clearing member.
W. Reporting of OTC trades in Corporate Bonds on Trade Reporting Platforms of stock Exchanges
Earlier OTC trades in Corporate Bonds and Securitized Debt instruments
33
Part One: Policies and Programmes
were reported on platform of BSE, NSE and FIMMDA. It has been decided that with effect from April 1, 2014, all OTC trades in corporate bonds and securitized debt instruments shall be reported on any of the reporting platform provided in the debt segment of stock exchanges viz., NSE, BSE and MCX-SX within 15 minutes of the trade.
X. Activities of Advisory Committees
a. Secondary Marker Advisory Committee
Secondary Marker Advisory Committee (SMAC) is chaired by Prof. Jayanth R. Varma Professor, IIM Ahmedabad. SMAC has been constituted to advice SEBI on following issues:• To review the developments in
secondary market;• To recommend measures for changes
and improvements in market structure in view of the impending changes;
• To recommend measures for improving market safety, efficiency, transparency and integrity;
• To suggest measures for reducing transaction costs;
• To recommend changes if required in the risk management / margin system;
• To recommend changes if required in the regulatory framework in secondary market;
• To take note of any new development which may have taken place in the secondary market between two consecutive meetings of the Committee and suggest measures;
• To review the investor protection measures in the stock exchanges and suggest improvements;
• Any other matter that Committee considers relevant or incidental thereto.
b. Depository Systems Review Committee
The Depository System Review Committee (DSRC) was constituted on June 25, 2012 under the Chairmanship of Mr. M. Balachandran (former CMD of Bank of India) with Prof H. Krishnamurthy (IISc Bangalore), Mr. R.S. Loona (Ex ED SEBI) and, Prof Vikram Kuriyan (ISB) as members to undertake a comprehensive review of the Indian Depository System and to benchmark against global best practices. The committee was set up with the following terms of reference:• Overall assessment/adequacy of
existing depository framework and identification of areas for review.
• Assessment of depository system on the basis of relevant CPSS-IOSCO principles, recommendations of CESR-ECB pertaining to Central Securities Depositories (CSDs) so as to benchmark with the global best practices.
• Identification of areas for continuous improvement of systems, procedures and practices and make recommendations thereof.
• Identification of systemically important market infrastructure providers/institutions/ depository participants and their inter-linkages and identify areas and suggest safeguards to prevent single point failures and denial of depository service.
• Review of existing system of inspection by depositories and suggest changes to strengthen monitoring/oversight of depository participants.
Based on the recommendations of the committee, SEBI has issued various guidelines
34
Annual Report 2013-14
during the last financial year. These pertained to IT Governance of depositories and inspection of depository participants (DPs) by the depositories which emphasised on risk based inspection including risk rating of DPs. Also guidelines were issued mandating greater control measures on Delivery Instruction Slip (DIS) processing and their issuance which also included standardisation of DIS and their scanning to enable off-site inspection.
c. Committee on Clearing Corporations
SEBI has set up a Committee on Clearing Corporations with Shri K V Kamath as Chairman of the Committee to examine several issues with respect to administration of clearing corporations including exploring the viability of introducing a single clearing corporation (CC) or interoperability between different CCs. The committee comprises of academicians and industry experts. The Committee on Clearing Corporations has discussed various issues pertaining to interoperability between clearing corporations.
The committee is also tasked with the mandate to deliberate and recommend measures related to investment policy of the recognized CC and the manner of utilisation of profits of CCs.
d. Risk Management Review Committee
SEBI has set up a Risk Management Review Committee (RMRC) with Prof J R Varma as Chairman of the Committee, to undertake a comprehensive review of the risk management framework of cash and derivatives segments so as to enable the participants to keep pace with the dynamic changes in the markets and meet the present and future challenges. The committee
comprises of academicians, representatives from the stock exchanges/clearing corporations and market participants.
The committee is also tasked with the mandate to review the investor protection measure in the stock exchanges as well as recommend measures in reducing transmission of risk between segments.
e. Technical Advisory Committee (TAC)
Technological advances in the securities market has necessitated setting up of a forum for discussing technical issues related to securities market. In view of this, Technical Advisory Committee (TAC) has been set up as an advisory committee of SEBI in order to take informed decisions in areas that may have a bearing on the functioning of the securities market, as far as technology is concerned.
The members of TAC comprise of academicians from technology field and also have representatives from the Exchanges and Depositories. Some of the areas where the expertise of the Committee has been employed relate to securities trading using wireless technology, Disaster Recovery Plan and Business Continuity Plan, Algorithmic Trading, Application programming Interface (API), Co-location facility offered by the Exchanges, Testing of software used in or related to trading and risk management, Safeguards to avoid trading disruption in case of failure of software vendors, etc.
Further, examining of the cyber security framework of the exchanges, clearing corporation and depositories, capacity planning and change management, etc., are some of the issues under consideration.

35
Part One: Policies and Programmes
Box 1.8: Third Meeting of the International Advisory Board of SEBI The third meeting of the International Advisory Board (IAB) of the Securities and Exchange Board of India (SEBI) was held on December 9 & 10, 2013 at Bangalore. The following major issues were discussed during the meeting: i. Insider Trading: Global best practices and lessons for India. ii. REITs & Business Trusts: Proposed framework for India vis-à-vis global practices. iii. SEBI’s Consent Mechanism: The global experience and learning for SEBI. iv. Cyber Security: Issues and concerns for securities market infrastructure. v. Recent macro-economic trends and their impact on securities markets. vi. Some potential lessons for India from the development and regulation of the South African securities
markets. SEBI had constituted the IAB in September, 2011, as part of its measures initiated to respond to the challenges arising out of the global financial crisis. The role of the IAB is to guide SEBI with its advice on future direction for the organization, taking into account relevant global experience, emerging challenges and latest developments in the regulatory space. Meetings of the IAB are organized by SEBI in India. Its previous two meetings were held on January 27, 2012 at Delhi and on November 3 - 4, 2012 at Mumbai.
Left: Third Meeting of the International Advisory Board of SEBI held at Bangalore IAB Members have been drawn from amongst former eminent regulators and leading academicians. The current members of IAB (arranged alphabetically by their surnames), in addition to Chairman, SEBI, are as under 1. Professor Viral V. Acharya, C.V. Starr Professor of Economics in the Department of Finance at New York
University Stern School of Business.2. Ms. Jane Diplock, Former Chairman of the New Zealand Securities Commission and Former Chairman of
the Executive Committee of IOSCO.3. Mr. Russell Loubser, Former CEO of the Johannesburg Stock Exchange and Member of the Kings Committee
on Corporate Governance.4. Professor Maureen O’Hara, Robert W. Purcell Professor of Finance at the Johnson Graduate School of
Management, Cornell University.5. Professor Arvind Panagariya, Jagdish Bhagwati Professor of Indian Political Economy at Columbia
University.6. Dr. Andrew L T Sheng, Former Chairman of the Securities and Futures Commission of Hong Kong. Mr. Prashant Saran, Mr. Rajeev Kumar Agarwal & Mr. S. Raman - Whole Time Members of SEBI and all the Executive Directors of SEBI also participated in the two day deliberations.
Left: Third Meeting of the International Advisory Board of SEBI held at Bangalore

36
Annual Report 2013-14
III. Mutual Funds
The mutual fund industry has moved within the broader market’s slipstream, oscillating between exuberance and retrenchment with assets under management approaching to `8,25,240 crore as end March 2014. The previous two years witnessed a slew of regulatory reforms approaching towards development and growth of the industry. Mutual funds manifest huge opportunity for growth and further penetration, which can be achieved over the period of time, ushering various policies and enhancing levels of investor education to increase presence in rural areas. The description of steps initiated during 2013-14 aiming at re-energising growth and investor protection is as follows:
A. Circular on Infrastructure Debt Fund
With regard to Infrastructure Debt Funds (IDF), the following provisions were developed:
a. Increase in the investment universei. Investments of funds received
on account of pre-payment of principal or regular repayments of principal were permitted in bonds of Public Financial Institutions (PFIs) and Infrastructure Finance Companies (IFCs), if the AMC is unable to find core assets for investment.
ii. Limit of scheme investments in sponsor owned assets were increased from 20 percent to 30 percent with some restrictions.
iii. Clarity in limits on investments in unrated /below investment grade assets (30percent extendable to 50 percent) and limits of investment in instruments of a single issuer (30 percent) was provided.
b. Allowed to raise monies through private placement of units to less than fifty persons.
c. Increase in the universe of strategic investors to include, Systemically Important NBFCs registered with RBI and foreign institutional investors registered with SEBI which are long term investors subject to their existing investment limits
d. Extension of the maximum new fund offer period and specified transaction period to 45 days
e. Allowed to increase the tenure of the scheme to two years subject to approval of two-thirds of the unitholders by value of their investment in the scheme.
f. The following categories of FIIs have been designated as long term investors for the purpose of IDF:• Foreign Central Banks• Governmental Agencies• Sovereign Wealth Funds• International/Multilateral
Organizations/ Agencies• Insurance Funds and Pension
Funds
Further, it was decided that regulated foreign feeder funds, having at all times, at least 20 percent of their assets under management held by investors belonging to one of more of the above categories of FIIs, shall also be categorized as FIIs which are long term investors, for the purpose of IDF.
B. Gold Exchange Traded Fund Scheme (Gold ETFs) and Gold Deposit Scheme (GDS) of Banks
Gold certificates issued by banks in respect of investments made by Gold ETFs in Gold Deposit Scheme (GDS) can be held by

37
Part One: Policies and Programmes
mutual funds in dematerialised or physical form.
C. Proprietary Trading Member (PTM) category
The asset management companies managing schemes of mutual funds have been permitted to take membership of debt segment of stock exchanges under ‘Proprietary Trading Member’ (PTM) category. However, this will be only to undertake trades directly on behalf of such schemes managed by them.
D. Conditions laid down for a sponsor to act as a custodian
It has been decided that the custodian in which the sponsor of a mutual fund or its associates, holding 50 percent or more of the voting rights of the share capital of the custodian, shall be allowed to act as custodian subject to fulfilling the following conditions i.e. (a) the sponsor should have net worth of at least `20,000 crore at all points of time, (b) 50 percent or more of the directors of the custodian shall be those who do not represent the interests of the sponsor or its associates, (c) neither the custodian nor the asset management company of a mutual fund shall be a subsidiary of each other, (d) no person shall be a director of both the custodian and the asset management company of a mutual fund and (e) the custodian and the asset management company of a mutual fund shall sign an undertaking that they will act independently of each other in their dealings with the schemes.
E. Enhancing disclosures, investor education and awareness campaign, developing alternative distribution channels for Mutual Fund products, etc.
a. In order to increase transparency, Mutual Funds/AMCs are mandated to disclose
its monthly Average AUM (Monthly AAUM) of various schemes categories and various investor types. Mutual funds/AMCs are also mandated to disclose contribution to Monthly AAUM from B-15 and T-15 cities, from sponsor and its associates and others, along-with data on State-wise/Union Territory-wise Monthly AAUM and monthly AAUM garnered through sponsor group/ non-sponsor group distributors. AMCs have to disclose this information on its website within seven working days from the end of the month and also need to forward the data to AMFI for consolidation in order to get holistic picture of the Mutual Fund industry.
b. To increase transparency and encourage Mutual funds/AMCs to diligently exercise their voting rights in best interest of the unitholders, Mutual funds/ AMCs shall be required to disclose voting data along with rationale supporting the decision (for, against or abstain) on a quarterly basis on websites of mutual funds. Also, on an annual basis, AMCs shall be required to obtain auditor’s certification on the voting reports being disclosed by them. Further, the board of AMCs and trustees of mutual funds would be required to review and ensure that AMCs have voted on important decisions that may affect the interest of investors and the rationale recorded for vote decision is prudent and adequate.
c. To promote financial inclusion, mutual funds need to make available printed literature on mutual funds for investor awareness and education in regional languages. Further mutual funds also need to introduce investor awareness campaign, both in print and electronic media, in regional languages.
38
Annual Report 2013-14
d. For developing additional distribution channels, AMCs need to frame a system for active support to PSU Banks for distribution of mutual fund products and also provide online investment facility to tap the internet savvy users and the burgeoning mobile-only internet users for direct investment in mutual fund products.
e. Further, in the guidelines issued on prudential limits for sectoral exposure in debt oriented mutual funds schemes, along-with investment in Bank CDs, CBLO, G-Secs, T-Bills and AAA rated securities issued by public financial institutions and public sector banks, investments in short term deposits of scheduled commercial banks shall also be excluded while calculating total exposure of debt schemes of mutual funds in a particular sector.
F. Self Regulatory Organization (SRO) relating to Mutual Fund Industry
It has been decided to have a single SRO for distributors of mutual fund products and a two stage procedure for grant of recognition as SRO for distributors of mutual fund product i.e. grant of in-principle approval and grant of recognition.
G. Activities of Advisory Committee
a. Advisory Committee on Mutual Funds
SEBI has an Advisory Committee on Mutual Funds (MFAC) which comprises industry representatives, investor association, government representative and other stakeholders. The committee provides
a platform for interaction and deliberation on the issues related to the mutual fund industry. It acts as a platform for SEBI to place its various regulatory development activities and at the same time the industry places its agenda before SEBI for further consideration. During financial year 2013-14, the committee under the Chairmanship of Shri Janki Ballabh, former Chairman of State Bank of India, met twice on September 30, 2013 and November 12, 2013 and gave its valuable recommendations on various policy issues encompassing mutual fund industry.
IV. Intermediaries Associated with Securities Market
A. Simplification of Procedure for Transmission of Securities
With a view to make the transmission process more efficient and investor friendly, SEBI vide circular dated October 28, 2013, issued guidelines with a view to avoid cumbersome court procedures. SEBI reviewed the process being followed by Share Transfer Agents (STAs) and Depositories/Issuer companies (in-house STAs) for effecting transmission of securities held in physical as well as dematerialised mode with a view to make the transmission process more efficient and investor friendly. In the revised process, STAs/ issuer companies and the depositories were directed to adhere to the guidelines, as applicable to them. Further, to improve the awareness of nomination facility, all Registrars to an Issue and Share Transfer Agents shall publicize nomination as an additional right available to investors, while sending communications to the investors. (Box 1.9)

39
Part One: Policies and Programmes
Box 1.9: Standardization and Simplification of Procedures for Transmission of Securities
SEBI reviewed the process being followed by Share Transfer Agents (STAs) and Depositories / issuer companies (in-house STAs) for effecting transmission of securities held in physical as well as dematerialized mode with a view to make the transmission process more efficient and investor friendly. In the revised process, STAs/ issuer companies and the depositories shall adhere to the following guidelines, as applicable to them:I. In case of transmission of securities in dematerialized mode, where the securities are held in a single name
without a nominee, the existing threshold limit of Rs. one lakh per beneficiary owner account has now been revised to Rs. five lakh, for the purpose of following simplified documentation, as prescribed by the depositories vide bye-laws / operating instructions.
II. In case of transmission of securities held in physical mode: a. where the securities are held in single name with a nominee, STAs/issuer companies shall follow the
standardized documentary requirement, as mentioned below. b. where the securities are held in single name without a nominee, the STAs/issuer companies shall
follow, in the normal course, the simplified documentation (as mentioned below), for a threshold limit of Rs. two lakh per issuer company. However, the issuer companies, at their discretion, may enhance the value of such securities.
III. The timeline for processing the transmission requests for securities held in dematerialized mode and physical mode shall be seven days and 21 days respectively, after receipt of the prescribed documents.
Documentary requirement for securities held in physical mode:
1. For securities held in single name with a nominee: i. Duly signed transmission request form by the nominee. ii. Original or Copy of death certificate duly attested by a Notary Public or by a Gazetted Officer. iii. Self attested copy of PAN card of the nominee. (Copy of PAN card may be substituted with ID proof in
case of residents of Sikkim after collecting address proof)
2. For securities held in single name without a nominee, following additional documents may be sought: a) Affidavit made on appropriate non judicial stamp paper – to the effect of identification and claim of
legal ownership to the securities b) For value of securities upto Rs. two lakh per issuer company as on date of application, one or more
of the following documents: i. No objection certificate [NOC] from all legal heir(s) who do not object to such transmission (or)
copy of Family Settlement Deed duly notarized or attested by a Gazetted Officer and executed by all the legal heirs of the deceased holder.
ii. Indemnity made on appropriate non judicial stamp paper – indemnifying the STA/Issuer Company.
c) For value of securities more than Rs.two lakh per issuer company as on date of application: Succession certificate (or) Probate of will (or) Letter of Administration (or) Court decree.
B. Rationalization of KYC Process
a. Rationalization of KYC norms for eligible foreign investors
Pursuant to the report on “Committee on Rationalization of Investment Routes and Monitoring of Foreign Portfolio Investments”, under the Chairmanship of
Shri K. M. Chandrasekhar, SEBI vide circular dated September 12, 2013 rationalized KYC norms for eligible Foreign Investors investing under Portfolio Investment Scheme (‘PIS’) route. The intermediaries are now required to follow risk based Know Your Client norms depending on category of investors.
40
Annual Report 2013-14
b. KYC form further simplified
SEBI, vide circular dated December 26, 2013, has further simplified Part I of the Account Opening Form (AOF) which contains basic KYC details of the client. The changes would assist in avoiding repeated modifications in the KRA system and will facilitate in making the KYC uniform for the entire financial sector.
c. Amendment to SEBI {KYC (Know Your Client) Registration Agency} Regulations, 2011
As per existing KRA Regulations, 2011, an option was available to the intermediary to access the centralized KRA system in case of a client who is already KYC compliant or carry out fresh KYC process. As the KRA system has now stabilised and has been working well, it was felt that there may not be a need to provide this option in the Regulations.
Accordingly, KRA Regulations were amended vide notification dated March 13, 2014 and the option of taking fresh KYC has been done away with. However, as provided in the Regulations, the intermediary can undertake enhanced KYC measures commensurate with the risk profile of its clients.
d. Aadhaar e-KYC service launched by UIDAI to be considered as a valid process for KYC verification
E-KYC service launched by UIDAI has now been accepted as a valid process for KYC verification, as per SEBI Guidelines. The information containing relevant client details and photograph made available from UIDAI as a result of e-KYC process shall be treated as sufficient proof of identity and address of the client.
C. Simplification and Reduction in cost of Demat account opening process
SEBI, vide circular dated December 4, 2013, simplified and rationalized the demat account opening process. This would standardize the account opening process across the depositories, harmonize the demat account opening process with that of trading account and reduce the cost. In terms of this circular, the existing Beneficial Owner-Depository Participant agreement has been replaced with “Rights and Obligations of the Beneficial Owner and Depository Participant” document, which shall be binding on the depository participant as well as the investor. The investor will be confident while signing the document as it is prescribed by the regulator. This will also result in the reduction in the number of signatures to be affixed by the investors while opening demat account and also in the cost to the investors due to non-payment of stamp duty which was earlier payable for entering into agreements.
D. Guidelines for dealing with Conflict of Interest for investment/ trading by Credit Rating Agencies, Access Persons and other employees
With a view to adopt best industry practices and systems by Credit Rating Agencies (CRAs) for managing conflict of interest in case of investment/trading in securities done by CRAs or their Access Persons and employees, SEBI vide circular dated August 28, 2013 issued guidelines for dealing with conflict of interest in consultation with the CRAs. These guidelines prescribe that:a. CRAs shall adopt adequate systems,
procedures and policies to ensure that they address conflict of interest while making their own investments in
41
Part One: Policies and Programmes
securities.b. CRAs, their employees and Access
Persons shall not take undue advantage of any price sensitive information that they may have about any company.
c. Access Persons shall seek prior approval for purchase or sale of securities of the companies which have been rated or graded by the CRA or whose securities / instruments /facilities have been rated or graded by the CRA
d. Disclosures shall be made by all employees/ access persons of CRAs while joining the CRA, on purchase or sale of securities and on annual basis as applicable.
e. The members of the Rating Committee shall upfront declare / disclose their interest, if any, to the Chief Executive Officer or Compliance Officer, as per the policy of the CRA, in the securities /instruments/ facilities that are considered for rating / grading by the CRA.
f. Employees involved in the rating / grading process shall not have ownership of the securities of the issuer.
The CRAs were advised to devise their policies and procedures for effective implementation of these guidelines by October 01, 2013 and to disclose the policies adopted by them in this regard on their websites.
E. Guidelines for Conflict of Interest in Securities Markets
On the lines of Principle 8 of the International Organisation of Securities Commissions (IOSCO) Objectives and Principles of Securities Regulations, SEBI, vide circular dated August 28, 2013, issued Guidelines for avoiding or dealing with
or managing conflict of interest for all intermediaries, recognized stock exchanges, recognized clearing corporations and depositories and their associated persons in securities markets. The Boards of such entities have been made responsible for putting in place systems for implementation of the requirements specified in the circular, providing necessary guidance enabling identification, elimination or management of conflict of interest situations and reviewing the compliance of this circular periodically.
F. Anti-Money Laundering/Countering Financing of Terrorism (AML/CFT)
The Anti-Money Laundering/Countering Financing of Terrorism (AML/CFT) framework prescribed by SEBI for market intermediaries has been updated vide circular dated March 12, 2014, to incorporate the amendments made in the PML Act and Rules. The major changes to the framework are with regard to record keeping requirements, appointment of designated director to oversee compliance with AML/CFT obligations, reliance on third party for carrying out client due diligence and risk assessment to be carried out by intermediaries.
G. Simplification of registration process for Stock Brokers
Vide Notification dated September 27, 2013, the SEBI (Stock Brokers and Sub-Brokers) Regulations, 1992, were amended to replace the existing requirement of obtaining multiple registrations for operating in different segments of a stock exchange / clearing corporation with a single registration per stock exchange / clearing corporation. If an entity is already registered with SEBI in any segment of a stock exchange, then for operating in any other segments of that
42
Annual Report 2013-14
stock exchange/clearing corporation, the entity is only required to obtain approval of the concerned stock exchange or clearing corporation as the case may be.
H. Strengthening the compliance mechanism of Stock Brokers-Internal Audit
Stock Brokers are required to conduct internal audit of their operations on a half yearly basis to be conducted by an independent auditor. The format of audit report and sample size is prescribed by the stock exchange. In consultation with SEBI, the stock exchanges have reviewed and increased the audit sample size to be covered under internal audit for stock brokers with effect from the half year ended March 31, 2014. Further, the auditor shall verify the compliance of SEBI / exchange inspection findings/observations by the stock broker during internal audit process. These changes are intended to strengthen the compliance mechanism of stock brokers.
I. Rationalisation of continuing professional education (CPE) process
The duration of continuing professional education (CPE), for certification of associated persons in the securities markets, has been reduced to one day from the earlier requirement of two days without compromising on the contents of examination. This will help all the intermediaries in complying with the requirement of CPE and improving their professional standards.
J. Transparency in Redressal of Investor Complaints
SEBI had earlier prescribed the format for disclosing details of complaints lodged by clients/investors against stock brokers on the website of stock exchanges. In order to
bring more transparency in the disclosure of complaint redressal status of the stock brokers on the website of stock exchange, SEBI in consultation with stock exchanges and market participants modified the format by including the following details:a. Number of active clients of stock
brokerb. Percentage of number of complaints
received as against number of active clients of stock broker
c. Percentage of complaints resolved as against complaints received by the stock broker
The stock exchanges are also now required to separately disclose total number of complaints received against all stock brokers, their active clients and percentage and also overall market redressal rate. Stock exchanges have implemented the new system with effect from January 2014.
The above modifications will result in disclosure of complaint redressal rate of individual stock broker and also overall redressal rate at stock exchange level. As the information is available in public domain, this will encourage the stock brokers to redress the complaints expeditiously. Further, as each stock exchange shall also disclose the overall redressal rate of the exchange, this will help them in monitoring and taking steps to improve their performance by regular follow-up with stock brokers. All this will result in expeditious redressal of complaints of the investors.
K. Strengthening the Disciplinary Process of Stock Exchanges
Stock exchanges are empowered under their bye-laws to impose monetary penalties on their stock brokers for violations/non-compliances based on findings of their
43
Part One: Policies and Programmes
inspections and regular monitoring. With a view to make the penalty structure more stringent so as to commensurate with the seriousness and/or repetitive nature of violations, the penalty structure was strengthened in consultation with stock exchanges, which came into effect from April 2013. This will help in improving the compliance standards for the stock brokers.
L. Periodical settlement of running accounts
With a view to instill greater transparency and discipline in the dealings between the clients and the stock brokers, SEBI had mandated, in 2009, that stock brokers shall compulsorily settle client running accounts on monthly/quarterly basis as desired by the clients and send them a statement of account to that effect. This regulatory directive has helped in reduction of investor grievances pertaining to unauthorized trading. With an objective to address the administrative and practical difficulties, SEBI has further streamlined the process of settling running accounts after receiving feedback from stock exchanges and stock brokers. As per the revised process, for the purpose of settlement, the stock broker is allowed to settle across segments
and across stock exchanges for a particular client. This will benefit the client as well as the stock brokers as the client account across stock exchanges will be netted for the purpose of settlement and debit balance in one exchange will get offset to the extent of the credit available in another exchange. In addition to this, certain other changes have been made to remove administrative/operational difficulties of stock brokers.
M. Limited Liability Partnership to become members of the stock exchange
Securities Contract (Regulation) Rules, 1957 (SCRR) were amended vide notification dated October 24, 2013 and rules were liberalised by allowing Limited Liability Partnerships (LLPs) to become eligible for seeking membership of a stock exchange.
V. Foreign Institutional Investment
A. SEBI (Foreign Portfolio Investors) Regulations, 2014 were notified on January 07, 2014.
SEBI (Foreign Portfolio Investors) Regulations, 2014 (the Regulations) were framed and the same were notified on January 7, 2014. The salient features of the Regulations are explained in Box 1.10
Box 1.10: Foreign Portfolio Investor (FPI) RegimeBackgroundSEBI constituted a “Committee on Rationalization of Investment Routes and Monitoring of Foreign Portfolio Investments” (the Committee), under the Chairmanship of Shri K. M. Chandrasekhar, comprising of representatives from GoI, RBI and various market participants. The Committee made recommendations regarding harmonization of different routes for foreign portfolio investments i.e. Foreign Institutional Investors (FIIs), Sub Accounts and Qualified Foreign Investors, uniform entry norms, adoption of risk based KYC norms etc. The Board, in its meeting held on June 25, 2013 accepted the recommendations of the Shri K.M. Chandrasekhar Committee.
SEBI (Foreign Portfolio Investors) Regulations, 2014In order to implement the recommendations of the Committee, the SEBI (Foreign Portfolio Investors) Regulations, 2014 (the Regulations) have been framed and the same have been notified on January 07, 2014. The FPI regime shall commence from June 01, 2014. Salient features of the Regulations are as under:
44
Annual Report 2013-14
A. Foreign Portfolio Investors (FPIs):
1. Existing FIIs, Sub Accounts and QFIs shall be merged into a new investor class termed as “FPIs”.
2. SEBI approved Designated Depository Participants (DDPs) shall register FPIs on behalf of SEBI subject to compliance with KYC requirements.
3. FPI shall be required to seek registration in any one of the following categories:
a) “Category I Foreign Portfolio Investor” which shall include Government and Government related foreign investors etc;
b) “Category II Foreign Portfolio Investor” which shall include appropriately regulated broad based funds, broad based funds whose investment manager is appropriately regulated, university funds, university related endowments, pension funds etc;
c) “Category III Foreign Portfolio Investor” which shall include all others not eligible under Category I and II foreign portfolio investors.
4. All existing FIIs and Sub Accounts may continue to buy, sell or otherwise deal in securities under the FPI regime.
5. All existing QFIs may continue to buy, sell or otherwise deal in securities till the period of one year from the date of notification of this regulation. In the meantime, they may obtain FPI registration through DDPs.
6. The registration granted to FPIs by the DDPs on behalf of SEBI shall be permanent unless suspended or cancelled by SEBI.
7. FPIs shall be allowed to invest in all those securities, wherein FIIs are allowed to invest.
8. Category I and Category II FPIs shall be allowed to issue, or otherwise deal in offshore derivative instruments (ODIs), directly or indirectly. However, unregulated broad based funds, which are classified as Category II FPI by virtue of their investment manager being appropriately regulated and category III FPIs are not allowed to issue, subscribe to or otherwise deal in offshore derivatives instruments directly or indirectly. However, the FPI needs to be satisfied that such ODIs are issued only to persons who are regulated by an appropriate foreign regulatory authority after ensuring compliance with ‘know your client’ norms.
B. Designated Depository Participants (DDPs):
1. DDP shall be an Authorized Dealer Category-1 bank authorized by Reserve Bank of India, Depository Participant and Custodian of Securities registered with SEBI.
2. Depository shall forward the application of DDP along with its recommendation to SEBI for grant of approval.
3. SEBI registered Custodian of Securities shall be deemed to be DDP subject to payment of fees as prescribed in the regulations.
4. SEBI approved QDPs having QFI accounts as on date of notification of SEBI (FPI) Regulations, 2014 shall be deemed to have been granted approval as DDP subject to the payment of fees. However, such QDPs will be allowed to register new FPIs after obtaining registration as a custodian of securities from SEBI.
5. DDPs shall carry out necessary due diligence and obtain appropriate declarations and undertakings before registering FPIs.
45
Part One: Policies and Programmes
B. Rationalization of debt limits
The framework of FII debt limits was simplified and existing debt limits were merged into two broad categories: Government securities of USD 25 billion by merging Government Debt – Old of USD 10 billion and Government Debt – Long Term of USD 15 billion) and corporate bonds of USD 51 billion (by merging USD 1 billion for QFIs, USD 25 billion for FIIs and USD 25 billion for FIIs in long term infra bonds).
C. Corporate Debt limit put on tap
Beginning April 1, 2013, FIIs have been permitted to invest in corporate debt without purchasing debt limits till the overall investment reaches 90 percent after which the auction mechanism would be initiated for allocation of the remaining limits.
D. Additional Government Debt limits on tap for Long Term Investors
With effect from June 12, 2013, the unutilized Government debt limits along with an additional USD 5 billion limit for Government debt has been made available for investment on tap for FIIs which are registered with SEBI under the categories of Sovereign Wealth Funds (SWFs), multilateral agencies, endowment funds, insurance funds, pension funds and foreign central banks.
E. Security Receipts under Corporate Debt Limits
Beginning July 9, 2013, investments in security receipts issued by Asset Reconstruction Companies by FIIs are being reckoned against the extant corporate debt limits.
F. Utilisation period for Government Debt limits
In order to ensure that the unutilised government debt limits are put up for auction without delay, SEBI vide circular dated July 31, 2013, permitted to utilise the debt limits allocated to them in each monthly auction till the 17th day of the succeeding month. Any unutilised limit as on the 18th of each month would get auctioned on the 20th of that month.
G. Government Debt Limits on Tap
FIIs have been permitted to invest in Government Debt without purchasing debt limits till the overall investment reaches 90 percent after which the auction mechanism shall be initiated for allocation of the remaining limits, as currently in place for FII investments in corporate debt.
H. Permission to invest in Credit Enhanced INR Bonds
Foreign Institutional Investors (FIIs) and Qualified Foreign Investors have been permitted to invest in Credit Enhanced INR Bonds up to an equivalent of USD 5 billion within the overall corporate bond limit of USD 51 billion.
I. Reduction in sub-limit for Commercial Paper
With effect from February 14, 2014, the sub-limit for FII/QFI investment in commercial papers was reduced from USD 3.5 billion to USD 2 billion.
Accordingly, FIIs and QFIs can invest in the following debt limits:
46
Annual Report 2013-14
J. Change in FII Debt Investment Limits
With effect from January 29, 2014 the sub-limit for long term investors under the Government Debt category was enhanced from USD 5 billion to USD 10 billion within the overall Government debt limit of USD 30 billion. Long term investors are FIIs which are registered with SEBI under the categories of Sovereign Wealth Funds (SWFs), multilateral agencies, endowment funds, insurance funds, pension funds and foreign central banks.
K. Declaration and Undertaking regarding PCC, MCV or equivalent structure by FIIs
On December 19, 2013, it was clarified by SEBI that if any applicant was required by its regulator or under any law to ring fence its assets and liabilities from other funds/ sub funds, such applicant shall not be treated as having opaque structure, provided:
i. the applicant is regulated in its home jurisdiction
ii. each fund/ sub fund in the applicant satisfies broad based criteria, and
iii. the applicant gives an undertaking to provide information regarding its beneficial owners as and when SEBI seeks this information
VI. Other Policies and Programmes having a bearing on the working of Securities Market
A. CORPORATE DEBT MARKET
A well developed corporate bond market supports economic development and is likely to be more beneficial for business having longer term cash flows, where investors may be wary of risk associated with equity market. The current year witnessed `2,76,054 crore raised through 1,924 issues by the way of private placement listed at BSE and NSE while there were 35 public debt issues worth ̀ 42,383 crore in 2013-14, depicting a manifold increase from the previous year. Furthermore, a framework for Regulations on Research Analyst and Real Estate Investment Trust (REIT) was proposed in 2013-14. The potential of the market can be realised on the back of policy and regulatory reforms accompanied by ways to penetrate retail investors. Following are the slew of measures undertaken by SEBI in 2013-14:
a. SEBI (Issue and Listing of Non-convertible Redeemable Preference Shares) Regulations, 2013
SEBI notified the SEBI (Issue and Listing of Non-Convertible Redeemable Preference Shares), Regulations, 2013 on
S. No. Type of Instrument Cap(USD Billion) Remarks
1 Government Debt 20Available on demand for both FIIs and QFIsEligible investors (FIIs and QFIs) may invest in Treasury Bills only up to USD 5.5 billion.
2 Government Debt 10
Available on demand for FIIs registered with SEBI as Sovereign Wealth Funds, Multilateral Agencies, Endowment funds, Insurance funds, pension funds and Foreign Central banks
3 Corporate Debt 51
Available on demand for both FIIs and QFIsEligible investors may invest in Commercial Papers only up to USD 2 billion and up to USD 5 billion in Credit Enhanced Bonds within the limit of USD 51 billion
Total 81
47
Part One: Policies and Programmes
June 12, 2013. The said regulations provide a regulatory framework for public issuance of Non-convertible Redeemable Preference shares and also for listing of privately placed redeemable preference shares. Considering the risks involved in the instrument, certain requirements like minimum tenure of the instruments (three years), minimum rating (“AA-” or equivalent) etc. have been specified in case of public issuances. For listing of privately placed non-convertible redeemable preference shares, minimum application size for each investor is fixed at `10 lakh.
As per Basel III norms, banks can issue non-equity instruments such as perpetual non-cumulative preference shares and innovative perpetual debt instruments, which are in compliance with the specified criteria for inclusion in Additional Tier I Capital. SEBI (Issue and Listing of Non-Convertible Redeemable Preference Shares), Regulations, 2013 was also made applicable to the non-equity instruments such as perpetual non-cumulative preference shares and innovative perpetual debt instruments, issued by banks (as per Basel III norms), which are in compliance with the criteria specified by RBI for inclusion in Additional Tier I Capital.
b. Centralized Database for Corporate Bonds/ Debentures
Considering the need to have comprehensive database on corporate bonds at a single place and taking into account the recommendations of Dr. R.H. Patil Committee, SEBI mandated both the depositories viz. NSDL and CDSL to jointly create, host, maintain and disseminate the centralized database of corporate bonds/debentures, which are available in demat form. The depositories shall obtain requisite information regarding the bonds/debentures from issuers, stock exchanges, credit rating
agencies and debenture trustees. The database can be accessed by the public or any other users without paying any kind of fees or charges. This has been done in view of the fact that the historical data on all corporate bonds issued is very crucial for an investor to take informed investment decision.
c. Issues pertaining to Primary Issuance of Debt Securities
SEBI had mandated that the day count convention for calculation of interest payments for listed corporate debt securities shall be actual. It has been pointed out by the market participants that the disclosures can further be improved, if cash flows concerning interest payment and redemption of debt securities are given by way of illustration in the offer document. Taking the same into account, SEBI issued a circular on October 29, 2013 stating that the cash outflows (interest payments and redemption of maturity) concerning debt securities, are to be explained by way of illustrations in the offer document.
Further, for the purpose of standardisation and in line with the dated government securities, it was also stated that if the coupon payment date of the debt securities, falls on a Sunday or a holiday the coupon payment shall be made on the next working day. If the maturity date of the debt securities, falls on a Sunday or a holiday, the redemption proceeds shall be paid on the previous working day.
Further, vide the said circular, a flexibility has also been given to the listed debt issuers (who have already listed their equity shares or debentures) , who are in compliance with the listing agreement, to disclose their unaudited financials with a limited review report in their offer document, instead of giving audited financials for the sub period.
48
Annual Report 2013-14
d. Amendment to SEBI (Issue and Listing of Debt Securities) Regulations, 2008
Companies Act, 2013 enables SEBI to specify the class of the companies which can be allowed to file shelf prospectus. To specify the class of companies eligible to file shelf prospectus, SEBI (Issue and Listing of Debt Securities) Regulations, 2008 was amended. Following class of entities are allowed to file Shelf Prospectus for public issuance of non-convertible debt securities:
i. Public financial institutions and scheduled banks;
ii. Issuers authorised by the notification of CBDT to make public issue tax free secured bonds;
iii. Infrastructure debt funds – NBFCs;
iv. NBFCs, registered with RBI, Housing Finance Companies registered with National Housing Bank (NHB) and entities which have listed their shares/debentures in the stock exchanges for at least three years complying with prescribed criteria.
The regulations also prescribe other formalities such as filing of an information memorandum, limits on number of issues through a single shelf prospectus, etc.
e. Reporting of Trades in Securitised Debt Instruments in Trade Reporting Platforms and Clearing and Settlement of trades in Securitised Debt Instruments through Clearing Corporations
With a view to develop the Securitised Debt Instruments (SDIs) market and to improve transparency in the dealings of SDIs, SEBI vide circular dated January
07, 2014, has directed that all trades in SDIs (listed or unlisted) by mutual funds, foreign institutional investors/sub-accounts/qualified foreign investors/foreign portfolio investors, alternative investment funds, foreign venture capital investors and portfolio managers shall be reported on the trade reporting platform of either NSE, BSE or MCX-SX, within fifteen minutes of the trade. All trades in SDIs (listed or unlisted) done between above specified entities shall necessarily be cleared and settled through the National Securities Clearing Corporation Limited (NSCCL) or the Indian Clearing Corporation Limited (ICCL) or MCX-SX Clearing Corporation Limited (MCX-SX CCL). To ensure that the data is not duplicated, it has also advised that the reporting for a trade must be done by the buyer and the seller on the same platform to ensure matching of both sides of the trades.
The meeting of Corporate Bonds Securitization Advisory Committee (CoBoSAC) was held on October 23, 2014 to discuss on the various policy issues pertaining to the corporate debt market and securitized debt instruments.
f. Activities of the Advisory Committee
Corporate Bonds and Securitization Advisory Committee (CoBoSAC), is an advisory committee of SEBI, constituted to review the progress of implementation of plans for the creation of a unified exchange traded market for corporate bonds. It suggests measures to hasten the process of the implementation of the project on one hand and removal of the bottlenecks on the other. The committee is chaired by Smt. Shyamala Gopinath, former Deputy Governor, RBI and currently the chairperson of Clearing Corporation of India Limited. In the year 2013-14, two meetings of the committee

49
Part One: Policies and Programmes
have been convened on October 23, 2013 and March 28, 2014.• The Committee deliberated on the
nature of the “Covered Bonds”.• The Committee gave various
recommendations to develop the market for Securitized product, including the additional continuous disclosure requirements that may be specified for Non-convertible Redeemable Preference Shares
• The committee also specified the entities that may be allowed to file shelf prospectus, under the Companies Act, 2013.
• The committee recommended the formation of a sub-committee, to specify disclosure and other requirements for Municipal Bonds.
• The committee recommended the formation of a sub-committee, for specifying disclosure and other requirements for bonds issued by co-operative societies
• The committee has pointed out that the entities coming out with public issue of NCDs shall provide granular disclosures in their offer document, with regards to the “Object of the Issue”. Further, the amount earmarked for “General Corporate Purposes”, shall not exceed 25 percent of the amount raised by the issuer in the proposed issue.
• NBFCs who are the most frequent users of the debt channel, shall have to disclose in their offer document, the details with regards to the lending done by them, out of the issue proceeds of previous public issues.
• The disclosure requirements in the Companies Act, 1956, which are not replicated in the Companies Act, 2013
may be carried forward to SEBI ILDS Regulations.
• The committee suggested that Depositories would be suitable to act as a single repository for hosting primary as well as secondary market data regarding corporate bonds.
• The committee recommended to constitute a sub-committee to discuss the issues pertaining to improving the secondary market liquidity in corporate bonds.
B. Collective Investment Schemes
The Securities Laws (Amendment) Ordinance, 2013, has, inter alia, amended the SEBI Act, 1992 by way of insertion of a proviso to sub-section (1) of section 11AA of SEBI Act to prescribe that: “… any pooling of funds under any scheme or arrangement, which is not registered with the Board or is not covered under sub-section (3), involving a corpus amount of one hundred crore rupees or more shall be deemed to be a collective investment scheme.”
Certain activities as listed under sub-section (3) of section 11AA, viz., Schemes offered by Cooperative Society, Deposits accepted by NBFCs, Contract of Insurance, Pension Scheme or Insurance Scheme, Deposits accepted under 58A of Companies Act, Nidhi or mutual benefit society, chit fund business, mutual fund and any scheme/ arrangement specifically exempted by the Central Government in consultation with SEBI, are outside the ambit of CIS. Therefore, any scheme falling under these sectors/ domains shall not be deemed to be a CIS irrespective of the quantum of the amount mobilised.
Also, any mobilisation of funds under any scheme or arrangement which is registered under any other Act and regulated
50
Annual Report 2013-14
by any other authority or otherwise banned under any prevailing law in the country shall not be deemed to be a CIS. Subsequent to the Ordinance, SEBI notified SEBI (Collective Investment Schemes) (Amendment) Regulations, 2014 on January 09, 2014.
C. Investor Assistance and Education
SEBI has been taking various regulatory measures to expedite the redressal of investor grievances. The grievances lodged by investors are taken up with the respective listed company/intermediary and are continuously monitored. Investor assistance provided by SEBI through various modes viz. e-mails, letters, telephonic calls received on toll free helpline etc. are being executed in a proficient manner. The SCORES system has been working satisfactorily and has helped in making the complaint handling and redressal mechanism more efficient. Alike every year, this year too witnessed various investor awareness and education programs with wider reach being conducted by SEBI with the help of exchanges, depositories and various trade bodies like AMFI etc, increasing the total number of such programs in 2013-14.
a. Advisory Committee for SEBI Investor Protection and Education Fund (IPEF)
In Budget speech of Finance Minister while presenting the budget for FY 2006-07, Finance Minister proposed “To set up an Investor Protection Fund under the aegis of SEBI, funded by fines and penalties recovered by SEBI. This will bolster confidence among retail investors who should be the key drivers of the capital market”. Also, SEBI was to issue guidelines in this regard.
Accordingly, the Board in its meeting held on June 30, 2007, approved the establishment of an Investor Protection and
Education Fund with contribution from SEBI’s General Fund to be used for taking measures for investor education.
Further, the SEBI (Investor Protection and Education Fund) Regulations, 2009 came into effect, which required for establishment of a fund called “Investor Protection and Education Fund” or IPEF. The Fund was deemed to have been established on July 23, 2007, by the order made by the Board under section 11 of the SEBI Act, 1992 with an initial corpus of `10 crore from the SEBI General Fund.
Amounts to be credited to the IPEF includes contribution by SEBI; Grants, donation by Central and state governments or any other entity approved by SEBI; Investor Protection Fund, Investor Services Fund, one percent security deposit available with the exchange in the event of de-recognition of stock exchange; interest or other income received from investment made from the fund etc; and any other amount as SEBI may specify in interest of investors.
Recent amendment to the SEBI Act 1992 through the Securities Laws (Amendment) Ordinance, 2013 has provided for crediting the disgorged amount pursuant to a direction issued under section 11B or section 12A of the Securities Contracts (Regulation) Act, 1956 or section 19 of the Depositories Act, 1996, as the case may be, to the Investor Protection and Education Fund.
Utilisation of funds from IPEF includes various educational and awareness activities, funding investor education and awareness activities of investor associations, aiding recognised investor associations to undertake legal proceedings in interest of investors; refund of securities deposit held by stock exchanges and transferred to IPEF consequent to de-recognition, after fulfilling condition for release of deposit etc.
51
Part One: Policies and Programmes
IPEF Advisory committee has been constituted (as prescribed by SEBI (IPEF) Regulations 2009) for recommending investor education and protection activities that may be undertaken directly by the Board or through any other agency, for utilisation of the funds from IPEF for the above purposes.
VII. Assessment and Prospects
A. Assessment
Indian economy suffered bouts of market turmoil in early 2013-14 on account of US Fed tapering concerns but the policy actions undertaken in the latter half of the year built buffers to withstand the economy against possible spillovers. While these defensive buffers facilitated in narrowing the statistics, the growth concerns still remain dominant with GDP growth estimated at 4.9 percent for FY14 while Index of Industrial Production (IIP) statistics stagnated for two successive years followed by contraction of 0.1 percent in 2013-14. While the previous year witnessed all the three sectors (services, agriculture and industry) losing their momentum, the current year bore a testimony to the revival in agriculture activity. While Services sector registered a sluggish growth, the Industry recorded a fall in growth in the financial year.
Savings rate as a percentage of GDP meanwhile fell further from 31.3 percent to 30.1 percent on the back of decline in Household Savings. While savings in financial assets remained constant, savings in physical assets registered a marginal decrease over the previous year. The investment dwindled during the year, while the saving-investment gap widened to 4.7 percent of the GDP at market prices, propagating heavy reliance on capital inflows. Following a lower trade deficit, coupled with rise in net invisible receipts, India’s full-year CAD is likely to be
below 2.5 percent of GDP due to slackening of gold imports and moderate pick-up in exports. The actual gross fiscal deficit declined to 4.5 percent of the GDP riding on the back of revenue push and expenditure cuts as also due to phased subsidy reduction of diesel prices. Liquidity conditions which remained tight till first half of the year, eased gradually with normalisation of exceptional monetary measures. Credit growth decelerated on the back of sluggish macroeconomic activity and deterioration in asset quality.
In addition to the containment of current account deficit within a sustainable level, efforts were made to stabilise the rupee exchange rate which in conjunction with improvements in global trade, contracted India’s trade deficit and also strengthened foreign exchange reserves during the year.
The securities market, which observed gains during the early part of the year, got disrupted owing to global headwinds. However, as normalcy returned, the Indian stock markets recovered with benchmark indices, BSE Sensex and NSE Nifty registering their all-time high. The BSE Sensex knocked a new peak to close at 22,386 on March 31, 2014, breaching the 20,000 mark touched during 2012-13. Nifty, too, crossed the 6,000 mark of 2012-13 and logged to a new lifetime high by closing at 6,704 on March 31, 2014. On a point to point basis, Sensex observed a growth of 18.8 percent, while Nifty recorded a growth of 18.0 percent over the previous year. The SX40 index of MCX-SX closed at 13,298 on March 31, 2014. As per World Federation of Exchanges (WFE) statistics, NSE retained its number one position in the category of largest exchange by Electronic Order Book (EOB) number of trades in 2013 and stood at third position among top 5 exchanges by number of single stock futures traded in 2013.

52
Annual Report 2013-14
The market capitalisation of benchmark indices replicated an upward trend with a rise of 16.1 percent at BSE and 16.6 percent at NSE over the previous financial year. The turnover at BSE declined by 4.9 percent whereas at NSE it increased by 3.7 percent over the previous year. The market capitalisation to GDP (at market prices) ratio of BSE stood at 65.3 percent and for NSE the ratio was 64.1 percent. MCX-SX, recorded a market captilisation of `72,39,670 crore in 2013-14 and its ratio to GDP at 64.0 percent. While the turnover in the equity derivative segment exhibited an increase of 22.9 percent in 2013-14, amidst the volatile rupee during the year, the currency derivative segment turnover registered a decline of 23.9 percent over the previous year. Meanwhile, markets witnessed introduction of new segments and platforms with BSE going live in the currency derivative segment and introduction of trading in interest rate futures at NSE and BSE.
Exchanges were permitted to launch IRF contracts on either one or both of the options - Coupon bearing Government of India security as underlying and/or Coupon bearing notional 10-year Government of India security with settlement price based on basket of securities as underlying. SEBI also permitted derivatives on India’s first volatility Index, India VIX, which is a key measure of market expectations of near-term volatility, which was launched in January 2014 by NSE. The measures have been largely aimed at expansion and development of our securities market.
The financial year 2013-14 also saw elevated levels in primary equity and debt market with a total resource mobilisation to the tune of `55,652 crore as against `32,455 crore raised in the previous year. Public Issue of debt reached more than doubled
over the previous year and reached `42,383 crore. Amount of resource mobilisation taking place through the private placement of corporate debt stood at `2,76,054 crore. Resource mobilisation of equity through Preferential Allotment is approximately similar to the previous year and stood at `46,463 crore while the QIP route registered a decline and mobilised ̀ 13,663 crore. The new platforms for small and medium enterprises (SMEs) by BSE and NSE, witnessed resource mobilisation of `317 crore through 37 issues compared to `239 crore raised by 24 issues in the previous year, reflecting high entrepreneurial potential of the economy.
In its endeavour to give a further impetus to the primary market, SEBI made grading mechanism voluntary for initial public offers (IPOs). In order to facilitate capital raising by small and medium enterprises (SMEs), SEBI decided to permit listing without an IPO and trading of specified securities of SMEs including start-up companies on Institutional Trading Platform (ITP) in SME Exchanges.
FII investments also witnessed a revival as confidence returned to the markets. In the early part of 2013-14, foreign institutional investors were net sellers in the debt segment while they turned net buyers from December 2013 onwards. The cumulative net investment of FIIs in Indian markets amounted to USD 180,405 million as at the end of March 2014 compared to USD 171,529 million in 2012-13, depicting a rise of 5.2 percent. The assets under the custody of custodians under different asset classes stood at `46,00,247 crore as end March 31, 2014. Mutual funds saw a net inflow of `53,783 crore in 2013-14. The persistent efforts of SEBI to promote and regulate the Indian securities market on the back of vigorous policy reforms were evident by growing statistics of the market.
53
Part One: Policies and Programmes
SEBI notified Foreign Portfolio Investors Regulations, 2014 with a view to harmonization of different routes of foreign portfolio investments. PSU divestment through ETF route, a first in Indian markets has also garnered market attention and appreciation visible in the record amount being mobilised. The year also witnessed the setting up of a dedicated debt segment on the stock exchanges with an objective to develop debt markets and encourage transition of trading in debt instruments from OTC markets to stock exchanges. With a committed approach to investor protection and empowerment, SEBI decided to give monetary relief to investors having claims upto `10 lakh, during the course of proceedings from the Investor Protection Fund of Stock Exchange.
The year 2013-14 saw SEBI being compliant of international good practices as specified by Financial Stability oversight body, constitution of Early Warning Group for monitoring early warning signals and monitoring of financial conglomerates as published in the IOSCO report of Thematic Review of the implementation of Principles 6 and 7 of the IOSCO. India is the only country that has a systemic risk monitoring template, developed by SEBI which covers the entire market, participants and product spectrum.
The incessant endeavours of SEBI in setting up a credible regulatory framework were lauded by IMF and World Bank in the FSAP report for India. The Report recognised that the regulatory and supervisory regime for Indian securities market is well developed and largely in compliance with international standards.
While the market fundamentals strengthened as the year progressed, steadfast policy measures encompassing all spheres
of market activity further emboldened the regulatory infrastructure and reposed the investor confidence.
B. Prospects
SEBI completed its 25 year journey in 2013. During these eventful years, it has successfully not only modernised Indian capital markets bringing in line the best international practices and standards but has taken initiatives that were subsequently adopted by other countries. However the challenges to regulation persist induced by advances of technology driving innovations and complexities in market, products and platforms. SEBI aims to continuously upgrade and improve its human and technological capabilities so that it can fulfill its mandate of delivering strong enforcement, protection of investors and development of markets.
The Indian securities market continues to evolve with various policy measures aimed to preserve and maintain a safe and fair market to protect the interest of investors. SEBI has been taking various regulatory actions especially those pertaining to CIS to make Indian securities market more secure and regulated. Over the years, SEBI has built the reputation of a credible enforcement agency. The enforcement action taken by SEBI is designed to be appropriate in a holistic sense. SEBI has used warnings and letters of deficiency to address findings from inspection reports, while in other cases ‘harder’ measures, such as disgorgement and payment of money under adjudication or consent proceedings, have been imposed. In order to make the market a safe and fair place to investors, SEBI reviewed the extant insider trading regulatory regime so as to align with the best practices globally. The High level committee on Insider trading has proposed draft Insider trading regulation which has
54
Annual Report 2013-14
been placed in public for comments.
Integrated and continuous market surveillance is the crucial mechanism to ensure market integrity and investor confidence. The upgraded surveillance mechanism implemented by SEBI is effectively supervising the market activities to ensure seamless trading. The dynamic contours of market, entails capacity building for effective integrated surveillance with special focus on enhancing skill sets for using analytical and statistical tools for monitoring derivative and HFT trades. World-wide, regulators are reviewing the regulatory frameworks on Algorithmic and HFT for its potential impact on market stability. Profiling of major clients in various segments may help to understand the pattern of market participation and their impact with special emphasis on algorithmic trading, HFT etc. This will necessitate upgradation of resources for understanding and effective surveillance specific to algorithmic trading and HFT. Systemic approach is a requisite to establish a mechanism for risk profiling of companies/ stock brokers so as to understand the associated risks. Process for comprehensive upgradation of DWBIS infrastructure to ensure data storage and processing requirement for next five years is also initiated.
To enhance the existing supervisory mechanisms, a Risk Based Supervision Task Force has been set up and assigned the task of understanding the objective of supervision for each class of SEBI registered intermediary, to identify and define various risk metrics, both quantitative and qualitative, to explore and lay down the methodology for assigning rating of various risk metrics. The Task Force will be submitting its report in the early part of FY 2014-15 and thereafter, the
implementation of the recommendations shall be taken up across various classes of intermediaries.
The Companies Act, 2013 was enacted on August 30, 2013 which provides for a major overhaul in the corporate governance norms for all companies. SEBI has also revised the existing Corporate Governance framework (Clause 49 of Listing agreement) which would be applicable with effect from October 01, 2014 to align with the provisions of the Companies Act, 2013, adopt best practices on corporate governance and to make the corporate governance framework more effective.
The FSAP report for India had recommended that enforcement of compliance of companies with listing obligations by stock exchanges should be strengthened. Also SEBI along with the stock exchanges should review whether current arrangements to analyse material events should be strengthened. Accordingly, a Committee was formed for drafting an all encompassing Listing Regulations providing listing conditions and disclosure requirements for various categories of securities. In order to maintain a single document in line with the Listing Agreement and to address the concerns of excessive delegation in the garb of flexibility with respect to certain areas, such as, disclosure requirements, an approach paper has been prepared enlisting listing agreement provisions, modifying existing and proposing new provisions and incorporating the changes in consonance with the Companies Act, 2013.
In addition to aligning the regulations, SEBI also strives to cover all the market participants within the ambit of its regulatory purview. With a view to regulate entities that offer investors analytical or evaluative

55
Part One: Policies and Programmes
services and to avoid conflicts of interest, SEBI is proposing to regulate research analysts in Indian securities market through an exclusive and comprehensive regulation. The final regulations on the same is under preparation.
Infrastructure is the cornerstone of India’s development and infrastructure financing is a bottleneck in country’s progress. To enable, setting up of a framework for investment in infrastructure, SEBI has proposed ‘Infrastructure Investment Trusts‘(InvITs) in the country. InvITs, as an investment vehicle, is aimed to provide wider and long-term re-finance for existing infrastructure projects, to free up current developer capital for reinvestment into new infrastructure projects and to refinance/takeout existing high cost debt with long-term low-cost capital.
SEBI has taken several steps to re-energize mutual fund industry to increase product penetration especially in smaller cities/towns, regulation of distributors and issues concerning investor protection, develop a long-term policy for the sustainable growth of the industry and increase household savings through mutual funds.
SEBI has been setting up local offices across the country with the primary aim to provide investor assistance and education to nooks and corners of the country. In order to help in achieving financial inclusion and to enhance the investor’s confidence and awareness, SEBI continues to evolve various initiatives like conducting workshops, visit to SEBI and introducing financial concepts in CBSE curriculum. SEBI initiated National Financial Literacy Assessment Test (NFLAT) under National Strategy for Financial Education with a vision of a financially aware and empowered India. In addition, with
an objective to make learning of securities market and financial education easy and entertainment based, SEBI is looking forward to explore ways to employ modern technology and social media to achieve the same.
Various investor centric initiatives such as these may require deployment of more resources both financial as well as human. Hence it was felt to undertake a comprehensive analysis so as to harmonize the resources with the evolving market structure and review the expenditures so as to align them with organisational objectives. Towards this, a comprehensive review was undertaken by an internal committee for augmentation and rationalization of the financial resources viz. Committee on Rationalization of Financial Resources of SEBI. Implementation of the recommendations of the consultant appointed to revisit the structural and organizational issues, re-prioritize areas of focus and to look at the technological and manpower needs of SEBI is also in progress.
In the international arena, SEBI continues to contribute towards the substantive projects and issues, and plays a pivotal role in many areas: at the bilateral, Asia-Pacific regional and international levels. SEBI continued to play a key role at the various meetings and committees of the IOSCO and, thus, strengthened its position in the global space.
As the new financial year commences, the journey of SEBI continues with new challenges moulded by innovations, technologies, manipulators and systemically important institutions. Notwithstanding these, SEBI would incessantly strive to make Indian securities market world-class by pursuing its mandatory objectives, “Protection of interests of investors, promote the regulation and development of market”.
PART TWO: REVIEW OF WORKING AND OPERATIONS OF THE SECURITIES AND EXCHANGE BOARD OF INDIA IN THE SECURITIES MARKET
1. PRIMARY SECURITIES MARKET
In 2013-14, primary markets rebounded with enhanced figures in resource mobilisation. The upbeat sentiment is consistent with the encouraging global cues and improving macroeconomic factors back at home. A host of factors like economic recovery, containment of twin deficits, adjustment of rupee exchange rate, fall in interest rates have all been influential in shaping the markets. While the first half of the financial year grappled with volatility emanating from international headwinds and domestic uncertainty, the second half saw a growth in external demand on the back of currency appreciation. Policy actions in India have strengthened the buffers and prevented Indian economy from the possible spillovers of the US Fed tapering and the Ukraine crisis. Investor confidence and optimism restored during the year mainly on account of performance of financial markets and facilitative policy actions by SEBI. Listing without an Initial Public Offer and trading of specified securities of small and medium enterprises (SMEs) including start-up companies on Institutional Trading Platform (ITP) in SME Exchanges, modifications in the formats for disclosures under regulation 29 (1), 29 (2) and 31 of SEBI (Substantial Acquisition of Shares and Takeovers) Regulations, 2011 to ensure adequate disclosures are made to
help investors were some measures aimed at bolstering the primary market activities.
I. Resource Mobilisation through Public and Rights Issues
During 2013-14, 90 companies accessed the primary market and raised `55,652 crore through public (75) and rights issues (15) as against 69 companies which raised `32,455 crore in 2012-13 through public (53) and rights issues (16) (Table 2.1). Primary market activities in 2013-14 were on a resurgent mode as compared to 2012-13. The number of IPOs in 2013-14 stood at 38 as compared to 33 in the year 2012-13. Of the 38 IPOs, 37 have been listed at the SME platform. The amount raised through IPOs in 2013-14 was lower at `1,236 crore as compared to `6,528 crore during 2012-13. During the year, offer for sale by existing shareholders mobilised `3,096 crore through four IPOs and FPOs. There were two FPOs worth ` 7,457 crore in 2013-14 as compared to none in 2012-13. The share of public issues in the total resource mobilisation increased to 91.8 percent during 2013-14 from 72.4 percent during 2012-13 and the share of rights issues decreased from 27.6 percent in 2012-13 to 8.2 percent in 2013-14 (Chart 2.1). Of the public issues, the share of debt issues in the total resource mobilisation was the largest at 76.2 percent and that of equity issues was 23.8 percent in 2013-14.
56
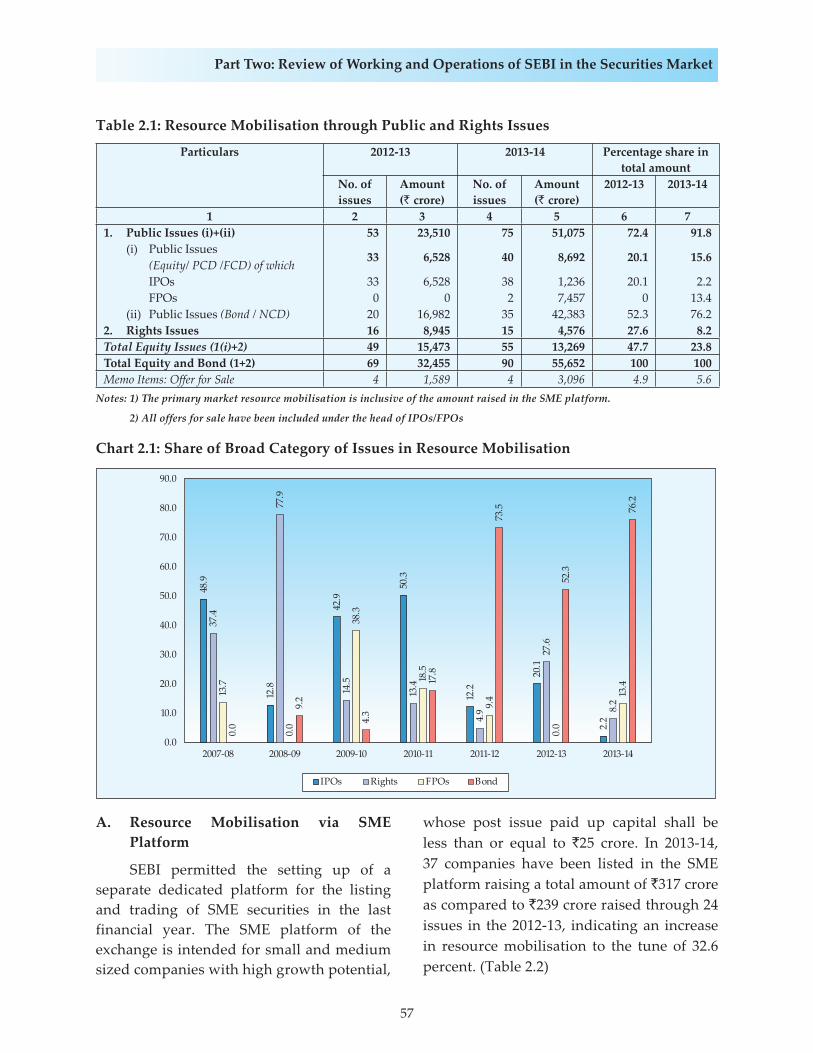
57
Part Two: Review of Working and Operations of SEBI in the Securities Market
A. Resource Mobilisation via SME Platform
SEBI permitted the setting up of a separate dedicated platform for the listing and trading of SME securities in the last financial year. The SME platform of the exchange is intended for small and medium sized companies with high growth potential,
Table 2.1: Resource Mobilisation through Public and Rights Issues
Particulars 2012-13 2013-14 Percentage share in total amount
No. of issues
Amount (` crore)
No. of issues
Amount (` crore)
2012-13 2013-14
1 2 3 4 5 6 71. Public Issues (i)+(ii) 53 23,510 75 51,075 72.4 91.8 (i) Public Issues
33 6,528 40 8,692 20.1 15.6 (Equity/ PCD /FCD) of which IPOs 33 6,528 38 1,236 20.1 2.2 FPOs 0 0 2 7,457 0 13.4 (ii) Public Issues (Bond / NCD) 20 16,982 35 42,383 52.3 76.22. Rights Issues 16 8,945 15 4,576 27.6 8.2Total Equity Issues (1(i)+2) 49 15,473 55 13,269 47.7 23.8Total Equity and Bond (1+2) 69 32,455 90 55,652 100 100Memo Items: Offer for Sale 4 1,589 4 3,096 4.9 5.6
Notes: 1) The primary market resource mobilisation is inclusive of the amount raised in the SME platform.
2) All offers for sale have been included under the head of IPOs/FPOs
whose post issue paid up capital shall be less than or equal to `25 crore. In 2013-14, 37 companies have been listed in the SME platform raising a total amount of `317 crore as compared to `239 crore raised through 24 issues in the 2012-13, indicating an increase in resource mobilisation to the tune of 32.6 percent. (Table 2.2)
Chart 2.1: Share of Broad Category of Issues in Resource Mobilisation

58
Annual Report 2013-14
B. Sector-wise Resource Mobilisation
Sector-wise classification of the resource mobilisation shows that 70 private sector issues and 20 public sector issues were mobilised through primary market in 2013-14 as compared to 55 private sector issues and 14 public sector issues in 2012-13. Private sector issues mobilised `11,681 crore compared to `43,970 crore mobilised by the public
sector companies (Table 2.3). Private sector contributed 21.0 percent in the total resource mobilisation in 2013-14 as compared to 54.5 percent in 2012-13 (Chart 2.2). The amount raised through public sector issues was 79.0 percent of the total resource mobilisation comparing with 45.5 percent during the year 2012-13.
Table 2.2: SME Platform
Year/Month Total
No. of issue Amount(` crore)
1 2 3
2012-13 24 239
2013-14 37 317
Apr-13 0 0
May-13 2 9
Jun-13 1 16
Jul-13 2 11
Aug-13 5 67
Sep-13 5 36
Oct-13 5 84
Nov-13 1 6
Dec-13 3 18
Jan-14 2 10
Feb-14 6 39
Mar-14 5 21
Table 2.3: Sector-wise Resource Mobilisation
Sector 2012-13 2013-14 Percentage share in total amount
No.of issues Amount(` crore)
No.of issues Amount(` crore)
2012-13 2013-14
1 2 3 4 5 6 7
Private 55 17,690 70 11,681 54.5 21.0
Public 14 14,765 20 43,970 45.5 79.0
Total 69 32,455 90 55,652 100.0 100.0
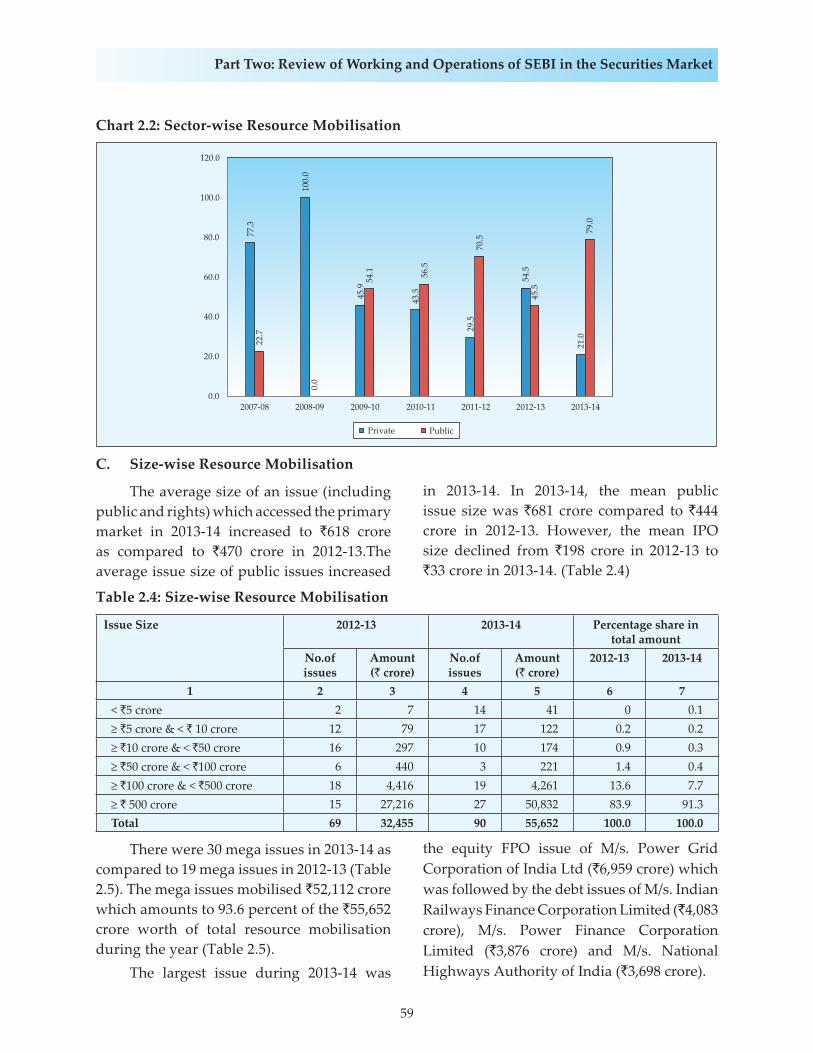
59
Part Two: Review of Working and Operations of SEBI in the Securities Market
C. Size-wise Resource Mobilisation
The average size of an issue (including public and rights) which accessed the primary market in 2013-14 increased to `618 crore as compared to `470 crore in 2012-13.The average issue size of public issues increased
Chart 2.2: Sector-wise Resource Mobilisation
in 2013-14. In 2013-14, the mean public issue size was `681 crore compared to `444 crore in 2012-13. However, the mean IPO size declined from `198 crore in 2012-13 to `33 crore in 2013-14. (Table 2.4)
Table 2.4: Size-wise Resource Mobilisation
Issue Size 2012-13 2013-14 Percentage share in total amount
No.of issues
Amount (` crore)
No.of issues
Amount (` crore)
2012-13 2013-14
1 2 3 4 5 6 7< `5 crore 2 7 14 41 0 0.1≥ `5 crore & < ` 10 crore 12 79 17 122 0.2 0.2≥ `10 crore & < `50 crore 16 297 10 174 0.9 0.3≥ `50 crore & < `100 crore 6 440 3 221 1.4 0.4≥ `100 crore & < `500 crore 18 4,416 19 4,261 13.6 7.7≥ ` 500 crore 15 27,216 27 50,832 83.9 91.3Total 69 32,455 90 55,652 100.0 100.0
There were 30 mega issues in 2013-14 as compared to 19 mega issues in 2012-13 (Table 2.5). The mega issues mobilised `52,112 crore which amounts to 93.6 percent of the `55,652 crore worth of total resource mobilisation during the year (Table 2.5). The largest issue during 2013-14 was
the equity FPO issue of M/s. Power Grid Corporation of India Ltd (`6,959 crore) which was followed by the debt issues of M/s. Indian Railways Finance Corporation Limited (`4,083 crore), M/s. Power Finance Corporation Limited (`3,876 crore) and M/s. National Highways Authority of India (`3,698 crore).
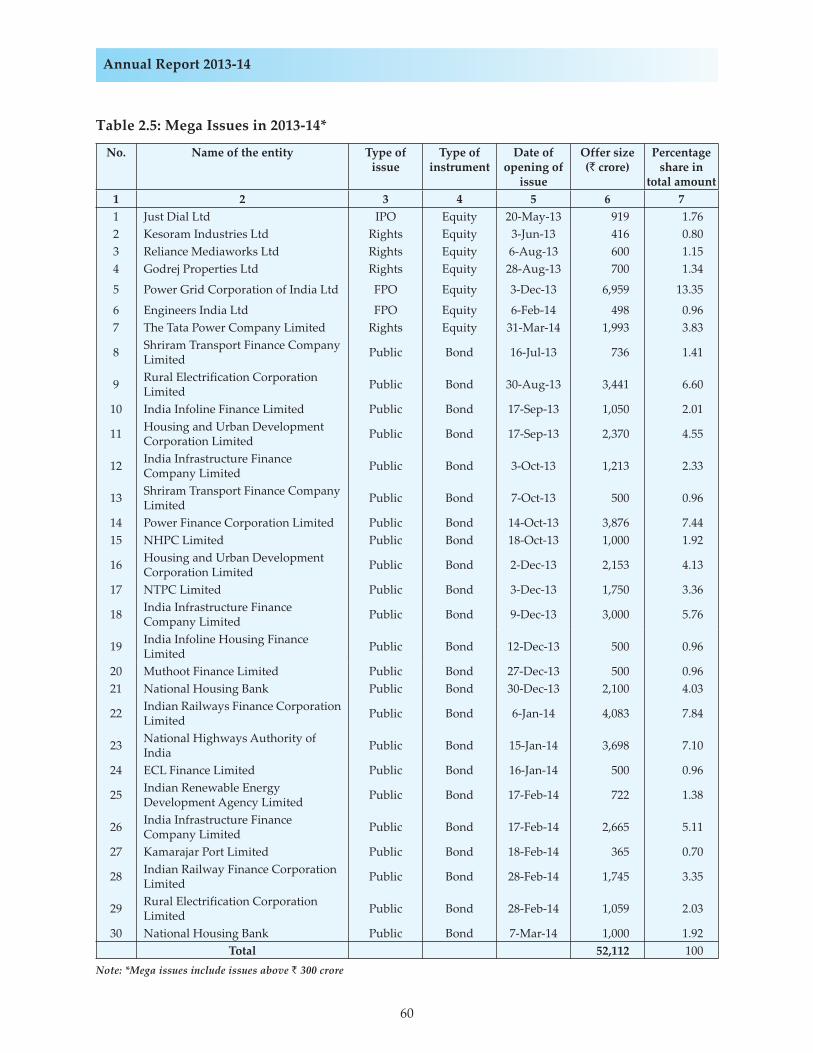
60
Annual Report 2013-14
Table 2.5: Mega Issues in 2013-14*
No. Name of the entity Type of issue
Type of instrument
Date of opening of
issue
Offer size(` crore)
Percentage share in
total amount1 2 3 4 5 6 71 Just Dial Ltd IPO Equity 20-May-13 919 1.762 Kesoram Industries Ltd Rights Equity 3-Jun-13 416 0.803 Reliance Mediaworks Ltd Rights Equity 6-Aug-13 600 1.154 Godrej Properties Ltd Rights Equity 28-Aug-13 700 1.34
5 Power Grid Corporation of India Ltd FPO Equity 3-Dec-13 6,959 13.35
6 Engineers India Ltd FPO Equity 6-Feb-14 498 0.967 The Tata Power Company Limited Rights Equity 31-Mar-14 1,993 3.83
8 Shriram Transport Finance Company Limited Public Bond 16-Jul-13 736 1.41
9 Rural Electrification Corporation Limited Public Bond 30-Aug-13 3,441 6.60
10 India Infoline Finance Limited Public Bond 17-Sep-13 1,050 2.01
11 Housing and Urban Development Corporation Limited Public Bond 17-Sep-13 2,370 4.55
12 India Infrastructure Finance Company Limited Public Bond 3-Oct-13 1,213 2.33
13 Shriram Transport Finance Company Limited Public Bond 7-Oct-13 500 0.96
14 Power Finance Corporation Limited Public Bond 14-Oct-13 3,876 7.4415 NHPC Limited Public Bond 18-Oct-13 1,000 1.92
16 Housing and Urban Development Corporation Limited Public Bond 2-Dec-13 2,153 4.13
17 NTPC Limited Public Bond 3-Dec-13 1,750 3.36
18 India Infrastructure Finance Company Limited Public Bond 9-Dec-13 3,000 5.76
19 India Infoline Housing Finance Limited Public Bond 12-Dec-13 500 0.96
20 Muthoot Finance Limited Public Bond 27-Dec-13 500 0.9621 National Housing Bank Public Bond 30-Dec-13 2,100 4.03
22 Indian Railways Finance Corporation Limited Public Bond 6-Jan-14 4,083 7.84
23 National Highways Authority of India Public Bond 15-Jan-14 3,698 7.10
24 ECL Finance Limited Public Bond 16-Jan-14 500 0.96
25 Indian Renewable Energy Development Agency Limited Public Bond 17-Feb-14 722 1.38
26 India Infrastructure Finance Company Limited Public Bond 17-Feb-14 2,665 5.11
27 Kamarajar Port Limited Public Bond 18-Feb-14 365 0.70
28 Indian Railway Finance Corporation Limited Public Bond 28-Feb-14 1,745 3.35
29 Rural Electrification Corporation Limited Public Bond 28-Feb-14 1,059 2.03
30 National Housing Bank Public Bond 7-Mar-14 1,000 1.92Total 52,112 100
Note: *Mega issues include issues above ` 300 crore
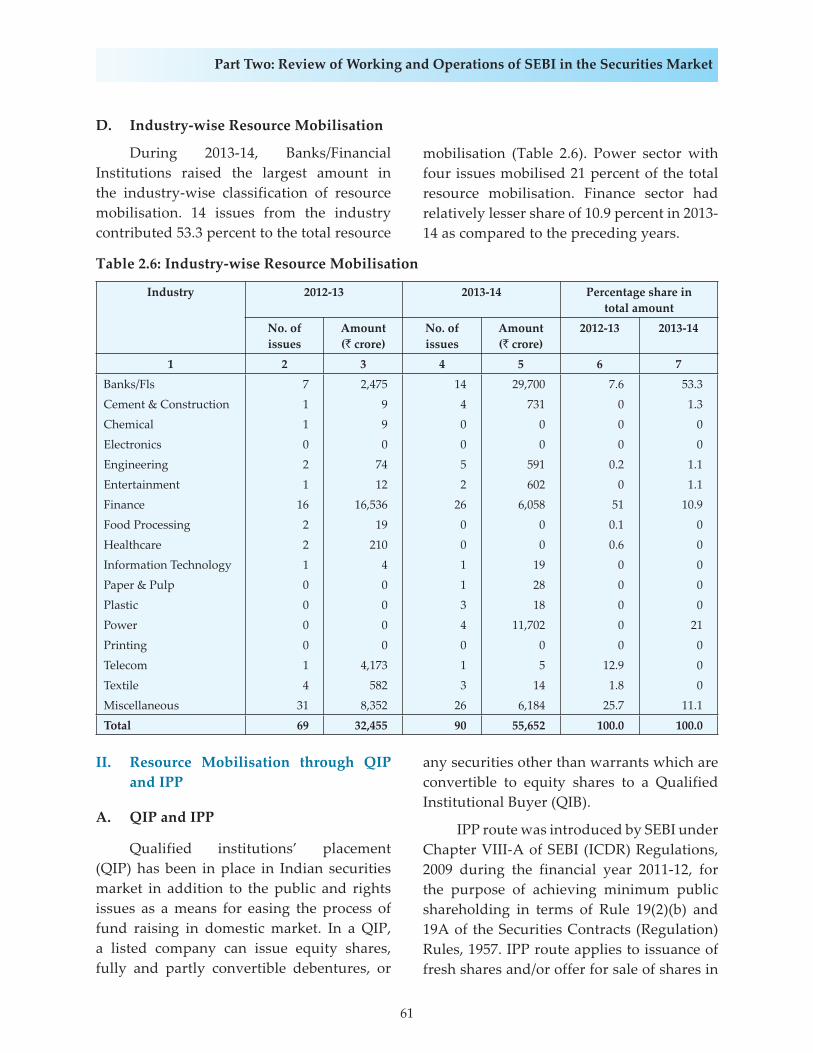
61
Part Two: Review of Working and Operations of SEBI in the Securities Market
II. Resource Mobilisation through QIP and IPP
A. QIP and IPP
Qualified institutions’ placement (QIP) has been in place in Indian securities market in addition to the public and rights issues as a means for easing the process of fund raising in domestic market. In a QIP, a listed company can issue equity shares, fully and partly convertible debentures, or
any securities other than warrants which are convertible to equity shares to a Qualified Institutional Buyer (QIB).
IPP route was introduced by SEBI under Chapter VIII-A of SEBI (ICDR) Regulations, 2009 during the financial year 2011-12, for the purpose of achieving minimum public shareholding in terms of Rule 19(2)(b) and 19A of the Securities Contracts (Regulation) Rules, 1957. IPP route applies to issuance of fresh shares and/or offer for sale of shares in
D. Industry-wise Resource Mobilisation
During 2013-14, Banks/Financial Institutions raised the largest amount in the industry-wise classification of resource mobilisation. 14 issues from the industry contributed 53.3 percent to the total resource
mobilisation (Table 2.6). Power sector with four issues mobilised 21 percent of the total resource mobilisation. Finance sector had relatively lesser share of 10.9 percent in 2013-14 as compared to the preceding years.
Table 2.6: Industry-wise Resource Mobilisation
Industry 2012-13 2013-14 Percentage share intotal amount
No. of issues
Amount (` crore)
No. of issues
Amount (` crore)
2012-13 2013-14
1 2 3 4 5 6 7Banks/Fls 7 2,475 14 29,700 7.6 53.3Cement & Construction 1 9 4 731 0 1.3Chemical 1 9 0 0 0 0Electronics 0 0 0 0 0 0Engineering 2 74 5 591 0.2 1.1Entertainment 1 12 2 602 0 1.1Finance 16 16,536 26 6,058 51 10.9Food Processing 2 19 0 0 0.1 0Healthcare 2 210 0 0 0.6 0Information Technology 1 4 1 19 0 0Paper & Pulp 0 0 1 28 0 0Plastic 0 0 3 18 0 0Power 0 0 4 11,702 0 21Printing 0 0 0 0 0 0Telecom 1 4,173 1 5 12.9 0Textile 4 582 3 14 1.8 0Miscellaneous 31 8,352 26 6,184 25.7 11.1Total 69 32,455 90 55,652 100.0 100.0
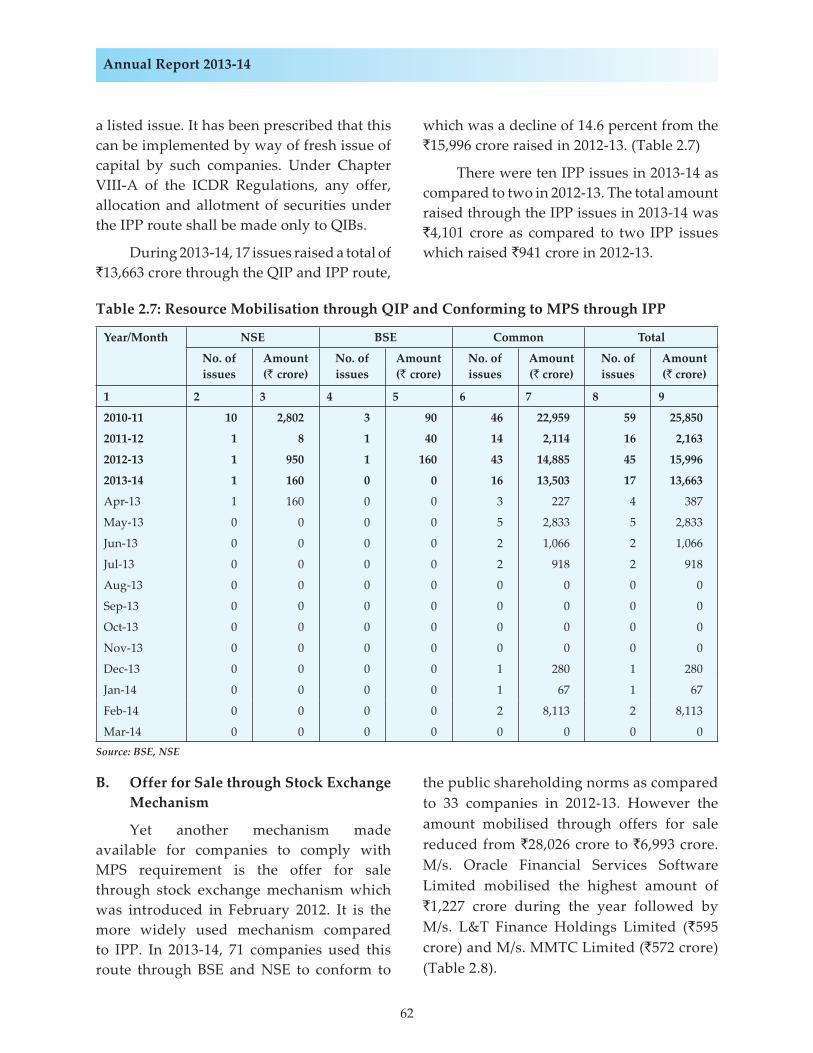
62
Annual Report 2013-14
a listed issue. It has been prescribed that this can be implemented by way of fresh issue of capital by such companies. Under Chapter VIII-A of the ICDR Regulations, any offer, allocation and allotment of securities under the IPP route shall be made only to QIBs.
During 2013-14, 17 issues raised a total of `13,663 crore through the QIP and IPP route,
which was a decline of 14.6 percent from the `15,996 crore raised in 2012-13. (Table 2.7)
There were ten IPP issues in 2013-14 as compared to two in 2012-13. The total amount raised through the IPP issues in 2013-14 was `4,101 crore as compared to two IPP issues which raised `941 crore in 2012-13.
Table 2.7: Resource Mobilisation through QIP and Conforming to MPS through IPP
Year/Month NSE BSE Common Total
No. of issues
Amount (` crore)
No. of issues
Amount (` crore)
No. of issues
Amount (` crore)
No. of issues
Amount (` crore)
1 2 3 4 5 6 7 8 9
2010-11 10 2,802 3 90 46 22,959 59 25,850
2011-12 1 8 1 40 14 2,114 16 2,163
2012-13 1 950 1 160 43 14,885 45 15,996
2013-14 1 160 0 0 16 13,503 17 13,663
Apr-13 1 160 0 0 3 227 4 387
May-13 0 0 0 0 5 2,833 5 2,833
Jun-13 0 0 0 0 2 1,066 2 1,066
Jul-13 0 0 0 0 2 918 2 918
Aug-13 0 0 0 0 0 0 0 0
Sep-13 0 0 0 0 0 0 0 0
Oct-13 0 0 0 0 0 0 0 0
Nov-13 0 0 0 0 0 0 0 0
Dec-13 0 0 0 0 1 280 1 280
Jan-14 0 0 0 0 1 67 1 67
Feb-14 0 0 0 0 2 8,113 2 8,113
Mar-14 0 0 0 0 0 0 0 0Source: BSE, NSE
B. Offer for Sale through Stock Exchange Mechanism
Yet another mechanism made available for companies to comply with MPS requirement is the offer for sale through stock exchange mechanism which was introduced in February 2012. It is the more widely used mechanism compared to IPP. In 2013-14, 71 companies used this route through BSE and NSE to conform to
the public shareholding norms as compared to 33 companies in 2012-13. However the amount mobilised through offers for sale reduced from `28,026 crore to `6,993 crore. M/s. Oracle Financial Services Software Limited mobilised the highest amount of `1,227 crore during the year followed by M/s. L&T Finance Holdings Limited (`595 crore) and M/s. MMTC Limited (`572 crore) (Table 2.8).

63
Part Two: Review of Working and Operations of SEBI in the Securities Market
III. Resource Mobilisation through Preferential Allotment
The mode of preferential allotment is utilised by a listed company to issues equity shares / fully convertible debentures/partly convertible debentures or any other financial instruments which would be converted into or exchanged with equity shares at a later date. The allotments are done on private placement basis to select group of persons under section 81 (1A) of
Companies Act, 1956. The issuer is required to take the permission of shareholders and should comply with various provisions which inter-alia include pricing, disclosures in the notice, lock-in, etc, in addition to the requirements specified in the Companies Act, 1956.
During 2013-14, 411 preferential issues raised `46,463 crore compared to 420 preferential issues which raised ̀ 46,939 crore in 2012-13 (Table 2.9).
Table 2.8: Offer for Sale through Stock Exchange Mechanism to conform to MPS
Year No. of Companies Total Resource Mobilised (in `crore)
1 2 3
2011-12 2 13,518
2012-13 33 28,026
2013-14 71 6,993
Source: BSE, NSE
Table 2.9: Resource Mobilisation through Preferential Allotment
Year/ Month
NSE BSE Common Total
No. of issues
Amount (` crore)
No. of issues
Amount (` crore)
No. of issues
Amount (` crore)
No. of issues
Amount (` crore)
1 2 3 4 5 6 7 8 9
2010-11 83 1,393 156 12,072 134 17,046 373 30,511
2011-12 133 2,820 88 4,166 90 18,723 311 25,709
2012-13 188 7,442 87 12,729 145 26,768 420 46,939
2013-14 222 3,789 24 1,029 165 41,645 411 46,463
Apr-13 21 659 3 42 13 11,143 37 11,844
May-13 24 403 0 0 32 3,767 56 4,170
Jun-13 20 179 0 0 13 11,699 33 11,878
Jul-13 15 371 2 88 10 1,147 27 1,605
Aug-13 24 178 4 431 7 453 35 1,062
Sep-13 17 323 4 71 11 532 32 926
Oct-13 20 367 4 63 7 2935 31 3366
Nov-13 14 132 1 2 9 622 24 756
Dec-13 10 414 3 17 14 6512 27 6943
Jan-14 16 33 2 316 31 460 49 809
Feb-14 15 152 0 0 6 534 21 686
Mar-14 26 577 1 0 12 1,841 39 2,418Source: BSE, NSE
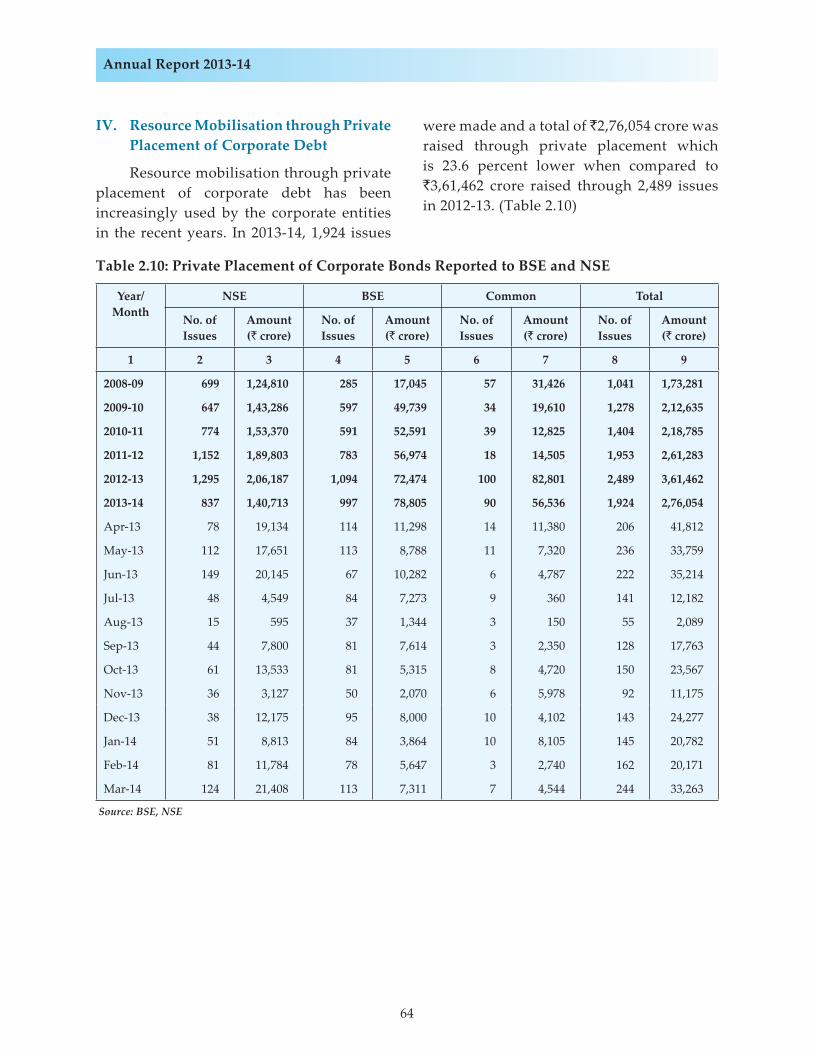
64
Annual Report 2013-14
IV. Resource Mobilisation through Private Placement of Corporate Debt
Resource mobilisation through private placement of corporate debt has been increasingly used by the corporate entities in the recent years. In 2013-14, 1,924 issues
were made and a total of `2,76,054 crore was raised through private placement which is 23.6 percent lower when compared to `3,61,462 crore raised through 2,489 issues in 2012-13. (Table 2.10)
Table 2.10: Private Placement of Corporate Bonds Reported to BSE and NSE
Year/ Month
NSE BSE Common Total
No. of Issues
Amount (` crore)
No. of Issues
Amount (` crore)
No. of Issues
Amount (` crore)
No. of Issues
Amount (` crore)
1 2 3 4 5 6 7 8 9
2008-09 699 1,24,810 285 17,045 57 31,426 1,041 1,73,281
2009-10 647 1,43,286 597 49,739 34 19,610 1,278 2,12,635
2010-11 774 1,53,370 591 52,591 39 12,825 1,404 2,18,785
2011-12 1,152 1,89,803 783 56,974 18 14,505 1,953 2,61,283
2012-13 1,295 2,06,187 1,094 72,474 100 82,801 2,489 3,61,462
2013-14 837 1,40,713 997 78,805 90 56,536 1,924 2,76,054
Apr-13 78 19,134 114 11,298 14 11,380 206 41,812
May-13 112 17,651 113 8,788 11 7,320 236 33,759
Jun-13 149 20,145 67 10,282 6 4,787 222 35,214
Jul-13 48 4,549 84 7,273 9 360 141 12,182
Aug-13 15 595 37 1,344 3 150 55 2,089
Sep-13 44 7,800 81 7,614 3 2,350 128 17,763
Oct-13 61 13,533 81 5,315 8 4,720 150 23,567
Nov-13 36 3,127 50 2,070 6 5,978 92 11,175
Dec-13 38 12,175 95 8,000 10 4,102 143 24,277
Jan-14 51 8,813 84 3,864 10 8,105 145 20,782
Feb-14 81 11,784 78 5,647 3 2,740 162 20,171
Mar-14 124 21,408 113 7,311 7 4,544 244 33,263
Source: BSE, NSE
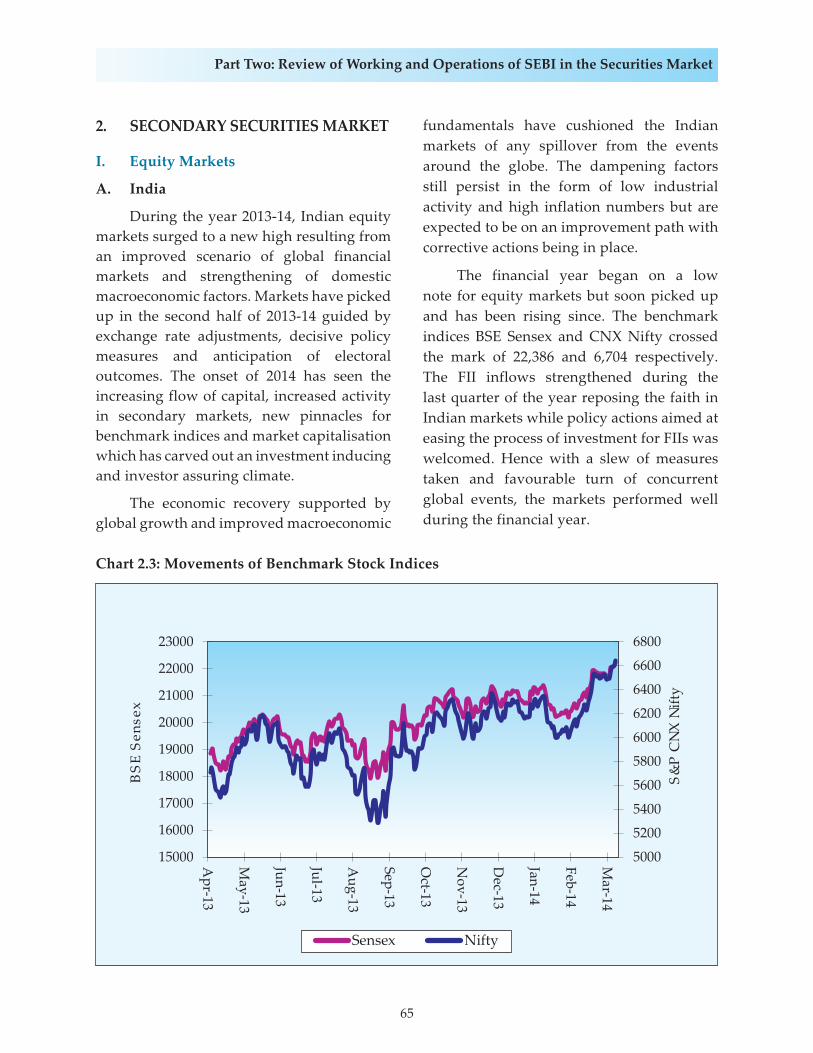
65
Part Two: Review of Working and Operations of SEBI in the Securities Market
2. SECONDARY SECURITIES MARKET
I. Equity Markets
A. India
During the year 2013-14, Indian equity markets surged to a new high resulting from an improved scenario of global financial markets and strengthening of domestic macroeconomic factors. Markets have picked up in the second half of 2013-14 guided by exchange rate adjustments, decisive policy measures and anticipation of electoral outcomes. The onset of 2014 has seen the increasing flow of capital, increased activity in secondary markets, new pinnacles for benchmark indices and market capitalisation which has carved out an investment inducing and investor assuring climate.
The economic recovery supported by global growth and improved macroeconomic
fundamentals have cushioned the Indian markets of any spillover from the events around the globe. The dampening factors still persist in the form of low industrial activity and high inflation numbers but are expected to be on an improvement path with corrective actions being in place.
The financial year began on a low note for equity markets but soon picked up and has been rising since. The benchmark indices BSE Sensex and CNX Nifty crossed the mark of 22,386 and 6,704 respectively. The FII inflows strengthened during the last quarter of the year reposing the faith in Indian markets while policy actions aimed at easing the process of investment for FIIs was welcomed. Hence with a slew of measures taken and favourable turn of concurrent global events, the markets performed well during the financial year.
Chart 2.3: Movements of Benchmark Stock Indices
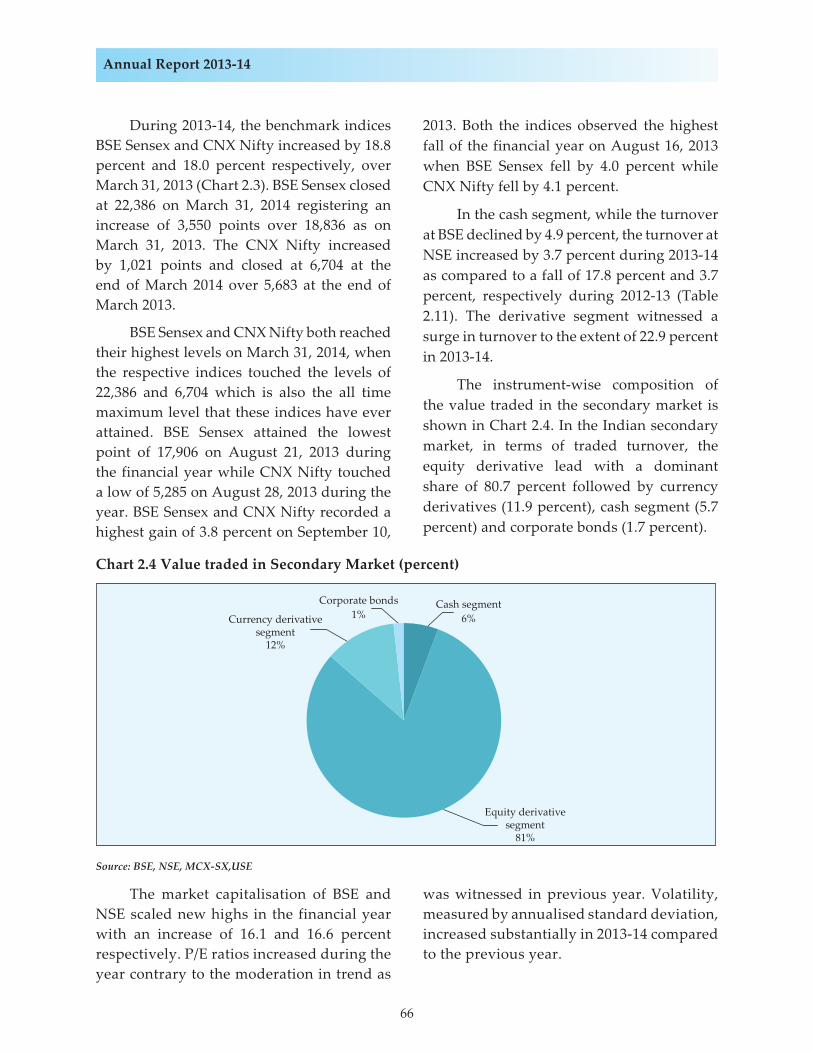
66
Annual Report 2013-14
During 2013-14, the benchmark indices BSE Sensex and CNX Nifty increased by 18.8 percent and 18.0 percent respectively, over March 31, 2013 (Chart 2.3). BSE Sensex closed at 22,386 on March 31, 2014 registering an increase of 3,550 points over 18,836 as on March 31, 2013. The CNX Nifty increased by 1,021 points and closed at 6,704 at the end of March 2014 over 5,683 at the end of March 2013.
BSE Sensex and CNX Nifty both reached their highest levels on March 31, 2014, when the respective indices touched the levels of 22,386 and 6,704 which is also the all time maximum level that these indices have ever attained. BSE Sensex attained the lowest point of 17,906 on August 21, 2013 during the financial year while CNX Nifty touched a low of 5,285 on August 28, 2013 during the year. BSE Sensex and CNX Nifty recorded a highest gain of 3.8 percent on September 10,
2013. Both the indices observed the highest fall of the financial year on August 16, 2013 when BSE Sensex fell by 4.0 percent while CNX Nifty fell by 4.1 percent.
In the cash segment, while the turnover at BSE declined by 4.9 percent, the turnover at NSE increased by 3.7 percent during 2013-14 as compared to a fall of 17.8 percent and 3.7 percent, respectively during 2012-13 (Table 2.11). The derivative segment witnessed a surge in turnover to the extent of 22.9 percent in 2013-14.
The instrument-wise composition of the value traded in the secondary market is shown in Chart 2.4. In the Indian secondary market, in terms of traded turnover, the equity derivative lead with a dominant share of 80.7 percent followed by currency derivatives (11.9 percent), cash segment (5.7 percent) and corporate bonds (1.7 percent).
Chart 2.4 Value traded in Secondary Market (percent)
Source: BSE, NSE, MCX-SX,USE
The market capitalisation of BSE and NSE scaled new highs in the financial year with an increase of 16.1 and 16.6 percent respectively. P/E ratios increased during the year contrary to the moderation in trend as
was witnessed in previous year. Volatility, measured by annualised standard deviation, increased substantially in 2013-14 compared to the previous year.
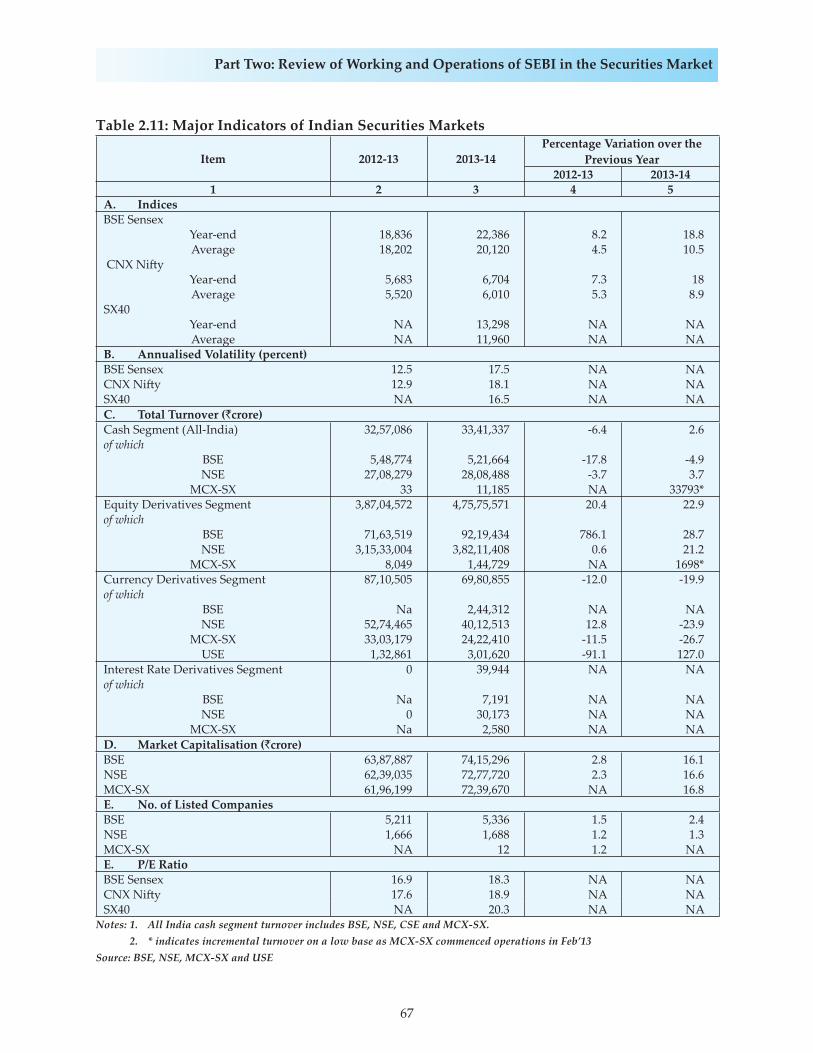
67
Part Two: Review of Working and Operations of SEBI in the Securities Market
Table 2.11: Major Indicators of Indian Securities Markets
Item 2012-13 2013-14Percentage Variation over the
Previous Year2012-13 2013-14
1 2 3 4 5A. Indices BSE Sensex
Year-end 18,836 22,386 8.2 18.8Average 18,202 20,120 4.5 10.5
CNX Ni� y Year-end 5,683 6,704 7.3 18Average 5,520 6,010 5.3 8.9
SX40Year-end NA 13,298 NA NAAverage NA 11,960 NA NA
B. Annualised Volatility (percent)BSE Sensex 12.5 17.5 NA NACNX Ni� y 12.9 18.1 NA NASX40 NA 16.5 NA NAC. Total Turnover (`crore) Cash Segment (All-India) 32,57,086 33,41,337 -6.4 2.6of which
BSE 5,48,774 5,21,664 -17.8 -4.9NSE 27,08,279 28,08,488 -3.7 3.7
MCX-SX 33 11,185 NA 33793*Equity Derivatives Segment 3,87,04,572 4,75,75,571 20.4 22.9of which
BSE 71,63,519 92,19,434 786.1 28.7NSE 3,15,33,004 3,82,11,408 0.6 21.2
MCX-SX 8,049 1,44,729 NA 1698*Currency Derivatives Segment 87,10,505 69,80,855 -12.0 -19.9of which
BSE Na 2,44,312 NA NANSE 52,74,465 40,12,513 12.8 -23.9
MCX-SX 33,03,179 24,22,410 -11.5 -26.7USE 1,32,861 3,01,620 -91.1 127.0
Interest Rate Derivatives Segment 0 39,944 NA NAof which
BSE Na 7,191 NA NANSE 0 30,173 NA NA
MCX-SX Na 2,580 NA NAD. Market Capitalisation (`crore) BSE 63,87,887 74,15,296 2.8 16.1NSE 62,39,035 72,77,720 2.3 16.6MCX-SX 61,96,199 72,39,670 NA 16.8E. No. of Listed CompaniesBSE 5,211 5,336 1.5 2.4NSE 1,666 1,688 1.2 1.3MCX-SX NA 12 1.2 NAE. P/E Ratio BSE Sensex 16.9 18.3 NA NACNX Ni� y 17.6 18.9 NA NASX40 NA 20.3 NA NA
Notes: 1. All India cash segment turnover includes BSE, NSE, CSE and MCX-SX. 2. * indicates incremental turnover on a low base as MCX-SX commenced operations in Feb’13Source: BSE, NSE, MCX-SX and USE

68
Annual Report 2013-14
B. International Comparison
Global markets while being tumultuous during the first half of the year, recovered in the second half. While the global activity strengthened and is expected to strengthen further, the downside risks which have overall moderated still persist arising from the ongoing tapering of quantitative easing in the US, weaker balance sheets in Euro area and inflationary pressures in emerging economies. Certain downside risks to the world economy as outlined by IMF have been a yet-greater general slowdown in emerging market economies, risks to activity from lower than expected inflation rates in advanced economies and rising geopolitical tensions. While US is moving from recovery to growth and Euro area from recession to recovery, Japan and China are absorbed with the tackling of domestic economic issues. Other Emerging Market and Developing Economies (EMDEs) have been benefitting
from strong external demand from advanced economies and are expected to further grow.
The second half of the financial year saw easing of tensions and remarkable improvements in the global financial conditions. The US Fed QE tapering boosted the global market sentiments. The turn of events in Ukraine and Syria however didn’t affect the financial market health. Most of the emerging and developed markets witnessed rebound during 2013-14. Among the emerging markets the annual return on a point-to-point basis was the highest in Argentina (56.1 percent) followed by Egypt (53.0 percent) and South Africa (19.3 percent). (Chart 2.5)
Among the developed equity markets, the yearly returns were highest in US (29.6 percent) followed by Japan (22.2 percent) and Germany (20.3 percent). The declines were the maximum for Russia (16.2 percent), Chile (14.6 percent) and Thailand (11.2 percent).
Chart 2.5: Year-on-Year Return of International Indices (in Percent)
Source: Bloomberg Services
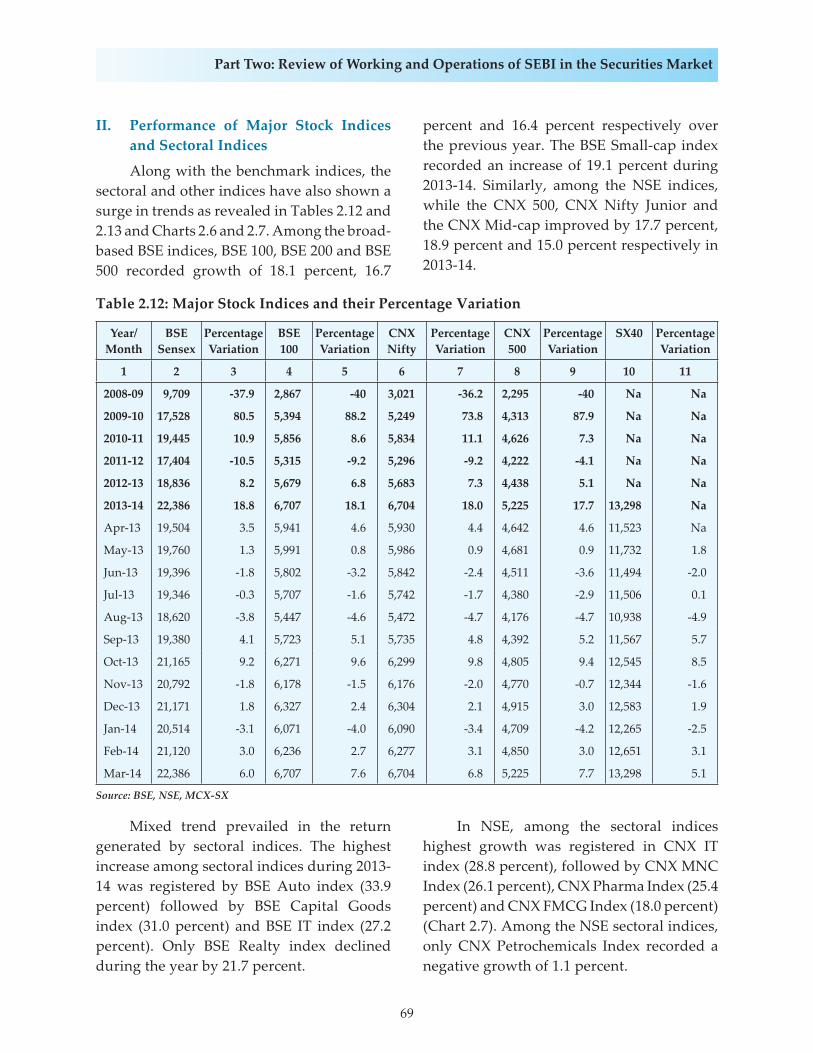
69
Part Two: Review of Working and Operations of SEBI in the Securities Market
II. Performance of Major Stock Indices and Sectoral Indices
Along with the benchmark indices, the sectoral and other indices have also shown a surge in trends as revealed in Tables 2.12 and 2.13 and Charts 2.6 and 2.7. Among the broad-based BSE indices, BSE 100, BSE 200 and BSE 500 recorded growth of 18.1 percent, 16.7
percent and 16.4 percent respectively over the previous year. The BSE Small-cap index recorded an increase of 19.1 percent during 2013-14. Similarly, among the NSE indices, while the CNX 500, CNX Nifty Junior and the CNX Mid-cap improved by 17.7 percent, 18.9 percent and 15.0 percent respectively in 2013-14.
Table 2.12: Major Stock Indices and their Percentage Variation
Year/ Month
BSE Sensex
Percentage Variation
BSE 100
Percentage Variation
CNX Nifty
Percentage Variation
CNX 500
Percentage Variation
SX40 Percentage Variation
1 2 3 4 5 6 7 8 9 10 11
2008-09 9,709 -37.9 2,867 -40 3,021 -36.2 2,295 -40 Na Na
2009-10 17,528 80.5 5,394 88.2 5,249 73.8 4,313 87.9 Na Na
2010-11 19,445 10.9 5,856 8.6 5,834 11.1 4,626 7.3 Na Na
2011-12 17,404 -10.5 5,315 -9.2 5,296 -9.2 4,222 -4.1 Na Na
2012-13 18,836 8.2 5,679 6.8 5,683 7.3 4,438 5.1 Na Na
2013-14 22,386 18.8 6,707 18.1 6,704 18.0 5,225 17.7 13,298 Na
Apr-13 19,504 3.5 5,941 4.6 5,930 4.4 4,642 4.6 11,523 Na
May-13 19,760 1.3 5,991 0.8 5,986 0.9 4,681 0.9 11,732 1.8
Jun-13 19,396 -1.8 5,802 -3.2 5,842 -2.4 4,511 -3.6 11,494 -2.0
Jul-13 19,346 -0.3 5,707 -1.6 5,742 -1.7 4,380 -2.9 11,506 0.1
Aug-13 18,620 -3.8 5,447 -4.6 5,472 -4.7 4,176 -4.7 10,938 -4.9
Sep-13 19,380 4.1 5,723 5.1 5,735 4.8 4,392 5.2 11,567 5.7
Oct-13 21,165 9.2 6,271 9.6 6,299 9.8 4,805 9.4 12,545 8.5
Nov-13 20,792 -1.8 6,178 -1.5 6,176 -2.0 4,770 -0.7 12,344 -1.6
Dec-13 21,171 1.8 6,327 2.4 6,304 2.1 4,915 3.0 12,583 1.9
Jan-14 20,514 -3.1 6,071 -4.0 6,090 -3.4 4,709 -4.2 12,265 -2.5
Feb-14 21,120 3.0 6,236 2.7 6,277 3.1 4,850 3.0 12,651 3.1
Mar-14 22,386 6.0 6,707 7.6 6,704 6.8 5,225 7.7 13,298 5.1
Source: BSE, NSE, MCX-SX
Mixed trend prevailed in the return generated by sectoral indices. The highest increase among sectoral indices during 2013-14 was registered by BSE Auto index (33.9 percent) followed by BSE Capital Goods index (31.0 percent) and BSE IT index (27.2 percent). Only BSE Realty index declined during the year by 21.7 percent.
In NSE, among the sectoral indices highest growth was registered in CNX IT index (28.8 percent), followed by CNX MNC Index (26.1 percent), CNX Pharma Index (25.4 percent) and CNX FMCG Index (18.0 percent) (Chart 2.7). Among the NSE sectoral indices, only CNX Petrochemicals Index recorded a negative growth of 1.1 percent.
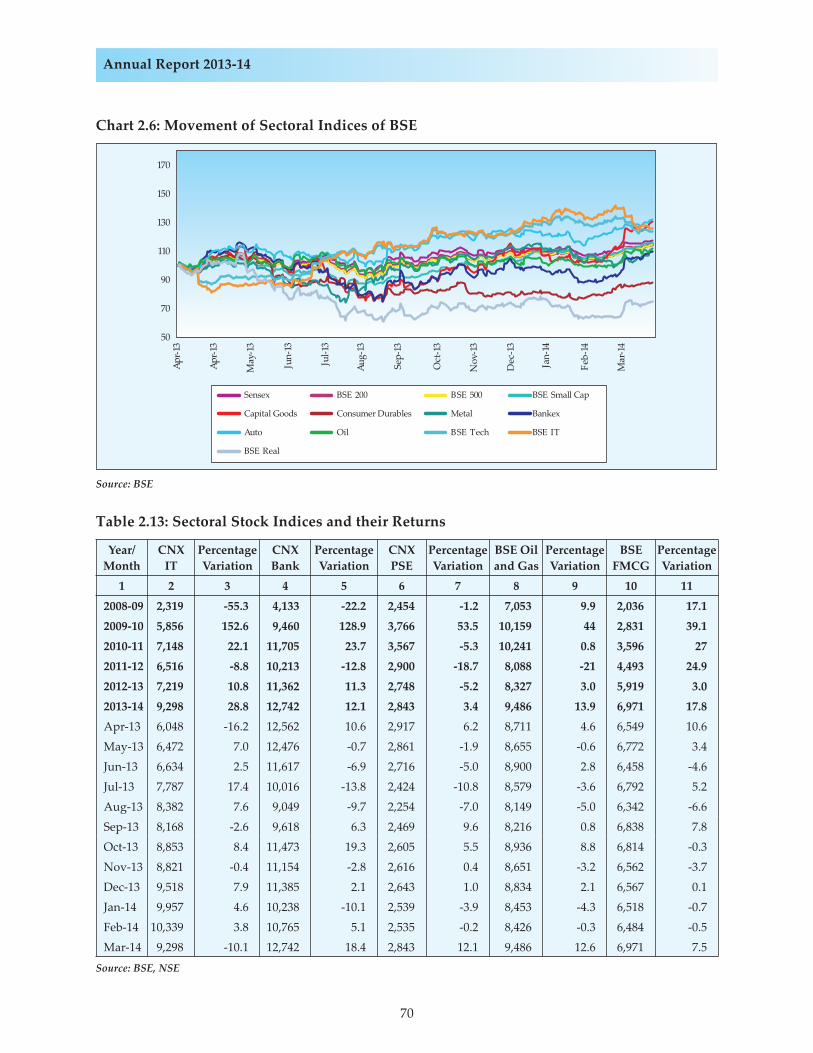
70
Annual Report 2013-14
Chart 2.6: Movement of Sectoral Indices of BSE
Source: BSE
Table 2.13: Sectoral Stock Indices and their Returns
Year/ Month
CNXIT
Percentage Variation
CNX Bank
Percentage Variation
CNX PSE
Percentage Variation
BSE Oil and Gas
Percentage Variation
BSE FMCG
Percentage Variation
1 2 3 4 5 6 7 8 9 10 112008-09 2,319 -55.3 4,133 -22.2 2,454 -1.2 7,053 9.9 2,036 17.12009-10 5,856 152.6 9,460 128.9 3,766 53.5 10,159 44 2,831 39.12010-11 7,148 22.1 11,705 23.7 3,567 -5.3 10,241 0.8 3,596 272011-12 6,516 -8.8 10,213 -12.8 2,900 -18.7 8,088 -21 4,493 24.92012-13 7,219 10.8 11,362 11.3 2,748 -5.2 8,327 3.0 5,919 3.02013-14 9,298 28.8 12,742 12.1 2,843 3.4 9,486 13.9 6,971 17.8Apr-13 6,048 -16.2 12,562 10.6 2,917 6.2 8,711 4.6 6,549 10.6May-13 6,472 7.0 12,476 -0.7 2,861 -1.9 8,655 -0.6 6,772 3.4Jun-13 6,634 2.5 11,617 -6.9 2,716 -5.0 8,900 2.8 6,458 -4.6Jul-13 7,787 17.4 10,016 -13.8 2,424 -10.8 8,579 -3.6 6,792 5.2Aug-13 8,382 7.6 9,049 -9.7 2,254 -7.0 8,149 -5.0 6,342 -6.6Sep-13 8,168 -2.6 9,618 6.3 2,469 9.6 8,216 0.8 6,838 7.8Oct-13 8,853 8.4 11,473 19.3 2,605 5.5 8,936 8.8 6,814 -0.3Nov-13 8,821 -0.4 11,154 -2.8 2,616 0.4 8,651 -3.2 6,562 -3.7Dec-13 9,518 7.9 11,385 2.1 2,643 1.0 8,834 2.1 6,567 0.1Jan-14 9,957 4.6 10,238 -10.1 2,539 -3.9 8,453 -4.3 6,518 -0.7Feb-14 10,339 3.8 10,765 5.1 2,535 -0.2 8,426 -0.3 6,484 -0.5Mar-14 9,298 -10.1 12,742 18.4 2,843 12.1 9,486 12.6 6,971 7.5
Source: BSE, NSE
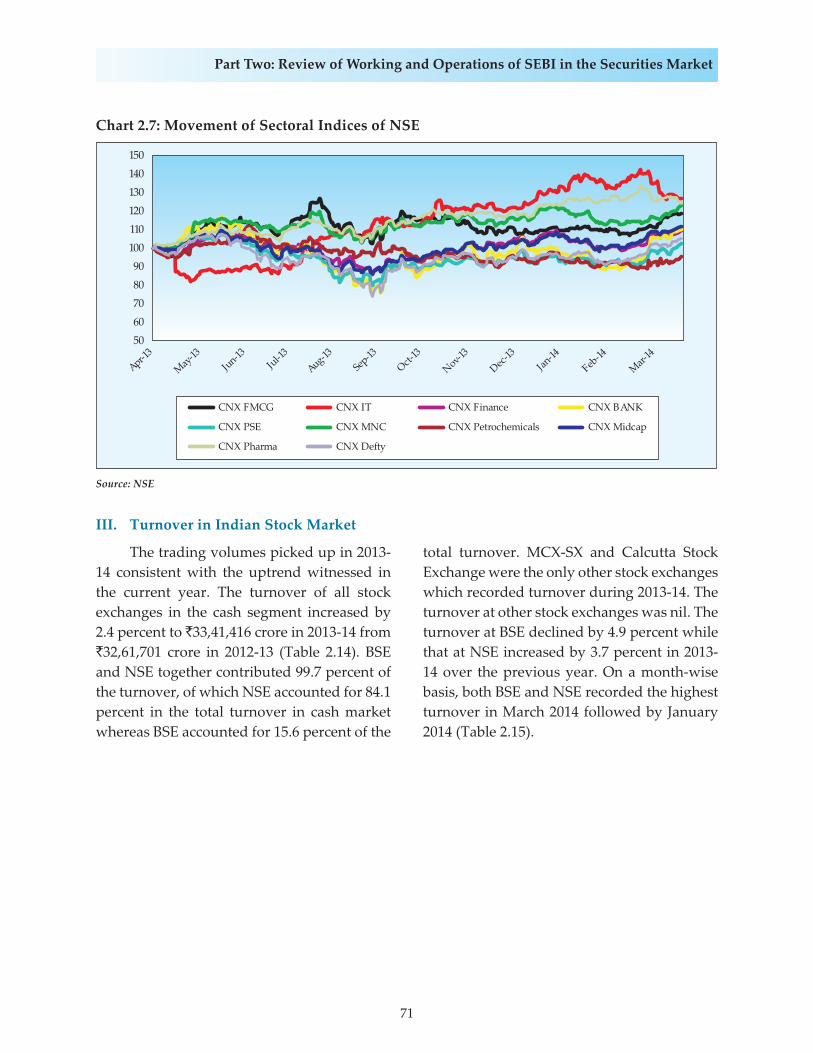
71
Part Two: Review of Working and Operations of SEBI in the Securities Market
III. Turnover in Indian Stock Market
The trading volumes picked up in 2013-14 consistent with the uptrend witnessed in the current year. The turnover of all stock exchanges in the cash segment increased by 2.4 percent to `33,41,416 crore in 2013-14 from `32,61,701 crore in 2012-13 (Table 2.14). BSE and NSE together contributed 99.7 percent of the turnover, of which NSE accounted for 84.1 percent in the total turnover in cash market whereas BSE accounted for 15.6 percent of the
Chart 2.7: Movement of Sectoral Indices of NSE
Source: NSE
total turnover. MCX-SX and Calcutta Stock Exchange were the only other stock exchanges which recorded turnover during 2013-14. The turnover at other stock exchanges was nil. The turnover at BSE declined by 4.9 percent while that at NSE increased by 3.7 percent in 2013-14 over the previous year. On a month-wise basis, both BSE and NSE recorded the highest turnover in March 2014 followed by January 2014 (Table 2.15).
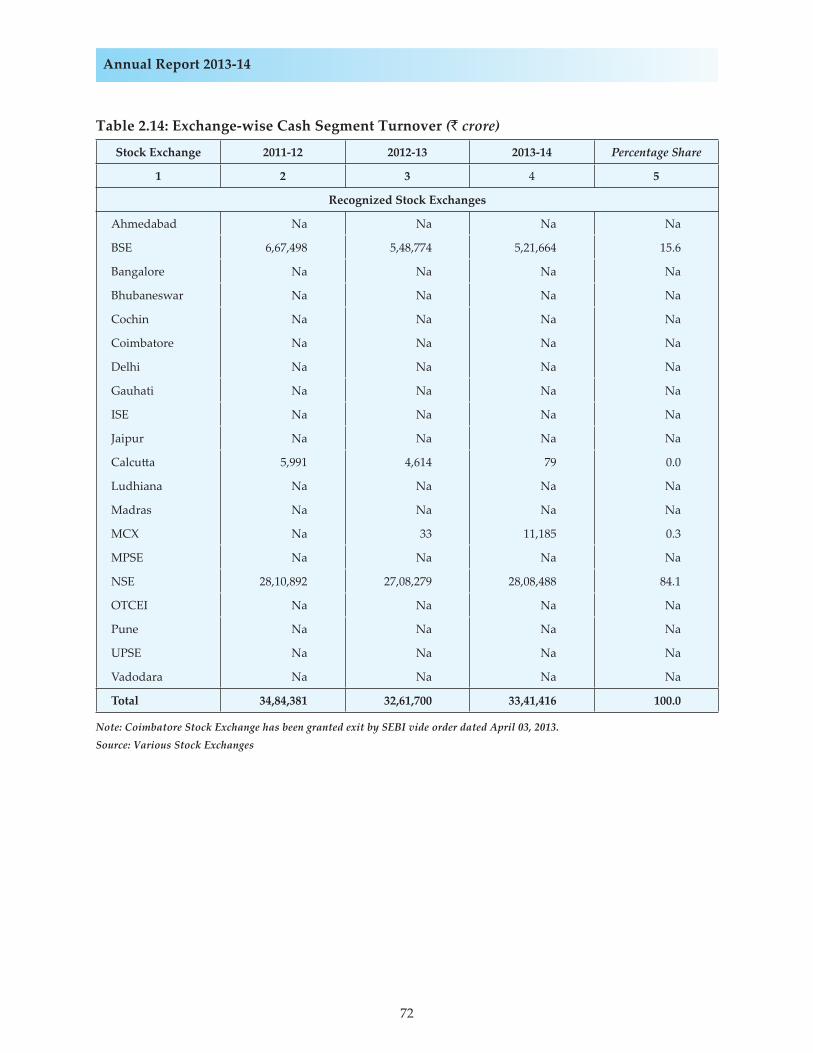
72
Annual Report 2013-14
Table 2.14: Exchange-wise Cash Segment Turnover (` crore)
Stock Exchange 2011-12 2012-13 2013-14 Percentage Share
1 2 3 4 5
Recognized Stock Exchanges
Ahmedabad Na Na Na Na
BSE 6,67,498 5,48,774 5,21,664 15.6
Bangalore Na Na Na Na
Bhubaneswar Na Na Na Na
Cochin Na Na Na Na
Coimbatore Na Na Na Na
Delhi Na Na Na Na
Gauhati Na Na Na Na
ISE Na Na Na Na
Jaipur Na Na Na Na
Calcu� a 5,991 4,614 79 0.0
Ludhiana Na Na Na Na
Madras Na Na Na Na
MCX Na 33 11,185 0.3
MPSE Na Na Na Na
NSE 28,10,892 27,08,279 28,08,488 84.1
OTCEI Na Na Na Na
Pune Na Na Na Na
UPSE Na Na Na Na
Vadodara Na Na Na Na
Total 34,84,381 32,61,700 33,41,416 100.0
Note: Coimbatore Stock Exchange has been granted exit by SEBI vide order dated April 03, 2013.
Source: Various Stock Exchanges
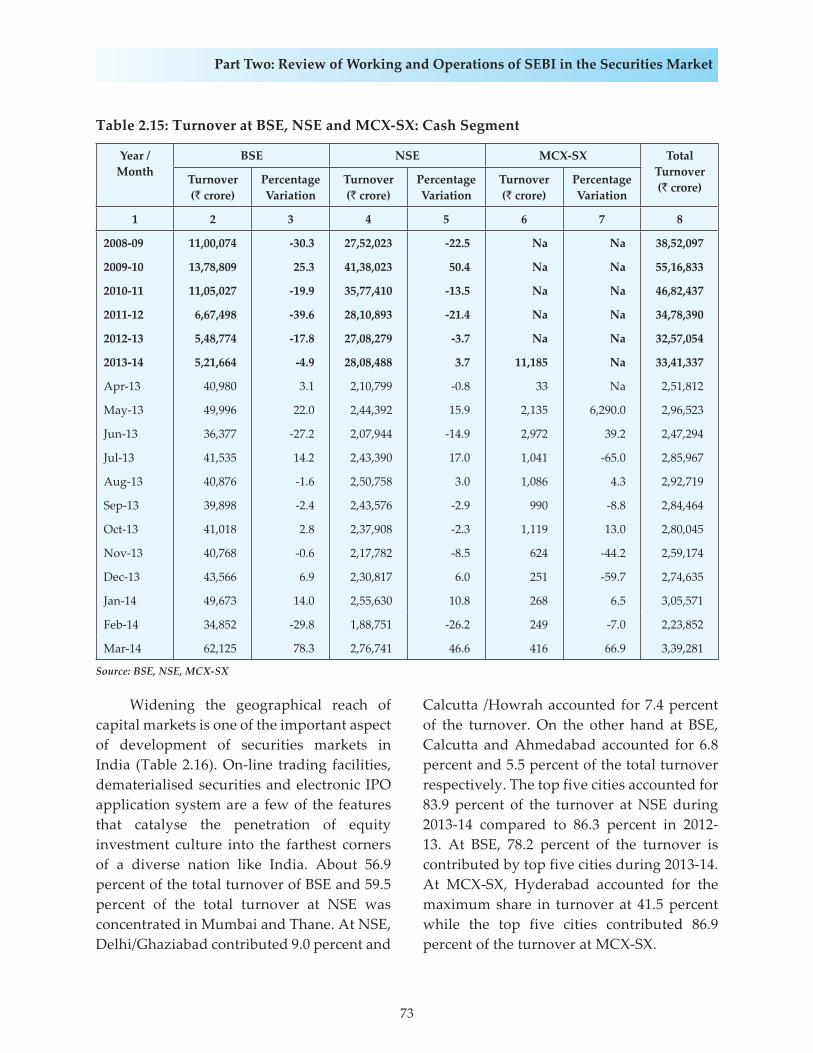
73
Part Two: Review of Working and Operations of SEBI in the Securities Market
Widening the geographical reach of capital markets is one of the important aspect of development of securities markets in India (Table 2.16). On-line trading facilities, dematerialised securities and electronic IPO application system are a few of the features that catalyse the penetration of equity investment culture into the farthest corners of a diverse nation like India. About 56.9 percent of the total turnover of BSE and 59.5 percent of the total turnover at NSE was concentrated in Mumbai and Thane. At NSE, Delhi/Ghaziabad contributed 9.0 percent and
Calcutta /Howrah accounted for 7.4 percent of the turnover. On the other hand at BSE, Calcutta and Ahmedabad accounted for 6.8 percent and 5.5 percent of the total turnover respectively. The top five cities accounted for 83.9 percent of the turnover at NSE during 2013-14 compared to 86.3 percent in 2012-13. At BSE, 78.2 percent of the turnover is contributed by top five cities during 2013-14. At MCX-SX, Hyderabad accounted for the maximum share in turnover at 41.5 percent while the top five cities contributed 86.9 percent of the turnover at MCX-SX.
Table 2.15: Turnover at BSE, NSE and MCX-SX: Cash Segment
Year / Month
BSE NSE MCX-SX Total Turnover(` crore)
Turnover(` crore)
Percentage Variation
Turnover(` crore)
Percentage Variation
Turnover(` crore)
Percentage Variation
1 2 3 4 5 6 7 8
2008-09 11,00,074 -30.3 27,52,023 -22.5 Na Na 38,52,097
2009-10 13,78,809 25.3 41,38,023 50.4 Na Na 55,16,833
2010-11 11,05,027 -19.9 35,77,410 -13.5 Na Na 46,82,437
2011-12 6,67,498 -39.6 28,10,893 -21.4 Na Na 34,78,390
2012-13 5,48,774 -17.8 27,08,279 -3.7 Na Na 32,57,054
2013-14 5,21,664 -4.9 28,08,488 3.7 11,185 Na 33,41,337
Apr-13 40,980 3.1 2,10,799 -0.8 33 Na 2,51,812
May-13 49,996 22.0 2,44,392 15.9 2,135 6,290.0 2,96,523
Jun-13 36,377 -27.2 2,07,944 -14.9 2,972 39.2 2,47,294
Jul-13 41,535 14.2 2,43,390 17.0 1,041 -65.0 2,85,967
Aug-13 40,876 -1.6 2,50,758 3.0 1,086 4.3 2,92,719
Sep-13 39,898 -2.4 2,43,576 -2.9 990 -8.8 2,84,464
Oct-13 41,018 2.8 2,37,908 -2.3 1,119 13.0 2,80,045
Nov-13 40,768 -0.6 2,17,782 -8.5 624 -44.2 2,59,174
Dec-13 43,566 6.9 2,30,817 6.0 251 -59.7 2,74,635
Jan-14 49,673 14.0 2,55,630 10.8 268 6.5 3,05,571
Feb-14 34,852 -29.8 1,88,751 -26.2 249 -7.0 2,23,852
Mar-14 62,125 78.3 2,76,741 46.6 416 66.9 3,39,281
Source: BSE, NSE, MCX-SX
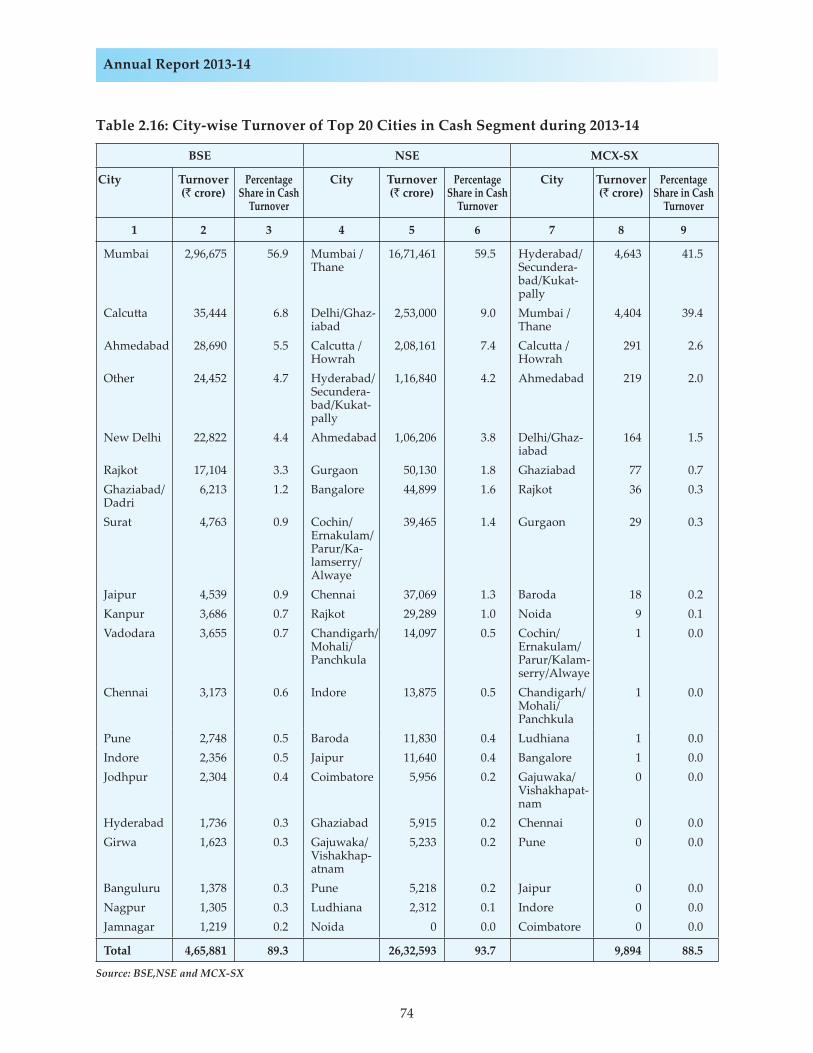
74
Annual Report 2013-14
Table 2.16: City-wise Turnover of Top 20 Cities in Cash Segment during 2013-14
BSE NSE MCX-SX
City Turnover (` crore)
Percentage Share in Cash
Turnover
City Turnover (` crore)
Percentage Share in Cash
Turnover
City Turnover (` crore)
Percentage Share in Cash
Turnover
1 2 3 4 5 6 7 8 9
Mumbai 2,96,675 56.9 Mumbai / Thane
16,71,461 59.5 Hyderabad/Secundera-bad/Kukat-pally
4,643 41.5
Calcu� a 35,444 6.8 Delhi/Ghaz-iabad
2,53,000 9.0 Mumbai / Thane
4,404 39.4
Ahmedabad 28,690 5.5 Calcu� a / Howrah
2,08,161 7.4 Calcu� a / Howrah
291 2.6
Other 24,452 4.7 Hyderabad/Secundera-bad/Kukat-pally
1,16,840 4.2 Ahmedabad 219 2.0
New Delhi 22,822 4.4 Ahmedabad 1,06,206 3.8 Delhi/Ghaz-iabad
164 1.5
Rajkot 17,104 3.3 Gurgaon 50,130 1.8 Ghaziabad 77 0.7Ghaziabad/ Dadri
6,213 1.2 Bangalore 44,899 1.6 Rajkot 36 0.3
Surat 4,763 0.9 Cochin/Ernakulam/Parur/Ka-lamserry/Alwaye
39,465 1.4 Gurgaon 29 0.3
Jaipur 4,539 0.9 Chennai 37,069 1.3 Baroda 18 0.2Kanpur 3,686 0.7 Rajkot 29,289 1.0 Noida 9 0.1Vadodara 3,655 0.7 Chandigarh/
Mohali/Panchkula
14,097 0.5 Cochin/Ernakulam/Parur/Kalam-serry/Alwaye
1 0.0
Chennai 3,173 0.6 Indore 13,875 0.5 Chandigarh/Mohali/Panchkula
1 0.0
Pune 2,748 0.5 Baroda 11,830 0.4 Ludhiana 1 0.0Indore 2,356 0.5 Jaipur 11,640 0.4 Bangalore 1 0.0Jodhpur 2,304 0.4 Coimbatore 5,956 0.2 Gajuwaka/
Vishakhapat-nam
0 0.0
Hyderabad 1,736 0.3 Ghaziabad 5,915 0.2 Chennai 0 0.0Girwa 1,623 0.3 Gajuwaka/
Vishakhap-atnam
5,233 0.2 Pune 0 0.0
Banguluru 1,378 0.3 Pune 5,218 0.2 Jaipur 0 0.0Nagpur 1,305 0.3 Ludhiana 2,312 0.1 Indore 0 0.0Jamnagar 1,219 0.2 Noida 0 0.0 Coimbatore 0 0.0
Total 4,65,881 89.3 26,32,593 93.7 9,894 88.5
Source: BSE,NSE and MCX-SX
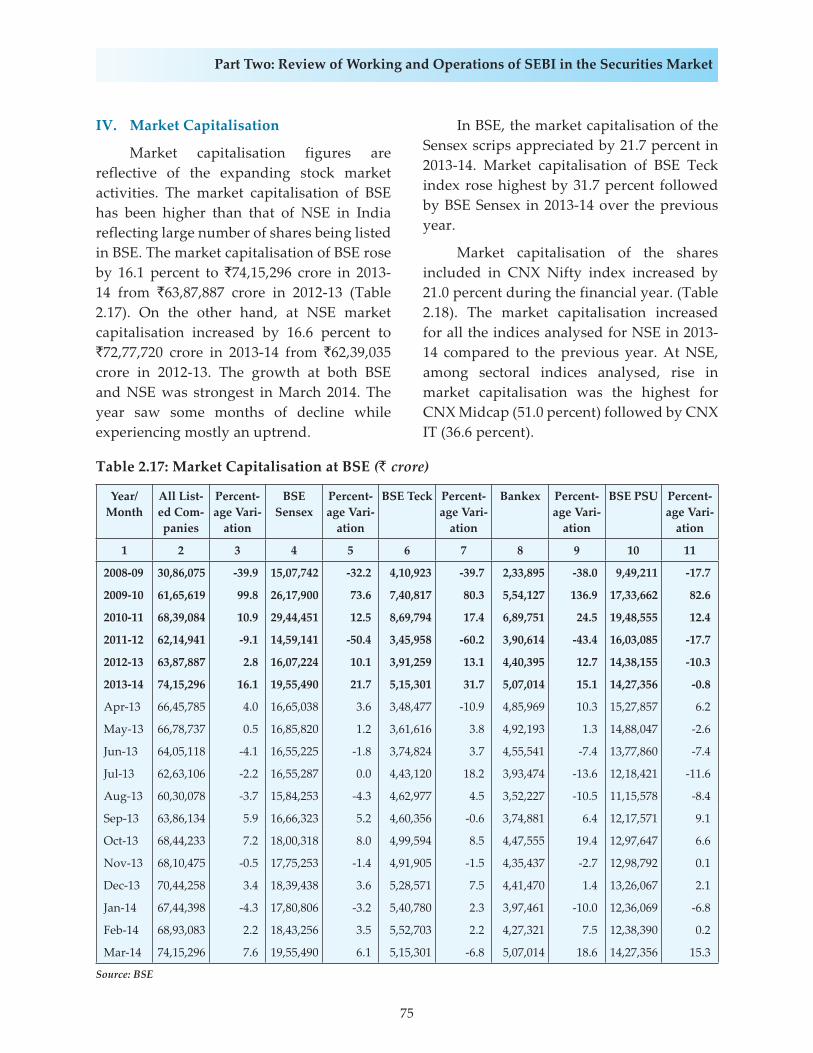
75
Part Two: Review of Working and Operations of SEBI in the Securities Market
Table 2.17: Market Capitalisation at BSE (` crore)
Year/ Month
All List-ed Com-panies
Percent-age Vari-
ation
BSE Sensex
Percent-age Vari-
ation
BSE Teck Percent-age Vari-
ation
Bankex Percent-age Vari-
ation
BSE PSU Percent-age Vari-
ation
1 2 3 4 5 6 7 8 9 10 11
2008-09 30,86,075 -39.9 15,07,742 -32.2 4,10,923 -39.7 2,33,895 -38.0 9,49,211 -17.7
2009-10 61,65,619 99.8 26,17,900 73.6 7,40,817 80.3 5,54,127 136.9 17,33,662 82.6
2010-11 68,39,084 10.9 29,44,451 12.5 8,69,794 17.4 6,89,751 24.5 19,48,555 12.4
2011-12 62,14,941 -9.1 14,59,141 -50.4 3,45,958 -60.2 3,90,614 -43.4 16,03,085 -17.7
2012-13 63,87,887 2.8 16,07,224 10.1 3,91,259 13.1 4,40,395 12.7 14,38,155 -10.3
2013-14 74,15,296 16.1 19,55,490 21.7 5,15,301 31.7 5,07,014 15.1 14,27,356 -0.8
Apr-13 66,45,785 4.0 16,65,038 3.6 3,48,477 -10.9 4,85,969 10.3 15,27,857 6.2
May-13 66,78,737 0.5 16,85,820 1.2 3,61,616 3.8 4,92,193 1.3 14,88,047 -2.6
Jun-13 64,05,118 -4.1 16,55,225 -1.8 3,74,824 3.7 4,55,541 -7.4 13,77,860 -7.4
Jul-13 62,63,106 -2.2 16,55,287 0.0 4,43,120 18.2 3,93,474 -13.6 12,18,421 -11.6
Aug-13 60,30,078 -3.7 15,84,253 -4.3 4,62,977 4.5 3,52,227 -10.5 11,15,578 -8.4
Sep-13 63,86,134 5.9 16,66,323 5.2 4,60,356 -0.6 3,74,881 6.4 12,17,571 9.1
Oct-13 68,44,233 7.2 18,00,318 8.0 4,99,594 8.5 4,47,555 19.4 12,97,647 6.6
Nov-13 68,10,475 -0.5 17,75,253 -1.4 4,91,905 -1.5 4,35,437 -2.7 12,98,792 0.1
Dec-13 70,44,258 3.4 18,39,438 3.6 5,28,571 7.5 4,41,470 1.4 13,26,067 2.1
Jan-14 67,44,398 -4.3 17,80,806 -3.2 5,40,780 2.3 3,97,461 -10.0 12,36,069 -6.8
Feb-14 68,93,083 2.2 18,43,256 3.5 5,52,703 2.2 4,27,321 7.5 12,38,390 0.2
Mar-14 74,15,296 7.6 19,55,490 6.1 5,15,301 -6.8 5,07,014 18.6 14,27,356 15.3
Source: BSE
IV. Market Capitalisation
Market capitalisation figures are reflective of the expanding stock market activities. The market capitalisation of BSE has been higher than that of NSE in India reflecting large number of shares being listed in BSE. The market capitalisation of BSE rose by 16.1 percent to `74,15,296 crore in 2013-14 from `63,87,887 crore in 2012-13 (Table 2.17). On the other hand, at NSE market capitalisation increased by 16.6 percent to `72,77,720 crore in 2013-14 from `62,39,035 crore in 2012-13. The growth at both BSE and NSE was strongest in March 2014. The year saw some months of decline while experiencing mostly an uptrend.
In BSE, the market capitalisation of the Sensex scrips appreciated by 21.7 percent in 2013-14. Market capitalisation of BSE Teck index rose highest by 31.7 percent followed by BSE Sensex in 2013-14 over the previous year.
Market capitalisation of the shares included in CNX Nifty index increased by 21.0 percent during the financial year. (Table 2.18). The market capitalisation increased for all the indices analysed for NSE in 2013-14 compared to the previous year. At NSE, among sectoral indices analysed, rise in market capitalisation was the highest for CNX Midcap (51.0 percent) followed by CNX IT (36.6 percent).
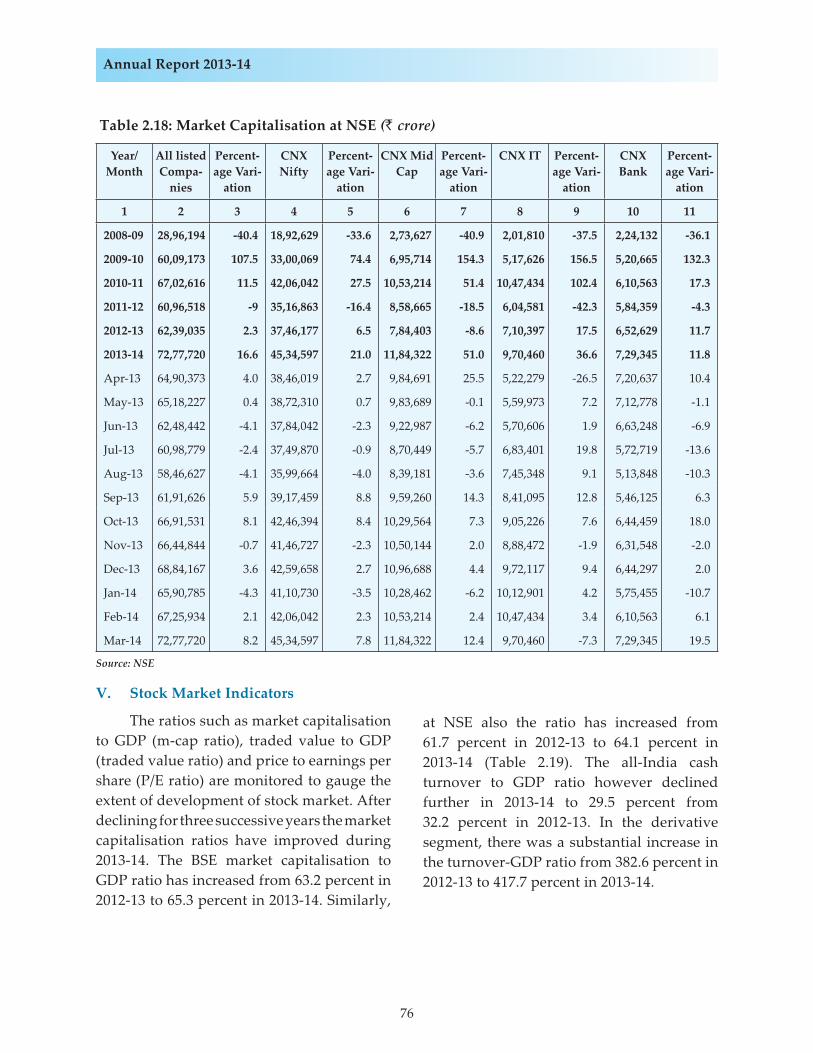
76
Annual Report 2013-14
Table 2.18: Market Capitalisation at NSE (` crore)
Year/ Month
All listed Compa-
nies
Percent-age Vari-
ation
CNX Nifty
Percent-age Vari-
ation
CNX Mid Cap
Percent-age Vari-
ation
CNX IT Percent-age Vari-
ation
CNX Bank
Percent-age Vari-
ation
1 2 3 4 5 6 7 8 9 10 11
2008-09 28,96,194 -40.4 18,92,629 -33.6 2,73,627 -40.9 2,01,810 -37.5 2,24,132 -36.1
2009-10 60,09,173 107.5 33,00,069 74.4 6,95,714 154.3 5,17,626 156.5 5,20,665 132.3
2010-11 67,02,616 11.5 42,06,042 27.5 10,53,214 51.4 10,47,434 102.4 6,10,563 17.3
2011-12 60,96,518 -9 35,16,863 -16.4 8,58,665 -18.5 6,04,581 -42.3 5,84,359 -4.3
2012-13 62,39,035 2.3 37,46,177 6.5 7,84,403 -8.6 7,10,397 17.5 6,52,629 11.7
2013-14 72,77,720 16.6 45,34,597 21.0 11,84,322 51.0 9,70,460 36.6 7,29,345 11.8
Apr-13 64,90,373 4.0 38,46,019 2.7 9,84,691 25.5 5,22,279 -26.5 7,20,637 10.4
May-13 65,18,227 0.4 38,72,310 0.7 9,83,689 -0.1 5,59,973 7.2 7,12,778 -1.1
Jun-13 62,48,442 -4.1 37,84,042 -2.3 9,22,987 -6.2 5,70,606 1.9 6,63,248 -6.9
Jul-13 60,98,779 -2.4 37,49,870 -0.9 8,70,449 -5.7 6,83,401 19.8 5,72,719 -13.6
Aug-13 58,46,627 -4.1 35,99,664 -4.0 8,39,181 -3.6 7,45,348 9.1 5,13,848 -10.3
Sep-13 61,91,626 5.9 39,17,459 8.8 9,59,260 14.3 8,41,095 12.8 5,46,125 6.3
Oct-13 66,91,531 8.1 42,46,394 8.4 10,29,564 7.3 9,05,226 7.6 6,44,459 18.0
Nov-13 66,44,844 -0.7 41,46,727 -2.3 10,50,144 2.0 8,88,472 -1.9 6,31,548 -2.0
Dec-13 68,84,167 3.6 42,59,658 2.7 10,96,688 4.4 9,72,117 9.4 6,44,297 2.0
Jan-14 65,90,785 -4.3 41,10,730 -3.5 10,28,462 -6.2 10,12,901 4.2 5,75,455 -10.7
Feb-14 67,25,934 2.1 42,06,042 2.3 10,53,214 2.4 10,47,434 3.4 6,10,563 6.1
Mar-14 72,77,720 8.2 45,34,597 7.8 11,84,322 12.4 9,70,460 -7.3 7,29,345 19.5
Source: NSE
V. Stock Market Indicators
The ratios such as market capitalisation to GDP (m-cap ratio), traded value to GDP (traded value ratio) and price to earnings per share (P/E ratio) are monitored to gauge the extent of development of stock market. After declining for three successive years the market capitalisation ratios have improved during 2013-14. The BSE market capitalisation to GDP ratio has increased from 63.2 percent in 2012-13 to 65.3 percent in 2013-14. Similarly,
at NSE also the ratio has increased from 61.7 percent in 2012-13 to 64.1 percent in 2013-14 (Table 2.19). The all-India cash turnover to GDP ratio however declined further in 2013-14 to 29.5 percent from 32.2 percent in 2012-13. In the derivative segment, there was a substantial increase in the turnover-GDP ratio from 382.6 percent in 2012-13 to 417.7 percent in 2013-14.
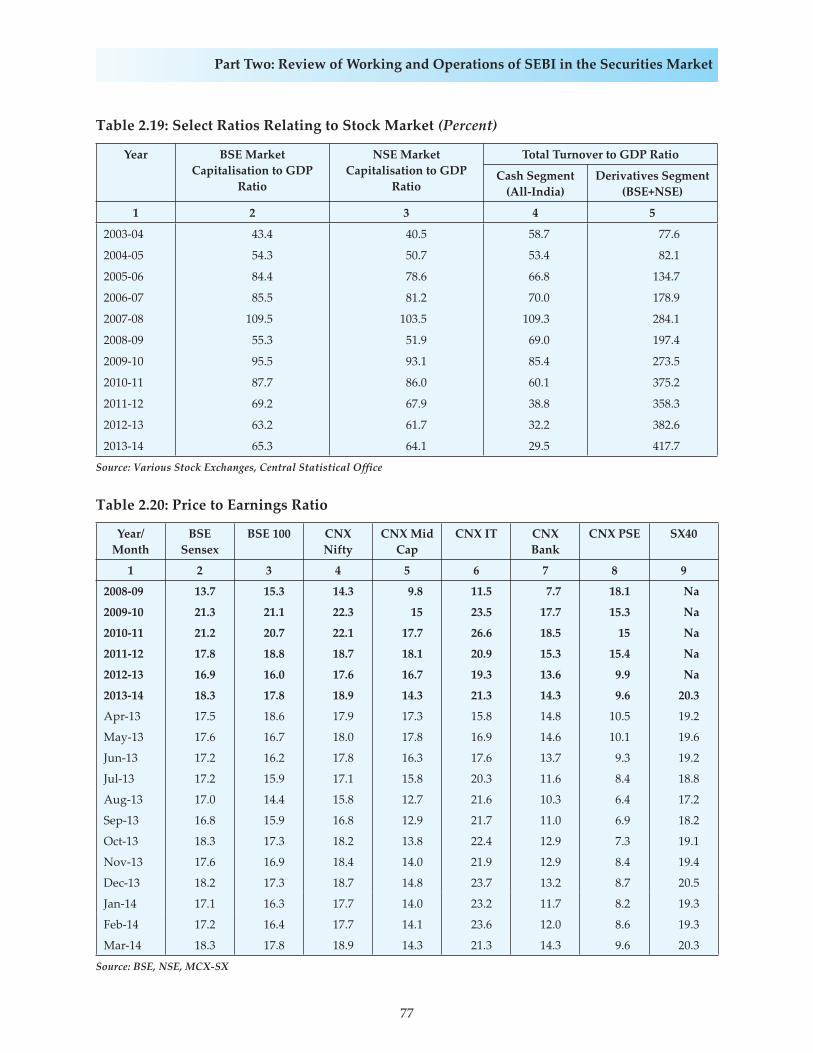
77
Part Two: Review of Working and Operations of SEBI in the Securities Market
Table 2.19: Select Ratios Relating to Stock Market (Percent)
Year BSE Market Capitalisation to GDP
Ratio
NSE Market Capitalisation to GDP
Ratio
Total Turnover to GDP Ratio
Cash Segment (All-India)
Derivatives Segment (BSE+NSE)
1 2 3 4 5
2003-04 43.4 40.5 58.7 77.6
2004-05 54.3 50.7 53.4 82.1
2005-06 84.4 78.6 66.8 134.7
2006-07 85.5 81.2 70.0 178.9
2007-08 109.5 103.5 109.3 284.1
2008-09 55.3 51.9 69.0 197.4
2009-10 95.5 93.1 85.4 273.5
2010-11 87.7 86.0 60.1 375.2
2011-12 69.2 67.9 38.8 358.3
2012-13 63.2 61.7 32.2 382.6
2013-14 65.3 64.1 29.5 417.7
Source: Various Stock Exchanges, Central Statistical Office
Table 2.20: Price to Earnings Ratio
Year/ Month
BSE Sensex
BSE 100 CNX Nifty
CNX Mid Cap
CNX IT CNX Bank
CNX PSE SX40
1 2 3 4 5 6 7 8 9
2008-09 13.7 15.3 14.3 9.8 11.5 7.7 18.1 Na
2009-10 21.3 21.1 22.3 15 23.5 17.7 15.3 Na
2010-11 21.2 20.7 22.1 17.7 26.6 18.5 15 Na
2011-12 17.8 18.8 18.7 18.1 20.9 15.3 15.4 Na
2012-13 16.9 16.0 17.6 16.7 19.3 13.6 9.9 Na
2013-14 18.3 17.8 18.9 14.3 21.3 14.3 9.6 20.3
Apr-13 17.5 18.6 17.9 17.3 15.8 14.8 10.5 19.2
May-13 17.6 16.7 18.0 17.8 16.9 14.6 10.1 19.6
Jun-13 17.2 16.2 17.8 16.3 17.6 13.7 9.3 19.2
Jul-13 17.2 15.9 17.1 15.8 20.3 11.6 8.4 18.8
Aug-13 17.0 14.4 15.8 12.7 21.6 10.3 6.4 17.2
Sep-13 16.8 15.9 16.8 12.9 21.7 11.0 6.9 18.2
Oct-13 18.3 17.3 18.2 13.8 22.4 12.9 7.3 19.1
Nov-13 17.6 16.9 18.4 14.0 21.9 12.9 8.4 19.4
Dec-13 18.2 17.3 18.7 14.8 23.7 13.2 8.7 20.5
Jan-14 17.1 16.3 17.7 14.0 23.2 11.7 8.2 19.3
Feb-14 17.2 16.4 17.7 14.1 23.6 12.0 8.6 19.3
Mar-14 18.3 17.8 18.9 14.3 21.3 14.3 9.6 20.3
Source: BSE, NSE, MCX-SX
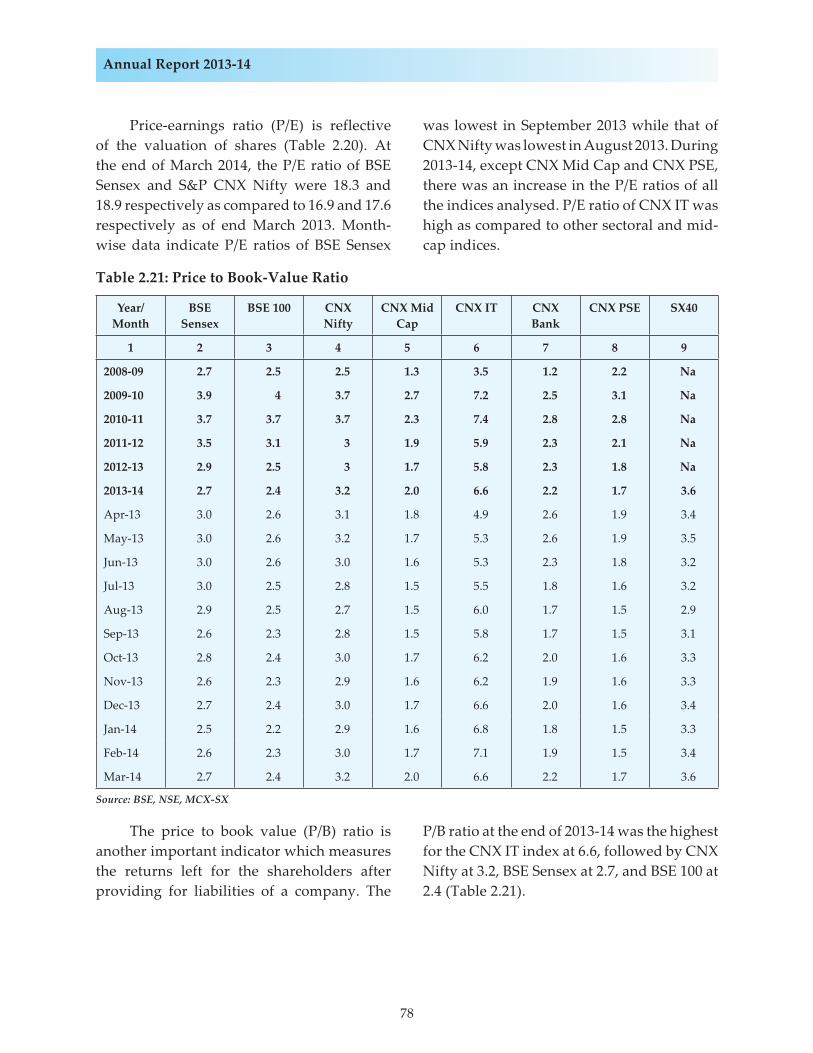
78
Annual Report 2013-14
Price-earnings ratio (P/E) is reflective of the valuation of shares (Table 2.20). At the end of March 2014, the P/E ratio of BSE Sensex and S&P CNX Nifty were 18.3 and 18.9 respectively as compared to 16.9 and 17.6 respectively as of end March 2013. Month-wise data indicate P/E ratios of BSE Sensex
was lowest in September 2013 while that of CNX Nifty was lowest in August 2013. During 2013-14, except CNX Mid Cap and CNX PSE, there was an increase in the P/E ratios of all the indices analysed. P/E ratio of CNX IT was high as compared to other sectoral and mid-cap indices.
Table 2.21: Price to Book-Value Ratio
Year/ Month
BSE Sensex
BSE 100 CNX Nifty
CNX Mid Cap
CNX IT CNX Bank
CNX PSE SX40
1 2 3 4 5 6 7 8 9
2008-09 2.7 2.5 2.5 1.3 3.5 1.2 2.2 Na
2009-10 3.9 4 3.7 2.7 7.2 2.5 3.1 Na
2010-11 3.7 3.7 3.7 2.3 7.4 2.8 2.8 Na
2011-12 3.5 3.1 3 1.9 5.9 2.3 2.1 Na
2012-13 2.9 2.5 3 1.7 5.8 2.3 1.8 Na
2013-14 2.7 2.4 3.2 2.0 6.6 2.2 1.7 3.6
Apr-13 3.0 2.6 3.1 1.8 4.9 2.6 1.9 3.4
May-13 3.0 2.6 3.2 1.7 5.3 2.6 1.9 3.5
Jun-13 3.0 2.6 3.0 1.6 5.3 2.3 1.8 3.2
Jul-13 3.0 2.5 2.8 1.5 5.5 1.8 1.6 3.2
Aug-13 2.9 2.5 2.7 1.5 6.0 1.7 1.5 2.9
Sep-13 2.6 2.3 2.8 1.5 5.8 1.7 1.5 3.1
Oct-13 2.8 2.4 3.0 1.7 6.2 2.0 1.6 3.3
Nov-13 2.6 2.3 2.9 1.6 6.2 1.9 1.6 3.3
Dec-13 2.7 2.4 3.0 1.7 6.6 2.0 1.6 3.4
Jan-14 2.5 2.2 2.9 1.6 6.8 1.8 1.5 3.3
Feb-14 2.6 2.3 3.0 1.7 7.1 1.9 1.5 3.4
Mar-14 2.7 2.4 3.2 2.0 6.6 2.2 1.7 3.6
Source: BSE, NSE, MCX-SX
The price to book value (P/B) ratio is another important indicator which measures the returns left for the shareholders after providing for liabilities of a company. The
P/B ratio at the end of 2013-14 was the highest for the CNX IT index at 6.6, followed by CNX Nifty at 3.2, BSE Sensex at 2.7, and BSE 100 at 2.4 (Table 2.21).
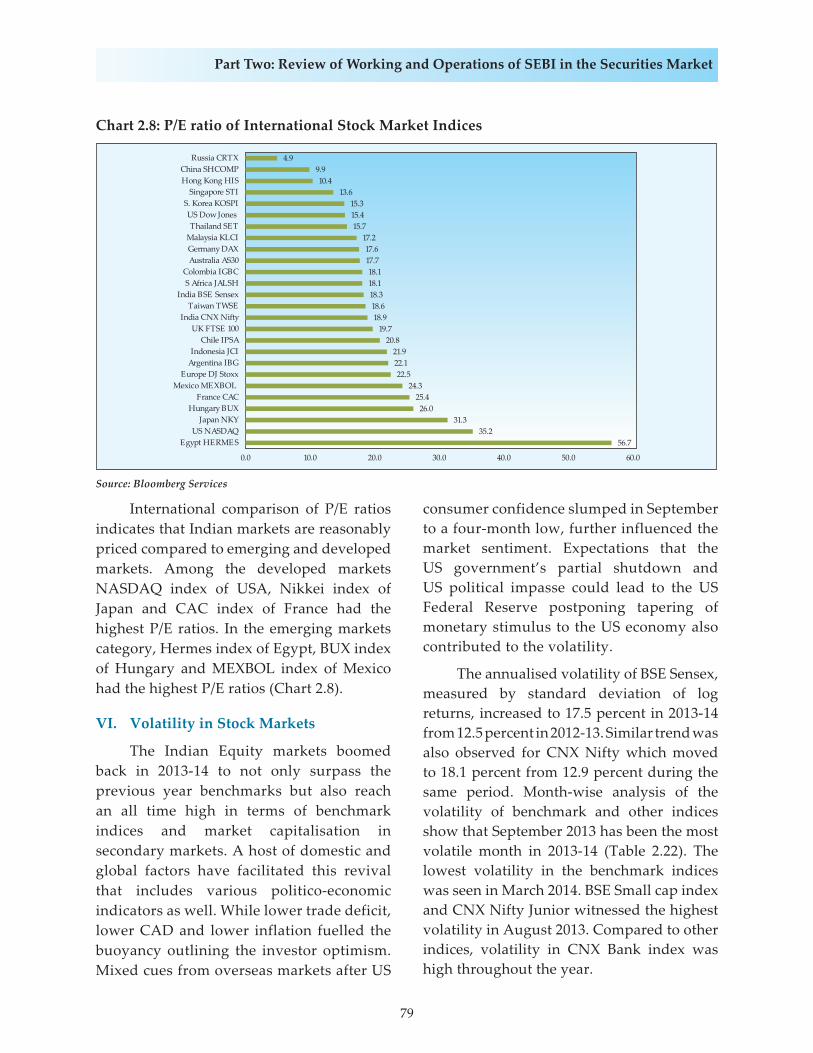
79
Part Two: Review of Working and Operations of SEBI in the Securities Market
International comparison of P/E ratios indicates that Indian markets are reasonably priced compared to emerging and developed markets. Among the developed markets NASDAQ index of USA, Nikkei index of Japan and CAC index of France had the highest P/E ratios. In the emerging markets category, Hermes index of Egypt, BUX index of Hungary and MEXBOL index of Mexico had the highest P/E ratios (Chart 2.8).
VI. Volatility in Stock Markets
The Indian Equity markets boomed back in 2013-14 to not only surpass the previous year benchmarks but also reach an all time high in terms of benchmark indices and market capitalisation in secondary markets. A host of domestic and global factors have facilitated this revival that includes various politico-economic indicators as well. While lower trade deficit, lower CAD and lower inflation fuelled the buoyancy outlining the investor optimism. Mixed cues from overseas markets after US
consumer confidence slumped in September to a four-month low, further influenced the market sentiment. Expectations that the US government’s partial shutdown and US political impasse could lead to the US Federal Reserve postponing tapering of monetary stimulus to the US economy also contributed to the volatility.
The annualised volatility of BSE Sensex, measured by standard deviation of log returns, increased to 17.5 percent in 2013-14 from 12.5 percent in 2012-13. Similar trend was also observed for CNX Nifty which moved to 18.1 percent from 12.9 percent during the same period. Month-wise analysis of the volatility of benchmark and other indices show that September 2013 has been the most volatile month in 2013-14 (Table 2.22). The lowest volatility in the benchmark indices was seen in March 2014. BSE Small cap index and CNX Nifty Junior witnessed the highest volatility in August 2013. Compared to other indices, volatility in CNX Bank index was high throughout the year.
Chart 2.8: P/E ratio of International Stock Market Indices
Source: Bloomberg Services
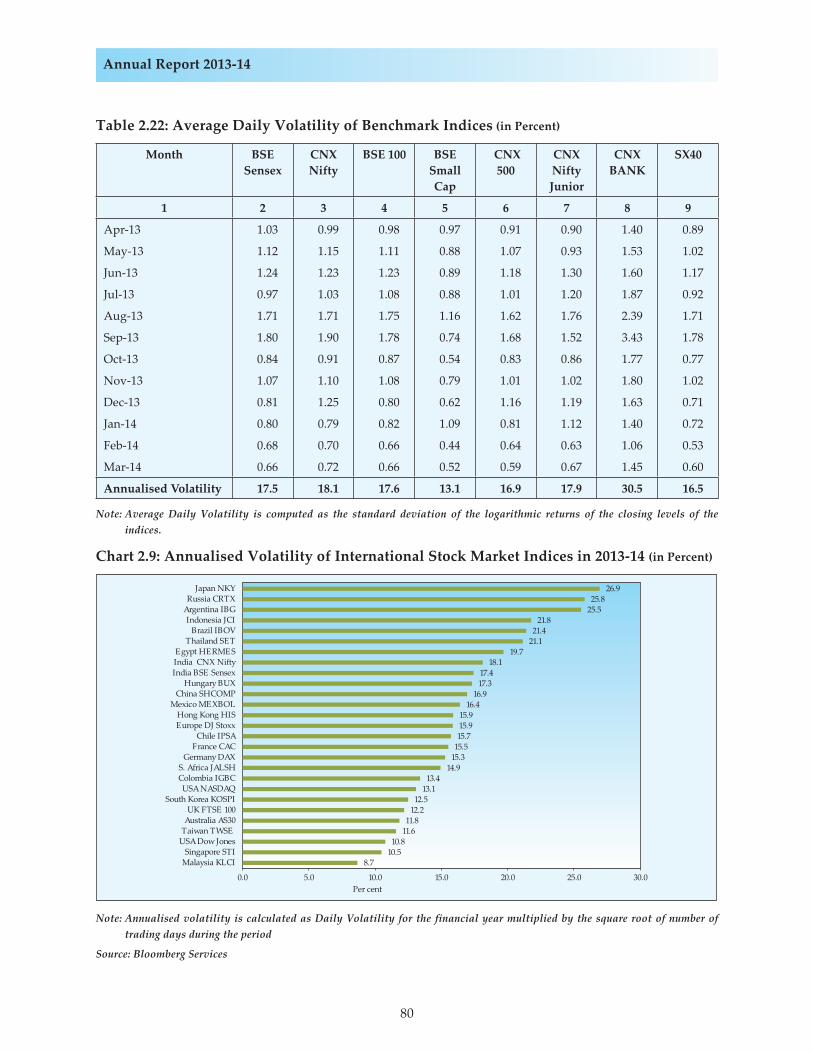
80
Annual Report 2013-14
Table 2.22: Average Daily Volatility of Benchmark Indices (in Percent)
Month BSE Sensex
CNX Nifty
BSE 100 BSE Small Cap
CNX 500
CNX Nifty Junior
CNX BANK
SX40
1 2 3 4 5 6 7 8 9
Apr-13 1.03 0.99 0.98 0.97 0.91 0.90 1.40 0.89
May-13 1.12 1.15 1.11 0.88 1.07 0.93 1.53 1.02
Jun-13 1.24 1.23 1.23 0.89 1.18 1.30 1.60 1.17
Jul-13 0.97 1.03 1.08 0.88 1.01 1.20 1.87 0.92
Aug-13 1.71 1.71 1.75 1.16 1.62 1.76 2.39 1.71
Sep-13 1.80 1.90 1.78 0.74 1.68 1.52 3.43 1.78
Oct-13 0.84 0.91 0.87 0.54 0.83 0.86 1.77 0.77
Nov-13 1.07 1.10 1.08 0.79 1.01 1.02 1.80 1.02
Dec-13 0.81 1.25 0.80 0.62 1.16 1.19 1.63 0.71
Jan-14 0.80 0.79 0.82 1.09 0.81 1.12 1.40 0.72
Feb-14 0.68 0.70 0.66 0.44 0.64 0.63 1.06 0.53
Mar-14 0.66 0.72 0.66 0.52 0.59 0.67 1.45 0.60
Annualised Volatility 17.5 18.1 17.6 13.1 16.9 17.9 30.5 16.5
Note: Average Daily Volatility is computed as the standard deviation of the logarithmic returns of the closing levels of the indices.
Chart 2.9: Annualised Volatility of International Stock Market Indices in 2013-14 (in Percent)
Note: Annualised volatility is calculated as Daily Volatility for the financial year multiplied by the square root of number of trading days during the period
Source: Bloomberg Services
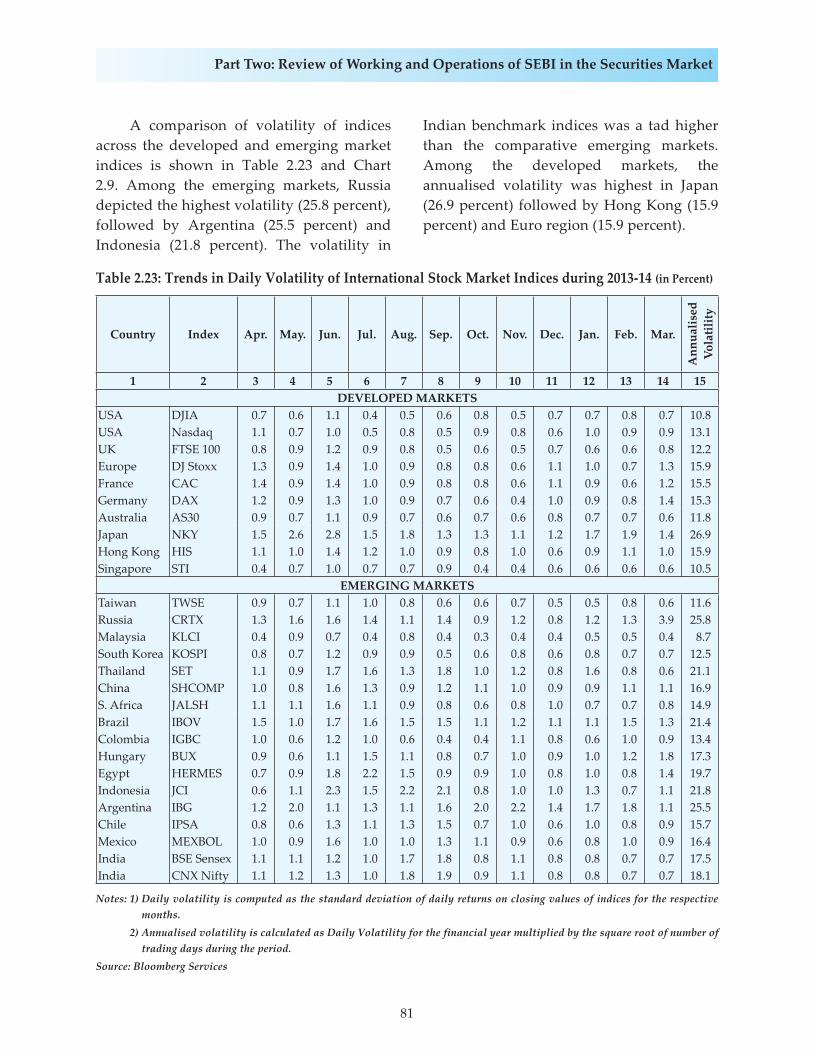
81
Part Two: Review of Working and Operations of SEBI in the Securities Market
Table 2.23: Trends in Daily Volatility of International Stock Market Indices during 2013-14 (in Percent)
Country Index Apr. May. Jun. Jul. Aug. Sep. Oct. Nov. Dec. Jan. Feb. Mar.
Ann
ualis
ed
Vola
tility
1 2 3 4 5 6 7 8 9 10 11 12 13 14 15DEVELOPED MARKETS
USA DJIA 0.7 0.6 1.1 0.4 0.5 0.6 0.8 0.5 0.7 0.7 0.8 0.7 10.8USA Nasdaq 1.1 0.7 1.0 0.5 0.8 0.5 0.9 0.8 0.6 1.0 0.9 0.9 13.1UK FTSE 100 0.8 0.9 1.2 0.9 0.8 0.5 0.6 0.5 0.7 0.6 0.6 0.8 12.2Europe DJ Stoxx 1.3 0.9 1.4 1.0 0.9 0.8 0.8 0.6 1.1 1.0 0.7 1.3 15.9France CAC 1.4 0.9 1.4 1.0 0.9 0.8 0.8 0.6 1.1 0.9 0.6 1.2 15.5Germany DAX 1.2 0.9 1.3 1.0 0.9 0.7 0.6 0.4 1.0 0.9 0.8 1.4 15.3Australia AS30 0.9 0.7 1.1 0.9 0.7 0.6 0.7 0.6 0.8 0.7 0.7 0.6 11.8Japan NKY 1.5 2.6 2.8 1.5 1.8 1.3 1.3 1.1 1.2 1.7 1.9 1.4 26.9Hong Kong HIS 1.1 1.0 1.4 1.2 1.0 0.9 0.8 1.0 0.6 0.9 1.1 1.0 15.9Singapore STI 0.4 0.7 1.0 0.7 0.7 0.9 0.4 0.4 0.6 0.6 0.6 0.6 10.5
EMERGING MARKETSTaiwan TWSE 0.9 0.7 1.1 1.0 0.8 0.6 0.6 0.7 0.5 0.5 0.8 0.6 11.6Russia CRTX 1.3 1.6 1.6 1.4 1.1 1.4 0.9 1.2 0.8 1.2 1.3 3.9 25.8Malaysia KLCI 0.4 0.9 0.7 0.4 0.8 0.4 0.3 0.4 0.4 0.5 0.5 0.4 8.7South Korea KOSPI 0.8 0.7 1.2 0.9 0.9 0.5 0.6 0.8 0.6 0.8 0.7 0.7 12.5Thailand SET 1.1 0.9 1.7 1.6 1.3 1.8 1.0 1.2 0.8 1.6 0.8 0.6 21.1China SHCOMP 1.0 0.8 1.6 1.3 0.9 1.2 1.1 1.0 0.9 0.9 1.1 1.1 16.9S. Africa JALSH 1.1 1.1 1.6 1.1 0.9 0.8 0.6 0.8 1.0 0.7 0.7 0.8 14.9Brazil IBOV 1.5 1.0 1.7 1.6 1.5 1.5 1.1 1.2 1.1 1.1 1.5 1.3 21.4Colombia IGBC 1.0 0.6 1.2 1.0 0.6 0.4 0.4 1.1 0.8 0.6 1.0 0.9 13.4Hungary BUX 0.9 0.6 1.1 1.5 1.1 0.8 0.7 1.0 0.9 1.0 1.2 1.8 17.3Egypt HERMES 0.7 0.9 1.8 2.2 1.5 0.9 0.9 1.0 0.8 1.0 0.8 1.4 19.7Indonesia JCI 0.6 1.1 2.3 1.5 2.2 2.1 0.8 1.0 1.0 1.3 0.7 1.1 21.8Argentina IBG 1.2 2.0 1.1 1.3 1.1 1.6 2.0 2.2 1.4 1.7 1.8 1.1 25.5Chile IPSA 0.8 0.6 1.3 1.1 1.3 1.5 0.7 1.0 0.6 1.0 0.8 0.9 15.7Mexico MEXBOL 1.0 0.9 1.6 1.0 1.0 1.3 1.1 0.9 0.6 0.8 1.0 0.9 16.4India BSE Sensex 1.1 1.1 1.2 1.0 1.7 1.8 0.8 1.1 0.8 0.8 0.7 0.7 17.5India CNX Nifty 1.1 1.2 1.3 1.0 1.8 1.9 0.9 1.1 0.8 0.8 0.7 0.7 18.1
Notes: 1) Daily volatility is computed as the standard deviation of daily returns on closing values of indices for the respective months.
2) Annualised volatility is calculated as Daily Volatility for the financial year multiplied by the square root of number of trading days during the period.
Source: Bloomberg Services
A comparison of volatility of indices across the developed and emerging market indices is shown in Table 2.23 and Chart 2.9. Among the emerging markets, Russia depicted the highest volatility (25.8 percent), followed by Argentina (25.5 percent) and Indonesia (21.8 percent). The volatility in
Indian benchmark indices was a tad higher than the comparative emerging markets. Among the developed markets, the annualised volatility was highest in Japan (26.9 percent) followed by Hong Kong (15.9 percent) and Euro region (15.9 percent).

82
Annual Report 2013-14
Table 2.24: Trading Frequency of Listed Stocks
Trading Frequency (Range of
Days)
2012-13 2013-14
BSE NSE BSE NSE
No. of Shares Traded
Percentage of Total
No. of Shares Traded
Percentage of Total
No. of Shares Traded
Percentage of Total
No. of Shares Traded
Percentage of Total
1 2 3 4 5 6 7 8 9
Above 100 3,232 78.0 1,561 95.4 2,893 66.8 1,469 89.1
91-100 48 1.2 3 0.2 93 2.2 17 1.0
81-90 46 1.1 6 0.4 77 1.8 15 0.9
71-80 67 1.6 5 0.3 89 2.1 15 0.9
61-70 72 1.7 5 0.3 108 2.5 25 1.5
51-60 55 1.3 9 0.5 98 2.3 15 0.9
41-50 73 1.8 3 0.2 97 2.2 17 1.0
31-40 65 1.6 3 0.2 113 2.6 13 0.8
21-30 58 1.4 6 0.4 126 2.9 14 0.8
11-20 70 1.7 4 0.2 162 3.7 13 0.8
0-10 360 8.7 32 2.0 477 11.0 35 2.1
Total 4,146 100 1,637 100 4,333 100 1,648 100
Note : MCX-SX data not significant, therefore not included
Source: BSE, NSE
VII. Trading Frequency
Stock market liquidity is reflected in the trading frequency of the stocks at NSE and BSE. The number of companies listed at BSE at the end of March 2014 was 5,336. At NSE, the number of companies listed was 1,688 as of end March 2014. Trading frequency improved marginally at both the stock exchanges in 2013-14 over the previous financial year. During 2013-14, the number of securities traded in BSE was 4,333 as compared to 4,146 in 2012-13 (Table
2.24). Similarly, the number of securities traded in NSE was higher at 1,648 in 2013-14 as compared to 1,637 in 2012-13. The percentage share of securities traded at BSE above 100 days decreased from 78.0 percent in 2012-13 to 66.8 percent in 2013-14. At NSE, this percentage decreased from 95.4 percent in 2012-13 to 89.1 percent in 2013-14. The percentage share of securities traded for less than 10 days was 11.0 percent at BSE and 2.1 percent at NSE in 2013-14.
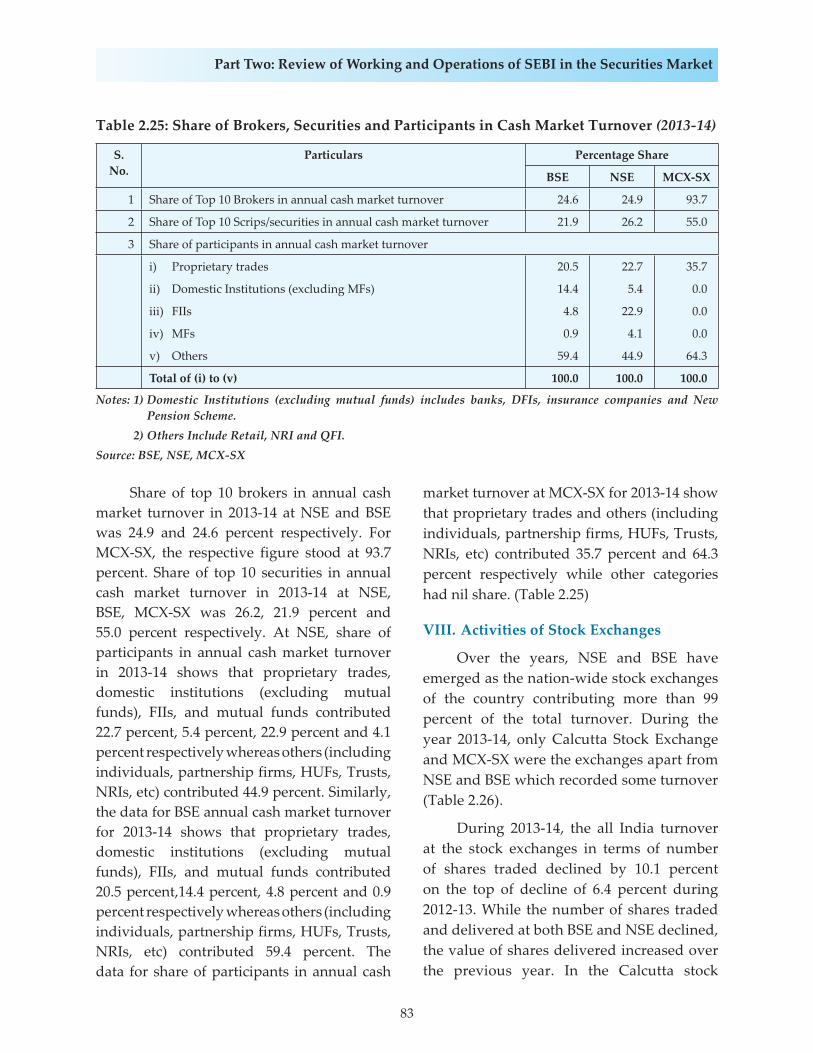
83
Part Two: Review of Working and Operations of SEBI in the Securities Market
Share of top 10 brokers in annual cash market turnover in 2013-14 at NSE and BSE was 24.9 and 24.6 percent respectively. For MCX-SX, the respective figure stood at 93.7 percent. Share of top 10 securities in annual cash market turnover in 2013-14 at NSE, BSE, MCX-SX was 26.2, 21.9 percent and 55.0 percent respectively. At NSE, share of participants in annual cash market turnover in 2013-14 shows that proprietary trades, domestic institutions (excluding mutual funds), FIIs, and mutual funds contributed 22.7 percent, 5.4 percent, 22.9 percent and 4.1 percent respectively whereas others (including individuals, partnership firms, HUFs, Trusts, NRIs, etc) contributed 44.9 percent. Similarly, the data for BSE annual cash market turnover for 2013-14 shows that proprietary trades, domestic institutions (excluding mutual funds), FIIs, and mutual funds contributed 20.5 percent,14.4 percent, 4.8 percent and 0.9 percent respectively whereas others (including individuals, partnership firms, HUFs, Trusts, NRIs, etc) contributed 59.4 percent. The data for share of participants in annual cash
market turnover at MCX-SX for 2013-14 show that proprietary trades and others (including individuals, partnership firms, HUFs, Trusts, NRIs, etc) contributed 35.7 percent and 64.3 percent respectively while other categories had nil share. (Table 2.25)
VIII. Activities of Stock Exchanges
Over the years, NSE and BSE have emerged as the nation-wide stock exchanges of the country contributing more than 99 percent of the total turnover. During the year 2013-14, only Calcutta Stock Exchange and MCX-SX were the exchanges apart from NSE and BSE which recorded some turnover (Table 2.26).
During 2013-14, the all India turnover at the stock exchanges in terms of number of shares traded declined by 10.1 percent on the top of decline of 6.4 percent during 2012-13. While the number of shares traded and delivered at both BSE and NSE declined, the value of shares delivered increased over the previous year. In the Calcutta stock
Table 2.25: Share of Brokers, Securities and Participants in Cash Market Turnover (2013-14)
S. No.
Particulars Percentage Share
BSE NSE MCX-SX
1 Share of Top 10 Brokers in annual cash market turnover 24.6 24.9 93.7
2 Share of Top 10 Scrips/securities in annual cash market turnover 21.9 26.2 55.0
3 Share of participants in annual cash market turnover
i) Proprietary trades 20.5 22.7 35.7
ii) Domestic Institutions (excluding MFs) 14.4 5.4 0.0
iii) FIIs 4.8 22.9 0.0
iv) MFs 0.9 4.1 0.0
v) Others 59.4 44.9 64.3
Total of (i) to (v) 100.0 100.0 100.0
Notes: 1) Domestic Institutions (excluding mutual funds) includes banks, DFIs, insurance companies and New Pension Scheme.
2) Others Include Retail, NRI and QFI.Source: BSE, NSE, MCX-SX
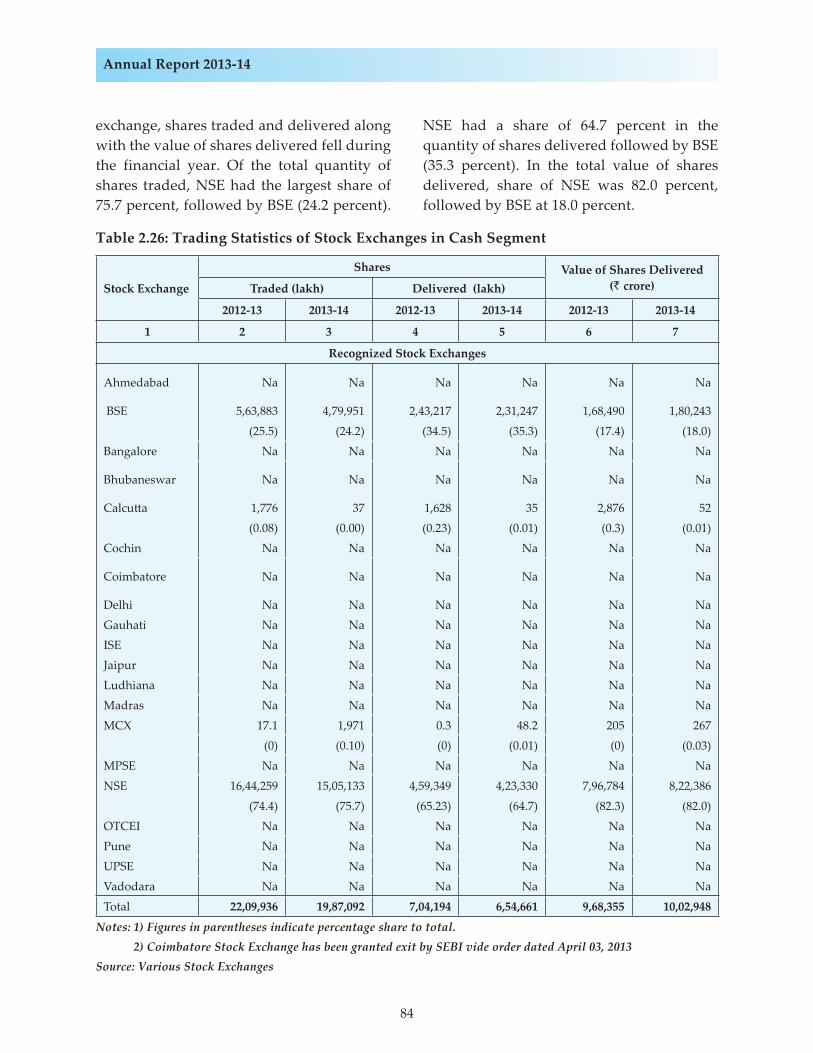
84
Annual Report 2013-14
Table 2.26: Trading Statistics of Stock Exchanges in Cash Segment
Stock Exchange
Shares Value of Shares Delivered (` crore) Traded (lakh) Delivered (lakh)
2012-13 2013-14 2012-13 2013-14 2012-13 2013-14
1 2 3 4 5 6 7
Recognized Stock Exchanges
Ahmedabad Na Na Na Na Na Na
BSE 5,63,883 4,79,951 2,43,217 2,31,247 1,68,490 1,80,243
(25.5) (24.2) (34.5) (35.3) (17.4) (18.0)Bangalore Na Na Na Na Na Na
Bhubaneswar Na Na Na Na Na Na
Calcu� a 1,776 37 1,628 35 2,876 52(0.08) (0.00) (0.23) (0.01) (0.3) (0.01)
Cochin Na Na Na Na Na Na
Coimbatore Na Na Na Na Na Na
Delhi Na Na Na Na Na NaGauhati Na Na Na Na Na NaISE Na Na Na Na Na NaJaipur Na Na Na Na Na NaLudhiana Na Na Na Na Na NaMadras Na Na Na Na Na Na
MCX 17.1 1,971 0.3 48.2 205 267
(0) (0.10) (0) (0.01) (0) (0.03)MPSE Na Na Na Na Na Na
NSE 16,44,259 15,05,133 4,59,349 4,23,330 7,96,784 8,22,386
(74.4) (75.7) (65.23) (64.7) (82.3) (82.0)OTCEI Na Na Na Na Na NaPune Na Na Na Na Na NaUPSE Na Na Na Na Na NaVadodara Na Na Na Na Na Na
Total 22,09,936 19,87,092 7,04,194 6,54,661 9,68,355 10,02,948
Notes: 1) Figures in parentheses indicate percentage share to total. 2) Coimbatore Stock Exchange has been granted exit by SEBI vide order dated April 03, 2013Source: Various Stock Exchanges
exchange, shares traded and delivered along with the value of shares delivered fell during the financial year. Of the total quantity of shares traded, NSE had the largest share of 75.7 percent, followed by BSE (24.2 percent).
NSE had a share of 64.7 percent in the quantity of shares delivered followed by BSE (35.3 percent). In the total value of shares delivered, share of NSE was 82.0 percent, followed by BSE at 18.0 percent.
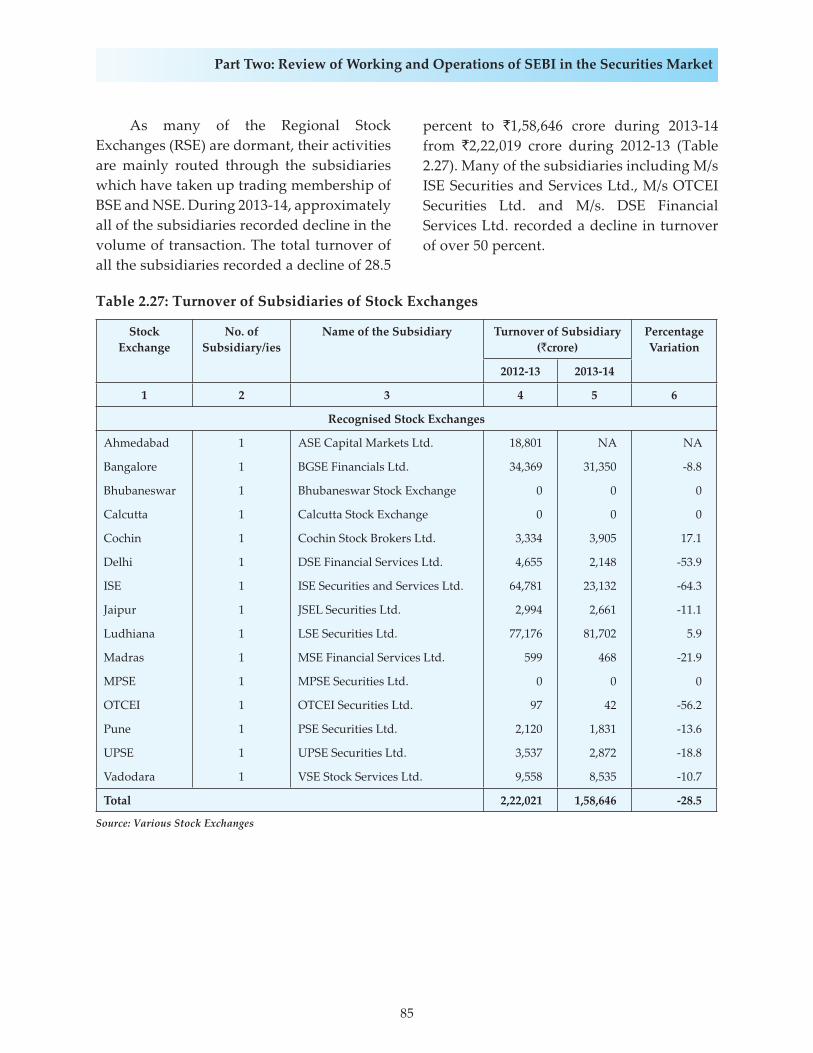
85
Part Two: Review of Working and Operations of SEBI in the Securities Market
Table 2.27: Turnover of Subsidiaries of Stock Exchanges
Stock Exchange
No. of Subsidiary/ies
Name of the Subsidiary Turnover of Subsidiary (`crore)
Percentage Variation
2012-13 2013-14
1 2 3 4 5 6
Recognised Stock Exchanges
Ahmedabad 1 ASE Capital Markets Ltd. 18,801 NA NA
Bangalore 1 BGSE Financials Ltd. 34,369 31,350 -8.8
Bhubaneswar 1 Bhubaneswar Stock Exchange 0 0 0
Calcutta 1 Calcutta Stock Exchange 0 0 0
Cochin 1 Cochin Stock Brokers Ltd. 3,334 3,905 17.1
Delhi 1 DSE Financial Services Ltd. 4,655 2,148 -53.9
ISE 1 ISE Securities and Services Ltd. 64,781 23,132 -64.3
Jaipur 1 JSEL Securities Ltd. 2,994 2,661 -11.1
Ludhiana 1 LSE Securities Ltd. 77,176 81,702 5.9
Madras 1 MSE Financial Services Ltd. 599 468 -21.9
MPSE 1 MPSE Securities Ltd. 0 0 0
OTCEI 1 OTCEI Securities Ltd. 97 42 -56.2
Pune 1 PSE Securities Ltd. 2,120 1,831 -13.6
UPSE 1 UPSE Securities Ltd. 3,537 2,872 -18.8
Vadodara 1 VSE Stock Services Ltd. 9,558 8,535 -10.7
Total 2,22,021 1,58,646 -28.5
Source: Various Stock Exchanges
As many of the Regional Stock Exchanges (RSE) are dormant, their activities are mainly routed through the subsidiaries which have taken up trading membership of BSE and NSE. During 2013-14, approximately all of the subsidiaries recorded decline in the volume of transaction. The total turnover of all the subsidiaries recorded a decline of 28.5
percent to `1,58,646 crore during 2013-14 from `2,22,019 crore during 2012-13 (Table 2.27). Many of the subsidiaries including M/s ISE Securities and Services Ltd., M/s OTCEI Securities Ltd. and M/s. DSE Financial Services Ltd. recorded a decline in turnover of over 50 percent.
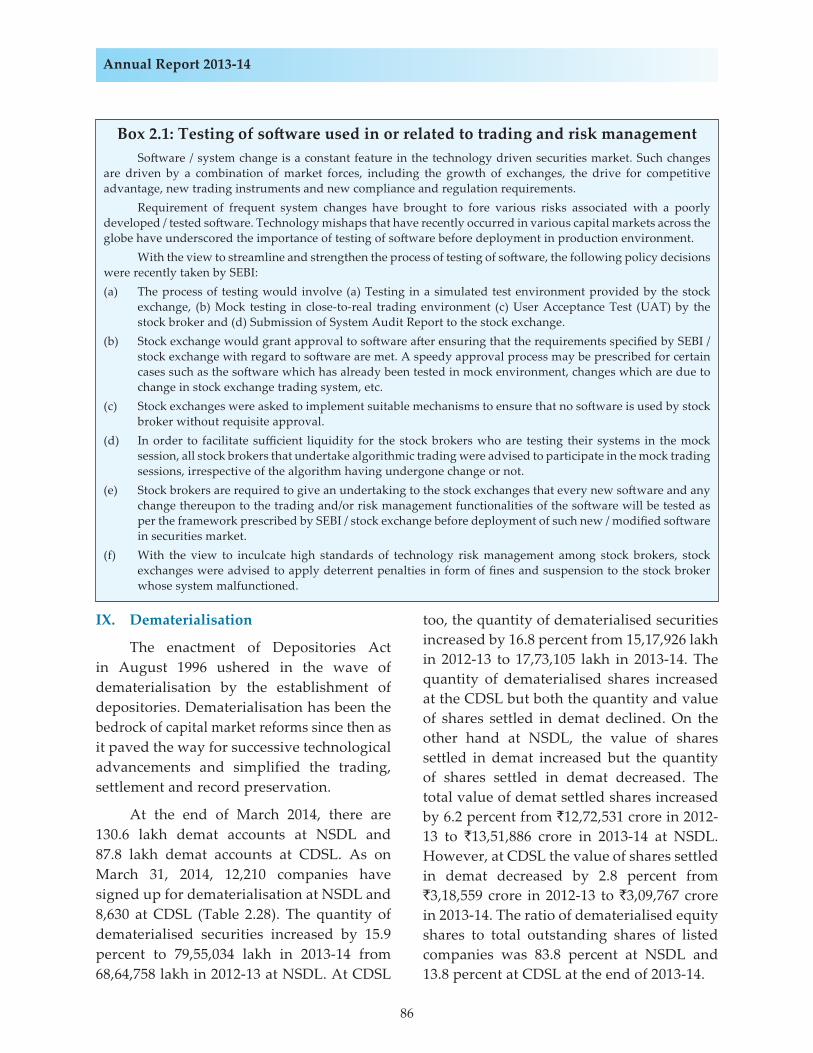
86
Annual Report 2013-14
Box 2.1: Testing of so� ware used in or related to trading and risk management So� ware / system change is a constant feature in the technology driven securities market. Such changes are driven by a combination of market forces, including the growth of exchanges, the drive for competitive advantage, new trading instruments and new compliance and regulation requirements. Requirement of frequent system changes have brought to fore various risks associated with a poorly developed / tested so� ware. Technology mishaps that have recently occurred in various capital markets across the globe have underscored the importance of testing of so� ware before deployment in production environment. With the view to streamline and strengthen the process of testing of so� ware, the following policy decisions were recently taken by SEBI:(a) The process of testing would involve (a) Testing in a simulated test environment provided by the stock
exchange, (b) Mock testing in close-to-real trading environment (c) User Acceptance Test (UAT) by the stock broker and (d) Submission of System Audit Report to the stock exchange.
(b) Stock exchange would grant approval to so� ware a� er ensuring that the requirements specifi ed by SEBI / stock exchange with regard to so� ware are met. A speedy approval process may be prescribed for certain cases such as the so� ware which has already been tested in mock environment, changes which are due to change in stock exchange trading system, etc.
(c) Stock exchanges were asked to implement suitable mechanisms to ensure that no so� ware is used by stock broker without requisite approval.
(d) In order to facilitate suffi cient liquidity for the stock brokers who are testing their systems in the mock session, all stock brokers that undertake algorithmic trading were advised to participate in the mock trading sessions, irrespective of the algorithm having undergone change or not.
(e) Stock brokers are required to give an undertaking to the stock exchanges that every new so� ware and any change thereupon to the trading and/or risk management functionalities of the so� ware will be tested as per the framework prescribed by SEBI / stock exchange before deployment of such new / modifi ed so� ware in securities market.
(f) With the view to inculcate high standards of technology risk management among stock brokers, stock exchanges were advised to apply deterrent penalties in form of fi nes and suspension to the stock broker whose system malfunctioned.
IX. Dematerialisation
The enactment of Depositories Act in August 1996 ushered in the wave of dematerialisation by the establishment of depositories. Dematerialisation has been the bedrock of capital market reforms since then as it paved the way for successive technological advancements and simplified the trading, settlement and record preservation.
At the end of March 2014, there are 130.6 lakh demat accounts at NSDL and 87.8 lakh demat accounts at CDSL. As on March 31, 2014, 12,210 companies have signed up for dematerialisation at NSDL and 8,630 at CDSL (Table 2.28). The quantity of dematerialised securities increased by 15.9 percent to 79,55,034 lakh in 2013-14 from 68,64,758 lakh in 2012-13 at NSDL. At CDSL
too, the quantity of dematerialised securities increased by 16.8 percent from 15,17,926 lakh in 2012-13 to 17,73,105 lakh in 2013-14. The quantity of dematerialised shares increased at the CDSL but both the quantity and value of shares settled in demat declined. On the other hand at NSDL, the value of shares settled in demat increased but the quantity of shares settled in demat decreased. The total value of demat settled shares increased by 6.2 percent from `12,72,531 crore in 2012-13 to `13,51,886 crore in 2013-14 at NSDL. However, at CDSL the value of shares settled in demat decreased by 2.8 percent from `3,18,559 crore in 2012-13 to `3,09,767 crore in 2013-14. The ratio of dematerialised equity shares to total outstanding shares of listed companies was 83.8 percent at NSDL and 13.8 percent at CDSL at the end of 2013-14.
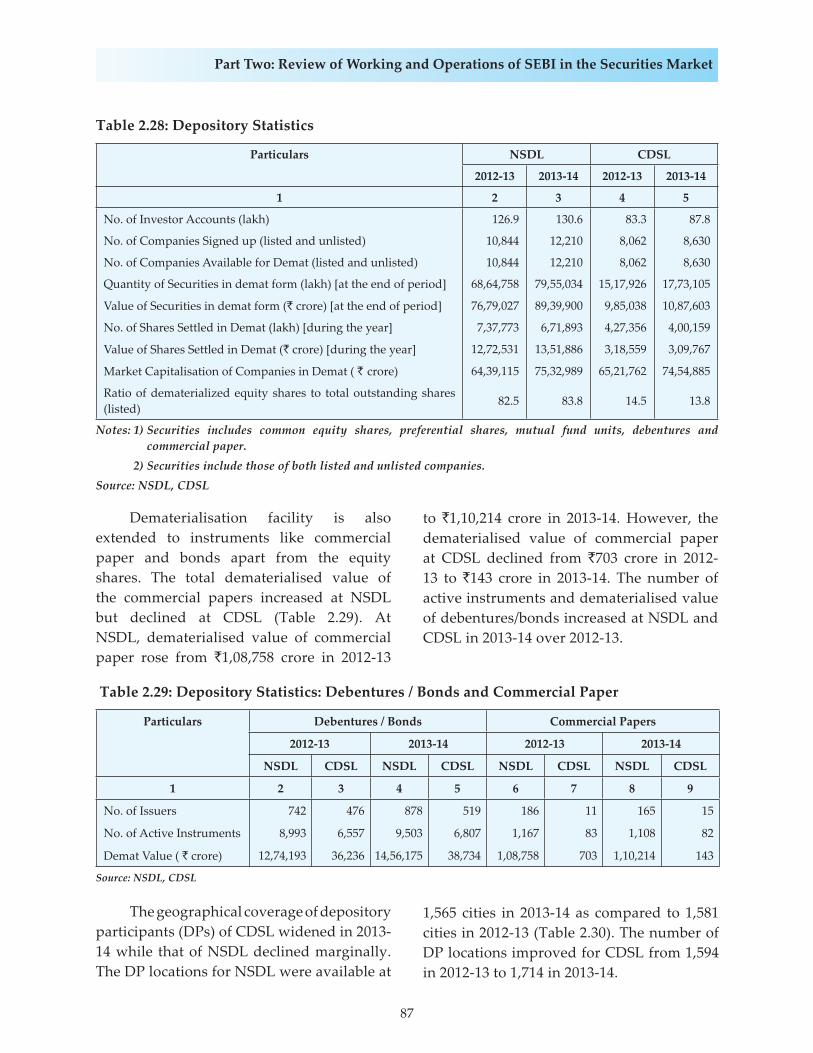
87
Part Two: Review of Working and Operations of SEBI in the Securities Market
Table 2.28: Depository Statistics
Particulars NSDL CDSL
2012-13 2013-14 2012-13 2013-14
1 2 3 4 5
No. of Investor Accounts (lakh) 126.9 130.6 83.3 87.8
No. of Companies Signed up (listed and unlisted) 10,844 12,210 8,062 8,630
No. of Companies Available for Demat (listed and unlisted) 10,844 12,210 8,062 8,630
Quantity of Securities in demat form (lakh) [at the end of period] 68,64,758 79,55,034 15,17,926 17,73,105
Value of Securities in demat form (` crore) [at the end of period] 76,79,027 89,39,900 9,85,038 10,87,603
No. of Shares Settled in Demat (lakh) [during the year] 7,37,773 6,71,893 4,27,356 4,00,159
Value of Shares Settled in Demat (` crore) [during the year] 12,72,531 13,51,886 3,18,559 3,09,767
Market Capitalisation of Companies in Demat ( ` crore) 64,39,115 75,32,989 65,21,762 74,54,885
Ratio of dematerialized equity shares to total outstanding shares (listed) 82.5 83.8 14.5 13.8
Notes: 1) Securities includes common equity shares, preferential shares, mutual fund units, debentures and commercial paper.
2) Securities include those of both listed and unlisted companies.Source: NSDL, CDSL
Dematerialisation facility is also extended to instruments like commercial paper and bonds apart from the equity shares. The total dematerialised value of the commercial papers increased at NSDL but declined at CDSL (Table 2.29). At NSDL, dematerialised value of commercial paper rose from `1,08,758 crore in 2012-13
to `1,10,214 crore in 2013-14. However, the dematerialised value of commercial paper at CDSL declined from `703 crore in 2012-13 to `143 crore in 2013-14. The number of active instruments and dematerialised value of debentures/bonds increased at NSDL and CDSL in 2013-14 over 2012-13.
Table 2.29: Depository Statistics: Debentures / Bonds and Commercial Paper
Particulars Debentures / Bonds Commercial Papers
2012-13 2013-14 2012-13 2013-14
NSDL CDSL NSDL CDSL NSDL CDSL NSDL CDSL
1 2 3 4 5 6 7 8 9
No. of Issuers 742 476 878 519 186 11 165 15
No. of Active Instruments 8,993 6,557 9,503 6,807 1,167 83 1,108 82
Demat Value ( ` crore) 12,74,193 36,236 14,56,175 38,734 1,08,758 703 1,10,214 143
Source: NSDL, CDSL
The geographical coverage of depository participants (DPs) of CDSL widened in 2013-14 while that of NSDL declined marginally. The DP locations for NSDL were available at
1,565 cities in 2013-14 as compared to 1,581 cities in 2012-13 (Table 2.30). The number of DP locations improved for CDSL from 1,594 in 2012-13 to 1,714 in 2013-14.

88
Annual Report 2013-14
X. DERIVATIVES SEGMENT
Financial derivatives have grossed a central place in the financial markets worldwide. The activity in derivatives market has surpassed the growth in other spheres. The emergence and growth of Indian derivatives market since its inception in 2000 has been phenomenal. Within the given span of time, Indian Exchanges and Indian Derivative products feature in the Global rankings.
Globally, derivative products on volatility indices are widely used by market participants as tools for risk management and to hedge against market volatility. SEBI has permitted introduction of derivatives on ‘India VIX’ to National Stock Exchange (NSE) in January 2014, which is India’s first volatility Index and is a key measure of market expectations of near-term volatility.
A. Equity Derivatives Segment
The equity derivatives segment has been effervescent with activity during recent years. Along with NSE and BSE, MCX-SX which started trading in equity derivatives in Feb 2013 registered significant volumes in 2013-14. Indian Exchanges stand out in the list of top five exchanges on a number of parameters in 2013 report of World Federation of Exchanges
(WFE). NSE ranks 3rd in terms of number of single stock futures traded in 2013 as against the 4th position in 2012. NSE is the topmost exchange by number of index options traded in 2013 from 2nd in 2012 while BSE ranks number five in the same category, retaining its position since 2012. The total turnover in 2013-14 in the derivatives segment was approximately 14 times of the turnover in the cash market. NSE had the majority share in the trading volumes at 80.3 percent while BSE contributed 19.4 percent and MCX-SX had a minor share of 0.3 percent.
The total number of contracts traded in the derivative segment of NSE increased by 13.5 percent to 128.4 crore in 2013-14 from 113.1crore in 2012-13, whereas, at BSE, the number of contracts traded increased by 15.1 percent from 26.2 crore in 2012-13 to 30.2 crore in 2013-14. The value of the contracts traded in the derivative segment of NSE increased by 21.2 percent to `3.82 crore in 2013-14 from `3.15 crore in 2012-13, whereas the turnover at the derivatives segment of BSE increased by 28.7 percent to `92,19,434 crore in 2013-14 from `71,63,519 crore in 2012-13. The open interest in the derivative segment of NSE increased by 44.7 percent to `1,24,378 crore at the end of 2013-14 from `85,952 crore at the end of 2012-13.
Table 2.30: Cities according to Number of DP Locations: Geographical Spread
No. of DP Locations NSDL CDSL2012-13 2013-14 2012-13 2013-14
1 2 3 4 50 > 10 1,386 1,385 1,424 1,54110-20 87 78 78 7221-50 67 66 56 6251-100 23 17 21 20> 100 18 19 15 19Total 1,581 1,565 1,594 1,714
Note: The number of DP locations at CDSL, includes locations that have back office connected centres of the DPs.
Source: NSDL, CDSL
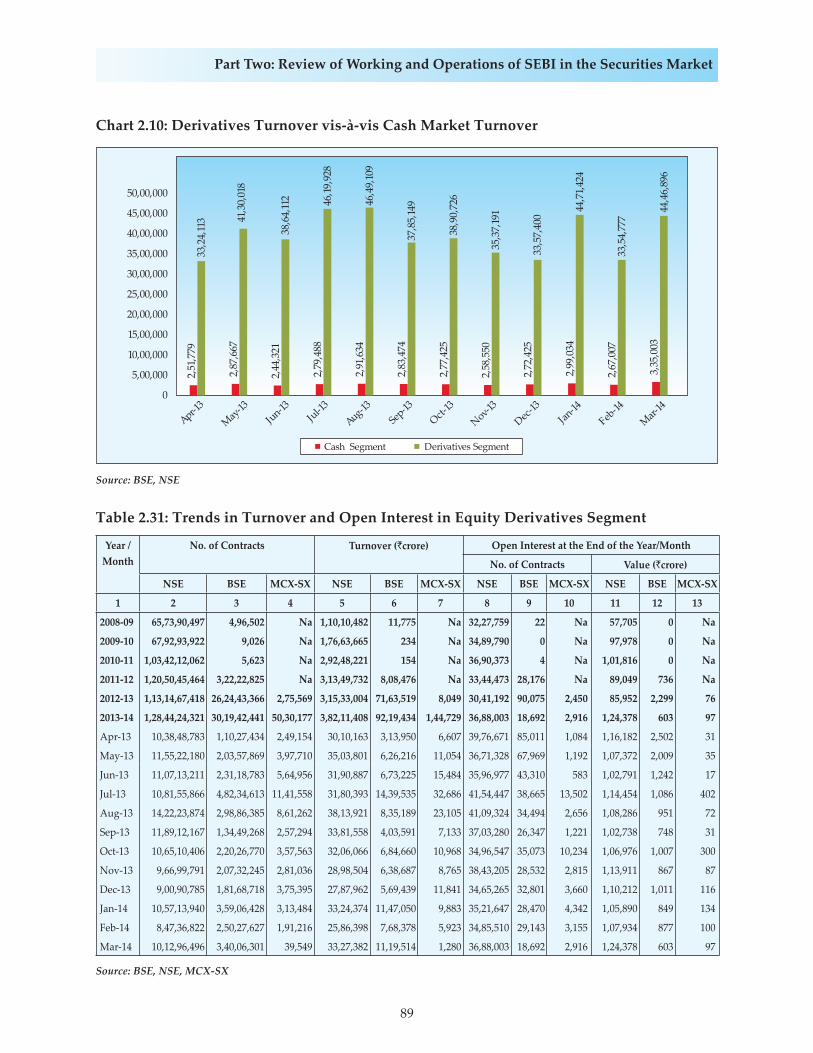
89
Part Two: Review of Working and Operations of SEBI in the Securities Market
Chart 2.10: Derivatives Turnover vis-à-vis Cash Market Turnover
Source: BSE, NSE
Table 2.31: Trends in Turnover and Open Interest in Equity Derivatives Segment
Year / Month
No. of Contracts Turnover (`crore) Open Interest at the End of the Year/Month
No. of Contracts Value (`crore)
NSE BSE MCX-SX NSE BSE MCX-SX NSE BSE MCX-SX NSE BSE MCX-SX
1 2 3 4 5 6 7 8 9 10 11 12 13
2008-09 65,73,90,497 4,96,502 Na 1,10,10,482 11,775 Na 32,27,759 22 Na 57,705 0 Na
2009-10 67,92,93,922 9,026 Na 1,76,63,665 234 Na 34,89,790 0 Na 97,978 0 Na
2010-11 1,03,42,12,062 5,623 Na 2,92,48,221 154 Na 36,90,373 4 Na 1,01,816 0 Na
2011-12 1,20,50,45,464 3,22,22,825 Na 3,13,49,732 8,08,476 Na 33,44,473 28,176 Na 89,049 736 Na
2012-13 1,13,14,67,418 26,24,43,366 2,75,569 3,15,33,004 71,63,519 8,049 30,41,192 90,075 2,450 85,952 2,299 76
2013-14 1,28,44,24,321 30,19,42,441 50,30,177 3,82,11,408 92,19,434 1,44,729 36,88,003 18,692 2,916 1,24,378 603 97
Apr-13 10,38,48,783 1,10,27,434 2,49,154 30,10,163 3,13,950 6,607 39,76,671 85,011 1,084 1,16,182 2,502 31
May-13 11,55,22,180 2,03,57,869 3,97,710 35,03,801 6,26,216 11,054 36,71,328 67,969 1,192 1,07,372 2,009 35
Jun-13 11,07,13,211 2,31,18,783 5,64,956 31,90,887 6,73,225 15,484 35,96,977 43,310 583 1,02,791 1,242 17
Jul-13 10,81,55,866 4,82,34,613 11,41,558 31,80,393 14,39,535 32,686 41,54,447 38,665 13,502 1,14,454 1,086 402
Aug-13 14,22,23,874 2,98,86,385 8,61,262 38,13,921 8,35,189 23,105 41,09,324 34,494 2,656 1,08,286 951 72
Sep-13 11,89,12,167 1,34,49,268 2,57,294 33,81,558 4,03,591 7,133 37,03,280 26,347 1,221 1,02,738 748 31
Oct-13 10,65,10,406 2,20,26,770 3,57,563 32,06,066 6,84,660 10,968 34,96,547 35,073 10,234 1,06,976 1,007 300
Nov-13 9,66,99,791 2,07,32,245 2,81,036 28,98,504 6,38,687 8,765 38,43,205 28,532 2,815 1,13,911 867 87
Dec-13 9,00,90,785 1,81,68,718 3,75,395 27,87,962 5,69,439 11,841 34,65,265 32,801 3,660 1,10,212 1,011 116
Jan-14 10,57,13,940 3,59,06,428 3,13,484 33,24,374 11,47,050 9,883 35,21,647 28,470 4,342 1,05,890 849 134
Feb-14 8,47,36,822 2,50,27,627 1,91,216 25,86,398 7,68,378 5,923 34,85,510 29,143 3,155 1,07,934 877 100
Mar-14 10,12,96,496 3,40,06,301 39,549 33,27,382 11,19,514 1,280 36,88,003 18,692 2,916 1,24,378 603 97
Source: BSE, NSE, MCX-SX
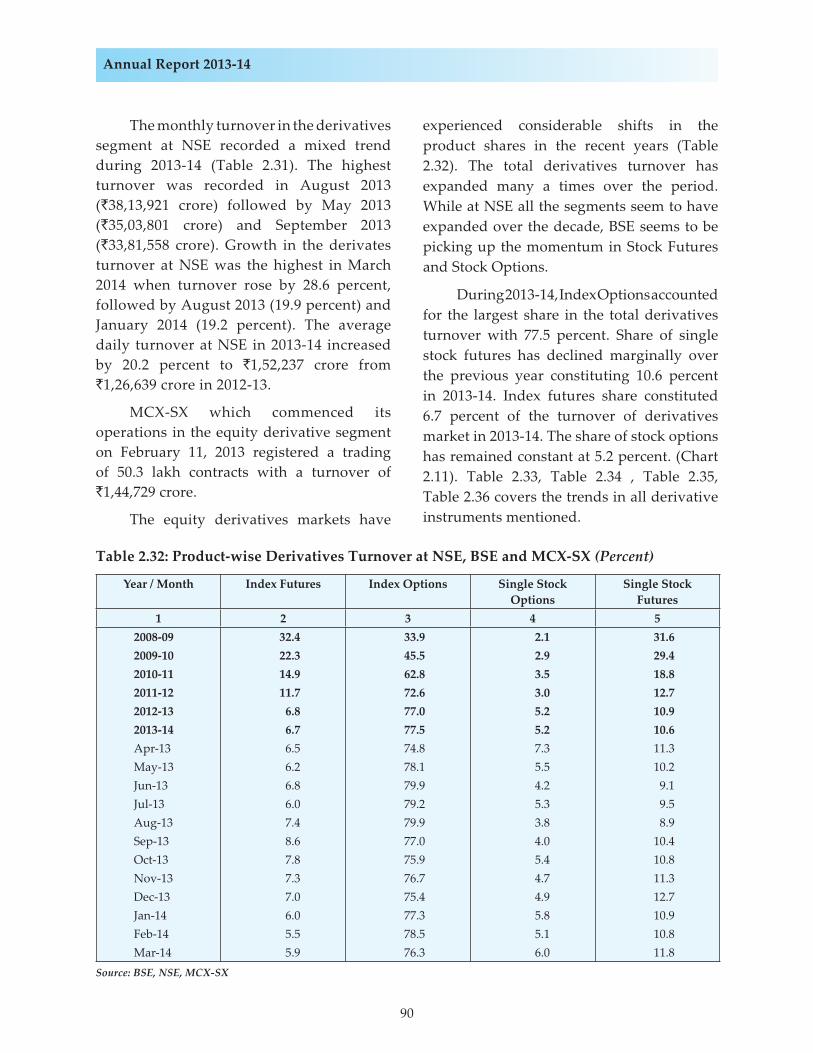
90
Annual Report 2013-14
The monthly turnover in the derivatives segment at NSE recorded a mixed trend during 2013-14 (Table 2.31). The highest turnover was recorded in August 2013 (`38,13,921 crore) followed by May 2013 (`35,03,801 crore) and September 2013 (`33,81,558 crore). Growth in the derivates turnover at NSE was the highest in March 2014 when turnover rose by 28.6 percent, followed by August 2013 (19.9 percent) and January 2014 (19.2 percent). The average daily turnover at NSE in 2013-14 increased by 20.2 percent to `1,52,237 crore from `1,26,639 crore in 2012-13.
MCX-SX which commenced its operations in the equity derivative segment on February 11, 2013 registered a trading of 50.3 lakh contracts with a turnover of `1,44,729 crore.
The equity derivatives markets have
experienced considerable shifts in the product shares in the recent years (Table 2.32). The total derivatives turnover has expanded many a times over the period. While at NSE all the segments seem to have expanded over the decade, BSE seems to be picking up the momentum in Stock Futures and Stock Options.
During 2013-14, Index Options accounted for the largest share in the total derivatives turnover with 77.5 percent. Share of single stock futures has declined marginally over the previous year constituting 10.6 percent in 2013-14. Index futures share constituted 6.7 percent of the turnover of derivatives market in 2013-14. The share of stock options has remained constant at 5.2 percent. (Chart 2.11). Table 2.33, Table 2.34 , Table 2.35, Table 2.36 covers the trends in all derivative instruments mentioned.
Table 2.32: Product-wise Derivatives Turnover at NSE, BSE and MCX-SX (Percent)
Year / Month Index Futures Index Options Single Stock Options
Single Stock Futures
1 2 3 4 52008-09 32.4 33.9 2.1 31.62009-10 22.3 45.5 2.9 29.42010-11 14.9 62.8 3.5 18.82011-12 11.7 72.6 3.0 12.72012-13 6.8 77.0 5.2 10.92013-14 6.7 77.5 5.2 10.6Apr-13 6.5 74.8 7.3 11.3May-13 6.2 78.1 5.5 10.2Jun-13 6.8 79.9 4.2 9.1Jul-13 6.0 79.2 5.3 9.5Aug-13 7.4 79.9 3.8 8.9Sep-13 8.6 77.0 4.0 10.4Oct-13 7.8 75.9 5.4 10.8Nov-13 7.3 76.7 4.7 11.3Dec-13 7.0 75.4 4.9 12.7Jan-14 6.0 77.3 5.8 10.9Feb-14 5.5 78.5 5.1 10.8Mar-14 5.9 76.3 6.0 11.8
Source: BSE, NSE, MCX-SX
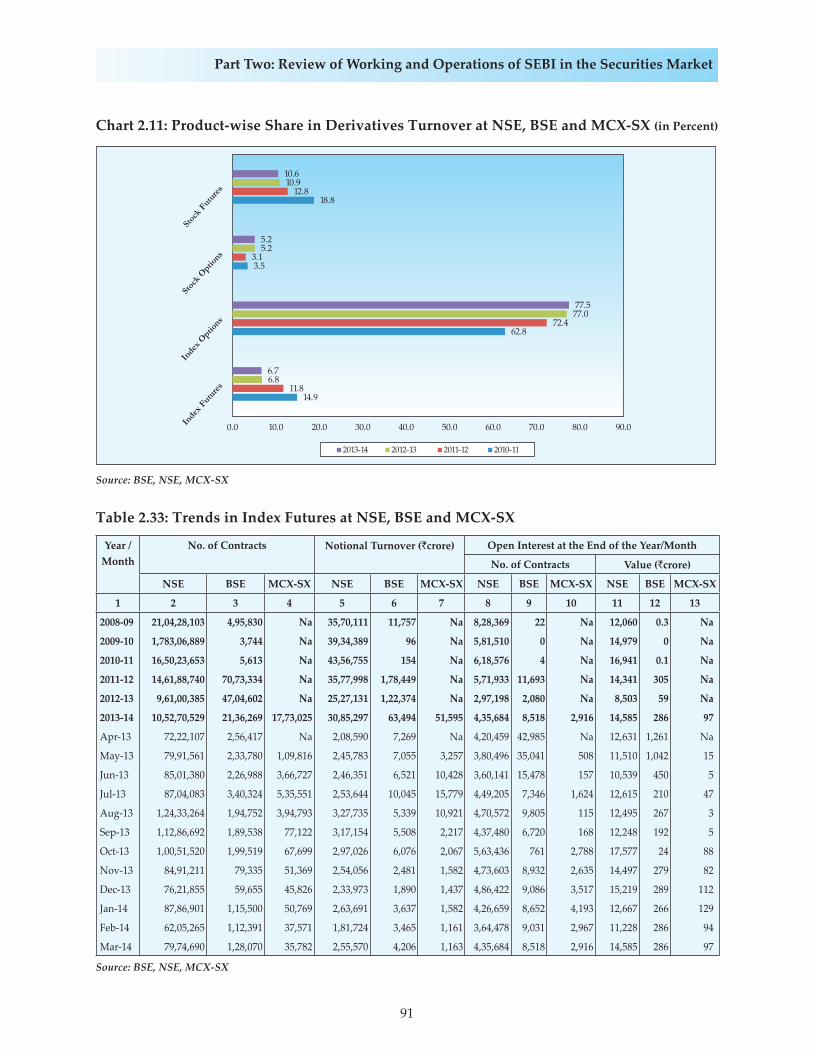
91
Part Two: Review of Working and Operations of SEBI in the Securities Market
Chart 2.11: Product-wise Share in Derivatives Turnover at NSE, BSE and MCX-SX (in Percent)
Source: BSE, NSE, MCX-SX
Table 2.33: Trends in Index Futures at NSE, BSE and MCX-SX
Year / Month
No. of Contracts Notional Turnover (`crore) Open Interest at the End of the Year/Month
No. of Contracts Value (`crore)
NSE BSE MCX-SX NSE BSE MCX-SX NSE BSE MCX-SX NSE BSE MCX-SX
1 2 3 4 5 6 7 8 9 10 11 12 13
2008-09 21,04,28,103 4,95,830 Na 35,70,111 11,757 Na 8,28,369 22 Na 12,060 0.3 Na
2009-10 1,783,06,889 3,744 Na 39,34,389 96 Na 5,81,510 0 Na 14,979 0 Na
2010-11 16,50,23,653 5,613 Na 43,56,755 154 Na 6,18,576 4 Na 16,941 0.1 Na
2011-12 14,61,88,740 70,73,334 Na 35,77,998 1,78,449 Na 5,71,933 11,693 Na 14,341 305 Na
2012-13 9,61,00,385 47,04,602 Na 25,27,131 1,22,374 Na 2,97,198 2,080 Na 8,503 59 Na
2013-14 10,52,70,529 21,36,269 17,73,025 30,85,297 63,494 51,595 4,35,684 8,518 2,916 14,585 286 97
Apr-13 72,22,107 2,56,417 Na 2,08,590 7,269 Na 4,20,459 42,985 Na 12,631 1,261 Na
May-13 79,91,561 2,33,780 1,09,816 2,45,783 7,055 3,257 3,80,496 35,041 508 11,510 1,042 15
Jun-13 85,01,380 2,26,988 3,66,727 2,46,351 6,521 10,428 3,60,141 15,478 157 10,539 450 5
Jul-13 87,04,083 3,40,324 5,35,551 2,53,644 10,045 15,779 4,49,205 7,346 1,624 12,615 210 47
Aug-13 1,24,33,264 1,94,752 3,94,793 3,27,735 5,339 10,921 4,70,572 9,805 115 12,495 267 3
Sep-13 1,12,86,692 1,89,538 77,122 3,17,154 5,508 2,217 4,37,480 6,720 168 12,248 192 5
Oct-13 1,00,51,520 1,99,519 67,699 2,97,026 6,076 2,067 5,63,436 761 2,788 17,577 24 88
Nov-13 84,91,211 79,335 51,369 2,54,056 2,481 1,582 4,73,603 8,932 2,635 14,497 279 82
Dec-13 76,21,855 59,655 45,826 2,33,973 1,890 1,437 4,86,422 9,086 3,517 15,219 289 112
Jan-14 87,86,901 1,15,500 50,769 2,63,691 3,637 1,582 4,26,659 8,652 4,193 12,667 266 129
Feb-14 62,05,265 1,12,391 37,571 1,81,724 3,465 1,161 3,64,478 9,031 2,967 11,228 286 94
Mar-14 79,74,690 1,28,070 35,782 2,55,570 4,206 1,163 4,35,684 8,518 2,916 14,585 286 97
Source: BSE, NSE, MCX-SX
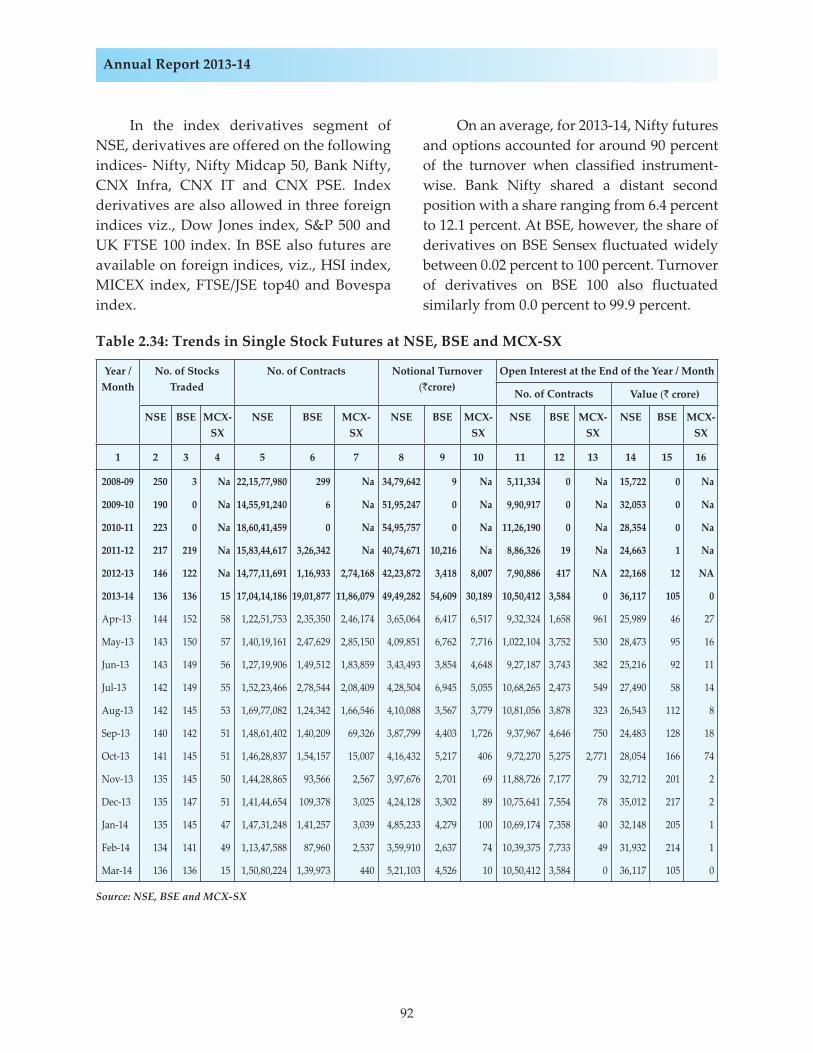
92
Annual Report 2013-14
In the index derivatives segment of NSE, derivatives are offered on the following indices- Nifty, Nifty Midcap 50, Bank Nifty, CNX Infra, CNX IT and CNX PSE. Index derivatives are also allowed in three foreign indices viz., Dow Jones index, S&P 500 and UK FTSE 100 index. In BSE also futures are available on foreign indices, viz., HSI index, MICEX index, FTSE/JSE top40 and Bovespa index.
On an average, for 2013-14, Nifty futures and options accounted for around 90 percent of the turnover when classified instrument-wise. Bank Nifty shared a distant second position with a share ranging from 6.4 percent to 12.1 percent. At BSE, however, the share of derivatives on BSE Sensex fluctuated widely between 0.02 percent to 100 percent. Turnover of derivatives on BSE 100 also fluctuated similarly from 0.0 percent to 99.9 percent.
Table 2.34: Trends in Single Stock Futures at NSE, BSE and MCX-SX
Year / Month
No. of Stocks Traded
No. of Contracts Notional Turnover (`crore)
Open Interest at the End of the Year / Month
No. of Contracts Value (` crore)
NSE BSE MCX-SX
NSE BSE MCX-SX
NSE BSE MCX-SX
NSE BSE MCX-SX
NSE BSE MCX-SX
1 2 3 4 5 6 7 8 9 10 11 12 13 14 15 16
2008-09 250 3 Na 22,15,77,980 299 Na 34,79,642 9 Na 5,11,334 0 Na 15,722 0 Na
2009-10 190 0 Na 14,55,91,240 6 Na 51,95,247 0 Na 9,90,917 0 Na 32,053 0 Na
2010-11 223 0 Na 18,60,41,459 0 Na 54,95,757 0 Na 11,26,190 0 Na 28,354 0 Na
2011-12 217 219 Na 15,83,44,617 3,26,342 Na 40,74,671 10,216 Na 8,86,326 19 Na 24,663 1 Na
2012-13 146 122 Na 14,77,11,691 1,16,933 2,74,168 42,23,872 3,418 8,007 7,90,886 417 NA 22,168 12 NA
2013-14 136 136 15 17,04,14,186 19,01,877 11,86,079 49,49,282 54,609 30,189 10,50,412 3,584 0 36,117 105 0
Apr-13 144 152 58 1,22,51,753 2,35,350 2,46,174 3,65,064 6,417 6,517 9,32,324 1,658 961 25,989 46 27
May-13 143 150 57 1,40,19,161 2,47,629 2,85,150 4,09,851 6,762 7,716 1,022,104 3,752 530 28,473 95 16
Jun-13 143 149 56 1,27,19,906 1,49,512 1,83,859 3,43,493 3,854 4,648 9,27,187 3,743 382 25,216 92 11
Jul-13 142 149 55 1,52,23,466 2,78,544 2,08,409 4,28,504 6,945 5,055 10,68,265 2,473 549 27,490 58 14
Aug-13 142 145 53 1,69,77,082 1,24,342 1,66,546 4,10,088 3,567 3,779 10,81,056 3,878 323 26,543 112 8
Sep-13 140 142 51 1,48,61,402 1,40,209 69,326 3,87,799 4,403 1,726 9,37,967 4,646 750 24,483 128 18
Oct-13 141 145 51 1,46,28,837 1,54,157 15,007 4,16,432 5,217 406 9,72,270 5,275 2,771 28,054 166 74
Nov-13 135 145 50 1,44,28,865 93,566 2,567 3,97,676 2,701 69 11,88,726 7,177 79 32,712 201 2
Dec-13 135 147 51 1,41,44,654 109,378 3,025 4,24,128 3,302 89 10,75,641 7,554 78 35,012 217 2
Jan-14 135 145 47 1,47,31,248 1,41,257 3,039 4,85,233 4,279 100 10,69,174 7,358 40 32,148 205 1
Feb-14 134 141 49 1,13,47,588 87,960 2,537 3,59,910 2,637 74 10,39,375 7,733 49 31,932 214 1
Mar-14 136 136 15 1,50,80,224 1,39,973 440 5,21,103 4,526 10 10,50,412 3,584 0 36,117 105 0
Source: NSE, BSE and MCX-SX
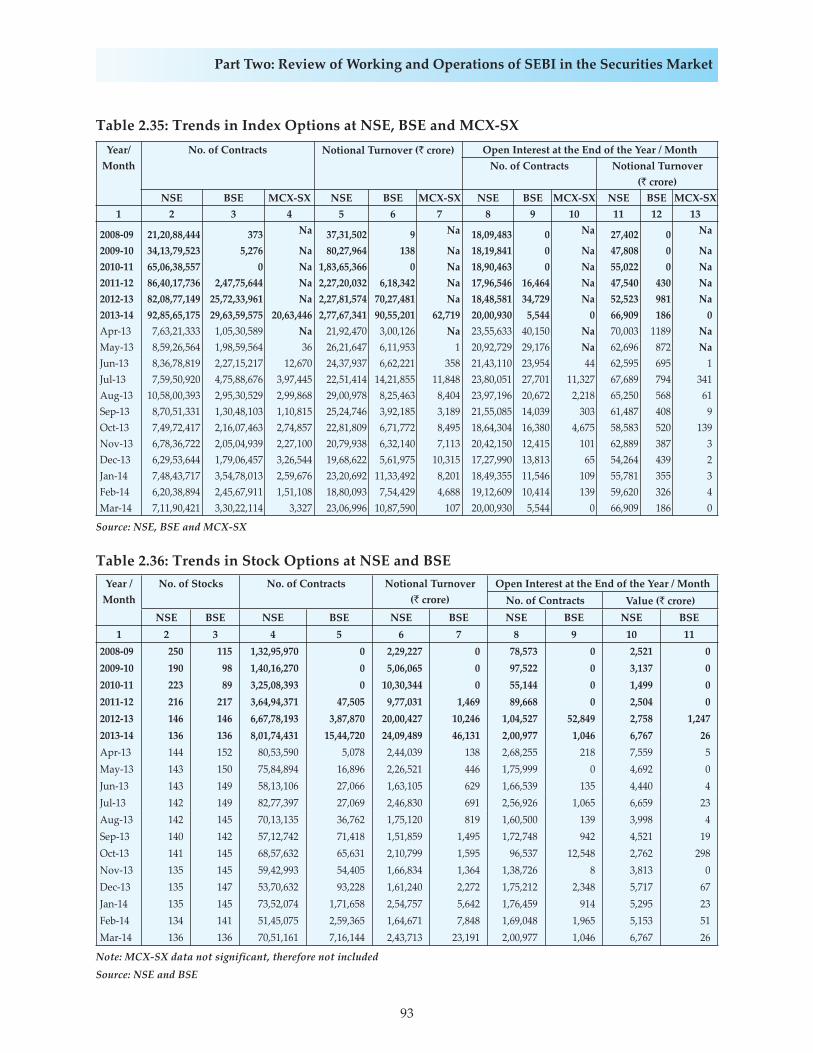
93
Part Two: Review of Working and Operations of SEBI in the Securities Market
Table 2.35: Trends in Index Options at NSE, BSE and MCX-SXYear/
MonthNo. of Contracts Notional Turnover (` crore) Open Interest at the End of the Year / Month
No. of Contracts Notional Turnover(` crore)
NSE BSE MCX-SX NSE BSE MCX-SX NSE BSE MCX-SX NSE BSE MCX-SX1 2 3 4 5 6 7 8 9 10 11 12 13
2008-09 21,20,88,444 373 Na 37,31,502 9 Na 18,09,483 0 Na 27,402 0 Na
2009-10 34,13,79,523 5,276 Na 80,27,964 138 Na 18,19,841 0 Na 47,808 0 Na2010-11 65,06,38,557 0 Na 1,83,65,366 0 Na 18,90,463 0 Na 55,022 0 Na2011-12 86,40,17,736 2,47,75,644 Na 2,27,20,032 6,18,342 Na 17,96,546 16,464 Na 47,540 430 Na2012-13 82,08,77,149 25,72,33,961 Na 2,27,81,574 70,27,481 Na 18,48,581 34,729 Na 52,523 981 Na2013-14 92,85,65,175 29,63,59,575 20,63,446 2,77,67,341 90,55,201 62,719 20,00,930 5,544 0 66,909 186 0Apr-13 7,63,21,333 1,05,30,589 Na 21,92,470 3,00,126 Na 23,55,633 40,150 Na 70,003 1189 NaMay-13 8,59,26,564 1,98,59,564 36 26,21,647 6,11,953 1 20,92,729 29,176 Na 62,696 872 NaJun-13 8,36,78,819 2,27,15,217 12,670 24,37,937 6,62,221 358 21,43,110 23,954 44 62,595 695 1Jul-13 7,59,50,920 4,75,88,676 3,97,445 22,51,414 14,21,855 11,848 23,80,051 27,701 11,327 67,689 794 341Aug-13 10,58,00,393 2,95,30,529 2,99,868 29,00,978 8,25,463 8,404 23,97,196 20,672 2,218 65,250 568 61Sep-13 8,70,51,331 1,30,48,103 1,10,815 25,24,746 3,92,185 3,189 21,55,085 14,039 303 61,487 408 9Oct-13 7,49,72,417 2,16,07,463 2,74,857 22,81,809 6,71,772 8,495 18,64,304 16,380 4,675 58,583 520 139Nov-13 6,78,36,722 2,05,04,939 2,27,100 20,79,938 6,32,140 7,113 20,42,150 12,415 101 62,889 387 3Dec-13 6,29,53,644 1,79,06,457 3,26,544 19,68,622 5,61,975 10,315 17,27,990 13,813 65 54,264 439 2Jan-14 7,48,43,717 3,54,78,013 2,59,676 23,20,692 11,33,492 8,201 18,49,355 11,546 109 55,781 355 3Feb-14 6,20,38,894 2,45,67,911 1,51,108 18,80,093 7,54,429 4,688 19,12,609 10,414 139 59,620 326 4Mar-14 7,11,90,421 3,30,22,114 3,327 23,06,996 10,87,590 107 20,00,930 5,544 0 66,909 186 0
Source: NSE, BSE and MCX-SX
Table 2.36: Trends in Stock Options at NSE and BSEYear /
MonthNo. of Stocks No. of Contracts Notional Turnover
(` crore)Open Interest at the End of the Year / Month
No. of Contracts Value (` crore)NSE BSE NSE BSE NSE BSE NSE BSE NSE BSE
1 2 3 4 5 6 7 8 9 10 112008-09 250 115 1,32,95,970 0 2,29,227 0 78,573 0 2,521 02009-10 190 98 1,40,16,270 0 5,06,065 0 97,522 0 3,137 02010-11 223 89 3,25,08,393 0 10,30,344 0 55,144 0 1,499 02011-12 216 217 3,64,94,371 47,505 9,77,031 1,469 89,668 0 2,504 02012-13 146 146 6,67,78,193 3,87,870 20,00,427 10,246 1,04,527 52,849 2,758 1,2472013-14 136 136 8,01,74,431 15,44,720 24,09,489 46,131 2,00,977 1,046 6,767 26Apr-13 144 152 80,53,590 5,078 2,44,039 138 2,68,255 218 7,559 5May-13 143 150 75,84,894 16,896 2,26,521 446 1,75,999 0 4,692 0Jun-13 143 149 58,13,106 27,066 1,63,105 629 1,66,539 135 4,440 4Jul-13 142 149 82,77,397 27,069 2,46,830 691 2,56,926 1,065 6,659 23Aug-13 142 145 70,13,135 36,762 1,75,120 819 1,60,500 139 3,998 4Sep-13 140 142 57,12,742 71,418 1,51,859 1,495 1,72,748 942 4,521 19Oct-13 141 145 68,57,632 65,631 2,10,799 1,595 96,537 12,548 2,762 298Nov-13 135 145 59,42,993 54,405 1,66,834 1,364 1,38,726 8 3,813 0Dec-13 135 147 53,70,632 93,228 1,61,240 2,272 1,75,212 2,348 5,717 67Jan-14 135 145 73,52,074 1,71,658 2,54,757 5,642 1,76,459 914 5,295 23Feb-14 134 141 51,45,075 2,59,365 1,64,671 7,848 1,69,048 1,965 5,153 51Mar-14 136 136 70,51,161 7,16,144 2,43,713 23,191 2,00,977 1,046 6,767 26
Note: MCX-SX data not significant, therefore not included
Source: NSE and BSE
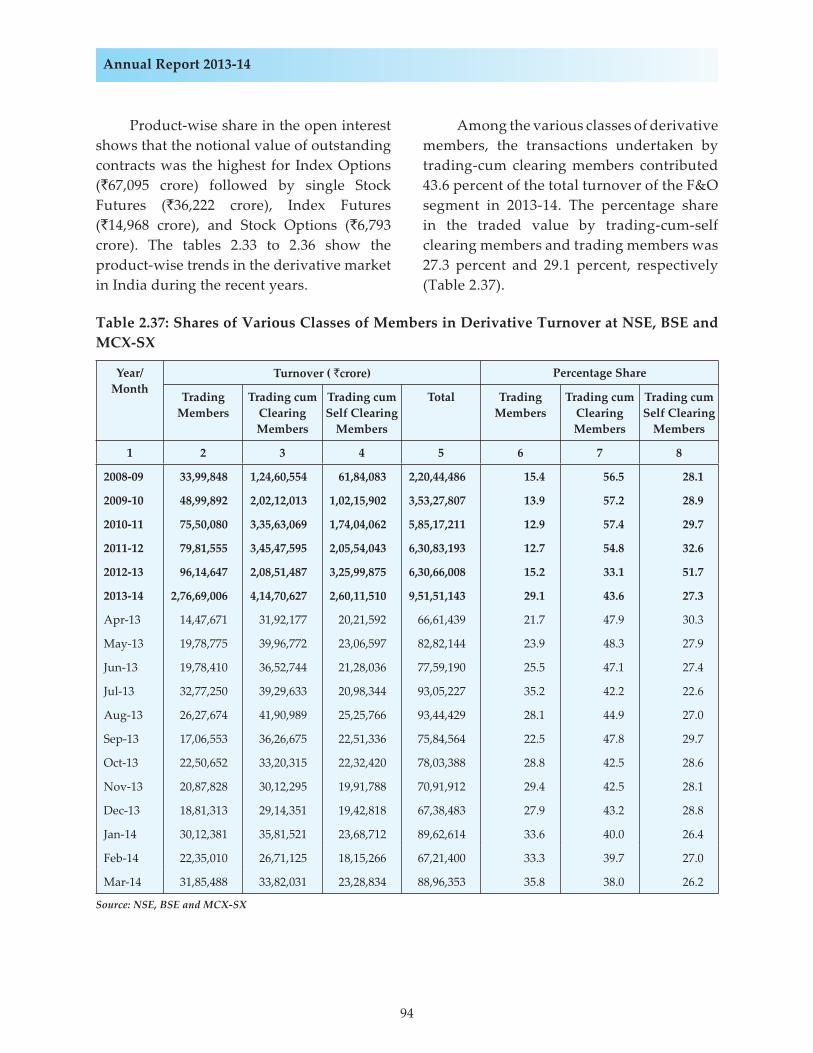
94
Annual Report 2013-14
Product-wise share in the open interest shows that the notional value of outstanding contracts was the highest for Index Options (`67,095 crore) followed by single Stock Futures (`36,222 crore), Index Futures (`14,968 crore), and Stock Options (`6,793 crore). The tables 2.33 to 2.36 show the product-wise trends in the derivative market in India during the recent years.
Among the various classes of derivative members, the transactions undertaken by trading-cum clearing members contributed 43.6 percent of the total turnover of the F&O segment in 2013-14. The percentage share in the traded value by trading-cum-self clearing members and trading members was 27.3 percent and 29.1 percent, respectively (Table 2.37).
Table 2.37: Shares of Various Classes of Members in Derivative Turnover at NSE, BSE and MCX-SX
Year/Month
Turnover ( `crore) Percentage Share
Trading Members
Trading cum Clearing Members
Trading cum Self Clearing
Members
Total Trading Members
Trading cum Clearing Members
Trading cum Self Clearing
Members
1 2 3 4 5 6 7 8
2008-09 33,99,848 1,24,60,554 61,84,083 2,20,44,486 15.4 56.5 28.1
2009-10 48,99,892 2,02,12,013 1,02,15,902 3,53,27,807 13.9 57.2 28.9
2010-11 75,50,080 3,35,63,069 1,74,04,062 5,85,17,211 12.9 57.4 29.7
2011-12 79,81,555 3,45,47,595 2,05,54,043 6,30,83,193 12.7 54.8 32.6
2012-13 96,14,647 2,08,51,487 3,25,99,875 6,30,66,008 15.2 33.1 51.7
2013-14 2,76,69,006 4,14,70,627 2,60,11,510 9,51,51,143 29.1 43.6 27.3
Apr-13 14,47,671 31,92,177 20,21,592 66,61,439 21.7 47.9 30.3
May-13 19,78,775 39,96,772 23,06,597 82,82,144 23.9 48.3 27.9
Jun-13 19,78,410 36,52,744 21,28,036 77,59,190 25.5 47.1 27.4
Jul-13 32,77,250 39,29,633 20,98,344 93,05,227 35.2 42.2 22.6
Aug-13 26,27,674 41,90,989 25,25,766 93,44,429 28.1 44.9 27.0
Sep-13 17,06,553 36,26,675 22,51,336 75,84,564 22.5 47.8 29.7
Oct-13 22,50,652 33,20,315 22,32,420 78,03,388 28.8 42.5 28.6
Nov-13 20,87,828 30,12,295 19,91,788 70,91,912 29.4 42.5 28.1
Dec-13 18,81,313 29,14,351 19,42,818 67,38,483 27.9 43.2 28.8
Jan-14 30,12,381 35,81,521 23,68,712 89,62,614 33.6 40.0 26.4
Feb-14 22,35,010 26,71,125 18,15,266 67,21,400 33.3 39.7 27.0
Mar-14 31,85,488 33,82,031 23,28,834 88,96,353 35.8 38.0 26.2
Source: NSE, BSE and MCX-SX
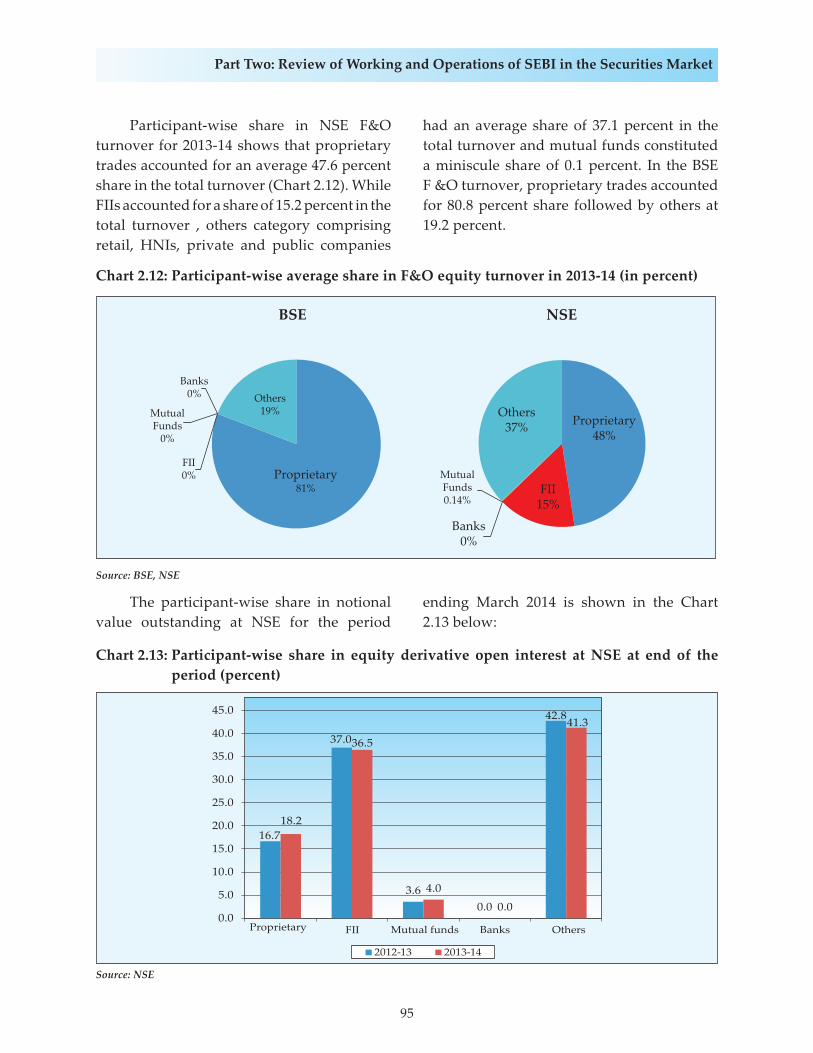
95
Part Two: Review of Working and Operations of SEBI in the Securities Market
Participant-wise share in NSE F&O turnover for 2013-14 shows that proprietary trades accounted for an average 47.6 percent share in the total turnover (Chart 2.12). While FIIs accounted for a share of 15.2 percent in the total turnover , others category comprising retail, HNIs, private and public companies
had an average share of 37.1 percent in the total turnover and mutual funds constituted a miniscule share of 0.1 percent. In the BSE F &O turnover, proprietary trades accounted for 80.8 percent share followed by others at 19.2 percent.
Chart 2.12: Participant-wise average share in F&O equity turnover in 2013-14 (in percent)
Source: BSE, NSE
The participant-wise share in notional value outstanding at NSE for the period
ending March 2014 is shown in the Chart 2.13 below:
Chart 2.13: Participant-wise share in equity derivative open interest at NSE at end of the period (percent)
Source: NSE
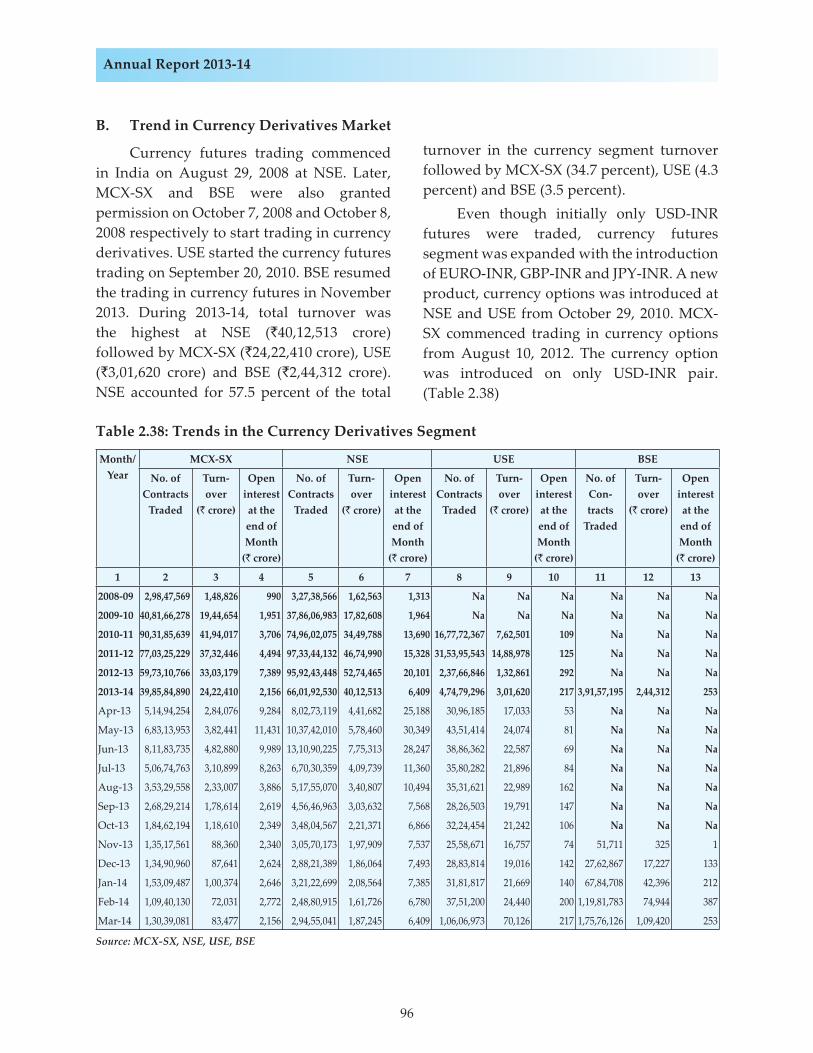
96
Annual Report 2013-14
B. Trend in Currency Derivatives Market
Currency futures trading commenced in India on August 29, 2008 at NSE. Later, MCX-SX and BSE were also granted permission on October 7, 2008 and October 8, 2008 respectively to start trading in currency derivatives. USE started the currency futures trading on September 20, 2010. BSE resumed the trading in currency futures in November 2013. During 2013-14, total turnover was the highest at NSE (`40,12,513 crore) followed by MCX-SX (`24,22,410 crore), USE (`3,01,620 crore) and BSE (`2,44,312 crore). NSE accounted for 57.5 percent of the total
turnover in the currency segment turnover followed by MCX-SX (34.7 percent), USE (4.3 percent) and BSE (3.5 percent).
Even though initially only USD-INR futures were traded, currency futures segment was expanded with the introduction of EURO-INR, GBP-INR and JPY-INR. A new product, currency options was introduced at NSE and USE from October 29, 2010. MCX-SX commenced trading in currency options from August 10, 2012. The currency option was introduced on only USD-INR pair. (Table 2.38)
Table 2.38: Trends in the Currency Derivatives Segment
Month/ Year
MCX-SX NSE USE BSE
No. of Contracts
Traded
Turn-over
(` crore)
Open interest at the end of Month
(` crore)
No. of Contracts
Traded
Turn-over
(` crore)
Open interest at the end of Month
(` crore)
No. of Contracts
Traded
Turn-over
(` crore)
Open interest at the end of Month
(` crore)
No. of Con-tracts
Traded
Turn-over
(` crore)
Open interest at the end of Month
(` crore)
1 2 3 4 5 6 7 8 9 10 11 12 13
2008-09 2,98,47,569 1,48,826 990 3,27,38,566 1,62,563 1,313 Na Na Na Na Na Na
2009-10 40,81,66,278 19,44,654 1,951 37,86,06,983 17,82,608 1,964 Na Na Na Na Na Na
2010-11 90,31,85,639 41,94,017 3,706 74,96,02,075 34,49,788 13,690 16,77,72,367 7,62,501 109 Na Na Na
2011-12 77,03,25,229 37,32,446 4,494 97,33,44,132 46,74,990 15,328 31,53,95,543 14,88,978 125 Na Na Na
2012-13 59,73,10,766 33,03,179 7,389 95,92,43,448 52,74,465 20,101 2,37,66,846 1,32,861 292 Na Na Na
2013-14 39,85,84,890 24,22,410 2,156 66,01,92,530 40,12,513 6,409 4,74,79,296 3,01,620 217 3,91,57,195 2,44,312 253
Apr-13 5,14,94,254 2,84,076 9,284 8,02,73,119 4,41,682 25,188 30,96,185 17,033 53 Na Na Na
May-13 6,83,13,953 3,82,441 11,431 10,37,42,010 5,78,460 30,349 43,51,414 24,074 81 Na Na Na
Jun-13 8,11,83,735 4,82,880 9,989 13,10,90,225 7,75,313 28,247 38,86,362 22,587 69 Na Na Na
Jul-13 5,06,74,763 3,10,899 8,263 6,70,30,359 4,09,739 11,360 35,80,282 21,896 84 Na Na Na
Aug-13 3,53,29,558 2,33,007 3,886 5,17,55,070 3,40,807 10,494 35,31,621 22,989 162 Na Na Na
Sep-13 2,68,29,214 1,78,614 2,619 4,56,46,963 3,03,632 7,568 28,26,503 19,791 147 Na Na Na
Oct-13 1,84,62,194 1,18,610 2,349 3,48,04,567 2,21,371 6,866 32,24,454 21,242 106 Na Na Na
Nov-13 1,35,17,561 88,360 2,340 3,05,70,173 1,97,909 7,537 25,58,671 16,757 74 51,711 325 1
Dec-13 1,34,90,960 87,641 2,624 2,88,21,389 1,86,064 7,493 28,83,814 19,016 142 27,62,867 17,227 133
Jan-14 1,53,09,487 1,00,374 2,646 3,21,22,699 2,08,564 7,385 31,81,817 21,669 140 67,84,708 42,396 212
Feb-14 1,09,40,130 72,031 2,772 2,48,80,915 1,61,726 6,780 37,51,200 24,440 200 1,19,81,783 74,944 387
Mar-14 1,30,39,081 83,477 2,156 2,94,55,041 1,87,245 6,409 1,06,06,973 70,126 217 1,75,76,126 1,09,420 253
Source: MCX-SX, NSE, USE, BSE
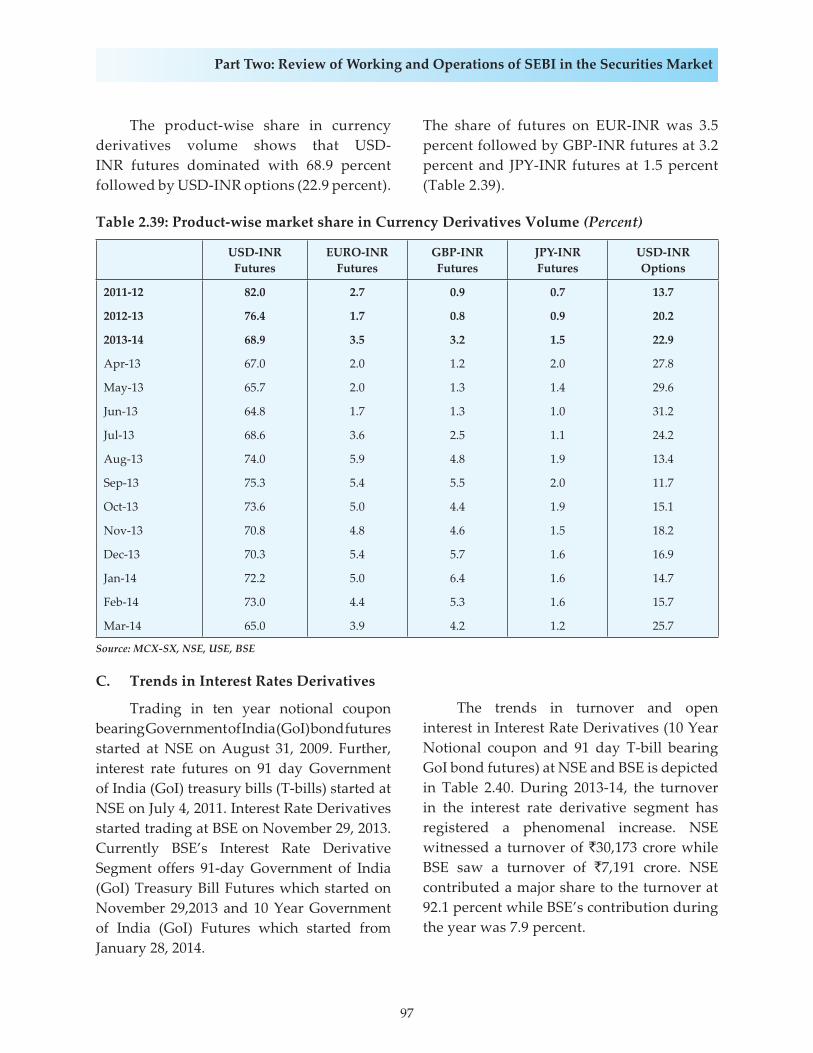
97
Part Two: Review of Working and Operations of SEBI in the Securities Market
The product-wise share in currency derivatives volume shows that USD-INR futures dominated with 68.9 percent followed by USD-INR options (22.9 percent).
The share of futures on EUR-INR was 3.5 percent followed by GBP-INR futures at 3.2 percent and JPY-INR futures at 1.5 percent (Table 2.39).
Table 2.39: Product-wise market share in Currency Derivatives Volume (Percent)
USD-INR Futures
EURO-INR Futures
GBP-INR Futures
JPY-INR Futures
USD-INR Options
2011-12 82.0 2.7 0.9 0.7 13.7
2012-13 76.4 1.7 0.8 0.9 20.2
2013-14 68.9 3.5 3.2 1.5 22.9
Apr-13 67.0 2.0 1.2 2.0 27.8
May-13 65.7 2.0 1.3 1.4 29.6
Jun-13 64.8 1.7 1.3 1.0 31.2
Jul-13 68.6 3.6 2.5 1.1 24.2
Aug-13 74.0 5.9 4.8 1.9 13.4
Sep-13 75.3 5.4 5.5 2.0 11.7
Oct-13 73.6 5.0 4.4 1.9 15.1
Nov-13 70.8 4.8 4.6 1.5 18.2
Dec-13 70.3 5.4 5.7 1.6 16.9
Jan-14 72.2 5.0 6.4 1.6 14.7
Feb-14 73.0 4.4 5.3 1.6 15.7
Mar-14 65.0 3.9 4.2 1.2 25.7
Source: MCX-SX, NSE, USE, BSE
C. Trends in Interest Rates Derivatives
Trading in ten year notional coupon bearing Government of India (GoI) bond futures started at NSE on August 31, 2009. Further, interest rate futures on 91 day Government of India (GoI) treasury bills (T-bills) started at NSE on July 4, 2011. Interest Rate Derivatives started trading at BSE on November 29, 2013. Currently BSE’s Interest Rate Derivative Segment offers 91-day Government of India (GoI) Treasury Bill Futures which started on November 29,2013 and 10 Year Government of India (GoI) Futures which started from January 28, 2014.
The trends in turnover and open interest in Interest Rate Derivatives (10 Year Notional coupon and 91 day T-bill bearing GoI bond futures) at NSE and BSE is depicted in Table 2.40. During 2013-14, the turnover in the interest rate derivative segment has registered a phenomenal increase. NSE witnessed a turnover of `30,173 crore while BSE saw a turnover of `7,191 crore. NSE contributed a major share to the turnover at 92.1 percent while BSE’s contribution during the year was 7.9 percent.

98
Annual Report 2013-14
Table 2.40: Trends in Interest Rate Derivatives at NSE, BSE and MCX-SX
Year/ Month
Total Open Interest at the end of the year/ month
No. of contracts Turnover (` crore) No. of Contracts Value (` crore)
NSE BSE MCX-SX NSE BSE MCX-SX NSE BSE MCX-SX NSE BSE MCX-SX
1 2 3 4 5 6 7 8 9 10 11 12 13
2009-10 1,60,894 Na Na 2,975 Na Na 758 Na Na 14 Na Na
2010-11 3,348 Na Na 62 Na Na 1 Na Na 0 Na Na
2011-12 2,15,200 Na Na 3,959 Na Na 0 Na Na 0 Na Na
2012-13 12 Na Na 0 Na Na 0 Na Na 0 Na Na
2013-14 15,02,148 1,28,549 3,56,555 30,173 7,191 2,580 55,710 9,829 2,596 1,113 197 52
Apr-13 0 0 0 0 0 0 0 0 0 0 0 0
May-13 0 0 0 0 0 0 0 0 0 0 0 0
Jun-13 0 0 0 0 0 0 0 0 0 0 0 0
Jul-13 0 0 0 0 0 0 0 0 0 0 0 0
Aug-13 0 0 0 0 0 0 0 0 0 0 0 0
Sep-13 0 0 0 0 0 0 0 0 0 0 0 0
Oct-13 0 0 0 0 0 0 0 0 0 0 0 0
Nov-13 0 0 0 0 0 0 0 0 0 0 0 0
Dec-13 0 0 0 0 0 0 0 0 0 0 0 0
Jan-14 4,36,836 54,134 2,00,101 8,832 4,055 1,085 24,662 310 11,103 494 6 222
Feb-14 4,56,591 56,933 97,752 9,146 1,960 1,144 33,138 958 2,722 661 19 54
Mar-14 6,08,721 17,482 58,702 12,194 1,175 350 55,710 9,829 2,596 1,113 197 52
Source: NSE, BSE and MCX-SX
3. MUTUAL FUNDS
Over the years, SEBI has been taking several steps to re-energise the mutual fund industry. Some of the measures include the penetration of mutual fund products, improving the reach of MF products in smaller cities and towns beyond the top 15 cities, alignment of interest of investors, etc. In 2013-14, SEBI has framed a long term policy for mutual funds in India which inter alia includes enhancing the reach of mutual fund products, promoting financial inclusion, tax treatment, obligation of various stakeholders, increasing transparency etc. SEBI endeavours to constantly revisit the
regulations so that the mutual fund industry mobilises a larger chunk of the domestic savings of Indian household.
The future of the mutual fund industry is dependent on increasing the financial literacy and showcasing the suitability of mutual funds in an investor’s portfolio. AMCs and product distributors must work closely to achieve the target of higher penetration of mutual funds and household savings. There is a very important role of independent financial institutions apart from banks in the growth and stability of the economy and the capital markets.

99
Part Two: Review of Working and Operations of SEBI in the Securities Market
Mutual fund industry continued to exhibit positive growth in assets under management in 2013-14. The gross mobilisation of resources by all mutual funds during 2013-14 was at `97,68,100 crore compared to `72,67,885 crore during the previous year indicating an increase of 34.4 percent over the previous year (Table 2.41). Correspondingly, redemption also increased by 35.1 percent to `97,14,318 crore in 2013-14 from `71,91,346 crore in 2012-13. The net resources mobilised by all the mutual funds aggregated to `53,782 crore in 2013-14 compared to net inflow of `76,539 crore in 2012-13.
As of at the end of March 2014, the cumulative net assets managed by all the mutual funds totaled to `8,25,240 crore as against `7,01,443 crore at the end of March 2013, representing a rise 17.6 percent.
Sector-wise Resource Mobilisation
The private sector mutual funds retained the dominant place in the mutual
fund industry with 82.4 percent share in the gross resource mobilisation and 90.8 percent in the net resource mobilisation. The corresponding shares of UTI mutual fund and other public sector mutual funds was 8.2 percent and 9.4 percent in the gross resource mobilisation and 0.7 percent and 8.4 percent in the net resource mobilisation.
In absolute terms, the gross resource mobilisation by private sector mutual funds rose by 35.8 percent to `80,49,397 crore in 2013-14 from `59,27,947 crore in 2012-13 (Table 2.42). Due to the heavy redemptions in the last three quarters of 2013-14, the net resource mobilisation by private sector mutual funds declined by 25.0 percent to `48,838 crore in 2013-14 compared to `65,102 crore in 2012-13. The net resources raised by UTI mutual fund and other public sector mutual funds was much lesser at `401 crore and `4,542 crore respectively in 2013-14 and represented a decline of 91.3 percent and 33.3 percent respectively over the previous financial year.
Table 2.41: Mobilisation of Resources by Mutual Funds ( `crore)
Year Gross Mobilisation Redemption Net Inflow Assets at the end of period
1 2 3 4 5
2007-08 44,64,376 43,10,575 1,53,802 5,05,152
2008-09 54,26,353 54,54,650 -28,296 4,17,300
2009-10 1,00,19,022 99,35,942 83,080 6,13,979
2010-11 88,59,515 89,08,921 -49,406 5,92,250
2011-12 68,19,678 68,41,702 -22,024 5,87,217
2012-13 72,67,885 71,91,346 76,539 7,01,443
2013-14 97,68,100 97,14,318 53,782 8,25,240
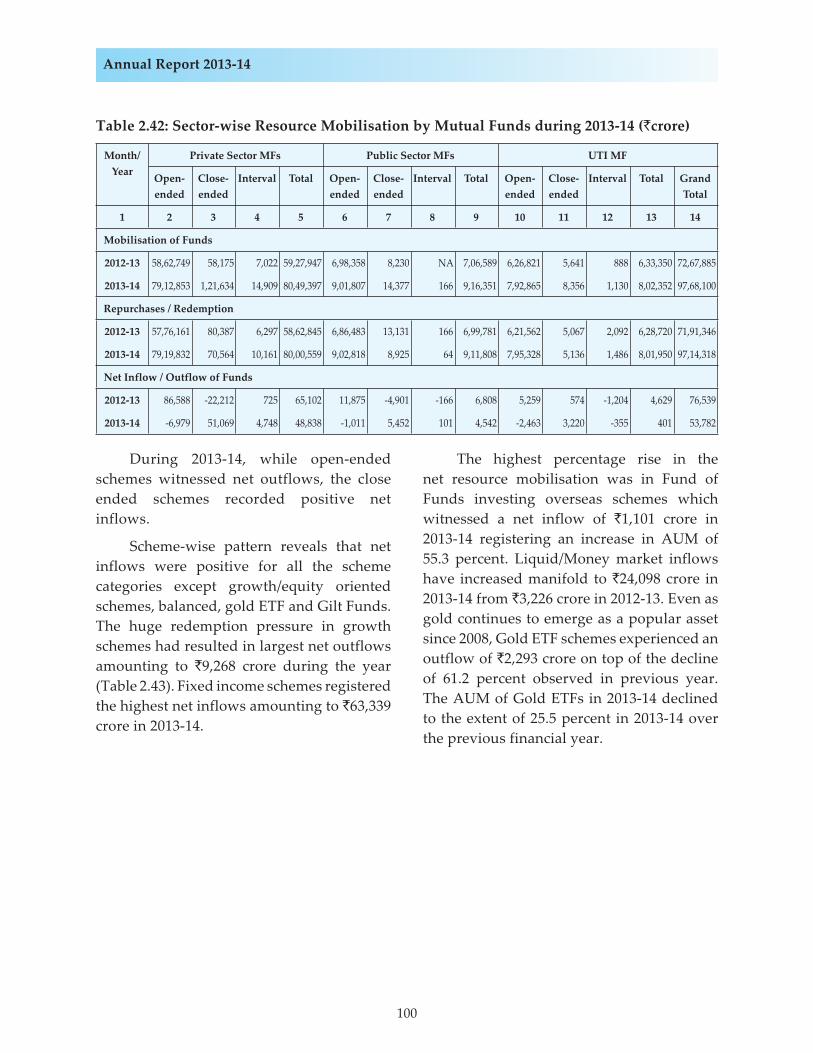
100
Annual Report 2013-14
Table 2.42: Sector-wise Resource Mobilisation by Mutual Funds during 2013-14 (`crore)
Month/ Year
Private Sector MFs Public Sector MFs UTI MF
Open-ended
Close-ended
Interval Total Open-ended
Close- ended
Interval Total Open-ended
Close- ended
Interval Total Grand Total
1 2 3 4 5 6 7 8 9 10 11 12 13 14
Mobilisation of Funds
2012-13 58,62,749 58,175 7,022 59,27,947 6,98,358 8,230 NA 7,06,589 6,26,821 5,641 888 6,33,350 72,67,885
2013-14 79,12,853 1,21,634 14,909 80,49,397 9,01,807 14,377 166 9,16,351 7,92,865 8,356 1,130 8,02,352 97,68,100
Repurchases / Redemption
2012-13 57,76,161 80,387 6,297 58,62,845 6,86,483 13,131 166 6,99,781 6,21,562 5,067 2,092 6,28,720 71,91,346
2013-14 79,19,832 70,564 10,161 80,00,559 9,02,818 8,925 64 9,11,808 7,95,328 5,136 1,486 8,01,950 97,14,318
Net Inflow / Outflow of Funds
2012-13 86,588 -22,212 725 65,102 11,875 -4,901 -166 6,808 5,259 574 -1,204 4,629 76,539
2013-14 -6,979 51,069 4,748 48,838 -1,011 5,452 101 4,542 -2,463 3,220 -355 401 53,782
The highest percentage rise in the net resource mobilisation was in Fund of Funds investing overseas schemes which witnessed a net inflow of `1,101 crore in 2013-14 registering an increase in AUM of 55.3 percent. Liquid/Money market inflows have increased manifold to `24,098 crore in 2013-14 from `3,226 crore in 2012-13. Even as gold continues to emerge as a popular asset since 2008, Gold ETF schemes experienced an outflow of `2,293 crore on top of the decline of 61.2 percent observed in previous year. The AUM of Gold ETFs in 2013-14 declined to the extent of 25.5 percent in 2013-14 over the previous financial year.
During 2013-14, while open-ended schemes witnessed net outflows, the close ended schemes recorded positive net inflows.
Scheme-wise pattern reveals that net inflows were positive for all the scheme categories except growth/equity oriented schemes, balanced, gold ETF and Gilt Funds. The huge redemption pressure in growth schemes had resulted in largest net outflows amounting to `9,268 crore during the year (Table 2.43). Fixed income schemes registered the highest net inflows amounting to `63,339 crore in 2013-14.
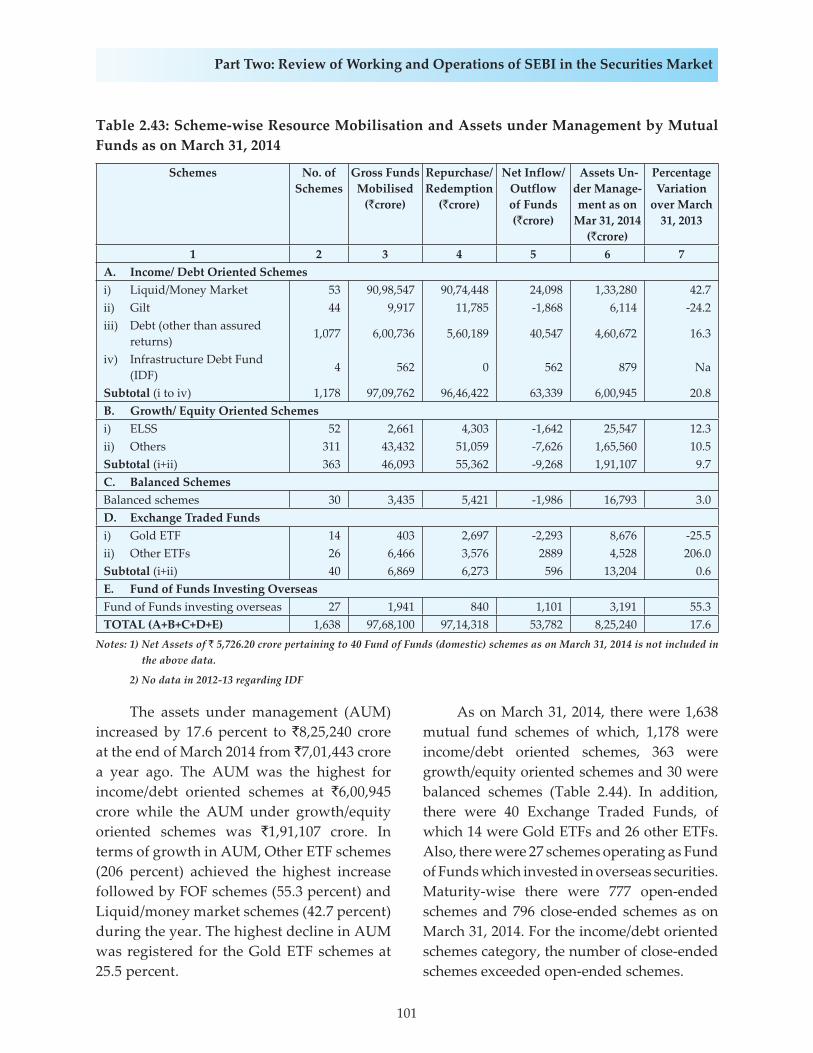
101
Part Two: Review of Working and Operations of SEBI in the Securities Market
Table 2.43: Scheme-wise Resource Mobilisation and Assets under Management by Mutual Funds as on March 31, 2014
Schemes No. of Schemes
Gross Funds Mobilised
(`crore)
Repurchase/Redemption
(`crore)
Net Inflow/ Outflow of Funds (`crore)
Assets Un-der Manage-ment as on
Mar 31, 2014 (`crore)
Percentage Variation
over March 31, 2013
1 2 3 4 5 6 7A. Income/ Debt Oriented Schemesi) Liquid/Money Market 53 90,98,547 90,74,448 24,098 1,33,280 42.7ii) Gilt 44 9,917 11,785 -1,868 6,114 -24.2iii) Debt (other than assured
returns) 1,077 6,00,736 5,60,189 40,547 4,60,672 16.3
iv) Infrastructure Debt Fund (IDF) 4 562 0 562 879 Na
Subtotal (i to iv) 1,178 97,09,762 96,46,422 63,339 6,00,945 20.8B. Growth/ Equity Oriented Schemesi) ELSS 52 2,661 4,303 -1,642 25,547 12.3ii) Others 311 43,432 51,059 -7,626 1,65,560 10.5Subtotal (i+ii) 363 46,093 55,362 -9,268 1,91,107 9.7C. Balanced Schemes Balanced schemes 30 3,435 5,421 -1,986 16,793 3.0D. Exchange Traded Fundsi) Gold ETF 14 403 2,697 -2,293 8,676 -25.5ii) Other ETFs 26 6,466 3,576 2889 4,528 206.0Subtotal (i+ii) 40 6,869 6,273 596 13,204 0.6E. Fund of Funds Investing Overseas Fund of Funds investing overseas 27 1,941 840 1,101 3,191 55.3TOTAL (A+B+C+D+E) 1,638 97,68,100 97,14,318 53,782 8,25,240 17.6
Notes: 1) Net Assets of ` 5,726.20 crore pertaining to 40 Fund of Funds (domestic) schemes as on March 31, 2014 is not included in the above data.
2) No data in 2012-13 regarding IDF
The assets under management (AUM) increased by 17.6 percent to `8,25,240 crore at the end of March 2014 from `7,01,443 crore a year ago. The AUM was the highest for income/debt oriented schemes at `6,00,945 crore while the AUM under growth/equity oriented schemes was `1,91,107 crore. In terms of growth in AUM, Other ETF schemes (206 percent) achieved the highest increase followed by FOF schemes (55.3 percent) and Liquid/money market schemes (42.7 percent) during the year. The highest decline in AUM was registered for the Gold ETF schemes at 25.5 percent.
As on March 31, 2014, there were 1,638 mutual fund schemes of which, 1,178 were income/debt oriented schemes, 363 were growth/equity oriented schemes and 30 were balanced schemes (Table 2.44). In addition, there were 40 Exchange Traded Funds, of which 14 were Gold ETFs and 26 other ETFs. Also, there were 27 schemes operating as Fund of Funds which invested in overseas securities. Maturity-wise there were 777 open-ended schemes and 796 close-ended schemes as on March 31, 2014. For the income/debt oriented schemes category, the number of close-ended schemes exceeded open-ended schemes.
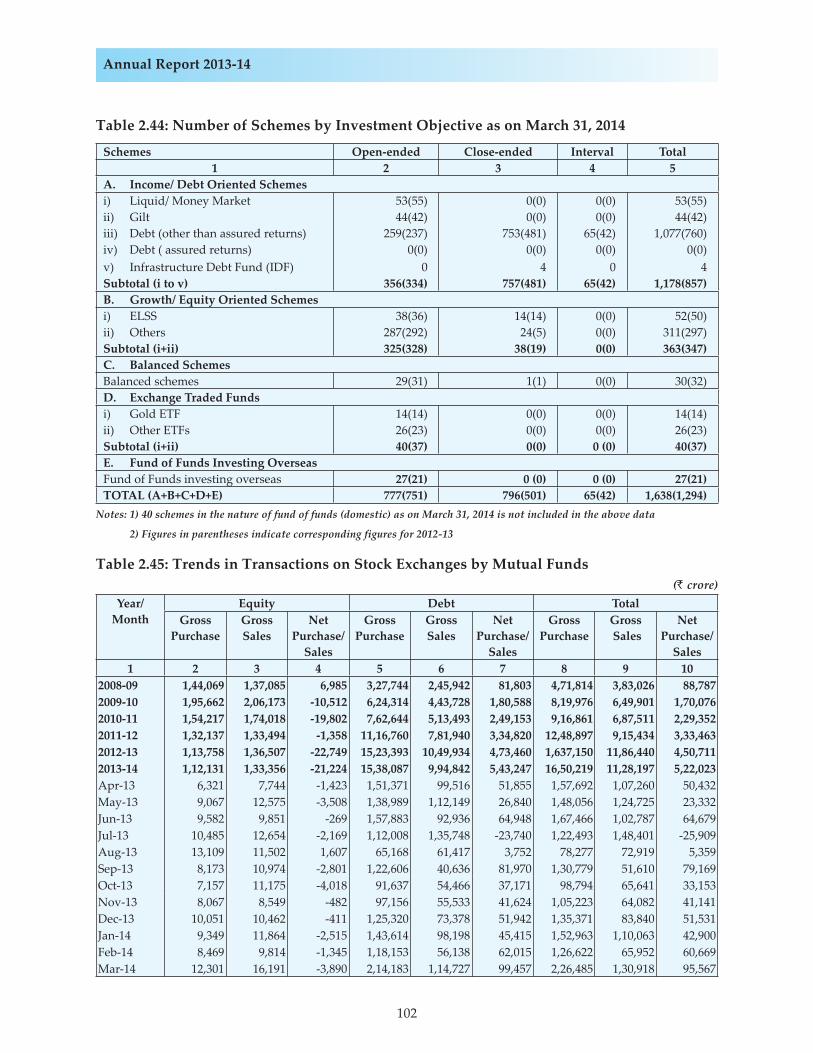
102
Annual Report 2013-14
Table 2.44: Number of Schemes by Investment Objective as on March 31, 2014
Schemes Open-ended Close-ended Interval Total1 2 3 4 5
A. Income/ Debt Oriented Schemesi) Liquid/ Money Market 53(55) 0(0) 0(0) 53(55)ii) Gilt 44(42) 0(0) 0(0) 44(42)iii) Debt (other than assured returns) 259(237) 753(481) 65(42) 1,077(760)iv) Debt ( assured returns) 0(0) 0(0) 0(0) 0(0)v) Infrastructure Debt Fund (IDF) 0 4 0 4Subtotal (i to v) 356(334) 757(481) 65(42) 1,178(857)B. Growth/ Equity Oriented Schemesi) ELSS 38(36) 14(14) 0(0) 52(50)ii) Others 287(292) 24(5) 0(0) 311(297)Subtotal (i+ii) 325(328) 38(19) 0(0) 363(347)C. Balanced Schemes Balanced schemes 29(31) 1(1) 0(0) 30(32)D. Exchange Traded Fundsi) Gold ETF 14(14) 0(0) 0(0) 14(14)ii) Other ETFs 26(23) 0(0) 0(0) 26(23)Subtotal (i+ii) 40(37) 0(0) 0 (0) 40(37)E. Fund of Funds Investing Overseas Fund of Funds investing overseas 27(21) 0 (0) 0 (0) 27(21)TOTAL (A+B+C+D+E) 777(751) 796(501) 65(42) 1,638(1,294)
Notes: 1) 40 schemes in the nature of fund of funds (domestic) as on March 31, 2014 is not included in the above data
2) Figures in parentheses indicate corresponding figures for 2012-13
Table 2.45: Trends in Transactions on Stock Exchanges by Mutual Funds(` crore)
Year/ Month
Equity Debt TotalGross
PurchaseGrossSales
NetPurchase/
Sales
GrossPurchase
GrossSales
Net Purchase/
Sales
GrossPurchase
Gross Sales
Net Purchase/
Sales1 2 3 4 5 6 7 8 9 10
2008-09 1,44,069 1,37,085 6,985 3,27,744 2,45,942 81,803 4,71,814 3,83,026 88,7872009-10 1,95,662 2,06,173 -10,512 6,24,314 4,43,728 1,80,588 8,19,976 6,49,901 1,70,0762010-11 1,54,217 1,74,018 -19,802 7,62,644 5,13,493 2,49,153 9,16,861 6,87,511 2,29,3522011-12 1,32,137 1,33,494 -1,358 11,16,760 7,81,940 3,34,820 12,48,897 9,15,434 3,33,4632012-13 1,13,758 1,36,507 -22,749 15,23,393 10,49,934 4,73,460 1,637,150 11,86,440 4,50,7112013-14 1,12,131 1,33,356 -21,224 15,38,087 9,94,842 5,43,247 16,50,219 11,28,197 5,22,023Apr-13 6,321 7,744 -1,423 1,51,371 99,516 51,855 1,57,692 1,07,260 50,432May-13 9,067 12,575 -3,508 1,38,989 1,12,149 26,840 1,48,056 1,24,725 23,332Jun-13 9,582 9,851 -269 1,57,883 92,936 64,948 1,67,466 1,02,787 64,679Jul-13 10,485 12,654 -2,169 1,12,008 1,35,748 -23,740 1,22,493 1,48,401 -25,909Aug-13 13,109 11,502 1,607 65,168 61,417 3,752 78,277 72,919 5,359Sep-13 8,173 10,974 -2,801 1,22,606 40,636 81,970 1,30,779 51,610 79,169Oct-13 7,157 11,175 -4,018 91,637 54,466 37,171 98,794 65,641 33,153Nov-13 8,067 8,549 -482 97,156 55,533 41,624 1,05,223 64,082 41,141Dec-13 10,051 10,462 -411 1,25,320 73,378 51,942 1,35,371 83,840 51,531Jan-14 9,349 11,864 -2,515 1,43,614 98,198 45,415 1,52,963 1,10,063 42,900Feb-14 8,469 9,814 -1,345 1,18,153 56,138 62,015 1,26,622 65,952 60,669Mar-14 12,301 16,191 -3,890 2,14,183 1,14,727 99,457 2,26,485 1,30,918 95,567
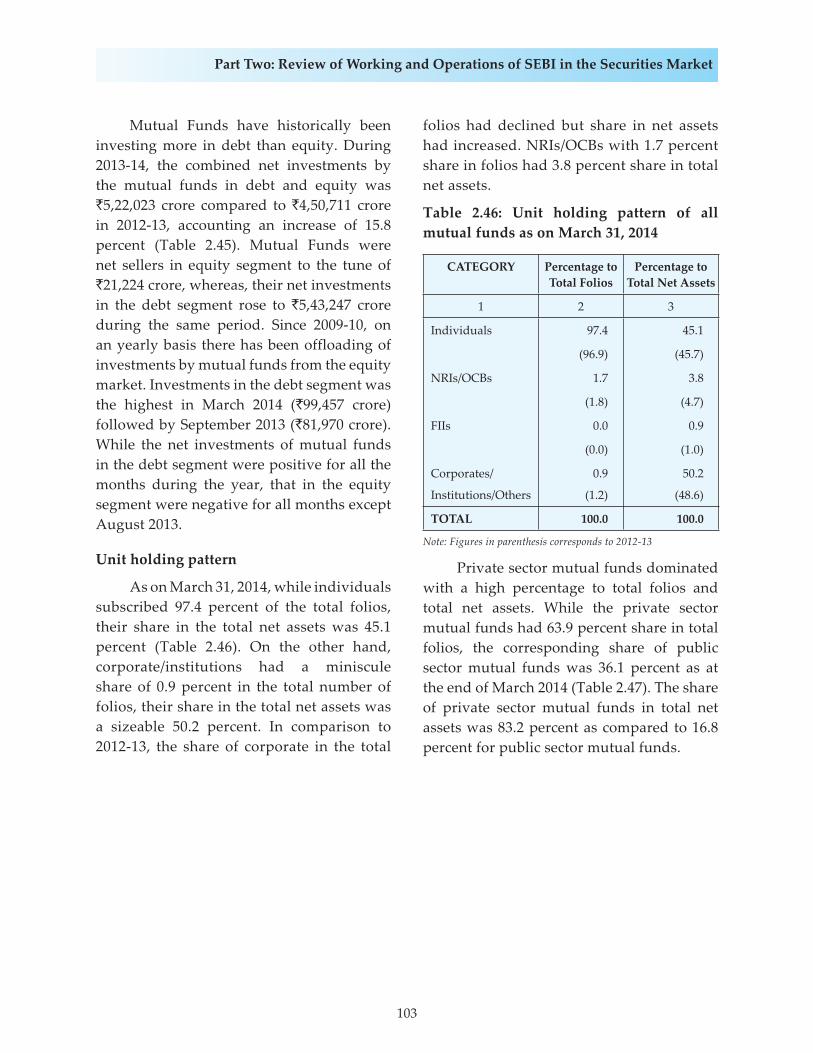
103
Part Two: Review of Working and Operations of SEBI in the Securities Market
Mutual Funds have historically been investing more in debt than equity. During 2013-14, the combined net investments by the mutual funds in debt and equity was `5,22,023 crore compared to `4,50,711 crore in 2012-13, accounting an increase of 15.8 percent (Table 2.45). Mutual Funds were net sellers in equity segment to the tune of `21,224 crore, whereas, their net investments in the debt segment rose to `5,43,247 crore during the same period. Since 2009-10, on an yearly basis there has been offloading of investments by mutual funds from the equity market. Investments in the debt segment was the highest in March 2014 (`99,457 crore) followed by September 2013 (`81,970 crore). While the net investments of mutual funds in the debt segment were positive for all the months during the year, that in the equity segment were negative for all months except August 2013.
Unit holding pattern
As on March 31, 2014, while individuals subscribed 97.4 percent of the total folios, their share in the total net assets was 45.1 percent (Table 2.46). On the other hand, corporate/institutions had a miniscule share of 0.9 percent in the total number of folios, their share in the total net assets was a sizeable 50.2 percent. In comparison to 2012-13, the share of corporate in the total
folios had declined but share in net assets had increased. NRIs/OCBs with 1.7 percent share in folios had 3.8 percent share in total net assets.
Table 2.46: Unit holding pattern of all mutual funds as on March 31, 2014
CATEGORY Percentage to Total Folios
Percentage to Total Net Assets
1 2 3
Individuals 97.4 45.1
(96.9) (45.7)
NRIs/OCBs 1.7 3.8
(1.8) (4.7)
FIIs 0.0 0.9
(0.0) (1.0)
Corporates/
Institutions/Others
0.9
(1.2)
50.2
(48.6)
TOTAL 100.0 100.0
Note: Figures in parenthesis corresponds to 2012-13
Private sector mutual funds dominated with a high percentage to total folios and total net assets. While the private sector mutual funds had 63.9 percent share in total folios, the corresponding share of public sector mutual funds was 36.1 percent as at the end of March 2014 (Table 2.47). The share of private sector mutual funds in total net assets was 83.2 percent as compared to 16.8 percent for public sector mutual funds.
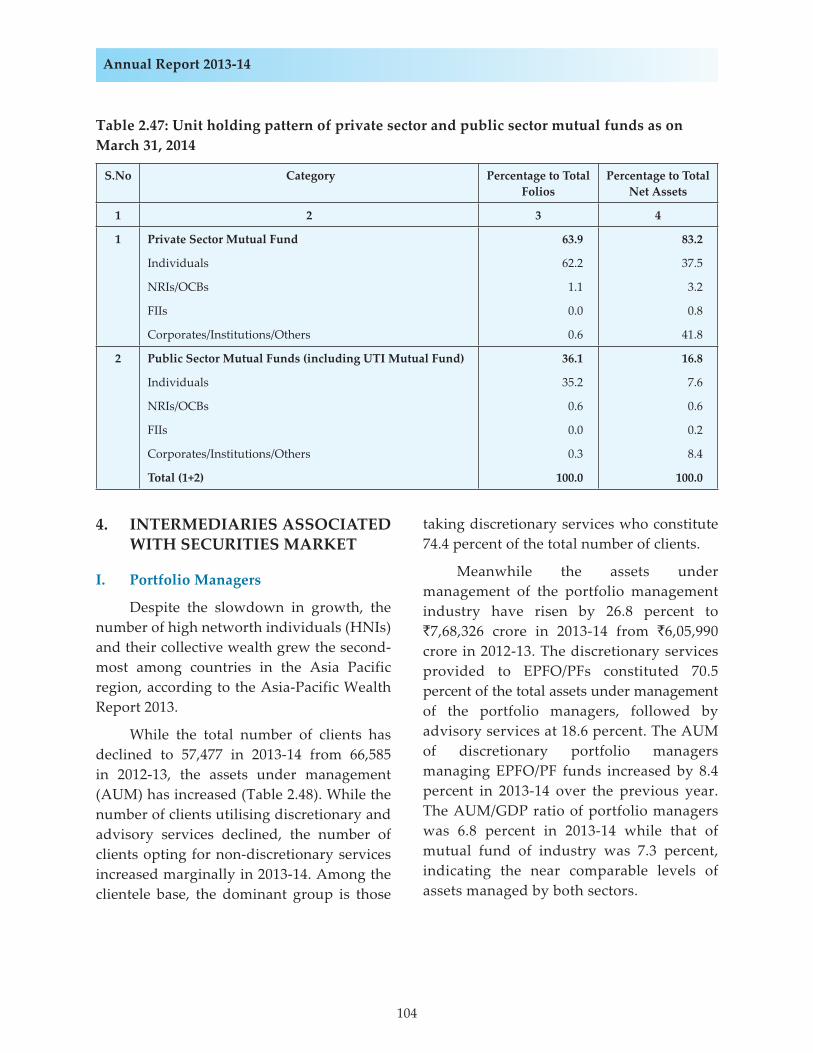
104
Annual Report 2013-14
4. INTERMEDIARIES ASSOCIATED WITH SECURITIES MARKET
I. Portfolio Managers
Despite the slowdown in growth, the number of high networth individuals (HNIs) and their collective wealth grew the second-most among countries in the Asia Pacific region, according to the Asia-Pacific Wealth Report 2013.
While the total number of clients has declined to 57,477 in 2013-14 from 66,585 in 2012-13, the assets under management (AUM) has increased (Table 2.48). While the number of clients utilising discretionary and advisory services declined, the number of clients opting for non-discretionary services increased marginally in 2013-14. Among the clientele base, the dominant group is those
Table 2.47: Unit holding pattern of private sector and public sector mutual funds as on March 31, 2014
S.No Category Percentage to Total Folios
Percentage to Total Net Assets
1 2 3 4
1 Private Sector Mutual Fund 63.9 83.2
Individuals 62.2 37.5
NRIs/OCBs 1.1 3.2
FIIs 0.0 0.8
Corporates/Institutions/Others 0.6 41.8
2 Public Sector Mutual Funds (including UTI Mutual Fund) 36.1 16.8
Individuals 35.2 7.6
NRIs/OCBs 0.6 0.6
FIIs 0.0 0.2
Corporates/Institutions/Others 0.3 8.4
Total (1+2) 100.0 100.0
taking discretionary services who constitute 74.4 percent of the total number of clients.
Meanwhile the assets under management of the portfolio management industry have risen by 26.8 percent to `7,68,326 crore in 2013-14 from `6,05,990 crore in 2012-13. The discretionary services provided to EPFO/PFs constituted 70.5 percent of the total assets under management of the portfolio managers, followed by advisory services at 18.6 percent. The AUM of discretionary portfolio managers managing EPFO/PF funds increased by 8.4 percent in 2013-14 over the previous year. The AUM/GDP ratio of portfolio managers was 6.8 percent in 2013-14 while that of mutual fund of industry was 7.3 percent, indicating the near comparable levels of assets managed by both sectors.
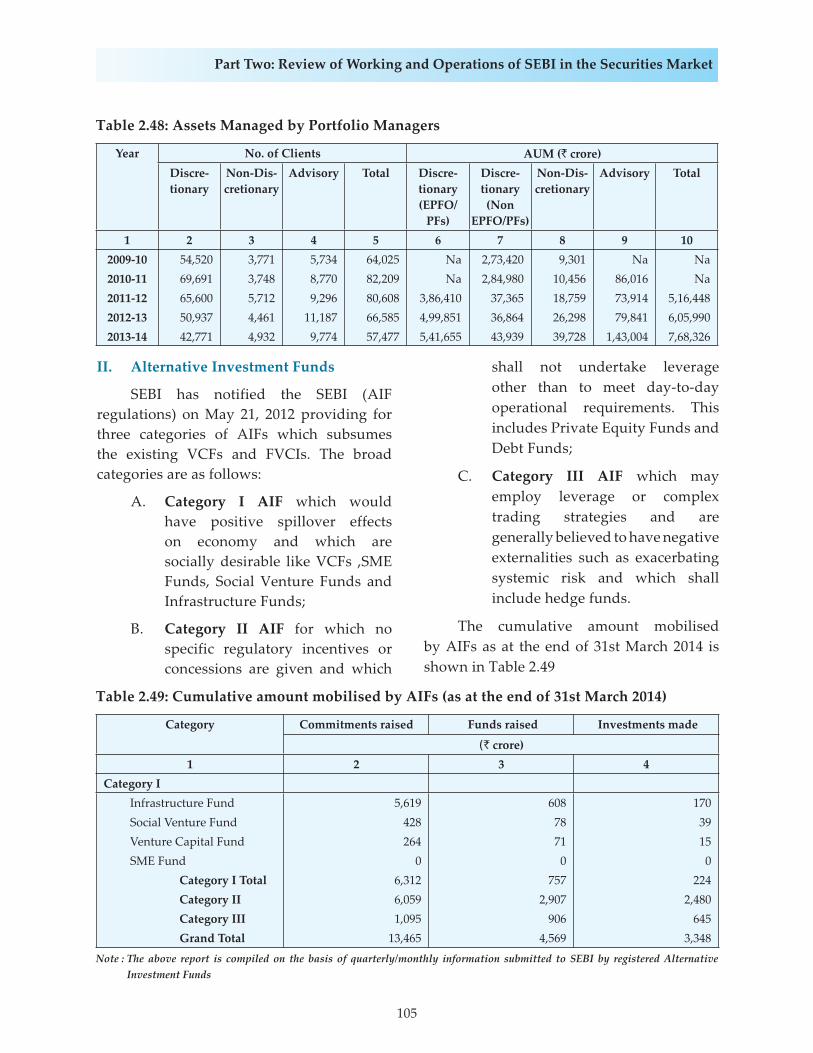
105
Part Two: Review of Working and Operations of SEBI in the Securities Market
II. Alternative Investment Funds
SEBI has notified the SEBI (AIF regulations) on May 21, 2012 providing for three categories of AIFs which subsumes the existing VCFs and FVCIs. The broad categories are as follows:
A. Category I AIF which would have positive spillover effects on economy and which are socially desirable like VCFs ,SME Funds, Social Venture Funds and Infrastructure Funds;
B. Category II AIF for which no specific regulatory incentives or concessions are given and which
shall not undertake leverage other than to meet day-to-day operational requirements. This includes Private Equity Funds and Debt Funds;
C. Category III AIF which may employ leverage or complex trading strategies and are generally believed to have negative externalities such as exacerbating systemic risk and which shall include hedge funds.
The cumulative amount mobilised by AIFs as at the end of 31st March 2014 is shown in Table 2.49
Table 2.48: Assets Managed by Portfolio Managers
Year No. of Clients AUM (` crore)Discre-tionary
Non-Dis-cretionary
Advisory Total Discre-tionary (EPFO/
PFs)
Discre-tionary (Non
EPFO/PFs)
Non-Dis-cretionary
Advisory Total
1 2 3 4 5 6 7 8 9 102009-10 54,520 3,771 5,734 64,025 Na 2,73,420 9,301 Na Na2010-11 69,691 3,748 8,770 82,209 Na 2,84,980 10,456 86,016 Na2011-12 65,600 5,712 9,296 80,608 3,86,410 37,365 18,759 73,914 5,16,4482012-13 50,937 4,461 11,187 66,585 4,99,851 36,864 26,298 79,841 6,05,9902013-14 42,771 4,932 9,774 57,477 5,41,655 43,939 39,728 1,43,004 7,68,326
Table 2.49: Cumulative amount mobilised by AIFs (as at the end of 31st March 2014)
Category Commitments raised Funds raised Investments made
(` crore)1 2 3 4
Category I Infrastructure Fund 5,619 608 170 Social Venture Fund 428 78 39 Venture Capital Fund 264 71 15 SME Fund 0 0 0 Category I Total 6,312 757 224 Category II 6,059 2,907 2,480 Category III 1,095 906 645 Grand Total 13,465 4,569 3,348
Note : The above report is compiled on the basis of quarterly/monthly information submitted to SEBI by registered Alternative Investment Funds
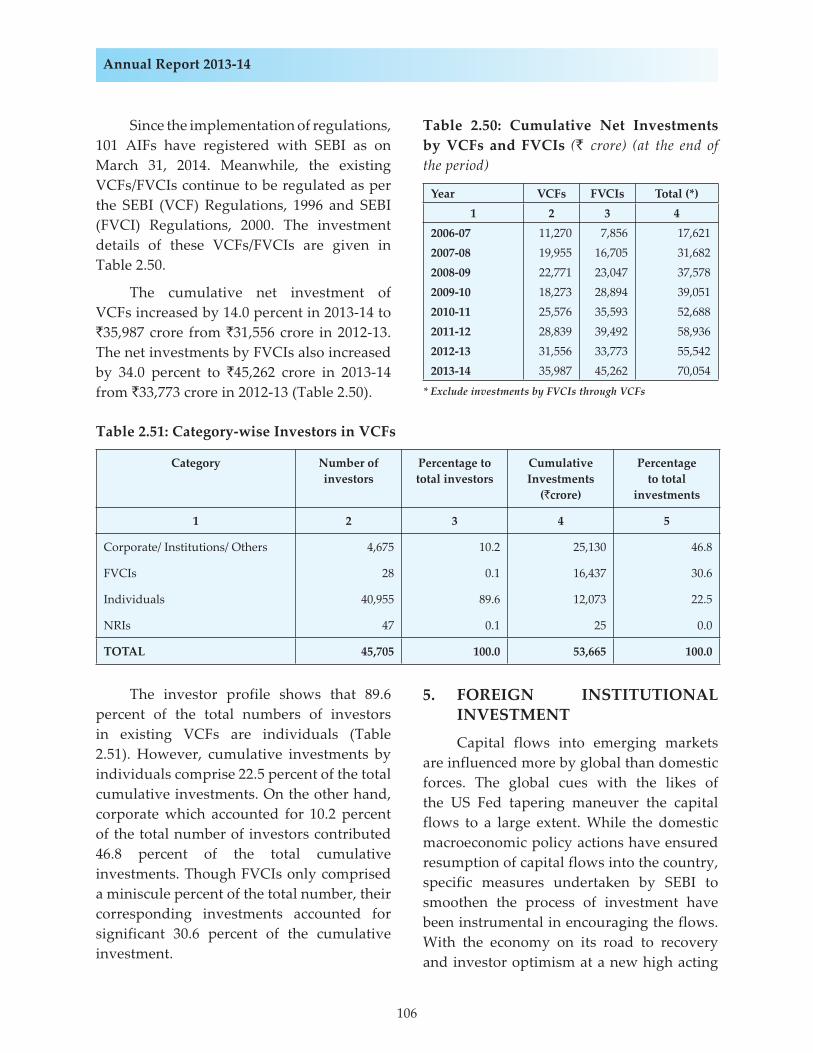
106
Annual Report 2013-14
The investor profile shows that 89.6 percent of the total numbers of investors in existing VCFs are individuals (Table 2.51). However, cumulative investments by individuals comprise 22.5 percent of the total cumulative investments. On the other hand, corporate which accounted for 10.2 percent of the total number of investors contributed 46.8 percent of the total cumulative investments. Though FVCIs only comprised a miniscule percent of the total number, their corresponding investments accounted for significant 30.6 percent of the cumulative investment.
5. FOREIGN INSTITUTIONAL INVESTMENT
Capital flows into emerging markets are influenced more by global than domestic forces. The global cues with the likes of the US Fed tapering maneuver the capital flows to a large extent. While the domestic macroeconomic policy actions have ensured resumption of capital flows into the country, specific measures undertaken by SEBI to smoothen the process of investment have been instrumental in encouraging the flows. With the economy on its road to recovery and investor optimism at a new high acting
Since the implementation of regulations, 101 AIFs have registered with SEBI as on March 31, 2014. Meanwhile, the existing VCFs/FVCIs continue to be regulated as per the SEBI (VCF) Regulations, 1996 and SEBI (FVCI) Regulations, 2000. The investment details of these VCFs/FVCIs are given in Table 2.50.
The cumulative net investment of VCFs increased by 14.0 percent in 2013-14 to `35,987 crore from `31,556 crore in 2012-13. The net investments by FVCIs also increased by 34.0 percent to `45,262 crore in 2013-14 from `33,773 crore in 2012-13 (Table 2.50).
Table 2.50: Cumulative Net Investments by VCFs and FVCIs (` crore) (at the end of the period)
Year VCFs FVCIs Total (*)1 2 3 4
2006-07 11,270 7,856 17,6212007-08 19,955 16,705 31,6822008-09 22,771 23,047 37,5782009-10 18,273 28,894 39,0512010-11 25,576 35,593 52,6882011-12 28,839 39,492 58,9362012-13 31,556 33,773 55,5422013-14 35,987 45,262 70,054
* Exclude investments by FVCIs through VCFs
Table 2.51: Category-wise Investors in VCFs
Category Number of investors
Percentage to total investors
Cumulative Investments
(`crore)
Percentage to total
investments
1 2 3 4 5
Corporate/ Institutions/ Others 4,675 10.2 25,130 46.8
FVCIs 28 0.1 16,437 30.6
Individuals 40,955 89.6 12,073 22.5
NRIs 47 0.1 25 0.0
TOTAL 45,705 100.0 53,665 100.0

107
Part Two: Review of Working and Operations of SEBI in the Securities Market
as enablers, the conditions seem encouraging for the flow of foreign capital.
FII investments into India have grown remarkably since 2009-10. India received a total FII net investments of `51,649 crore during 2013-14 compared to `1,68,367 crore in 2012-13, showing a decline of 69.3 percent. In US dollar terms, the net investments amounted to USD 8,876 million in 2013-14. The combined gross purchases of debt and
equity by FIIs increased by 12.8 percent to `10,21,010 crore in 2013-14 from `9,04,845 crore in 2012-13 (Table 2.52). The combined gross sales by FIIs increased by 31.6 percent to `9,69,361 crore from `7,36,481 crore during the same period in previous year. The cumulative net investment of FIIs in Indian markets amounted to USD 180,405 million as at the end of March 2014 compared to USD 171,529 million in 2012-13, registering an increase of 5.2 percent.
Table 2.52: Investment by Foreign Institutional lnvestors
Year Gross Purchase(` crore)
Gross Sales(` crore)
Net Investment(` crore)
Net Investment (USD mn.)
Cumulative Investment (USD mn.)
1 2 3 4 5 61992-93 18 4 13 4 41993-94 5,593 467 5,127 1,634 1,6381994-95 7,631 2,835 4,796 1,528 3,1671995-96 9,694 2,752 6,942 2,036 5,2021996-97 15,554 6,980 8,575 2,432 7,6351997-98 18,695 12,737 5,958 1,650 9,2851998-99 16,116 17,699 -1,584 -386 8,8991999-00 56,857 46,735 10,122 2,474 11,3732000-01 74,051 64,118 9,933 2,160 13,5322001-02 50,071 41,308 8,763 1,839 15,3722002-03 47,062 44,372 2,689 566 15,9372003-04 1,44,855 99,091 45,764 10,005 25,9432004-05 2,16,951 1,71,071 45,880 10,352 36,2942005-06 3,46,976 3,05,509 41,467 9,363 45,6572006-07 5,20,506 4,89,665 30,841 6,820 52,4772007-08 9,48,018 8,81,839 66,179 16,442 68,9192008-09 6,14,576 6,60,386 -45,811 -9,837 59,0812009-10 8,46,438 7,03,780 1,42,658 30,251 89,3332010-11 9,92,599 8,46,161 1,46,438 32,226 121,5592011-12 9,21,285 8,27,562 93,725 18,923 140,4822012-13 9,04,845 7,36,481 1,68,367 31,047 171,5292013-14 10,21,010 9,69,361 51,649 8,876 180,405
An analysis of the FII net investments reveal that the majority is invested in equity. This has been the trend over the years except 2011-12. In 2013-14, the FII net investments into equity segment declined by 43.1 percent
to `79,708 crore from `1,40,033 crore in 2012-13 (Table 2.53). In the debt segment, the FII net investments was {`28,061} crore in 2013-14 as compared to `28,334 crore in 2012-13.
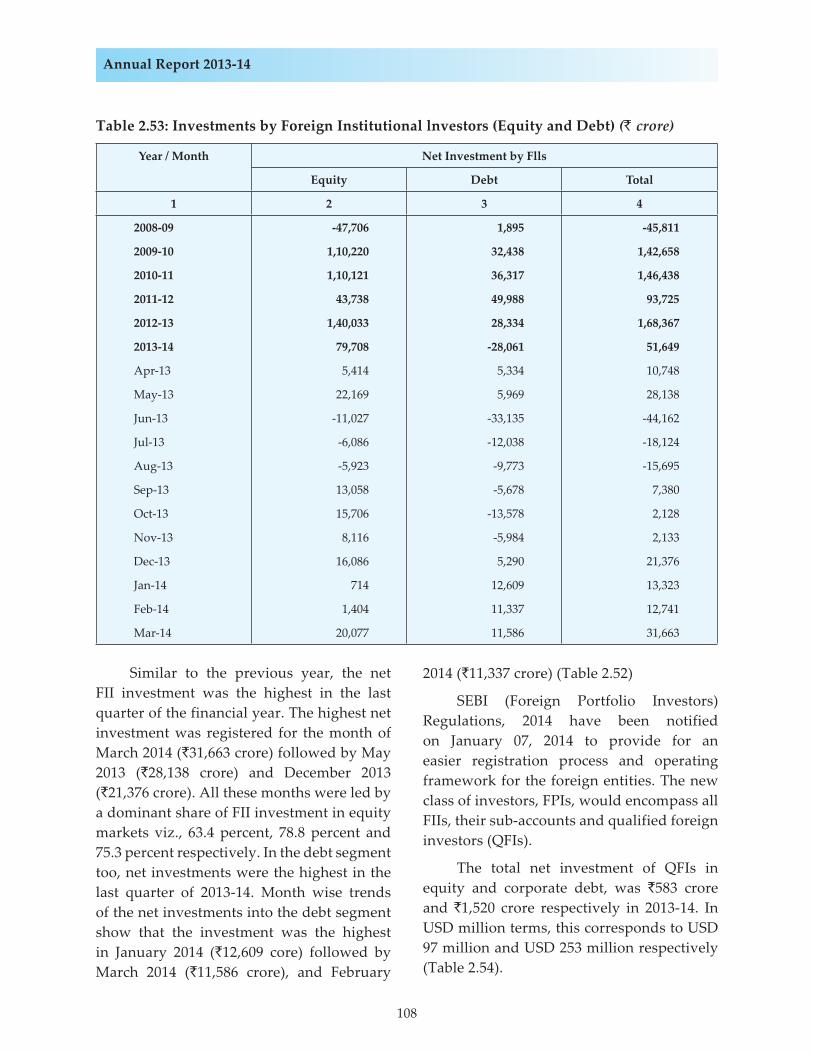
108
Annual Report 2013-14
Table 2.53: Investments by Foreign Institutional lnvestors (Equity and Debt) (` crore)
Year / Month Net Investment by Flls
Equity Debt Total
1 2 3 4
2008-09 -47,706 1,895 -45,811
2009-10 1,10,220 32,438 1,42,658
2010-11 1,10,121 36,317 1,46,438
2011-12 43,738 49,988 93,725
2012-13 1,40,033 28,334 1,68,367
2013-14 79,708 -28,061 51,649
Apr-13 5,414 5,334 10,748
May-13 22,169 5,969 28,138
Jun-13 -11,027 -33,135 -44,162
Jul-13 -6,086 -12,038 -18,124
Aug-13 -5,923 -9,773 -15,695
Sep-13 13,058 -5,678 7,380
Oct-13 15,706 -13,578 2,128
Nov-13 8,116 -5,984 2,133
Dec-13 16,086 5,290 21,376
Jan-14 714 12,609 13,323
Feb-14 1,404 11,337 12,741
Mar-14 20,077 11,586 31,663
Similar to the previous year, the net FII investment was the highest in the last quarter of the financial year. The highest net investment was registered for the month of March 2014 (`31,663 crore) followed by May 2013 (`28,138 crore) and December 2013 (`21,376 crore). All these months were led by a dominant share of FII investment in equity markets viz., 63.4 percent, 78.8 percent and 75.3 percent respectively. In the debt segment too, net investments were the highest in the last quarter of 2013-14. Month wise trends of the net investments into the debt segment show that the investment was the highest in January 2014 (`12,609 core) followed by March 2014 (`11,586 crore), and February
2014 (`11,337 crore) (Table 2.52)
SEBI (Foreign Portfolio Investors) Regulations, 2014 have been notified on January 07, 2014 to provide for an easier registration process and operating framework for the foreign entities. The new class of investors, FPIs, would encompass all FIIs, their sub-accounts and qualified foreign investors (QFIs).
The total net investment of QFIs in equity and corporate debt, was `583 crore and `1,520 crore respectively in 2013-14. In USD million terms, this corresponds to USD 97 million and USD 253 million respectively (Table 2.54).
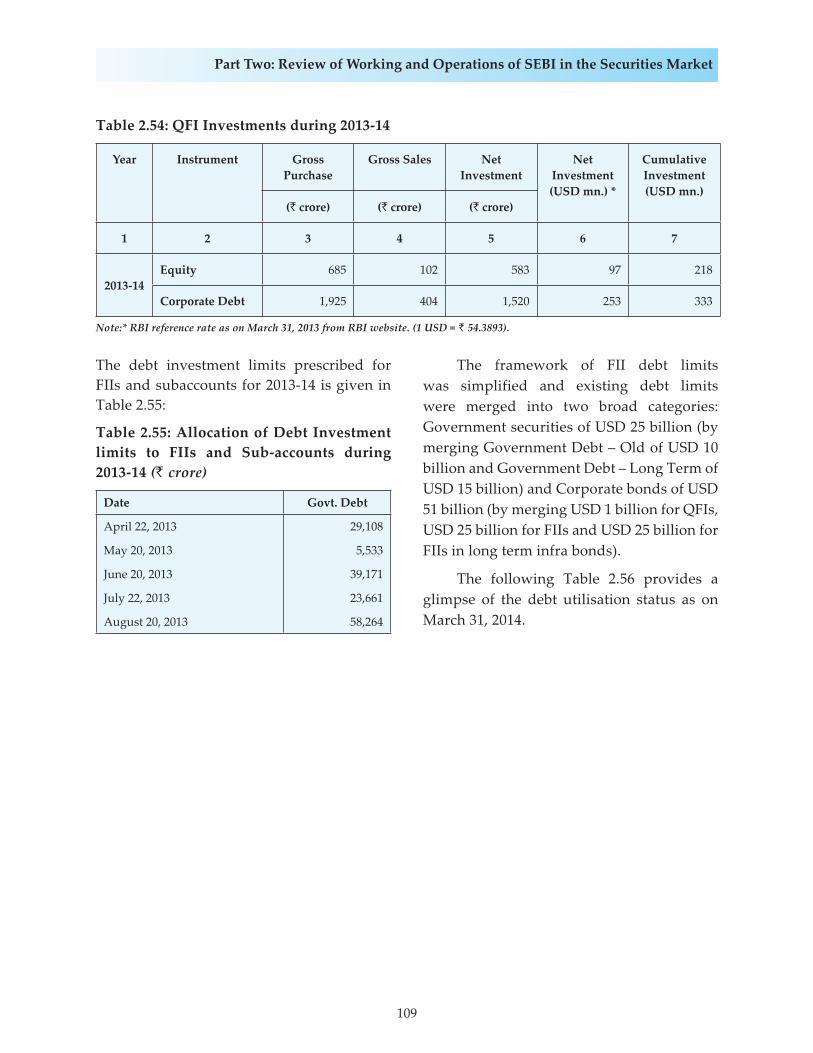
109
Part Two: Review of Working and Operations of SEBI in the Securities Market
Table 2.54: QFI Investments during 2013-14
Year Instrument Gross Purchase
Gross Sales Net Investment
Net Investment (USD mn.) *
Cumulative Investment (USD mn.)
(` crore) (` crore) (` crore)
1 2 3 4 5 6 7
2013-14Equity 685 102 583 97 218
Corporate Debt 1,925 404 1,520 253 333
Note:* RBI reference rate as on March 31, 2013 from RBI website. (1 USD = ` 54.3893).
The debt investment limits prescribed for FIIs and subaccounts for 2013-14 is given in Table 2.55:
Table 2.55: Allocation of Debt Investment limits to FIIs and Sub-accounts during 2013-14 (` crore)
Date Govt. Debt
April 22, 2013 29,108
May 20, 2013 5,533
June 20, 2013 39,171
July 22, 2013 23,661
August 20, 2013 58,264
The framework of FII debt limits was simplified and existing debt limits were merged into two broad categories: Government securities of USD 25 billion (by merging Government Debt – Old of USD 10 billion and Government Debt – Long Term of USD 15 billion) and Corporate bonds of USD 51 billion (by merging USD 1 billion for QFIs, USD 25 billion for FIIs and USD 25 billion for FIIs in long term infra bonds).
The following Table 2.56 provides a glimpse of the debt utilisation status as on March 31, 2014.
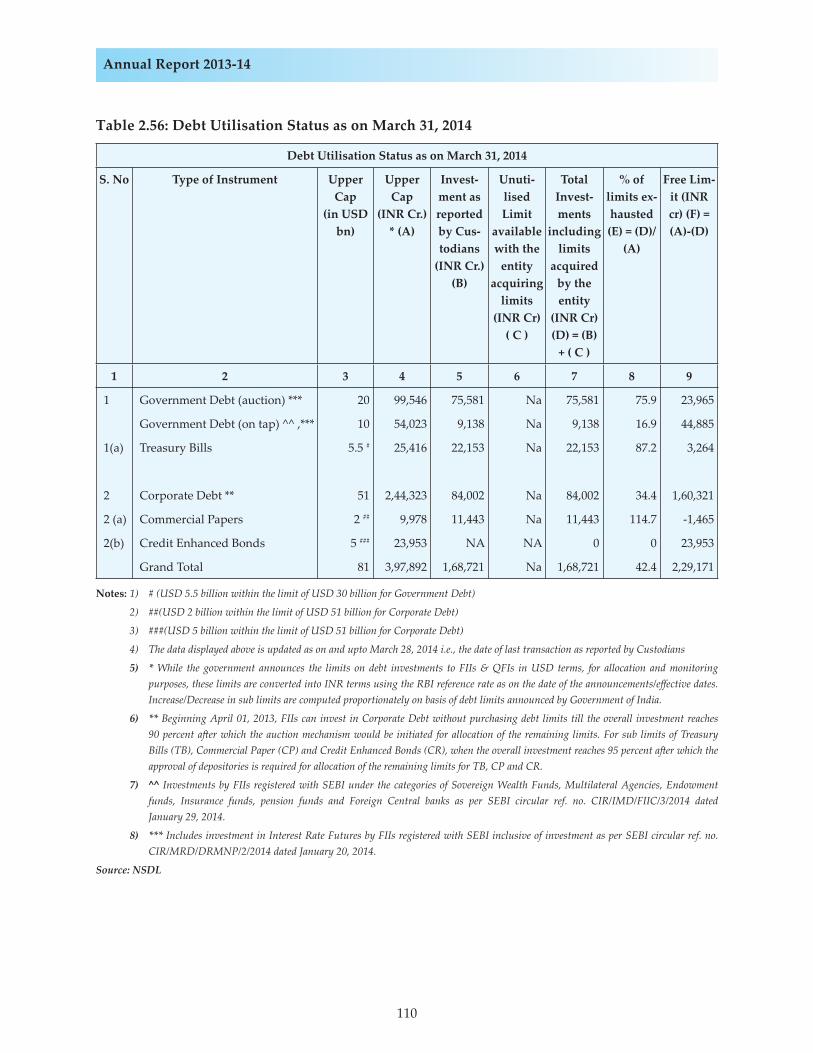
110
Annual Report 2013-14
Table 2.56: Debt Utilisation Status as on March 31, 2014
Debt Utilisation Status as on March 31, 2014
S. No Type of Instrument Upper Cap
(in USD bn)
Upper Cap
(INR Cr.) * (A)
Invest-ment as reported by Cus-todians
(INR Cr.) (B)
Unuti-lised Limit
available with the
entity acquiring
limits(INR Cr)
( C )
Total Invest-ments
including limits
acquired by the entity
(INR Cr) (D) = (B)
+ ( C )
% of limits ex-hausted (E) = (D)/
(A)
Free Lim-it (INR cr) (F) = (A)-(D)
1 2 3 4 5 6 7 8 9
1 Government Debt (auction) *** 20 99,546 75,581 Na 75,581 75.9 23,965
Government Debt (on tap) ^^ ,*** 10 54,023 9,138 Na 9,138 16.9 44,885
1(a) Treasury Bills 5.5 # 25,416 22,153 Na 22,153 87.2 3,264
2 Corporate Debt ** 51 2,44,323 84,002 Na 84,002 34.4 1,60,321
2 (a) Commercial Papers 2 ## 9,978 11,443 Na 11,443 114.7 -1,465
2(b) Credit Enhanced Bonds 5 ### 23,953 NA NA 0 0 23,953
Grand Total 81 3,97,892 1,68,721 Na 1,68,721 42.4 2,29,171
Notes: 1) # (USD 5.5 billion within the limit of USD 30 billion for Government Debt)
2) ##(USD 2 billion within the limit of USD 51 billion for Corporate Debt)
3) ###(USD 5 billion within the limit of USD 51 billion for Corporate Debt)
4) The data displayed above is updated as on and upto March 28, 2014 i.e., the date of last transaction as reported by Custodians
5) * While the government announces the limits on debt investments to FIIs & QFIs in USD terms, for allocation and monitoring purposes, these limits are converted into INR terms using the RBI reference rate as on the date of the announcements/eff ective dates. Increase/Decrease in sub limits are computed proportionately on basis of debt limits announced by Government of India.
6) ** Beginning April 01, 2013, FIIs can invest in Corporate Debt without purchasing debt limits till the overall investment reaches 90 percent a� er which the auction mechanism would be initiated for allocation of the remaining limits. For sub limits of Treasury Bills (TB), Commercial Paper (CP) and Credit Enhanced Bonds (CR), when the overall investment reaches 95 percent a� er which the approval of depositories is required for allocation of the remaining limits for TB, CP and CR.
7) ̂ ^ Investments by FIIs registered with SEBI under the categories of Sovereign Wealth Funds, Multilateral Agencies, Endowment funds, Insurance funds, pension funds and Foreign Central banks as per SEBI circular ref. no. CIR/IMD/FIIC/3/2014 dated January 29, 2014.
8) *** Includes investment in Interest Rate Futures by FIIs registered with SEBI inclusive of investment as per SEBI circular ref. no. CIR/MRD/DRMNP/2/2014 dated January 20, 2014.
Source: NSDL
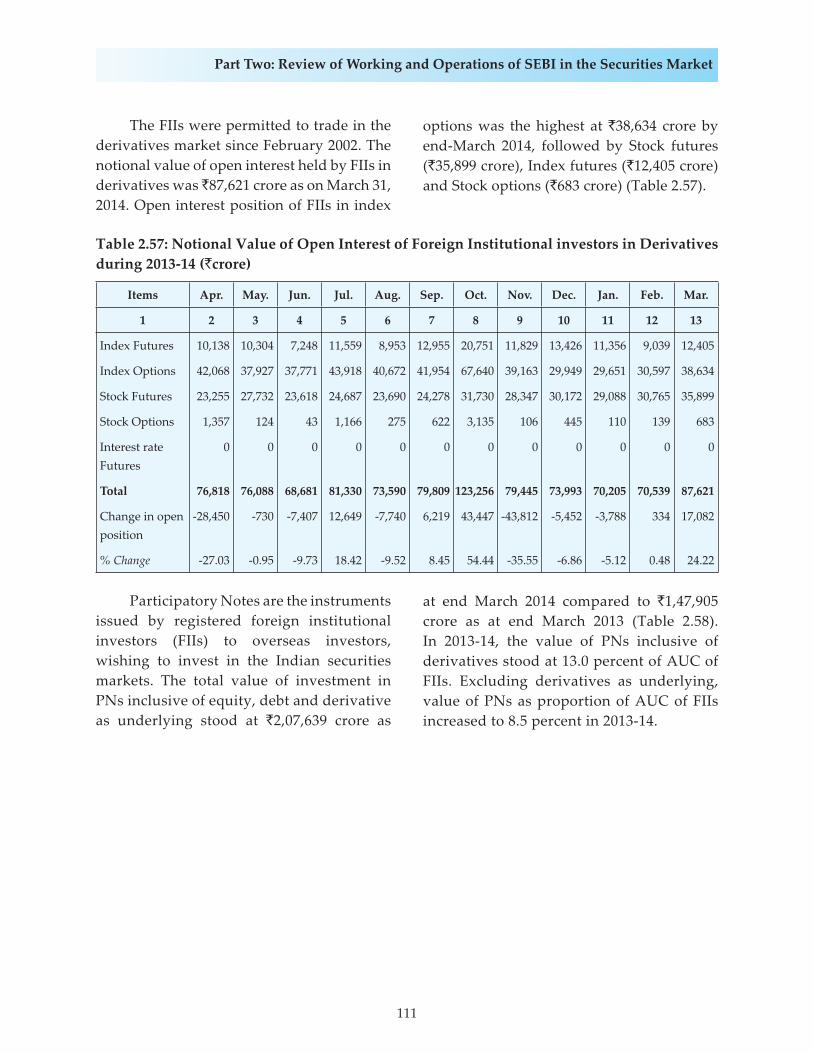
111
Part Two: Review of Working and Operations of SEBI in the Securities Market
Table 2.57: Notional Value of Open Interest of Foreign Institutional investors in Derivatives during 2013-14 (`crore)
Items Apr. May. Jun. Jul. Aug. Sep. Oct. Nov. Dec. Jan. Feb. Mar.
1 2 3 4 5 6 7 8 9 10 11 12 13
Index Futures 10,138 10,304 7,248 11,559 8,953 12,955 20,751 11,829 13,426 11,356 9,039 12,405
Index Options 42,068 37,927 37,771 43,918 40,672 41,954 67,640 39,163 29,949 29,651 30,597 38,634
Stock Futures 23,255 27,732 23,618 24,687 23,690 24,278 31,730 28,347 30,172 29,088 30,765 35,899
Stock Options 1,357 124 43 1,166 275 622 3,135 106 445 110 139 683
Interest rate Futures
0 0 0 0 0 0 0 0 0 0 0 0
Total 76,818 76,088 68,681 81,330 73,590 79,809 123,256 79,445 73,993 70,205 70,539 87,621
Change in open position
-28,450 -730 -7,407 12,649 -7,740 6,219 43,447 -43,812 -5,452 -3,788 334 17,082
% Change -27.03 -0.95 -9.73 18.42 -9.52 8.45 54.44 -35.55 -6.86 -5.12 0.48 24.22
The FIIs were permitted to trade in the derivatives market since February 2002. The notional value of open interest held by FIIs in derivatives was ̀ 87,621 crore as on March 31, 2014. Open interest position of FIIs in index
options was the highest at `38,634 crore by end-March 2014, followed by Stock futures (`35,899 crore), Index futures (`12,405 crore) and Stock options (`683 crore) (Table 2.57).
Participatory Notes are the instruments issued by registered foreign institutional investors (FIIs) to overseas investors, wishing to invest in the Indian securities markets. The total value of investment in PNs inclusive of equity, debt and derivative as underlying stood at `2,07,639 crore as
at end March 2014 compared to `1,47,905 crore as at end March 2013 (Table 2.58). In 2013-14, the value of PNs inclusive of derivatives stood at 13.0 percent of AUC of FIIs. Excluding derivatives as underlying, value of PNs as proportion of AUC of FIIs increased to 8.5 percent in 2013-14.
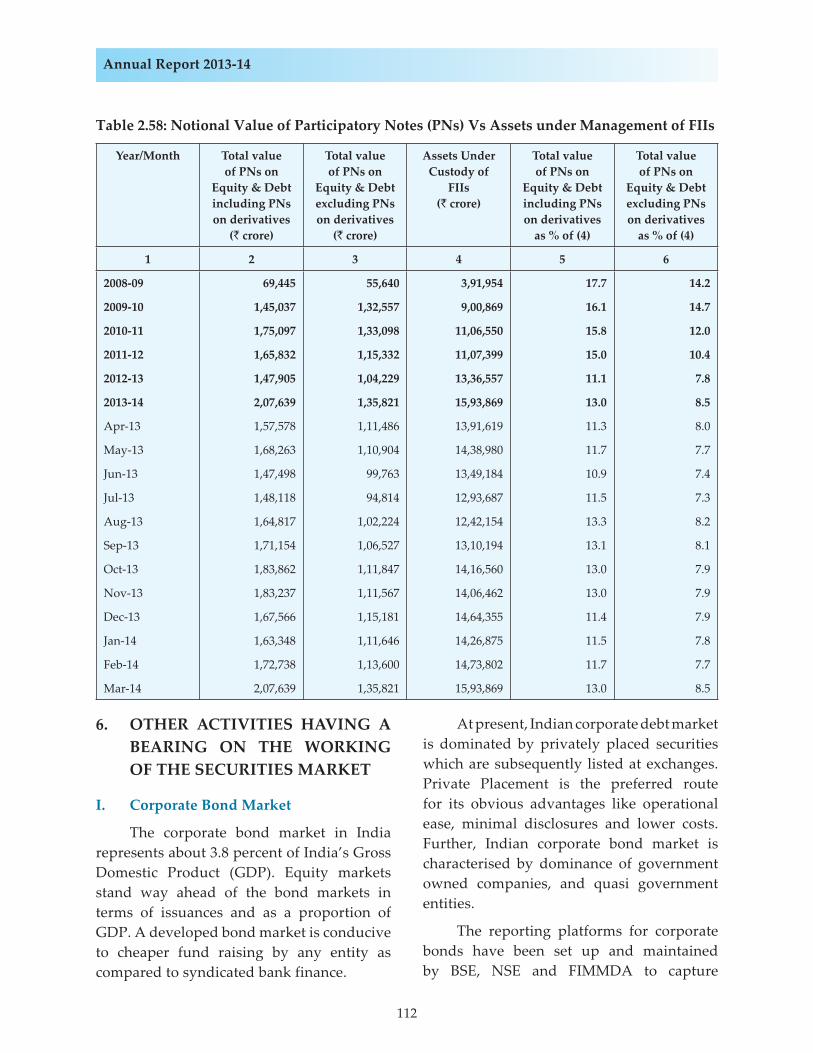
112
Annual Report 2013-14
Table 2.58: Notional Value of Participatory Notes (PNs) Vs Assets under Management of FIIs
Year/Month Total value of PNs on
Equity & Debt including PNs on derivatives
(` crore)
Total value of PNs on
Equity & Debt excluding PNs on derivatives
(` crore)
Assets Under Custody of
FIIs (` crore)
Total value of PNs on
Equity & Debt including PNs on derivatives
as % of (4)
Total value of PNs on
Equity & Debt excluding PNs on derivatives
as % of (4)
1 2 3 4 5 6
2008-09 69,445 55,640 3,91,954 17.7 14.2
2009-10 1,45,037 1,32,557 9,00,869 16.1 14.7
2010-11 1,75,097 1,33,098 11,06,550 15.8 12.0
2011-12 1,65,832 1,15,332 11,07,399 15.0 10.4
2012-13 1,47,905 1,04,229 13,36,557 11.1 7.8
2013-14 2,07,639 1,35,821 15,93,869 13.0 8.5
Apr-13 1,57,578 1,11,486 13,91,619 11.3 8.0
May-13 1,68,263 1,10,904 14,38,980 11.7 7.7
Jun-13 1,47,498 99,763 13,49,184 10.9 7.4
Jul-13 1,48,118 94,814 12,93,687 11.5 7.3
Aug-13 1,64,817 1,02,224 12,42,154 13.3 8.2
Sep-13 1,71,154 1,06,527 13,10,194 13.1 8.1
Oct-13 1,83,862 1,11,847 14,16,560 13.0 7.9
Nov-13 1,83,237 1,11,567 14,06,462 13.0 7.9
Dec-13 1,67,566 1,15,181 14,64,355 11.4 7.9
Jan-14 1,63,348 1,11,646 14,26,875 11.5 7.8
Feb-14 1,72,738 1,13,600 14,73,802 11.7 7.7
Mar-14 2,07,639 1,35,821 15,93,869 13.0 8.5
6. OTHER ACTIVITIES HAVING A BEARING ON THE WORKING OF THE SECURITIES MARKET
I. Corporate Bond Market
The corporate bond market in India represents about 3.8 percent of India’s Gross Domestic Product (GDP). Equity markets stand way ahead of the bond markets in terms of issuances and as a proportion of GDP. A developed bond market is conducive to cheaper fund raising by any entity as compared to syndicated bank finance.
At present, Indian corporate debt market is dominated by privately placed securities which are subsequently listed at exchanges. Private Placement is the preferred route for its obvious advantages like operational ease, minimal disclosures and lower costs. Further, Indian corporate bond market is characterised by dominance of government owned companies, and quasi government entities.
The reporting platforms for corporate bonds have been set up and maintained by BSE, NSE and FIMMDA to capture
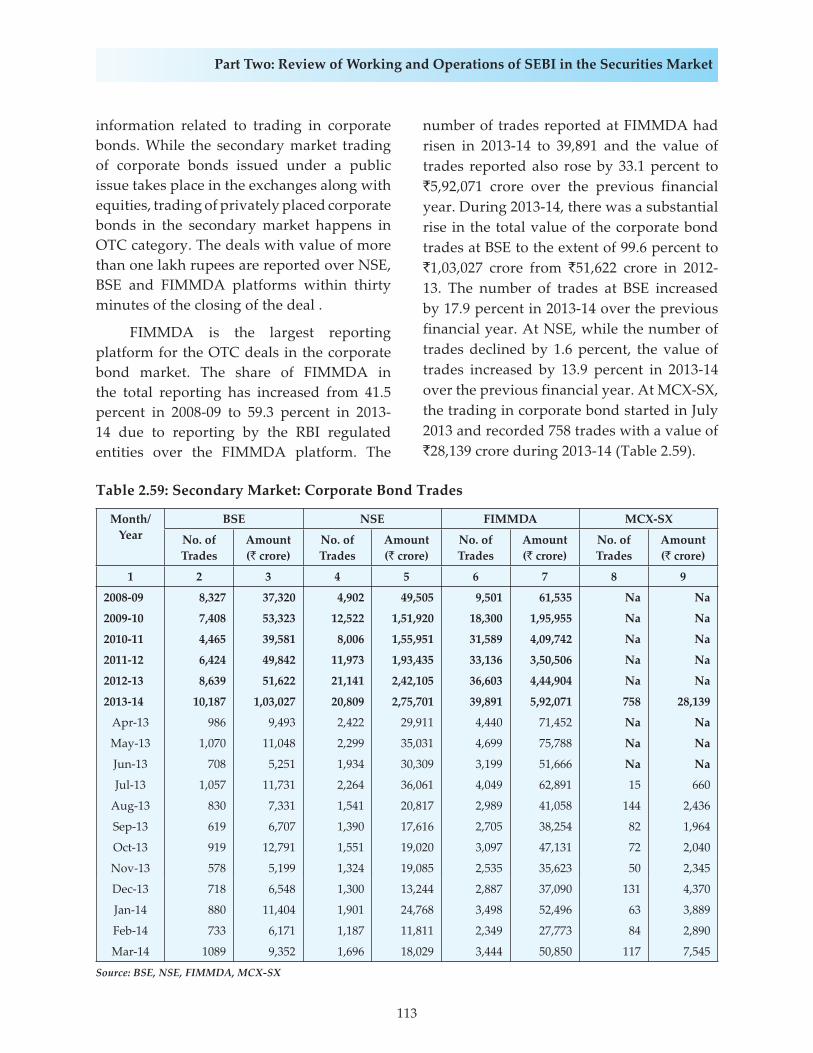
113
Part Two: Review of Working and Operations of SEBI in the Securities Market
information related to trading in corporate bonds. While the secondary market trading of corporate bonds issued under a public issue takes place in the exchanges along with equities, trading of privately placed corporate bonds in the secondary market happens in OTC category. The deals with value of more than one lakh rupees are reported over NSE, BSE and FIMMDA platforms within thirty minutes of the closing of the deal .
FIMMDA is the largest reporting platform for the OTC deals in the corporate bond market. The share of FIMMDA in the total reporting has increased from 41.5 percent in 2008-09 to 59.3 percent in 2013-14 due to reporting by the RBI regulated entities over the FIMMDA platform. The
number of trades reported at FIMMDA had risen in 2013-14 to 39,891 and the value of trades reported also rose by 33.1 percent to `5,92,071 crore over the previous financial year. During 2013-14, there was a substantial rise in the total value of the corporate bond trades at BSE to the extent of 99.6 percent to `1,03,027 crore from `51,622 crore in 2012-13. The number of trades at BSE increased by 17.9 percent in 2013-14 over the previous financial year. At NSE, while the number of trades declined by 1.6 percent, the value of trades increased by 13.9 percent in 2013-14 over the previous financial year. At MCX-SX, the trading in corporate bond started in July 2013 and recorded 758 trades with a value of `28,139 crore during 2013-14 (Table 2.59).
Table 2.59: Secondary Market: Corporate Bond Trades
Month/ Year
BSE NSE FIMMDA MCX-SX
No. of Trades
Amount(` crore)
No. of Trades
Amount (` crore)
No. of Trades
Amount(` crore)
No. of Trades
Amount (` crore)
1 2 3 4 5 6 7 8 9
2008-09 8,327 37,320 4,902 49,505 9,501 61,535 Na Na
2009-10 7,408 53,323 12,522 1,51,920 18,300 1,95,955 Na Na
2010-11 4,465 39,581 8,006 1,55,951 31,589 4,09,742 Na Na
2011-12 6,424 49,842 11,973 1,93,435 33,136 3,50,506 Na Na
2012-13 8,639 51,622 21,141 2,42,105 36,603 4,44,904 Na Na
2013-14 10,187 1,03,027 20,809 2,75,701 39,891 5,92,071 758 28,139
Apr-13 986 9,493 2,422 29,911 4,440 71,452 Na Na
May-13 1,070 11,048 2,299 35,031 4,699 75,788 Na Na
Jun-13 708 5,251 1,934 30,309 3,199 51,666 Na Na
Jul-13 1,057 11,731 2,264 36,061 4,049 62,891 15 660
Aug-13 830 7,331 1,541 20,817 2,989 41,058 144 2,436
Sep-13 619 6,707 1,390 17,616 2,705 38,254 82 1,964
Oct-13 919 12,791 1,551 19,020 3,097 47,131 72 2,040
Nov-13 578 5,199 1,324 19,085 2,535 35,623 50 2,345
Dec-13 718 6,548 1,300 13,244 2,887 37,090 131 4,370
Jan-14 880 11,404 1,901 24,768 3,498 52,496 63 3,889
Feb-14 733 6,171 1,187 11,811 2,349 27,773 84 2,890
Mar-14 1089 9,352 1,696 18,029 3,444 50,850 117 7,545
Source: BSE, NSE, FIMMDA, MCX-SX
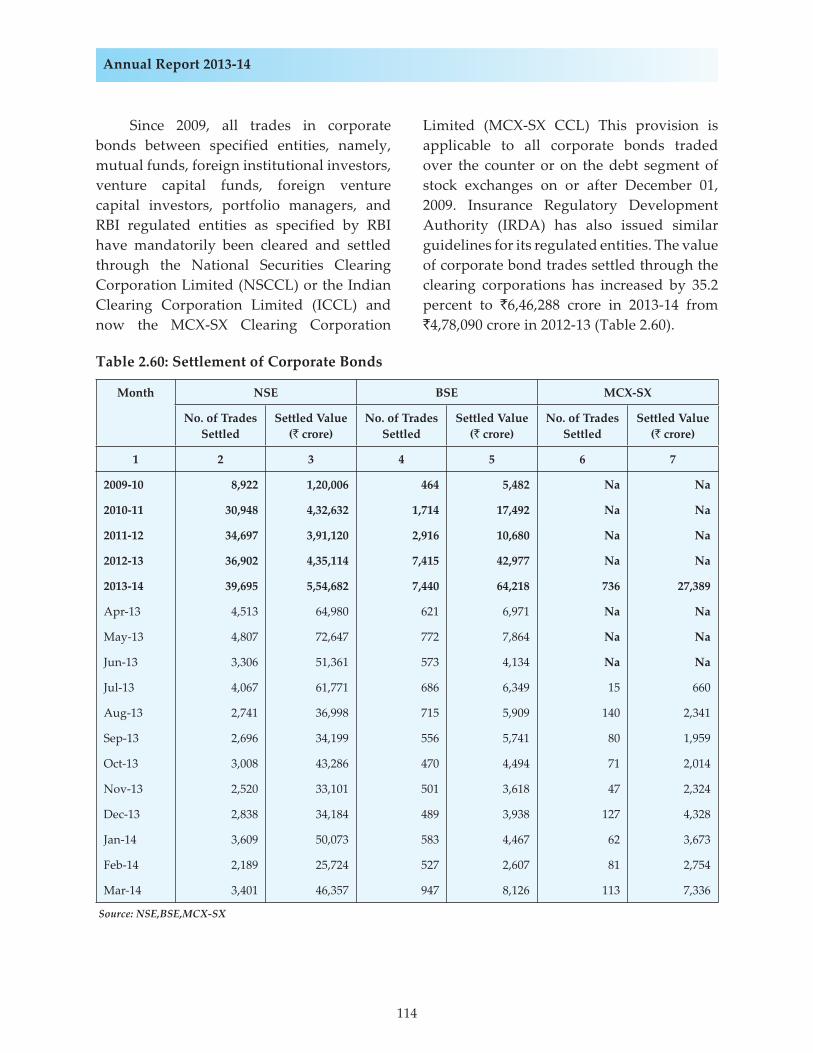
114
Annual Report 2013-14
Since 2009, all trades in corporate bonds between specified entities, namely, mutual funds, foreign institutional investors, venture capital funds, foreign venture capital investors, portfolio managers, and RBI regulated entities as specified by RBI have mandatorily been cleared and settled through the National Securities Clearing Corporation Limited (NSCCL) or the Indian Clearing Corporation Limited (ICCL) and now the MCX-SX Clearing Corporation
Limited (MCX-SX CCL) This provision is applicable to all corporate bonds traded over the counter or on the debt segment of stock exchanges on or after December 01, 2009. Insurance Regulatory Development Authority (IRDA) has also issued similar guidelines for its regulated entities. The value of corporate bond trades settled through the clearing corporations has increased by 35.2 percent to `6,46,288 crore in 2013-14 from `4,78,090 crore in 2012-13 (Table 2.60).
Table 2.60: Settlement of Corporate Bonds
Month NSE BSE MCX-SX
No. of Trades Settled
Settled Value (` crore)
No. of Trades Settled
Settled Value (` crore)
No. of Trades Settled
Settled Value (` crore)
1 2 3 4 5 6 7
2009-10 8,922 1,20,006 464 5,482 Na Na
2010-11 30,948 4,32,632 1,714 17,492 Na Na
2011-12 34,697 3,91,120 2,916 10,680 Na Na
2012-13 36,902 4,35,114 7,415 42,977 Na Na
2013-14 39,695 5,54,682 7,440 64,218 736 27,389
Apr-13 4,513 64,980 621 6,971 Na Na
May-13 4,807 72,647 772 7,864 Na Na
Jun-13 3,306 51,361 573 4,134 Na Na
Jul-13 4,067 61,771 686 6,349 15 660
Aug-13 2,741 36,998 715 5,909 140 2,341
Sep-13 2,696 34,199 556 5,741 80 1,959
Oct-13 3,008 43,286 470 4,494 71 2,014
Nov-13 2,520 33,101 501 3,618 47 2,324
Dec-13 2,838 34,184 489 3,938 127 4,328
Jan-14 3,609 50,073 583 4,467 62 3,673
Feb-14 2,189 25,724 527 2,607 81 2,754
Mar-14 3,401 46,357 947 8,126 113 7,336
Source: NSE,BSE,MCX-SX
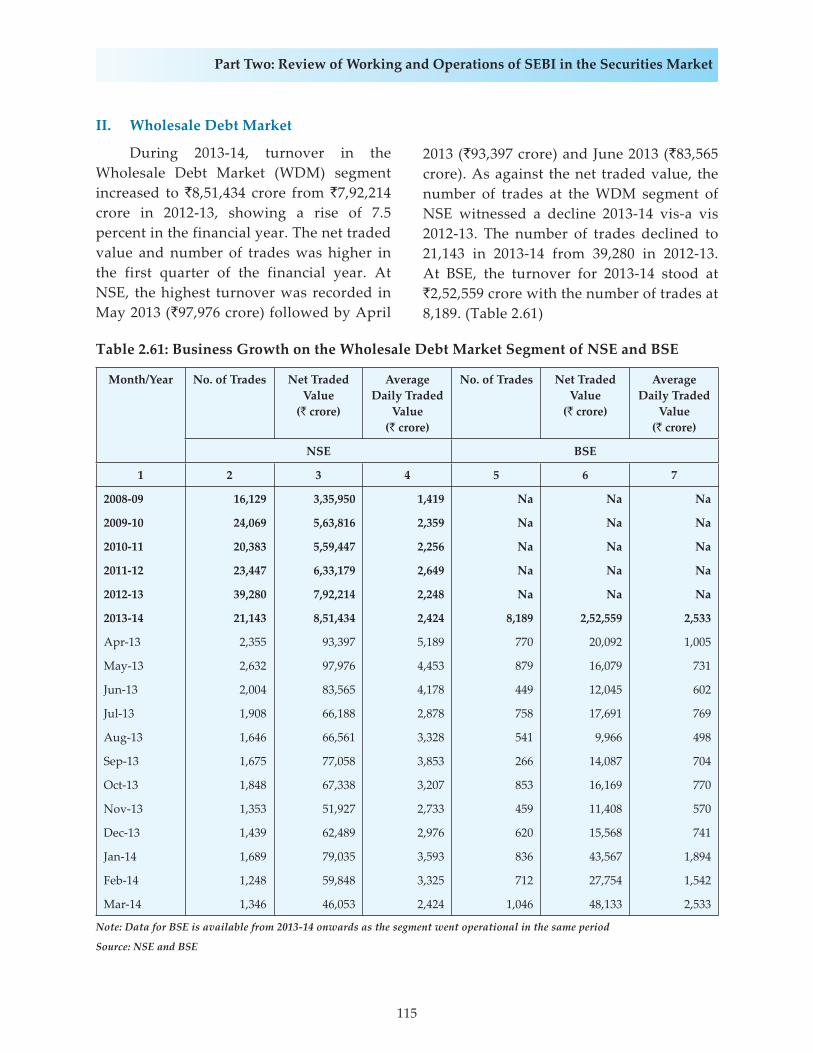
115
Part Two: Review of Working and Operations of SEBI in the Securities Market
II. Wholesale Debt Market
During 2013-14, turnover in the Wholesale Debt Market (WDM) segment increased to `8,51,434 crore from `7,92,214 crore in 2012-13, showing a rise of 7.5 percent in the financial year. The net traded value and number of trades was higher in the first quarter of the financial year. At NSE, the highest turnover was recorded in May 2013 (`97,976 crore) followed by April
2013 (`93,397 crore) and June 2013 (`83,565 crore). As against the net traded value, the number of trades at the WDM segment of NSE witnessed a decline 2013-14 vis-a vis 2012-13. The number of trades declined to 21,143 in 2013-14 from 39,280 in 2012-13. At BSE, the turnover for 2013-14 stood at `2,52,559 crore with the number of trades at 8,189. (Table 2.61)
Table 2.61: Business Growth on the Wholesale Debt Market Segment of NSE and BSE
Month/Year No. of Trades Net Traded Value
(` crore)
Average Daily Traded
Value(` crore)
No. of Trades Net Traded Value
(` crore)
Average Daily Traded
Value(` crore)
NSE BSE
1 2 3 4 5 6 7
2008-09 16,129 3,35,950 1,419 Na Na Na
2009-10 24,069 5,63,816 2,359 Na Na Na
2010-11 20,383 5,59,447 2,256 Na Na Na
2011-12 23,447 6,33,179 2,649 Na Na Na
2012-13 39,280 7,92,214 2,248 Na Na Na
2013-14 21,143 8,51,434 2,424 8,189 2,52,559 2,533
Apr-13 2,355 93,397 5,189 770 20,092 1,005
May-13 2,632 97,976 4,453 879 16,079 731
Jun-13 2,004 83,565 4,178 449 12,045 602
Jul-13 1,908 66,188 2,878 758 17,691 769
Aug-13 1,646 66,561 3,328 541 9,966 498
Sep-13 1,675 77,058 3,853 266 14,087 704
Oct-13 1,848 67,338 3,207 853 16,169 770
Nov-13 1,353 51,927 2,733 459 11,408 570
Dec-13 1,439 62,489 2,976 620 15,568 741
Jan-14 1,689 79,035 3,593 836 43,567 1,894
Feb-14 1,248 59,848 3,325 712 27,754 1,542
Mar-14 1,346 46,053 2,424 1,046 48,133 2,533
Note: Data for BSE is available from 2013-14 onwards as the segment went operational in the same period
Source: NSE and BSE
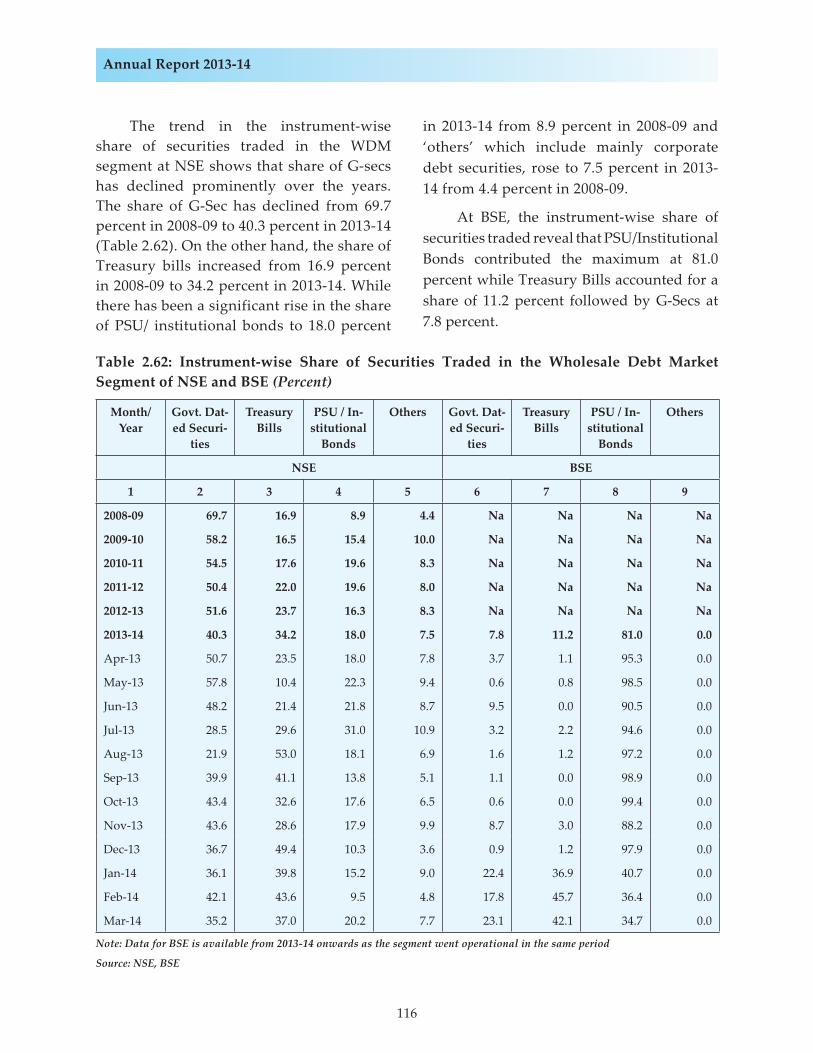
116
Annual Report 2013-14
Table 2.62: Instrument-wise Share of Securities Traded in the Wholesale Debt Market Segment of NSE and BSE (Percent)
Month/Year
Govt. Dat-ed Securi-
ties
Treasury Bills
PSU / In-stitutional
Bonds
Others Govt. Dat-ed Securi-
ties
Treasury Bills
PSU / In-stitutional
Bonds
Others
NSE BSE
1 2 3 4 5 6 7 8 9
2008-09 69.7 16.9 8.9 4.4 Na Na Na Na
2009-10 58.2 16.5 15.4 10.0 Na Na Na Na
2010-11 54.5 17.6 19.6 8.3 Na Na Na Na
2011-12 50.4 22.0 19.6 8.0 Na Na Na Na
2012-13 51.6 23.7 16.3 8.3 Na Na Na Na
2013-14 40.3 34.2 18.0 7.5 7.8 11.2 81.0 0.0
Apr-13 50.7 23.5 18.0 7.8 3.7 1.1 95.3 0.0
May-13 57.8 10.4 22.3 9.4 0.6 0.8 98.5 0.0
Jun-13 48.2 21.4 21.8 8.7 9.5 0.0 90.5 0.0
Jul-13 28.5 29.6 31.0 10.9 3.2 2.2 94.6 0.0
Aug-13 21.9 53.0 18.1 6.9 1.6 1.2 97.2 0.0
Sep-13 39.9 41.1 13.8 5.1 1.1 0.0 98.9 0.0
Oct-13 43.4 32.6 17.6 6.5 0.6 0.0 99.4 0.0
Nov-13 43.6 28.6 17.9 9.9 8.7 3.0 88.2 0.0
Dec-13 36.7 49.4 10.3 3.6 0.9 1.2 97.9 0.0
Jan-14 36.1 39.8 15.2 9.0 22.4 36.9 40.7 0.0
Feb-14 42.1 43.6 9.5 4.8 17.8 45.7 36.4 0.0
Mar-14 35.2 37.0 20.2 7.7 23.1 42.1 34.7 0.0
Note: Data for BSE is available from 2013-14 onwards as the segment went operational in the same period
Source: NSE, BSE
The trend in the instrument-wise share of securities traded in the WDM segment at NSE shows that share of G-secs has declined prominently over the years. The share of G-Sec has declined from 69.7 percent in 2008-09 to 40.3 percent in 2013-14 (Table 2.62). On the other hand, the share of Treasury bills increased from 16.9 percent in 2008-09 to 34.2 percent in 2013-14. While there has been a significant rise in the share of PSU/ institutional bonds to 18.0 percent
in 2013-14 from 8.9 percent in 2008-09 and ‘others’ which include mainly corporate debt securities, rose to 7.5 percent in 2013-14 from 4.4 percent in 2008-09.
At BSE, the instrument-wise share of securities traded reveal that PSU/Institutional Bonds contributed the maximum at 81.0 percent while Treasury Bills accounted for a share of 11.2 percent followed by G-Secs at 7.8 percent.
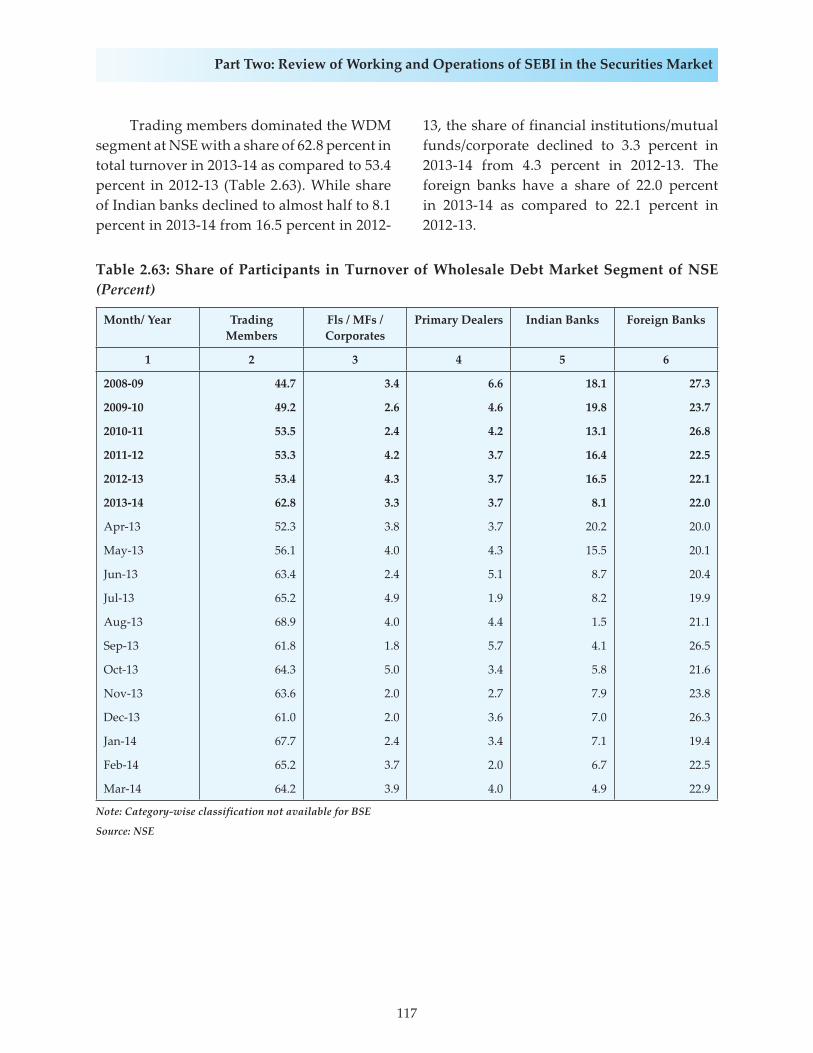
117
Part Two: Review of Working and Operations of SEBI in the Securities Market
Table 2.63: Share of Participants in Turnover of Wholesale Debt Market Segment of NSE (Percent)
Month/ Year Trading Members
Fls / MFs / Corporates
Primary Dealers Indian Banks Foreign Banks
1 2 3 4 5 6
2008-09 44.7 3.4 6.6 18.1 27.3
2009-10 49.2 2.6 4.6 19.8 23.7
2010-11 53.5 2.4 4.2 13.1 26.8
2011-12 53.3 4.2 3.7 16.4 22.5
2012-13 53.4 4.3 3.7 16.5 22.1
2013-14 62.8 3.3 3.7 8.1 22.0
Apr-13 52.3 3.8 3.7 20.2 20.0
May-13 56.1 4.0 4.3 15.5 20.1
Jun-13 63.4 2.4 5.1 8.7 20.4
Jul-13 65.2 4.9 1.9 8.2 19.9
Aug-13 68.9 4.0 4.4 1.5 21.1
Sep-13 61.8 1.8 5.7 4.1 26.5
Oct-13 64.3 5.0 3.4 5.8 21.6
Nov-13 63.6 2.0 2.7 7.9 23.8
Dec-13 61.0 2.0 3.6 7.0 26.3
Jan-14 67.7 2.4 3.4 7.1 19.4
Feb-14 65.2 3.7 2.0 6.7 22.5
Mar-14 64.2 3.9 4.0 4.9 22.9
Note: Category-wise classification not available for BSE
Source: NSE
Trading members dominated the WDM segment at NSE with a share of 62.8 percent in total turnover in 2013-14 as compared to 53.4 percent in 2012-13 (Table 2.63). While share of Indian banks declined to almost half to 8.1 percent in 2013-14 from 16.5 percent in 2012-
13, the share of financial institutions/mutual funds/corporate declined to 3.3 percent in 2013-14 from 4.3 percent in 2012-13. The foreign banks have a share of 22.0 percent in 2013-14 as compared to 22.1 percent in 2012-13.
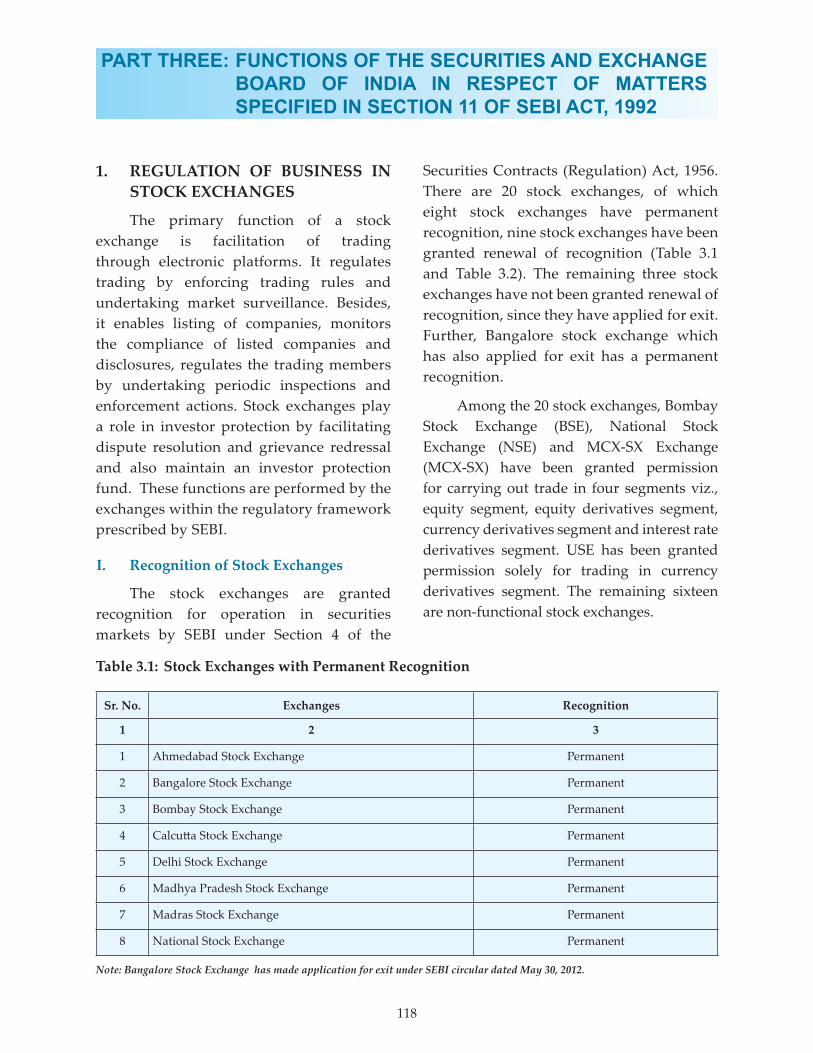
PART THREE: FUNCTIONS OF THE SECURITIES AND EXCHANGE BOARD OF INDIA IN RESPECT OF MATTERS SPECIFIED IN SECTION 11 OF SEBI ACT, 1992
1. REGULATION OF BUSINESS IN STOCK EXCHANGES
The primary function of a stock exchange is facilitation of trading through electronic platforms. It regulates trading by enforcing trading rules and undertaking market surveillance. Besides, it enables listing of companies, monitors the compliance of listed companies and disclosures, regulates the trading members by undertaking periodic inspections and enforcement actions. Stock exchanges play a role in investor protection by facilitating dispute resolution and grievance redressal and also maintain an investor protection fund. These functions are performed by the exchanges within the regulatory framework prescribed by SEBI.
I. Recognition of Stock Exchanges
The stock exchanges are granted recognition for operation in securities markets by SEBI under Section 4 of the
Securities Contracts (Regulation) Act, 1956. There are 20 stock exchanges, of which eight stock exchanges have permanent recognition, nine stock exchanges have been granted renewal of recognition (Table 3.1 and Table 3.2). The remaining three stock exchanges have not been granted renewal of recognition, since they have applied for exit. Further, Bangalore stock exchange which has also applied for exit has a permanent recognition.
Among the 20 stock exchanges, Bombay Stock Exchange (BSE), National Stock Exchange (NSE) and MCX-SX Exchange (MCX-SX) have been granted permission for carrying out trade in four segments viz., equity segment, equity derivatives segment, currency derivatives segment and interest rate derivatives segment. USE has been granted permission solely for trading in currency derivatives segment. The remaining sixteen are non-functional stock exchanges.
118
Table 3.1: Stock Exchanges with Permanent Recognition
Sr. No. Exchanges Recognition
1 2 3
1 Ahmedabad Stock Exchange Permanent
2 Bangalore Stock Exchange Permanent
3 Bombay Stock Exchange Permanent
4 Calcu� a Stock Exchange Permanent
5 Delhi Stock Exchange Permanent
6 Madhya Pradesh Stock Exchange Permanent
7 Madras Stock Exchange Permanent
8 National Stock Exchange Permanent
Note: Bangalore Stock Exchange has made application for exit under SEBI circular dated May 30, 2012.

119
Part Three: Functions of SEBI in Respect of Ma� ers Specifi ed in Section 11 of SEBI Act, 1992
Table 3.2: Renewal of Recognition Granted to Stock Exchanges during 2013-14
Sr. No. Exchanges Date of Notifi cation Period
1 2 3 4
1 U� ar Pradesh Stock Exchange June 03, 2013 Jun 03,2013 - Jun 02, 2014
2 Bhubaneswar Stock Exchange May 22, 2013 Jun 05, 2013- Jun 04, 2014
3 OTC Exchange Aug 19, 2013 Aug 23, 2013- Aug 22, 2014
4 Pune Stock Exchange Aug 30, 2013 Sept 02, 2013- Sept 01, 2014
5 MCX Stock Exchange Sept 12, 2013 Sept 16, 2013- Sept 15, 2014
6 Interconnected Stock Exchange Nov 14, 2013 Nov 18, 2013 – Nov 17, 2014
7 Vadodara Stock Exchange Dec 30, 2013 Jan 04, 2014 – Jan 03, 2015
8 Jaipur Stock Exchange Dec 30, 2013 Jan 09, 2014- Jan 08, 2015
9 United Stock Exchange Mar 11, 2014 Mar 22, 2014 - Mar 21, 2015
Note: Gauhati Stock Exchange, Cochin Stock Exchange, and Ludhiana Stock Exchange have made application for exit under SEBI circular dated May 30, 2012.
II. Trading and Settlement Practices at Stock Exchanges
Stock exchanges offer online, fully automated, anonymous, order driven, screen-based trading system to the investors through their members. In this system, members can enter the quantities of securities and the prices at which they would like to transact, and the transaction is executed as soon as it finds a matching sale for the buy order for a counterparty from the order book.
The clearing and settlement process involves three main activities — clearing, settlement, and risk management. The clearing process involves determining what the counterparties owe and what they are due to receive on the settlement date, after which the obligations are discharged by settlement.
A. Cash Segment
The core processes involved in clearing and settlement include (a) Determination of Obligation, (b) Pay-in of Funds and Securities, and (c) Pay-out of Funds and Securities. The clearing corporation (CC) clears and settles trades as per the well-defined settlement
cycles. All the securities are being traded and settled under T+2 rolling settlement. In case of institutional trades, the CC notifies the relevant trade details to clearing members (CMs)/custodians on the trade day (T), which needs to be confirmed by T+1 to CC. Subsequently, the CC determines the obligations of counterparties and sends the obligations to members. A CM has to pay-in/pay-out funds and/or securities. The obligations are netted for a member across all securities to determine his fund and securities obligations and he has to either pay or receive funds and securities. Members’ pay-in/pay-out obligations are determined latest by T+1 and are forwarded to them on the same day, so that they can settle their obligations on T+2. The securities and funds are paid-in and paid-out on T+2 day to the members and the settlement is complete in two days from the trading day. In case of shortage of securities, auction takes place on T+2 day and then settled on T+3 days.
B. F&O Segment
The positions in the futures contracts for each member is marked-to-market to the daily settlement price of the futures contracts at the
120
Annual Report 2013-14
end of each trade day. The profits/ losses are computed as the difference between the trade price or the previous day’s settlement price, as the case may be, and the current day’s settlement price. Further, on the expiry of the futures contracts, CC marks all positions of a CM to the final settlement price and the resulting profit / loss is settled in cash. The final settlement of the futures contracts is similar to the daily settlement process except for the method of computation of final settlement price. The final settlement of profit / loss is computed as the difference between trade price or the previous day’s settlement price, as the case may be, and the final settlement price of the relevant futures contract. In case of options, the premium settlement is cash settled and settlement style is premium style. The premium payable position and premium receivable positions are netted across all option contracts for each CM at the client level to determine the net premium payable or receivable amount, at the end of each day. Final exercise settlement is effected for option positions at in-the-money strike prices existing at the close of trading hours, on the expiration day of an option contract.
C. Risk Management
A sound risk management system is integral to an efficient settlement system. Membership of exchanges and their clearing corporations are granted only after satisfying minimum net-worth requirements and depositing base minimum capital with exchanges and liquid net-worth with CC. Further, members have to deposit collateral with exchanges/CC which can be used for margins for trading positions. As soon as trade is executed, capital adequacy check is carried out by the CC and portion of collateral deposited by broker is blocked commensurate
to the requisite margins on the positions taken. Margins/liquid assets deposited by members are in the form of cash and cash equivalent (cash, fixed deposits, bank guarantees etc) and other liquid assets (Group I liquid eligible securities after appropriate hair-cuts etc) with cash equivalents required to be at least 50 percent of liquid assets.
III. Memorandum of Understanding (MoU) between Stock Exchanges
Pursuant to Section 13 of Securities Contracts (Regulation) Act, 1956, stock exchanges can enter into a MoU with any recognised stock exchange outside its area of operation to enable the investors to buy and sell securities through such trading floor under the regulatory framework of that stock exchange. Vide the same provisions, Madhya Pradesh Stock Exchange operationalised trading under such MoU with NSE and BSE. Further, Madras Stock Exchange and Calcutta Stock Exchange have operationalised trading with NSE.
IV. Steps taken by SEBI to ring-fence MCX-SX
The recognition of MCX-SX was renewed vide gazette notification dated September 12, 2013, for the period September 16, 2013 to September 15, 2014. In view of developments in M/s. National Spot Exchange Ltd. (NSEL), which is regulated by Forward Markets Commission (FMC) and promoted by M/s. Financial Technologies (India) Ltd. (FTIL), while renewing recognition of MCX-SX for a period of one year in September 2013, certain conditions were imposed to ring-fence MCX-SX from the NSEL crisis. The said conditions were as under:
a. A committee comprising of two Public Interest Directors and three nominees
121
Part Three: Functions of SEBI in Respect of Ma� ers Specifi ed in Section 11 of SEBI Act, 1992
from institutional investors in MCX-SX shall be constituted within two days of renewal of recognition to oversee the following functions of the exchange:
• All financial transactions related to investment, lending, and borrowing of funds and related party transactions as defined in Accounting Standards 18;
• Appointment of key management personnel;
• All facility / infrastructure sharing arrangements;
• All major capital expenditure;
• and advise the board on all the major policy matters.
The board will consider the advice and maintain a record of the proceedings. A committee on the same lines may also be constituted by MCX-SX CCL which is the subsidiary of MCX-SX. The said committee shall oversee the clearing and settlement function in addition to the functions listed above.
b. In order to further secure the management of the exchange and clearing corporation, shareholders of MCX-SX and MCX-SX CCL in AGM / EGM would examine conflict of interest and compliance with SECC (Regulations), 2012 by the directors and the key management personnel including managing director, and take appropriate action including reconstitution of board, reappointment of any key management personnel and will report to SEBI within 30 days from the date of renewal of recognition.
c. Thereafter, MCX-SX and MCX-SX CCL held an EGM on October 9, 2013 to discuss and decide on the compliance
with SEBI directions issued vide letter dated September 12, 2013.
d. Before the commencement of the EGM, MD and CEO, a then existing shareholder director were made to resign from the Board of Directors with immediate effect.
e. A comprehensive audit has been initiated with a focus on related party transactions, major board decisions, agreements with related parties, etc. since inception of the exchange in 2008.
Further, FMC vide an order dated December 17, 2013, inter-alia declared FTIL as not fit and proper to continue to hold shares in Multi-Commodity Exchange of India Ltd. (MCX). Accordingly a Show Cause Notice was issued to FTIL on December 20, 2013, and an opportunity of hearing was provided to FTIL. Subsequently, vide order dated March 19, 2014, SEBI has issued directions to FTIL to divest all the shares/warrants held directly or indirectly in MCX-SX, MCX-SX CCL, NSEIL, DSE and VSE by declaring them not fit and proper person in terms of SECC (Regulations), 2012.
V. Exit of Stock Exchanges
SEBI issued the circular CIR/MRD/DSA/14/2012 dated May 30, 2012, regarding the Exit Policy for de-recognised/non-operational stock exchanges. As on March 31, 2014, four exchanges namely Hyderabad Stock Exchange, Coimbatore Stock Exchange, Saurashtra Kutch Stock Exchange and Mangalore Stock Exchange have been granted exit by SEBI vide orders dated January 25, 2013, April 3, 2013, April 5, 2013 and March 3, 2014 respectively. Further, Gauhati Stock Exchange, Cochin Stock Exchange, Bangalore Stock Exchange and Ludhiana Stock Exchange have made application for exit in terms of SEBI circular dated May 30, 2012.
122
Annual Report 2013-14
VI. Measures adopted for regulation of Stock Exchanges
During 2013-14, in order to improve the effectiveness of monitoring mechanism of stock exchanges to ascertain the adequacy and accuracy of disclosures made in compliance with the Listing Agreement, the stock exchanges were advised to put in place appropriate framework to effectively monitor the disclosure and for handling complaints related to inadequate and inaccurate disclosures and non-compliances. SEBI also decided to streamline the processes
and procedures with regard to actions for non-compliances of certain listing conditions which have so far been considered as grounds for suspension of trading by the recognised stock exchanges (Box 3.1). With a view to streamline the investor grievance mechanism and the arbitration mechanism at the stock exchanges, various measures were adopted during 2013-14 like widened jurisdiction for appealing before the courts, increase in number of investor service centers facilitating arbitration, facilitation desks at all investor service centers etc.
2. REGISTRATION AND REGULATION OF WORKING OF INTERMEDIARIES ASSOCIATED WITH THE SECURITIES MARKET
SEBI has framed regulations under the SEBI Act, 1992 and the Depositories Act, 1996 for the registration and regulation of
all market intermediaries. Under these Acts, the Government and SEBI issue notifications, guidelines and circulars that the market intermediaries need to comply with. There are a large variety and number of intermediaries who operate in Indian securities markets under the respective regulations. SEBI ensures the
Box 3.1 : Standard Operating Procedure for stock exchanges for suspension and revocation of trading of shares of listed entities for non-compliance of certain listing conditions
For non-compliance with listing conditions, exchanges have been suspending the trading of the shares of the listed companies, which aff ected the interest of non-promoters much more than the promoters, as the exit route used to be closed for such investors a� er suspension of trading. Therefore, it was decided that the exchange, in case of non compliant companies, would resort to several other measures such as imposition of fi nes, freezing of shares of the promoter and promoter group, transferring the trading in the shares of the company to separate category, etc., before suspending the shares of the company.
Accordingly, to maintain consistency and uniformity of approach by the stock exchanges for taking action against the listed entities for non-compliance with certain important listing conditions, SEBI vide circular dated September 30, 2013 has prescribed Standard Operating Procedure (SOP) for suspension and revocation of suspension of trading in the shares.
The salient features of the circular are as follows:� Imposition of fi nes (on per day basis) on the company for non-compliance and delay in compliance with
continuous listing conditions such as submission of shareholding pa� ern, fi nancial results, corporate governance report, etc.
� In case of non-compliance for two consecutive quarters, moving the shares of non-compliant company to "Z" category, where the trades would be se� led on Trade for Trade basis.
� In case non-compliance continues, freezing the shares of the promoter and promoter group. This would be carried out before suspension of the trading of shares of the company.
� In order to provide exit window for the non-promoters, a� er 15 days of suspension, trading in the shares of non-compliant entity will be available on the "Trade for Trade" basis, on the fi rst trading day of every week for six months.
123
Part Three: Functions of SEBI in Respect of Ma� ers Specifi ed in Section 11 of SEBI Act, 1992
standard and quality of service provided by intermediaries to the clients and investors, fair and sound conduct and compliance practices.
I. Streamlining the Process of Initial / Permanent Registration of Intermediaries
The process for streamlining the registration of intermediaries and approvals by enhancing the levels of transparency continued during the year 2013-14. With a view
to rationalize the time taken, documentation involved and to avoid duplication of efforts, SEBI (Stock Brokers and Sub Brokers) Regulations, 1992 were amended and notified on September 27, 2013. The primary objective of the amendment was to replace the existing requirement of obtaining multiple registrations for operating in different segments of a stock exchange with a single registration per stock exchange (Box 3.2).
Box 3.2: Simplification of Registration Requirements for Stock BrokersIn 2011, SEBI dispensed with the requirement of intermediaries to obtain prior approval from SEBI for change in status or constitution. The intermediaries now require to take prior approval from SEBI only for change in control as against a number of approvals required earlier. Also, if the applicant holds multiple registrations with SEBI, it is required to make only one application to SEBI for prior approval in case of change in control. Subsequently, permanent registration was introduced for merchant bankers, registrars to an issue and share transfer agents, depository participants, credit rating agencies and debenture trustees. Vide amendment dated July 5, 2011 to the regulations the aforesaid intermediaries were granted initial registration for a period of five years. Thereafter, they could apply for permanent registration instead of earlier requirement of periodical renewal of certificate of registration.
One registration per Stock Exchange for Stock Brokers
In continuation to the simplification of prior approval and permanent registration requirements, concept of single registration per stock exchange has now been introduced for stock brokers. Initially, applicants were required to obtain multiple certificates of registration from SEBI while operating in each segment viz. equity, equity derivative, currency derivative, debt of a stock exchange/ clearing corporation, and for each category viz. Trading Member, Trading Cum Self Clearing Member, Trading Cum Clearing Member and Professional Clearing Member. These applications were processed at stock exchange/ clearing corporation level and then submitted to SEBI for final approval i.e. issuing certification of registration.
With a view to rationalize the time taken, documentation involved and to avoid duplication of efforts, the registration requirements for stock broker/ clearing member were simplified by amendment to the SEBI (Stock Brokers and Sub Brokers) Regulations, 1992, notified on September 27, 2013.
Revised registration procedure
� If a new entity intends to register as a stock broker/ clearing member in any segment(s) of a stock exchange/ clearing corporation, the entity shall apply to SEBI through the respective stock exchange/ clearing corporation in the manner prescribed in the SEBI (Stock Brokers and Sub Brokers) Regulations, 1992 in any one segment. The entity shall be issued a certificate with a unique registration number for each stock exchange/clearing corporation, as the case may be, irrespective of number of segments.
� If an entity is already registered with SEBI in any segment of a stock exchange/ clearing corporation, then for operating in any other segment of that stock exchange/ clearing corporation (promoted by that stock exchange), the entity need not apply to SEBI. The entity can directly seek approval from the concerned stock exchange or clearing corporation as per the procedure prescribed in the SEBI (Stock Brokers and Sub Brokers) Regulations, 1992 for the same.
� The stock exchange or clearing corporation shall grant approval for any additional segment to the stock broker, self-clearing member or clearing member, as the case may be, after exercising due diligence and on being satisfied about the compliance of all relevant eligibility requirements and shall inform the Board about such grant of approval.
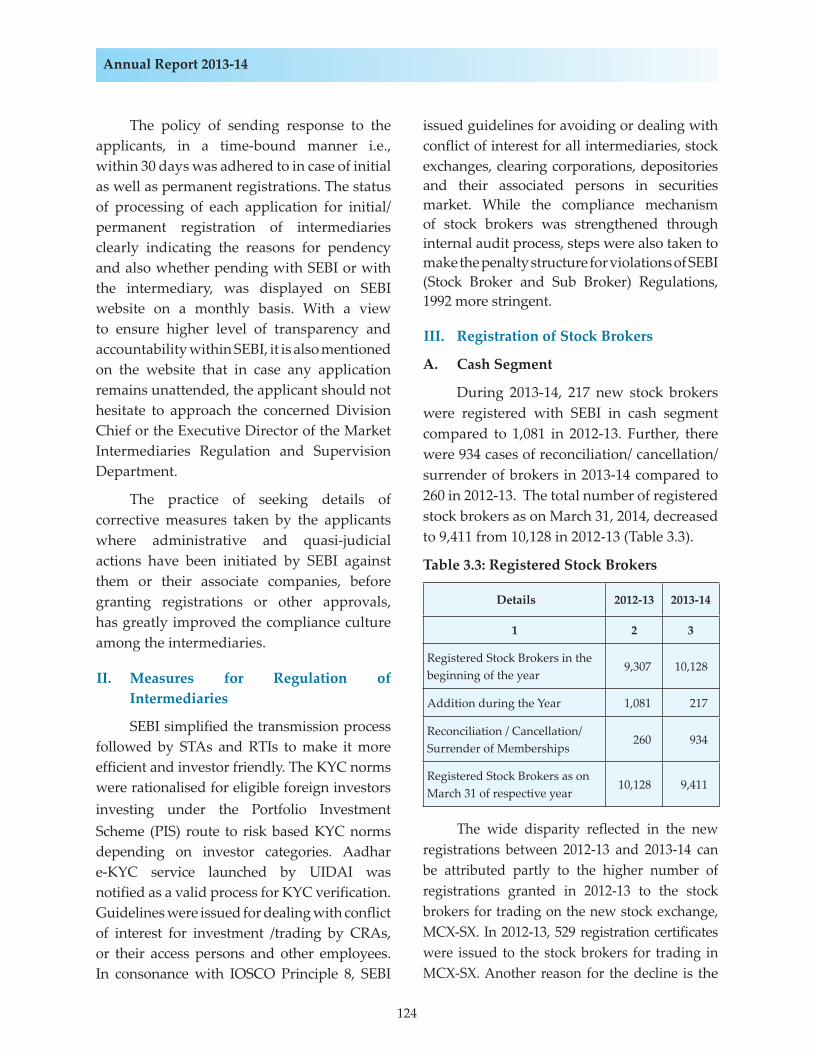
124
Annual Report 2013-14
The policy of sending response to the applicants, in a time-bound manner i.e., within 30 days was adhered to in case of initial as well as permanent registrations. The status of processing of each application for initial/permanent registration of intermediaries clearly indicating the reasons for pendency and also whether pending with SEBI or with the intermediary, was displayed on SEBI website on a monthly basis. With a view to ensure higher level of transparency and accountability within SEBI, it is also mentioned on the website that in case any application remains unattended, the applicant should not hesitate to approach the concerned Division Chief or the Executive Director of the Market Intermediaries Regulation and Supervision Department.
The practice of seeking details of corrective measures taken by the applicants where administrative and quasi-judicial actions have been initiated by SEBI against them or their associate companies, before granting registrations or other approvals, has greatly improved the compliance culture among the intermediaries.
II. Measures for Regulation of Intermediaries
SEBI simplified the transmission process followed by STAs and RTIs to make it more efficient and investor friendly. The KYC norms were rationalised for eligible foreign investors investing under the Portfolio Investment Scheme (PIS) route to risk based KYC norms depending on investor categories. Aadhar e-KYC service launched by UIDAI was notified as a valid process for KYC verification. Guidelines were issued for dealing with conflict of interest for investment /trading by CRAs, or their access persons and other employees. In consonance with IOSCO Principle 8, SEBI
issued guidelines for avoiding or dealing with conflict of interest for all intermediaries, stock exchanges, clearing corporations, depositories and their associated persons in securities market. While the compliance mechanism of stock brokers was strengthened through internal audit process, steps were also taken to make the penalty structure for violations of SEBI (Stock Broker and Sub Broker) Regulations, 1992 more stringent.
III. Registration of Stock Brokers
A. Cash Segment
During 2013-14, 217 new stock brokers were registered with SEBI in cash segment compared to 1,081 in 2012-13. Further, there were 934 cases of reconciliation/ cancellation/ surrender of brokers in 2013-14 compared to 260 in 2012-13. The total number of registered stock brokers as on March 31, 2014, decreased to 9,411 from 10,128 in 2012-13 (Table 3.3).
Table 3.3: Registered Stock Brokers
Details 2012-13 2013-14
1 2 3
Registered Stock Brokers in the beginning of the year
9,307 10,128
Addition during the Year 1,081 217
Reconciliation / Cancellation/ Surrender of Memberships
260 934
Registered Stock Brokers as on March 31 of respective year
10,128 9,411
The wide disparity reflected in the new registrations between 2012-13 and 2013-14 can be attributed partly to the higher number of registrations granted in 2012-13 to the stock brokers for trading on the new stock exchange, MCX-SX. In 2012-13, 529 registration certificates were issued to the stock brokers for trading in MCX-SX. Another reason for the decline is the
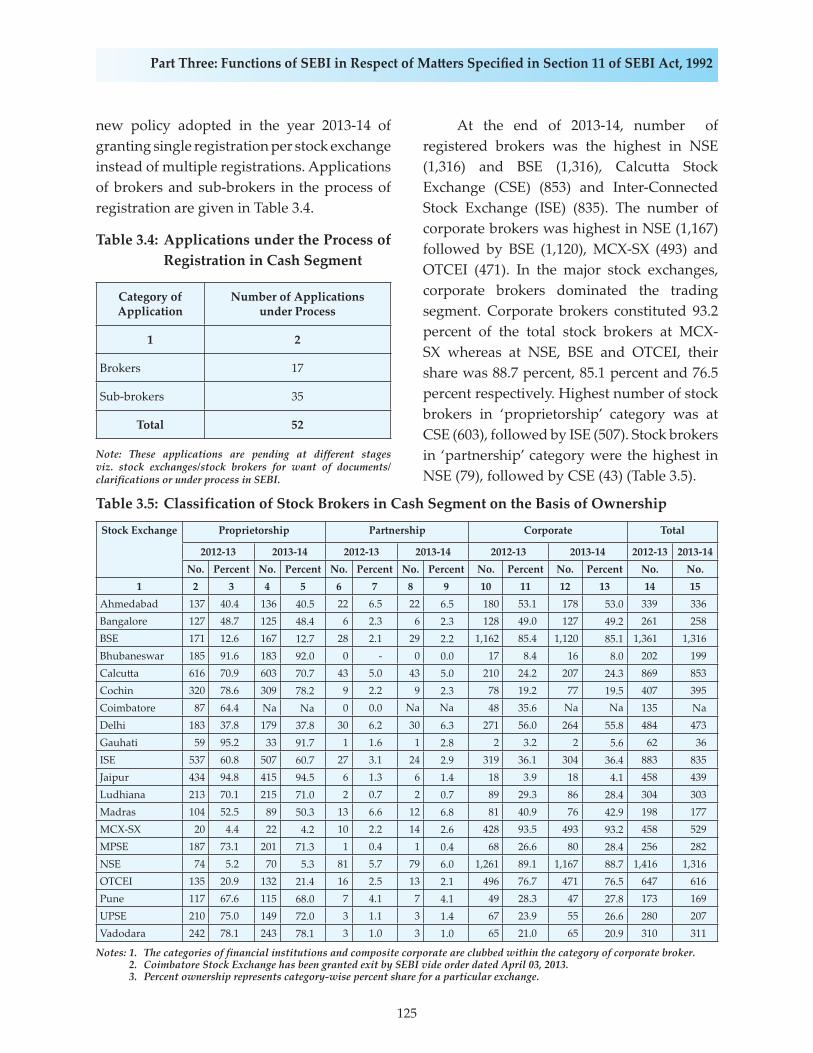
125
Part Three: Functions of SEBI in Respect of Ma� ers Specifi ed in Section 11 of SEBI Act, 1992
new policy adopted in the year 2013-14 of granting single registration per stock exchange instead of multiple registrations. Applications of brokers and sub-brokers in the process of registration are given in Table 3.4.
Table 3.4: Applications under the Process of Registration in Cash Segment
Category of Application
Number of Applications under Process
1 2
Brokers 17
Sub-brokers 35
Total 52
Note: These applications are pending at different stages viz. stock exchanges/stock brokers for want of documents/clarifications or under process in SEBI.
At the end of 2013-14, number of registered brokers was the highest in NSE (1,316) and BSE (1,316), Calcutta Stock Exchange (CSE) (853) and Inter-Connected Stock Exchange (ISE) (835). The number of corporate brokers was highest in NSE (1,167) followed by BSE (1,120), MCX-SX (493) and OTCEI (471). In the major stock exchanges, corporate brokers dominated the trading segment. Corporate brokers constituted 93.2 percent of the total stock brokers at MCX-SX whereas at NSE, BSE and OTCEI, their share was 88.7 percent, 85.1 percent and 76.5 percent respectively. Highest number of stock brokers in ‘proprietorship’ category was at CSE (603), followed by ISE (507). Stock brokers in ‘partnership’ category were the highest in NSE (79), followed by CSE (43) (Table 3.5).
Table 3.5: Classification of Stock Brokers in Cash Segment on the Basis of Ownership
Stock Exchange Proprietorship Partnership Corporate Total
2012-13 2013-14 2012-13 2013-14 2012-13 2013-14 2012-13 2013-14No. Percent No. Percent No. Percent No. Percent No. Percent No. Percent No. No.
1 2 3 4 5 6 7 8 9 10 11 12 13 14 15Ahmedabad 137 40.4 136 40.5 22 6.5 22 6.5 180 53.1 178 53.0 339 336Bangalore 127 48.7 125 48.4 6 2.3 6 2.3 128 49.0 127 49.2 261 258BSE 171 12.6 167 12.7 28 2.1 29 2.2 1,162 85.4 1,120 85.1 1,361 1,316Bhubaneswar 185 91.6 183 92.0 0 - 0 0.0 17 8.4 16 8.0 202 199Calcu� a 616 70.9 603 70.7 43 5.0 43 5.0 210 24.2 207 24.3 869 853Cochin 320 78.6 309 78.2 9 2.2 9 2.3 78 19.2 77 19.5 407 395Coimbatore 87 64.4 Na Na 0 0.0 Na Na 48 35.6 Na Na 135 NaDelhi 183 37.8 179 37.8 30 6.2 30 6.3 271 56.0 264 55.8 484 473Gauhati 59 95.2 33 91.7 1 1.6 1 2.8 2 3.2 2 5.6 62 36ISE 537 60.8 507 60.7 27 3.1 24 2.9 319 36.1 304 36.4 883 835Jaipur 434 94.8 415 94.5 6 1.3 6 1.4 18 3.9 18 4.1 458 439Ludhiana 213 70.1 215 71.0 2 0.7 2 0.7 89 29.3 86 28.4 304 303Madras 104 52.5 89 50.3 13 6.6 12 6.8 81 40.9 76 42.9 198 177MCX-SX 20 4.4 22 4.2 10 2.2 14 2.6 428 93.5 493 93.2 458 529MPSE 187 73.1 201 71.3 1 0.4 1 0.4 68 26.6 80 28.4 256 282NSE 74 5.2 70 5.3 81 5.7 79 6.0 1,261 89.1 1,167 88.7 1,416 1,316OTCEI 135 20.9 132 21.4 16 2.5 13 2.1 496 76.7 471 76.5 647 616Pune 117 67.6 115 68.0 7 4.1 7 4.1 49 28.3 47 27.8 173 169UPSE 210 75.0 149 72.0 3 1.1 3 1.4 67 23.9 55 26.6 280 207Vadodara 242 78.1 243 78.1 3 1.0 3 1.0 65 21.0 65 20.9 310 311
Notes: 1. The categories of financial institutions and composite corporate are clubbed within the category of corporate broker. 2. Coimbatore Stock Exchange has been granted exit by SEBI vide order dated April 03, 2013. 3. Percent ownership represents category-wise percent share for a particular exchange.

126
Annual Report 2013-14
B. Equity and Currency Derivative Segment
In equity derivative segment, 22 trading members (TM), two clearing members (CM) and five self-clearing members (SCM) were granted registration at NSE Futures and Options (F&O) segment during 2013-14. In case of BSE F&O segment, the corresponding figures were 23, two and four respectively. Further, 61 trading members, seven clearing
members and ten self clearing members were granted registration at F&O segment of MCX-SX during the same period. In addition, two trading members were granted registration at Madras Stock Exchange (MSE), 30 trading members were granted registration at Madhya Pradesh Stock Exchange (MPSE) and 13 trading members were granted registration at Calcutta Stock Exchange (CSE) during 2013-14 (Table 3.6).
Table 3.6: Number of Registered Members in Equity Derivatives Segment
Type of Member Registrations granted during 2013-14 Registered Member as on March 31, 2014
NSE BSE MCX-SX
MSE MPSE CSE NSE BSE MCX-SX
MSE MPSE CSE
1 2 3 4 5 6 7 8 9 10 11 12 13
Trading Member 22 23 61 2 30 13 1,315 983 529 31 116 30
Clearing Member 2 2 7 Na Na Na 226 136 72 0 0 0
Self Clearing Member 5 4 10 Na Na Na 359 40 72 0 0 0
Total 29 29 78 2 30 13 1,900 1,159 673 31 116 30
Note: Madhya Pradesh Stock Exchange operationalised trading under MoU with NSE and BSE. Further, Madras Stock Exchange and Calcutta Stock Exchange have operationalised trading with NSE.
The trading of currency derivatives segment at BSE started in November 2013. In the currency derivatives segment, total number of certificates of registration issued
for trading/clearing at NSE, BSE, MCX-SX and USE in various categories were 1,088, 187, 1,029 and 471 respectively at the end of March 31, 2014 (Table 3.7).
Table 3.7: Number of Registered Members in Currency Derivatives Segment
Type of Member Registrations granted during 2013-14 Registered Member as on March 31, 2014
NSE BSE MCX-SX USE NSE BSE MCX-SX USE
1 2 3 4 5 8 9 10 11
Trading Member 21 5 20 11 898 160 895 412
Clearing Member 2 Na Na Na 173 27 119 55
Self Clearing Member 4 Na 1 Na 17 0 15 4
Total 27 5 21 11 1,088 187 1,029 471

127
Part Three: Functions of SEBI in Respect of Ma� ers Specifi ed in Section 11 of SEBI Act, 1992
The number of applications under the process of registration in the derivatives segment is given in Table 3.8
Table 3.8: Applications under the Process of Registration in Derivative Segment
Category of Application Number of Applications under Process
1 2
Brokers in Equity Derivatives Segment 20
Brokers in Currency Derivatives Segment 22
Total 42
IV. Registration of Sub-brokers
The number of registered sub-brokers
has declined by 26.1 percent (from 70,178 as on March 31, 2013 to 51,885 as on March 31, 2014). However, the number of Authorised Persons (APs) as approved by the stock exchanges in accordance with SEBI Guidelines has increased substantially by 29.9 percent during the year (from 1,25,273 as on March 31, 2013 to 1,62,679 as on March 31, 2014). Stock brokers were allowed to provide market access to clients through APs, in addition to sub-brokers, with a view to expand the reach of the markets for exchange traded products, vide SEBI circular dated November 6, 2009. Thus, while number of sub-brokers has declined, the increased presence of APs has ensured the reach of the markets for exchange traded products, as intended while introducing the concept of APs (Table 3.9).
Table 3.9: Registered Sub-brokers
Stock Exchange 2012-13 2013-14
Number Percentage of Total Number Percentage of Total
1 2 3 4 5Ahmedabad 77 0.1 71 0.1Bangalore 158 0.2 158 0.3Bhubaneswar 14 0.0 14 0.0BSE 31,635 45.1 22,652 43.7Calcu� a 71 0.1 47 0.1Cochin 41 0.1 41 0.1Coimbatore 20 0.0 Na NaDelhi 200 0.3 186 0.4Gauhati 4 0.0 4 0.0ISE 0 0.0 0 0.0Jaipur 30 0.0 29 0.1Ludhiana 21 0.0 21 0.0Madhya Pradesh 5 0.0 5 0.0Madras 103 0.1 103 0.2NSE 37,600 53.6 28,362 54.7OTCEI 14 0.0 14 0.0Pune 156 0.2 152 0.3U� ar Pradesh 2 0.0 2 0.0Vadodara 27 0.0 24 0.0Total 70,178 100.0 51,885 100.0
Note: Coimbatore Stock Exchange has been granted exit by SEBI vide order dated April 03, 2013.
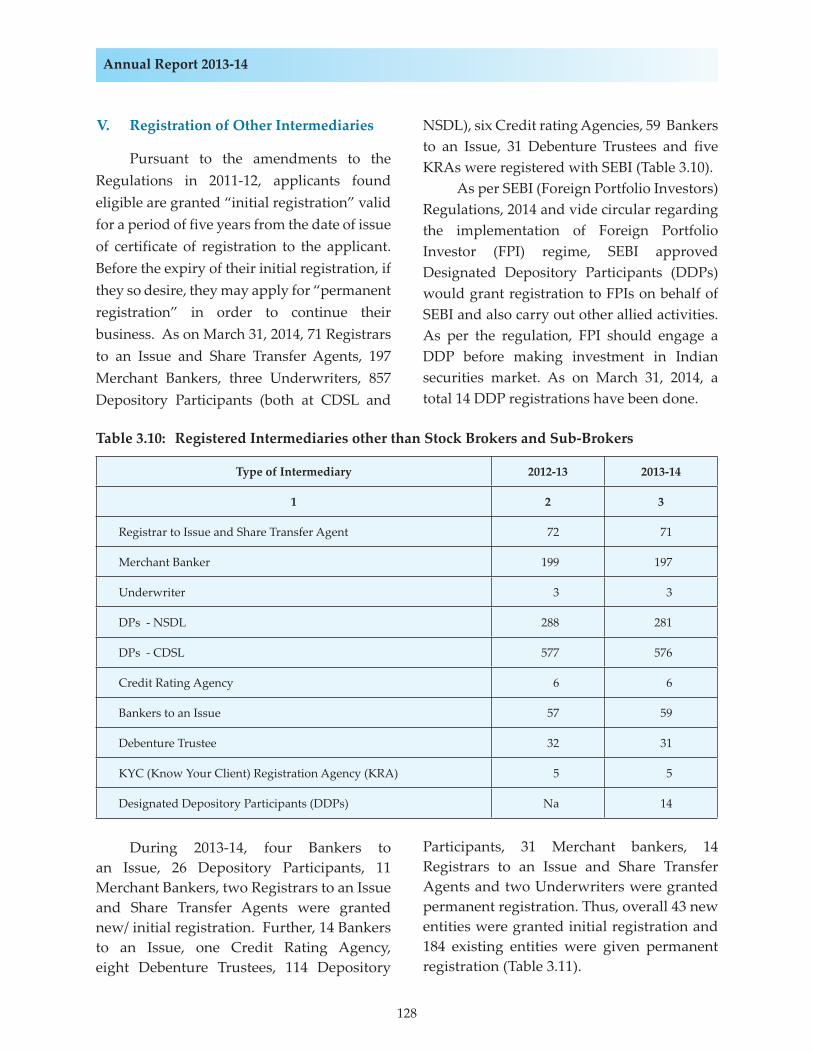
128
Annual Report 2013-14
V. Registration of Other Intermediaries
Pursuant to the amendments to the Regulations in 2011-12, applicants found eligible are granted “initial registration” valid for a period of five years from the date of issue of certificate of registration to the applicant. Before the expiry of their initial registration, if they so desire, they may apply for “permanent registration” in order to continue their business. As on March 31, 2014, 71 Registrars to an Issue and Share Transfer Agents, 197 Merchant Bankers, three Underwriters, 857 Depository Participants (both at CDSL and
NSDL), six Credit rating Agencies, 59 Bankers to an Issue, 31 Debenture Trustees and five KRAs were registered with SEBI (Table 3.10). As per SEBI (Foreign Portfolio Investors) Regulations, 2014 and vide circular regarding the implementation of Foreign Portfolio Investor (FPI) regime, SEBI approved Designated Depository Participants (DDPs) would grant registration to FPIs on behalf of SEBI and also carry out other allied activities. As per the regulation, FPI should engage a DDP before making investment in Indian securities market. As on March 31, 2014, a total 14 DDP registrations have been done.
Table 3.10: Registered Intermediaries other than Stock Brokers and Sub-Brokers
Type of Intermediary 2012-13 2013-14
1 2 3
Registrar to Issue and Share Transfer Agent 72 71
Merchant Banker 199 197
Underwriter 3 3
DPs - NSDL 288 281
DPs - CDSL 577 576
Credit Rating Agency 6 6
Bankers to an Issue 57 59
Debenture Trustee 32 31
KYC (Know Your Client) Registration Agency (KRA) 5 5
Designated Depository Participants (DDPs) Na 14
During 2013-14, four Bankers to an Issue, 26 Depository Participants, 11 Merchant Bankers, two Registrars to an Issue and Share Transfer Agents were granted new/ initial registration. Further, 14 Bankers to an Issue, one Credit Rating Agency, eight Debenture Trustees, 114 Depository
Participants, 31 Merchant bankers, 14 Registrars to an Issue and Share Transfer Agents and two Underwriters were granted permanent registration. Thus, overall 43 new entities were granted initial registration and 184 existing entities were given permanent registration (Table 3.11).
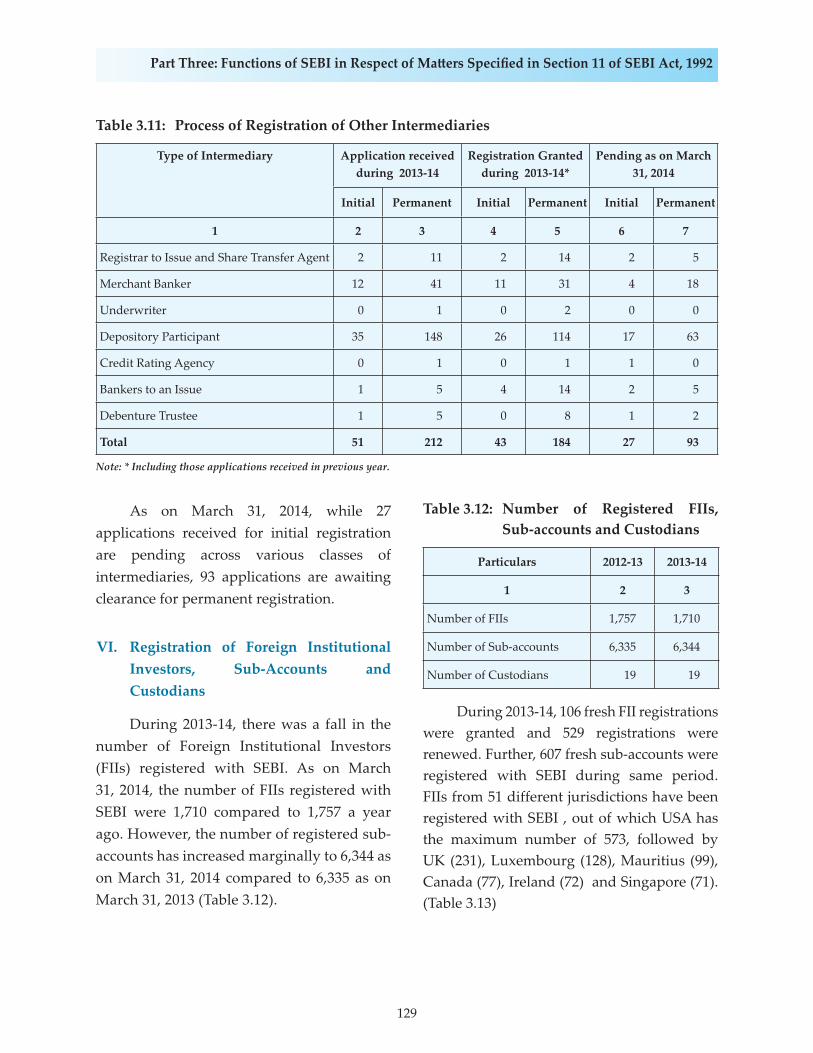
129
Part Three: Functions of SEBI in Respect of Ma� ers Specifi ed in Section 11 of SEBI Act, 1992
Table 3.11: Process of Registration of Other Intermediaries
Type of Intermediary
Application received during 2013-14
Registration Granted during 2013-14*
Pending as on March 31, 2014
Initial Permanent Initial Permanent Initial Permanent
1 2 3 4 5 6 7
Registrar to Issue and Share Transfer Agent 2 11 2 14 2 5
Merchant Banker 12 41 11 31 4 18
Underwriter 0 1 0 2 0 0
Depository Participant 35 148 26 114 17 63
Credit Rating Agency 0 1 0 1 1 0
Bankers to an Issue 1 5 4 14 2 5
Debenture Trustee 1 5 0 8 1 2
Total 51 212 43 184 27 93
Note: * Including those applications received in previous year.
As on March 31, 2014, while 27 applications received for initial registration are pending across various classes of intermediaries, 93 applications are awaiting clearance for permanent registration.
VI. Registration of Foreign Institutional Investors, Sub-Accounts and Custodians
During 2013-14, there was a fall in the number of Foreign Institutional Investors (FIIs) registered with SEBI. As on March 31, 2014, the number of FIIs registered with SEBI were 1,710 compared to 1,757 a year ago. However, the number of registered sub-accounts has increased marginally to 6,344 as on March 31, 2014 compared to 6,335 as on March 31, 2013 (Table 3.12).
Table 3.12: Number of Registered FIIs, Sub-accounts and Custodians
Particulars 2012-13 2013-14
1 2 3
Number of FIIs 1,757 1,710
Number of Sub-accounts 6,335 6,344
Number of Custodians 19 19
During 2013-14, 106 fresh FII registrations were granted and 529 registrations were renewed. Further, 607 fresh sub-accounts were registered with SEBI during same period. FIIs from 51 different jurisdictions have been registered with SEBI , out of which USA has the maximum number of 573, followed by UK (231), Luxembourg (128), Mauritius (99), Canada (77), Ireland (72) and Singapore (71). (Table 3.13)
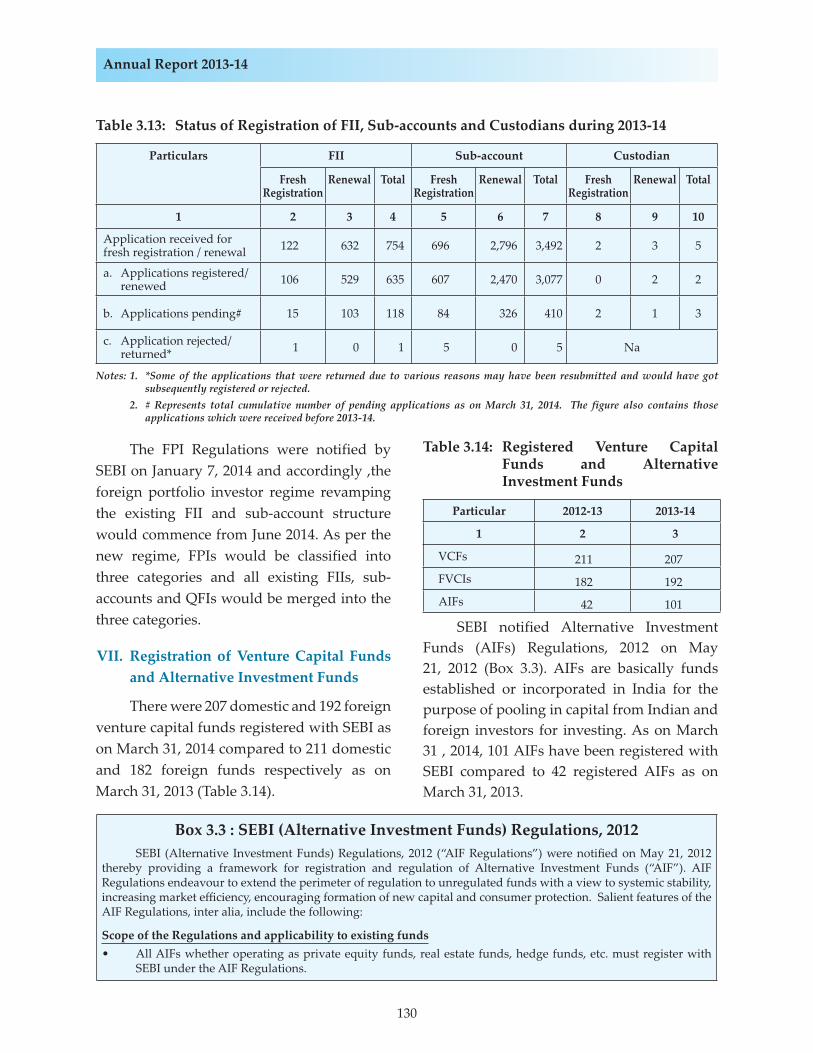
130
Annual Report 2013-14
Table 3.13: Status of Registration of FII, Sub-accounts and Custodians during 2013-14
Particulars FII Sub-account Custodian
Fresh Registration
Renewal Total Fresh Registration
Renewal Total Fresh Registration
Renewal Total
1 2 3 4 5 6 7 8 9 10
Application received for fresh registration / renewal 122 632 754 696 2,796 3,492 2 3 5
a. Applications registered/renewed 106 529 635 607 2,470 3,077 0 2 2
b. Applications pending# 15 103 118 84 326 410 2 1 3
c. Application rejected/returned* 1 0 1 5 0 5 Na
Notes: 1. *Some of the applications that were returned due to various reasons may have been resubmitted and would have got subsequently registered or rejected.
2. # Represents total cumulative number of pending applications as on March 31, 2014. The figure also contains those applications which were received before 2013-14.
The FPI Regulations were notified by SEBI on January 7, 2014 and accordingly ,the foreign portfolio investor regime revamping the existing FII and sub-account structure would commence from June 2014. As per the new regime, FPIs would be classified into three categories and all existing FIIs, sub-accounts and QFIs would be merged into the three categories.
VII. Registration of Venture Capital Funds and Alternative Investment Funds
There were 207 domestic and 192 foreign venture capital funds registered with SEBI as on March 31, 2014 compared to 211 domestic and 182 foreign funds respectively as on March 31, 2013 (Table 3.14).
Table 3.14: Registered Venture Capital Funds and Alternative Investment Funds
Particular 2012-13 2013-14
1 2 3
VCFs 211 207FVCIs 182 192AIFs 42 101
SEBI notified Alternative Investment Funds (AIFs) Regulations, 2012 on May 21, 2012 (Box 3.3). AIFs are basically funds established or incorporated in India for the purpose of pooling in capital from Indian and foreign investors for investing. As on March 31 , 2014, 101 AIFs have been registered with SEBI compared to 42 registered AIFs as on March 31, 2013.
Box 3.3 : SEBI (Alternative Investment Funds) Regulations, 2012 SEBI (Alternative Investment Funds) Regulations, 2012 (“AIF Regulations”) were notifi ed on May 21, 2012 thereby providing a framework for registration and regulation of Alternative Investment Funds (“AIF”). AIF Regulations endeavour to extend the perimeter of regulation to unregulated funds with a view to systemic stability, increasing market effi ciency, encouraging formation of new capital and consumer protection. Salient features of the AIF Regulations, inter alia, include the following:
Scope of the Regulations and applicability to existing funds• All AIFs whether operating as private equity funds, real estate funds, hedge funds, etc. must register with
SEBI under the AIF Regulations.
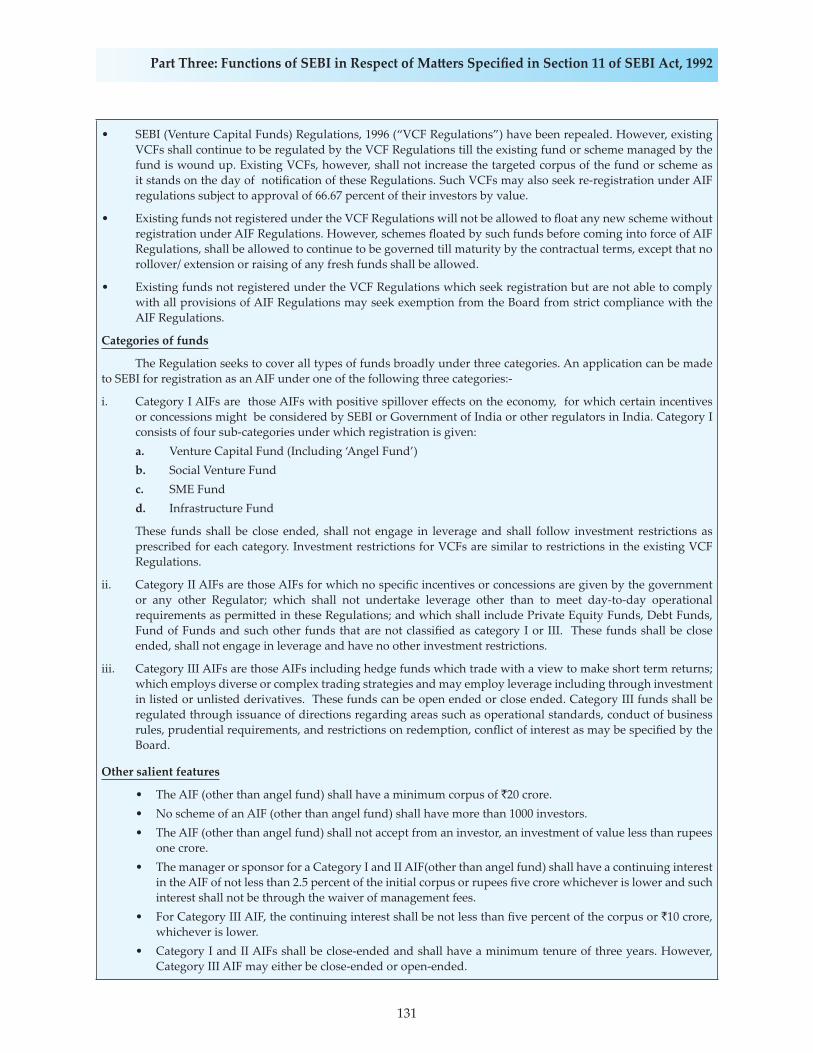
131
Part Three: Functions of SEBI in Respect of Ma� ers Specifi ed in Section 11 of SEBI Act, 1992
• SEBI (Venture Capital Funds) Regulations, 1996 (“VCF Regulations”) have been repealed. However, existing VCFs shall continue to be regulated by the VCF Regulations till the existing fund or scheme managed by the fund is wound up. Existing VCFs, however, shall not increase the targeted corpus of the fund or scheme as it stands on the day of notifi cation of these Regulations. Such VCFs may also seek re-registration under AIF regulations subject to approval of 66.67 percent of their investors by value.
• Existing funds not registered under the VCF Regulations will not be allowed to fl oat any new scheme without registration under AIF Regulations. However, schemes fl oated by such funds before coming into force of AIF Regulations, shall be allowed to continue to be governed till maturity by the contractual terms, except that no rollover/ extension or raising of any fresh funds shall be allowed.
• Existing funds not registered under the VCF Regulations which seek registration but are not able to comply with all provisions of AIF Regulations may seek exemption from the Board from strict compliance with the AIF Regulations.
Categories of funds
The Regulation seeks to cover all types of funds broadly under three categories. An application can be made to SEBI for registration as an AIF under one of the following three categories:-
i. Category I AIFs are those AIFs with positive spillover eff ects on the economy, for which certain incentives or concessions might be considered by SEBI or Government of India or other regulators in India. Category I consists of four sub-categories under which registration is given:
a. Venture Capital Fund (Including ‘Angel Fund’) b. Social Venture Fund c. SME Fund d. Infrastructure Fund
These funds shall be close ended, shall not engage in leverage and shall follow investment restrictions as prescribed for each category. Investment restrictions for VCFs are similar to restrictions in the existing VCF Regulations.
ii. Category II AIFs are those AIFs for which no specifi c incentives or concessions are given by the government or any other Regulator; which shall not undertake leverage other than to meet day-to-day operational requirements as permi� ed in these Regulations; and which shall include Private Equity Funds, Debt Funds, Fund of Funds and such other funds that are not classifi ed as category I or III. These funds shall be close ended, shall not engage in leverage and have no other investment restrictions.
iii. Category III AIFs are those AIFs including hedge funds which trade with a view to make short term returns; which employs diverse or complex trading strategies and may employ leverage including through investment in listed or unlisted derivatives. These funds can be open ended or close ended. Category III funds shall be regulated through issuance of directions regarding areas such as operational standards, conduct of business rules, prudential requirements, and restrictions on redemption, confl ict of interest as may be specifi ed by the Board.
Other salient features
• The AIF (other than angel fund) shall have a minimum corpus of `20 crore. • No scheme of an AIF (other than angel fund) shall have more than 1000 investors. • The AIF (other than angel fund) shall not accept from an investor, an investment of value less than rupees
one crore. • The manager or sponsor for a Category I and II AIF(other than angel fund) shall have a continuing interest
in the AIF of not less than 2.5 percent of the initial corpus or rupees fi ve crore whichever is lower and such interest shall not be through the waiver of management fees.
• For Category III AIF, the continuing interest shall be not less than fi ve percent of the corpus or `10 crore, whichever is lower.
• Category I and II AIFs shall be close-ended and shall have a minimum tenure of three years. However, Category III AIF may either be close-ended or open-ended.
132
Annual Report 2013-14
• Schemes may be launched under an AIF subject to fi ling of information memorandum with the Board along with applicable fees.
• Units of AIF may be listed on stock exchange subject to a minimum tradable lot of rupees one crore. However, AIF shall not raise funds through stock exchange mechanism.
• Category I and II AIFs shall not be permi� ed to invest more than 25 percent of the investible funds in one investee company. Category III AIFs shall invest not more than 10 percent of the corpus in one investee company.
• AIF (other than angel fund) shall not invest in associates except with the approval of 75 percent of investors by value of their investment in the AIF.
• All AIFs shall have QIB status as per SEBI (Issue of Capital and Disclosure Requirements) Regulations, 2009.
• The Regulations provide for transparency and disclosures and mechanism for avoidance of confl ict of interest.
Angel Funds
“Angel fund” is a sub-category of Venture Capital Fund under Category I- AIF that raises funds from angel investors and invests in accordance with the provisions of Chapter III-A of AIF Regulations. The Angel Fund shall only raise funds by way of issue of units to angel investors. “Angel investor” means any person who proposes to invest in an angel fund and satisfi es one of the following conditions, namely,(a) an individual investor who has net tangible assets of at least two crore rupees excluding value of his principal
residence, and who: (i) has early stage investment experience, or (ii) has experience as a serial entrepreneur, or (iii) is a senior management professional with at least ten years of experience; (‘Early stage investment experience’ shall mean prior experience in investing in start-up or emerging or early-stage
ventures and ‘serial entrepreneur’ shall mean a person who has promoted or co-promoted more than one start-up venture.)
(b) a body corporate with a net worth of at least ten crore rupees; or(c) an AIF registered under these regulations or a VCF registered under the SEBI (Venture Capital Funds)
Regulations, 1996.
Salient features • The Angel Fund shall have a minimum corpus of rupees ten crore. • No scheme of the Angel Fund shall have more than forty-nine angel investors. • The Angel fund shall accept, up to a maximum period of three years, an investment of not less than 25 lakh
rupees from an angel investor. • The manager or sponsor of the Angel Fund shall have the continuing interest in the Angel Fund of not less
than two and half percent of the corpus or fi � y lakh rupees, whichever is lower and such interest shall not be through the waiver of management fees.
• The Angel Fund shall be close ended. • Units of angel funds shall not be listed on any recognised stock exchange. • Angel funds shall invest only in venture capital undertakings which: i) have been incorporated during the preceding three years from the date of such investment; ii) have a turnover of less than twenty fi ve crore rupees; iii) are not promoted or sponsored by or related to an industrial group whose group turnover exceeds
300 crore rupees; and iv) are not companies with family connection with any of the angel investors who are investing in
the company. • Investment by an angel fund in any venture capital undertaking shall not be less than 50 lakh rupees and
shall not exceed fi ve crore rupees. • Investment by an angel fund in the venture capital undertaking shall be locked-in for a period of three
years. • Angel funds shall not invest in associates. • Angel funds shall not invest more than 25 percent of the total investments under all its schemes in one
venture capital undertaking.
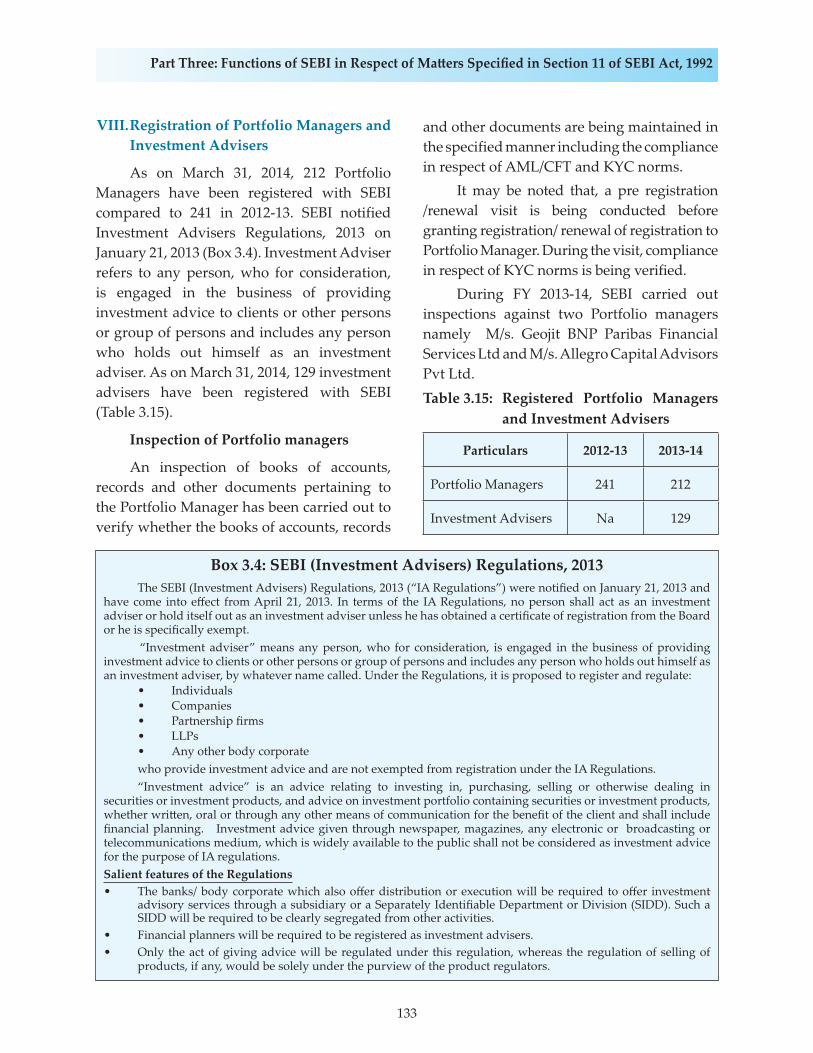
133
Part Three: Functions of SEBI in Respect of Ma� ers Specifi ed in Section 11 of SEBI Act, 1992
VIII. Registration of Portfolio Managers and Investment Advisers
As on March 31, 2014, 212 Portfolio Managers have been registered with SEBI compared to 241 in 2012-13. SEBI notified Investment Advisers Regulations, 2013 on January 21, 2013 (Box 3.4). Investment Adviser refers to any person, who for consideration, is engaged in the business of providing investment advice to clients or other persons or group of persons and includes any person who holds out himself as an investment adviser. As on March 31, 2014, 129 investment advisers have been registered with SEBI (Table 3.15).
Inspection of Portfolio managers
An inspection of books of accounts, records and other documents pertaining to the Portfolio Manager has been carried out to verify whether the books of accounts, records
and other documents are being maintained in the specified manner including the compliance in respect of AML/CFT and KYC norms. It may be noted that, a pre registration /renewal visit is being conducted before granting registration/ renewal of registration to Portfolio Manager. During the visit, compliance in respect of KYC norms is being verified. During FY 2013-14, SEBI carried out inspections against two Portfolio managers namely M/s. Geojit BNP Paribas Financial Services Ltd and M/s. Allegro Capital Advisors Pvt Ltd.Table 3.15: Registered Portfolio Managers and Investment Advisers
Particulars 2012-13 2013-14
Portfolio Managers 241 212
Investment Advisers Na 129
Box 3.4: SEBI (Investment Advisers) Regulations, 2013 The SEBI (Investment Advisers) Regulations, 2013 (“IA Regulations”) were notifi ed on January 21, 2013 and have come into eff ect from April 21, 2013. In terms of the IA Regulations, no person shall act as an investment adviser or hold itself out as an investment adviser unless he has obtained a certifi cate of registration from the Board or he is specifi cally exempt. “Investment adviser” means any person, who for consideration, is engaged in the business of providing investment advice to clients or other persons or group of persons and includes any person who holds out himself as an investment adviser, by whatever name called. Under the Regulations, it is proposed to register and regulate: • Individuals • Companies • Partnership fi rms • LLPs • Any other body corporate who provide investment advice and are not exempted from registration under the IA Regulations. “Investment advice” is an advice relating to investing in, purchasing, selling or otherwise dealing in securities or investment products, and advice on investment portfolio containing securities or investment products, whether wri� en, oral or through any other means of communication for the benefi t of the client and shall include fi nancial planning. Investment advice given through newspaper, magazines, any electronic or broadcasting or telecommunications medium, which is widely available to the public shall not be considered as investment advice for the purpose of IA regulations.Salient features of the Regulations• The banks/ body corporate which also off er distribution or execution will be required to off er investment
advisory services through a subsidiary or a Separately Identifi able Department or Division (SIDD). Such a SIDD will be required to be clearly segregated from other activities.
• Financial planners will be required to be registered as investment advisers.• Only the act of giving advice will be regulated under this regulation, whereas the regulation of selling of
products, if any, would be solely under the purview of the product regulators.
134
Annual Report 2013-14
• The investment adviser shall not obtain any remuneration or compensation from any person other than from the client being advised.
• For a bank or body corporate having a distribution or execution business, it would be necessary to keep the investment advisory services segregated from such activities and to make disclosures to the clients being advised about any remuneration or compensation received by it and any of its associates for the distribution or execution services.
• The investment advisers registered under the regulations shall use the words “investment adviser” in their name.
• Individual investment adviser/ partner/ representative of a body corporate offering investment advice shall: – have a professional qualification or post graduate degree or diploma in finance, accountancy, business
management, commerce, economics, capital market, banking, insurance or actuarial science or any state government from a university or an institution recognised by the central government or a recognised foreign university or institution or association or a graduate in any discipline with an experience of at least five years in activities relating to advice in financial products or securities fund or asset or portfolio management.
– obtain a certification accredited by NISM from NISM/FPSB/exchange on Financial Planning or fund or asset management or investment advisory services.
• Investment advisers who are body corporate shall have a minimum net worth of `25 lakh.• Investment advisers who are individuals or partnership firms shall have minimum net tangible assets rupees
one lakh.• The applicant needs to be a fit and proper person. • The regulations provide for code of conduct, fiduciary duties, record keeping, risk profiling of the clients and
also deal with the issue of suitability and appropriateness of the advice.
3. REGISTRATION AND REGULATION OF WORKING OF COLLECTIVE INVESTMENT SCHEMES INCLUDING MUTUAL FUNDS
I. Registration of Collective Investment Schemes
As on March 31, 2014, there was only one registered CIS, viz. M/s. Gift Collective Investment Management Company Ltd. which was registered during 2008-09.
II. Inspection of Collective Investment Schemes
During FY 2013-14, SEBI carried out inspections against three entities, subsequent to the interim orders against them, to ascertain their compliance with the directions in the interim orders.
III. Regulatory actions against Collective Investment Schemes
During financial year 2013-14, the following orders were passed against entities
carrying out CIS activities without obtaining registration from SEBI:
A. M/s. Sumangal Industries Ltd.
The company was found to be carrying out CIS activities without obtaining registration from SEBI and hence, an interim order u/s 11B of the SEBI Act, 1992 was issued on April 10, 2013 whereby the company was inter-alia directed not to raise any further money from investors and not to dispose off any assets/ properties related to its schemes. Subsequently, vide final order dated July 9, 2013, SEBI directed M/s. Sumangal Industries Ltd. to wind up its existing collective investment schemes and refund the money collected by it under the schemes with returns which are due to the investors as per the terms of offer within a period of three months. Further, the company and directors have been debarred from accessing the capital market till all its schemes are wound up and all the money mobilized are refunded to investors.
135
Part Three: Functions of SEBI in Respect of Ma� ers Specifi ed in Section 11 of SEBI Act, 1992
Managing Director, Mr. Sudipta Sen, to wind up its existing collective investment schemes and refund the money collected by it under the schemes with returns which are due to the investors as per the terms of offer within a period of three months from the date of the order and submit a winding up and repayment report to SEBI. Also the company and its Managing Director have been directed not to access the capital market and have been further restrained and prohibited them from buying, selling or otherwise dealing in the securities market till all its collective investment schemes are wound up and all the monies mobilized through them are refunded to the investors.
D. M/s. Ken Infratech Ltd.
The company was found to be carrying out CIS activities without obtaining registration from SEBI and hence an ex- parte interim Order cum show cause notice u/s 11B of the SEBI Act, 1992 was issued on June 18, 2013 whereby the company and its promoters and directors were inter-alia directed not to raise any further money from investors and not to dispose off any assets/ properties related to its schemes.
E. M/s. Alchemist Infra Reality Ltd.
An order u/s 11B of the SEBI Act, 1992 was issued on June 21, 2013 directing the company to wind up its existing ‘collective investment scheme’ and refund the monies, collected by it under its scheme to all the investors within a period of three months.
F. M/s. Rose Valley Hotels and Entertainments Ltd.
The company was found to be carrying out CIS activities without obtaining registration from SEBI and hence an interim order u/s 11B of the SEBI Act, 1992 was issued on July 10, 2013 whereby the company has been, inter-alia, directed not to collect any further money from investors and not to dispose off any assets/ properties related to its schemes.
B. M/s. Osian’s Connoisseurs of Art Private Ltd.
SEBI passed an order dated April 15, 2013 in the matter of Art Fund sponsored by M/s. Osian’s Connoisseurs of Art Private Ltd (the company) in the nature of CIS and directed it to wind up its existing ‘collective investment scheme’ and refund the monies, collected by it under its scheme but remaining unpaid, to all the investors within a period of three months from the date of the order. In addition, the company was also directed to pay the amount of profits/income earned, if any, that is due to the investors as per the terms of its offer or pay interest at the rate of 10 percent per annum from the date of investment till the date of refund, whichever is higher. Further, the company was also directed not to access the capital market and was further restrained and prohibited from buying, selling or otherwise dealing in the securities market till its collective investment scheme/s is/are wound up and all the monies mobilized through them are refunded to the investors.
The company had sponsored an Art Fund namely Osian Art Fund which in turn floated a close-ended scheme Contemporary-1 which involved pooling of investments from investors with the objective to generate income and capital growth from a portfolio of investment and management in the art works. The company also acted as an Asset Management Company and Oseta Investments Trustee Company Private Ltd was appointed as Trustee for the Osian Art Fund. The company was found to be engaged in the fund mobilizing activity from investors by sponsoring/ launching or cause to be sponsored/ launched ‘CIS as defined in Section 11AA of the SEBI Act, 1992.
C. M/s. Saradha Realty India Ltd.
SEBI passed an order dated April 23, 2013 directing M/s. Saradha Realty India Ltd. and its
136
Annual Report 2013-14
G. M/s. HBN Dairies and Allied Ltd.
Vide order dated July 12, 2013, M/s. HBN and its directors were inter-alia directed not to solicit or collect any further money/ investments from investors/ customers into its schemes or launch or carry out any money collection schemes. Further, M/s. HBN and its directors were directed to submit to SEBI, a reasonable proposal including firm time lines with regard to the manner in which it proposes to wind up its schemes and make payments along with the returns which are due to its investors, within a period of 30 days from the date of the order.
H. M/s. Sai Prasad Foods Ltd.
SEBI passed an interim order on July 17, 2013 in the matter of M/s. Sai Prasad Foods Ltd. directing the company and its directors viz. Mr. Balasaheb K. Bhapkar, Mrs. Vandana B. Bhapkar and Mr. Shashank B. Bhapkar not to collect any more money from investors including under the existing schemes, not to launch any new schemes, not to dispose of any of the properties or alienate any of the assets of the schemes and not to divert any funds raised from public at large which are kept in bank account(s) and/or in the custody of the company.
M/s. Sai Prasad Foods Ltd was prima facie found to be engaged in fund mobilising activity from public by floating ‘collective investment schemes’ as defined in Section 11AA of the SEBI Act, 1992.
I. M/s. Sai Prasad Properties Ltd.
SEBI passed an interim order on July 17, 2013 in the matter of M/s. Sai Prasad Properties Ltd. directing the company and its directors/promoters, including Mr. Balasaheb K. Bhapkar and Mrs. Vandana B. Bhapkar not to collect any more money from investors including under the existing schemes, not
to launch any new schemes or plans, not to dispose of or alienate any of the properties or assets owned or acquired in respect of or in pursuance of the schemes and not to divert any funds raised from public at large which are kept in bank account(s) and/or in the custody of the company.
M/s. Sai Prasad Foods Ltd was prima facie found to be engaged in fund mobilising activity from public by floating ‘collective investment schemes’ as defined in Section 11AA of the SEBI Act, 1992.
J. M/s. Maitreya Plotters & Structures Pvt. Ltd.
SEBI passed an order on August 30, 2013 under sections 11(1), 11B and 11(4) of SEBI Act, 1992 read with Regulation 65 of the SEBI (CIS) Regulations, 1999 in the matter of M/s. Maitreya Plotters and Structures Pvt. Ltd. The order directed the company and its directors viz. Mrs. Varsha Madhusudan Satpalkar and Mr. Janardan Arvind Parulekar not to collect any more money from investors including under the existing schemes, not to launch any new schemes, not to dispose of any of the properties or alienate any of the assets of the schemes and not to divert any funds raised from public at large which are kept in bank account(s) and/or in the custody of the company.
M/s. Maitreya Plotters and Structures Pvt. Ltd. was prima facie found to be engaged in fund mobilising activity from public by floating ‘collective investment schemes’ as defined in Section 11AA of the SEBI Act, 1992.
K. M/s. KBCL India Ltd.
SEBI passed an order on September 12, 2013 under Sections 11(1), 11(4) and 11B of SEBI Act, 1992 read with Regulation 65 of the SEBI (CIS) Regulations, 1999 in the matter of M/s. KBCL India Ltd. The order directed the company and its directors viz. Mr. Rakesh
137
Part Three: Functions of SEBI in Respect of Ma� ers Specifi ed in Section 11 of SEBI Act, 1992
Kumar, Mr. Vishvnath Pratap Singh and Mr. Shashi Kant Mishra not to collect any more money from investors including under the existing schemes, not to launch any new schemes, not to dispose of any of the properties or alienate any of the assets of the schemes and not to divert any funds raised from public at large which are kept in bank account(s) and/or in the custody of M/s. KBCL India Ltd.
M/s. KBCL India Ltd was prima facie found to be engaged in fund mobilising activity from public by floating ‘collective investment schemes’ as defined in Section 11AA of the SEBI Act, 1992.
L. M/s. MVL Ltd.
Vide an interim order dated September 26, 2013 by SEBI, M/s. MVL Ltd. and its directors were inter-alia directed not to collect any money from investors including under the existing ‘India Business Centre’ (IBC) project, not to launch any new scheme, not to dispose of any of the properties or alienate any assets of the IBC project and not to divert any funds raised from public under the IBC project which are kept in bank accounts and/ or in the custody of the company.
M. M/s. Samruddha Jeevan Foods India Ltd.
SEBI passed an interim order on October 31, 2013 in the matter of M/s. Samruddha Jeevan Foods India Ltd. directing the company and its directors viz. Mr. Mahesh Kisan Motewar, Mrs. Vaishali Mahesh Motewar and Mr. Ghanshyam Jashbhai Patel not to collect any more money from investors including under the existing schemes, not to launch any new schemes, not to dispose of any of the properties or alienate any of the assets of the schemes and not to divert any funds raised from public at large which are kept in bank account(s) and/or in the custody of the company. M/s. Samruddha Jeevan Foods
India Ltd was prima facie found to be engaged in fund mobilising activity from public by floating ‘collective investment schemes’ as defined in Section 11AA of the SEBI Act, 1992.
N. M/s. Servehit Housing & Infrastructure India Ltd.
Vide an interim order dated October 31, SEBI inter-alia directed M/s. Servehit Housing & Infrastructure India Ltd. and its directors not to collect any money from investors under the existing schemes; not to launch any new schemes or plans; not to dispose of or alienate any of the properties or assets owned or acquired in respect of or in pursuance of the plans or schemes or earmarked / allotted to the investors under the plans / schemes; not to divert any fund raised from public at large kept in bank account(s) and/or in the custody of the company and to immediately submit the full inventory of the assets owned by the company out of the amounts collected from the ‘customers’/ investors under its various schemes.
O. M/s. Orient Resorts (India) Pvt. Ltd.
Vide order dated November 26, 2013, SEBI directed M/s. Orient Resorts (India) Pvt. Ltd. to wind up its existing collective investment schemes and refund the money collected by it under the schemes with returns which are due to the investors as per the terms of offer within a period of three months. Further, the company and directors were debarred from accessing the capital market till all its schemes are wound up and all the money mobilized is refunded to investors.
P. M/s. Kim Infrastructure and Developers Ltd.
Vide interim order dated December 5, 2013 SEBI inter-alia directed M/s. KIM Infrastructure and Developers Ltd. not to collect any more money from investors including under the existing schemes; not to launch any new schemes; to give a full

138
Annual Report 2013-14
inventory of the assets owned by the company to SEBI; not to dispose of any of the properties or alienate any of the assets of the schemes; not to divert any funds raised from public at large which are kept in bank account(s) and/or in the custody of M/s. Kim Infrastructure and Developers Ltd.
Q. M/s. Sun-Plant Agro Ltd. (SPAL)
Vide order dated May 03, 2011, SEBI directed M/s. SPAL to repay the mobilized funds to the investors within a period of three months. Since M/s. SPAL failed to confirm compliance of the directions issued to it vide the order dated May 3, 2011, SEBI issued a Show Cause Notice (SCN) dated January 3, 2013 to M/s. SPAL and its directors/ persons in charge of business of its scheme(s){hereinafter referred to as ‘the noticees’} calling upon them to show cause as to why appropriate actions, as contemplated in the SCN, in terms of SEBI Act and CIS Regulations should not be taken against the noticees for failure to comply with the said order. Subsequently, vide order dated December 30, 2013, SEBI inter-alia restrained and debarred M/s. SPAL and its directors, namely, Mr. Awdesh Kumar Singh, Mr. Girija Shankar Kumar and Mr. Sant Kumar from accessing the securities market for a period of five years, and prohibited the said entities/ persons from mobilizing funds under any schemes or arrangement, existing or future, as defined under section 11AA of the SEBI Act, 1992. Further, it was clarified that the directions passed in this order shall not be construed to absolve the M/s. SPAL and other noticees from the obligations to wind up all its collective investment schemes and repay the investors to the satisfaction of SEBI.
R. M/s. Shree Sai Spaces Creations Ltd.
SEBI passed an interim order on Jan 23, 2014 in the matter of M/s. Shree Sai Spaces and Creations Ltd. directing the company and its
directors, Mr. Suresh L Srivastav, Ms. Laxmi S Shrivastav, Mr. Ritesh K Shrivastav, Mr. Vivek Kumar Suresh Srivastav and Mr. Rajkumar Laxman Konde not to collect any money from investors from its existing project/scheme, not to launch any new project /scheme, not to dispose of or alienate any of the properties or assets owned or acquired in respect of or in pursuance of the schemes and not to divert any funds raised from public at large which are kept in bank account(s) and/or in the custody of the company.
M/s. Shree Sai Spaces and Creations Ltd was prima facie found to be engaged in fund mobilising activity from public by floating ‘collective investment schemes’ as defined in Section 11AA of the SEBI Act, 1992.
S. M/s. Green Ray International Ltd.
SEBI passed an order dated February 3, 2014 inter-alia directing M/s. Green Ray International Ltd and its directors/promoters to wind up the existing collective investment schemes and refund the money collected by the said company under the schemes with returns which are due to its investors as per the terms of offer within a period of three months from the date of the order and submit a winding up and repayment report to SEBI.
T. M/s. Royal Twinke Star Club Private Ltd.
SEBI passed an interim order on March 7, 2014 in the matter of M/s. Royal Twinkle Star Club Private Ltd. directing the company and its directors viz. Mr. Omprakash Basantlal Goenka, Mr.Prakash Ganpat Utekar, Mr. Venkatraman Natrajan and Mr.Narayan Shivram Kotnis not to collect any more money from investors including under the existing schemes, not to launch any new schemes, not to dispose of any of the properties or alienate any of the assets of the schemes and not to divert any funds raised from public at large

139
Part Three: Functions of SEBI in Respect of Ma� ers Specifi ed in Section 11 of SEBI Act, 1992
which are kept in bank account(s) and/or in the custody of the company. M/s. Royal Twinkle Star Club Private Ltd was prima facie found to be engaged in fund mobilising activity from public by floating ‘collective investment schemes’ as defined in Section 11AA of the SEBI Act, 1992.
U. M/s. Bajaj Capital Ltd.
Vide order dated March 11, 2014, SEBI disposed off the Show Cause Notice dated June 14, 2007 issued to M/s. Bajaj Capital Ltd. The said Show Cause Notice issued to the entity alleged violation of provisions of Section 12 read with Sections 11 and 11AA of the SEBI Act, 1992 and the provisions of SEBI (CIS) Regulations, 1999.
V. M/s. RR Investors Capital Services Private Ltd.
Vide order dated March 11, 2014, SEBI disposed off the Show Cause Notice dated June 14, 2007 issued to M/s. RR Investors Capital Services Private Ltd. The said Show Cause Notice issued to the entity alleged violation of provisions of Section 12 read with Sections 11 and 11AA of the SEBI Act, 1992 and the provisions of SEBI (CIS) Regulations, 1999.
W. M/s. Marwahs Fine Art Dealers
Vide order dated March 11, 2014, SEBI disposed off the Show Cause Notice dated June 14, 2007 issued to M/s. Marwahs Fine Art Dealers. The said Show Cause Notice issued to the entity alleged violation of provisions of Section 12 read with Sections 11 and 11AA of the SEBI Act, 1992 and the provisions of SEBI (CIS) Regulations, 1999.
X. M/s. Ecogreen Real Estate (India) Ltd.
Vide an interim order dated March 26, 2014, SEBI directed M/s. Ecogreen Real Estate (India) Ltd. and its directors not to collect any money from investors under the existing schemes; not to launch any new schemes or
plans; not to dispose of any of the properties or alienate the assets of the existing scheme; not to divert any funds raised from public at large, kept in bank account(s) and/or in the custody of the company, to immediately submit the full inventory of the assets owned by the company out of the amounts collected from the “customers”/ investors under its existing schemes and to furnish all the information sought by SEBI.
IV. Registration and Regulation of Mutual Funds
As on March 31, 2014, 50 mutual funds were registered with SEBI, of which 43 were in the private sector and seven (including UTI) were in public sector. During 2013-14, Daiwa Mutual Fund was acquired by SBI Mutual Fund following which Daiwa Mutual Fund was deregistered. ICICI Securities Fund was deregistered during this period. The name of Religare Mutual Fund was changed to Religare Invesco Mutual Fund (Table 3.16).
Table 3.16: Mutual Funds Registered with SEBI
Sector 2012-13 2013-14
1 2 3
Public Sector (including UTI) 7 7
Private Sector 45 43
Total 52 50
A. Inspection of Mutual Funds
As per the policy of SEBI regarding inspection of Mutual Funds, a risk based approach has been adopted. The inspections are undertaken based on assets under management and other factors including number of complaints received against MF. During 2013-14, inspection of 21 Mutual Funds and 2 Registrars (executing Mutual Fund transactions) was conducted.
140
Annual Report 2013-14
B. Regulatory Actions against Mutual Funds During 2013-14, 48 warning le� ers and 19 defi ciency le� ers were issued to mutual funds on account of violations of SEBI Regulations / guidelines observed in Compliance Test Reports, inspection reports, etc.
4. PROMOTION AND REGULATION OF SELF REGULATORY ORGANISATIONS
SEBI (Self Regulatory Organisations), 2004 was notified on February 19, 2004 with the objective to promote organisation of intermediaries representing a particular segment of the securities market as a self regulated entity / organisation. To enable the setting up of an SRO for distributors, the SEBI (Self Regulatory Organisations) (Amendment) Regulations, 2013 were notified on January 7, 2013 which stated that distributors shall be deemed as intermediaries. A public notice was issued on March 21, 2013 inviting applications from any group or association of intermediaries which are desirous of being recognized as a Self Regulatory Organisation in terms of SEBI (Self Regulatory Organisations) Regulations, 2004 for distributors of mutual fund products, by making an application as prescribed in the said Regulations. During 2013-14, SEBI decided to have a single SRO for distributors of mutual fund products and a two stage procedure for grant of recognition as SRO for distributors of mutual fund product i.e. grant of in-principle approval and grant of recognition. SEBI received three applications for recognition as SRO and in the matter regarding selection of SRO, a case has been filed and the same is pending before Securities Appelate Tribunal.
5. FRAUDULENT AND UNFAIR TRADE PRACTICES
To protect the interest of investors
and to promote a fair and orderly securities market, SEBI ensures the integrity of markets by detecting market frauds on a proactive basis, investigating abusive, manipulative or illegal trading practices in the securities markets and taking punitive steps to punish the manipulators. Market surveillance helps in ensuring integrity of markets by enabling a safe and sound environment where buyers and sellers are willing to participate confidently.
I. Types of fraudulent and unfair trade practices
A. Entering into synchronized trades / reversal of trades / circular trades within the group and entering into repeated self trades resulting in no change in beneficial ownership, artificial volumes and price rise.
B. Certain connected entities contributed to price rise by placing orders for one share for each buy order in several instances.
C. Transferring shares in off market and then reversing the trade and buying the same back in the market, resulting in artificial volumes.
D. Increasing the price of the scrips in the last few minutes of trading hours affecting the closing price of the scrip on the day. Subsequently, significant quantity of call options is exercised after closing of the market, resulting in profits.
E. Using front entities and creating false or misleading appearance of trading in the securities market, entering into transactions in securities without the intention of performing it or without intention of change of ownership of security and manipulating the price of scrip.
F. Increasing the price of the scrip by executing repeated self trades and profiting from it.
141
Part Three: Functions of SEBI in Respect of Ma� ers Specifi ed in Section 11 of SEBI Act, 1992
was alleged that Mr. V. P. Patel along with GRD group entities and Korp group entities, indulged in structured / synchronized / circular trades, so as to create artificial volumes in the scrip and give exit to the allottees of IPO of BGIL viz. Anoop Jain HUF, Mr. Anoop Vimal Jain, Mrs. Ritu Jain, Ms Shikha Somani and Mr. Nimit Jayendra Shah along with other allottees at a pre-determined price by misusing the stock exchange trading mechanism. It was further alleged that the trading was also instrumental in giving misleading appearance of trading in the scrip of BGI and it was alleged that Mr. V. P. Patel and Mr. Vanraj Singh Kahor had executed self trades.
Adjudicating Officer passed an order imposing a total penalty of `42.50 crore on 21 entities for violation of Section 12A(a), (b) and (c) of the SEBI Act and Regulation 3(a), (b), (c) & (d) and 4(1) & 4(2)(a) (e) and (g) of the SEBI (PFUTP) Regulations, 2003, under Section 15 HA and 15 HB of the SEBI Act, 1992.
C. Order in the matter of M/s Sumeet industries Limited against M/s Sumeet industries Ltd. and 13 other entities.
SEBI conducted an investigation into the trading in the scrip of M/s. Sumeet Industries Ltd. listed at BSE and NSE during the period from October 1, 2006 to March 12, 2007. It was observed that the price of the scrip increased from `4.81 (opening price on December 05, 2006) to `34.25 (opening price on February 21, 2007- a rise of 612 percent) along with volume spurt, and decreased to `26.30 on March 12, 2007. On the basis of investigation it was alleged that M/s. Sumeet Industries Ltd. in collusion with stock broker M/s SIC Stocks and Services Pvt. Ltd. manipulated its order book, created buying pressure in its scrip and paid the consideration to M/s SIC Stocks and Services Pvt. Ltd.
II. Fraudulent and unfair trade practices cases during 2013-14
A. Order in the matter of M/s Brooks Laboratories Ltd against M/s. Konark Commerce & Industries Ltd & 24 other entities.
SEBI conducted investigations into the alleged irregularities in the IPO of M/s. Brooks Laboratories Ltd. (Brooks) for siphoning of funds from the IPO proceeds, by promoters of Brooks, along with M/s. Konark Commerce & Industries Ltd, M/s. Shardaraj Tradefin Ltd, M/s. Suryamukhi Projects Pvt. Ltd and 22 other entities. The investigation inter-alia revealed that an amount of ` 8.25 crore were round tripped by the entities with Brooks in the guise of ICDs through fictitious transactions. M/s. Suryamukhi Projects Pvt. Ltd also received ` 15.30 crore under agreement with Brooks, which was alleged to be not-genuine. It was also alleged that out of IPO proceeds, ` 2.50 crore was transferred to M/s. Overall Financial Consultants Pvt. Ltd. through layers of many entities in complicit with promoters of Brooks which was misutilised by Overall Financial in trading in the shares of Brooks.
Adjudicating Officer passed an order dated December 31, 2013 imposing total penalty of ` 53.50 crore on 25 entities for violations of section 12 A (b) & (c) of the SEBI Act, 1992 and Regulation 3 (c) & (d) and 4 (1) of the SEBI (PFUTP) Regulations, 2003, under Section 15 HA of the SEBI Act, 1992.
B. Order in the matter of M/s. Bharatiya Global Infomedia Limited (BGIL) against Mr. V. P. Patel & 20 other entities.
BGIL had come out with an IPO through book building route in July 2011. On the basis of investigation it was alleged that M/s. GRD group and M/s. Korp group had entered into synchronized / structured trades. Further it

142
Annual Report 2013-14
Adjudicating Officer imposed a total penalty of `17,92,00,000/- on M/s Sumeet industries Ltd. and 13 other entities for the violation of Regulations 3 (b),(c),(d) and 4(1), 4(2) (a),(d),(e),(f) and (r) of SEBI (PFUTP) Regulations, 2003 read with Section 12A(a),(b) & (c) of the SEBI Act, 1992, under Section 15 HA of the SEBI Act, 1992.
D. Order in the matter of trading activity in the scrips of M/s. Nakoda Textiles India Ltd, M/s. Gayatri Projects Ltd., M/s. Nandan Exim Ltd. and M/s. Trimurthi Drugs and Pharmaceuticals Ltd. against Mr. Rameshbhai V Shah & 9 other entities.
The investigation into the trading activity of Sanghvi Group in four scrips M/s. Nakoda Textiles India Ltd, M/s. Gayatri Projects Ltd., M/s. Nandan Exim Ltd. and M/s. Trimurthi Drugs and Pharmaceuticals Ltd. revealed that 10 connected entities of M/s. Sanghvi Group had allegedly indulged in fictitious / artificial trading activities such as self trades, intra-day trades, multiple first trades and synchronised trades by contributing significantly to the increase in price of the four scrips. It was also revealed by investigation that the counterparties to many of such trades were the entities only.
Adjudicating Officer imposed a consolidated monetary penalty of `5 crore on all the entities jointly and severally for the violation of Section 12A(a),(b) and (c) of the SEBI Act,1992 read with Regulation 3(a), (b), (c) and (d) and 4(1), (2)(a) of SEBI (PFUTP) Regulations, 2003, under Section 15 HA of the SEBI Act, 1992.
E. Order in the matter of M/s. Sanwaria Agro Oils Limited against Mr. Anil Agrawal & 8 other entities
SEBI carried out an investigation into the dealings in the scrip of M/s Sanwaria
Agro Oils Limited (SAOL) for the period from February 01, 2009 to February 26, 2010. The investigation, inter-alia, had revealed that the company SAOL, in which Mr. Anil Agrawal was a Whole Time Director had allegedly transferred money to connected companies namely viz. M/s. Unique Ways Realtors Pvt. Ltd. and other entities (collectively referred to as the “Uni group”) who were controlled by Mr. Anil Agrawal and Mr. Rajesh Kapoor.
The Uni group in turn allegedly transferred money to Mr. Rajesh Kapoor who placed orders at price higher than the last traded price and had impacted the price of the scrip and contributed significantly to the price rise in the scrip of SAOL during the investigation period ranging from ` 22.95 on February 02, 2009 to the high of ` 98 on July 08, 2009 and closing at ` 31.45 on February 26, 2010.
Adjudicating Officer imposed a total penalty of `4.5 crore on the nine noticees for the violation of Regulation 3(a), (b), (c), (d), 4(1), 4(2)(d) and (e) of the SEBI (PFUTP) Regulations, 2003, under Section 15 HA of the SEBI Act, 1992.
F. Order in the matter of IPO of M/s RDB Rasayans Ltd. against Mr. Dave Harihar Kiritbhai.
SEBI conducted an investigation into the Initial Public Offer (IPO) of M/s RDB Rasayans Ltd. and its subsequent trading on and around the listing day, as the scrip witnessed wide fluctuations in the price on BSE. It was observed that the scrip on listing day witnessed huge volumes. The scrip opened at a price of `85 and traded in the range of `72.90 to `93.15 and thereafter it started falling sharply and reached its intraday low of `19.80 and closed at `26.50. Further, the major buy transactions on the listing day was seen to have been executed by Mr. Dave Harihar Kiritbhai,
143
Part Three: Functions of SEBI in Respect of Ma� ers Specifi ed in Section 11 of SEBI Act, 1992
before the market price of the shares began to fall and he had incurred huge loss on account of his trading on the listing day. From the bank statements, it was alleged that few transactions took place through inter-connected entities and M/s Sardhav Investment and Finance Pvt. Ltd., one of the inter-connected entities, had transferred money to four major loss making trading clients who had dealt in RDB shares and one of the loss making trading clients was Mr. Dave Harihar Kiritbhai.
Further on the basis of investigations it was alleged that IPO money was routed by M/s RDB Rasayans Ltd. through a web of inter-connected entities to make the transaction look complex and hide the actual source of the money in order to enable Mr. Dave Harihar Kiritbhai to make payments to his stock broker on time i.e. as per T+2 settlement mechanism.
Adjudicating Officer imposed a penalty of `2,00,00,000 /- on Mr. Dave Harihar Kiritbhai for the violation of Sections 12A (a), (b) and (c) of the SEBI Act read with Regulations 3 (a), (b), (c), (d), 4 (1), 4 (2) (a), (d) and (e) of the SEBI (PFUTP) Regulations, 2003, under Section 15 HA of the SEBI Act, 1992.
G. Order in the matter of IPO of M/s RDB Rasayans Ltd. against M/s BMD Exports Pvt. Ltd. and its Directors.
M/s. RDB Rasayans Ltd. came out with an IPO on September 2011. On the basis of investigation it was found that a large portion of the allottees of RDB IPO had sold their shares on the day of listing. M/s BMD Exports Pvt. Ltd. which traded in the scrip on its listing day incurred huge losses on account of the trading. It was alleged that a part of IPO proceeds flowed in from M/s. RDB Rasayans Ltd. to four loss making trading clients including M/s BMD Exports Pvt. Ltd. Further, M/s. BMD Exports Pvt. Ltd. and its directors
Mr. Jitendrabhai Ramanbhai Patel and Shri Madhavlal Bechardas Patel have regularly borrowed funds inter-alia from M/s. Sardhav Investment and Finance Pvt. Ltd. and repaid the same, pursuant to an agreement between M/s. Sardhav Investment and Finance Pvt. Ltd., but the loan agreement entered between them was not duly witnessed by any third party. It was therefore alleged that IPO money was routed by RDB through a web of inter-connected entities to make the transaction look complex and hide the actual source of the money in order to enable BMD to make payments to its stock broker on time i.e. as per T+2 settlement mechanism. Adjudicating Officer imposed a consolidated penalty of ` 2 crore on M/s. BMD Exports Pvt. Ltd. and its Directors, Mr. Jitendrabhai Ramanbhai Patel and Mr. Madhavlal B. Patel for violation of Sections 12A (a), (b) and (c) of the SEBI Act read with Regulations 3 (a), (b), (c), (d), 4 (1), 4 (2) (a), (d) and (e) of SEBI (PFUTP) Regulations, 2003 under Section 15 HA of the SEBI Act, 1992.
H. Order in the matter of M/s. RDB Rasayans Ltd. against M/s. Shreyanshnath Shares and Financial Services Pvt. Limited & its Directors.
SEBI conducted an investigation into the IPO of M/s. RDB Rasayans Ltd and its subsequent trading on and around the listing day as the scrip of RDB witnessed wide fluctuations in the price on BSE. The investigation alleged that IPO money was routed by RDB through a web of inter-connected entities to make the transaction look complex and hide the actual source of the money in order to enable M/s. Shreyanshnath Shares and Financial Services Pvt. Ltd. to make payments to its stock broker on time i.e. as per T+2 settlement mechanism. This fraud was alleged to have been committed by M/s. Shreyanshnath Shares and
144
Annual Report 2013-14
Financial Services Pvt. Ltd and its directors, Mr. Patel Kirtikumar Gopalbhai and Mr. Chauhan Vijaykumar Babubhai.
Adjudicating Officer imposed a consolidated penalty of Rupees one crore on M/s. Shreyanshnath Shares and Financial Services Pvt. Ltd., Mr. Patel Kirtikumar Gopalbhai and Mr. Chauhan Vijaykumar Babubhai under Section 15HA of the SEBI Act 1992 for the violation of Sections 12A (a), (b) and (c) of the SEBI Act read with Regulations 3 (a), (b), (c), (d), 4 (1), 4 (2) (a), (d) and (e) of the SEBI (PFUTP) Regulations, 2003.
I. Order in the matter of M/s. GHCL Ltd against M/s. GHCL Ltd.
Nine promoter entities of M/s. GHCL Ltd., by an arbitration order dated July 23, 2009, were restrained from selling, transferring or creating third party interest in any manner in 86,70,800 shares of M/s. GHCL Ltd., while M/s. GHCL Ltd. disclosed only 15,60,000 shares were encumbered for promoter group entities, for the quarters ending March 31, 2009 and 16,05,000 for the quarter ending June 2009, September 2009, December 2009, March 2010 and June 2010. Thus it was alleged that M/s. GHCL Ltd. had failed to provide the correct details with respect to shares encumbered and thus failed to comply with Clause 35 of the Listing Agreement.
It was also alleged that M/s. GHCL Ltd. by the omission and concealment of the vital information regarding encumbrance of around 48 percent of shares held by promoters and promoter group of M/s. GHCL Ltd, has committed fraud on the investors as per regulation 3(d) of SEBI (PFUTP) Regulations, 2003. It was further alleged that M/s. GHCL Ltd. by its act of causing to publish information which was not true i.e. by providing incorrect number of encumbered shares has also
violated regulation 4(2)(f) of SEBI (PFUTP) Regulations, 2003.
Adjudicating Officer imposed a consolidated penalty of `1,25,00,000/- onM/s. GHCL Ltd. for the violation of Clause 35 of the Listing Agreement and Regulations 3(d), 4(2)(f) of SEBI (PFUTP) Regulations, 2003, under Section 23Eof SCRA Act, 1956 & Section 15 HA of the SEBI Act, 1992.
J. Order in the matter of M/s. Golden Tobacco Ltd against M/s. Golden Tobacco Limited.
Nine promoter entities of M/s. Golden Tobacco Ltd. (GTL), by an arbitration order dated July 23, 2009, were restrained from selling, transferring or creating third party interest in any manner in 32,93,000 shares of M/s. Golden Tobacco Ltd, while quarterly disclosure made for quarters ending March 31, 2009, June 30, 2009, September 30, 2009, December 31, 2009, March 31, 2010, and June 30, 2010 made by GTL stated that only 5,28,000 shares were encumbered for the promoter entities. Thus GTL had allegedly failed to provide the correct details with respect to shares encumbered and thus failed to comply with Clause 35 of the Listing Agreement.
It was also alleged that GTL by the omission and concealment of the vital information regarding encumbrance of around 80 percent of shares held by promoters and promoter group of GTL, has committed fraud on the investors as per regulation 3(d) of SEBI PFUTP Regulations, 2003. It was further alleged that its act of causing to publish information which was not true i.e. by providing incorrect number of encumbered shares has also violated regulation 4(2)(f) of SEBI (PFUTP) Regulations, 2003. Adjudicating Officer imposed a consolidated penalty of `1,00,00,000/- on
145
Part Three: Functions of SEBI in Respect of Ma� ers Specifi ed in Section 11 of SEBI Act, 1992
M/s. GTL for the violation of Clause 35 of the Listing Agreement and Regulations 3(d), 4(2)(f) of SEBI (PFUTP) Regulations, 2003, under Section 23Eof SCRA Act, 1956 & Section 15 HA of the SEBI Act, 1992.
K. Order in respect of Mrs. Vibha Sharma, Mr. Jitendra Kumar Sharma in the matter of Central Bank of India
One Mrs. Vibha Sharma was observed to be front running the orders of Central Bank of India. Investigations revealed that Mr. Jitendra Sharma, husband of Mrs. Vibha Sharma, was an employee of Central Bank of India working as an equity dealer. Investigations also revealed that Mrs. Vibha Sharma bought shares in the morning at around the last traded price (LTP) and placed sell orders at a price which was much higher (around three percent or more above LTP) but just below the buy order price of the trades of Central Bank of India. Thus there was 100 percent matching of her sell orders with the buy orders of Central Bank of India on 14 trading days. Accordingly, Adjudication proceedings was initiated against (1) Mr. Jitendra Sharma for passing on confidential information related to trading by Central Bank of India to his wife and (2) Mrs. Vibha Sharma for obtaining confidential information related to trading by Central Bank of India in connivance with her husband and for front running the trades of Central Bank of India using her own trading account.
Adjudicating Officer imposed a penalty of `25 lakh, jointly and severally, on Mr. Jitendra Sharma and Mrs. Vibha Sharma. Pursuant to the appeal filed by Mr. Jitendra Sharma and Mrs. Vibha Sharma before Hon’ble Securities Appellate Tribunal (SAT), SAT upheld the SEBI order. Further, on the question of law, SAT observed that the act of front running is always considered injurious
be it an intermediary or any other person for that reasons. Therefore, it would like to give a liberal interpretation to the concept of front running and would hold that any person, who is connected with the capital market, and indulges in front running is guilty of a fraudulent market practice as such liable to be punished as per law by SEBI. The definition of front running, therefore, cannot be put in a straight-jacket formula.
L. Interim order in the matter of M/s. PM Telelinks Ltd and M/s. 8K Miles Software Solutions Ltd.
SEBI, suo moto, carried out an examination in the scrip of M/s. P.M. Telelinks Ltd. (PMTL) and M/s. 8K Miles Software Solutions Ltd. (8KMILES) in view of surveillance alerts regarding variation in price.
Examination, prima facie, revealed that promoters of PMTL transferred funds to related/connected entities. The related/connected entities were observed to be trading in the scrip of PMTL immediately after credit of funds in their accounts. These connected entities indulged in creating artificial volumes in the scrip of PMTL and 8KMILES through trading amongst themselves , executing synchronised trades and placed orders at a price higher than the last traded price (LTP), thereby contributing to the rise in price. Once the price of the scrip reached its peak, the aforesaid entities offloaded their shares, thereby resulting in fall in the price of the scrip.
SEBI, passed an ad interim ex -parte order dated April 18, 2013 restraining 13 entities including the promoters of M/s. P.M. Telelinks Ltd. (PMTL), from accessing securities market and prohibiting them from buying, selling or dealing in securities in any manner whatsoever, till further directions in the matter of dealing in the scrip of M/s. P.M. Telelinnks Ltd. (PMTL) and M/s. 8K Miles Software Solutions
146
Annual Report 2013-14
Ltd. (8KMILES). Pursuant to the above, after considering the submissions made by these 13 entities, SEBI has confirmed its directions against 13 entities.
M. Interim order in the matter of Jigar group of entities in the matter of M/s. Polytex India Ltd., M/s. KGN Enterprises Ltd. and M/s. Gemstone Investments Ltd.
SEBI, suo moto, carried out an examination in the scrip of M/s. Polytex India Ltd., M/s. KGN Enterprises Ltd. and M/s. Gemstone Investments Ltd. in view of surveillance alerts regarding variation in price. Examination, prima facie, revealed that certain entities have received funds from Pabari - Parikh Group entities who have been barred from accessing securities market by SEBI vide its order no. -WTM/KMA/ISD/353/02/2011 dated February 2, 2011. These, aforesaid, entities created artificial volumes in the scrips of M/s. Polytex India Ltd., M/s. KGN Enterprises Ltd. and M/s. Gemstone Investments Ltd., substantially traded amongst themselves and placed orders at a price higher than the last traded price and thereby contributed to the rise in price of M/s. Polytex India Ltd., M/s. KGN Enterprises Ltd. and M/s. Gemstone Investments Ltd.
SEBI, passed an ad interim ex -parte order dated May 10, 2013 restraining 11 entities, from accessing securities market and prohibiting them from buying, selling or dealing in securities in any manner whatsoever, till further directions in the matter of M/s. Polytex India Ltd., M/s. KGN Enterprises Ltd. and M/s. Gemstone Investments Ltd. Pursuant to the above, after considering the submissions made by these 11 entities, SEBI has confirmed its directions against 11 entities.
N. Interim order in the matter of M/s. Zylog Systems Ltd (ZSL)
SEBI, suo moto, carried out an examination
in the scrip of M/s. ZSL in view of surveillance alerts regarding variation in price. Examination, prima facie, revealed that a. ZSL provided misleading information
to the stock exchanges wherein it stated that its promoters have been buying and increasing their stake while actually the promoters were net sellers and their shareholding declined due to invocation of pledge by financiers. Similar misleading clarification was also given by the promoter of ZSL, to the media.
b. ZSL disclosed incorrect and false information in the quarterly shareholding pattern for the four quarters in the year 2012 to the stock exchanges by overstating the holding of the promoters and understating the quantum of shares pledged by the promoters.
c. Various instances of non-adherences to accounting standards and listing agreement in the annual report by ZSL have also been observed.
d. There have been repeated instances of false, incorrect and misleading disclosures and concealment of material information by the ZSL and its promoters/directors to the stock exchanges with respect to their on-market and off-market transactions in the scrip and their pledge related transactions.
e. ZSL has provided funds on several occasions to the promoter related entity for dealing in shares of ZSL.
f. The promoters of ZSL along with related entity, acting in concert have acquired shares in ZSL beyond the threshold stipulated under regulation 3(2) of the SEBI(Substantial Acquisition of Shares and Takeovers) Regulations 2011 without complying with the obligation of making open offer.
147
Part Three: Functions of SEBI in Respect of Ma� ers Specifi ed in Section 11 of SEBI Act, 1992
SEBI, passed an ad interim ex -parte order dated June 13, 2013 restraining six entities, from accessing securities market and prohibiting them from buying, selling or dealing in securities in any manner whatsoever, till further directions in the matter of ZSL.
O. Interim order in the matter of entities engaged in Unregistered Investment Advisory and Portfolio Management Activities through Short Message Services (SMSs)
SEBI had noticed that Mr. Imtiyaz Hanif Khanda (proprietor of M/s Right Trade and M/s Sai Traders) and Mr. Vali Mamad Habib Ghaniwala (proprietor of M/s Bull Trader and M/s Laxmi Traders) were offering intraday tips and stock advisory services to investors through Short Message Services (SMSs) via mobile phones. SEBI, as part of its investigation, obtained details of the call data records of the telephone numbers used for sending such SMSs. It was prima-facie observed that the entities through their proprietary concerns were providing investment advice and had solicited business of portfolio management services from the general public without being registered as a portfolio manager with SEBI. The entities had also made misrepresentations by making unrealistic claims, false statements such as having office in various countries, FII based calls, jackpot calls, etc., and they also made representation in reckless and careless manner in their messages and website suggesting facts which are not true. By their acts and omissions they have prima-facie solicited, enticed and induced investors to deal in securities on the basis of their investment advices, stock trade tips, etc.
SEBI passed an ad-interim ex-parte order dated August 20, 2013 debarring these two
entities from buying, selling or dealing in the securities market, either directly or indirectly, in any manner whatsoever till further orders. Further, the above entities including their proprietary concerns were directed to
a. to cease and desist from acting as investment advisers and portfolio managers and not to solicit or undertake such activities or any other unregistered activity in the securities market, directly or indirectly, in any manner whatsoever;
b. immediately withdraw and remove all advertisements, representations, literatures, brochures, materials, publications, documents, websites, etc. in relation to their investment advisory and portfolio management activities or any unregistered activity in the securities market.
Pursuant to the above, after considering the submissions made by these two entities, SEBI has confirmed its directions against two entities.
P. Interim order in the matter of M/s. SMS Techsoft (India ) Ltd.
SEBI, suo moto, carried out an examination in the scrip of M/s. SMS Techsoft in view of various SMSs circulating in the market mentioning therein buy recommendation for the scrip of M/s. SMS Techsoft.
Examination, prima facie, revealed that :
a. The company issued ` 3,00,00,000 equity shares to 31 entities including three promoters of the company, who are related to one Mr. Rajesh Ranka, who was restrained from buying, selling or dealing in securities market in any manner whatsoever for a period of two years vide SEBI order No. WTM/PS/28/IVD/ID-06/JULY/10 dated July 28, 2010.
148
Annual Report 2013-14
b. The preferential allotment was designed merely as a book entry wherein Mr. Rajesh Ranka circulated ` 1,99,50,000 back and forth between the company, other allottees in the purported preferential allotment by the company. The scheme/plan was a camouflage to give misleading impression that many people had subscribed to the shares of M/s. SMS Tech by paying the consideration to the company. The entire allotment money funded by Mr.Rajesh Ranka had been returned to him in the whole plan without the company getting the proceeds of preferential allotment. Effectively, 3,00,00,000 new equity shares have been issued in the names of 31 allottees without receipt of any consideration for the shares allotted in the purported preferential allotment.
c. The company had misrepresented annual reports for the financial years 2011-12 and 2012-13 that the proceeds of the purported preferential allotment has been utilised to purchase land worth ` 30,00,00,000/-.
d. Once the lock-in period for the shares allotted under purported preferential allotment expired on March 12, 2013, the entities related to Shri Rajesh Ranka started creating artificial volume in the scrip by trading amongst themselves and, thereafter, offloading these shares to common investors.
SEBI, passed an ad interim ex -parte order dated November 5, 2013 M/s. SMS Techsoft (India) Ltd, its three promoters (including MD of company), and 29 other entities, from accessing securities market and prohibiting them from buying, selling or dealing in securities in any manner.
Q. Final Order in respect of Jayesh P Khandwala HUF, proprietor of M/s. Zealous Trading Company Ltd in the matter of Initial Public Offers of M/s. IDFC Ltd, M/s. Sasken Communication Technologies Ltd and M/s. Suzlon Energy Ltd.
SEBI, passed disgorgement order on August 12, 2013 in the matter of Initial Public Offering (IPO) in respect of Jayesh P. Khandwala-HUF, who was identified as financier to key operators namely Ms. Roopalben Panchal, M/s. Sugandh Estates and Investment Pvt. Ltd. and Mr. Biren Kantilal Shah. The directions passed are as follows:a. Jayesh P. Khandwala - HUF and
Mr. Jayesh P. Khandwala shall not buy, sell or deal in the securities market in any manner whatsoever or access the securities market, directly or indirectly, for a period of three months from the date of this order;
b. Jayesh P. Khandwala-HUF shall disgorge the unlawful gain of `3,88,08,783/-. It shall also pay `3,74,70,356, being the simple interest at the rate of 12 percent per annum for eight years (2005-13) on the unlawful gain of ̀ 3,88,08,783. Thus, it shall pay a total amount of `7,62,79,139.
c. Jayesh P. Khandwala-HUF shall pay the above amount within 45 (forty five) days from the date of this order by way of crossed demand draft drawn in favour of “Securities and Exchange Board of India”, payable at Mumbai
d. In case the aforesaid amount ̀ 7,62,79,139 is not paid within the specified time, Jayesh P. Khandwala - HUF and Mr. Jayesh P. Khandwala shall be restrained for a further period of seven years from (i) buying, selling or dealing in securities market in any manner whatsoever, (ii) accessing the securities market,
149
Part Three: Functions of SEBI in Respect of Ma� ers Specifi ed in Section 11 of SEBI Act, 1992
directly or indirectly, or (iii) associating with any securities market intermediary or listed company in any manner or capacity, without prejudice to SEBI’s right to enforce disgorgement.
e. The period of debarment already undergone by Jayesh P. Khandwala - HUF and Mr. Jayesh P. Khandwala shall be set-off from the period of debarment as directed herein above.
R. Final Order in the matter of market manipulation using GDR issues against several entities including Shri Arun Panchariya (hereinafter referred to as AP) and M/s. Pan Asia Advisors Ltd. (now known as M/s. Global Finance and Capital Ltd.)
SEBI had passed an ad interim ex-parte order dated September 21, 2011, in the matter of market manipulation using GDR issues against several entities including Mr. Arun Panchariya (hereinafter referred to as AP) and M/s. Pan Asia Advisors Ltd (now known as M/s. Global Finance and Capital Ltd).
SEBI subsequently completed its investigation regarding the role of M/s. Pan Asia and Mr. Arun Panchariya in the matter of market manipulation using GDR issues. It was inter-alia observed that Mr. Arun Panchariya had entered into a fraudulent arrangement with the promoters of certain issuer companies viz. M/s. Asahi Infrastructure & Projects Ltd., M/s. IKF Technologies Ltd., M/s. Avon Corporation Ltd, M/s. K Sera Sera Ltd., M/s. CAT Technologies Ltd. and M/s. Maars Software International Ltd. to issue GDRs. The cross referenced agreements signed by entities of AP and by the issuer company with European American Investment Bank AG, Austria led to GDR proceeds received by company being pledged against loans raised by entity of AP. The names of foreign investors
disclosed to exchanges in India were found to be fictitious. Therefore together, AP and Indian companies have created a scheme to mislead the investors about the inflow of foreign investment through GDRs and that the companies were found as favourable investments by foreign investors. Thereafter, these GDRs were converted through sub-accounts controlled by AP and the shares so converted were dumped in the Indian securities markets to the detriment of the Indian investors.
WTM, SEBI has passed final order dated June 20, 2013 against Mr. Arun Panchariya and M/s. Pan Asia Advisors Ltd in the matter. Directions have been passed against Mr. Arun Panchariya and M/s. Pan Asia Advisors Ltd prohibiting them from rendering services in connection with instruments that are defined as securities (as in section 2(h) of Securities Contracts Regulation Act, 1956) in the Indian market or in any way dealing with them, directly or indirectly, for a period of 10 years, from the date of the order. M/s. Pan Asia and Panchariya have also been prohibited from accessing the capital market directly or indirectly for a period of 10 years, from the date of the order. Entities went in for appeal in Hon’ble SAT. SAT vide order dated September 30, 2013 revoked the directions against both the entities. Presently matter is pending in Supreme Court.
S. Final Order in the matter of market manipulation using GDR issues against several entities including M/s. Cals Refineries Ltd (hereinafter referred to as Cals).
SEBI passed an ad interim ex-parte order dated September 21, 2011, in the matter of market manipulation using GDR issues against several entities including M/s. Cals Refineries Ltd (hereinafter referred to as Cals).
150
Annual Report 2013-14
SEBI subsequently completed its investigation in the matter and it was observed that:a. Cals siphoned funds to the accounts of
its promotersb. Cals provided financial assistance in the
form of guarantee to create illusion of successful GDR subscriptions.
c. Cals concealed material information regarding its GDR issue to mislead its investors and SEBI.
In view of the fraudulent activities of Cals, Whole Time Member, SEBI vide Order dated October 23, 2013, directed M/s. Cals Refineries Ltd not to issue equity shares or any other instrument convertible into equity shares or any other security, for a period of ten years. Further, the prohibition already undergone by Cals pursuant to the SEBI interim order shall be reduced while computing the period in respect of the prohibition imposed vide this order. Presently matter is pending in SAT.
T. Final Order in the matter of market manipulation using GDR issues against several entities including M/s. Mavi Investment Fund Ltd (hereinafter referred to as Mavi)
SEBI passed an ad interim ex-parte order dated September 21, 2011, in the matter of market manipulation using GDR issues against several entities including M/s. Mavi Investment Fund Ltd (Mavi). Subsequently, SEBI completed the investigation against Mavi. Following are the observations with respect to Mavi: a. Mavi had purchased and cancelled GDRs
and sold resultant shares of two listed companies, viz. M/s. Cat Technologies Ltd (“CAT”) and M/s. Maars.
b. The counterparties to the shares sold by Mavi were either CP Group entities or connected to the promoters of the issuer companies.
Following are the details of the counterparties of the shares sold by Mavi in Maars and CAT.a. No connection between Mavi and Arun
Panchariya/CP Group or the promoters of CAT could be established in the investigation.
b. It cannot be conclusively determined that such trades were synchronized by Mavi with the CP Group/promoters of CAT.
Based on the conclusion arrived in the investigation report, Whole Time Member, SEBI vide Order dated September 25, 2013, disposed of the SCN issued to Mavi and the restraint imposed on Mavi vide the aforesaid orders are vacated. However, the revocation is without prejudice to any additional information that SEBI might receive from foreign authorities.
III. Steps taken to prevent the occurrence of fraudulent and unfair trade practices
SEBI has taken the following steps to prevent the occurrence of FUTP practices:
A. SEBI (Prohibition of Fraudulent and Unfair Trade Practices Relating to Securities Market) Regulations, 2003 are in place.
B. Actions are taken in terms of provisions of SEBI Act, 1992 which also includes Adjudication proceedings for levy of monetary penalty. This also acts as a deterrent.
The total penalty imposed by SEBI in adjudication proceedings for the violations of SEBI (Prohibition of Fraudulent and Unfair Trade Practices relating to the Securities Market) Regulations, 2003 was `134.65 crore in 2013-14 compared to `39.98 crore in 2012-13 representing a rise of 236.8 percent. However, the total penalty imposed in 2012-13, includes `1.96 crore imposed under
151
Part Three: Functions of SEBI in Respect of Ma� ers Specifi ed in Section 11 of SEBI Act, 1992
awareness programs/workshops compared to 206 awareness programs/workshops in 2012-13 (Table 3.17).
Table 3.17: Trends in Awareness Programs/ Workshops Conducted by SEBI
Particular 2011-12 2012-13 2013-14
1 2 3 4
Number of Programs 175 206 224
B. Investor Education – Multimedia Campaign
As part of SEBI’s multimedia Investor Education and Awareness Campaign, campaigns aiming to spread awareness regarding Collective Investment Schemes (CIS), were broadcast in mass media through TV and Radio in Hindi, English and 11 major Indian languages. During 2013-14, through above such campaigns, investors were cautioned not to rely on schemes offering unrealistic returns, and not to invest by hearsay and do proper due diligence.
C. Regional Seminars
This initiative started in 2011-12 and has expanded its scope and reach significantly in terms of investor population and geographical landscape. At present it primarily concentrates on Tier II and Tier III cities. During 2013-14, 77 regional seminars have been conducted in Moradabad, Jakhama, Gwalior, Pratapgarh, Mumbai, Sangli, Madurai, Chandigarh, Sirohi, Banaskantha, Mehsana, Bhuj, Vidisha, Bhopal, Ujjain and Indore. Further, to create more awareness regarding unauthorised CIS, a CD containing the media campaigns have been sent to all Resource persons and all offices of SEBI. The same was included as a key topic in all the regional seminars organised (Table 3.18).
SEBI (Prohibition of Fraudulent and Unfair Trade Practices relating to the Securities Market) Regulations, 2003 and SEBI (Stock Brokers and Sub-brokers) Regulations,1992 as common orders were passed in certain matters during 2012-13.
6. INVESTOR EDUCATION AND TRAINING OF INTERMEDIARIES
Section 11(2) (f) of SEBI Act empowers SEBI to promote investors’ education and foster training for intermediaries in the securities market. Along with investor education and training, SEBI has also actively pursued investor grievance redressal with a view to protect the investor interest, enhance the confidence and increase the participation of investors.
I. Investor Education
Education and awareness along with the grievance redressal had been the thrust areas as a part of capacity building and to make investors confident and aware while investing in securities market. SEBI has been actively pursuing investor/ financial education activities in the past. During 2013-14, the same has been continued with wider reach and increase in the total number of such programs.
A. Investor Awareness Programs/Workshops
Various investor awareness programs have been conducted by SEBI with the help of exchanges, depositories and various trade bodies like AMFI etc. SEBI also reimburses the cost of the approved programs conducted by Investor Associations recognised by SEBI, subject to certain limits. The topic of investor grievance redressal mechanism in securities market has been an integral part of all such programs. A booklet on investor grievance redress mechanism has also been published and made available on the investor website. During 2013-14, SEBI has conducted 224
152
Annual Report 2013-14
Table 3.18: Regional Seminars Conducted by SEBI
Particular 2011-12 2012-13 2013-14
1 2 3 4
Number of Seminars 47 44 77
D. Dedicated investor website
SEBI maintains an updated, comprehensive website for education of investors (www.investor.sebi.gov.in). The website has been revamped to make it more user friendly and the educative material is being updated. The schedules of various programmes are also updated on the website. Efforts also have been made to popularise Rajiv Gandhi Equity Savings Scheme (RGESS) through the website. The revised guidelines along with the revised frequently asked questions (FAQs) have been provided in the SEBI investor website.
E. Educative material for investor education and awareness
SEBI is in the process of updating various materials relating to investor education and awareness across various topics in securities market. A series on various topics on modes through which an individual can invest in securities market is being launched.
II. Training of Intermediaries
Pursuant to the announcement made by the Finance Minister in Budget Speech in February 2005, to set up an institution of national importance to cater to securities market education and training of intermediaries, SEBI established the National Institute of Securities Markets (NISM). NISM was set up as a public trust to lead, catalyse and deliver educational and training initiatives to intermediaries and other stakeholders to
enhance the quality of securities markets. The Institute is engaged in capacity building among the stakeholders in the securities markets through financial literacy, professional education, enhancing governance standards and fostering policy research
NISM has established six distinct schools to cater the educational needs of stakeholders and market participants such as investor, issuers, intermediaries, regulator, policy makers, academia and future professionals of securities markets. In addition, NISM publishes various materials with a view to enhance knowledge levels of participants in the securities industry. Over the years, NISM has also developed and implemented certification examinations, as mentioned below, for professionals employed in various segments of the Indian securities markets.
A. Certification of Associated Persons in Securities Markets
NISM launched the following certification examinations in the financial year 2013-14:
• NISM-Series-X-A: Investment Adviser (Level 1) Certification Examination
• NISM-Series-X-B: Investment Adviser (Level 2) Certification Examination
• NISM-Series-III-B: Issuers Compliance Certification Examination
As a part of its periodic examination review, NISM launched revised exams for the following certification examinations in the financial year 2013-14:
• NISM-Series-I: Currency Derivatives Certification Examination
• NISM-Series-II-A: Registrar to an Issue and Share Transfer Agent – (Corporate) Certification Examination
153
Part Three: Functions of SEBI in Respect of Ma� ers Specifi ed in Section 11 of SEBI Act, 1992
• NISM-Series-II-B: Registrar to an Issue and Share Transfer Agent – (Mutual Fund) Certification Examination
• NISM-Series-IV: Interest Rate Derivatives Certification Examination
• NISM Series-V-A: Mutual Fund Distributors Certification Examination,
• NISM-Series-V-B: Mutual Fund Foundation Certification Examination,
• NISM-Series-VI: Depository Operations Certification Examination
• NISM-Series-VII: Securities Operations and Risk Management Certification Examination
• NISM-Series-VIII: Equity Derivatives Certification Examination
• NISM-Series-X-A: Investment Adviser (Level 1) Certification Examination
During the year 2013-14, a total of 1,14,805 candidates appeared for NISM Certification Examinations available in 196 test centres located at 157 cities across India.
B. Development & Administration of Continuing Professional Education (CPE)
NISM launched the following one day CPE Programs during the year:
• CPE Programs for NISM Series-IV: Interest Rate Derivatives Certification Examination
• CPE Programs for NISM Series-VIII: Equity Derivatives Certification Examination
• CPE Programs for NISM-Series-III-A: Securities Intermediaries Compliance (Non-Fund) Certification Examination
NISM also revised the following two days CPE Program and launched them as one Day CPE Program:
• CPE Program for NISM-Series-I: Currency Derivatives Certification Examination
• CPE Program for NISM-Series-II-A: Registrar to an Issue and Share Transfer Agent –Corporate Certification Examination
• CPE Program for NISM-Series-II-B: Registrar to an Issue and Share Transfer Agent – Mutual Fund Certification Examination
• CPE Program for NISM-Series-V-A: Mutual Fund Distributors Certification Examination
• CPE Program for NISM-Series-VI: Depository Operations Certification Examination
• CPE Program for NISM-Series-VII: Securities Operations and Risk Management Certification Examination
NISM has initiated the accreditation of various CPE Providers for the delivery of NISM CPE Programs. In addition to the accredited CPE Providers, NISM also provides classroom delivery of CPE Program specific to each certification examination. During 2013-14, NISM along with CPE Providers conducted 1,065 CPE programs at 102 locations covering 42,678 participants across different segments like Mutual Fund Distributors, Equity derivatives, Currency derivatives, Depository operations, RTA- Corporate, Securities Operations and Risk Management and Mutual Fund Foundation. NISM also undertook an exercise to increase number of CPE trainers. Accordingly, 71
154
Annual Report 2013-14
This will be delivered in a customized Learning management system.
d. Online CPE Registration and Enrolment System (OCRES): NISM is developing a web based online system for registration, enrolment and issuance of certificates to participants of CPE programmes. The fourth phase of development and testing is completed.
e. Skills Registry: Skills Registry, a web based system was developed and made available on NISM website to provide access to the members of public to the database of all certificates issued by NISM.
III. Financial Education
With the aim of spreading financial literacy, SEBI has taken up various programs across the country. The resource person model developed by SEBI has been well appreciated internationally as well as domestically by other regulators and various ministries.
A. Through SEBI trained Resource Persons
SEBI launched a financial education drive through Resource Persons (RPs) in June 2010, where teachers and lecturers were trained and empanelled for conducting financial education workshops. The study material developed for the above target groups is presently available in 10 vernacular languages. During 2013-14, refresher training in two batches was conducted for empanelled RPs in July and August 2013 in New Delhi and Bangalore. As on March 31, 2014, 899 RPs have been empanelled, covering 26 states and six union territories. These Resource Persons have conducted around 9,493 financial education workshops during 2013-14 (Chart 3.1).
new CPE trainers were empanelled during the year. NISM conducted four ‘NISM CPE Trainers Contact Programmes at Mumbai, Lucknow and Bangalore for enhancing the domain knowledge and training delivery of empanelled CPE trainers. In all, 75 trainers benefitted from these programmes.
C. Other Initiatives
a. Accreditation of Certification Exams: Subsequent to the notification of SEBI (Investment Advisers) Regulations, 2013, NISM finalized the process for accreditation of certifications for Investment Advisers and invited applications for accreditation. Two certifications were granted in-principle approval by NISM. During the year, Chartered Wealth Manager (CWM) certification of the American Academy of M/s. Financial Management India Pvt. Ltd. met with NISM requirements and was granted accreditation.
b. Memorandum of Understanding (MoU): NISM enters into MoUs with different
institutes / organizations with the objective of offering innovative certifications and educational programmes in financial markets to enhance the choices and availability of quality financial education to students. During the year, NISM entered into MoUs with the Association of International Wealth Management of India (AIWMI) and ICICI Securities (ICICI Direct Center for Financial Learning).
c. E-learning initiative: Currently, NISM is developing content for Mutual Fund Distributors as part of our Continuing Professional Education (CPE) initiative.
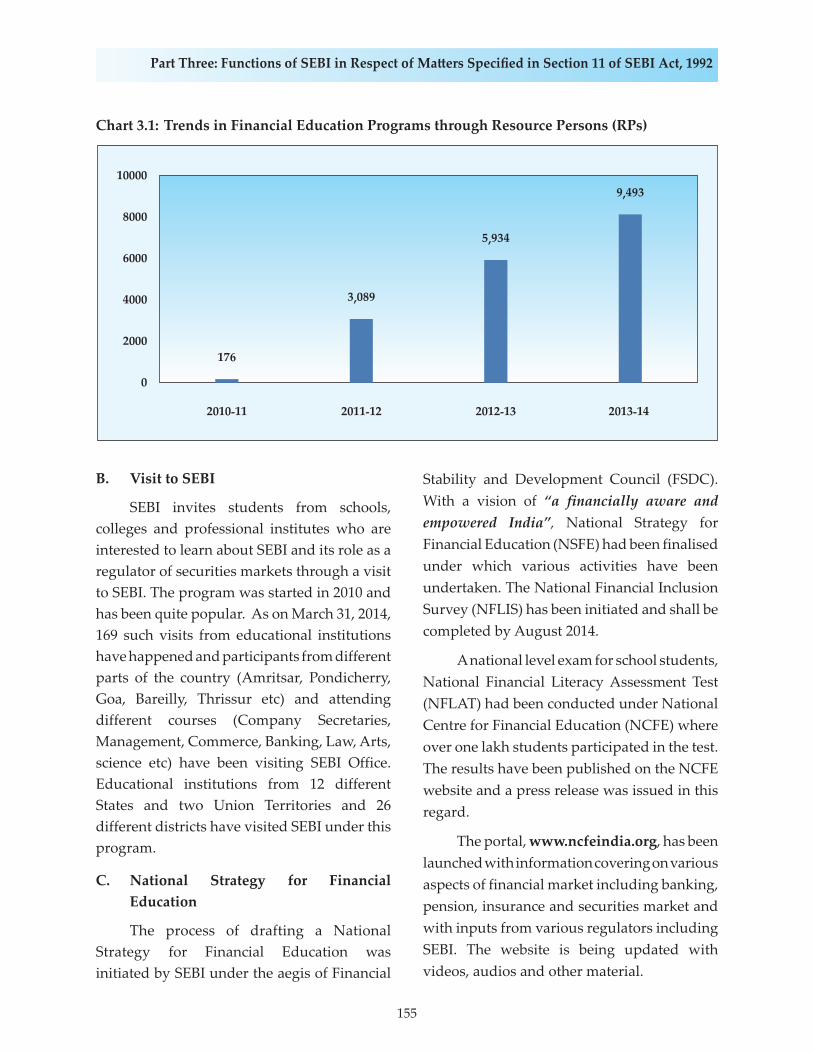
155
Part Three: Functions of SEBI in Respect of Ma� ers Specifi ed in Section 11 of SEBI Act, 1992
Chart 3.1: Trends in Financial Education Programs through Resource Persons (RPs)
Stability and Development Council (FSDC). With a vision of “a financially aware and empowered India”, National Strategy for Financial Education (NSFE) had been finalised under which various activities have been undertaken. The National Financial Inclusion Survey (NFLIS) has been initiated and shall be completed by August 2014.
A national level exam for school students, National Financial Literacy Assessment Test (NFLAT) had been conducted under National Centre for Financial Education (NCFE) where over one lakh students participated in the test. The results have been published on the NCFE website and a press release was issued in this regard.
The portal, www.ncfeindia.org, has been launched with information covering on various aspects of financial market including banking, pension, insurance and securities market and with inputs from various regulators including SEBI. The website is being updated with videos, audios and other material.
B. Visit to SEBI
SEBI invites students from schools, colleges and professional institutes who are interested to learn about SEBI and its role as a regulator of securities markets through a visit to SEBI. The program was started in 2010 and has been quite popular. As on March 31, 2014, 169 such visits from educational institutions have happened and participants from different parts of the country (Amritsar, Pondicherry, Goa, Bareilly, Thrissur etc) and attending different courses (Company Secretaries, Management, Commerce, Banking, Law, Arts, science etc) have been visiting SEBI Office. Educational institutions from 12 different States and two Union Territories and 26 different districts have visited SEBI under this program.
C. National Strategy for Financial Education
The process of drafting a National Strategy for Financial Education was initiated by SEBI under the aegis of Financial
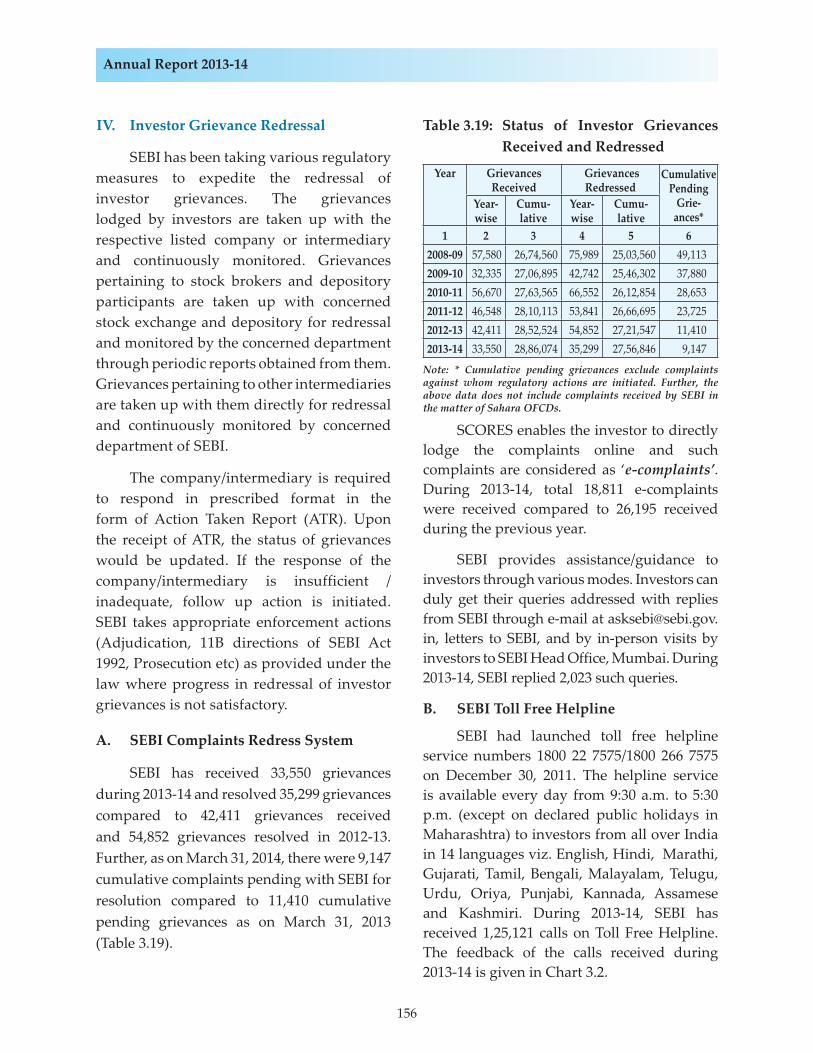
156
Annual Report 2013-14
IV. Investor Grievance Redressal
SEBI has been taking various regulatory measures to expedite the redressal of investor grievances. The grievances lodged by investors are taken up with the respective listed company or intermediary and continuously monitored. Grievances pertaining to stock brokers and depository participants are taken up with concerned stock exchange and depository for redressal and monitored by the concerned department through periodic reports obtained from them. Grievances pertaining to other intermediaries are taken up with them directly for redressal and continuously monitored by concerned department of SEBI.
The company/intermediary is required to respond in prescribed format in the form of Action Taken Report (ATR). Upon the receipt of ATR, the status of grievances would be updated. If the response of the company/intermediary is insufficient / inadequate, follow up action is initiated. SEBI takes appropriate enforcement actions (Adjudication, 11B directions of SEBI Act 1992, Prosecution etc) as provided under the law where progress in redressal of investor grievances is not satisfactory.
A. SEBI Complaints Redress System
SEBI has received 33,550 grievances during 2013-14 and resolved 35,299 grievances compared to 42,411 grievances received and 54,852 grievances resolved in 2012-13. Further, as on March 31, 2014, there were 9,147 cumulative complaints pending with SEBI for resolution compared to 11,410 cumulative pending grievances as on March 31, 2013 (Table 3.19).
Table 3.19: Status of Investor Grievances Received and Redressed
Year Grievances Received
Grievances Redressed
Cumulative Pending
Grie-ances*
Year-wise
Cumu-lative
Year-wise
Cumu-lative
1 2 3 4 5 62008-09 57,580 26,74,560 75,989 25,03,560 49,1132009-10 32,335 27,06,895 42,742 25,46,302 37,8802010-11 56,670 27,63,565 66,552 26,12,854 28,6532011-12 46,548 28,10,113 53,841 26,66,695 23,7252012-13 42,411 28,52,524 54,852 27,21,547 11,4102013-14 33,550 28,86,074 35,299 27,56,846 9,147
Note: * Cumulative pending grievances exclude complaints against whom regulatory actions are initiated. Further, the above data does not include complaints received by SEBI in the matter of Sahara OFCDs.
SCORES enables the investor to directly lodge the complaints online and such complaints are considered as ‘e-complaints’. During 2013-14, total 18,811 e-complaints were received compared to 26,195 received during the previous year.
SEBI provides assistance/guidance to investors through various modes. Investors can duly get their queries addressed with replies from SEBI through e-mail at [email protected], letters to SEBI, and by in-person visits by investors to SEBI Head Office, Mumbai. During 2013-14, SEBI replied 2,023 such queries.
B. SEBI Toll Free Helpline
SEBI had launched toll free helpline service numbers 1800 22 7575/1800 266 7575 on December 30, 2011. The helpline service is available every day from 9:30 a.m. to 5:30 p.m. (except on declared public holidays in Maharashtra) to investors from all over India in 14 languages viz. English, Hindi, Marathi, Gujarati, Tamil, Bengali, Malayalam, Telugu, Urdu, Oriya, Punjabi, Kannada, Assamese and Kashmiri. During 2013-14, SEBI has received 1,25,121 calls on Toll Free Helpline. The feedback of the calls received during 2013-14 is given in Chart 3.2.
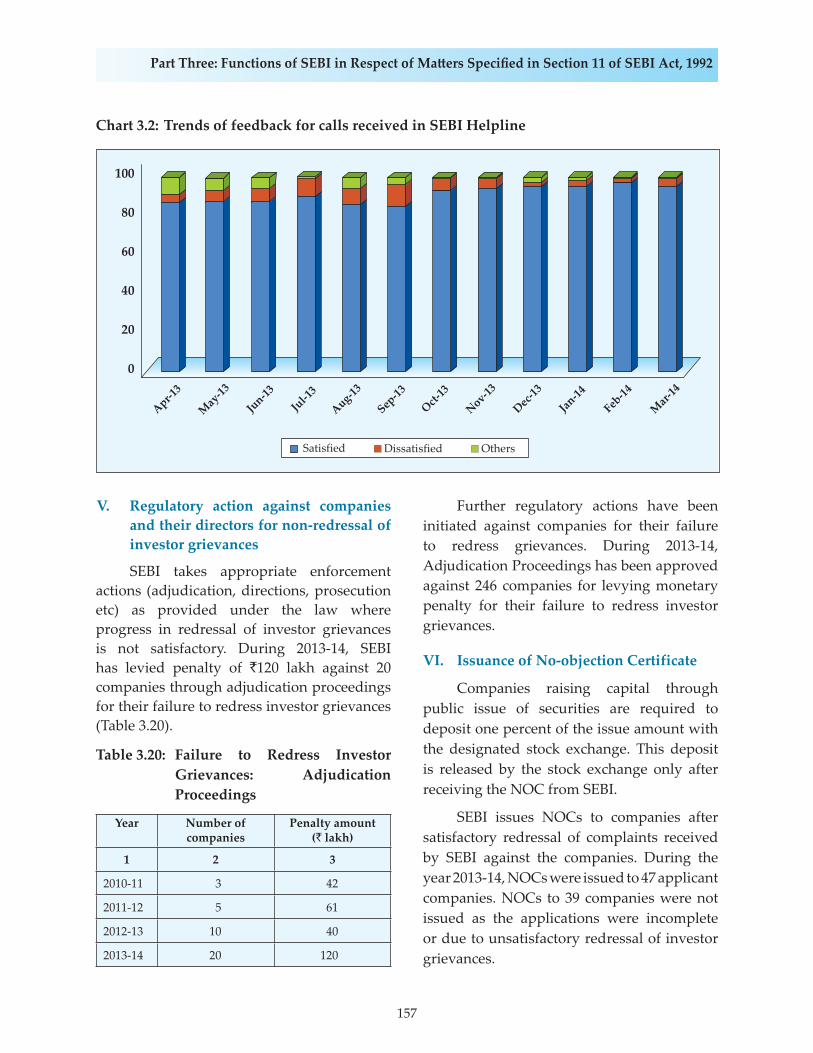
157
Part Three: Functions of SEBI in Respect of Ma� ers Specifi ed in Section 11 of SEBI Act, 1992
Chart 3.2: Trends of feedback for calls received in SEBI Helpline
V. Regulatory action against companies and their directors for non-redressal of investor grievances
SEBI takes appropriate enforcement actions (adjudication, directions, prosecution etc) as provided under the law where progress in redressal of investor grievances is not satisfactory. During 2013-14, SEBI has levied penalty of `120 lakh against 20 companies through adjudication proceedings for their failure to redress investor grievances (Table 3.20).
Table 3.20: Failure to Redress Investor Grievances: Adjudication Proceedings
Year Number of companies
Penalty amount (` lakh)
1 2 3
2010-11 3 42
2011-12 5 61
2012-13 10 40
2013-14 20 120
Further regulatory actions have been initiated against companies for their failure to redress grievances. During 2013-14, Adjudication Proceedings has been approved against 246 companies for levying monetary penalty for their failure to redress investor grievances.
VI. Issuance of No-objection Certificate
Companies raising capital through public issue of securities are required to deposit one percent of the issue amount with the designated stock exchange. This deposit is released by the stock exchange only after receiving the NOC from SEBI.
SEBI issues NOCs to companies after satisfactory redressal of complaints received by SEBI against the companies. During the year 2013-14, NOCs were issued to 47 applicant companies. NOCs to 39 companies were not issued as the applications were incomplete or due to unsatisfactory redressal of investor grievances.
158
Annual Report 2013-14
7. PROHIBITION OF INSIDER TRADING
I Types of Insider trading practices
A. Managing Director of the company was indulging in insider trading by trading before the announcement of annual results while he was in possession of unpublished price sensitive information;
B. Company not adopting Model Code of Conduct as specified in SEBI (Prohibition of Insider Trading) Regulations, 1992;
C. Directors of the company not making disclosure of the shareholding;
D. Directors of the company not following the Model Code of Conduct as specified in SEBI (Prohibition of Insider Trading) Regulations, 1992.
II Insider Trading Cases during 2013-14
A. Order in respect of M/s Reliance Petroinvestments Ltd. in the matter of M/s. Indian Petrochemicals Corporation Ltd.
SEBI conducted an investigation in the trading of the scrip of M/s. Indian Petrochemicals Corporation Ltd. (IPCL/ Company) during the period from February 22, 2007 to March 08, 2007.
As per the investigation report, the M/s. Reliance Petroinvestments Ltd. (RPIL/Noticee) was deemed to be connected person of IPCL in terms of Regulation 2(h) of SEBI PIT Regulation, 1992. Therefore, the first element of the definition of “insider” i.e. “deemed to have been connected with the company” as per regulation 2(e) was established. It was observed that declaration of interim dividend and amalgamation by the company were price sensitive information as per regulation 2(ha) of SEBI PIT Regulation, 1992.
It was further observed from the disclosures made by IPCL itself to the stock exchanges under Regulation 8 (3) of SAST Regulations as on March 31, 2006 that RPIL is a “promoter having control over the company” with the total shareholding of approx. 46percent Further, RIL has been shown as a “person(s) acting in concert” with RPIL.
The above facts established that RPIL was having control over IPCL. It was therefore, concluded that by virtue of RPIL having control over IPCL, it was reasonably expected to have access to UPSI of IPCL. Noticee being the promoter having control over the company holding approx. 46 percent shares of IPCL was inherently expected to have access to UPSI.
It was further observed that during the period June 9, 2006 to February 26, 2007 RPIL had not dealt in the shares of IPCL but all of a sudden started buying the shares of IPCL from February 27, 2007 i.e just before the major announcement of declaration of the interim dividend and amalgamation of IPCL with RIL. Therefore, the charge of insider trading against the Noticee as per regulation 3 of SEBI PIT Regulation, 1992 stood established.
A penalty of `11 crore was imposed on M/s. Reliance Petroinvestments Ltd. in terms of the provisions of Section 15G of the SEBI Act, 1992 for the violation of Regulation 3 of SEBI PIT Regulation, 1992.
B. Orders in respect of Shri Shanti Ranjan Paul & ors; Mr.Sisir Kumar Shaa & Mr. Soura Sekhar Saha ; Mr.Chirantan Mukherji & Ms. Chandra Mukherji in the matter of M/s Shelter Infra projects Ltd.
The investigation revealed that M/s
159
Part Three: Functions of SEBI in Respect of Ma� ers Specifi ed in Section 11 of SEBI Act, 1992
SIPL had entered into a Share Purchase Agreement (SPA), to be executed between SIPL and the proposed acquirers, M/s Ramayana Promoters Pvt. Ltd. on July 31, 2009 for the sale of the issued and subscribed equity share capital of the company held by the erstwhile promoters, as also change in management of the company.
Mr. Shanti Ranjan Paul, the Director of the M/s. Shelter Infra projects Ltd (SIPL) had passed on the unpublished price sensitive information (UPSI) to others (his close relatives) just before the period of open offer. The Adjudicating officer vide order dated March 7, 2014 imposed a penalty of rupees one crore on Shri Shanti Ranjan Paul and rupees two crore on others under SEBI PIT Regulation, 1992.
Mr. Sisir Kumar Saha, the Whole Time Director of SIPL was privy to the unpublished price sensitive information (UPSI) and traded in the shares of SIPL. Further, he had also communicated or counselled, directly or indirectly, the UPSI to Mr. Soura Sekhar Saha , son of Mr. Sisir Kumar Saha who also traded in the shares of SIPL. The Adjudicating officer vide order dated March 7, 2014 held that “ there is no dispute to the fact that Mr. Sisir Kumar Saha is a “connected person” as defined under Regulation 2(c)(i) of the SEBI PIT Regulation, 1992 and therefore an insider. Since Mr. Soura Sekhar Saha is the son of Mr. Sisir Kumar Saha, he is deemed to be a connected person as per Regulation 2(h)(viii) of the SEBI PIT Regulation, 1992.” Adjudicating officer took into consideration that Mr. Soura Sekhar Saha has not sold any of the shares he has brought in the scrip and therefore the profit cannot be quantified i.e. profit not realised, whereas Mr. Sisir
Kumar Saha made a profit of ` 840 only. Therefore after considering all the facts and circumstance of the case Adjudicating officer imposed a consolidated penalty of `50 lakh on Mr. Sisir Kumar Saha and Mr. Soura Sekhar Saha for dealing in the scrip based upon UPSI.
Mr. Chirantan Mukherji was Chairman & promoter of SIPL and Ms. Chandra Mukherji was wife of Shir Chirantan Mukherji. On the basis of investigation it was alleged that Mr. Chirantan Mukherji being the Chairman & promoter of SIPL was privy to the unpublished price sensitive information (UPSI) and traded in the shares of SIPL. Further, he had also communicated or counselled, directly or indirectly, the UPSI to Mr. Chandra Mukherji who also traded in the shares of SIPL. The Adjudicating officer vide order dated March 7, 2014 held that “there is no dispute to the fact that Mr.Chirantan Mukherji is a “connected person” as defined under Regulation 2(c)(i) of the SEBI PIT Regulation, 1992 and therefore an insider. Further, since Ms. Chandra Mukherji is the wife of Mr. Chirantan Mukherji, she is deemed to be a connected person as per Regulation 2(h)(viii) of the SEBI PIT Regulation, 1992.” Adjudicating officer took into consideration that Ms. Chandra Mukherji has not sold any of the shares he has brought in the scrip and therefore the profit cannot be quantified i.e. profit not realised.
Therefore, after considering all the facts and circumstance of the case Adjudicating officer imposed a penalty of rupees one crore on Ms. Chandra Mukherji for dealing in the scrip based upon UPSI. However no penalty was imposed on Mr. Chirantan Mukherji as he expired on March 03, 2013.

160
Annual Report 2013-14
C. Order in respect of M/s. Falcon Tyres Ltd.
SEBI had sought various information from M/s.Falcon Tyres Ltd. such as a copy of Code of Internal Procedure and Conduct and Code of Corporate Disclosure Practices of the company in accordance with SEBI (Prohibition of Insider Trading) Regulations, 1992, the time of closing and opening of trading window with respect to the above announcements and the details of disclosures made to the company and to the stock exchanges under SEBI PIT Regulation, 1992.
SEBI observed that the company had forwarded a copy of the Code of Conduct and Ethics, instead of a copy of the Code of Internal Procedure & Conduct and Code of Corporate Disclosure Practices in accordance with the SEBI PIT Regulation, 1992.
Adjudication was initiated for violation of regulation 12 (1) read with Clause 1.2 under Part A of Schedule I of the SEBI PIT Regulation, 1992. It is observed that the lackadaisical and uninvolved manner in which the Noticees have conducted themselves, irrespective of whether the Model Code as specified under the SEBI PIT Regulation, 1992 is considered to be in place or not, provided ample scope for misuse of price sensitive information.
Pursuant to Adjudication proceedings, the Adjudicating officer vide order dated Feb 26, 2014 imposed a penalty of rupees one crore, jointly and severally on M/s. Falcon Tyres Limited, its Chairman and Promoter Director- Mr. Pawan Kumar Ruia, its Executive Director - Mr. Sunil Bhansali, Mr. S. Ravi, Non - Executive Director and Mr. M. C. Bhansali,
Secretary cum Compliance Officer of the company.
D. Orders in respect of M/s N R Mercantiles Private Limited and M/s Imtihan Commercial Private Limited in the matter of M/s Ramsarup Industries Limited
SEBI conducted an investigation into the affairs relating to buying, selling and dealing in the shares of M/s Ramsarup Industries Limited (RIL). The investigation covered the period from July 01, 2010 to August 31, 2010.
It was established that Ashish, Chairman & Managing Director and Mr. Naveen Gupta, Whole Time Director & CFO of RIL were in possession of UPSI from August 07, 2010. The sales of RIL which were `651.48 crore for quarter ended March 2010, fell to `343.36 crore for quarter ended June 2010 (fall of 52.70 percent). Similarly the net profit for quarter ended June 2010 fell to ̀ 5.88 crore from `14.41 crore in previous quarter, a fall of almost 60 percent. The company management was definitely aware of the erosion in performance of the company. As per the shareholding disclosure of RIL available on NSE website, it was found that M/s. N R Mercantiles Private Limited (Noticee no.1) was a part of promoter group of RIL and its shareholding in RIL for quarter ending June 2010 was 17.72 percent.
Further, as per shareholding disclosure available in NSE website and submissions made by M/s. Imtihan Commercial Private Limited (the Noticee no.2) vide its letter dated September 17, 2011 it was observed that Noticee was part of the promoter group of RIL. It was found that Imtihan is 100 percent held by Ashish and his wife Neerza Jhunjhunwala.
161
Part Three: Functions of SEBI in Respect of Ma� ers Specifi ed in Section 11 of SEBI Act, 1992
Mr.Ashish is Chairman and Managing Director of RIL. Further, other two directors of Noticee i.e M/s.. Vikash Ladia and Mr.Naveen Gupta are also directors of RIL.
Noticee no.1 vide its letter dated September 17, 2011 and in its replies to SCN accepted that it was a part of promoter group of RIL. In addition, address of the Noticee no.1 is same as the registered address of RIL. Further, Mr.Ashish who is the managing director of RIL as well as the director of the Noticee no.1 along with his wife Ms. Neerza Jhunjhunwala has a shareholding of 68.52 percent in the Noticee no.1 and the balance is held by M/s Rav Dravya Pvt. Ltd., another promoter group entity. Furthermore, Mr. Naveen Gupta was found to be a director both in RIL as well as in the Noticee no.1. Therefore, Noticee no.1 was a company under control of the same management and is consequently deemed to be a connected person to RIL as per regulation 2h(i) of PIT Regulations.
It is pertinent to note that Mr. Ashish was the common person/director between the management of RIL, Noticee no.1 and 2 and was in possession of UPSI. As per the Noticee no.1’s reply dated July 16, 2012, orders for the sale of shares of RIL on May 11, 2010, July 30, 2010 and August 12, 2010 were placed by Mr. Ashish. Upon analysis of trading pattern of the Noticee no.1, it was found that Noticee no.1 had sold 79,150 shares of RIL on May 11, 2010 & July 30, 2010 i.e. prior to UPSI period and sold 75,000 shares of RIL on August 12, 2010 i.e. during UPSI period (during August 07 to August 13, 2010). Noticee no.1 ‘s trading during the UPSI period was found in violation of PIT Regulations. Mr.Ashish being the
director of the Noticee no.2, placed the sell orders on behalf of Noticee no.2, i.e. Noticee had sold the 25,000 shares of RIL during the UPSI period while in possession of UPSI, thereby avoided a potential loss of ` 4,37,500.
A penalty of ` 40 lakh was imposed on M/s N R Mercantiles Private Limited and ` 13.5 lakh was imposed on M/s Imtihan Commercial Private Limited, for violation of sections 12A(d) & 12A(e) of SEBI Act and regulation 3(i) of SEBI PIT Regulation, 1992. The said orders were appealed before the SAT and SAT vide its order dated October 31,2013 dismissed the appeal finding it devoid of merits.
E. Order in the matter of M/s. Man Industries India Limited
M/s. Man Industries (India) Limited; Mr.R.C Mansukhani, Chairman; Mr. J C Mansukhani, Vice Chairman and Managing Director; Mr.R C Jindal, Executive Director; & Mr.Sujal Sharma, Company Secretary & Compliance Officer, had failed in making of prompt disclosure of price sensitive information to the exchanges and disseminations of the same on a continuous and immediate basis.
Adjudication was initiated for violation of regulation 12 (2) & 12 (3) read with Clause 2.1 of Schedule II of SEBI PIT Regulation, 1992 which mandates prompt disclosure of price sensitive information to the exchanges and disseminations of the same on a continuous and immediate basis.
Pursuant to adjudication proceedings, the Adjudicating officer vide order dated March 28, 2014 imposed a penalty of `25 lakh on the above captioned 5 noticees.
162
Annual Report 2013-14
F. Order in respect of Ms.Devyani Chandrakant Doshi
Ms. Devyani Chandrakant Doshi and Mr. Chandrakant Nanalal Doshi were the promoters of M/s.REL. Ms.Devyani Chandrakant Doshi was holding 13,45,000 (3.66 percent) shares on February 6, 2013 and received 27,77,000 (11.22 percent) shares in an off-market transaction from Mr. Chandrakant Nanalal Doshi which resulted in an increase in her holding to more than 5 percent of the total paid-up share capital. In view of the said increase / change in the shareholding, the noticees being the promoters of REL were required to make the necessary disclosures.
Adjudication was initiated for violation of Regulation 13(1), 13(3) & 13(4A) read with Regulation 13(5) the SEBI PIT Regulation, 1992 for not making the necessary disclosures within the prescribed time. Pursuant to Adjudication proceedings, the Adjudicating officer vide order dated Jan 23, 2014 imposed a penalty of `12 lakh on Ms.Devyani Chandrakant Doshi.
G. Order in respect of Mr.Sarat Chander Manocha
In the scrip of M/s. Lanco Infratech Ltd., one of its Director, Mr Sarat Chander Manocha had sold 2,00,000 shares between April 3,2012 to June 25,2012 resulting in change in shareholding of Mr. Manocha by 25,000 share on several occasions since the last disclosure.
Adjudication was initiated for violation of regulation 13(4) read with 13(5) of SEBI PIT Regulation, 1992 for not making the continual disclosures of change in shareholding.
Pursuant to Adjudication proceedings, the Adjudicating officer vide order dated Feb 26, 2014 imposed a penalty of `10 lakh on Mr. Sarat Chander Manocha.
H. Order in respect of M/s. Spark Securities Pvt. Ltd.
M/s. Spark Securities Pvt. Limited and M/s. Anirudh Bubna Trust, acquired/sold shares in the scrip of M/s Himalaya Granites Limited without complying with the relevant provisions of SEBI (Substantial Acquisition of Shares and Takeover) Regulations, 1997 (hereinafter referred to as the ‘Takeover Regulations,1997), and SEBI (Prohibition of Insider Trading) Regulations, 1992.
Adjudication was initiated for violation Regulations 7(1) read with 7(2) of Takeover Regulations, 1997 and Regulations 13(1) and 13(3) read with 13(5) of SEBI PIT Regulation, 1992.
Pursuant to Adjudication proceedings, the Adjudicating officer vide order dated Feb 26, 2014 imposed a penalty of `10 lakh on the noticees, jointly and severally.
I. Order in respect of Mr. G. Jayaraman, Compliance officer of M/s Satyam Computer Services Ltd.
Mr. G. Jayaraman, the company secretary and compliance officer of M/s. Satyam Computer Services Ltd. (satyam), had failed to close the trading window, when Satyam was in possession of unpublished price sensitive information relating to its acquisition of two infrastructure companies. Adjudication was initiated for violation of para 1.2 and 3.2.3 in Schedule I, Part-A of the Model code of conduct for prevention of Insider Trading for listed companies framed under Regulation 12(1) of SEBI(PIT) Regulations, 1992. Pursuant to Adjudication proceedings, the Adjudicating officer vide order dated July 27, 2012 imposed a penalty of `5 lakh on Mr. G. Jayaraman.
The said order was appealed by Mr. G.
163
Part Three: Functions of SEBI in Respect of Ma� ers Specifi ed in Section 11 of SEBI Act, 1992
Jayaraman in SAT and the SAT in its order dated December 24, 2013, while observing “Compliance officer would be liable for penalty if he fails to close trading window when in possession of Unpublished price sensitive information even if no employee has traded in the shares of that company when in possession of unpublished price sensitive information. Similarly the fact that Board of Directors of December 17, 2008 have reversed there earlier decision granting approval to the acquisition does not absolve appellant from liability to pay penalty for violating PIT Regulations “ upheld the order of Adjudicating officer.
J. Order in respect of Mr. Bhargav Marepally in the matter of M/s GSS America Infotech Ltd.
Mr. Bhargav Marepally who was the Managing Director of the company, entered into opposite transactions i.e., sold/ purchased shares of the company within six months of the prior purchase/sale following transaction, thereby violating the provisions of clause 4.2 of Part A, Schedule I of Model code of conduct for prevention of Insider Trading for listed companies under Regulation 12(1) of SEBI (PIT) Regulations, 1992. The matter was referred for Adjudication.
The entity contended before the Adjudicating officer that the sale was a result of invocation of pledge by the lending entities and was outside his control and therefore should not be considered as sale made by him. With regard to the purchases, he had contended that he had to maintain a minimum promoter holding in the company as per the loan agreements. Pursuant to Adjudication proceedings, the Adjudicating officer vide order dated April 29, 2013 imposed a penalty of `5 lakh.
K. Order in the matter of M/s CG-Vak Software and Exports Ltd.
SEBI noticed two instances of delay of 14 days and 31 days in disclosing the information relating to acquisition of shares of the company by its managing director through the stock exchanges, thereby, the company violated provisions of Regulation 13(6) of SEBI(PIT) Regulations, 1992. Accordingly, the matter was adjudicated and the Adjudicating officer imposed a penalty of `3 lakh on the company vide order dated December 17, 2013.
The company appealed before SAT that the delay in making disclosure was unintentional and was on account of its managing director travelling abroad at the relevant time. Hon’ble tribunal vide its order dated April 23, 2014 was of the view that Managing director of the company was travelling abroad at the relevant time cannot be ground to escape penalty for not making disclosures within the stipulated time under the said Regulations and dismissed the appeal.
L. Order in respect of Mr. Swaminathan Srinivasan in the matter of M/s Tech Mahindra Ltd.( Formerly M/s Mahindra Satyam Ltd.)
SEBI had received a reference from M/s Tech Mahindra Ltd. (formerly, Mahindra Satyam Ltd.), that one of its designated associate viz., Mr. Swaminathan Srinivasan had sold 1,000 shares of the company without the pre-clearance in excess of threshold limit of 5,000 shares. SEBI found that the employee had sold 6,000 shares between Feb 04-08, 2013, resulting his change in shareholding of the employee exceeding ̀ 5 lakh in value since last disclosure, violating the provisions of

164
Annual Report 2013-14
Regulation 13(4) read with Regulation 13(5) of the SEBI PIT Regulation, 1992.
The matter was adjudicated under provisions of Section 15A(b) of the SEBI Act. 1992, Pursuant to Adjudication proceedings, the Adjudicating officer vide order dated April 28, 2014 imposed a penalty of `3 lakh for the said violations.
M. Order in respect of Mr.Dhaval Janardan Nanavati in the matter of M/s Organic Coatings Ltd.
Mr. Dhaval Janardhan Nanavati was holding 9.79 percent of the equity capital in M/s.Organic Coatings Ltd. He sold the entire shareholdings on October 5, 2012 and did not comply with the disclosure requirements within two working days as provided under Regulation 13(3) and 13(5) of SEBI (PIT) Regulations, 1992. The matter was adjudicated and the Adjudicating officer vide order dated November 27, 2013, imposed a penalty of `1 lakh under the provisions of 15 A(b) of the SEBI Act., 1992.
The said order was appealed before the SAT and SAT vide its order dated February 27, 2014 observed that, “even if disclosures made under SAST regulations could be treated as disclosure made under PIT Regulations, such disclosures being not made within the time prescribed under PIT regulations, appellant cannot escape penal liability”, and dismissed the appeal.
III Steps initiated to curb Insider Trading practices
A. SEBI (Prohibition of Insider Trading) Regulations, 1992 are in place.
B. Actions are taken in terms of provisions of SEBI Act, 1992 which also includes Adjudication proceedings for levy of
monetary penalty. This also acts as a deterrent.
The total penalty imposed by SEBI in adjudication proceedings for the violations of SEBI (Prohibition of Insider Trading) Regulations, 1992 was `20.4 crore in 2013-14 compared to `1.84 crore in 2012-13 representing a rise of 1010.9 percent. The said penalty includes penalty for disclosure related violations. Further the total penalty imposed for 2013-14 includes `0.45 crore imposed under SEBI (Prohibition of Insider Trading) Regulations, 1992 & SEBI (Substantial Acquisition of Shares and Takeovers) Regulations, 1997 as common orders were passed in certain matters during 2013-14.
8. SUBSTANTIAL ACQUISITION OF SHARES AND TAKEOVERS
The existence of an efficient and smooth-functioning market for takeovers plays an important role in the economic development of a country. Existence of an efficient and well-administered set of Takeover Regulations ensures that the takeover markets operate in a fair, equitable and transparent manner. The SEBI Act, 1992 expressly mandated SEBI to regulate substantial acquisition of shares and takeovers by suitable measures. Accordingly, SEBI provided a legal framework by notifying the Takeover Regulations in 1997. The new SEBI (SAST) Regulations were notified in 2011.
I. Open Offer
As on March 31, 2014, total 92 draft letters were held with SEBI for Open Offers, of which 71 draft letters of offer have been filed during 2013-14 (one under old Takeover Regulations). Of the 92 draft letters, observations were issued for 66 letters during 2013-14 and 26 draft letters were pending with SEBI for issuance of observations as on March 31, 2014 (Table 3.21).
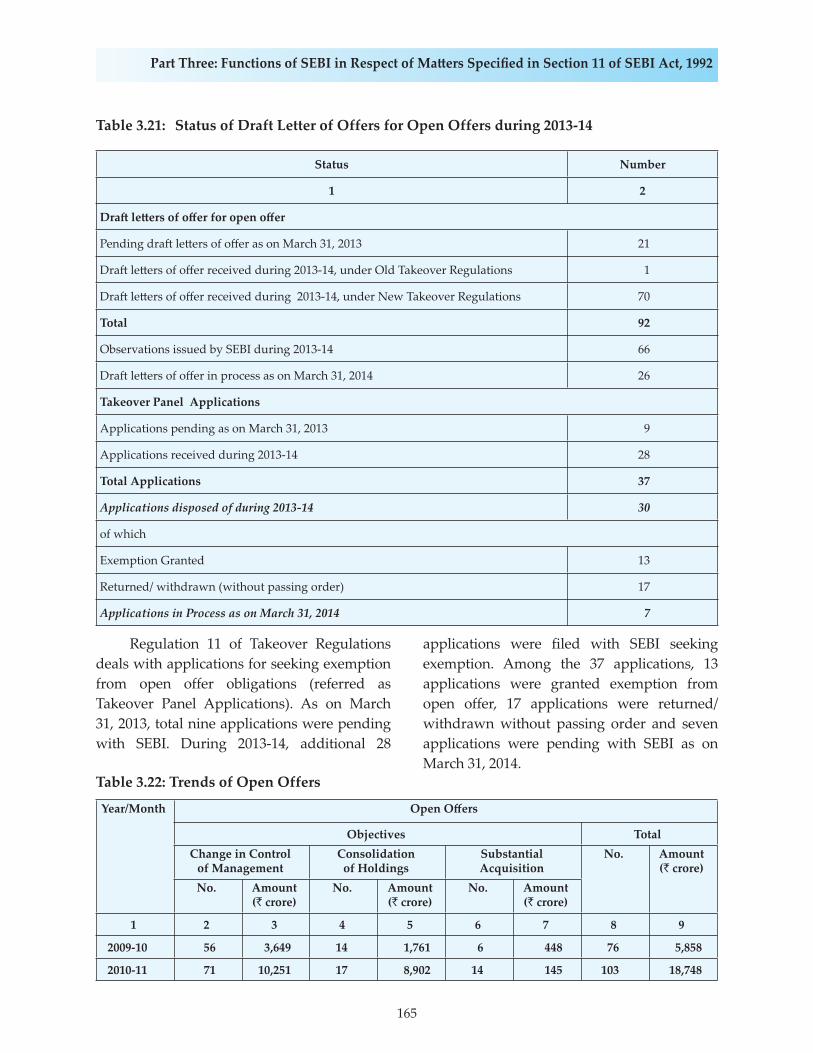
165
Part Three: Functions of SEBI in Respect of Ma� ers Specifi ed in Section 11 of SEBI Act, 1992
Table 3.21: Status of Draft Letter of Offers for Open Offers during 2013-14
Status Number
1 2
Dra� le� ers of off er for open off er
Pending dra� le� ers of off er as on March 31, 2013 21
Dra� le� ers of off er received during 2013-14, under Old Takeover Regulations 1
Dra� le� ers of off er received during 2013-14, under New Takeover Regulations 70
Total 92
Observations issued by SEBI during 2013-14 66
Dra� le� ers of off er in process as on March 31, 2014 26
Takeover Panel Applications
Applications pending as on March 31, 2013 9
Applications received during 2013-14 28
Total Applications 37
Applications disposed of during 2013-14 30
of which
Exemption Granted 13
Returned/ withdrawn (without passing order) 17
Applications in Process as on March 31, 2014 7
Table 3.22: Trends of Open Offers
Year/Month Open Off ers
Objectives TotalChange in Control
of ManagementConsolidation
of HoldingsSubstantial Acquisition
No. Amount (` crore)
No. Amount (` crore)
No. Amount (` crore)
No. Amount (` crore)
1 2 3 4 5 6 7 8 9
2009-10 56 3,649 14 1,761 6 448 76 5,858
2010-11 71 10,251 17 8,902 14 145 103 18,748
Regulation 11 of Takeover Regulations deals with applications for seeking exemption from open offer obligations (referred as Takeover Panel Applications). As on March 31, 2013, total nine applications were pending with SEBI. During 2013-14, additional 28
applications were filed with SEBI seeking exemption. Among the 37 applications, 13 applications were granted exemption from open offer, 17 applications were returned/withdrawn without passing order and seven applications were pending with SEBI as on March 31, 2014.
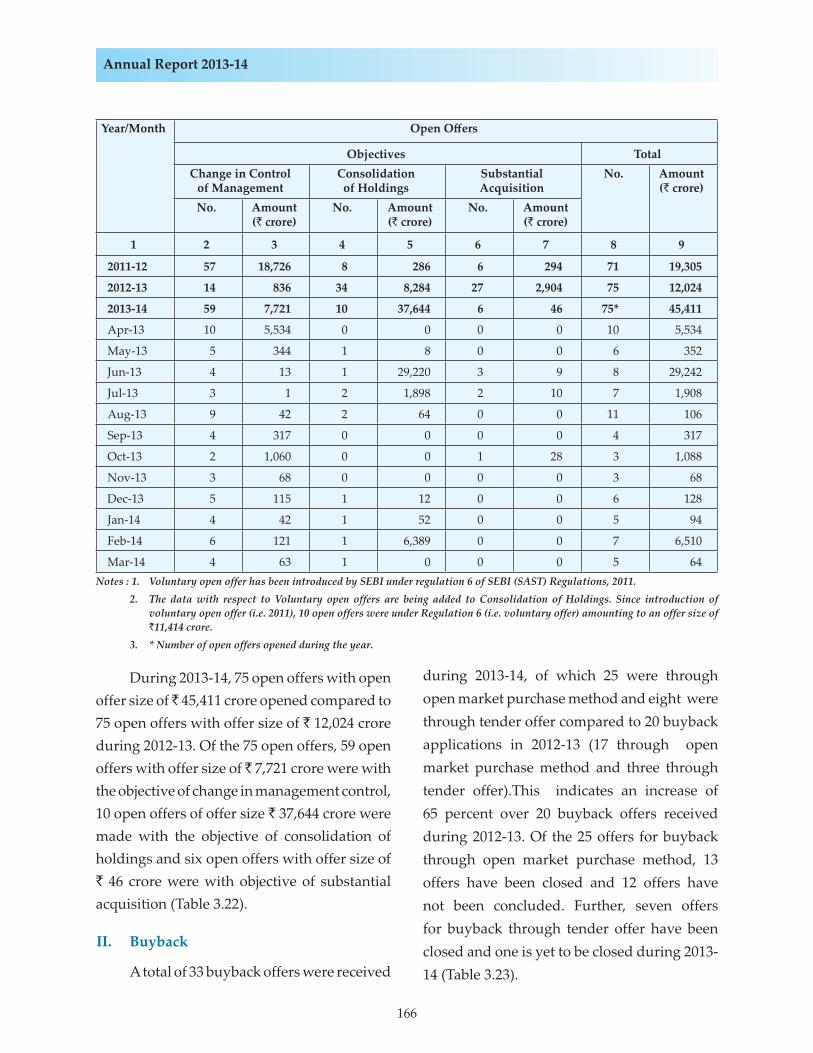
166
Annual Report 2013-14
Year/Month Open Off ers
Objectives TotalChange in Control
of ManagementConsolidation
of HoldingsSubstantial Acquisition
No. Amount (` crore)
No. Amount (` crore)
No. Amount (` crore)
No. Amount (` crore)
1 2 3 4 5 6 7 8 9
2011-12 57 18,726 8 286 6 294 71 19,305
2012-13 14 836 34 8,284 27 2,904 75 12,024
2013-14 59 7,721 10 37,644 6 46 75* 45,411
Apr-13 10 5,534 0 0 0 0 10 5,534
May-13 5 344 1 8 0 0 6 352
Jun-13 4 13 1 29,220 3 9 8 29,242
Jul-13 3 1 2 1,898 2 10 7 1,908
Aug-13 9 42 2 64 0 0 11 106
Sep-13 4 317 0 0 0 0 4 317
Oct-13 2 1,060 0 0 1 28 3 1,088
Nov-13 3 68 0 0 0 0 3 68
Dec-13 5 115 1 12 0 0 6 128
Jan-14 4 42 1 52 0 0 5 94
Feb-14 6 121 1 6,389 0 0 7 6,510
Mar-14 4 63 1 0 0 0 5 64Notes : 1. Voluntary open offer has been introduced by SEBI under regulation 6 of SEBI (SAST) Regulations, 2011. 2. The data with respect to Voluntary open offers are being added to Consolidation of Holdings. Since introduction of
voluntary open offer (i.e. 2011), 10 open offers were under Regulation 6 (i.e. voluntary offer) amounting to an offer size of `11,414 crore.
3. * Number of open offers opened during the year.
During 2013-14, 75 open offers with open offer size of ̀ 45,411 crore opened compared to 75 open offers with offer size of ` 12,024 crore during 2012-13. Of the 75 open offers, 59 open offers with offer size of ̀ 7,721 crore were with the objective of change in management control, 10 open offers of offer size ` 37,644 crore were made with the objective of consolidation of holdings and six open offers with offer size of ` 46 crore were with objective of substantial acquisition (Table 3.22).
II. Buyback
A total of 33 buyback offers were received
during 2013-14, of which 25 were through open market purchase method and eight were through tender offer compared to 20 buyback applications in 2012-13 (17 through open market purchase method and three through tender offer).This indicates an increase of 65 percent over 20 buyback offers received during 2012-13. Of the 25 offers for buyback through open market purchase method, 13 offers have been closed and 12 offers have not been concluded. Further, seven offers for buyback through tender offer have been closed and one is yet to be closed during 2013-14 (Table 3.23).
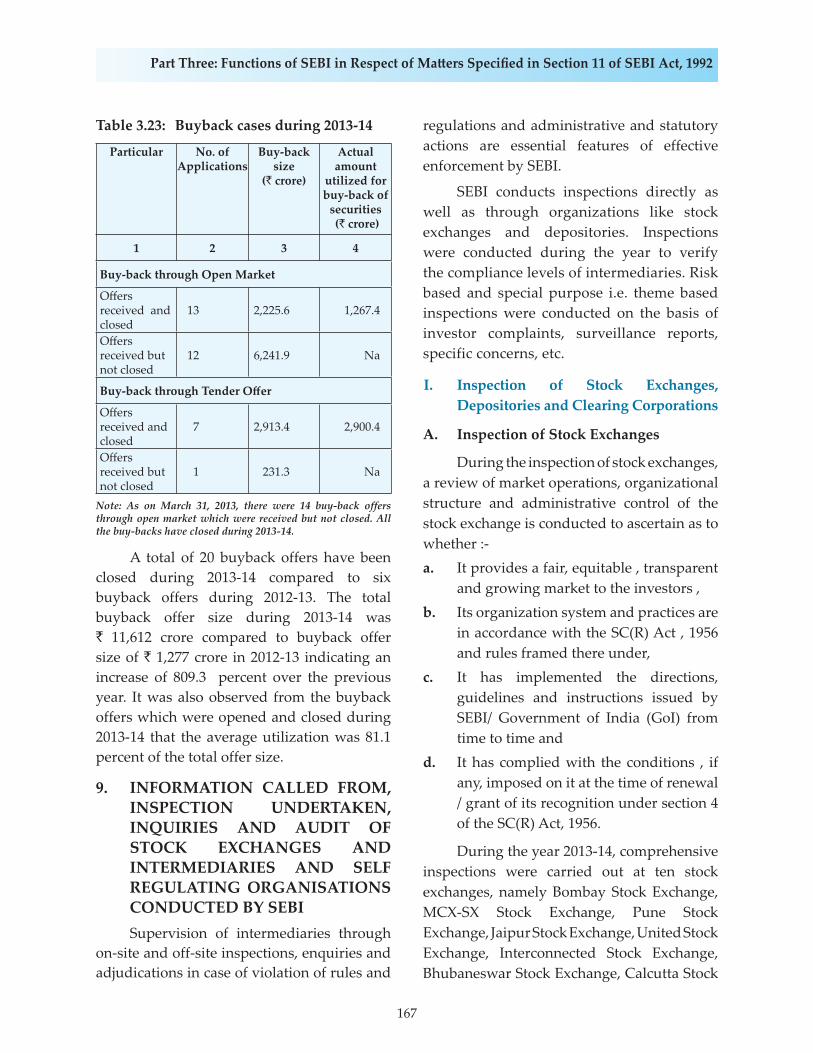
167
Part Three: Functions of SEBI in Respect of Ma� ers Specifi ed in Section 11 of SEBI Act, 1992
Table 3.23: Buyback cases during 2013-14
Particular No. of Applications
Buy-back size
(` crore)
Actual amount
utilized for buy-back of
securities (` crore)
1 2 3 4
Buy-back through Open Market
Off ers received and closed
13 2,225.6 1,267.4
Off ers received but not closed
12 6,241.9 Na
Buy-back through Tender Off er
Off ers received and closed
7 2,913.4 2,900.4
Off ers received but not closed
1 231.3 Na
Note: As on March 31, 2013, there were 14 buy-back offers through open market which were received but not closed. All the buy-backs have closed during 2013-14.
A total of 20 buyback offers have been closed during 2013-14 compared to six buyback offers during 2012-13. The total buyback offer size during 2013-14 was ` 11,612 crore compared to buyback offer size of ` 1,277 crore in 2012-13 indicating an increase of 809.3 percent over the previous year. It was also observed from the buyback offers which were opened and closed during 2013-14 that the average utilization was 81.1 percent of the total offer size.
9. INFORMATION CALLED FROM, INSPECTION UNDERTAKEN, INQUIRIES AND AUDIT OF STOCK EXCHANGES AND INTERMEDIARIES AND SELF REGULATING ORGANISATIONS CONDUCTED BY SEBI
Supervision of intermediaries through on-site and off-site inspections, enquiries and adjudications in case of violation of rules and
regulations and administrative and statutory actions are essential features of effective enforcement by SEBI.
SEBI conducts inspections directly as well as through organizations like stock exchanges and depositories. Inspections were conducted during the year to verify the compliance levels of intermediaries. Risk based and special purpose i.e. theme based inspections were conducted on the basis of investor complaints, surveillance reports, specific concerns, etc.
I. Inspection of Stock Exchanges, Depositories and Clearing Corporations
A. Inspection of Stock Exchanges
During the inspection of stock exchanges, a review of market operations, organizational structure and administrative control of the stock exchange is conducted to ascertain as to whether :-a. It provides a fair, equitable , transparent
and growing market to the investors ,b. Its organization system and practices are
in accordance with the SC(R) Act , 1956 and rules framed there under,
c. It has implemented the directions, guidelines and instructions issued by SEBI/ Government of India (GoI) from time to time and
d. It has complied with the conditions , if any, imposed on it at the time of renewal / grant of its recognition under section 4 of the SC(R) Act, 1956.
During the year 2013-14, comprehensive inspections were carried out at ten stock exchanges, namely Bombay Stock Exchange, MCX-SX Stock Exchange, Pune Stock Exchange, Jaipur Stock Exchange, United Stock Exchange, Interconnected Stock Exchange, Bhubaneswar Stock Exchange, Calcutta Stock
168
Annual Report 2013-14
Exchange, Vadodara Stock Exchange and Madhya Pradesh Stock Exchange. In addition, during 2013-14, compliance inspections were carried out at Pune Stock Exchange, OTC Exchange and Uttar Pradesh Stock Exchange. The compliance inspections of exchanges were carried out for the purpose of renewal of recognition of stock exchange.
Further, inspections were carried out prior to the commencement of various segments at respective stock exchanges. In 2013-14, inspections were conducted before the commencement of debt segment at NSE and BSE, currency derivative segment at BSE and SME segment at MCX-SX.
B. Inspection of Depositories
During the inspection of depositories, a review of the market operations, organizational structure and administrative control of the depository is conducted to ascertain as to whether:-
a. The procedures and practices of the depository are in compliance with the Depositories Act 1996, SEBI (Depositories and Participants), Regulations, 1996, SEBI circulars, the bye-laws etc.;
b. The books of account are being maintained by the depository, in accordance with SEBI (Depositories and Participants), Regulations, 1996;
c. The complaint received by depositories from participants, issuers, issuers’ agents, beneficiary owners or any other person are redressed.
During 2013-14, comprehensive inspection of NSDL was conducted to ascertain the systems, procedures and practices in conducting the inspection of depository participants by depositories and desirability of adopting the practices by depositories.
C. Inspections of Clearing Corporations (CCs)
In order to ascertain the adequacy of the collateral management process of the CCs, during the financial year 2013-14, special purpose inspections were undertaken for the following Clearing Corporations, viz., NSCCL, ICCL and MCX-SX CCL.
In addition to the above, during 2013-14, comprehensive inspections of the following CCs were undertaken for grant of recognition, viz., NSCCL, ICCL and MCX-SX CCL.
II. Inspection of Market Intermediaries
The number of inspections has increased to 350 during 2013-14 from 300 in 2012-13. The inspection process of intermediaries has been further streamlined with a view to improve the quality such as selection of themes for inspections, questionnaire for inspections and follow up action. It was ensured that the inspections are concluded expeditiously. Based on the findings of inspections after considering the comments of intermediaries, they were specifically advised about the areas where improvement was required by them. They were also required to report to SEBI about the corrective steps taken by them and also place the same before their board/partners/proprietor, as the case may be. These steps taken by SEBI have improved the level of compliance among the intermediaries. Administrative and quasi-judicial actions were initiated based on the deficiencies and seriousness of the violations committed by the intermediaries. A. Inspection of Stock Brokers and
Sub-Brokers During the year 2013-14, 217 stock brokers and sub-brokers have been inspected as against 201 in the financial year 2012-13. Specific purpose risk-based inspections

169
Part Three: Functions of SEBI in Respect of Ma� ers Specifi ed in Section 11 of SEBI Act, 1992
were carried out during the year. The focus of the inspections included themes such as compliance of norms regarding anti-money laundering, investor redressal mechanism, handling of funds and securities of clients, settlement of accounts of clients on timely basis, segregation of clients and proprietary funds/securities, KYC norms, clearing operations, etc. During inspections, the compliance of specific provisions of SEBI regulations/ circulars was verified. The details of inspection of stock brokers and sub-brokers carried out are given in Table 3.24.
Table 3.24: Inspection of Stock Brokers/ Sub-brokers
Particulars 2012-13 2013-14
1 2 3
Inspections Completed – Stock Brokers 162 160
Inspections Completed - Sub - brokers 39 57
Total 201 217
In compliance with the requirement of inspecting active members by the stock exchanges, the number of entities inspected by the stock exchanges is given in Table 3.25:
Table 3.25: Inspection by Stock Exchanges
Year NSE BSE MCX-SX USE
1 2 3 4 5
2012-13 1,384 936 245 89
2013-14 889 442 490 22
The stock exchanges carried out risk based inspections as per new policy adopted by them in consultation with SEBI. Additionally, stock brokers/clearing members are required to carry out complete internal audit on a half
yearly basis by independent auditors. Stock exchanges levy penalties for delay in filing the internal audit reports by stock brokers. The system of internal audits of stock brokers by outside professionals, inspections by stock exchanges and by SEBI has improved the compliance level of stock brokers.
B. Inspection of Other Intermediaries
Risk based and special focus inspections of intermediaries are undertaken by SEBI to ascertain the extent of compliance on specific issues. SEBI has been carrying out inspection of the merchant bankers, randomly on the basis of public/rights issue, open offer and buy-back etc., to check the due diligence exercised in respect of pre-issue and post-issue activities, and the registrars to an issue to check the allotment process followed and the redressal of investor complaints handled by them.
SEBI conducted inspections of debenture trustees based on the number of public issues handled by them to confirm the compliance with the applicable regulatory and statutory requirements with focus on their systems and controls with respect to monitoring of payment of interest/ redemption amount, processing of investor grievances and action taken in case of defaults by issuer companies.
During 2013-14, inspections were completed for 57 depository participants, 42 merchant bankers, five credit rating agencies, four debenture trustees and 25 RTIs & STAs. The total number of inspections conducted by SEBI of these intermediaries has increased during the year, from 99 in 2012-13 to 133 in 2013-14 (Table 3.26). There was special focus on follow-up actions after the inspections so that corrective steps are taken by the intermediaries.
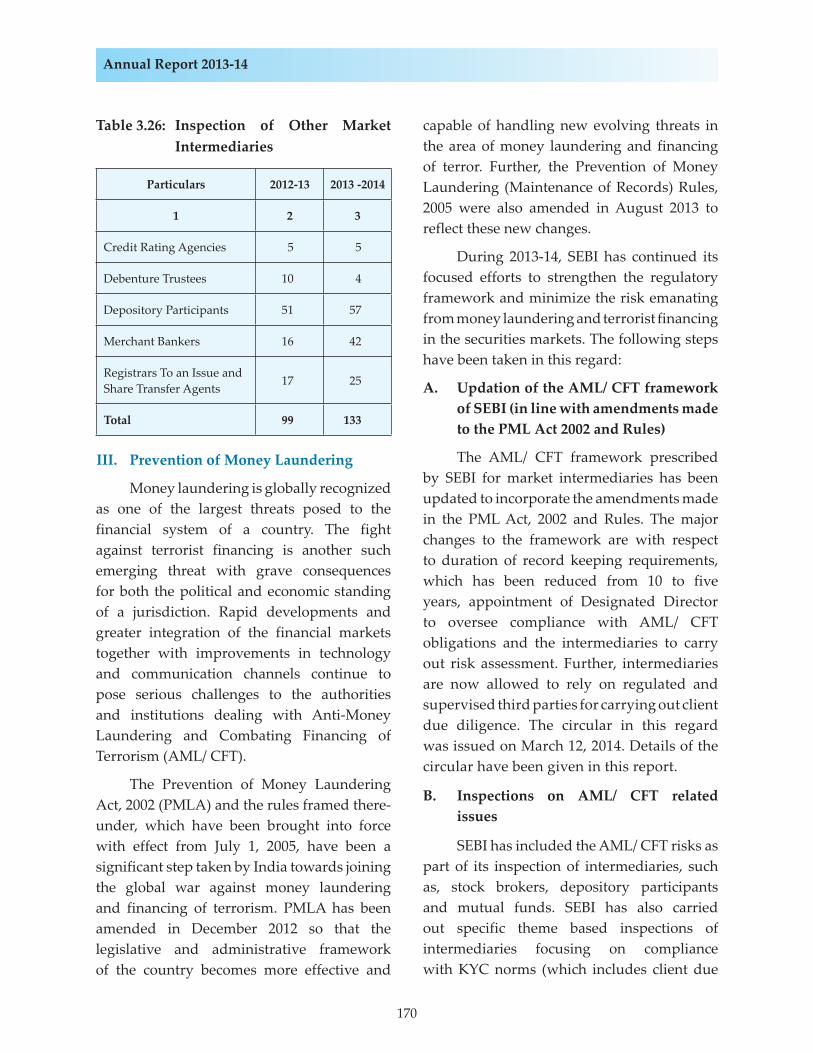
170
Annual Report 2013-14
Table 3.26: Inspection of Other Market Intermediaries
Particulars 2012-13 2013 -2014
1 2 3
Credit Rating Agencies 5 5
Debenture Trustees 10 4
Depository Participants 51 57
Merchant Bankers 16 42
Registrars To an Issue and Share Transfer Agents 17 25
Total 99 133
III. Prevention of Money Laundering
Money laundering is globally recognized as one of the largest threats posed to the financial system of a country. The fight against terrorist financing is another such emerging threat with grave consequences for both the political and economic standing of a jurisdiction. Rapid developments and greater integration of the financial markets together with improvements in technology and communication channels continue to pose serious challenges to the authorities and institutions dealing with Anti-Money Laundering and Combating Financing of Terrorism (AML/ CFT).
The Prevention of Money Laundering Act, 2002 (PMLA) and the rules framed there-under, which have been brought into force with effect from July 1, 2005, have been a significant step taken by India towards joining the global war against money laundering and financing of terrorism. PMLA has been amended in December 2012 so that the legislative and administrative framework of the country becomes more effective and
capable of handling new evolving threats in the area of money laundering and financing of terror. Further, the Prevention of Money Laundering (Maintenance of Records) Rules, 2005 were also amended in August 2013 to reflect these new changes.
During 2013-14, SEBI has continued its focused efforts to strengthen the regulatory framework and minimize the risk emanating from money laundering and terrorist financing in the securities markets. The following steps have been taken in this regard:
A. Updation of the AML/ CFT framework of SEBI (in line with amendments made to the PML Act 2002 and Rules)
The AML/ CFT framework prescribed by SEBI for market intermediaries has been updated to incorporate the amendments made in the PML Act, 2002 and Rules. The major changes to the framework are with respect to duration of record keeping requirements, which has been reduced from 10 to five years, appointment of Designated Director to oversee compliance with AML/ CFT obligations and the intermediaries to carry out risk assessment. Further, intermediaries are now allowed to rely on regulated and supervised third parties for carrying out client due diligence. The circular in this regard was issued on March 12, 2014. Details of the circular have been given in this report.
B. Inspections on AML/ CFT related issues
SEBI has included the AML/ CFT risks as part of its inspection of intermediaries, such as, stock brokers, depository participants and mutual funds. SEBI has also carried out specific theme based inspections of intermediaries focusing on compliance with KYC norms (which includes client due
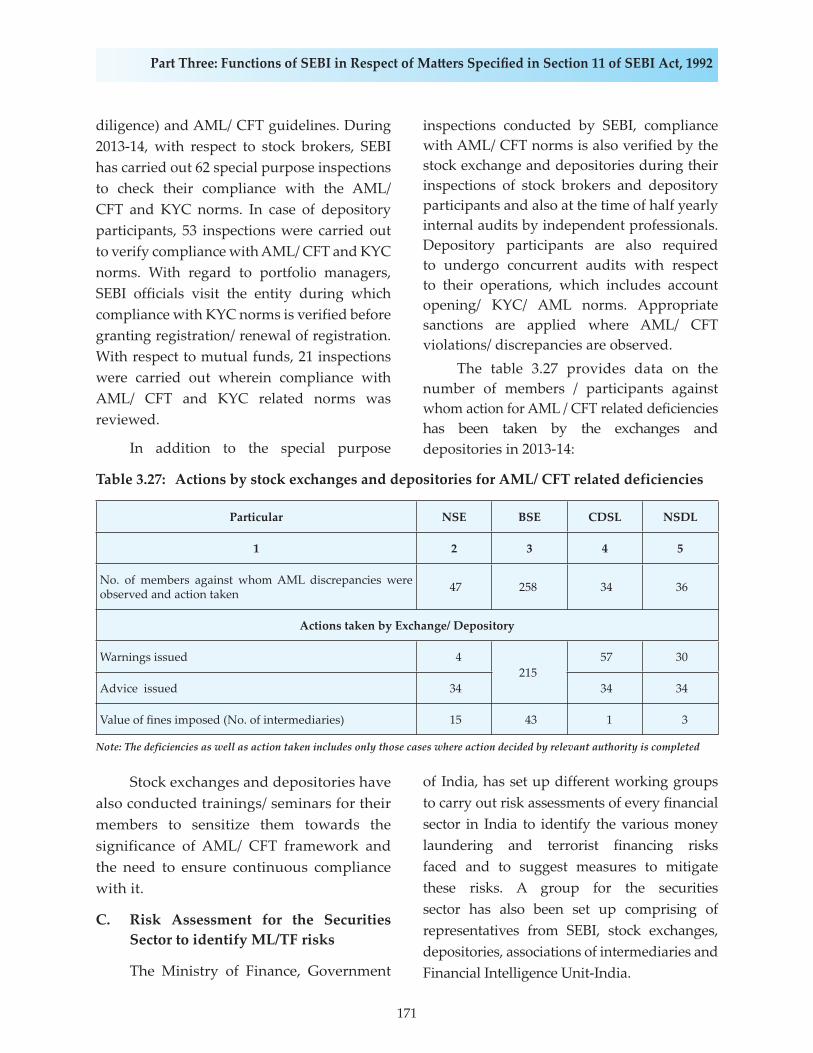
171
Part Three: Functions of SEBI in Respect of Ma� ers Specifi ed in Section 11 of SEBI Act, 1992
diligence) and AML/ CFT guidelines. During 2013-14, with respect to stock brokers, SEBI has carried out 62 special purpose inspections to check their compliance with the AML/ CFT and KYC norms. In case of depository participants, 53 inspections were carried out to verify compliance with AML/ CFT and KYC norms. With regard to portfolio managers, SEBI officials visit the entity during which compliance with KYC norms is verified before granting registration/ renewal of registration. With respect to mutual funds, 21 inspections were carried out wherein compliance with AML/ CFT and KYC related norms was reviewed.
In addition to the special purpose
inspections conducted by SEBI, compliance with AML/ CFT norms is also verified by the stock exchange and depositories during their inspections of stock brokers and depository participants and also at the time of half yearly internal audits by independent professionals. Depository participants are also required to undergo concurrent audits with respect to their operations, which includes account opening/ KYC/ AML norms. Appropriate sanctions are applied where AML/ CFT violations/ discrepancies are observed. The table 3.27 provides data on the number of members / participants against whom action for AML / CFT related deficiencies has been taken by the exchanges and depositories in 2013-14:
Table 3.27: Actions by stock exchanges and depositories for AML/ CFT related deficiencies
Particular NSE BSE CDSL NSDL
1 2 3 4 5
No. of members against whom AML discrepancies were observed and action taken 47 258 34 36
Actions taken by Exchange/ Depository
Warnings issued 4215
57 30
Advice issued 34 34 34
Value of fi nes imposed (No. of intermediaries) 15 43 1 3
Note: The deficiencies as well as action taken includes only those cases where action decided by relevant authority is completed
Stock exchanges and depositories have also conducted trainings/ seminars for their members to sensitize them towards the significance of AML/ CFT framework and the need to ensure continuous compliance with it.
C. Risk Assessment for the Securities Sector to identify ML/TF risks
The Ministry of Finance, Government
of India, has set up different working groups to carry out risk assessments of every financial sector in India to identify the various money laundering and terrorist financing risks faced and to suggest measures to mitigate these risks. A group for the securities sector has also been set up comprising of representatives from SEBI, stock exchanges, depositories, associations of intermediaries and Financial Intelligence Unit-India.
172
Annual Report 2013-14
D. International co-operation on AML/ CFT related issues
In order to protect the international financial system from money laundering and financing of terrorism (ML/ FT) risks and to encourage greater compliance with the AML/ CFT standards, the FATF identifies jurisdictions that have strategic deficiencies and works with them to address those deficiencies that pose a risk to the international financial system. The names of these jurisdictions are made public as part of a FATF Public Statement. As required by the FATF Recommendations, the Ministry of Finance, Government of India circulates the FATF Public Statements to all regulators with an advice to disseminate the same to all financial institutions under their supervision for applying enhanced due diligence measures when dealing with clients from these high-risk jurisdictions. In the year 2013-14, SEBI circulated three such FATF Public Statements dated June 21, 2013, October 18, 2013 and February 14, 2014 to registered intermediaries for their compliance.
The Eurasian Group (EAG) had instituted a typology research project on topic “Money Laundering through the Securities Market”, the leadership of which was assigned to SEBI. SEBI submitted the final report of the project, based on information received from various member jurisdictions. Earlier, SEBI had also made two presentations on the preliminary findings in the meetings of the Group held in Moscow and New Delhi. The report was published on the EAG website in September 2013. In September 2013, the Australian Transaction Reports and Analysis Centre (AUSTRAC) had organized a three day AML regional workshop in Colombo, Sri Lanka, to assist the regulators of the capital
markets in South Asia to assess the threats and vulnerabilities of the securities markets in South Asia to money laundering. SEBI made a presentation on the AML/ CFT framework and steps taken in Indian securities markets.
10. DELEGATED POWERS AND FUNCTIONS
Section 29A of the Securities Contracts (Regulation) Act, 1956 permits the Central Government to delegate powers exercisable by it under any provision of the SC (R) Act, 1956 to SEBI also by order published in the Official Gazette except the power to make rules. The Central Government has delegated certain powers to SEBI with respect to regulation of contracts in securities and stock exchanges and clearing corporations. The delegated powers with respect to contracts in securities include the power to notify permissible contracts in securities, power to prohibit contract in securities in certain cases and power to extend the application of section 17 with respect to spot delivery contracts. In exercise of such delegated powers to prevent undesirable speculation in securities market, SEBI vide notification dated October 3, 2013 had superseded the notification dated the March 1, 2000 and declared that no person in the territory to which SC (R) Act extends, shall, save with the permission of the Board, enter into any contract for sale or purchase of securities other than a contract falling under any one or more of categories specified therein. The said notification, inter alia, permitted contracts for pre-emption including right of first refusal, tag-along or drag-along rights contained in the shareholders agreements or articles of association of companies. SEBI has also permitted contracts containing an option for purchase or sale of securities subject to the following:
173
Part Three: Functions of SEBI in Respect of Ma� ers Specifi ed in Section 11 of SEBI Act, 1992
• the title and ownership of the underlying securities are held continuously by the selling party to such a contract for a minimum period of one year from the date of entering into the contract;
• the price or consideration payable for the sale or purchase of the underlying securities pursuant to exercise of any option contained therein, is in compliance with all the laws for the time being in force, as applicable; and
• the contract has to be settled by way of actual delivery of the underlying securities.
The contracts permitted under the said notification are mandated to be in accordance with the provisions of Foreign Exchange Management Act, 1999. Further, it was declared that the said notification would not affect or validate any contract which has been entered into prior to the date of the said notification. The said notification is also in line with the proviso to section 58(2) of the Companies Act, 2013 which states that “any contract or arrangement between two or more persons in respect of transfer of securities shall be enforceable as a contract”.
Delegated powers to SEBI with respect to stock exchanges and clearing corporations
include the power to grant or withdraw recognition, power to approve additional trading floor, new segments and new products in stock exchanges, power to enquire into the affairs of a stock exchange, licensing of dealers in securities, power to direct rules to be made or make rules, power to supersede or reconstitute the governing board and suspend the business.
11. FEES AND OTHER CHARGES
Details of the amount of fees and other charges (un-audited) collected by SEBI from market intermediaries on both recurring and non-recurring basis is provided in Table below. During 2013-14, the total amount of fees and other charges received was `175 crore (unaudited) as against `148.7 crore in 2012-13 (audited). The recurring fee was 46.5 percent in 2013-14 as compared to 59.4 percent in 2012-13. The largest amount of `34.4 crore was collected from registration of derivative members, while the second largest recurring fee of `12.5 crore was collected from stock brokers and sub-brokers. In non recurring fee category, the highest fee was collected from FIIs (`22.2 crore) followed by fees from sub account - foreign institutional investors (`20.3 crore), mutual funds (`15 crore), and offer documents and prospectuses filed (`13.3 crore).

174
Annual Report 2013-14
Table 3.28: Fees and other Charges (` crore)
Particulars 2012-13 2013-14 (Unaudited)
Recurring fees #
Non-recurring fees ##
Total Fees Received
Recurring fees #
Non-recurring fees ##
Total Fees Received
(Unaudited)1 2 3 4 5 6 7
Off er Documents and prospectuses fi led - 4.9 4.9 - 13.3 13.3Merchant Bankers 3.0 2.0 5.0 1.8 2.4 4.2Underwriters 0.1 0.0 0.1 0.1 - 0.1Portfolio Managers 2.7 2.4 5.1 3.2 1.2 4.4Registrars to an Issue and Share Transfer Agents 0.4 0.1 0.5 0.3 0.1 0.4
Bankers to an Issue 1.1 0.8 1.9 0.7 0.6 1.3Debenture Trustees 0.5 0.4 0.9 0.6 0.1 0.6Takeover fees - 10.3 10.3 - 10.6 10.6Mutual Funds 2.4 11.2 13.6 2.5 15.0 17.5Stock Brokers and Sub-Brokers 19.8 - 19.8 12.5 12.5Foreign Institutional Investors - 11.6 11.6 - 22.2 22.2Sub Account - Foreign Institutional Investors - 10.2 10.2 - 20.3 20.3
Depositories 0.2 - 0.2 0.2 0.2Depository Participants 0.1 2.2 2.3 0.1 1.6 1.7Designated Depository Participant - - - 0.7 0.7Venture Capital Funds - 0.2 0.2 - - -Custodian of Securities 10.0 0.2 10.2 11.1 0.0 11.1Approved Intermediaries under Securities Lending Scheme 0.0 - 0.0 0.1 0.2 0.3
Credit Rating Agencies 0.1 - 0.1 - 0.1 0.1Listing Fees Contribution from Stock Exchanges 6.9 - 6.9 7.6 7.6
Alternative Investment Scheme - 2.8 2.8 - 3.5 3.5KYC Registration Fees - 0.1 0.1 - 0.0 0.0Foreign Venture Capital - 0.8 0.8 - 1.0 1.0Derivatives Members registration 34.8 - 34.8 34.4 34.4Investment Advisor - - - - 0.9 0.9Informal Guidance Scheme - 0.0 0.0 - 0.0 0.0Regulatory Fees 6.4 - 6.4 6.22 6.2Total 88.4 60.3 148.7 81.3 93.7 175
Notes: 1. # Recurring fees: Fees which is received on annual/3-yearly/5-yearly basis (includes Fee/ Service Fee/ annual fee/ Listing Fees from exchanges/ Regulatory Fees from stock exchanges).
2. ## Non-recurring fees: Fees which is received on one time basis. Includes fee for Offer Documents Filed/ Registration Fee/ Application Fee/ Takeover Fees/ Informal Guidance Scheme/ FII Registration and FII Sub –Accounts Registration.
3. Since the amount realised by way of penalties on or after 29.10.2002 has been credited to the Consolidated Fund of India, therefore, the same has not been included in the fees income of SEBI since 2003-04.
4. Stock brokers and sub-brokers fee includes annual fees and turnover fees.
5. Stock brokers and derivatives fees are of recurring nature and depend on the trading turnover of the stock brokers and members of derivatives segment.
175
Part Three: Functions of SEBI in Respect of Ma� ers Specifi ed in Section 11 of SEBI Act, 1992
12. RESEARCH AND STUDIES Section 11(2) (l) of the SEBI Act, 1992 enshrines SEBI to undertake research activities for effectively fulfilling its functions. During 2013-14, SEBI undertook new research initiatives to boost in-house research and capabilities, complied with the submission of mandatory report as per the Act and continued to publish information for the benefit of various stakeholders.
SEBI is responsible to maintain a repository of data for entire capital/ securities market, collection of data from various sources, verifying their accuracy and continuously maintaining/ updating the data. During 2013-14, SEBI has published SEBI Annual Report 2012-13, Handbook of Statistics on Indian Securities Market 2013 and SEBI Monthly Bulletin (monthly publication) which are available in the publication section of SEBI website (www.sebi.gov.in). SEBI has been distributing these publications to various stakeholders in the market like research institutions, investor associations, mutual funds, banks, etc on gratis. Apart from the publications, SEBI was responsible for providing information regularly to Ministry of Finance (MoF), Reserve Bank of India (RBI), Ministry of Corporate Affairs and Government of Maharashtra etc.
SEBI celebrated its Silver Jubilee in 2013. In this context, SEBI published the Book “Banyan tree to e- trading” at the silver jubilee celebrations. The book was released on May 25, 2013 by Hon’ble Prime Minister of India Dr. Manmohan Singh.
I. Research Activities
SEBI Development Research Group (DRG) is a new research initiative which aims to undertake extensive policy research to analyze the existing regulatory policies from an academic perspective as well as to
suggest new policy alternatives, essentially on subjects contributing clarity and solutions to challenges faced by SEBI. During 2013-14, under DRG-I, four DRG studies were successfully completed and published on the following topics :A. Foreign Investment in Indian
Government bond MarketB. Impact of Increased Derivatives Trading
in India on the Price-Discovery ProcessC. Earnings Management in IndiaD. Penetration of Mutual Funds in India -
Opportunities and Challenges During 2013-14, officers from SEBI presented research papers on the following topics A. ‘Black Economy & Securities Market - Role
of SEBI’ presented on 9-10 December 2013 at Jawaharlal Nehru University, New Delhi.
B. “Currency Futures Trading in India” presented at “World Finance & Banking Symposium” held at Beijing during Dec 16-17, 2013.
C. “Cross Country Trading of Nifty Derivatives” presented at the Golden Jubilee Conference of the Indian Econometric Society (TIES) be held on Dec 22-24, 2013 at Indira Gandhi Institute of Development Research (IGIDR), Mumbai.
D. “Capital Market Development and Economic Growth: An Asian Perspective” presented at the International Research Conference, held on March 14, 2014 at Durgadevi Saraf Institute of Management Studies (DSIMS), Mumbai.
II. Systemic Stability Unit During 2013-14, SEBI represented India on Thematic Review Team “IOSCO Principles on Systemic Risk – Assessment of IOSCO
176
Annual Report 2013-14
Principle 6 and 7” and also participated in the review conducted. SEBI is also involved in the implementation of the Non-Legislative Recommendations of the Financial Sector Legislative Reforms Commission (FSLRC). CPSS and IOSCO under the aegis of FSB, issued 24 principles “Principles for Financial Market Infrastructure” -April 2012. In light of the above, SEBI had set up a Technical Group for reviewing the self assessment done by the FMIs pertaining to the securities market. The Technical group had identified systemically important FMIs: Clearing Corporations- NSCCL, ICCL, MCX-SX CCL; Depositories-NSDL, CDSL. The self assessment exercise by all FMIs and assessment by SEBI has been completed. SEBI had also contributed in the Financial Stability Report June and December, 2013, published by RBI covering issues like Tapering of Quantitative Easing and FII flows in India, Volatility and Returns in Indian Securities Market, Cyber Crime growing as Systemic Risk, FII Holdings and financial stability, Trends in FII Flows, Analysis of trends in equity issuances by Indian companies, Facts and Concerns on Pledging of Shares by Promoters, Liquidity Issues in MMMFs etc.
III. Academic Interactions
SEBI invites renowned scholars and financial market practitioners, to deliver lecture/talk on the topics related to securities markets, economics and finance. During the year, SEBI invited experts to speak on the topics such as: “Economic Outlook for 2013-14: Indian and Global context”, “HFT, Latency and Regulations” and “Impact of Financial Globalization”. These discussions between the speaker and the SEBI staff helped the SEBI officials to gain insights and enhance their knowledge about the latest
developments in the market place, including market movements, policy requirements and regulations.
IV. International Research Conference
SEBI organized its First International Research Conference during January 27-28, 2014 in Mumbai. The topic of the conference was “High frequency trading (HFT), Algo Trading and Co-location”. Academicians/market practitioners/regulators, having experience in the field, from countries such as USA, Spain, Australia, Canada, Japan, India etc were invited for the conference. During the conference, the participants discussed issues related to impact of HFT on market quality, financial stability, information asymmetry and retail investors, HFT in developing countries, regulatory mechanism and technology as an enabler to re-level the field.
V. New Research Initiatives
Statistical Analytics Group has been set up to scientifically supplement the investigation and surveillance functions of SEBI. The works initiated within the group are as follows:
• Stock price modelling using the concepts of Geometric Brownian Motion: In financial markets, the dynamics of stock prices are reflected by uncertain movements of their value over time which is attributed to the Efficient Market hypothesis (EMH) . Based on market restrictions and laws, Geometric Brownian Motion is a mathematical approach for stock price modelling. The objective of this initiative is to model the return data of stock prices of different scrips and check whether they really follow Geometric Brownian Motion as desired or not.
177
Part Three: Functions of SEBI in Respect of Ma� ers Specifi ed in Section 11 of SEBI Act, 1992
• Disgorgement calculation for insider trading: In order to overcome the limitations of event study analysis, a probabilistic methodology was used to calculate disgorgement amount. The method mainly consists of computation of the potential probabilistic disgorgement by analyzing all the future price scenarios, assigning them a suitable probability measure on the basis of the strategy of the insider and on the current stock price. The stochastic differential equation adopted in this model is the geometric Brownian motion applied by Black & Scholes to their option-pricing model.
• Developing algorithm to detect Insider Trading: The aim of this initiative to generate alert for entities that may be associated with Insider trading based on the day-wise trading data. Based on the model parameters, notional volume and notional percentage profit, cluster analysis mechanism is used to classify all the clients/ investors traded in a scrip into some mutually exclusive and exhaustive groups ,such that within each group the investors are homogeneous in nature and between the groups they are heterogeneous. By forming two groups, namely normal and anomalous, the anomalous investors are filtered based on their trading pattern surrounding the announcement date in order to generate final suspect list.
13. OTHER FUNCTIONSI. Surveillance
An effective surveillance mechanism is one of the prime requirements for well functioning securities market. Effective surveillance aims to facilitate orderly markets by safeguarding the integrity of market and can achieve investor confidence, protection and market development. The stock exchanges,
as a primary regulator, are entrusted to act as first level source of detection of market frauds, suspicious activity and any aberration in the market movement are then reported to SEBI for further examination.
At SEBI, the Integrated Surveillance Department (ISD) monitors market activity through its market alert systems and is in charge of overall market surveillance. The various processes and systems implemented as mentioned below help in detecting FUTP.
A. Integrated Market Surveillance System (IMSS)
Integrated Market Surveillance System (IMSS) keeps track of market aberrations and generates alerts on a daily basis. The alerts are analyzed periodically so as to identify any manipulative trading in the market. During the year, SEBI redesigned the IMSS system software to handle more than two billion messages in a day by implementing market splitting and streaming mechanism. To further enhance the system capability and performance of alert generation process, implementation of alerting on multiple market stream are underway.
B. Data Warehousing and Business Intelligence System (DWBIS)
DWBIS comprises of data warehouse, data mining and business intelligence tools. Presently, DWBIS consists of three phases:
a. Phase-I: A single source of market data and enables users to generate multi-dimensional reports dynamically (fully operational).
b. Phase-II: Several pattern recognition modules and predictive modeling scenarios (fully operational).
c. Phase-III: It consists of various reports to help research initiatives (released for User Acceptance Test (UAT)).
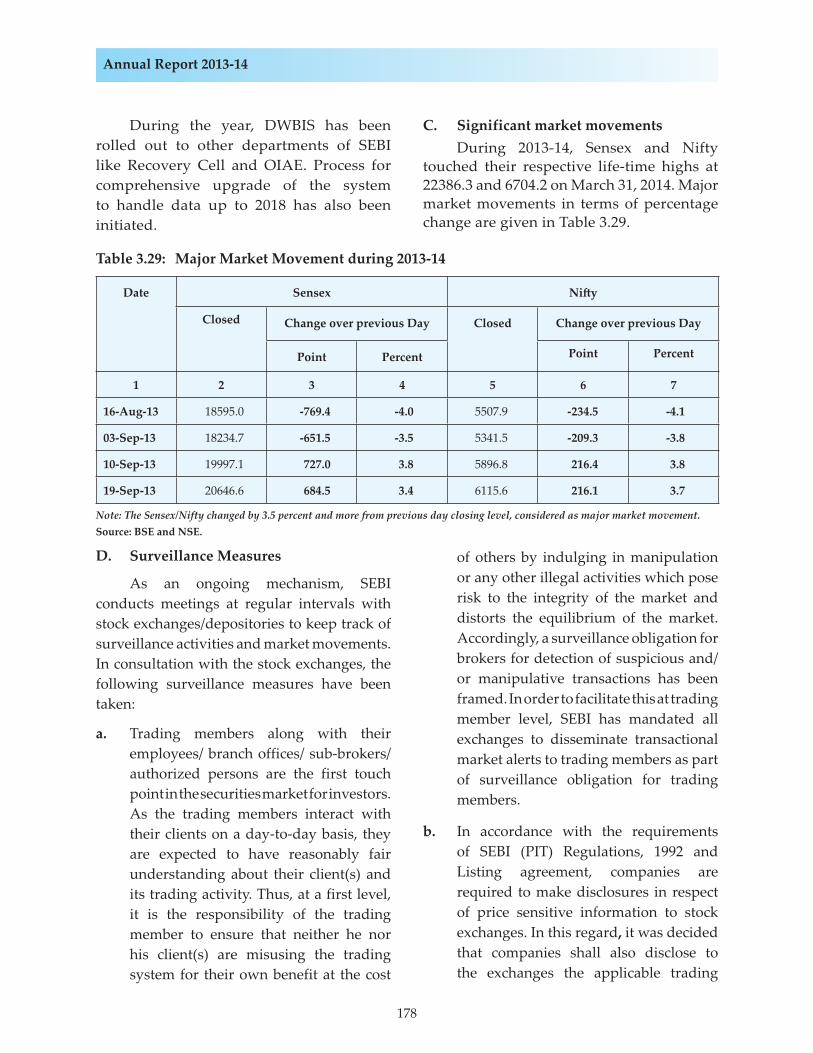
178
Annual Report 2013-14
During the year, DWBIS has been rolled out to other departments of SEBI like Recovery Cell and OIAE. Process for comprehensive upgrade of the system to handle data up to 2018 has also been initiated.
C. Significant market movements During 2013-14, Sensex and Nifty touched their respective life-time highs at 22386.3 and 6704.2 on March 31, 2014. Major market movements in terms of percentage change are given in Table 3.29.
Table 3.29: Major Market Movement during 2013-14
Date Sensex Ni� y
Closed Change over previous Day Closed Change over previous Day
Point Percent Point Percent
1 2 3 4 5 6 7
16-Aug-13 18595.0 -769.4 -4.0 5507.9 -234.5 -4.1
03-Sep-13 18234.7 -651.5 -3.5 5341.5 -209.3 -3.8
10-Sep-13 19997.1 727.0 3.8 5896.8 216.4 3.8
19-Sep-13 20646.6 684.5 3.4 6115.6 216.1 3.7
Note: The Sensex/Nifty changed by 3.5 percent and more from previous day closing level, considered as major market movement.Source: BSE and NSE.
D. Surveillance Measures
As an ongoing mechanism, SEBI conducts meetings at regular intervals with stock exchanges/depositories to keep track of surveillance activities and market movements. In consultation with the stock exchanges, the following surveillance measures have been taken:
a. Trading members along with their employees/ branch offices/ sub-brokers/ authorized persons are the first touch point in the securities market for investors. As the trading members interact with their clients on a day-to-day basis, they are expected to have reasonably fair understanding about their client(s) and its trading activity. Thus, at a first level, it is the responsibility of the trading member to ensure that neither he nor his client(s) are misusing the trading system for their own benefit at the cost
of others by indulging in manipulation or any other illegal activities which pose risk to the integrity of the market and distorts the equilibrium of the market. Accordingly, a surveillance obligation for brokers for detection of suspicious and/or manipulative transactions has been framed. In order to facilitate this at trading member level, SEBI has mandated all exchanges to disseminate transactional market alerts to trading members as part of surveillance obligation for trading members.
b. In accordance with the requirements of SEBI (PIT) Regulations, 1992 and Listing agreement, companies are required to make disclosures in respect of price sensitive information to stock exchanges. In this regard, it was decided that companies shall also disclose to the exchanges the applicable trading

179
Part Three: Functions of SEBI in Respect of Ma� ers Specifi ed in Section 11 of SEBI Act, 1992
window period along with any price sensitive information.
c. Often trading members appear as shareholders of a listed company while the actual holding is on behalf of their clients. This practice leads to masking the identity of the actual shareholders of a company. Accordingly, in order to increase transparency and provide correct picture of the actual shareholding of a listed company, the exchanges are advised to collect and disseminate shareholding by trading member in listed companies along with breakup of shareholding (held in their name or on behalf of the clients), in the format as prescribed by SEBI, on a quarterly basis, if such holding is one percent or more of the share capital of a listed company.
d. SEBI has mandated all exchanges to disseminate on their website, volume and member level concentration details for scrips / indices on which Liquidity Enhancement Schemes (LES) are present.
E. Surveillance Actions
During 2013-14, NSE, BSE and MCX-SX initiated preliminary examination and investigation in 56 cases, 644 cases and 33 cases respectively. In addition, as surveillance action, during 2013-14, NSE shifted 586 scrips to trade to trade (T to T) segment, BSE shifted 1,509 scrips to trade to trade (T to T) segment and MCX-SX shifted 236 scrips to trade to trade (T to T) segment. In this segment, scrips are traded and settled through mandatory delivery and no netting off positions are allowed. This leads to reduction in the amount of speculation as only those who can deliver the securities can enter into sale transactions and thereby day trading is reduced (Table 3.30).
Table 3.30: Surveillance Actions during 2013-14
Nature of Action NSE BSE MCX-SX
1 2 3 4
Scrips shi� ed to Trade to Trade segment
586 1,509 236
(336) (1,151) (1)
No. of scrips in which price bands were imposed (2 percent, 5 percent & 10 percent)
1,093 2,002 603
(693) (1,652) (41)
Preliminary Investigation taken up
56 644 33
(85) (885) (Na)
Rumours Verifi ed116 122 1
(94) (100) (Na)
Note: Figures in parentheses pertains to 2012-13.
With a view to dampen the amplitude of prices, scrips shifted to T to T segment attract applicable circuit filters. NSE reduced circuit filter in 1,093 instances, BSE in 2,002 instances and MCX-SX in 603 instances. NSE, BSE and MCX-SX verified 116, 122 and one rumours, respectively (Table 3.18A). Further, as a soft enforcement measure, NSE and BSE issued observation letter to 458 and 708 entities, respectively and caution letter to one and three entities, respectively.
II. Investigation
Timely completion of investigation cases and effective, proportionate and dissuasive action in case of violations of securities laws is important for protection of investors’ interest and ensuring fair, transparent and orderly functioning of the market. It is also vital for improving the confidence in the integrity of the securities market. SEBI is therefore constantly striving to upgrade its investigative skills by making use of Information Technology (IT) and other latest investigative tools. Importance of effective and credible use of investigation
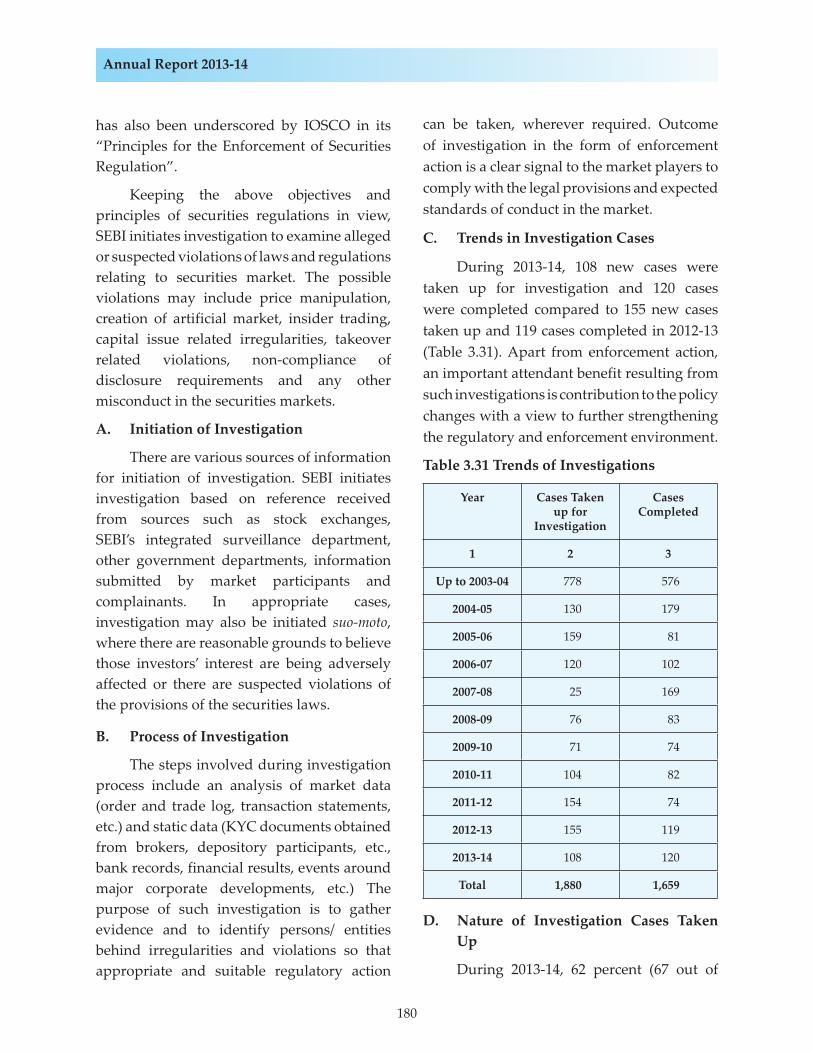
180
Annual Report 2013-14
has also been underscored by IOSCO in its “Principles for the Enforcement of Securities Regulation”.
Keeping the above objectives and principles of securities regulations in view, SEBI initiates investigation to examine alleged or suspected violations of laws and regulations relating to securities market. The possible violations may include price manipulation, creation of artificial market, insider trading, capital issue related irregularities, takeover related violations, non-compliance of disclosure requirements and any other misconduct in the securities markets.
A. Initiation of Investigation
There are various sources of information for initiation of investigation. SEBI initiates investigation based on reference received from sources such as stock exchanges, SEBI’s integrated surveillance department, other government departments, information submitted by market participants and complainants. In appropriate cases, investigation may also be initiated suo-moto, where there are reasonable grounds to believe those investors’ interest are being adversely affected or there are suspected violations of the provisions of the securities laws.
B. Process of Investigation
The steps involved during investigation process include an analysis of market data (order and trade log, transaction statements, etc.) and static data (KYC documents obtained from brokers, depository participants, etc., bank records, financial results, events around major corporate developments, etc.) The purpose of such investigation is to gather evidence and to identify persons/ entities behind irregularities and violations so that appropriate and suitable regulatory action
can be taken, wherever required. Outcome of investigation in the form of enforcement action is a clear signal to the market players to comply with the legal provisions and expected standards of conduct in the market.
C. Trends in Investigation Cases
During 2013-14, 108 new cases were taken up for investigation and 120 cases were completed compared to 155 new cases taken up and 119 cases completed in 2012-13 (Table 3.31). Apart from enforcement action, an important attendant benefit resulting from such investigations is contribution to the policy changes with a view to further strengthening the regulatory and enforcement environment.
Table 3.31 Trends of Investigations
Year Cases Taken up for
Investigation
Cases Completed
1 2 3
Up to 2003-04 778 576
2004-05 130 179
2005-06 159 81
2006-07 120 102
2007-08 25 169
2008-09 76 83
2009-10 71 74
2010-11 104 82
2011-12 154 74
2012-13 155 119
2013-14 108 120
Total 1,880 1,659
D. Nature of Investigation Cases Taken Up
During 2013-14, 62 percent (67 out of
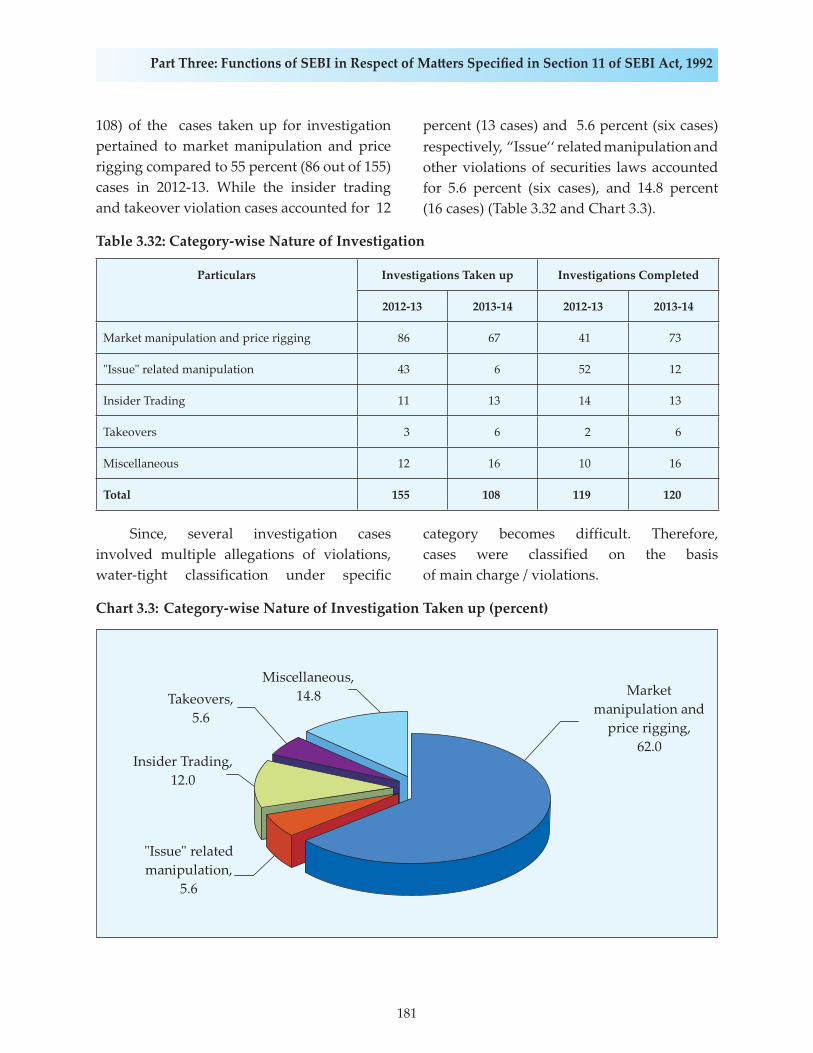
181
Part Three: Functions of SEBI in Respect of Ma� ers Specifi ed in Section 11 of SEBI Act, 1992
108) of the cases taken up for investigation pertained to market manipulation and price rigging compared to 55 percent (86 out of 155) cases in 2012-13. While the insider trading and takeover violation cases accounted for 12
percent (13 cases) and 5.6 percent (six cases) respectively, “Issue‘‘ related manipulation and other violations of securities laws accounted for 5.6 percent (six cases), and 14.8 percent (16 cases) (Table 3.32 and Chart 3.3).
Table 3.32: Category-wise Nature of Investigation
Particulars Investigations Taken up Investigations Completed
2012-13 2013-14 2012-13 2013-14
Market manipulation and price rigging 86 67 41 73
"Issue" related manipulation 43 6 52 12
Insider Trading 11 13 14 13
Takeovers 3 6 2 6
Miscellaneous 12 16 10 16
Total 155 108 119 120
Since, several investigation cases involved multiple allegations of violations, water-tight classification under specific
category becomes difficult. Therefore, cases were classified on the basis of main charge / violations.
Chart 3.3: Category-wise Nature of Investigation Taken up (percent)

182
Annual Report 2013-14
E. Nature of Investigation Cases Completed
During 2013-14, 60.8 percent (73 out of 120) investigation cases completed pertain to market manipulation and price rigging compared to 34 percent (41 out of 119) cases in 2012-13. In addition, the other category of cases completed
pertained to insider trading, takeover violations, “Issue‘‘ related manipulation and other violations of securities laws accounted 10.8 percent (13 cases), 5.0 percent (six cases), 10.0 percent (12 cases), and 13.3 percent (16 cases), respectively (Table 3.32 and Chart 3.4).
Chart 3.4: Category-wise Nature of Investigation Completed (percent)
F. Regulatory Action Taken
After completion of investigation, penal action is initiated as approved by the competent authority wherever violations of laws and obligations relating to securities market is observed. Action is decided based on the principles of objectivity, consistency, materiality and quality of evidence available, after thorough analysis and appreciation of
facts. The actions include issuing warning letters, initiating enquiry proceedings for registered intermediaries, initiating adjudication proceedings for levy of monetary penalties, passing directions under Section 11 of SEBI Act, 1992, and initiating prosecution and referring matter to other regulatory agencies.
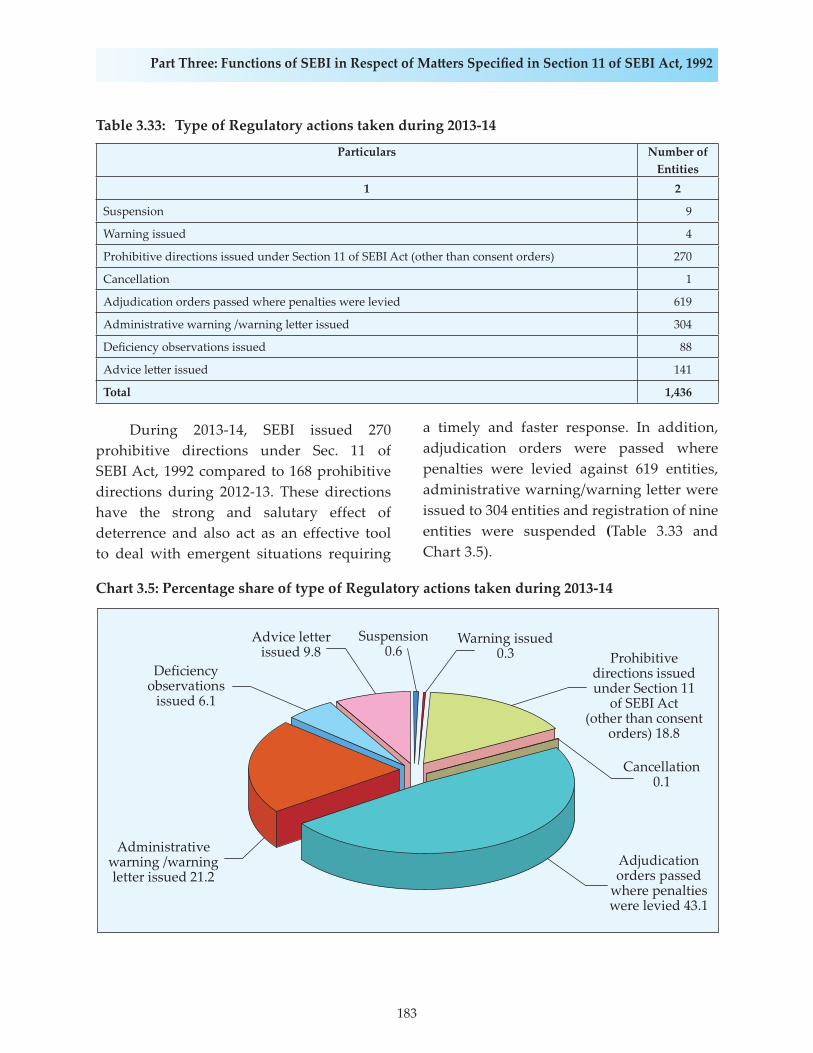
183
Part Three: Functions of SEBI in Respect of Ma� ers Specifi ed in Section 11 of SEBI Act, 1992
Table 3.33: Type of Regulatory actions taken during 2013-14
Particulars Number of Entities
1 2
Suspension 9
Warning issued 4
Prohibitive directions issued under Section 11 of SEBI Act (other than consent orders) 270
Cancellation 1
Adjudication orders passed where penalties were levied 619
Administrative warning /warning le� er issued 304
Defi ciency observations issued 88
Advice le� er issued 141
Total 1,436
During 2013-14, SEBI issued 270 prohibitive directions under Sec. 11 of SEBI Act, 1992 compared to 168 prohibitive directions during 2012-13. These directions have the strong and salutary effect of deterrence and also act as an effective tool to deal with emergent situations requiring
a timely and faster response. In addition, adjudication orders were passed where penalties were levied against 619 entities, administrative warning/warning letter were issued to 304 entities and registration of nine entities were suspended (Table 3.33 and Chart 3.5).
Chart 3.5: Percentage share of type of Regulatory actions taken during 2013-14
184
Annual Report 2013-14
G. Regulatory Action Initiated
During 2013-14, proceedings under Section 11 of SEBI Act, 1992 were initiated against 402 entities, proceedings under Intermediaries Regulations were initiated against nine entities and adjudication proceedings were initiated against 697 entities. In addition, Show Cause Notices were issued to 142 entities for the proceedings under Section 11 of SEBI Act, 1992.
H. Follow up of Investigations
After completion of investigation, the Investigation Department is also actively involved in post-investigation enforcement actions and quasi-judicial proceedings. Such actions include issuing show cause notices to the entities, examining their replies, organising and participating in the hearings of the entities before the Whole Time Members (WTM) of SEBI, co-ordination with Enforcement Department (EFD), issuing press releases after orders are passed, attending briefings of advocates and replying to their queries, co-ordination with Enforcement Department in the proceedings before Securities Appellate Tribunal (SAT) and before Courts, filing of complaints with Courts in co-ordination with Prosecution Department, follow-up for collection of penalty amount for orders passed by Adjudicating Officers, initiating prosecution for non-payment of penalties, processing of consent proposals filed by the entities, etc. Timely and qualitative completion of such actions is also important for ensuring the effectiveness of regulatory measures taken by SEBI.
On March 28,2014, SEBI has initiated the process of revamping of the follow-up proceedings pursuant to completion of investigation. This re-engineering has been initiated subsequent to the recommendations of the Consultant engaged by SEBI to revisit structural and organizational concerns,
re-prioritize areas of focus and enhance organizational efficiency. The consultant had identified significant areas for improvement in the follow up processes of investigation and recommended handing over of enforcement proceedings from the Investigation Department to the Enforcement Department (EFD) upon completion of investigation. This would ensure uniformity in approach and improve the efficiency of enforcement proceedings across the organization.
Accordingly, an Enforcement Task Force (ETF) was constituted, primarily to formalize the process / framework for handing over of enforcement matters to EFD upon completion of investigation/ inspection/ examination. The implementation of the ETF recommendations has commenced and will continue in phases and is to be completed by 2014-15.
III. Enforcement of Regulations
Effective enforcement lies at the heart of ensuring integrity, transparency and fairness in the market. It not only leads to better compliance culture, but also underscores the point that market misconduct and abuse will not go unpunished. A credible enforcement strategy underpins the importance of consistent, timely and transparent regulatory outcomes, which are proportionate, dissuasive and effective. Under SEBI Act, 1992, Securities Contracts (Regulation) Act, 1956 (SCRA) and Depositories Act, 1996, SEBI, broadly, pursues two streams of enforcement actions i.e. Administrative / Civil or Criminal. Administrative/Civil actions include issuing directions such as remedial orders, cease and desist orders, suspension or cancellation of certificate of registration and imposition of monetry penalty under the respective statutes. Proceedings of criminal nature involve initiating prosecution proceedings against violators by filing complaint before a criminal court.
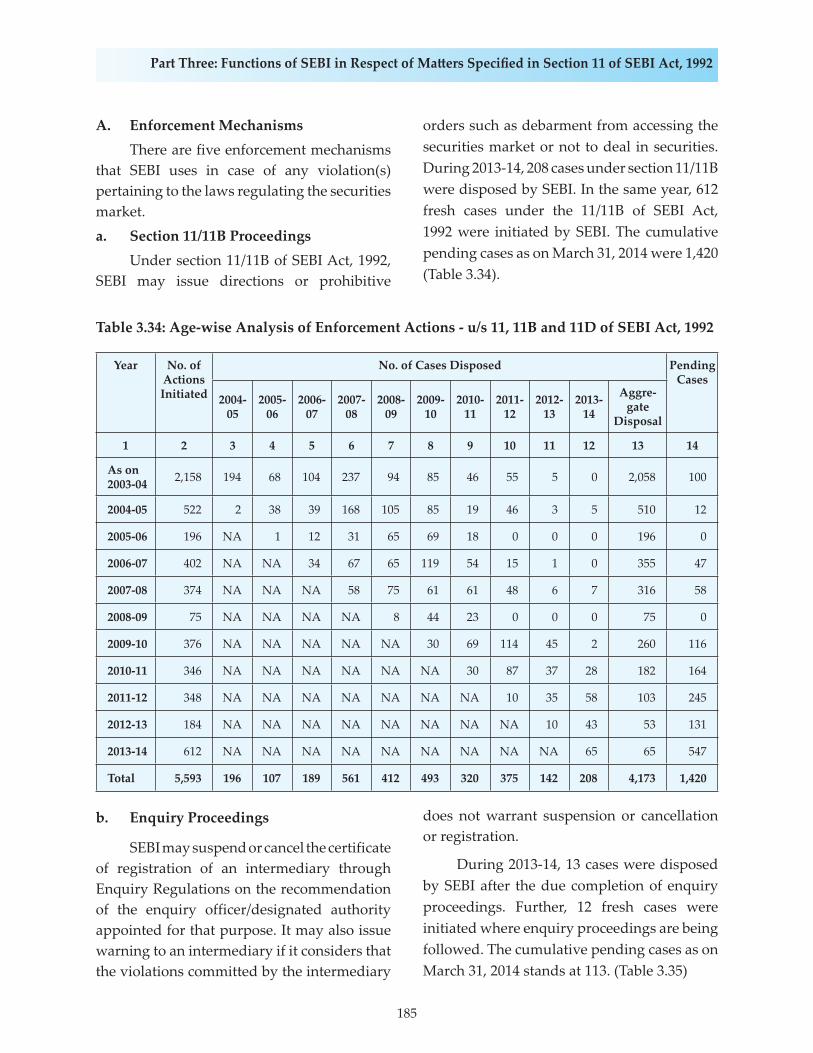
185
Part Three: Functions of SEBI in Respect of Ma� ers Specifi ed in Section 11 of SEBI Act, 1992
A. Enforcement Mechanisms There are five enforcement mechanisms that SEBI uses in case of any violation(s) pertaining to the laws regulating the securities market. a. Section 11/11B Proceedings Under section 11/11B of SEBI Act, 1992, SEBI may issue directions or prohibitive
orders such as debarment from accessing the securities market or not to deal in securities. During 2013-14, 208 cases under section 11/11B were disposed by SEBI. In the same year, 612 fresh cases under the 11/11B of SEBI Act, 1992 were initiated by SEBI. The cumulative pending cases as on March 31, 2014 were 1,420 (Table 3.34).
Table 3.34: Age-wise Analysis of Enforcement Actions - u/s 11, 11B and 11D of SEBI Act, 1992
Year No. of Actions Initiated
No. of Cases Disposed Pending Cases
2004-05
2005-06
2006-07
2007-08
2008- 09
2009-10
2010-11
2011-12
2012-13
2013-14
Aggre-gate
Disposal
1 2 3 4 5 6 7 8 9 10 11 12 13 14
As on 2003-04 2,158 194 68 104 237 94 85 46 55 5 0 2,058 100
2004-05 522 2 38 39 168 105 85 19 46 3 5 510 12
2005-06 196 NA 1 12 31 65 69 18 0 0 0 196 0
2006-07 402 NA NA 34 67 65 119 54 15 1 0 355 47
2007-08 374 NA NA NA 58 75 61 61 48 6 7 316 58
2008-09 75 NA NA NA NA 8 44 23 0 0 0 75 0
2009-10 376 NA NA NA NA NA 30 69 114 45 2 260 116
2010-11 346 NA NA NA NA NA NA 30 87 37 28 182 164
2011-12 348 NA NA NA NA NA NA NA 10 35 58 103 245
2012-13 184 NA NA NA NA NA NA NA NA 10 43 53 131
2013-14 612 NA NA NA NA NA NA NA NA NA 65 65 547
Total 5,593 196 107 189 561 412 493 320 375 142 208 4,173 1,420
b. Enquiry Proceedings
SEBI may suspend or cancel the certificate of registration of an intermediary through Enquiry Regulations on the recommendation of the enquiry officer/designated authority appointed for that purpose. It may also issue warning to an intermediary if it considers that the violations committed by the intermediary
does not warrant suspension or cancellation or registration.
During 2013-14, 13 cases were disposed by SEBI after the due completion of enquiry proceedings. Further, 12 fresh cases were initiated where enquiry proceedings are being followed. The cumulative pending cases as on March 31, 2014 stands at 113. (Table 3.35)
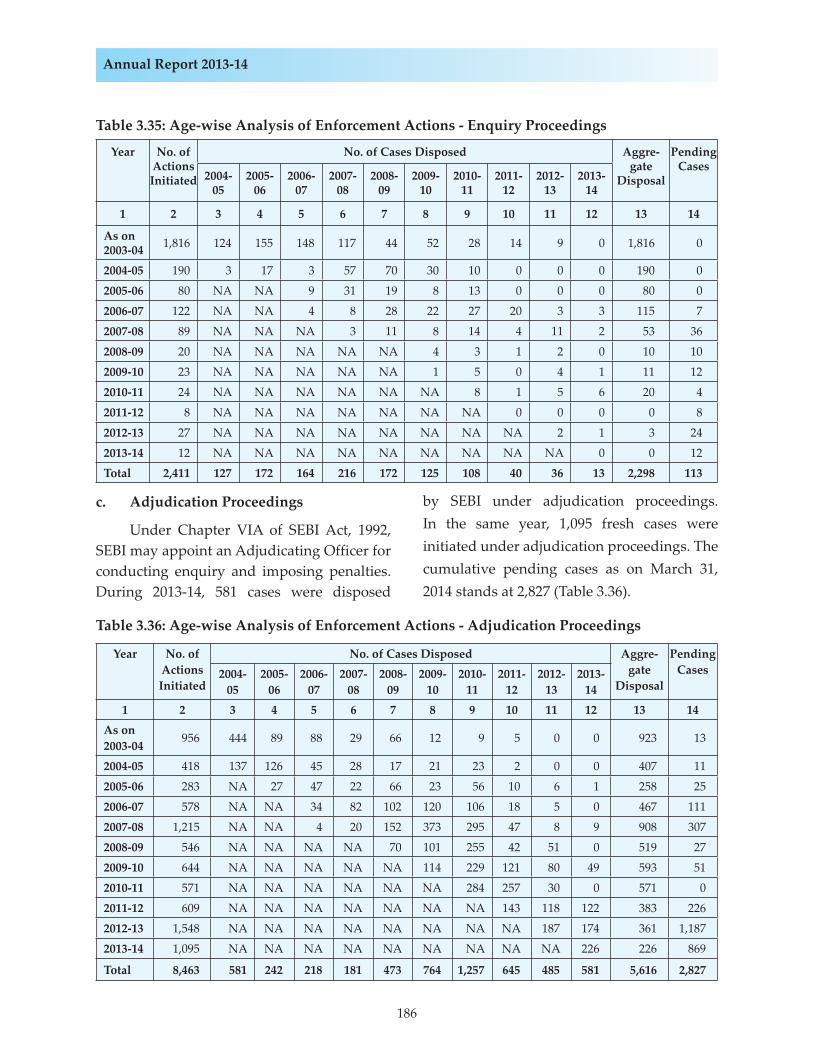
186
Annual Report 2013-14
Table 3.35: Age-wise Analysis of Enforcement Actions - Enquiry Proceedings
Year No. of Actions Initiated
No. of Cases Disposed Aggre-gate
Disposal
Pending Cases
2004-05
2005-06
2006-07
2007-08
2008-09
2009-10
2010-11
2011-12
2012-13
2013-14
1 2 3 4 5 6 7 8 9 10 11 12 13 14
As on 2003-04 1,816 124 155 148 117 44 52 28 14 9 0 1,816 0
2004-05 190 3 17 3 57 70 30 10 0 0 0 190 0
2005-06 80 NA NA 9 31 19 8 13 0 0 0 80 0
2006-07 122 NA NA 4 8 28 22 27 20 3 3 115 7
2007-08 89 NA NA NA 3 11 8 14 4 11 2 53 36
2008-09 20 NA NA NA NA NA 4 3 1 2 0 10 10
2009-10 23 NA NA NA NA NA 1 5 0 4 1 11 12
2010-11 24 NA NA NA NA NA NA 8 1 5 6 20 4
2011-12 8 NA NA NA NA NA NA NA 0 0 0 0 8
2012-13 27 NA NA NA NA NA NA NA NA 2 1 3 24
2013-14 12 NA NA NA NA NA NA NA NA NA 0 0 12
Total 2,411 127 172 164 216 172 125 108 40 36 13 2,298 113
c. Adjudication Proceedings
Under Chapter VIA of SEBI Act, 1992, SEBI may appoint an Adjudicating Officer for conducting enquiry and imposing penalties. During 2013-14, 581 cases were disposed
by SEBI under adjudication proceedings. In the same year, 1,095 fresh cases were initiated under adjudication proceedings. The cumulative pending cases as on March 31, 2014 stands at 2,827 (Table 3.36).
Table 3.36: Age-wise Analysis of Enforcement Actions - Adjudication Proceedings
Year No. of Actions Initiated
No. of Cases Disposed Aggre-gate
Disposal
Pending Cases2004-
052005-
062006-
072007-
082008-
092009-
102010-
112011-
122012-
132013-
141 2 3 4 5 6 7 8 9 10 11 12 13 14
As on 2003-04 956 444 89 88 29 66 12 9 5 0 0 923 13
2004-05 418 137 126 45 28 17 21 23 2 0 0 407 11
2005-06 283 NA 27 47 22 66 23 56 10 6 1 258 25
2006-07 578 NA NA 34 82 102 120 106 18 5 0 467 111
2007-08 1,215 NA NA 4 20 152 373 295 47 8 9 908 307
2008-09 546 NA NA NA NA 70 101 255 42 51 0 519 27
2009-10 644 NA NA NA NA NA 114 229 121 80 49 593 51
2010-11 571 NA NA NA NA NA NA 284 257 30 0 571 0
2011-12 609 NA NA NA NA NA NA NA 143 118 122 383 226
2012-13 1,548 NA NA NA NA NA NA NA NA 187 174 361 1,187
2013-14 1,095 NA NA NA NA NA NA NA NA NA 226 226 869
Total 8,463 581 242 218 181 473 764 1,257 645 485 581 5,616 2,827
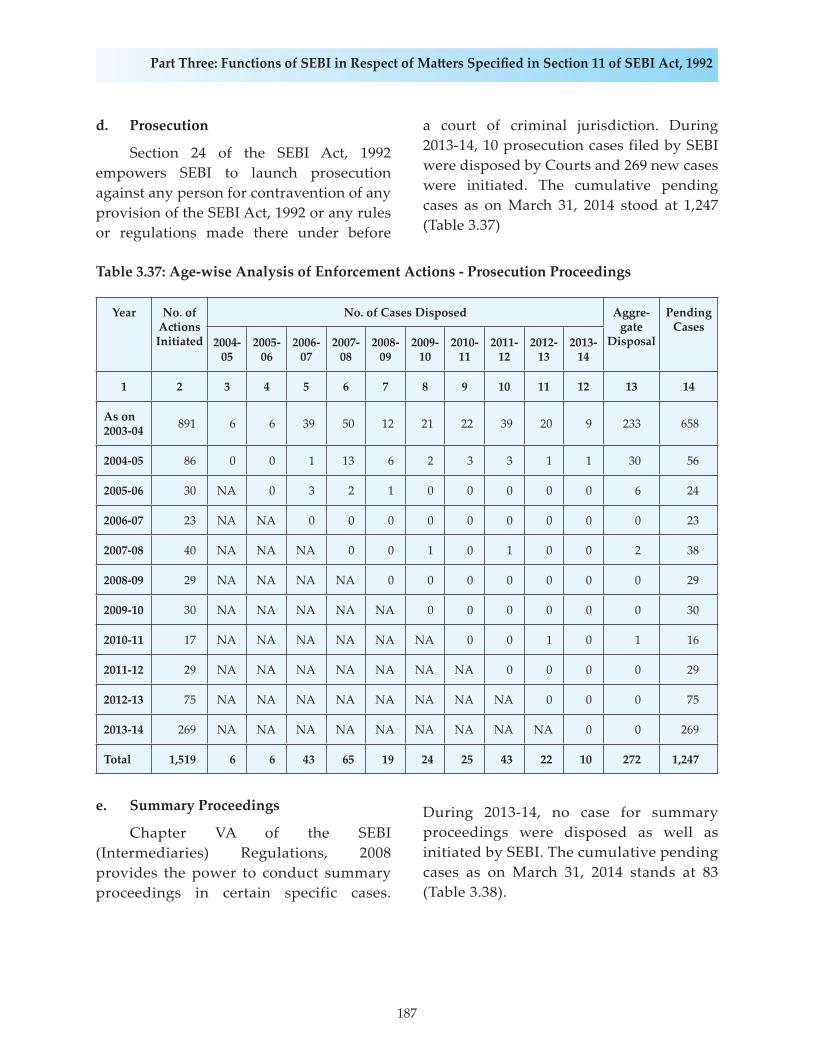
187
Part Three: Functions of SEBI in Respect of Ma� ers Specifi ed in Section 11 of SEBI Act, 1992
d. Prosecution
Section 24 of the SEBI Act, 1992 empowers SEBI to launch prosecution against any person for contravention of any provision of the SEBI Act, 1992 or any rules or regulations made there under before
a court of criminal jurisdiction. During 2013-14, 10 prosecution cases filed by SEBI were disposed by Courts and 269 new cases were initiated. The cumulative pending cases as on March 31, 2014 stood at 1,247 (Table 3.37)
Table 3.37: Age-wise Analysis of Enforcement Actions - Prosecution Proceedings
Year No. of Actions Initiated
No. of Cases Disposed Aggre-gate
Disposal
Pending Cases
2004-05
2005-06
2006-07
2007-08
2008-09
2009-10
2010-11
2011-12
2012-13
2013-14
1 2 3 4 5 6 7 8 9 10 11 12 13 14
As on 2003-04 891 6 6 39 50 12 21 22 39 20 9 233 658
2004-05 86 0 0 1 13 6 2 3 3 1 1 30 56
2005-06 30 NA 0 3 2 1 0 0 0 0 0 6 24
2006-07 23 NA NA 0 0 0 0 0 0 0 0 0 23
2007-08 40 NA NA NA 0 0 1 0 1 0 0 2 38
2008-09 29 NA NA NA NA 0 0 0 0 0 0 0 29
2009-10 30 NA NA NA NA NA 0 0 0 0 0 0 30
2010-11 17 NA NA NA NA NA NA 0 0 1 0 1 16
2011-12 29 NA NA NA NA NA NA NA 0 0 0 0 29
2012-13 75 NA NA NA NA NA NA NA NA 0 0 0 75
2013-14 269 NA NA NA NA NA NA NA NA NA 0 0 269
Total 1,519 6 6 43 65 19 24 25 43 22 10 272 1,247
e. Summary Proceedings
Chapter VA of the SEBI (Intermediaries) Regulations, 2008 provides the power to conduct summary proceedings in certain specific cases.
During 2013-14, no case for summary proceedings were disposed as well as initiated by SEBI. The cumulative pending cases as on March 31, 2014 stands at 83 (Table 3.38).
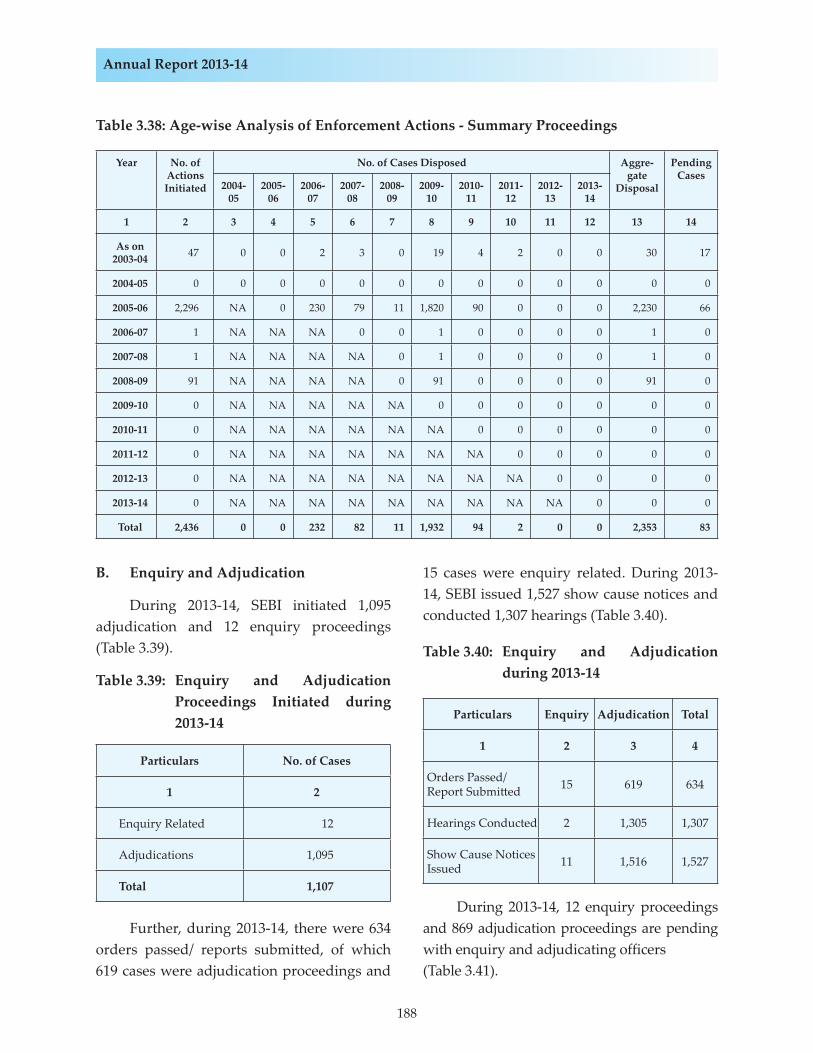
188
Annual Report 2013-14
Table 3.38: Age-wise Analysis of Enforcement Actions - Summary Proceedings
Year No. of Actions Initiated
No. of Cases Disposed Aggre-gate
Disposal
Pending Cases
2004-05
2005-06
2006-07
2007-08
2008-09
2009-10
2010-11
2011-12
2012-13
2013-14
1 2 3 4 5 6 7 8 9 10 11 12 13 14
As on 2003-04 47 0 0 2 3 0 19 4 2 0 0 30 17
2004-05 0 0 0 0 0 0 0 0 0 0 0 0 0
2005-06 2,296 NA 0 230 79 11 1,820 90 0 0 0 2,230 66
2006-07 1 NA NA NA 0 0 1 0 0 0 0 1 0
2007-08 1 NA NA NA NA 0 1 0 0 0 0 1 0
2008-09 91 NA NA NA NA 0 91 0 0 0 0 91 0
2009-10 0 NA NA NA NA NA 0 0 0 0 0 0 0
2010-11 0 NA NA NA NA NA NA 0 0 0 0 0 0
2011-12 0 NA NA NA NA NA NA NA 0 0 0 0 0
2012-13 0 NA NA NA NA NA NA NA NA 0 0 0 0
2013-14 0 NA NA NA NA NA NA NA NA NA 0 0 0
Total 2,436 0 0 232 82 11 1,932 94 2 0 0 2,353 83
B. Enquiry and Adjudication
During 2013-14, SEBI initiated 1,095 adjudication and 12 enquiry proceedings (Table 3.39).
Table 3.39: Enquiry and Adjudication Proceedings Initiated during 2013-14
Particulars No. of Cases
1 2
Enquiry Related 12
Adjudications 1,095
Total 1,107
Further, during 2013-14, there were 634 orders passed/ reports submitted, of which 619 cases were adjudication proceedings and
15 cases were enquiry related. During 2013-14, SEBI issued 1,527 show cause notices and conducted 1,307 hearings (Table 3.40).
Table 3.40: Enquiry and Adjudication during 2013-14
Particulars Enquiry Adjudication Total
1 2 3 4
Orders Passed/ Report Submi� ed 15 619 634
Hearings Conducted 2 1,305 1,307
Show Cause Notices Issued 11 1,516 1,527
During 2013-14, 12 enquiry proceedings and 869 adjudication proceedings are pending with enquiry and adjudicating officers (Table 3.41).
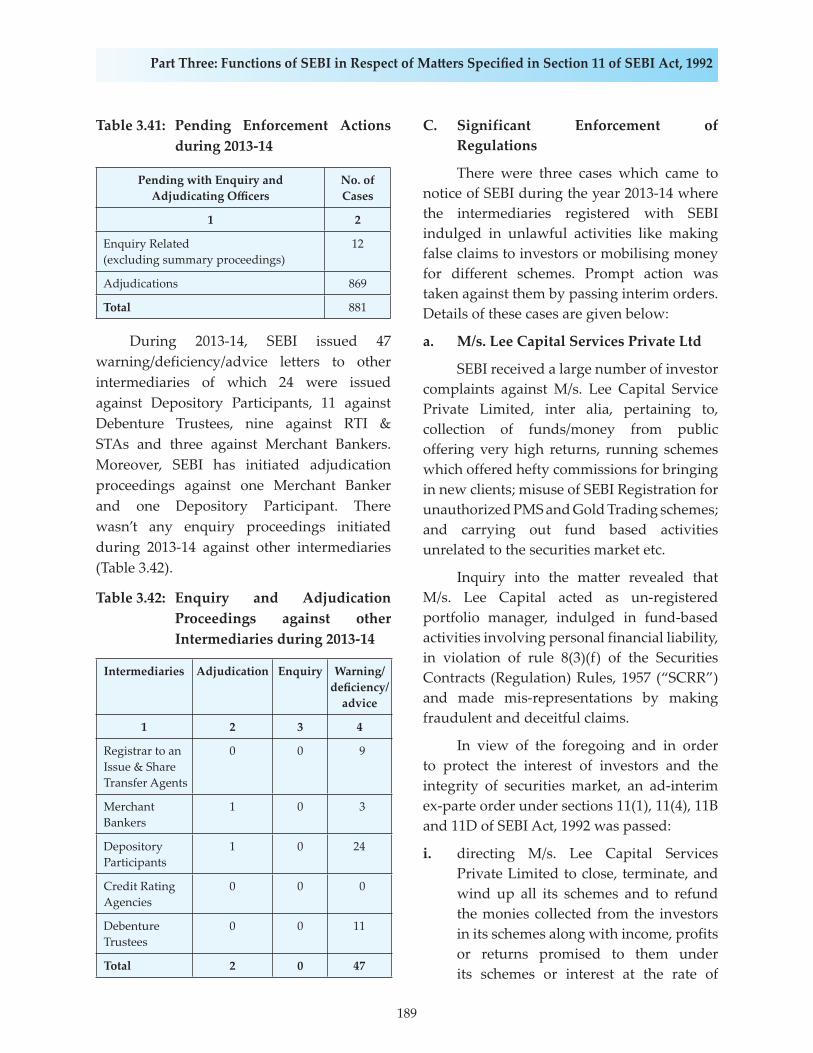
189
Part Three: Functions of SEBI in Respect of Ma� ers Specifi ed in Section 11 of SEBI Act, 1992
Table 3.41: Pending Enforcement Actions during 2013-14
Pending with Enquiry and Adjudicating Offi cers
No. of Cases
1 2
Enquiry Related (excluding summary proceedings)
12
Adjudications 869
Total 881
During 2013-14, SEBI issued 47 warning/deficiency/advice letters to other intermediaries of which 24 were issued against Depository Participants, 11 against Debenture Trustees, nine against RTI & STAs and three against Merchant Bankers. Moreover, SEBI has initiated adjudication proceedings against one Merchant Banker and one Depository Participant. There wasn’t any enquiry proceedings initiated during 2013-14 against other intermediaries(Table 3.42).
Table 3.42: Enquiry and Adjudication Proceedings against other Intermediaries during 2013-14
Intermediaries Adjudication Enquiry Warning/defi ciency/
advice
1 2 3 4
Registrar to an Issue & Share Transfer Agents
0 0 9
Merchant Bankers
1 0 3
Depository Participants
1 0 24
Credit Rating Agencies
0 0 0
Debenture Trustees
0 0 11
Total 2 0 47
C. Significant Enforcement of Regulations
There were three cases which came to notice of SEBI during the year 2013-14 where the intermediaries registered with SEBI indulged in unlawful activities like making false claims to investors or mobilising money for different schemes. Prompt action was taken against them by passing interim orders. Details of these cases are given below:
a. M/s. Lee Capital Services Private Ltd
SEBI received a large number of investor complaints against M/s. Lee Capital Service Private Limited, inter alia, pertaining to, collection of funds/money from public offering very high returns, running schemes which offered hefty commissions for bringing in new clients; misuse of SEBI Registration for unauthorized PMS and Gold Trading schemes; and carrying out fund based activities unrelated to the securities market etc.
Inquiry into the matter revealed that M/s. Lee Capital acted as un-registered portfolio manager, indulged in fund-based activities involving personal financial liability, in violation of rule 8(3)(f) of the Securities Contracts (Regulation) Rules, 1957 (“SCRR”) and made mis-representations by making fraudulent and deceitful claims.
In view of the foregoing and in order to protect the interest of investors and the integrity of securities market, an ad-interim ex-parte order under sections 11(1), 11(4), 11B and 11D of SEBI Act, 1992 was passed:
i. directing M/s. Lee Capital Services Private Limited to close, terminate, and wind up all its schemes and to refund the monies collected from the investors in its schemes along with income, profits or returns promised to them under its schemes or interest at the rate of

190
Annual Report 2013-14
10 percent per annum, whichever is higher, from the date of investment till the date of refund, within a period of three months from the date of this order and submit a winding up and repayment report to SEBI;
ii. restraining M/s. Lee Capital Services Private Limited and its directors Mr. Santosh Kumar K.L. and Mr. Kunjiraman Pillai from buying, selling or dealing in the securities markets, either directly or indirectly, in any manner whatsoever, till further directions:
iii. directing M/s. Lee Capital Services Private Limited and its directors Mr. Santosh Kumar K.L. and Mr. Kunjiraman Pillai
a) to cease and desist from unauthorized activities as noted above and not to solicit or undertake such activities or any other unregistered activity in the securities market, directly or indirectly, in any manner whatsoever;
b) to immediately withdraw and remove all advertisements, representations, literatures, brochures, materials, publications, documents, websites, etc. in relation to those schemes/activities or any unregistered activity in the securities markets.
b. M/s. MCX Biz Solutions and Mr Syed Sadaq
In the matter of M/s. MCX Biz Solutions (hereinafter referred to as “MBS”) SEBI noticed that the entity was soliciting and collecting money from public and was promising high returns. Therefore SEBI undertook preliminary inquiries into the matter and it was observed that MBS is maintaining a website wherein it
has claimed to be active in stock trading and commodities trading.
It was further observed that on its website MBS had displayed a sub-broker registration certificate showing it to have been issued by SEBI. The certificate was fake and MBS was observed to be not registered with SEBI as represented. Hence vide Order dated November 18, 2013, MBS and its sole proprietor Mr. Syed Sadaq were inter-alia restrained from accessing the securities markets and further prohibited from buying, selling or otherwise dealing in securities, directly or indirectly, or being associated with the securities market in any manner till further directions.
c. Mr. Sunil Kale and M/s. Trendline Trades Academy
In another matter of sub broker Sri Sunil Kale, SEBI noticed that M/s. Trendline Traders Academy, of which Mr. Sunil Kale is the founder/director, had issued advertisement in Sakal newspaper (a Marathi newspaper) dated April 28, 2013 claiming to double the money invested by an investor through it in a year’s time and also offered portfolio management services on its website without seeking the requisite registration under the SEBI Act and the Regulations. Hence vide Order dated November 18, 2013, Mr. Sunil Laxman Kale and M/s. Trendline Traders Academy were interalia restrained from accessing the securities market and further prohibited from buying, selling or otherwise dealing in securities, directly or indirectly, or being associated with the securities market in any manner.
After the issuance of the Order, Mr. Sunil Laxman Kale attended personal hearing in the matter and interalia submitted that the activities alleged in the Order happened due to mistake, non-understanding and ignorance of rules and regulations of SEBI and also

191
Part Three: Functions of SEBI in Respect of Ma� ers Specifi ed in Section 11 of SEBI Act, 1992
submitted that he had not done any activities in the nature of portfolio management services in the past and would not do so in future. Taking into account the submission of the sub-broker, the prohibitions and debarments regarding restraining Mr. Sunil Laxman Kale and M/s. Trendline Traders Academy from accessing the securities market etc. were discontinued vide Order dated December 31, 2013.
IV. Prosecution
A. Trends in Prosecution
a. Number of Prosecutions Launched
During 2013-14, 269 prosecution cases were launched against 652 persons/ entities as compared to 75 prosecutions launched against 150 persons/entities in 2012-13 (Table 3.43).
Table 3.43: Prosecutions Launched
Year No. of cases in which prosecution
has been launched
No. of persons/entities against
whom prosecution has been launched
1 2 3
Up to 2003-04 891 4,332
2004-05 86 432
2005-06 30 101
2006-07 23 152
2007-08 40 185
2008-09 29 114
2009-10 30 109
2010-11 17 67
2011-12 29 60
2012-13 75 150
2013-14 269 652
Total 1,519 6,354
As on March 31 2014, region-wise, the highest number of prosecutions were launched in Head Office/Western Region (906) followed by the Northern Region (347), Eastern Region (170) and Southern Region (96) (Table 3.44).
Table 3.44: Region-wise Data on Prosecution Cases as on March 31, 2014
Region Number of Cases
Percentage of Total
1 2 3
Head Offi ce/Western Region 906 59.7
Northern Region 347 22.8
Southern Region 96 6.3
Eastern Region 170 11.2
Total 1,519 100.0
b. Nature of Prosecution
Prosecutions are launched by SEBI under the SEBI Act, 1992, Companies Act, 1956, Depositories Act, 1996, SC(R) Act, 1956 and the Indian Penal Code. As on March 31, 2014, 1,519 cases were launched (Table 3.45).
Table 3.45: Nature of Prosecutions Launched as on March 31, 2014
Nature of Prosecution Launched Number of Cases
1 2
Securities and Exchange Board of India Act, 1992 (SEBI Act)
1,301
SEBI Act & Securities Contracts (Regulation) Act, 1956 (SCRA)
94
SEBI Act, SCRA & Companies Act 2
SEBI Act & Companies Act 3
SEBI Act & Indian Penal Code 5
Companies Act, 1956 70
Securities Contracts (Regulation) Act, 1956 7
Depositories Act, 1996 29
Indian Penal Code 8
Total 1,519
c. Disposal of Prosecution Cases Since the start of launch of prosecution against erring CIS entities, criminal prosecution cases have been launched by SEBI against CIS entities. As on March 31,
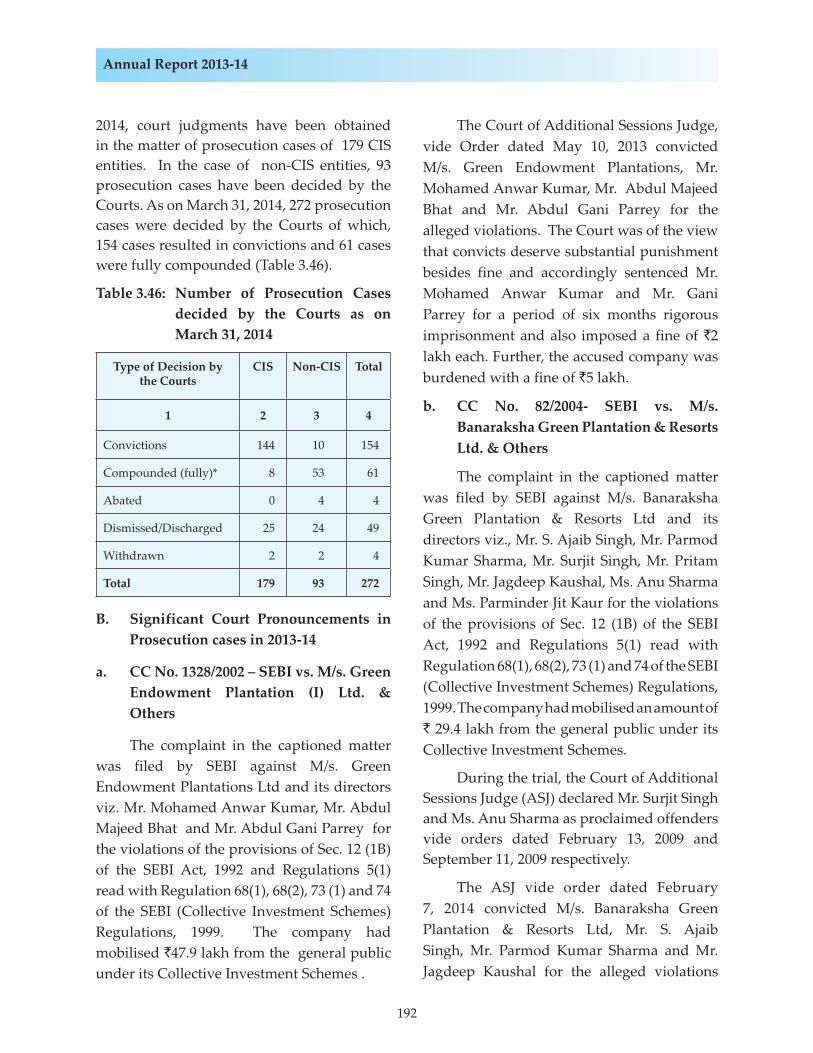
192
Annual Report 2013-14
2014, court judgments have been obtained in the matter of prosecution cases of 179 CIS entities. In the case of non-CIS entities, 93 prosecution cases have been decided by the Courts. As on March 31, 2014, 272 prosecution cases were decided by the Courts of which, 154 cases resulted in convictions and 61 cases were fully compounded (Table 3.46).
Table 3.46: Number of Prosecution Cases decided by the Courts as on March 31, 2014
Type of Decision by the Courts
CIS Non-CIS Total
1 2 3 4
Convictions 144 10 154
Compounded (fully)* 8 53 61
Abated 0 4 4
Dismissed/Discharged 25 24 49
Withdrawn 2 2 4
Total 179 93 272
B. Significant Court Pronouncements in Prosecution cases in 2013-14
a. CC No. 1328/2002 – SEBI vs. M/s. Green Endowment Plantation (I) Ltd. & Others
The complaint in the captioned matter was filed by SEBI against M/s. Green Endowment Plantations Ltd and its directors viz. Mr. Mohamed Anwar Kumar, Mr. Abdul Majeed Bhat and Mr. Abdul Gani Parrey for the violations of the provisions of Sec. 12 (1B) of the SEBI Act, 1992 and Regulations 5(1) read with Regulation 68(1), 68(2), 73 (1) and 74 of the SEBI (Collective Investment Schemes) Regulations, 1999. The company had mobilised `47.9 lakh from the general public under its Collective Investment Schemes .
The Court of Additional Sessions Judge, vide Order dated May 10, 2013 convicted M/s. Green Endowment Plantations, Mr. Mohamed Anwar Kumar, Mr. Abdul Majeed Bhat and Mr. Abdul Gani Parrey for the alleged violations. The Court was of the view that convicts deserve substantial punishment besides fine and accordingly sentenced Mr. Mohamed Anwar Kumar and Mr. Gani Parrey for a period of six months rigorous imprisonment and also imposed a fine of `2 lakh each. Further, the accused company was burdened with a fine of `5 lakh.
b. CC No. 82/2004- SEBI vs. M/s. Banaraksha Green Plantation & Resorts Ltd. & Others
The complaint in the captioned matter was filed by SEBI against M/s. Banaraksha Green Plantation & Resorts Ltd and its directors viz., Mr. S. Ajaib Singh, Mr. Parmod Kumar Sharma, Mr. Surjit Singh, Mr. Pritam Singh, Mr. Jagdeep Kaushal, Ms. Anu Sharma and Ms. Parminder Jit Kaur for the violations of the provisions of Sec. 12 (1B) of the SEBI Act, 1992 and Regulations 5(1) read with Regulation 68(1), 68(2), 73 (1) and 74 of the SEBI (Collective Investment Schemes) Regulations, 1999. The company had mobilised an amount of ` 29.4 lakh from the general public under its Collective Investment Schemes.
During the trial, the Court of Additional Sessions Judge (ASJ) declared Mr. Surjit Singh and Ms. Anu Sharma as proclaimed offenders vide orders dated February 13, 2009 and September 11, 2009 respectively.
The ASJ vide order dated February 7, 2014 convicted M/s. Banaraksha Green Plantation & Resorts Ltd, Mr. S. Ajaib Singh, Mr. Parmod Kumar Sharma and Mr. Jagdeep Kaushal for the alleged violations
193
Part Three: Functions of SEBI in Respect of Ma� ers Specifi ed in Section 11 of SEBI Act, 1992
and sentenced them to six months rigorous imprisonment and also imposed a fine of `3 lakh each.
Further, the accused company was burdened with a fine of `10 lakh. However, the ASJ, acquitted Mr. Pritam Singh and Ms. Parminder Jit Kaur on the ground that the complainant failed to bring home their guilt beyond the shadow of all reasonable doubts.
c. CC No. 113/2005 – SEBI vs. M/s. Burman Plantation Ltd. & Others
The complaint in the captioned matter was filed by SEBI against M/s. Burman Plantation Ltd and its directors viz., Mr. Sanjay Burman , Mr. Ravi Arora, Mr. U.C. Burman, Ms. Uma Charan Burman, Mr. Ramesh Chand, Mr. Anand Ballabh Agarwal and Mr. Mahesh Chandra Agarwal for the violations of the provisions of Section 12 (1B) of the SEBI Act, 1992 and Regulations 5(1) read with Regulation 68(1), 68(2), 73 (1) and 74 of the SEBI (Collective Investment Schemes) Regulations, 1999. The company had mobilised an amount of `21.7 lakh from the general public under its Collective Investment Schemes.
During the trial, the Court of Additional Sessions Judge (ASJ) declared Mr. Sanjay Burman and Ramesh Chand as proclaimed offenders vide Orders dated July 26, 2007 and February 22, 2013 respectively. The proceedings against Mr. U.C. Burman and Ms. Uma Charan Burman were abated on account of their death. Further, the proceedings on the accused company was also dropped on account of its winding up vide order dated January 13, 2012 passed by Hon’ble High Court of Allahabad.
The Court of ASJ, vide Order dated July 29, 2013 convicted Mr. Ravi Arora for the alleged violations and sentenced him to
six months rigorous imprisonment and also imposed a fine of `3 lakh. However, the Court acquitted Mr. Anand Ballabh Agarwal and Mr. Mahesh Chandra Agarwal as there was no sufficient evidence on record to show that they were holding any position in the company.
d. CC No. 650/2001 – SEBI vs. M/s. Agrogold Plantations & Resorts Ltd. and Others
The complaint in the captioned matter was filed by SEBI against M/s. Agrogold Plantations Ltd and its directors viz. Mr. Asdev Singh Sodhi, Mr. Sukhjot Sodhi and Mr. Kamlajeet for the violations of the provisions of Sec. 12 (1B) of the SEBI Act, 1992 and Regulations 5(1) read with Regulation 68(1), 68(2), 73 (1) and 74 of the SEBI (Collective Investment Schemes) Regulations, 1999. The company had mobilised an amount of ̀ 7 crore from the general public under its Collective Investment Schemes.
During the trial, the court vide Order dated November 15, 2003 dropped the proceedings against Mr. Asdev Singh Sodhi as there was no sufficient evidence to prove the role in the accused company.
The Court of Additional Chief Metropolitan Magistrate, vide Order dated January 04, 2014 convicted M/s. Agrogold Plantations Ltd, Mr. Sukhjot Sodhi and Mr. Kamlajeet for the alleged violations and sentenced Mr. Sukhjot Sodhi to six months simple imprisonment and Mr. Kamlajeet to three months simple imprisonment and also imposed a fine of ` 2.5 lakh each. Since, the name of the accused company was struck off from the records of ROC after following the due process, no fine was imposed on the company.
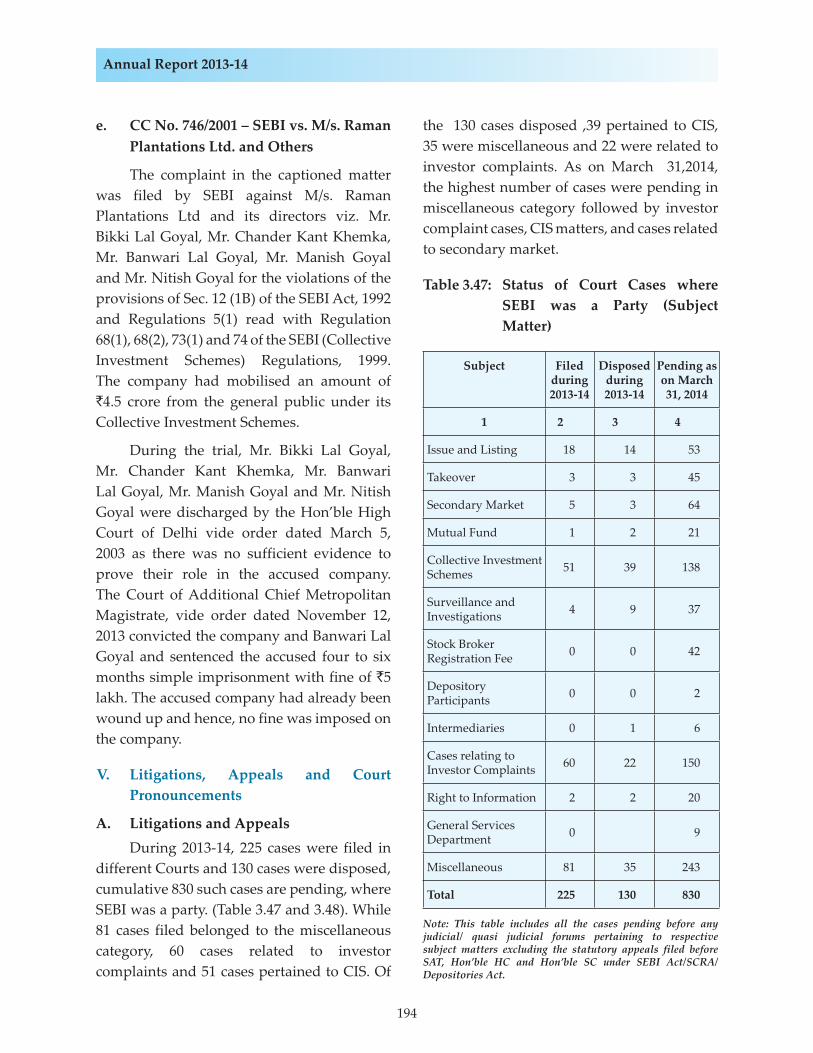
194
Annual Report 2013-14
e. CC No. 746/2001 – SEBI vs. M/s. Raman Plantations Ltd. and Others
The complaint in the captioned matter was filed by SEBI against M/s. Raman Plantations Ltd and its directors viz. Mr. Bikki Lal Goyal, Mr. Chander Kant Khemka, Mr. Banwari Lal Goyal, Mr. Manish Goyal and Mr. Nitish Goyal for the violations of the provisions of Sec. 12 (1B) of the SEBI Act, 1992 and Regulations 5(1) read with Regulation 68(1), 68(2), 73(1) and 74 of the SEBI (Collective Investment Schemes) Regulations, 1999. The company had mobilised an amount of `4.5 crore from the general public under its Collective Investment Schemes.
During the trial, Mr. Bikki Lal Goyal, Mr. Chander Kant Khemka, Mr. Banwari Lal Goyal, Mr. Manish Goyal and Mr. Nitish Goyal were discharged by the Hon’ble High Court of Delhi vide order dated March 5, 2003 as there was no sufficient evidence to prove their role in the accused company. The Court of Additional Chief Metropolitan Magistrate, vide order dated November 12, 2013 convicted the company and Banwari Lal Goyal and sentenced the accused four to six months simple imprisonment with fine of `5 lakh. The accused company had already been wound up and hence, no fine was imposed on the company.
V. Litigations, Appeals and Court Pronouncements
A. Litigations and Appeals During 2013-14, 225 cases were filed in different Courts and 130 cases were disposed, cumulative 830 such cases are pending, where SEBI was a party. (Table 3.47 and 3.48). While 81 cases filed belonged to the miscellaneous category, 60 cases related to investor complaints and 51 cases pertained to CIS. Of
the 130 cases disposed ,39 pertained to CIS, 35 were miscellaneous and 22 were related to investor complaints. As on March 31,2014, the highest number of cases were pending in miscellaneous category followed by investor complaint cases, CIS matters, and cases related to secondary market.
Table 3.47: Status of Court Cases where SEBI was a Party (Subject Matter)
Subject Filed during 2013-14
Disposed during 2013-14
Pending as on March 31, 2014
1 2 3 4
Issue and Listing 18 14 53
Takeover 3 3 45
Secondary Market 5 3 64
Mutual Fund 1 2 21
Collective Investment Schemes 51 39 138
Surveillance and Investigations 4 9 37
Stock Broker Registration Fee 0 0 42
Depository Participants 0 0 2
Intermediaries 0 1 6
Cases relating to Investor Complaints 60 22 150
Right to Information 2 2 20
General Services Department 0 9
Miscellaneous 81 35 243
Total 225 130 830
Note: This table includes all the cases pending before any judicial/ quasi judicial forums pertaining to respective subject matters excluding the statutory appeals filed before SAT, Hon’ble HC and Hon’ble SC under SEBI Act/SCRA/ Depositories Act.
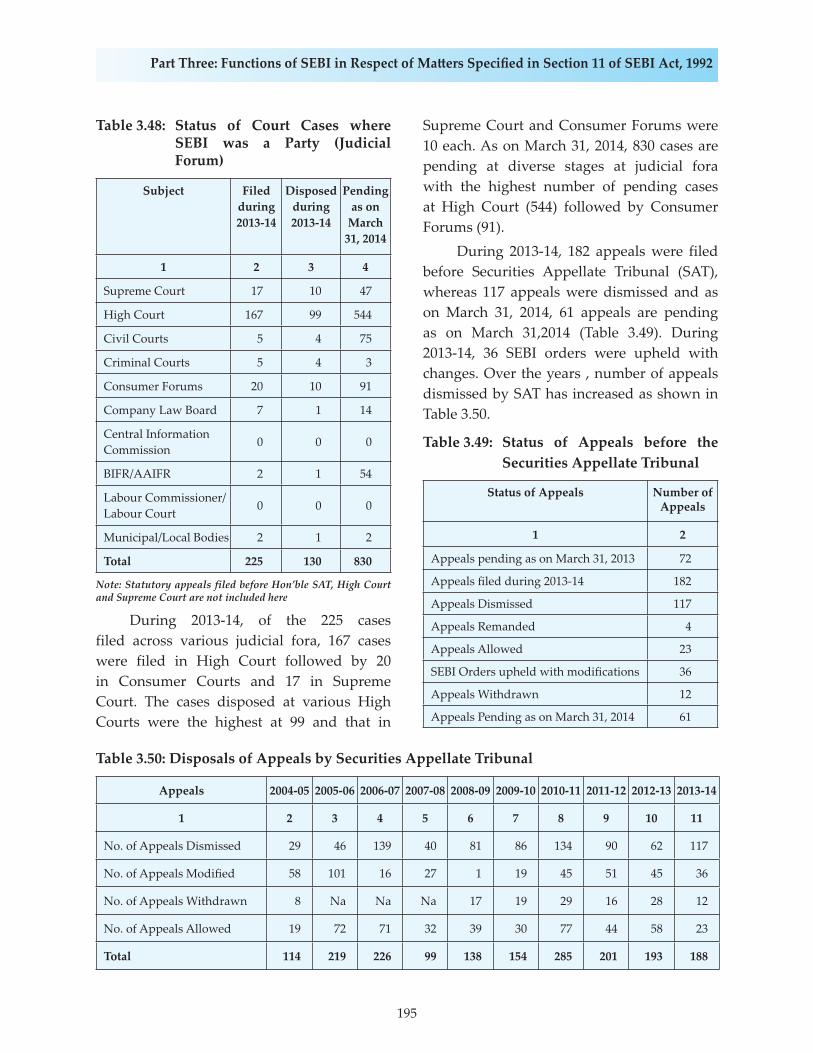
195
Part Three: Functions of SEBI in Respect of Ma� ers Specifi ed in Section 11 of SEBI Act, 1992
Table 3.48: Status of Court Cases where SEBI was a Party (Judicial Forum)
Subject Filed during 2013-14
Disposed during 2013-14
Pending as on
March 31, 2014
1 2 3 4
Supreme Court 17 10 47
High Court 167 99 544
Civil Courts 5 4 75
Criminal Courts 5 4 3
Consumer Forums 20 10 91
Company Law Board 7 1 14
Central Information Commission 0 0 0
BIFR/AAIFR 2 1 54
Labour Commissioner/Labour Court 0 0 0
Municipal/Local Bodies 2 1 2
Total 225 130 830
Note: Statutory appeals filed before Hon’ble SAT, High Court and Supreme Court are not included here
During 2013-14, of the 225 cases filed across various judicial fora, 167 cases were filed in High Court followed by 20 in Consumer Courts and 17 in Supreme Court. The cases disposed at various High Courts were the highest at 99 and that in
Supreme Court and Consumer Forums were 10 each. As on March 31, 2014, 830 cases are pending at diverse stages at judicial fora with the highest number of pending cases at High Court (544) followed by Consumer Forums (91). During 2013-14, 182 appeals were filed before Securities Appellate Tribunal (SAT), whereas 117 appeals were dismissed and as on March 31, 2014, 61 appeals are pending as on March 31,2014 (Table 3.49). During 2013-14, 36 SEBI orders were upheld with changes. Over the years , number of appeals dismissed by SAT has increased as shown in Table 3.50.
Table 3.49: Status of Appeals before the Securities Appellate Tribunal
Status of Appeals Number of Appeals
1 2
Appeals pending as on March 31, 2013 72
Appeals fi led during 2013-14 182
Appeals Dismissed 117
Appeals Remanded 4
Appeals Allowed 23
SEBI Orders upheld with modifi cations 36
Appeals Withdrawn 12
Appeals Pending as on March 31, 2014 61
Table 3.50: Disposals of Appeals by Securities Appellate Tribunal
Appeals 2004-05 2005-06 2006-07 2007-08 2008-09 2009-10 2010-11 2011-12 2012-13 2013-14
1 2 3 4 5 6 7 8 9 10 11
No. of Appeals Dismissed 29 46 139 40 81 86 134 90 62 117
No. of Appeals Modifi ed 58 101 16 27 1 19 45 51 45 36
No. of Appeals Withdrawn 8 Na Na Na 17 19 29 16 28 12
No. of Appeals Allowed 19 72 71 32 39 30 77 44 58 23
Total 114 219 226 99 138 154 285 201 193 188
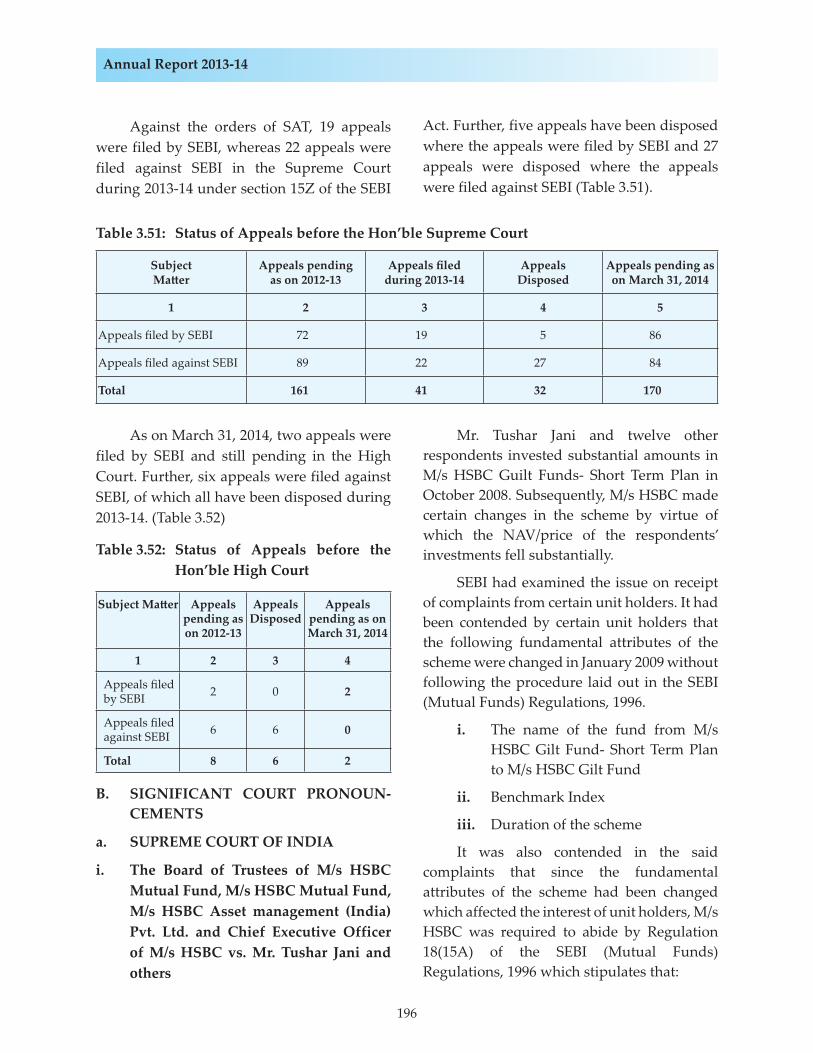
196
Annual Report 2013-14
Against the orders of SAT, 19 appeals were filed by SEBI, whereas 22 appeals were filed against SEBI in the Supreme Court during 2013-14 under section 15Z of the SEBI
Act. Further, five appeals have been disposed where the appeals were filed by SEBI and 27 appeals were disposed where the appeals were filed against SEBI (Table 3.51).
Table 3.51: Status of Appeals before the Hon’ble Supreme Court
Subject Ma� er
Appeals pending as on 2012-13
Appeals fi led during 2013-14
Appeals Disposed
Appeals pending as on March 31, 2014
1 2 3 4 5
Appeals fi led by SEBI 72 19 5 86
Appeals fi led against SEBI 89 22 27 84
Total 161 41 32 170
As on March 31, 2014, two appeals were filed by SEBI and still pending in the High Court. Further, six appeals were filed against SEBI, of which all have been disposed during 2013-14. (Table 3.52)
Table 3.52: Status of Appeals before the Hon’ble High Court
Subject Ma� er Appeals pending as on 2012-13
Appeals Disposed
Appeals pending as on March 31, 2014
1 2 3 4
Appeals fi led by SEBI 2 0 2
Appeals fi led against SEBI 6 6 0
Total 8 6 2
B. SIGNIFICANT COURT PRONOUN-CEMENTS
a. SUPREME COURT OF INDIA
i. The Board of Trustees of M/s HSBC Mutual Fund, M/s HSBC Mutual Fund, M/s HSBC Asset management (India) Pvt. Ltd. and Chief Executive Officer of M/s HSBC vs. Mr. Tushar Jani and others
Mr. Tushar Jani and twelve other respondents invested substantial amounts in M/s HSBC Guilt Funds- Short Term Plan in October 2008. Subsequently, M/s HSBC made certain changes in the scheme by virtue of which the NAV/price of the respondents’ investments fell substantially.
SEBI had examined the issue on receipt of complaints from certain unit holders. It had been contended by certain unit holders that the following fundamental attributes of the scheme were changed in January 2009 without following the procedure laid out in the SEBI (Mutual Funds) Regulations, 1996.
i. The name of the fund from M/s HSBC Gilt Fund- Short Term Plan to M/s HSBC Gilt Fund
ii. Benchmark Index
iii. Duration of the scheme
It was also contended in the said complaints that since the fundamental attributes of the scheme had been changed which affected the interest of unit holders, M/s HSBC was required to abide by Regulation 18(15A) of the SEBI (Mutual Funds) Regulations, 1996 which stipulates that:
197
Part Three: Functions of SEBI in Respect of Ma� ers Specifi ed in Section 11 of SEBI Act, 1992
• a written communication about the proposed change is sent to each unit holder and advertisement regarding the same is issued and
• unit holders are provided with an option to exit the scheme at the prevailing NAV.
However, the said requirements were not complied with by M/s HSBC.
Vide Order dated April 23, 2010, the Whole Time Member of SEBI held that M/s HSBC was technically correct in stating that the changes made by them did not amount to changing the fundamental attributes of the investment and therefore there was no legal compulsion to adhere to the procedure and manner prescribed under Regulation 18(15A) of the SEBI (Mutual Funds) Regulations, 1996 but opined that the Fund and its Trustees had violated Regulation 18 (19) (22) and 15(16) of the SEBI (Mutual Funds) Regulations, 1996, the AMC had violated Regulations 25(1) and 25(16) of the SEBI (Mutual Funds) Regulations, 1996 and the CEO had violated Regulation 25(6A) of the SEBI (Mutual Funds) Regulations, 1996, all of which lay down the code of conduct to be followed by them respectively. For the said violations, a warning was issued to these entities.
Challenging this order of the WTM, Appeal No. 111 of 2010 (by respondents, Mr. Subramanian R. Venkat and Ms. Anuradha Venkatasubramanian) was filed before the Hon’ble SAT. Vide order dated May 3, 2011, the SAT allowed the appeal holding that the changes brought about in the scheme altered the fundamental attributes thereof affecting the interest of the unit holders. However, the SAT observed that while NAV of the scheme had substantially increased, all the unit holders would not like to exit at the then prevailing NAV which was much less. In view of the same, SAT did not give a direction to HSBC to
comply with the procedure laid down under Regulation 18(15A) of the SEBI (Mutual Funds) Regulations, 1996 with respect to all the investors, but held that an exit route should be provided to the two appellant investors in accordance with Regulation 18(15A) of the SEBI (Mutual Funds) Regulations, 1996.
Following this order by the Hon’ble SAT, similarly placed entities, also preferred an appeal against the said order of the Whole Time Member and the Hon’ble SAT vide its order dated July 5, 2012 opined that the issue under consideration was squarely covered by the order of the Tribunal in Appeal No.11 of 2010 and thus directed M/s HSBC to comply with the procedure laid down Regulation 18(15A) of the SEBI (Mutual Funds) Regulations, 1996 and provide the appellant investors with an exit route.
The orders of the SAT dated May 3, 2011 and July 5, 2012 were under challenge before the Supreme Court of India by M/s HSBC. SEBI was impleaded in the same as respondent.
Vide order dated January 15, 2014 the Hon’ble Supreme Court held that it found no merit in the appeals and dismissed the same. This order of the Hon’ble Supreme Court implies that the orders of the Hon’ble SAT dated May 3, 2011 and July 5, 2012 will now be in force. However, the Hon’ble SAT has specifically stated that their order will be applicable to only those unit holders who have agitated their case before the judicial forum. Therefore, the appellants would now be required to provide an exit route to all the thirteen respondents, at the then prevailing NAV in accordance with Regulation 18(15A) of the SEBI (Mutual Funds) Regulations, 1996.
ii. Mr. N. Narayanan (Appellant) vs Adjudicating Officer, SEBI (Respondent)
SEBI conducted investigation in the
198
Annual Report 2013-14
quarterly financial results and the annual financial results of the company for the year 2007-08. It was observed that the company’s quarterly reports to the stock exchanges contained inflated figures of the company’s revenue profits, security deposits and receivables. It was observed that there was price rise in scrip consequent to the publication of the inflated results and promoters of the company pledged their shares to raise higher quantum of funds. It was alleged that the company along with its directors committed irregularities in its books of accounts and showed inflated profits and revenues in the financial statements and lured the general public to invest in the shares of the company based on such false financial statements. Hence, it was alleged that Mr. N. Narayanan and Mr. V Natarajan violated Section 12A of SEBI Act, 1992 and Regulation 3(b), 3(c), 3(d), 4(1), 4(2)(a), 4(2) (e), 4(2)(f), 4(2)(k) and 4(2)(r) of SEBI (Prohibition of Fraudulent and Unfair Trade Practices) Regulation, 2003.
An Adjudicating Officer was appointed to inquire into and adjudge the above mentioned violations. After conducting inquiry Adjudicating Officer found that Mr. N. Narayanan and Mr. V Natarajan have violated the provisions as alleged above and imposed a monetary penalty of ` 50 lakh.
Further vide order dated April 18, 2011, WTM, SEBI found that Mr. N. Narayanan and Mr. V Natarajan have violated the provision as alleged above and restrained them from buying, selling or dealing in securities in any manner whatsoever or accessing the securities market, directly or indirectly and from being a director of any listed company for a period of two years and three years respectively from the date of this order.
Both the orders were challenged before the Hon’ble SAT. Vide order dated October 5, 2012, the Hon’ble SAT upheld both the
orders. Aggrieved by the said order of the Hon’ble SAT, Mr. N. Narayanan and Mr. V Natarajan filed an appeal before the Hon’ble Supreme Court. The appeal was dismissed by the Hon’ble Supreme Court vide order dated April 26, 2013 inter alia holding as under:
“We notice in this case that the Directors of the company had clearly violated provisions of Section 12A of SEBI Act read with Regulations 3 and 4 of 2003 Regulations. Companies whose securities are traded on a public market, disclosure of information about the company is crucial for the accurate pricing of the companies’ securities and also for the efficient operation of the market.
The Directors of the company or the person in charge directly or indirectly use or employ, in connection with the issue, purchase or sale of any securities listed in stock exchange, any manipulative or deceptive device or contrivance in contravention of SEBI Act or the Regulations made thereunder have necessarily to be dealt with in accordance with the provisions of the Act and the Regulations which is absolutely necessary for the investor’s protection and to avoid market abuse.
Responsibility is cast on the Directors to prepare the annual records and reports and those accounts should reflect ‘a true and fair view’. The over-riding obligation of the Directors is to approve the accounts only if they are satisfied that they give true and fair view of the profits or loss for the relevant period and the correct financial position of the company.
Above being the factual and legal position, we are of the view that the SEBI has rightly restrained the appellant for a period of two years from the date of that order from buying, selling or dealing with any securities, in any manner, or accessing the securities market, directly or indirectly and from being Director of any listed company and that the adjudicating officer has rightly imposed a penalty of `50 lakh under Section 15HA of SEBI Act, 1992.”

199
Part Three: Functions of SEBI in Respect of Ma� ers Specifi ed in Section 11 of SEBI Act, 1992
iii. SIRECL and SHICL vs SEBI M/s Sahara India Real Estate Corporation Ltd., (SIRECL) and M/s Sahara Housing Investment Corporation Ltd., (SHICL) had raised amounts aggregating to ̀ 19,400.9 crore and `6,380.5 crore respectively from various subscribers through Red Herring Prospectus (RHP) dated March 03, 2008 and October 16, 2009. SEBI vide Order dated June 23, 2011 held that SIRECL and SHICL had violated various provisions of the Companies Act, the requirements of SEBI (DIP) Guidelines, 1992 and the provisions of the SEBI (ICDR) Regulations, 2009 and inter alia directed both the companies and their promoter, directors to forthwith refund the money collected by them through the RHPs with 15 percent interest from the date of receipt of money till the date of payment. SHICL, SIRECL, their promoter/directors appealed to the Hon’ble Securities Appellate Tribunal (SAT), which dismissed their appeals and upheld the order of SEBI. The Saharas approached the Hon’ble Supreme Court impugning the orders of SAT. The Hon’ble Supreme Court vide its Order dated August 31, 2012, upheld the order of SEBI and directed inter alia Saharas to refund the amounts raised, along with interest at the rate of 15 percent per annum to SEBI within three months; to furnish all documents in their custody, particularly the application forms submitted by the subscribers, the approval and allotment of bonds and all other documents to SEBI within a period of 10 days, so as to enable SEBI to ascertain the genuineness of the subscribers as well as the amounts deposited. The Court also appointed Justice (Retd.) Mr. B N Agarwal to oversee the implementation of its order. SEBI constituted a Cell (Special Enforcement Cell) to specifically handle the work relating to the verification process
of documents submitted in terms of the directions of the Hon’ble Supreme Court, and also handle the matters connected therewith.
The directions of the Supreme Court were not complied with by the Saharas, and instead the Saharas approached the SAT for modification of the order dated August 31, 2012 in view of alleged repayments to investors being carried out by it. The SAT refused to modify the directions contained in the order of the Supreme Court dated August 31, 2012. The Saharas then filed an appeal in the Supreme Court against the order of SAT. The Full Bench headed by the Chief Justice of India rejected the claim of alleged repayments to investors, vide order dated December 5, 2012, and granted 15 days time to the Saharas to furnish documents pertaining to refunds made and ordered them to refund an amount of `5,120 crore immediately and the balance amount in two installments not later than the 1st week of February 2013.
Pursuant to the said Order of the Hon’ble Supreme Court, Saharas refunded an amount of `5,120 crore on December 5, 2012 to SEBI. Saharas also sent 127 trucks stated to contain about 3 crore application forms and 2.2 crore redemption vouchers / statutory forms to SEBI in December 2012, which were found to be incomplete and hopelessly mixed up.
The Saharas did not pay the amounts as required in terms of Supreme Court order dated August 31, 2012 as modified by the Supreme Court order dated December 5, 2012. Consequently, SEBI passed Orders dated February 13, 2013 attaching the moveable and immoveable properties including bank accounts, of SHICL and SIRECL, their promoter and directors, and also filed contempt petitions before the Hon’ble Supreme Court. The Saharas moved applications indicating that the monies had been repaid directly to the investors and that therefore they cannot be asked to pay twice. These applications were
200
Annual Report 2013-14
rejected on February 25, 2013 by a Full Bench headed by the Chief Justice of India.
Pursuant to an application filed by SEBI, the Hon’ble Supreme Court, vide its Order dated May 8, 2013, permitted SEBI to make refunds to those investors who have filed or would be filing their complaints with SEBI, except investors holding multiple accounts, after ascertaining their genuineness. Accordingly, SEBI issued a Press Release on May 28, 2013 stating initiation of the process of refunds to those genuine investors and have devised a methodology to process claims and make refunds to genuine investors.
The Saharas challenged SEBI orders dated February 13, 2013 before SAT indicating that the assets had been sold for alleged repayments and details of bank accounts would be furnished as and when directed to do so. These SAT appeals stand transferred to the Hon’ble Supreme Court vide its order dated July 17, 2013.
In the contempt petitions, pending before the Supreme Court, the Saharas once again claimed repayment to the investors approximately ` 30,000 crore and refused to comply with the orders of the Supreme Court.
The Supreme Court directed the Saharas to submit title deeds of properties worth `20,000 crore to SEBI. SEBI examined the deeds furnished by the Saharas and found that while the properties were overvalued and incomplete title was submitted in respect of the properties, in some cases title was defective for various reasons viz. land in No-Development Zone, under litigation, etc. Vide order dated November 28, 2013 the Hon’ble Supreme Court was pleased to hold that its direction to submit title deeds had been violated and directed that the Sahara Group of companies shall not part with moveable/immoveable assets and the promoter/directors
of SHICL/SIRECL shall not leave the country without the permission of the Court. On the insistence of the counsels of the Saharas, the Division Bench of the Hon’ble Supreme Court heard the defense of repayment alleged to have been made by the Saharas, (earlier rejected by the Full bench headed by the CJI) and vide order dated January 9, 2014 directed the Saharas to furnish documentary evidence of the source of money alleged to have been used for repayment. The Saharas submitted a second set of property documents as security and also submitted various documents in furtherance of the direction contained in the order dated January 9, 2014. SEBI examined the details and pointed out several contradictions, defects in the reply of the Saharas, in particular, that Saharas had been constantly changing their stands and had now claimed that the entire alleged repayment to investors had been carried out in cash and that no bank account details were furnished in support of the same. SEBI also pointed out various defects in the second set of title deeds submitted by the Saharas. In view of the same, the Division bench of the Supreme Court directed the promoter/directors to be personally present before it on February 26, 2014. The promoter i.e. Subrata Roy failed to appear on the said date and the Hon’ble Supreme Court issued a bench warrant for his arrest and production on March 4, 2014. When produced by the Police authorities, before the Hon’ble Supreme Court, on March 4, 2014, the Hon’ble Supreme Court ordered judicial detention of Mr. Subrata Roy and two other male directors and granted liberty to the Saharas, to submit a proposal in respect of the monies due under the order dated August 31, 2012. Mr. Subrata Roy filed Writ Petition No. 57/2014 against the aforesaid order of detention. SEBI has so far received 3,612 applications involving 13,948 deposit accounts. Out

201
Part Three: Functions of SEBI in Respect of Ma� ers Specifi ed in Section 11 of SEBI Act, 1992
of the said 3,612 applications, SEBI has made refunds in respect of 445 applications involving equal number of deposit accounts for an aggregate amount of `1,25,21,241 including interest of `43,83,241. Out of the remaining 3,167 applications, in respect of 424 applications involving 1,683 deposit accounts, certain deficiencies were observed in the applications/supporting documents submitted by the applicants which were brought to the notices of the applicants for their clarification/rectification, and replies are awaited from them. SEBI is unable to process 1,260 applications involving 7,159 deposit accounts as these represent multiple investment category which issue is pending before the Hon’ble Supreme Court, and 92 cases involving 92 deposit accounts which are not meeting the extant refund methodology adopted by SEBI. 1,776 applications involving 4,395 deposit accounts could not be processed as these applications fall under “mismatch category” i.e., either the investment details as furnished by the applicant are not matching with those submitted by Saharas, or the investments are already claimed to have been refunded by Saharas or the investment details are not found in the information submitted by Saharas.
b. HIGH COURT
i. Mr. Brijinder Makkar vs SEBI (CRL A. No. 330 of 2010), Mr. S.P. Kalia vs SEBI (CRL. A. No. 331 of 2010), Mr. Manoj Kapur vs SEBI (CRL. A. No. 334 of 2010) before Hon’ble High Court of Delhi- Date of Decision- January 22, 2014.
SEBI had filed criminal complaint under section 24 (1) r/w 27 of SEBI Act, against M/s Asian Plantation Ltd for the violation of provision of SEBI (CIS) Regulations, 1999. The trial court after hearing the counsel for the parties and appreciating the evidence was pleased to convict and sentenced the accused. Appellants preferred appeals against order
dated February 15, 2010 and order dated February 23, 2010 convicting the appellants u/s. 24 and 27 of the SEBI Act and sentenced them to pay fine of ̀ 5 lakh each and to undergo rigorous imprisonment for six months each.
Appellants submitted that principal amount has been paid to all the investors of Collective Investment Schemes, therefore, the sentence and fine awarded to them should be reduced. Hon’ble High Court dismissed the appeal interalia noting that since no material in regard to payment of principal amount to investor has been produced either before SEBI or before the trial court despite specific opportunity given for this purpose, there is no good ground for reducing either the substantive sentence awarded to the appellants or to reduce the fine imposed upon them.
ii. Mr. Shailender Kaushik vs SEBI, (CRL A. No. 329 of 2010), Sudha Mittal vs SEBI, (CRL A No 334 of 2010) before Hon’ble High Court of Delhi- Date of Decision- January 22, 2014
SEBI had filed criminal complaint under section 24 (1) r/w 27 of SEBI Act, 1992 against M/s Asian Plantation Ltd for the violation of provision of SEBI (CIS) Regulations, 1999. The trial court after hearing the counsel for the parties and appreciating the evidence was pleased to convict and sentenced the accused.
Appellant preferred appeal against order dated February 15, 2010 and order dated February 23, 2010 convicting the appellant u/s. 24 and 27 of the SEBI Act, 1992 and sentenced him to pay fine of `5 lakh and to undergo rigorous imprisonment for six months. Hon’ble High Court vide its judgment dated January 22, 2014 allowed the appeal and acquitted the appellant on the ground that the appellant was merely subscriber to the memorandum and articles of association and cannot be held liable as person in charge

202
Annual Report 2013-14
and responsible for the conduct of affairs of the accused company.
iii. M/s Glitter Gold Plantation Ltd. and Others Vs. State (NCT of Delhi) (Crl. A. No. 567 of 2010) before Hon’ble High Court of Delhi- Date of Decision- February 24, 2014
SEBI had filed criminal complaint under section 24 (1) r/w 27 of SEBI Act, 1992 against M/s Glitter Gold Plantation Ltd and its directors for the violation of provision of SEBI (CIS) Regulations, 1999. The trial court after hearing the counsel for the parties and appreciating the evidence was pleased to convict and sentenced the accused. Appellants preferred appeal against judgment dated March 30, 2010 and order dated April 9, 2010 inter-alia convicting the company and its directors, Mr. Pankaj Jain, Mr. Deepak Jain, Mr. Sachin Gupta and Mr. Yashwant Jain and sentencing them to undergo rigorous imprisonment for three months each and to pay fine of `1 lakh each or to undergo simple imprisonment for three months each in default. Further, the trial court also found Ms. Manjul Jain and Ms. Arti Jain guilt of the violation alleged and sentenced them with a fine of `50,000 each or to undergo simple imprisonment for three months each in default.
Hon’ble High Court dismissed the appeal observing that both Mr. Pankaj Jain and Mr. Deepak Jain are the whole time directors of the appellant company M/s Glitter Gold Plantation Ltd. Both have been corresponding with SEBI with respect to the CIS of the company. Additional information to SEBI with respect to the CIS of the company, including the balance sheet, balance sheet certificate and statement of deployment of funds submitted by the appellant , Mr. Pankaj Jain, vide letter was received by SEBI on April 29,1998. The balance sheet of the company was signed by its
Managing Director, Mr. S.K. Jain as well as the appellant, Mr. Pankaj Jain, who is also son of the then Managing Director Mr. S.K. Jain. The compliance certificate submitted to SEBI was also signed by him on behalf of the company. The letter received by SEBI on January 9, 2001 submitted on behalf of company was signed by the appellant, Mr. Deepak Jain. He was also son of the Managing Director, Mr. S.K. Jain. The copy of Form-32 produced by the appellant showed that Mr. Deepak Jain became the Director of the company at the time of its incorporation. Thus, both of them were actively involved in the business of the company and were also associated with the Collective Investment Schemes under which the money was collected by the company from various investors. Thus, Hon’ble High Court dismissed the appeals
iv. Mr. Sachin Gupta vs SEBI (CRL. A. No. 563 of 2010 and Mr. Yashwant Jain vs SEBI (CRL A No 573 of 2010) before Hon’ble High Court of Delhi- Date of Decision- February 24, 2014
SEBI had filed criminal complaint under section 24 (1) r/w 27 of SEBI Act, 1992 against M/s Glitter Gold Plantation Ltd and its directors for the violation of provision of SEBI (CIS) Regulations, 1999. The trial court after hearing the counsel for the parties and appreciating the evidence was pleased to convict and sentenced the accused. Appellants preferred appeal against judgment dated March 30, 2010 and order dated April 9, 2010 inter-alia convicting the company and its directors, Mr. Pankaj Jain, Mr. Deepak Jain, Mr. Sachin Gupta and Mr. Yashwant Jain and sentencing them to undergo rigorous imprisonment for three months each and to pay fine of `1 lakh each or to undergo simple imprisonment for three months each in default. Further, the trial court also found Ms. Manjul Jain and Ms. Arti Jain guilt of the violation alleged and sentenced
203
Part Three: Functions of SEBI in Respect of Ma� ers Specifi ed in Section 11 of SEBI Act, 1992
them with a fine of `50,000 each or to undergo simple imprisonment for three months each in default. The appeals preferred against the order of conviction and sentences were allowed vide order dated February 24, 2014 on the ground that there is no sufficient evidence to show that Mr. Sachin Gupta and Mr. Yashwant Jain were directors and person in charge and responsible to the accused company for the conduct of its business, hence, acquitted by the Hon’ble High Court. v. Mr. Ajay Vohra vs SEBI (CRL. A. No. 474
of 2010); Mr. Major P.C. Thakur vs SEBI (CRL. A. No. 464 of 2010); Mr. Rajan Rai vs SEBI (CRL.A. No. 473 of 2010); Ms. Sunita Bhagat vs SEBI (CRL A. No. 442 of 2010)- Date of Decision- January 29,2014
SEBI had filed criminal complaint under section 24 (1) r/w 27 of SEBI Act, 1992 against M/s Accord Plantation Ltd and its directors for the violation of provision of SEBI (CIS) Regulations, 1999. The trial court after hearing the counsel for the parties and appreciating the evidence was pleased to convict and sentenced the accused. The appellants preferred appeal against judgment and order on sentence dated March 25, 2010 and March 26, 2010 respectively sentencing the appellants to undergo rigorous imprisonment for six months each, and to pay fine of `10 lakh each or to undergo simple imprisonment for three months each in default. The appeals preferred by the appellants/ accused were dismissed by the Hon’ble High Court vide its judgment dated January 29, 2014, wherein the Hon’ble High Court have found that there is sufficient evidence on record to prove that these appellants were directors and liable as person in charge and responsible for the conduct of affairs of the accused company.
vi. Mr. Parambir Singh vs SEBI (Crl Misc No. 831/2007) Date of Decision- November 13, 2013
Criminal Complaint was filed by SEBI under Section 200 Cr.P.C r/w Section 24 (1) and 27 of SEBI Act, 1992 for violation of CIS Regulations, 1999 against M/s Himanchal Harvest Farms Ltd and its directors. The trial court took cognizance and issued summons to the accused person, including the Petitioner, which was challenged by the Petitioner on the ground of delay in filing the complaint. SEBI opposed the petition contending that the offences for which petitioner has been prosecuted are continuing offence, and despite directions issued by respondent on December 7, 2000, petitioner has failed to refund the money collected under the investment schemes. The Hon’ble High Court being satisfied with the submission advanced on behalf of SEBI, was pleased to dismiss the petition vide order dated November 13, 2013 by holding that the contravention of provisions as alleged in the complaint gives rise to continuing offences, hence, complaint can’t be quashed as being time barred.
vii. M/s Janraksha Green Forests Ltd. and Others vs SEBI (Crl Misc No. 1356/2012), order dated October 19, 2013
Prosecution was launched against the captioned company and its directors for the violation of SEBI Act, 1992 r/w CIS Regulations, 1999. Trial court considered the case as a warrant trial case and listed the same for recording of pre-charge evidence. However, the Petitioners challenged the impugned order before Delhi High Court on the ground that a summons trial case cannot be converted into warrant trial case. The grievance of petitioners was that once the directions of SEBI were not followed by the Petitioner within prescribed time, then cause of action to file the complaint

204
Annual Report 2013-14
in question against petitioners (accused) arose on July 15, 2002. But instant complaint was filed after waiting for one year and in the meanwhile, Section 24 (1) of SEBI Act, 1992 was amended. The effect of amendment was that mode of the trial for the offences in question were changed to warrant trial instead.
The Hon’ble High Court dismissed the Petition and held that since the complaint in question had been filed under the amended section 24 of SEBI Act, 1992, the procedure to be adopted would be of warrant trial.
c. SECURITIES APPELLATE TRIBUNAL
i. Mrs. Madhuri Pitti vs SEBI (Appeal No. 2 of 2013)
Mrs. Madhuri Pitti (Appellant No.1), M/s. Pitti Electrical Equipment Pvt. Ltd., (Appellant No 2) is the “acquirers” of M/s Pitti Laminations Ltd., (Target Company). They were acting jointly with, Mr. Akshay S. Pitti (Appellant No. 3) and Mr. Sharad Pitti, (not a party in appeal). A preferential allotment was authorised on August 11, 2011 in the Annual General Meeting of the shareholders of the target company resulting in the increase of shareholding of the promoter group from 41.7 percent to 59.2 percent requiring the acquirers (along with persons acting in concert) to make an open offer under Regulation 11(1) of the SEBI (SAST), 1997 Regulations. Accordingly, a public announcement was made by the appellants on September 9, 2011 and simultaneously a Draft Letter of offer was filed before the respondent i.e. SEBI on September 19, 2011.
It came to light that on two occasions in the past i.e. April 26, 2006 and April 11, 2007, Mr. Akshay Pitti had individually acquired shares consequent to conversion of warrants which triggered Regulation 10 of the Takeover
Regulations, 1997. Since Regulation 10 had been attracted on both the occasions, SEBI sent the letter dated December 17, 2012 under regulation 18(2) of SEBI (SAST) Regulations, interalia, advising, to revise the offer price taking into consideration of acquisition of more than 15 percent of the shares by Mr. Akshay Pitti.
Aggrieved by the letter dated December 17, 2012, an appeal was filed before SAT. The issue before the Hon’ble Tribunal was whether the individual acquisition of shares by Mr. Akshay Pitti of 4.97 percent and 1.27 percent of shares in the target company on April 26, 2006 and April 11, 2007 consequent to conversion of warrants resulting in increase in his individual shareholding breaching the 15 percent limit should be considered as triggering of regulation 10 of SEBI (SAST Regulations), 1997 resulting into consequent obligations for the same. SAT has vide order dated October 31, 2013, disposed of the appeal by permitting the appellants to continue with the offer excluding SEBI’s directions on the ground that SEBI (SAST Regulations), 1997 intended to bring out a clear distinction between individual acquiring of shares on the one hand and shares acquired by persons acting in concert on the other. It observed that the individual acquisition breaching the threshold of 15 percent should not be considered as triggering of regulation 10. Instead, only the collective shareholding of all PACs together may be considered for the purpose of breaching the threshold limit. It further observed that liability to make open offer for breach of threshold limit by individual acquisition is stipulated only in SEBI (SAST) Regulations, 2011. The appeal filed by SEBI under section 15Z of SEBI Act, 1992 is pending before the Supreme Court.
205
Part Three: Functions of SEBI in Respect of Ma� ers Specifi ed in Section 11 of SEBI Act, 1992
ii. M/s. Clearwater Capital Partners (Cyprus) Ltd. vs SEBI (Appeal No. 21 of 2013)
The appellant/acquirer had subscribed to the Foreign Currency Convertible Bonds (FCCBs) for a consideration of USD 18 million offered by the target company, M/s Kamat Hotels India Ltd. as per the shareholder’s resolution dated September 23, 2006. Upon conversion of the FCCBs, the appellant holding along with PAC increased to 32.23 percent post equity share capital of the target company. Since it has triggered regulation 3(1) of SEBI (SAST Regulations), 2011, the appellant made a public announcement dated January 11, 2012. The letter of offer dated January 25, 2012 with the offer price calculated as ` 135 per share were filed by the merchant banker with SEBI.
However, on August 13, 2010, the target company had entered into an inter-se agreement with the appellant, and specified promoters of the target company. Various clauses in the inter-se agreement conferred on the appellant certain affirmative rights and veto rights on the policy decisions of the target company. Hence, the appellant had acquired control over the policy decision of the target company triggering regulation 12 of the SEBI (SAST Regulations), 1997. However, no public announcement was made by the appellant for the acquisition of control over the target company by virtue of the inter-se agreement.
In view of the acquisition of control and the resultant triggering of regulation 12 of the SEBI (Takeover Regulations), 1997, SEBI offered its comments on the draft letter of offer vide letter dated November 30, 2012, requiring to incorporate the fact of triggering of regulation 12 of the Takeover Regulations and to make consequential changes. Aggrieved by the finding of SEBI that regulation 12 of
the Takeover Regulations, 1997 has been triggered, the appellant challenged the impugned letter dated November 30, 2012, before SAT. Before the appeal is finally disposed of, the appellant completed the open offer without following the directions/observations of the SEBI contained in impugned letter.
SAT has vide order dated February 12, 2014 observed that there is no decision of SEBI on the objections raised by the appellant regarding the directions in the impugned letter. It also observed that the impugned communication does not set out consequences for non-compliance of above directions. In the above scenario, the Hon’ble SAT permitted SEBI to issue any show cause notice for non-compliance of the directions mentioned in the impugned letter, if it chooses to do so.
iii. M/s. Gillette India Ltd. vs SEBI and Others (Appeal No. 65 of 2013) – Order dated July 3, 2013
The captioned appeal was filed by M/s Gillette India Ltd., (Appellant), against order dated April 26, 2013 passed by SEBI, rejecting the method proposed by the appellant to attain the minimum public shareholding (MPS) requirement of 25 percent in accordance with the Securities Contracts (Regulation) Rules, 1957.
The appellant, jointly promoted by the M/s Poddar Group and M/s Procter and Gamble Group (P&G Group) who were parties to a Shareholders’ Agreement dated July 10, 1996 (SHA), made an application dated October 10, 2012 to SEBI under circular dated August 29, 2012 proposing a method to attain the mandatory requirement of minimum public shareholding of 25 percent in all listed companies, as the public shareholding of the appellant was 11.2 percent, which is significantly below the prescribed 25 percent limit.
206
Annual Report 2013-14
The respective shareholdings of the M/s Poddar Group and the M/s P&G Group were 12.9 percent and 75.9 percent. The manner in which to achieve the required public shareholding as presented by the appellant in the application, in brief, is that the M/s Poddar Group would first transfer four percent of its shares to the M/s P&G Group, which being an inter-se transfer of shares held by the M/s. Poddar Group for around 16 years would be exempt from the obligation of making an open offer as per Regulation 10(1)(a)(ii) of the SEBI (SAST) Regulations, 2011. As a result of this transfer, the holding of the M/s Poddar Group would go down to 8.9 percent. This would be followed by termination of the SHA and amendments to the Articles of Association of the company, as a result of which the M/s Poddar Group would be classified as an ordinary public shareholder and would lose all its rights and control over the appellant as promoter. Once the M/s Poddar Group joins the ranks of a public shareholder, the appellant will cause the M/s P & G Group, who shall then be holding 79.9 percent of the issued share capital, to sell or otherwise dilute 4.9 percent of their shareholding in the appellant company in the manner prescribed by the SEBI for achieving minimum public shareholding.
SEBI in its letter dated April 26, 2013 inter alia stated that it is not an acceptable means for achieving the MPS requirement in terms of rule 19 A of the Securities Contracts (Regulation) Rules, 1957. This letter of the SEBI was challenged by the appellant in the captioned appeal.
SAT vide its order dated July 7, 2013, upheld the order passed by SEBI by recording inter alia the fact that the underlying philosophy behind the requirement of a minimum public holding of 25 percent is prevention of concentration of shares in the
hands of a few market players by ensuring a sound and healthy public float to stave off any manipulation or perpetration of other unethical activities in the securities market. SAT also noted that no hardship or problems have been brought forth during the course of proceedings before this Tribunal which seem insurmountable to such an extent as to lead the Appellant to come up with such a dubious manner of achieving the 25 percent requirement regarding public shareholding while ignoring all other perfectly executable methods suggested by SEBI in various circulars over the past few years.
iv. M/s. Bombay Rayons Fashions Ltd. & Others vs SEBI ( Appeal No. 203/ 2013) order dated June 28,2013
The appeal was preferred by two entities M/s Bombay Rayons Fashions Ltd. and M/s B.R. Machine Tools Private Ltd. which were the promoter’s group companies. The fact leading to the dispute is that M/s Bombay Rayons Fashions Ltd. made preferential issue of 10 million of optionally convertible warrants to M/s B.R. Machine Tools Private Ltd. and to M/s Reynold Shirting Ltd. on September 13, 2009. Pursuant to the above said allotment of 20 million warrants, 12.5 million warrants were converted into equity shares within the creeping acquisition limit as prescribed by SEBI (SAST) Regulations, 1997. Thus, 7.5 million warrants remained to be converted into equity shares and the prescribed limitation of 18 months for conversion of such warrants was to expire on April 3, 2012.
In the meanwhile, certain developments took place which led to the reconstitution of the promoters’ group and consequently, the promoter group’s holding in M/s Bombay Rayons Fashions Ltd. stood at 93.15 percent of the total capital. In this situation, M/s B.R. Machine Tools Private Ltd. did not convert the balance 7.5 million outstanding warrants
207
Part Three: Functions of SEBI in Respect of Ma� ers Specifi ed in Section 11 of SEBI Act, 1992
on account of proviso to sub-regulation (2) of Regulation 3 of the SEBI (SAST) Regulations, 2011. According to the appellants, M/s B.R. Machine Tools Private Ltd. was, therefore, restrained from exercising its conversion option in respect of 7.5 million outstanding warrants and this peculiar situation which had arisen entirely due to coming into force of SAST Regulations, 2011 w.e.f. October 23, 2011. As such the appellants approached SEBI under Regulation 109 (C) of the SEBI (ICDR) Regulations, 2009 for grant of relaxation from the strict enforcement of Regulation 75 and 77 of SEBI (ICDR) Regulations, 2009. SEBI vide its reasoned order dated August 10, 2012, rejected the request of the appellants. This letter of the respondent was challenged in the captioned appeal.
Hon’ble SAT noted that the promoter group in M/s Bombay Rayons Fashions Ltd. increased their shareholding in a systematic manner from 31.54 percent to 93.2 percent during December 2009 to December 2011. The process of conversion of warrants into equity shares went on till September 30, 2011 when M/s B.R. Machine Tools Private Ltd. converted at least 2.5 million warrants into shares. The new SEBI (SAST) Regulations, 2011 had already been published in the official Gazette on September 23, 2011 and as such the M/s B.R. Machine Tools Private Ltd. was fully aware of the implication of the said Regulations which were to come into force on October 23, 2011 i.e. after 30 days of their being Gazetted. M/s B.R. Machine Tools Private Ltd. should have atleast approached SEBI for any relaxation or exemption from the applicability of Regulation 3(2) of the SAST Regulation, 2011 immediately after the same were Gazetted on September 23, 2011 or after October 23, 2011 when they were brought into force. But no such application was preferred by M/s B.R. Machine Tools Private Ltd. at
that time. Hon’ble SAT was of the view that that M/s B.R. Machine Tools Private Ltd. has totally failed to satisfy the respondent regarding any factor beyond the control of the issuer which would have prevented him from converting the warrants in question into shares. SEBI, therefore, rightly did not exercise its jurisdiction to permit any relaxation in the matter. The appeal was dismissed.
v. M/s. Uditi Mercantile Pvt. Ltd. vs SEBI (Appeal. No. 16/2012 & Misc. Application No. 7/2012); M/s Pams Investment Trading Co. Pvt. Ltd. vs SEBI in the scrip of Reliance Industries Limited (Appeal. No. 22/2012 & Misc. Application No. 10/2012)
Thirty four entities acting in concert with the promoter group of RIL, are alleged to have triggered the SAST Regulations upon acquisition of shares on January 7, 2000 on exercise of `12 crore convertible warrants issued to them by RIL in January 1994. The warrants appeared to have been issued at a price lower than the market price, and without a supporting resolution of the general body of shareholders (the existing resolution was exhausted by RIL in issuing warrants to another entity) as brought out in the Investigation Report. Despite triggering the SEBI (SAST) Regulations, 1997, the promoters and PACs failed to make the required public announcement in terms of Regulation 11 of SEBI (SAST) Regulations, 1997. The Adjudicating Officer (AO) was appointed vide order dated December 15, 2010 and the SCNs were issued to the said entities. The aforesaid appeals were filed by two entities representing the allottee group against the appointment of AO vide order dated December 15, 2010 and the issuance of SCNs by the AO, dated February 24, 2011 and March 18, 2011, alleging violation of Regulation 11 of

208
Annual Report 2013-14
Takeover Regulations, 1997. The appellants have challenged the jurisdiction of SEBI on the ground of inordinate delay in issue of SCN, the maintainability of SEBI’s actions on the ground of inapplicability of Takeover Regulations, 1997 and difficulty in gathering evidence.
SEBI filed an “Affidavit opposing admission” of the appellants’ appeal on the ground that the order appointing the AO is not an appealable order. SAT dismissed the appeal filed for challenging the issuance of notice to show cause by the adjudicating officer for violations relating to failure to make open offer under the Takeover Regulations and directed that the AO may consider the issues as raised by the appellants in accordance with law.
vi. M/s. N R Mercantile Private Ltd. vs SEBI (Appeal No.138 of 2013) and M/s. Imtihaan Commercial Private Ltd. vs SEBI (Appeal No. 141 of 2013) in the matter of M/s. Ramswarup Industries Ltd.
The captioned appeals were filed against the separate orders dated May 31, 2013 (impugned orders) passed by the Adjudicating Officer (AO) vide which penalty of `40,00,000 and `13,50,000 were imposed on M/s N R Mercantile Private Ltd. and M/s Imtihaan Commercial Private Ltd., respectively, for the violation of sections 12A(d) and 12A(e) of the SEBI Act, 1992 and regulation 3(i) of the SEBI (PIT) Regulations, 1992. It was observed in the impugned orders that the appellants were insiders and had traded in the shares of M/s Ramswarup Industries Ltd. while in possession of Unpublished Price Sensitive Information (UPSI).
The Hon’ble SAT upheld the orders passed by the AO and held that pursuant to the amendment to regulation 3(i) of the SEBI
(PIT) Regulations, 1992, trading in securities “when in possession of” any unpublished price sensitive information constitutes violation of SEBI (PIT) Regulations, 1992. vii. Mrs. Komal Nahata vs SEBI (Appeal
No. 5 of 2014)
The captioned appeal was filed against the order dated September 30, 2013 (impugned order) vide which a penalty of `1 lakh was imposed on the appellant. SEBI found that the appellant failed to make disclosures under regulations 7(1) and 7(2) of the SEBI (SAST) Regulations, 1997 and under regulation 13(3) read with regulation 13(5) of the SEBI (PIT) Regulations, 1992 in respect of transfer of 3,75,000 shares of M/s Arvind International Ltd. (AIL) to the appellant’s demat account, which constituted 5.4 percent shareholding of AIL.
The Hon’ble SAT, while upholding the impugned order, held that penalty for non-compliance of SEBI (SAST) Regulations, 1997 and SEBI (PIT) Regulations, 1992 is not dependent upon the investors actually suffering on account of such non-disclosure.
viii. Mr. Navin Kumar Tayal vs SEBI and other connected appeals - in the matter of Bank of Rajasthan
The captioned appeal/s were filed challenging the SEBI order dated February 14, 2013 wherein a cumulative penalty of `29.9 crore was imposed on the 118 entities (Represented in the 14 appeals) for the violations of the provisions of SEBI Act, 1992, the SEBI (PFUTP) Regulations, 2003 and the SEBI (SAST) Regulations,1997.
Hon’ble SAT had observed that some of the appellants have neither filed reply to show cause notices issued to them, not availed opportunity of personal hearing offered to them in the adjudication proceedings and,
209
Part Three: Functions of SEBI in Respect of Ma� ers Specifi ed in Section 11 of SEBI Act, 1992
therefore, appellants are presumed to have admitted charges leveled against them in the show cause notices. Further, Hon’ble SAT also held that the Adjudicating Officer was justified in holding that the transactions in question were carried out by promoter group in connivance with connected entities with a view to mislead investors that the promoter group has divested shares of Bank of Rajasthan when in fact there was no such divesting because both Promoter group and the connected entities were controlled by Tayal family.
Hon’ble SAT partly modified the amount of penalty imposed by the Adjudicating Officer and upheld the penalty to the tune of `15.4 crore.
ix. Mrs. Vibha Sharma and Mr Jitendra Kumar Sharma vs SEBI (Appeal No. 27 of 2013)
The appeal was filed against the adjudication order dated December 19, 2012 vide which a penalty of `25 lakh was jointly and severally imposed on the appellants for violation of Regulation 3(a), (b), (c) & (d) and 4(1) of the SEBI (PFUTP) Regulations, 2003. It was found out that the appellants were related as husband and wife and that the appellant no. 1 (Mrs. Vibha Sharma, who was a day trader) was front running/ trading on basis of the information (by whatsoever means it was communicated) received from Appellant No. 2 (Mr. Jitendra Kumar Sharma, who was a dealer in securities for Central Bank of India). Mrs. Vibha Sharma made handsome profits by manipulating sale price of one scrip only on each and every of the 14 days, out of 40 days of investigation period, and was suitably supported, in this activity by Mr. Jitendra Kumar Sharma.
It was argued by the appellants that front running charge against Mrs. Vibha Sharma
cannot be applicable in view of the earlier judgement of the Hon’ble SAT in Mr. Dipak Patel Vs. Adjudicating Officer.
The Hon’ble SAT, while upholding the order of the Adjudicating Officer, inter alia, have given a liberal interpretation to the concept of front running and held that any person, who is connected with the capital market, and indulges in front running is guilty of a fraudulent market practice as such liable to be punished as per law by SEBI. The definition of front running, therefore, cannot be put in a straight-jacket formula.
x. Appeal No. 126 of 2013 by M/s Pan Asia Advisors & Anr. vs. SEBI
The appeal was filed against the order dated June 20, 2013 of SEBI wherein M/s Pan Asia Advisors and Mr. Arun Panchariya (the appellants) who were involved in the conversion of Global Depository Receipts (GDR) into equity shares to sell in Indian markets, were barred from rendering services in connection with instruments that are defined as securities in section 2(h) of Securities Contracts (Regulations) Act, 1956 in the Indian market and also prohibited them from accessing the capital market directly or indirectly, for a period of 10 years, from the date of the order. The said order dated June 20, 2013 was under challenge in the appeal.
In the appeal, the appellants have raised a preliminary objection as to the jurisdiction of SEBI to take action in the matter of issuance of GDRs outside India and subsequent transaction of sale/purchase of underlying shares released on redemption of GDRs in the securities market in India. The Hon’ble SAT, after hearing the parties, disposed of the matter, vide order dated September 30, 2013 wherein the Presiding Officer held that SEBI has jurisdiction in the matter while the other two Members of the Hon’ble SAT have
210
Annual Report 2013-14
held that SEBI does not have jurisdiction and accordingly, the appeal was allowed. The two Members of the Hon’ble SAT, inter alia observed in the said order that the SEBI Act, 1992; the Securities Contracts (Regulations) Act, 1956; the Depositories Act, 1996 and the Companies Act, 1956 give no power to SEBI to exercise any jurisdiction in respect of the issuance, trading or conversion of GDRs abroad and SEBI may have a role only when GDRs are converted into shares and traded on Indian Stock Exchanges, and that too when any loss or prejudice is caused to the Indian investors or to the Indian capital market.
However, the Presiding Officer the Hon’ble SAT disagreed with the above decision of the Members and dismissed the appeal, inter alia, on the reasons that the transactions relating to sale/purchase of underlying shares in the securities market in India (after conversion of GDRs created/sold/traded outside India) are fraudulent transactions and that fraudulent intention existed right from the date of issuance of shares through GDR mechanism, then, SEBI would be justified in invoking jurisdiction under SEBI Act, 1992 and debar persons connected with such transactions from rendering services in connection with instruments that are defined as securities (as in section 2(h) of SCRA, 1956) in the Indian market for such period as it deems fit and further prohibit persons involved in such fraudulent transactions from accessing the capital market directly or indirectly for such period as it deems fit. The Presiding Officer has observed that the appellants were architects of a fraudulent scheme and were involved at every stage with their connivance of connected entities from raising ordinary shares through GDR mechanism up to the stage of sale/purchase of underlying shares in
the Indian securities market and accordingly they are liable for action under SEBI Act, 1992 and regulations made thereunder.
SEBI filed appeal before the Hon’ble Supreme Court challenging the majority decision of the Hon’ble SAT and vide order dated December 13, 2013, the Hon’ble Supreme Court stayed the operation of the order dated September 30, 2013 of the Hon’ble SAT.
d. CONSUMER COURTS
Mr. Manoj Aggarwal vs M/s J.M. Financial Mutual Fund & another (First Appeal No. 590/2013) before State Consumer Disputes Redressal Commission, New Delhi Order dated July 15, 2013
The appeal in the matter was preferred against the order of District Consumer Disputes Redressal Forum, Delhi wherein the complaint was dismissed on the ground that complainant is not a consumer as per section 2(1)(d) of Consumer Protection Act, 1986 (Act) and directed him to approach SEBI for relief. The complainant had invested in the respondent fund and he alleged manipulation by Respondent, as the money he invested got reduced due to arbitrary merger of his scheme by the Respondent with another scheme without justification or his consent. The issue before the Commission was whether stock market trader or investor in mutual fund is a consumer or not under the Act. Answering the same in negative, the Commission dismissed the appeal on the ground that the Act is not for entertaining or compensating speculative transactions and losses and trading in shares are carried out with the help of intermediaries and provision for adjudication of disputes in this regard is present in SEBI Rules and Guidelines.
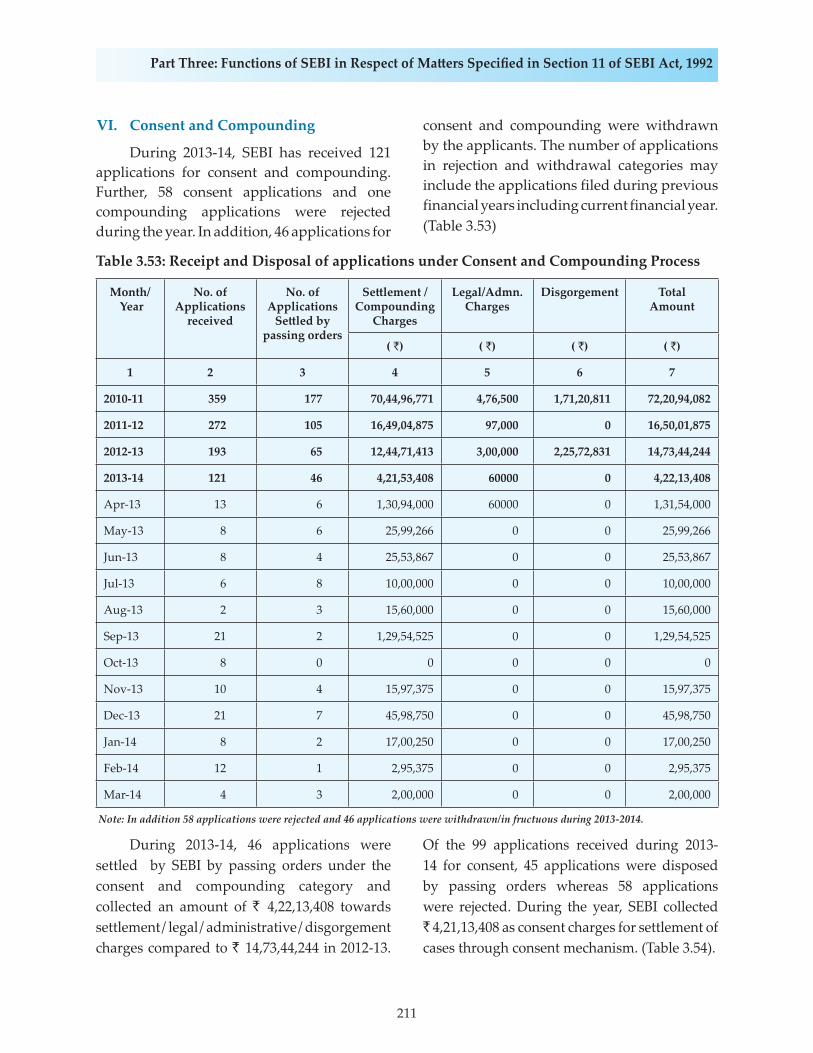
211
Part Three: Functions of SEBI in Respect of Ma� ers Specifi ed in Section 11 of SEBI Act, 1992
VI. Consent and Compounding
During 2013-14, SEBI has received 121 applications for consent and compounding. Further, 58 consent applications and one compounding applications were rejected during the year. In addition, 46 applications for
consent and compounding were withdrawn by the applicants. The number of applications in rejection and withdrawal categories may include the applications filed during previous financial years including current financial year. (Table 3.53)
Table 3.53: Receipt and Disposal of applications under Consent and Compounding Process
Month/ Year
No. of Applications
received
No. of Applications
Se� led by passing orders
Se� lement / Compounding
Charges
Legal/Admn. Charges
Disgorgement Total Amount
( `) ( `) ( `) ( `)
1 2 3 4 5 6 7
2010-11 359 177 70,44,96,771 4,76,500 1,71,20,811 72,20,94,082
2011-12 272 105 16,49,04,875 97,000 0 16,50,01,875
2012-13 193 65 12,44,71,413 3,00,000 2,25,72,831 14,73,44,244
2013-14 121 46 4,21,53,408 60000 0 4,22,13,408
Apr-13 13 6 1,30,94,000 60000 0 1,31,54,000
May-13 8 6 25,99,266 0 0 25,99,266
Jun-13 8 4 25,53,867 0 0 25,53,867
Jul-13 6 8 10,00,000 0 0 10,00,000
Aug-13 2 3 15,60,000 0 0 15,60,000
Sep-13 21 2 1,29,54,525 0 0 1,29,54,525
Oct-13 8 0 0 0 0 0
Nov-13 10 4 15,97,375 0 0 15,97,375
Dec-13 21 7 45,98,750 0 0 45,98,750
Jan-14 8 2 17,00,250 0 0 17,00,250
Feb-14 12 1 2,95,375 0 0 2,95,375
Mar-14 4 3 2,00,000 0 0 2,00,000
Note: In addition 58 applications were rejected and 46 applications were withdrawn/in fructuous during 2013-2014.
During 2013-14, 46 applications were settled by SEBI by passing orders under the consent and compounding category and collected an amount of ` 4,22,13,408 towards settlement / legal / administrative / disgorgement charges compared to ` 14,73,44,244 in 2012-13.
Of the 99 applications received during 2013-14 for consent, 45 applications were disposed by passing orders whereas 58 applications were rejected. During the year, SEBI collected ` 4,21,13,408 as consent charges for settlement of cases through consent mechanism. (Table 3.54).
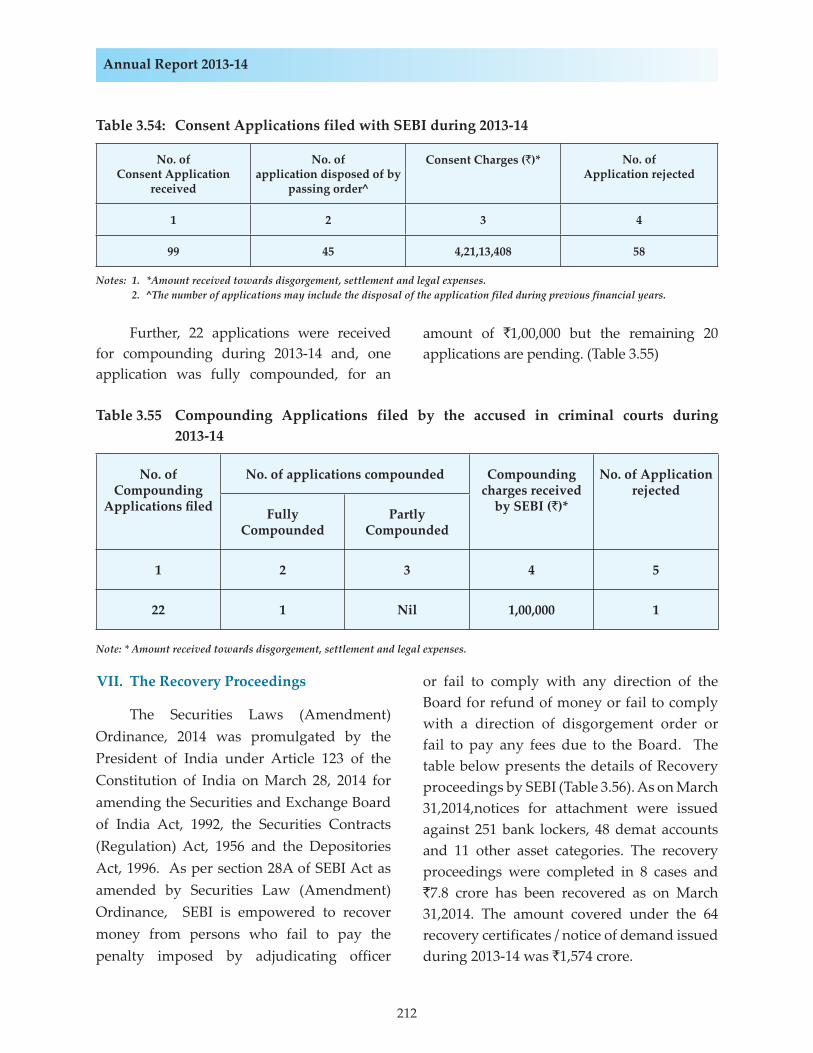
212
Annual Report 2013-14
Table 3.54: Consent Applications filed with SEBI during 2013-14
No. of Consent Application
received
No. of application disposed of by
passing order^
Consent Charges (`)* No. of Application rejected
1 2 3 4
99 45 4,21,13,408 58
Notes: 1. *Amount received towards disgorgement, settlement and legal expenses. 2. ^The number of applications may include the disposal of the application filed during previous financial years.
Table 3.55 Compounding Applications filed by the accused in criminal courts during 2013-14
No. of Compounding
Applications fi led
No. of applications compounded Compounding charges received
by SEBI (`)*
No. of Application rejected
Fully Compounded
Partly Compounded
1 2 3 4 5
22 1 Nil 1,00,000 1
Note: * Amount received towards disgorgement, settlement and legal expenses.
Further, 22 applications were received for compounding during 2013-14 and, one application was fully compounded, for an
amount of `1,00,000 but the remaining 20 applications are pending. (Table 3.55)
VII. The Recovery Proceedings
The Securities Laws (Amendment) Ordinance, 2014 was promulgated by the President of India under Article 123 of the Constitution of India on March 28, 2014 for amending the Securities and Exchange Board of India Act, 1992, the Securities Contracts (Regulation) Act, 1956 and the Depositories Act, 1996. As per section 28A of SEBI Act as amended by Securities Law (Amendment) Ordinance, SEBI is empowered to recover money from persons who fail to pay the penalty imposed by adjudicating officer
or fail to comply with any direction of the Board for refund of money or fail to comply with a direction of disgorgement order or fail to pay any fees due to the Board. The table below presents the details of Recovery proceedings by SEBI (Table 3.56). As on March 31,2014,notices for attachment were issued against 251 bank lockers, 48 demat accounts and 11 other asset categories. The recovery proceedings were completed in 8 cases and `7.8 crore has been recovered as on March 31,2014. The amount covered under the 64 recovery certificates / notice of demand issued during 2013-14 was `1,574 crore.
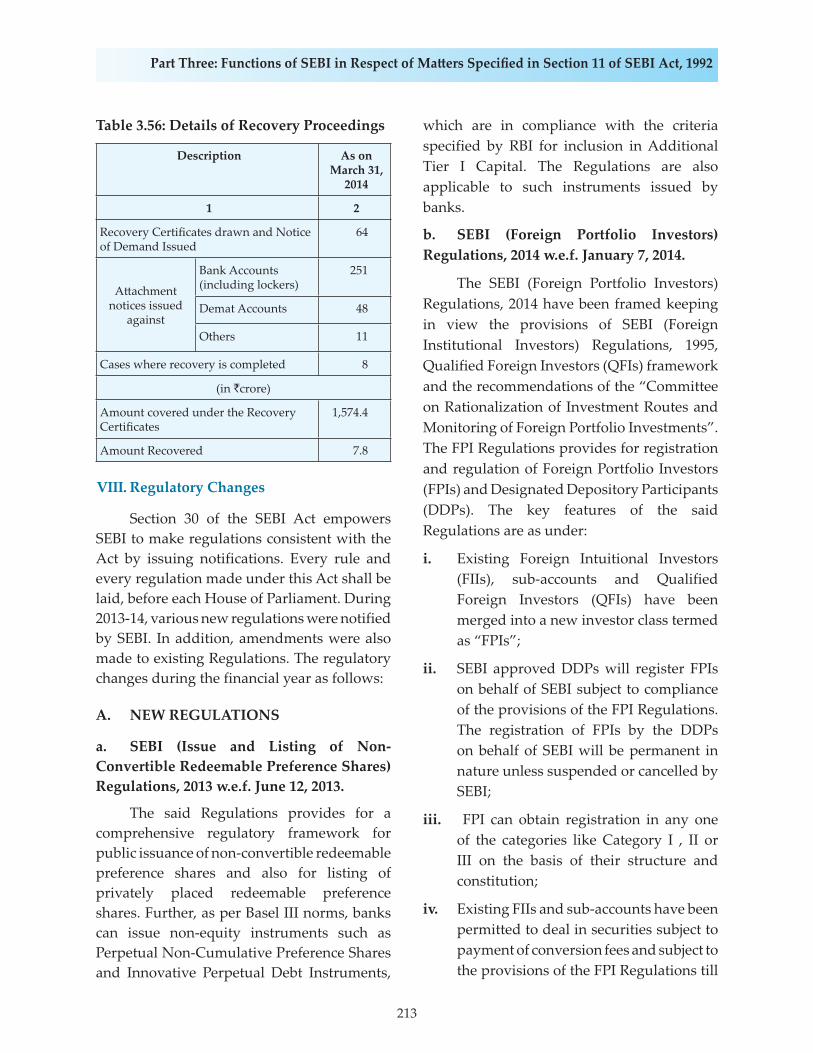
213
Part Three: Functions of SEBI in Respect of Ma� ers Specifi ed in Section 11 of SEBI Act, 1992
Table 3.56: Details of Recovery Proceedings
Description As on March 31,
2014
1 2
Recovery Certifi cates drawn and Notice of Demand Issued
64
A� achment notices issued
against
Bank Accounts (including lockers)
251
Demat Accounts 48
Others 11
Cases where recovery is completed 8
(in `crore)
Amount covered under the Recovery Certifi cates
1,574.4
Amount Recovered 7.8
VIII. Regulatory Changes
Section 30 of the SEBI Act empowers SEBI to make regulations consistent with the Act by issuing notifications. Every rule and every regulation made under this Act shall be laid, before each House of Parliament. During 2013-14, various new regulations were notified by SEBI. In addition, amendments were also made to existing Regulations. The regulatory changes during the financial year as follows:
A. NEW REGULATIONS
a. SEBI (Issue and Listing of Non-Convertible Redeemable Preference Shares) Regulations, 2013 w.e.f. June 12, 2013.
The said Regulations provides for a comprehensive regulatory framework for public issuance of non-convertible redeemable preference shares and also for listing of privately placed redeemable preference shares. Further, as per Basel III norms, banks can issue non-equity instruments such as Perpetual Non-Cumulative Preference Shares and Innovative Perpetual Debt Instruments,
which are in compliance with the criteria specified by RBI for inclusion in Additional Tier I Capital. The Regulations are also applicable to such instruments issued by banks.
b. SEBI (Foreign Portfolio Investors) Regulations, 2014 w.e.f. January 7, 2014.
The SEBI (Foreign Portfolio Investors) Regulations, 2014 have been framed keeping in view the provisions of SEBI (Foreign Institutional Investors) Regulations, 1995, Qualified Foreign Investors (QFIs) framework and the recommendations of the “Committee on Rationalization of Investment Routes and Monitoring of Foreign Portfolio Investments”. The FPI Regulations provides for registration and regulation of Foreign Portfolio Investors (FPIs) and Designated Depository Participants (DDPs). The key features of the said Regulations are as under:
i. Existing Foreign Intuitional Investors (FIIs), sub-accounts and Qualified Foreign Investors (QFIs) have been merged into a new investor class termed as “FPIs”;
ii. SEBI approved DDPs will register FPIs on behalf of SEBI subject to compliance of the provisions of the FPI Regulations. The registration of FPIs by the DDPs on behalf of SEBI will be permanent in nature unless suspended or cancelled by SEBI;
iii. FPI can obtain registration in any one of the categories like Category I , II or III on the basis of their structure and constitution;
iv. Existing FIIs and sub-accounts have been permitted to deal in securities subject to payment of conversion fees and subject to the provisions of the FPI Regulations till
214
Annual Report 2013-14
the expiry of their registrations or until they obtain a certificate of registration as FPI, whichever is earlier. Similarly, QFIs have also been permitted to deal in securities till the period of one year from the date of commencement of the FPI Regulations;
v. FPIs are allowed to invest in all those securities in which FIIs were allowed to invest;
vi. Category I and Category II FPIs are allowed to issue or otherwise deal in offshore derivative instruments subject to certain conditions;
vii. SEBI registered custodian of securities and certain qualified depository participants have been deemed to be DDPs, subject to payment of fees; and application for approval as DDP is to be forwarded by a depository with its recommendation and certification as to eligibility criteria of the participant to SEBI for grant of approval.
c. SEBI (Settlement of Administrative and Civil Proceedings) Regulations, 2014 w.e.f. January 9, 2014.
Vide the Securities Laws (Amendment) Ordinance, 2013 and subsequent re-promulgations thereof, section 15JB in the SEBI Act, 1992, section 23JA in the Securities Contracts (Regulation) Act, 1956 (SCRA) and section 19-IA in the Depositories Act, 1996, were inserted whereby SEBI was expressly empowered to settle administrative and civil proceedings. The Ordinance enabled SEBI to settle administrative and civil proceedings under the SEBI Act, 1992, SCRA and the Depositories Act, 1996 in accordance with the procedure specified in the Regulations providing for the terms and procedure for
settlement. Accordingly, the said Regulations were framed to provide for the procedure for the settlement of administrative and civil proceedings in lines of the existing consent proceedings as per SEBI circulars dated April 20, 2007 and May 25, 2012 which was rescinded vide the said Regulations.
d. SEBI (Procedure for Search and Seizure) Regulations, 2014 w.e.f. January 10, 2014
i. The Securities Laws (Amendment) Ordinance, 2013 and subsequent re-promulgations thereof, inter alia, empowered SEBI to conduct search and seizures without the intervention of the court of law. The said Ordinance empowers the Chairman, SEBI to authorise the Investigating Authority or any other officer of the Board to search any building, place, vessel, vehicle or aircraft, if the Investigating Authority has reason to believe that the person to whom a notice has been issued or might be issued has failed to provide information or document or that the information or document would not be provided or that the documents would be destroyed or mutilated or altered or falsified or secreted.
ii. The said Ordinance also empowered SEBI to make regulations in relation to search and seizure under section 11C of the SEBI Act. SEBI (Procedure for Search and Seizure) Regulations, 2014 were notified in exercise of the powers conferred under the said Ordinance. The said Regulations are framed on lines of the provisions of the Income Tax Act, 1961.
iii. The said Regulations provide for the procedure for the issuance of the warrant
215
Part Three: Functions of SEBI in Respect of Ma� ers Specifi ed in Section 11 of SEBI Act, 1992
of authority by the Chairman to the authorised officer empowering him to carry out search and seizure. It also lays down the obligations of the authorized officer and the detailed procedure to be followed by him at the time of search and seizure. It further provides for the rights and obligations of the persons being searched and the persons who are in charge of the premises being searched. In addition, the Regulations mandate safe custody and return of the documents seized. As a salient measure of protection of privacy, the personal information contained in any document seized is safeguarded from disclosure by SEBI except for the compliance of law, without the consent of the person to whom such information relates.
B. AMENDMENTS TO EXISTING REGULATIONS
a. SEBI (Stock Brokers and Sub-brokers) (Amendment) Regulations, 2013 w.e.f. April 5, 2013
In order to enable direct membership of banks and other institutional participants (as specified by their sectoral regulators) in the debt segment of the stock exchanges, the SEBI (Stock Brokers and Sub-brokers) Regulations, 1992 were amended as to provide as follows:
i. Debt segment was inserted in addition to derivatives segment and currency derivatives segment in the definition of clearing members, self clearing members, trading members;
ii. Introduced the definition of “proprietary trading member” to permit specified institutions such as scheduled commercial banks, primary dealers, pension funds, provident funds, insurance companies, mutual funds and
any other investors as may be specified by sectoral regulators from time to time to trade only on their own account in debt segment; and
iii. Introduced a new chapter in the said Regulations as ‘Chapter IIIC’ to provide for registration, procedures, fees, obligations and responsibilities for trading member/ proprietary trading member/self clearing member/ clearing member of debt segment.
b. SEBI (Mutual Funds) (Amendment) Regulations, 2013 w.e.f. April 16, 2013
The SEBI (Mutual Funds) Regulations were amended to provide the following regulatory changes:i. Regulation 49-OA was introduced vide
this amendment, whereby the mutual funds may raise money by way of private placement in case of infrastructure debt fund schemes. The private placement shall be made to less than 50 persons subject to the approval of trustees and board of asset management company. In case of a private placement, the mutual fund will have to file a Placement Memorandum with SEBI instead of a Scheme Information Document and a Key Information Memorandum.
ii. The overall investments by an Infrastructure Debt Fund (IDF) scheme in debt instruments or assets of infrastructure companies or projects or special purpose vehicles, which are created for the purpose of facilitating or promoting investment in infrastructure or bank loans in respect of completed and revenue generating projects of infrastructure companies or projects or special purpose vehicles, which are rated below investment grade or are unrated,
216
Annual Report 2013-14
shall not exceed 30 percent of the net assets of the scheme.
iii. The strategic investors for the infrastructure debt fund schemes with minimum contribution in such schemes shall now include systematically important NBFCs and Foreign Institutional Investors along with the existing strategic investors list which include infrastructure finance companies, scheduled commercial banks and international multilateral financial institutions.
iv. IDFs can extend scheme tenure by up to two years with the consent of two-third investors.
v. IDFs may also invest in bonds of public financial institutions and infrastructure finance companies.
c. SEBI (Depositories and Participants) (Amendment) Regulations, 2013 w.e.f. May 17, 2013
SEBI (Depositories and Participants) Regulations, 1996 were amended to provide the following regulatory changes:
i. Depository participants were made liable to pay registration fee for every five years from the sixth year of the date of grant of permanent registration;
ii. Depositories were enabled to prepare consolidated account statement of beneficial owners who hold demat assets other than securities;
iii. A framework for action in case of default or non-compliance by issuers or its agents is provided in the regulations. This also authorises depository to conduct inspection of issuers and agents.
d. SEBI (Mutual Funds) (Second Amendment) Regulations, 2013 w.e.f. Jun 19, 2013
Through the aforesaid amendment to the SEBI (Mutual Funds) Regulations, 1996, SEBI increased the initial offering period for eligible schemes under Rajiv Gandhi Equity Savings Scheme from 15 days to 30 days. The timeline for refund of money and sending statement of account, for such eligible schemes, was also extended from five working days to 15 days from closure of initial subscription.
e. SEBI (Buy-back of Securities) (Amendment) Regulations, 2013 w.e.f. August 8, 2013
In the amendments to the SEBI (Buy-back of Securities) Regulations, 1998, the following changes to buy-back of shares or other specified securities from the open market through stock exchange mechanism were specified:
i. The mandatory minimum buy-back has been increased to 50 percent of the amount earmarked for the buy-back, as against existing 25 percent, failing which, the amount in the escrow account would be forfeited subject to a maximum of 2.5 percent of the total amount earmarked;
ii. The maximum buy-back period has been reduced to six months from 12 months;
iii. The companies have been mandated to create an escrow account towards security for performance with an amount equivalent to at least 25 percent of the amount earmarked for buy-back;
iv. It was specified that companies shall not raise further capital for a period of one year from the closure of the buy-back except in discharge of its subsisting obligations as against the existing six months;
217
Part Three: Functions of SEBI in Respect of Ma� ers Specifi ed in Section 11 of SEBI Act, 1992
v. Companies are prohibited from making another buy-back offer within a period of one year from the date of closure of the preceding offer;
vi. The disclosure requirements have been rationalized requiring disclosure of the shares bought back on a cumulative basis on the website of the company and the stock exchange, only on a daily basis instead of the current requirement of disclosure on daily, fortnightly and monthly basis;
vii. The companies are permitted to buy-back 15 percent or more of capital (paid-up capital and free reserves) only by way of tender offer;
viii. Procedure for buy-back of physical shares (odd-lot) has been modified which includes creation of separate window in the trading system for tendering the shares, requirement of PAN/Aadhaar for verification, etc;
ix. Companies were permitted to extinguish shares bought back during the month, within fifteen days of the succeeding month subject to the last extinguishment within seven days of the completion of the offer;
x. The promoters of the company have been barred from executing any transaction, either on-market or off-market, during the buy-back period.
f. SEBI (Mutual Funds) (Third Amendment) Regulations, 2013 w.e.f. August 19, 2013
This amendment was made to enable mutual funds to directly trade on the debt platforms of the stock exchanges. Pursuant to this amendment, asset management companies can register themselves under ‘proprietary trading members’ category. These
AMCs would be allowed to trade only on behalf of schemes managed by them. The move could lead to the reduction in cost of trading for AMCs in debt segment, which in turn could enhance the performance of debt funds. Another change made by these regulations is that subject to certain conditions, the custodian in which the sponsor of a mutual fund or its associates hold 50 percent or more of the voting rights, would be allowed to act as custodian for a mutual fund constituted by the same sponsor or any of its associates or subsidiary.
g. SEBI (Issue of Capital and Disclosure Requirements) (Second Amendment) Regulations, 2013 w.e.f. August 26, 2013
The said Regulations made certain changes to the preferential issue norms. The key features of the amendments are as under:
i. The issuers were mandated to disclose the identity of the natural persons who are the ultimate beneficial owners of the shares proposed to be allotted and/or who ultimately control the proposed allottees with certain exceptions;
ii. The issuers were mandated to ensure that consideration of specified securities, if paid in cash, shall be received from respective allottee’s bank account;
iii. Allotment shall be in demateralised form;
iv. Lock-in of specified securities allotted on preferential basis was made effective from the date of trading approval;
v. Prohibited transfer of specified securities allotted on preferential basis till trading approval is granted by stock exchanges where the equity shares of the issuer are listed.
218
Annual Report 2013-14
h. SCR (Regulation) (Stock Exchanges and Clearing Corporations)(Amendment) Regulations, 2013 w.e.f. September 2, 2013
The Amendment Regulations enshrines finality of settled transactions. It also provides for right of Clearing Corporations over collateral and assets of the clearing members in order to recover dues arising from discharge of their clearing and settlement functions. i. SEBI (Prohibition of Fraudulent
and Unfair Trade Practices relating to Securities Market) (Amendment) Regulations, 2013 w.e.f. September 6, 2013
In order to make illegal mobilization of funds without obtaining a certificate under the SEBI (Collective Investment Schemes) Regulations, 1999, a fraudulent and unfair trade practice under regulation 4 of the SEBI (PFUTP) Regulations, 2003, a new clause was inserted in regulation 4(2) as clause (t). This provision enables imposition of deterrent monetary penalties for illegal mobilization of funds by floating schemes in the nature of unregistered collective investment schemes within the existing scheme of adjudication. There was a perception that an activity specifically prohibited under Regulation 4(2) of the SEBI (PFUTP Regulations), 2003 was restricted to a certain class of persons despite regulation 3 being couched in wide terms to cover any person irrespective of who the perpetrator of fraud or unfair/manipulative practice is. Therefore, an explanation to regulation 4(2) was inserted to clarify that an activity falling foul of regulation 3 is prohibited notwithstanding that it may not be included in categories of activity enumerated in Regulation 4(2)(a) to (s), or is mentioned in Regulation 4(2)(a) to (s), but is restricted therein to a certain class of persons.
j. SEBI (Alternative Investment Funds) (Amendment) Regulations, 2013 w.e.f. September 16, 2013
Giving effect to the announcement on angel investor pools in Union Budget for financial year 2013-14 by Hon’ble Finance Minister, amendments to SEBI (Alternative Investment Funds) Regulations, 2012 (“AIF Regulations”) have been notified for providing a framework for registration and regulation of angel pools under a sub-category ‘Angel Funds’ under Category I-Venture Capital Funds. Salient features of such angel funds are as under:i. Angel Funds have been included in the
definition of ‘Venture Capital Funds’ and a separate Chapter has been inserted specific to such funds. Angel funds shall raise funds only from angel investors.
ii. In view of the high risk investments of such funds, certain conditions have been imposed on investors. For instance, individual angel investors shall be required to have early stage investment experience/ experience as a serial entrepreneur/ be a senior management professional with 10 years experience. They shall also be required to have net tangible assets of at least rupees two crore. Corporate angel investors shall be required to have `10 crore net worth or be a registered Alternative Investment Fund (AIF)/Venture Capital Fund.
iii. Angel Funds shall have a corpus of at least `10 crore (as against `20 crore for other AIFs) and minimum investment by an investor shall be `25 lakh (may be accepted over a period of maximum three years) as against `1 crore for other AIFs. Further, the continuing interest by sponsor/manager in the Angel Fund shall be not less than 2.5 percent of the corpus or `50 lakh, whichever is lesser.
219
Part Three: Functions of SEBI in Respect of Ma� ers Specifi ed in Section 11 of SEBI Act, 1992
iv. For ensuring investments are genuine angel investments, angel funds are permitted to invest only in venture capital undertakings which are not more than three years old, have a turnover not exceeding `25 crore, are not promoted, sponsored or related to an industrial group whose group turnover is in excess of ` 300 crore, and have no family connection with the investors proposing to invest in the company.
v. Investment in an investee company by an angel fund shall be not less than `50 lakh and more than `5 crore and shall be required to be held for a period of at least three years.
vi. A minimum amount of `25 lakh is permitted to be collected as grants by Social Venture Funds. However, no profits or gains shall accrue to the provider of such grants.
k. SEBI (Stock Brokers and Sub-brokers) (Second Amendment) Regulations, 2013 w.e.f. September 27, 2013
The Amendment Regulationsimplements one registration per stock exchange for all segments and categories of stock brokers. Registration of clearing members has also been introduced. Further, where an entity is already registered as a stock broker, he would not require a separate registration as a clearing member and vice-versa, if such entity is a member of a stock exchange promoted clearing corporation of which he desires to seek membership and registration or vice versa. Consequently, the fee, deposit and networth requirements have also been modified. Since the amendments do away with segment-wise registration, multiple nomenclature used such as trading member, proprietary trading member, etc., are now referred to commonly as “stock broker”.
l. SEBI (Listing of Specified Securities on Institutional Trading Platform) Regulations, 2013 w.e.f. October 8, 2013
In order to facilitate capital raising by small and medium enterprises including start-up companies which are in their early stages of growth and to provide for easier exit options for informed investors like angel investors, VCFs and PEs etc., from such companies, SEBI permitted listing without an initial public offer and trading of specified securities of small and medium enterprises (SMEs) including start-up companies on Institutional Trading Platform (ITP) in SME Exchanges in line with the Budget Announcement dated February 28, 2013 with respect to capital market. The SEBI (Listing of Specified Securities on Institutional Trading Platform) Regulations, 2013 amended the following regulations to enable listing of small and medium enterprises without initial public offer:
i. SEBI (Issue of Capital and Disclosure Requirements) Regulations 2009, by inserting a new chapter as ‘Chapter XC’ on ‘Listing and Issue of Capital by Small and Medium Enterprises on Institutional Trading Platform’;
ii. SEBI (Substantial Acquisition of Shares and Takeovers) Regulations, 2011 was amended to exclude the applicability of this regulation to companies listed on this institutional trading platform;
iii. SEBI (Delisting of Equity Shares) Regulations, 2009 was amended to exclude the applicability of this regulation to companies listed on institutional trading platform.
The key features of the said Regulations are as under:
i. Institutional Trading Platform (ITP) was introduced for listing and trading of
220
Annual Report 2013-14
specified securities of small and medium enterprises including start-up companies in a ‘SME Exchange’;
ii. Access restricted to informed investors and the minimum trading lot is `10 lakh;
iii. Companies listed on ITP are prohibited from making public issue;
iv. The said Regulations, inter alia, provides for eligibility criteria for listing, process of listing, restriction on raising capital, lock-in of promoter holdings, voluntary and compulsory exit from the ITP.
m. SEBI (Self Regulatory Organisations) (Second Amendment) Regulations, 2013 w.e.f. November 18, 2013
In order to regulate distributors of mutual fund products, it has been decided to have a single SRO for distributors of mutual fund products. Further, it has been decided to have a two stage procedure for grant of recognition as SRO for distributors of mutual fund products. First stage is grant of in-principle approval for setting up of the SRO for distributors of mutual fund products and upon receipt of the same the applicant has to complete the remaining requirements of SEBI (SRO) Regulations, 2004 within the stipulated time period of six months for grant of recognition as SRO. Second stage is grant of recognition as SRO subject to compliance with all the regulatory requirements.
n. SEBI (Investor Protection and Education Fund) (Amendment) Regulations, 2014 w.e.f. January 9, 2014
Pursuant to the insertion of section 11(5) in the SEBI Act, 1992 vide Securities Laws (Amendment) Ordinance, 2013 and subsequent re-promulgations thereof, SEBI has been expressly empowered to disgorge
amounts for violation of securities laws and restitute investors using such disgorged amounts. The Ordinance, inter alia, mandates credit of disgorged amounts to the Investor Protection and Education Fund (IPEF) established by the Board. The aforesaid amendment to the SEBI (Investor Protection and Education Fund) Regulations, 2009 expressly provides for utilization of disgorged amounts credited to the fund for the purpose of restitution of investors wherever identifiable. However, the amounts remaining after restitution may be used for the other purposes of IPEF as well. For such determination, the Board may engage the services of any other agency or expert. o. SEBI (Collective Investment Schemes)
(Amendment) Regulations, 2014 w.e.f January 9, 2014
The Securities Laws (Amendment) Ordinance, 2013 provides for regulation of pooling of funds under any scheme or arrangement, involving a corpus amount of ` 100 crore or more, to be deemed to be a Collective Investment Scheme, subject to sub-section (3) of section 11AA of the SEBI Act. Accordingly, amendments were made to SEBI (Collective Investment Schemes) Regulations, 1999, providing a framework for regulation of such deemed CISs. It was also provided that all Collective Investment Management Companies shall mobilize money only through cheques.p. SEBI (Issue and Listing of Debt
Securities) (Amendment) Regulations, 2014 w.e.f January 31, 2014
The Companies Act, 1956 had allowed only banks and public financial institutions to file shelf prospectus. However, the Companies Act, 2013 specifically enabled SEBI to specify the class of the companies which can be allowed to file shelf prospectus. The aforesaid
221
Part Three: Functions of SEBI in Respect of Ma� ers Specifi ed in Section 11 of SEBI Act, 1992
amendments allowed the following class of entities to file shelf prospectus for public issuance of non-convertible debt securities:
i. Public financial institutions and Scheduled Banks;
ii. Issuers authorized by the notification of Central Board of Direct Taxes to make public issue tax free secured bonds;
iii. Infrastructure Debt Funds - NBFCs regulated by RBI;
iv. NBFCs, registered with RBI, Housing Finance Companies registered with National Housing Bank (NHB) and entities which have listed their shares/debentures in the stock exchanges for at least three years complying with the following criteria:
i. net worth of `500 crore; ii. track record of three years of
distributable profits; iii. having a credit rating of not less than
“AA-”; iv. having no default history or
regulatory action pending with RBI, SEBI or NHB.
In order to avoid fragmentation of the issues, the said Regulations stipulated that only a maximum of four issuances can be made under a shelf prospectus. It was also specified that companies filing a shelf prospectus with the Registrar of Companies are not required to file prospectus afresh at every stage of offer of securities, within the period of validity of such shelf prospectus. They are required to file only an information memorandum containing material updations with respect to subsequent issues.
q. SEBI (Issue of Capital and Disclosure Requirements) (Amendment) Regulations, 2014 w.e.f February 4, 2014
The aforesaid amendment to SEBI (Issue of Capital and Disclosure Requirements)
Regulations, 2009 made the IPO grading mechanism voluntary as against the earlier provision which made IPO grading mandatory.
r. SEBI {KYC(Know Your Client) Registration Agency} (Amendment) Regulations, 2014 w.e.f. March 13, 2014
Earlier, intermediaries were permitted to access the centralised KRA system in case of a client who is already KYC compliant or carry out fresh KYC process on its own. Vide the said Regulations, it was made mandatory that all intermediaries shall access the KRA system and the option to conduct KYC process on its own is done away with. Further, upon receipt of information on change in KYC details and status of the clients by the intermediary or when it comes to the knowledge of the intermediary, they are liable to upload the updated information on the system of KRA.
IX. Right to Information Act, 2005 SEBI has been implementing the various provisions of the Right to Information Act, 2005 (RTI Act) not only in letter but also in its true spirit. As per the provisions of the RTI Act, SEBI has designated a Central Public Information Officer (CPIO) at its Head Office in Mumbai. Dr. Anil Kumar Sharma is the present CPIO of the SEBI. As provided in the RTI Act, SEBI has an Official as the Appellate Authority (AA) with whom the appeal can be made against the Order of the CPIO. Shri S Raman, Whole Time Member, SEBI is the Appellate Authority.
In compliance with the direction of the Central Information Commission (CIC), SEBI has designated a Transparency Officer and Shri P. K. Nagpal, Executive Director, SEBI, is the present Transparency Officer. SEBI has also appointed 13 Central Assistant Public Information Officers (CAPIO) at its regional

222
Annual Report 2013-14
and local offices to streamline the process of attending to RTI applications for efficient and time bound response. CAPIOs receive the applications for information or appeals filed in their jurisdictions under the provisions of the RTI Act and refer the same to the CPIO.
Section 4 of the RTI Act casts obligation on every public authority to make certain disclosures on a proactive basis. SEBI has been proactively making such disclosures. The focus of the disclosure is transparency in working and functioning of SEBI. In this regard, SEBI has put in place various effective systems and procedures viz. policy decisions and reform measures taken by SEBI generally emanate through extensive consultative processes through various advisory committees. While evolving policy changes, SEBI endeavors to seek valuable comments from the investing public and the stakeholders at large though the public comments process.
The SEBI website (www.sebi.gov.in) is a veritable mine of information for investing public, stakeholders and researchers alike. Various sections of the website strive to serve specific interests. Investor Education and Awareness materials in various regional languages and Frequently Asked Questions (FAQs) on the SEBI website pertaining to different areas of the securities markets enable the investors and stakeholders to understand and acclimatize themselves with the nuances of the procedures and terminologies of the securities market for taking a well informed decision.
All the relevant Acts, SEBI regulations and various amendments from time to time are available on the SEBI website and updated from time to time. The various orders passed by SEBI in its quasi-judicial role and the orders of the Securities Appellate Tribunal (SAT) and various Courts, as well as Orders of SEBI Appellate Authority under RTI are promptly uploaded on the SEBI website.
Further, various information / statistics/ reports / discussion papers are also made available in public domain from time to time, in order to assist investors and researchers working in the area of the securities market to provide their inputs to further the vision of SEBI of promotion and development of the securities market. SEBI has also been taking various steps for ensuring the transparency in the functioning of the exchanges and other market participants. SEBI has through its various Regulations, such as the ICDR Regulations and the Insider Trading Regulations and Takeovers Regulations ensured providing maximum disclosure to the investing public in order to take well informed investment decisions. Further, the disclosure policy of SEBI requires even the non-public entities, not falling under the purview of the RTI Act, to disclose on their respective websites and otherwise, important details and updated information on the material developments and day-to-day operations including details of redressal of investor grievances. In respect of RTI applications received by SEBI which are in the nature of complaints / seeking redressal of complaints, the office of CPIO voluntary provides guidance to the information seeker. SEBI endeavors for proper and timely redressal of investor complaints for which separate designated website for the investor viz. http://investor.sebi.gov.in has been set up. Further, SEBI has also launched SCORES (SEBI Complaints Redress System), a web-based, centralized grievance redress system for the investors of the securities market where an investor can make complaint / grievances in electronic mode on the SCORES website (www.scores.gov.in) with facility for online tracking of his complaint status. SEBI has endeavored to provide the disclosable information within the stipulated time and there has not been not even a single
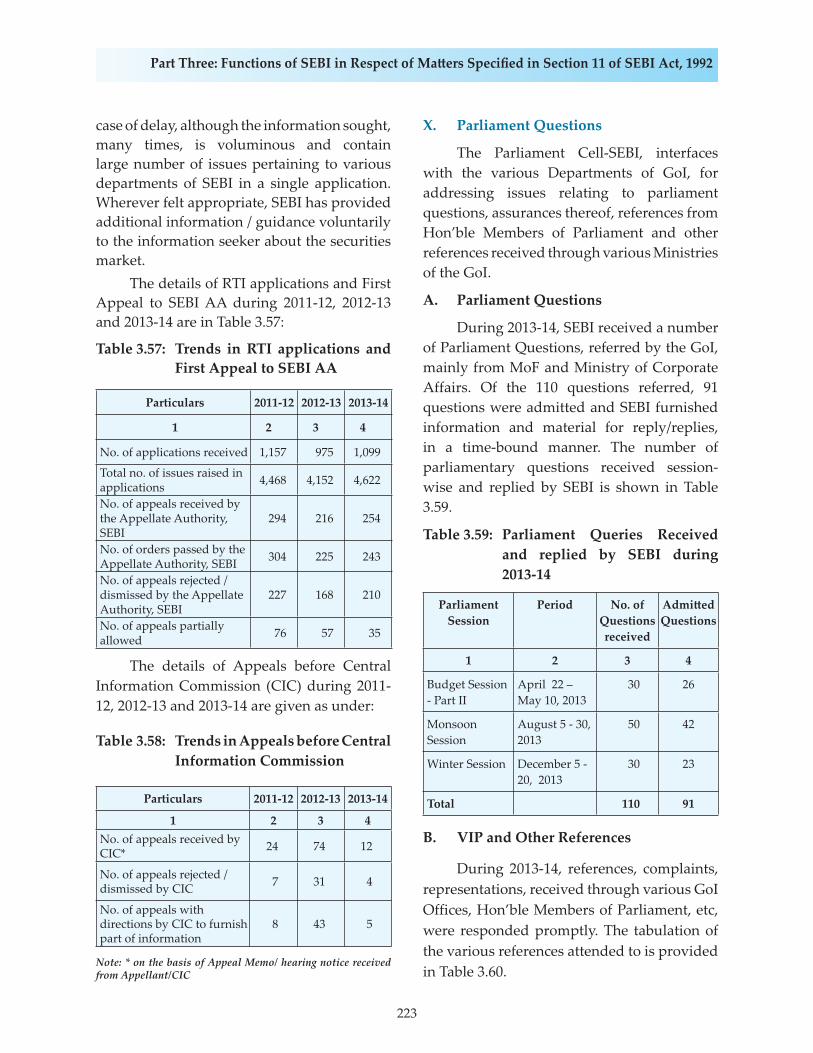
223
Part Three: Functions of SEBI in Respect of Ma� ers Specifi ed in Section 11 of SEBI Act, 1992
case of delay, although the information sought, many times, is voluminous and contain large number of issues pertaining to various departments of SEBI in a single application. Wherever felt appropriate, SEBI has provided additional information / guidance voluntarily to the information seeker about the securities market. The details of RTI applications and First Appeal to SEBI AA during 2011-12, 2012-13 and 2013-14 are in Table 3.57:
Table 3.57: Trends in RTI applications and First Appeal to SEBI AA
Particulars 2011-12 2012-13 2013-14
1 2 3 4
No. of applications received 1,157 975 1,099
Total no. of issues raised in applications 4,468 4,152 4,622
No. of appeals received by the Appellate Authority, SEBI
294 216 254
No. of orders passed by the Appellate Authority, SEBI 304 225 243
No. of appeals rejected / dismissed by the Appellate Authority, SEBI
227 168 210
No. of appeals partially allowed 76 57 35
The details of Appeals before Central Information Commission (CIC) during 2011-12, 2012-13 and 2013-14 are given as under:
Table 3.58: Trends in Appeals before Central Information Commission
Particulars 2011-12 2012-13 2013-14
1 2 3 4No. of appeals received by CIC* 24 74 12
No. of appeals rejected / dismissed by CIC 7 31 4
No. of appeals with directions by CIC to furnish part of information
8 43 5
Note: * on the basis of Appeal Memo/ hearing notice received from Appellant/CIC
X. Parliament Questions
The Parliament Cell-SEBI, interfaces with the various Departments of GoI, for addressing issues relating to parliament questions, assurances thereof, references from Hon’ble Members of Parliament and other references received through various Ministries of the GoI.
A. Parliament Questions
During 2013-14, SEBI received a number of Parliament Questions, referred by the GoI, mainly from MoF and Ministry of Corporate Affairs. Of the 110 questions referred, 91 questions were admitted and SEBI furnished information and material for reply/replies, in a time-bound manner. The number of parliamentary questions received session-wise and replied by SEBI is shown in Table 3.59.
Table 3.59: Parliament Queries Received and replied by SEBI during 2013-14
Parliament Session
Period No. of Questions received
Admi� ed Questions
1 2 3 4
Budget Session - Part II
April 22 – May 10, 2013
30 26
Monsoon Session
August 5 - 30, 2013
50 42
Winter Session December 5 - 20, 2013
30 23
Total 110 91
B. VIP and Other References
During 2013-14, references, complaints, representations, received through various GoI Offices, Hon’ble Members of Parliament, etc, were responded promptly. The tabulation of the various references attended to is provided in Table 3.60.

224
Annual Report 2013-14
Table 3.60: Data on Various References Received and Responded to during 2013-14
References No.
1 2
VIP (MP) References 7
General References/representations 31
Newspaper/magazine articles related to Securities Market
6
C. Responses/ Materials to Committees
During 2013-14, SEBI provided the required information and clarifications as desired by Parliamentary Committees/High Powered Committees in a time bound manner. In 2013-14, 54 points/questions were raised on Securities Laws Amendment Bill, 2013.
XI. International Co-Operation
In the financial year 2013-14, SEBI continued to actively engage and contribute to the ongoing works in the international arena. Along with contributing towards the substantive projects and issues, the past year saw SEBI play a pivotal role in many areas: at the bilateral, Asia-Pacific regional and international levels.
SEBI continued to play a key role at the various meetings and committees of the IOSCO and, thus, strengthened its position in the global space. Amongst other significant work streams, SEBI also actively engaged in co-operation on investigation / enforcement/ supervisory matters with other overseas regulators under the framework of mutual collaboration provided under the IOSCO Multilateral Memorandum of Understanding (MMoU) and several bilateral MoUs.
In addition, SEBI continued to make a meaningful contribution as a member of the leading international bodies and fora, such
as the Financial Stability Board (FSB), the international body that has been mandated by the G20 to promote implementation of financial sector regulatory reforms in the world, and the Joint Forum (JF), a co-operative cross-sector group established in 1996 to deal with issues common to the banking, securities and insurance sectors, including the regulation of financial conglomerates.
As a part of its other varying commitments as the securities market regulator, SEBI on several occasions, provided inputs to the Government of India on international issues/ treaties and financial sector dialogues, hosted and organized visits of foreign delegates, international seminars and training programs.
A. Association with IOSCO
a. IOSCO Board The IOSCO Board, the governing body of the IOSCO, is made up of 32 securities regulators and SEBI is one of the members of the IOSCO Board. SEBI participates in the various work streams of IOSCO and makes contributions to the policy decisions on different issues pertaining to the securities market. SEBI has its representations in six out of the eight Policy Committees of IOSCO. SEBI endeavors to implement the recommendations made by IOSCO through its reports.
b. Assessment Committee
SEBI plays a leadership role in the IOSCO’s Assessment Committee (AC) and is currently the Vice-Chair of this Committee. The AC has been formed in February 2012 to drive IOSCO’s key strategic goal of being the recognized standard setter for securities regulation. The main objectives of AC are to identify and assess implementation of IOSCO Principles and Standards and to promote the full, effective and consistent implementation of IOSCO Principles and Standards across the IOSCO membership. The main responsibilities
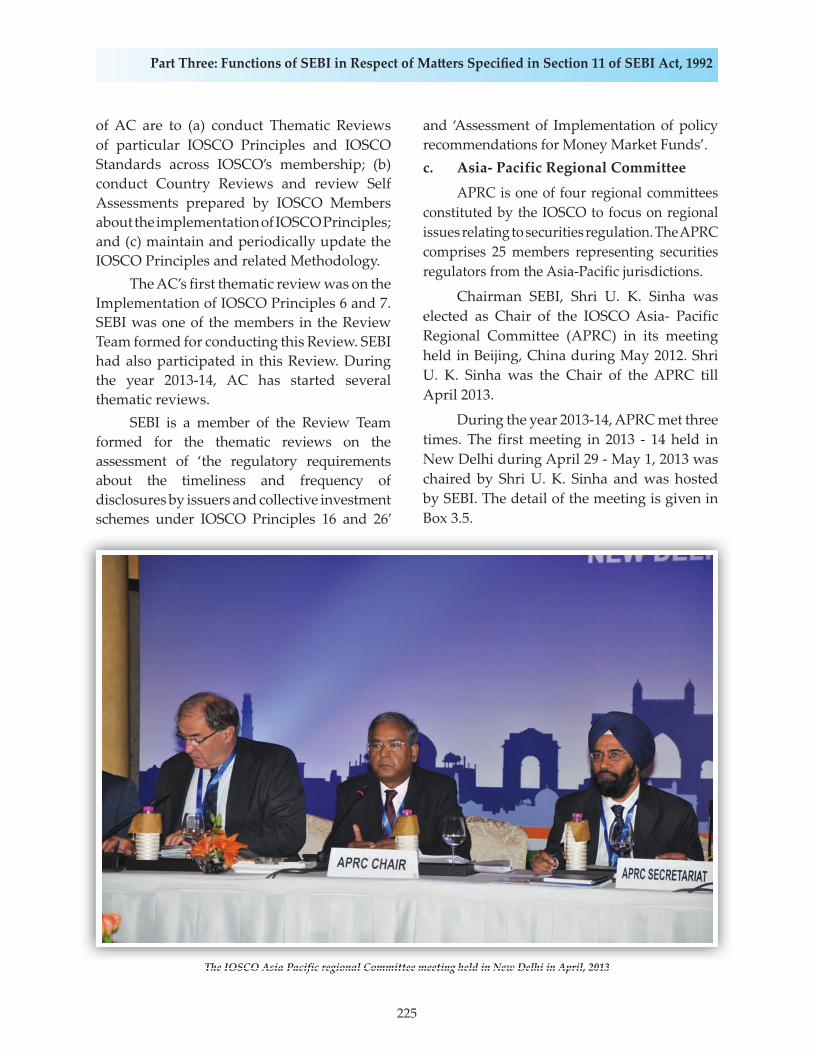
225
Part Three: Functions of SEBI in Respect of Ma� ers Specifi ed in Section 11 of SEBI Act, 1992
of AC are to (a) conduct Thematic Reviews of particular IOSCO Principles and IOSCO Standards across IOSCO’s membership; (b) conduct Country Reviews and review Self Assessments prepared by IOSCO Members about the implementation of IOSCO Principles; and (c) maintain and periodically update the IOSCO Principles and related Methodology. The AC’s first thematic review was on the Implementation of IOSCO Principles 6 and 7. SEBI was one of the members in the Review Team formed for conducting this Review. SEBI had also participated in this Review. During the year 2013-14, AC has started several thematic reviews. SEBI is a member of the Review Team formed for the thematic reviews on the assessment of ‘the regulatory requirements about the timeliness and frequency of disclosures by issuers and collective investment schemes under IOSCO Principles 16 and 26’
and ‘Assessment of Implementation of policy recommendations for Money Market Funds’. c. Asia- Pacific Regional Committee
APRC is one of four regional committees constituted by the IOSCO to focus on regional issues relating to securities regulation. The APRC comprises 25 members representing securities regulators from the Asia-Pacific jurisdictions.
Chairman SEBI, Shri U. K. Sinha was elected as Chair of the IOSCO Asia- Pacific Regional Committee (APRC) in its meeting held in Beijing, China during May 2012. Shri U. K. Sinha was the Chair of the APRC till April 2013.
During the year 2013-14, APRC met three times. The first meeting in 2013 - 14 held in New Delhi during April 29 - May 1, 2013 was chaired by Shri U. K. Sinha and was hosted by SEBI. The detail of the meeting is given in Box 3.5.
The IOSCO Asia Pacific regional Committee meeting held in New Delhi in April, 2013The IOSCO Asia Pacific regional Committee meeting held in New Delhi in April 2013
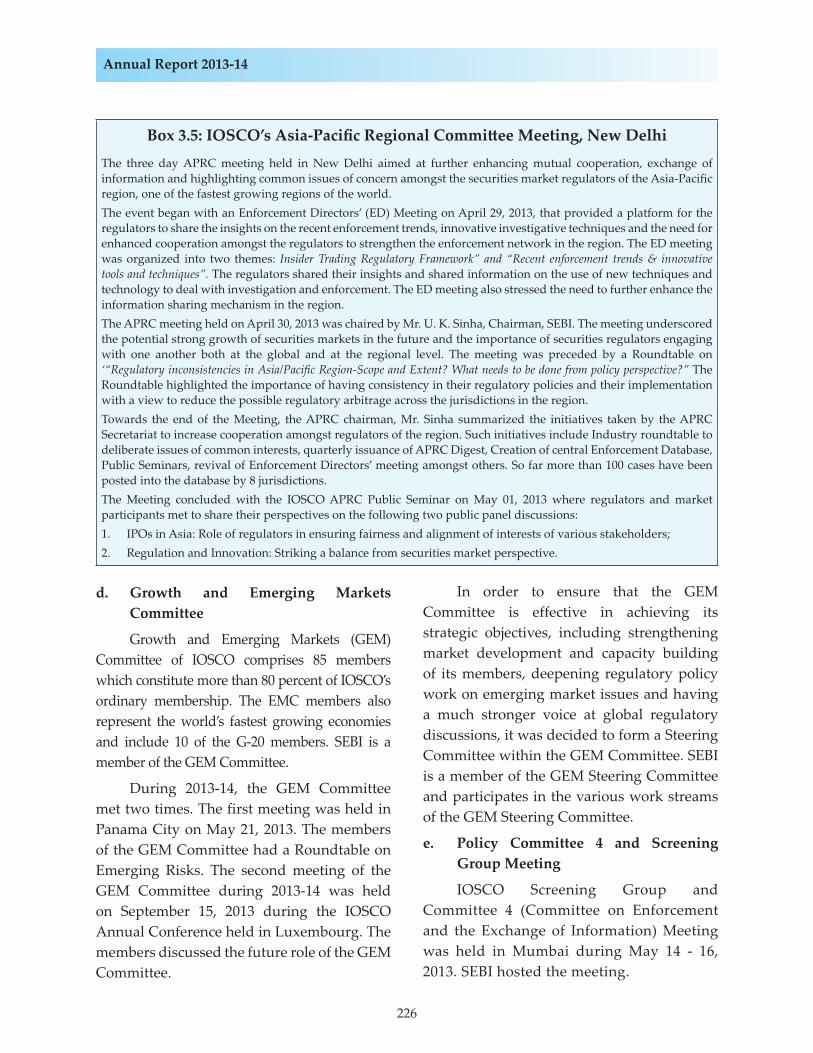
226
Annual Report 2013-14
Box 3.5: IOSCO’s Asia-Pacifi c Regional Commi� ee Meeting, New DelhiThe three day APRC meeting held in New Delhi aimed at further enhancing mutual cooperation, exchange of information and highlighting common issues of concern amongst the securities market regulators of the Asia-Pacifi c region, one of the fastest growing regions of the world.The event began with an Enforcement Directors’ (ED) Meeting on April 29, 2013, that provided a platform for the regulators to share the insights on the recent enforcement trends, innovative investigative techniques and the need for enhanced cooperation amongst the regulators to strengthen the enforcement network in the region. The ED meeting was organized into two themes: Insider Trading Regulatory Framework” and “Recent enforcement trends & innovative tools and techniques”. The regulators shared their insights and shared information on the use of new techniques and technology to deal with investigation and enforcement. The ED meeting also stressed the need to further enhance the information sharing mechanism in the region.The APRC meeting held on April 30, 2013 was chaired by Mr. U. K. Sinha, Chairman, SEBI. The meeting underscored the potential strong growth of securities markets in the future and the importance of securities regulators engaging with one another both at the global and at the regional level. The meeting was preceded by a Roundtable on ‘“Regulatory inconsistencies in Asia/Pacifi c Region-Scope and Extent? What needs to be done from policy perspective?” The Roundtable highlighted the importance of having consistency in their regulatory policies and their implementation with a view to reduce the possible regulatory arbitrage across the jurisdictions in the region.Towards the end of the Meeting, the APRC chairman, Mr. Sinha summarized the initiatives taken by the APRC Secretariat to increase cooperation amongst regulators of the region. Such initiatives include Industry roundtable to deliberate issues of common interests, quarterly issuance of APRC Digest, Creation of central Enforcement Database, Public Seminars, revival of Enforcement Directors’ meeting amongst others. So far more than 100 cases have been posted into the database by 8 jurisdictions.The Meeting concluded with the IOSCO APRC Public Seminar on May 01, 2013 where regulators and market participants met to share their perspectives on the following two public panel discussions:1. IPOs in Asia: Role of regulators in ensuring fairness and alignment of interests of various stakeholders; 2. Regulation and Innovation: Striking a balance from securities market perspective.
d. Growth and Emerging Markets Committee
Growth and Emerging Markets (GEM) Committee of IOSCO comprises 85 members which constitute more than 80 percent of IOSCO’s ordinary membership. The EMC members also represent the world’s fastest growing economies and include 10 of the G-20 members. SEBI is a member of the GEM Committee.
During 2013-14, the GEM Committee met two times. The first meeting was held in Panama City on May 21, 2013. The members of the GEM Committee had a Roundtable on Emerging Risks. The second meeting of the GEM Committee during 2013-14 was held on September 15, 2013 during the IOSCO Annual Conference held in Luxembourg. The members discussed the future role of the GEM Committee.
In order to ensure that the GEM Committee is effective in achieving its strategic objectives, including strengthening market development and capacity building of its members, deepening regulatory policy work on emerging market issues and having a much stronger voice at global regulatory discussions, it was decided to form a Steering Committee within the GEM Committee. SEBI is a member of the GEM Steering Committee and participates in the various work streams of the GEM Steering Committee.
e. Policy Committee 4 and Screening Group Meeting
IOSCO Screening Group and Committee 4 (Committee on Enforcement and the Exchange of Information) Meeting was held in Mumbai during May 14 - 16, 2013. SEBI hosted the meeting.
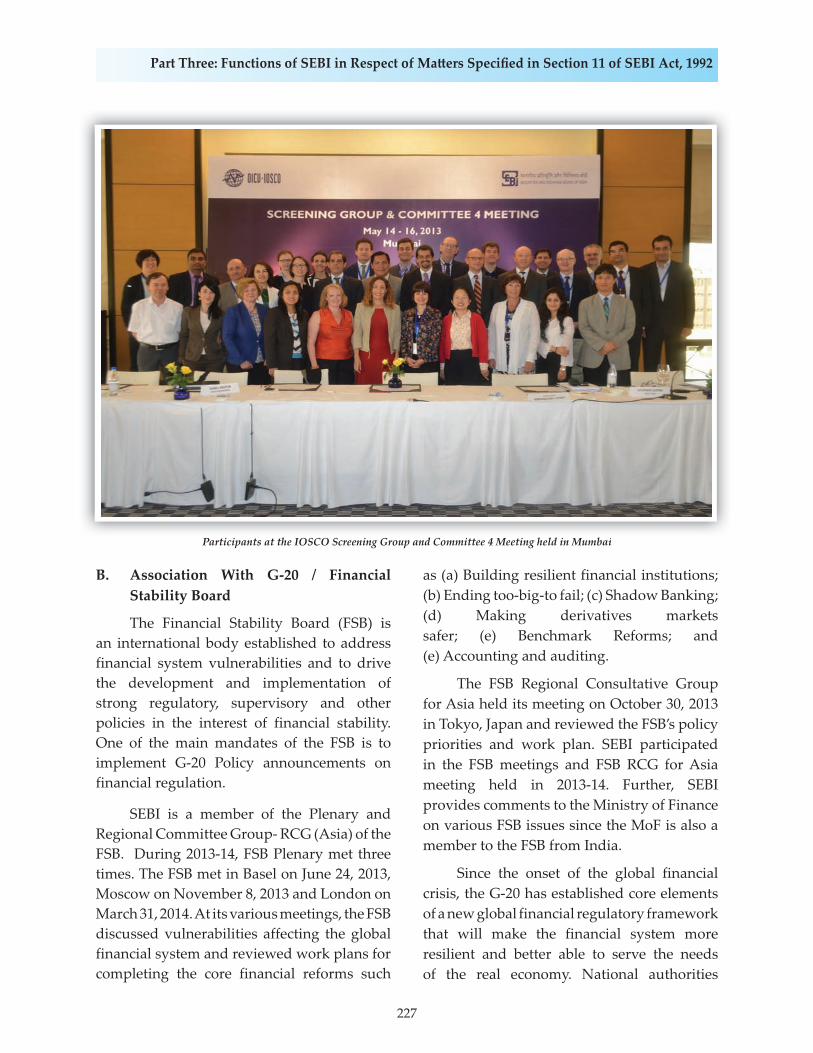
227
Part Three: Functions of SEBI in Respect of Ma� ers Specifi ed in Section 11 of SEBI Act, 1992
Participants at the IOSCO Screening Group and Committee 4 Meeting held in Mumbai
B. Association With G-20 / Financial Stability Board
The Financial Stability Board (FSB) is an international body established to address financial system vulnerabilities and to drive the development and implementation of strong regulatory, supervisory and other policies in the interest of financial stability. One of the main mandates of the FSB is to implement G-20 Policy announcements on financial regulation.
SEBI is a member of the Plenary and Regional Committee Group- RCG (Asia) of the FSB. During 2013-14, FSB Plenary met three times. The FSB met in Basel on June 24, 2013, Moscow on November 8, 2013 and London on March 31, 2014. At its various meetings, the FSB discussed vulnerabilities affecting the global financial system and reviewed work plans for completing the core financial reforms such
as (a) Building resilient financial institutions; (b) Ending too-big-to fail; (c) Shadow Banking; (d) Making derivatives markets safer; (e) Benchmark Reforms; and (e) Accounting and auditing.
The FSB Regional Consultative Group for Asia held its meeting on October 30, 2013 in Tokyo, Japan and reviewed the FSB’s policy priorities and work plan. SEBI participated in the FSB meetings and FSB RCG for Asia meeting held in 2013-14. Further, SEBI provides comments to the Ministry of Finance on various FSB issues since the MoF is also a member to the FSB from India.
Since the onset of the global financial crisis, the G-20 has established core elements of a new global financial regulatory framework that will make the financial system more resilient and better able to serve the needs of the real economy. National authorities
Participants at the IOSCO Screening Group and Committee 4 Meeting held in Mumbai
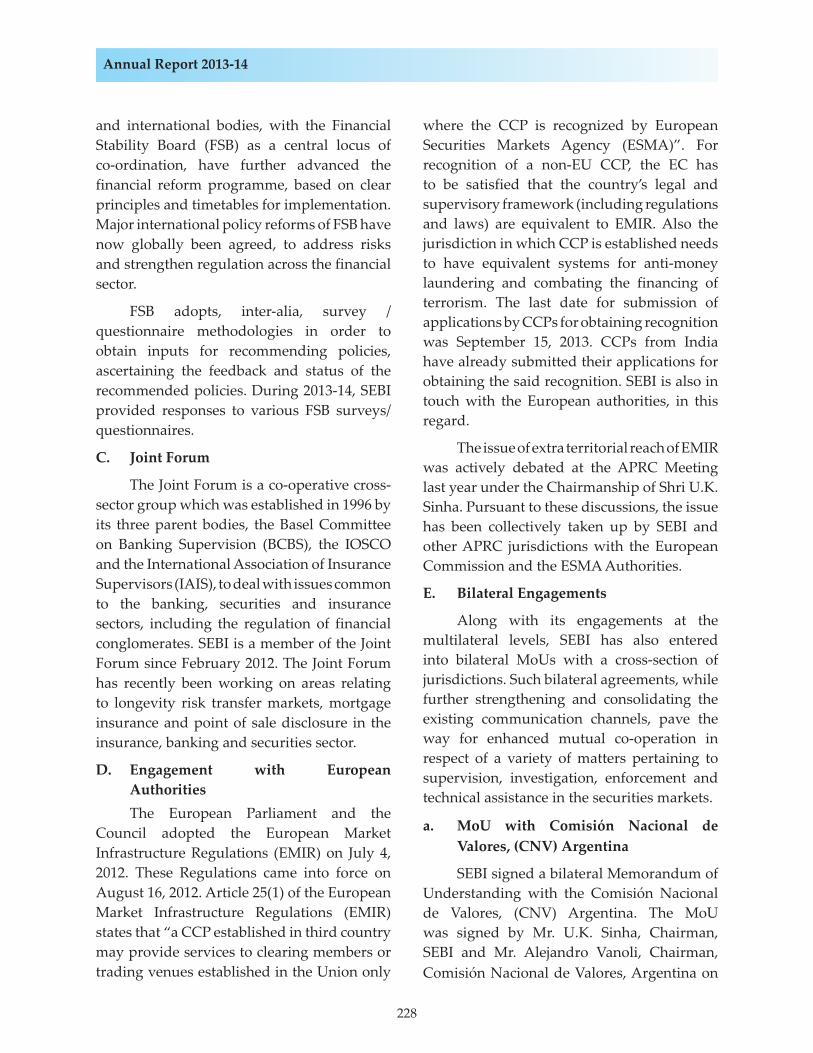
228
Annual Report 2013-14
and international bodies, with the Financial Stability Board (FSB) as a central locus of co-ordination, have further advanced the financial reform programme, based on clear principles and timetables for implementation. Major international policy reforms of FSB have now globally been agreed, to address risks and strengthen regulation across the financial sector.
FSB adopts, inter-alia, survey /questionnaire methodologies in order to obtain inputs for recommending policies, ascertaining the feedback and status of the recommended policies. During 2013-14, SEBI provided responses to various FSB surveys/questionnaires.
C. Joint Forum
The Joint Forum is a co-operative cross-sector group which was established in 1996 by its three parent bodies, the Basel Committee on Banking Supervision (BCBS), the IOSCO and the International Association of Insurance Supervisors (IAIS), to deal with issues common to the banking, securities and insurance sectors, including the regulation of financial conglomerates. SEBI is a member of the Joint Forum since February 2012. The Joint Forum has recently been working on areas relating to longevity risk transfer markets, mortgage insurance and point of sale disclosure in the insurance, banking and securities sector.
D. Engagement with European Authorities
The European Parliament and the Council adopted the European Market Infrastructure Regulations (EMIR) on July 4, 2012. These Regulations came into force on August 16, 2012. Article 25(1) of the European Market Infrastructure Regulations (EMIR) states that “a CCP established in third country may provide services to clearing members or trading venues established in the Union only
where the CCP is recognized by European Securities Markets Agency (ESMA)”. For recognition of a non-EU CCP, the EC has to be satisfied that the country’s legal and supervisory framework (including regulations and laws) are equivalent to EMIR. Also the jurisdiction in which CCP is established needs to have equivalent systems for anti-money laundering and combating the financing of terrorism. The last date for submission of applications by CCPs for obtaining recognition was September 15, 2013. CCPs from India have already submitted their applications for obtaining the said recognition. SEBI is also in touch with the European authorities, in this regard.
The issue of extra territorial reach of EMIR was actively debated at the APRC Meeting last year under the Chairmanship of Shri U.K. Sinha. Pursuant to these discussions, the issue has been collectively taken up by SEBI and other APRC jurisdictions with the European Commission and the ESMA Authorities.
E. Bilateral Engagements
Along with its engagements at the multilateral levels, SEBI has also entered into bilateral MoUs with a cross-section of jurisdictions. Such bilateral agreements, while further strengthening and consolidating the existing communication channels, pave the way for enhanced mutual co-operation in respect of a variety of matters pertaining to supervision, investigation, enforcement and technical assistance in the securities markets.
a. MoU with Comisión Nacional de Valores, (CNV) Argentina
SEBI signed a bilateral Memorandum of Understanding with the Comisión Nacional de Valores, (CNV) Argentina. The MoU was signed by Mr. U.K. Sinha, Chairman, SEBI and Mr. Alejandro Vanoli, Chairman, Comisión Nacional de Valores, Argentina on
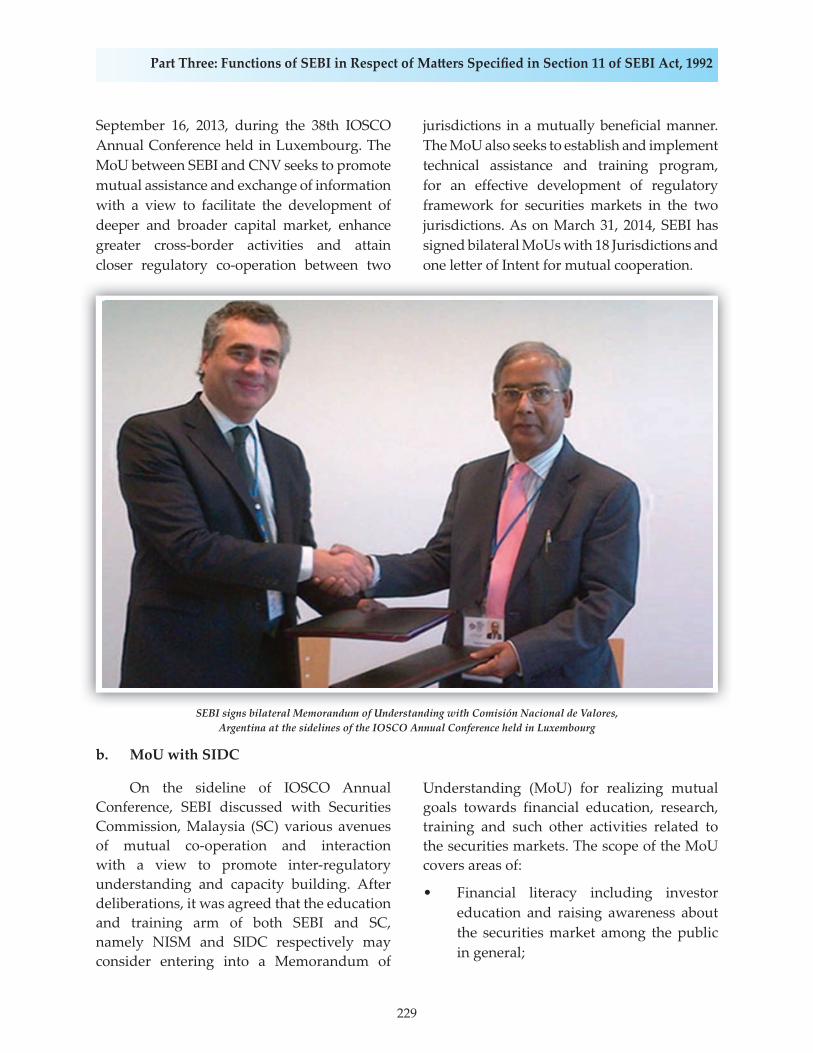
229
Part Three: Functions of SEBI in Respect of Ma� ers Specifi ed in Section 11 of SEBI Act, 1992
September 16, 2013, during the 38th IOSCO Annual Conference held in Luxembourg. The MoU between SEBI and CNV seeks to promote mutual assistance and exchange of information with a view to facilitate the development of deeper and broader capital market, enhance greater cross-border activities and attain closer regulatory co-operation between two
jurisdictions in a mutually beneficial manner. The MoU also seeks to establish and implement technical assistance and training program, for an effective development of regulatory framework for securities markets in the two jurisdictions. As on March 31, 2014, SEBI has signed bilateral MoUs with 18 Jurisdictions and one letter of Intent for mutual cooperation.
SEBI signs bilateral Memorandum of Understanding with Comisión Nacional de Valores, Argentina at the sidelines of the IOSCO Annual Conference held in Luxembourg
b. MoU with SIDC
On the sideline of IOSCO Annual Conference, SEBI discussed with Securities Commission, Malaysia (SC) various avenues of mutual co-operation and interaction with a view to promote inter-regulatory understanding and capacity building. After deliberations, it was agreed that the education and training arm of both SEBI and SC, namely NISM and SIDC respectively may consider entering into a Memorandum of
Understanding (MoU) for realizing mutual goals towards financial education, research, training and such other activities related to the securities markets. The scope of the MoU covers areas of:
• Financial literacy including investor education and raising awareness about the securities market among the public in general;
SEBI signs bilateral Memorandum of Understanding with Comisión Nacional de Valores
230
Annual Report 2013-14
• Assisting intermediaries to impart necessary skills to their staff through various programs, including workshops, webcasts, conferences and seminars;
• Designing and conducting examinations / certifications for staff of intermediaries
• Training staff of regulators on various aspects of policy, regulation, supervision, inspection and any other area of securities or financial market regulatory processes;
• Conducting focused and specialized training and joint educational programs on request from each other or on third party referrals;
• Fostering corporate governance through workshops, conferences, seminars for raising awareness and standards of market integrity; consultancy pertaining to the securities markets and the financial sector for staff of regulators,
policy-makers and such other bodies and research in topics pertaining to the securities markets and the financial sector, and their publication through monographs, reports, papers etc.
F. Conference on Investor Protection in Capital Markets
SEBI, jointly with German Federal Financial Supervisory Authority (BaFin) and Deutsche Gessellschaft Fuer Internationale Zusammenarbeit (GIZ) GmbH, had organised a regional conference on the topic of “Investor Protection in Capital Markets” during October 28-29, 2013 at Mumbai.
The Regional Conference was attended by approximately 175 participants (including participants from stock exchanges, depositories, mutual funds, stock brokers, merchant bankers, corporate representatives etc.) and included around 50-60 international participants from Germany, China, Japan, Indonesia, Vietnam, Hong Kong, Sri Lanka, Maldives, Italy and Mongolia (Box 3.6).
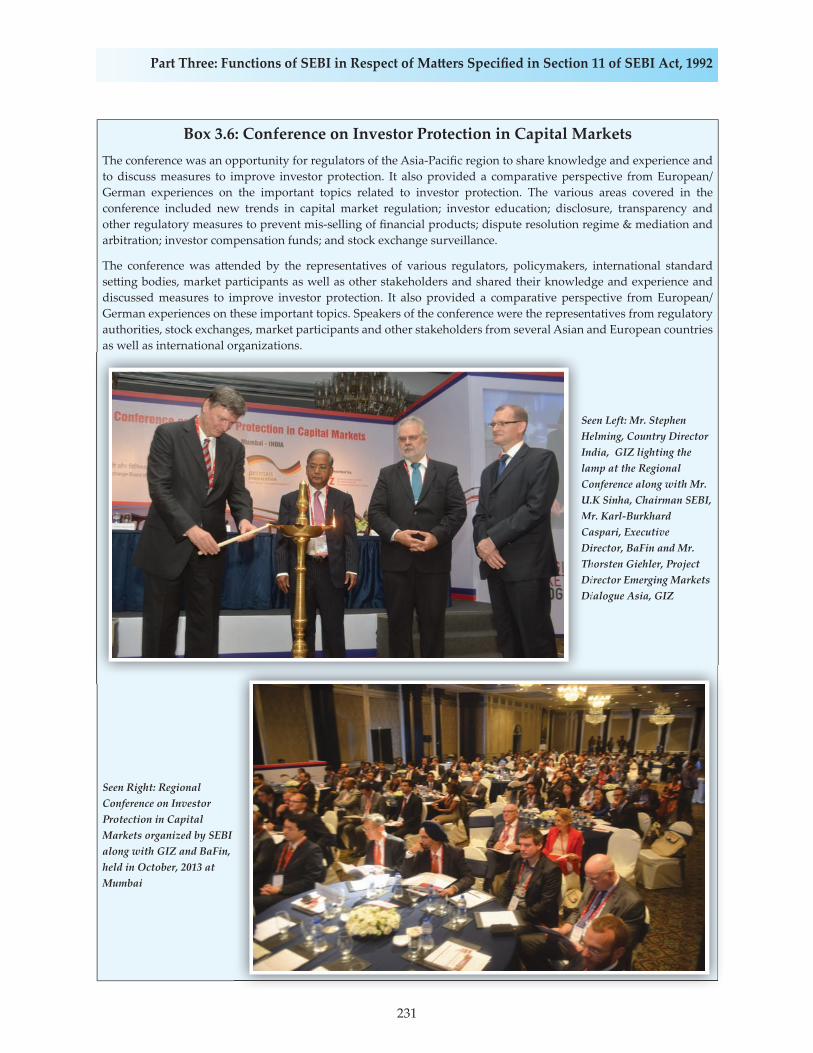
231
Part Three: Functions of SEBI in Respect of Ma� ers Specifi ed in Section 11 of SEBI Act, 1992
Box 3.6: Conference on Investor Protection in Capital MarketsThe conference was an opportunity for regulators of the Asia-Pacifi c region to share knowledge and experience and to discuss measures to improve investor protection. It also provided a comparative perspective from European/German experiences on the important topics related to investor protection. The various areas covered in the conference included new trends in capital market regulation; investor education; disclosure, transparency and other regulatory measures to prevent mis-selling of fi nancial products; dispute resolution regime & mediation and arbitration; investor compensation funds; and stock exchange surveillance.
The conference was a� ended by the representatives of various regulators, policymakers, international standard se� ing bodies, market participants as well as other stakeholders and shared their knowledge and experience and discussed measures to improve investor protection. It also provided a comparative perspective from European/German experiences on these important topics. Speakers of the conference were the representatives from regulatory authorities, stock exchanges, market participants and other stakeholders from several Asian and European countries as well as international organizations.
Seen Left: Mr. Stephen Helming, Country Director India, GIZ lighting the lamp at the Regional Conference along with Mr. U.K Sinha, Chairman SEBI, Mr. Karl-Burkhard Caspari, Executive Director, BaFin and Mr. Thorsten Giehler, Project Director Emerging Markets Dialogue Asia, GIZ
Seen Right: Regional Conference on Investor Protection in Capital Markets organized by SEBI along with GIZ and BaFin, held in October, 2013 at Mumbai
g
SeHeInlamCoU.MCaDiThDiDi
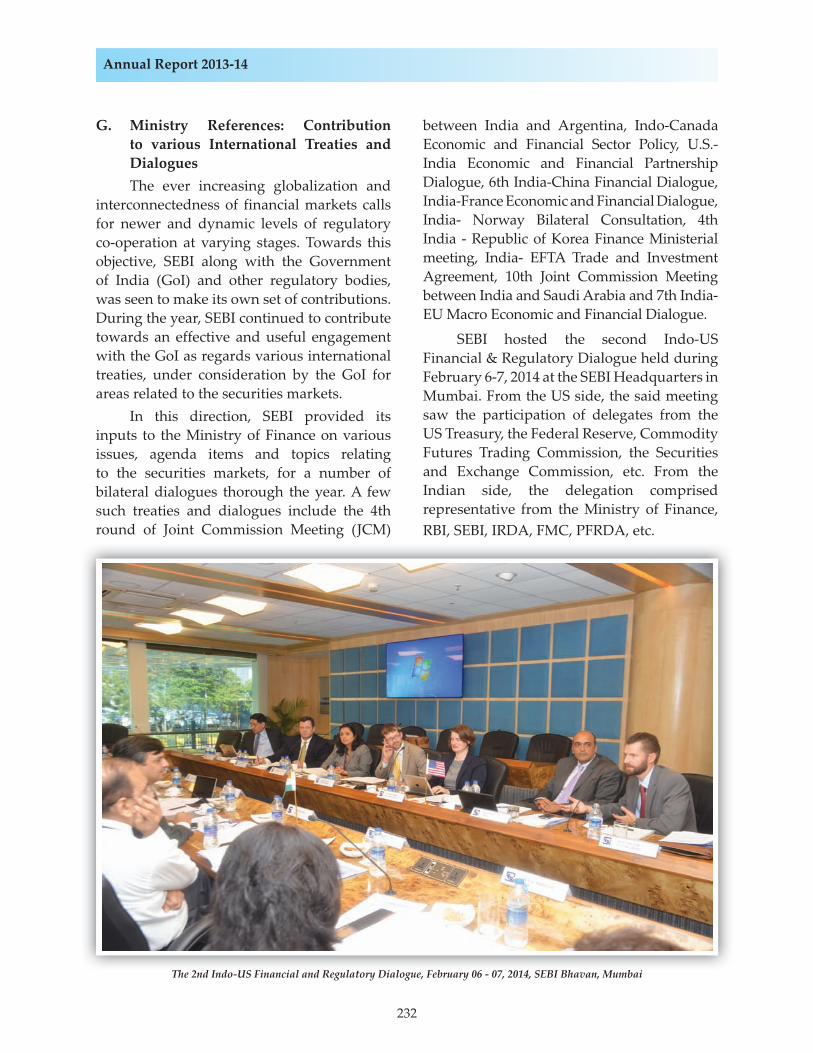
232
Annual Report 2013-14
G. Ministry References: Contribution to various International Treaties and Dialogues
The ever increasing globalization and interconnectedness of financial markets calls for newer and dynamic levels of regulatory co-operation at varying stages. Towards this objective, SEBI along with the Government of India (GoI) and other regulatory bodies, was seen to make its own set of contributions. During the year, SEBI continued to contribute towards an effective and useful engagement with the GoI as regards various international treaties, under consideration by the GoI for areas related to the securities markets. In this direction, SEBI provided its inputs to the Ministry of Finance on various issues, agenda items and topics relating to the securities markets, for a number of bilateral dialogues thorough the year. A few such treaties and dialogues include the 4th round of Joint Commission Meeting (JCM)
between India and Argentina, Indo-Canada Economic and Financial Sector Policy, U.S.-India Economic and Financial Partnership Dialogue, 6th India-China Financial Dialogue, India-France Economic and Financial Dialogue, India- Norway Bilateral Consultation, 4th India - Republic of Korea Finance Ministerial meeting, India- EFTA Trade and Investment Agreement, 10th Joint Commission Meeting between India and Saudi Arabia and 7th India-EU Macro Economic and Financial Dialogue.
SEBI hosted the second Indo-US Financial & Regulatory Dialogue held during February 6-7, 2014 at the SEBI Headquarters in Mumbai. From the US side, the said meeting saw the participation of delegates from the US Treasury, the Federal Reserve, Commodity Futures Trading Commission, the Securities and Exchange Commission, etc. From the Indian side, the delegation comprised representative from the Ministry of Finance, RBI, SEBI, IRDA, FMC, PFRDA, etc.
The 2nd Indo-US Financial and Regulatory Dialogue, February 06 - 07, 2014, SEBI Bhavan, Mumbai The 2nd Indo-US Financial and Regulatory Dialogue, February 06 - 07, 2014, SEBI Bhavan, Mumbai
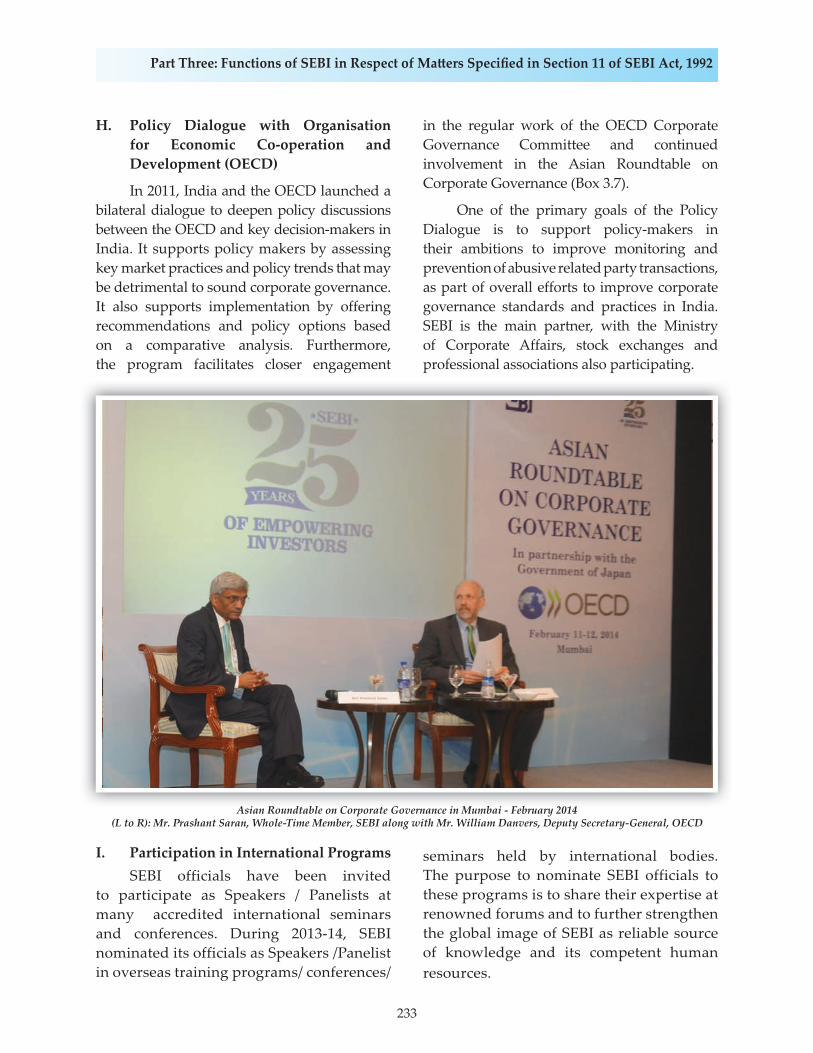
233
Part Three: Functions of SEBI in Respect of Ma� ers Specifi ed in Section 11 of SEBI Act, 1992
H. Policy Dialogue with Organisation for Economic Co-operation and Development (OECD)
In 2011, India and the OECD launched a bilateral dialogue to deepen policy discussions between the OECD and key decision-makers in India. It supports policy makers by assessing key market practices and policy trends that may be detrimental to sound corporate governance. It also supports implementation by offering recommendations and policy options based on a comparative analysis. Furthermore, the program facilitates closer engagement
in the regular work of the OECD Corporate Governance Committee and continued involvement in the Asian Roundtable on Corporate Governance (Box 3.7).
One of the primary goals of the Policy Dialogue is to support policy-makers in their ambitions to improve monitoring and prevention of abusive related party transactions, as part of overall efforts to improve corporate governance standards and practices in India. SEBI is the main partner, with the Ministry of Corporate Affairs, stock exchanges and professional associations also participating.
Asian Roundtable on Corporate Governance in Mumbai - February 2014(L to R): Mr. Prashant Saran, Whole-Time Member, SEBI along with Mr. William Danvers, Deputy Secretary-General, OECD
I. Participation in International ProgramsSEBI officials have been invited
to participate as Speakers / Panelists at many accredited international seminars and conferences. During 2013-14, SEBI nominated its officials as Speakers /Panelist in overseas training programs/ conferences/
seminars held by international bodies. The purpose to nominate SEBI officials to these programs is to share their expertise at renowned forums and to further strengthen the global image of SEBI as reliable source of knowledge and its competent human resources.
Asian Roundtable on Corporate Governance in Mumbai - February 2014
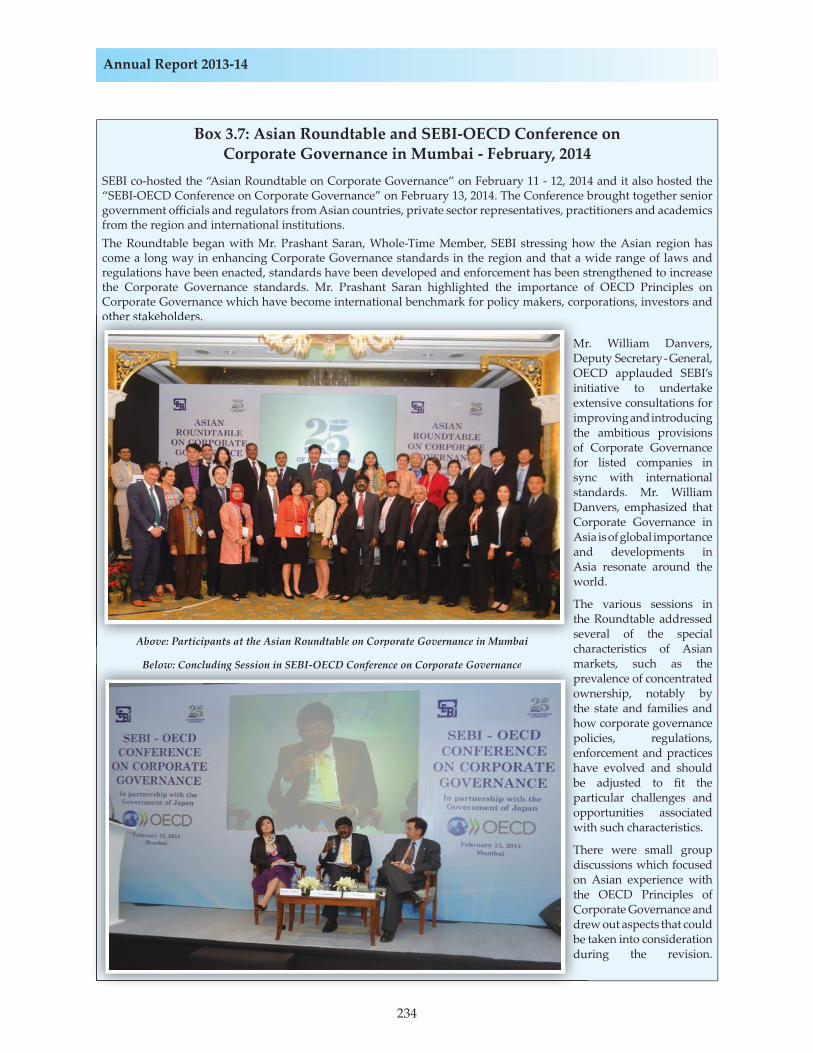
234
Annual Report 2013-14
Box 3.7: Asian Roundtable and SEBI-OECD Conference on Corporate Governance in Mumbai - February, 2014
SEBI co-hosted the “Asian Roundtable on Corporate Governance” on February 11 - 12, 2014 and it also hosted the “SEBI-OECD Conference on Corporate Governance” on February 13, 2014. The Conference brought together senior government offi cials and regulators from Asian countries, private sector representatives, practitioners and academics from the region and international institutions.The Roundtable began with Mr. Prashant Saran, Whole-Time Member, SEBI stressing how the Asian region has come a long way in enhancing Corporate Governance standards in the region and that a wide range of laws and regulations have been enacted, standards have been developed and enforcement has been strengthened to increase the Corporate Governance standards. Mr. Prashant Saran highlighted the importance of OECD Principles on Corporate Governance which have become international benchmark for policy makers, corporations, investors and other stakeholders.
Mr. William Danvers, Deputy Secretary - General, OECD applauded SEBI’s initiative to undertake extensive consultations for improving and introducing the ambitious provisions of Corporate Governance for listed companies in sync with international standards. Mr. William Danvers, emphasized that Corporate Governance in Asia is of global importance and developments in Asia resonate around the world.
The various sessions in the Roundtable addressed several of the special characteristics of Asian markets, such as the prevalence of concentrated ownership, notably by the state and families and how corporate governance policies, regulations, enforcement and practices have evolved and should be adjusted to fi t the particular challenges and opportunities associated with such characteristics.
There were small group discussions which focused on Asian experience with the OECD Principles of Corporate Governance and drew out aspects that could be taken into consideration during the revision.
Above: Participants at the Asian Roundtable on Corporate Governance in Mumbai
Below: Concluding Session in SEBI-OECD Conference on Corporate Governance
other stakeholders.
MrDeOEiniextimtheof forsynstaDaCoAsandAswo
ThthesevhAbove: Participants at the Asian Roundtable on Corporate Governance in Mumbai
mapreowthehowpolenfhavbe paroppwit
Thedison theCodrebe du
Below: Concluding Session in SEBI-OECD Conference on Corporate Governance
235
Part Three: Functions of SEBI in Respect of Ma� ers Specifi ed in Section 11 of SEBI Act, 1992
The SEBI-OECD Conference on Corporate Governance began with discussions on global institutional investor landscape as most OECD countries have witnessed a signifi cant rise in the institutional ownership of publicly listed companies along with the more traditional institutional investors, such as pension funds and investment funds. The various sessions in the Conference concentrated on the business model of the Institutional Investors in India which determines their quality of ownership engagement in the companies along with further issues pertaining to adequacy of information, fundamental incentives for Institutional Investors to make active and informed decisions. The Conference concluded with Mr. S. Ravindran, Executive Director, SEBI stressing SEBI’s commitment to further enhance the Corporate Governance standards in the country and how SEBI has borrowed from the OECD Principles on Corporate Governance and adapted the same to suit Indian scenario.
J. MMoU Requests
As a crucial part of its commitment towards the IOSCO Multilateral Memorandum of Understanding Concerning Consultation and Co-operation and the Exchange of Information (MMoU), to which SEBI has been a signatory since April 2003, SEBI provides co-operation and facilitates exchange of information with its counterparts in other jurisdictions.
During 2013-14, SEBI received a total of 94 requests for information from the overseas securities regulators seeking SEBI’s assistance. SEBI addressed and executed such requests, subject to the provisions of the MMoU. Similarly, 17 such requests were made by SEBI to the counterpart regulatory bodies of other jurisdictions. The Table 3.61 highlights the past trends of Regulatory Assistance made and received by SEBI over the last 3 years.
Table 3.61: Trends of Regulatory Assistance made and received by SEBI
Type of References 2011-12 2012-13 2013- 14
1 2 3 4
Requests Received by SEBI from Foreign Authorities
37 40 94
Requests Made by SEBI 9 9 17
K. Foreign delegations / Dignitaries to SEBI
To promote mutual collaboration and establish deeper levels of regulatory co-operation, and to facilitate a better understanding of the Indian securities markets, SEBI played host to a number of important dignitaries and delegations of overseas regulatory bodies / agencies.
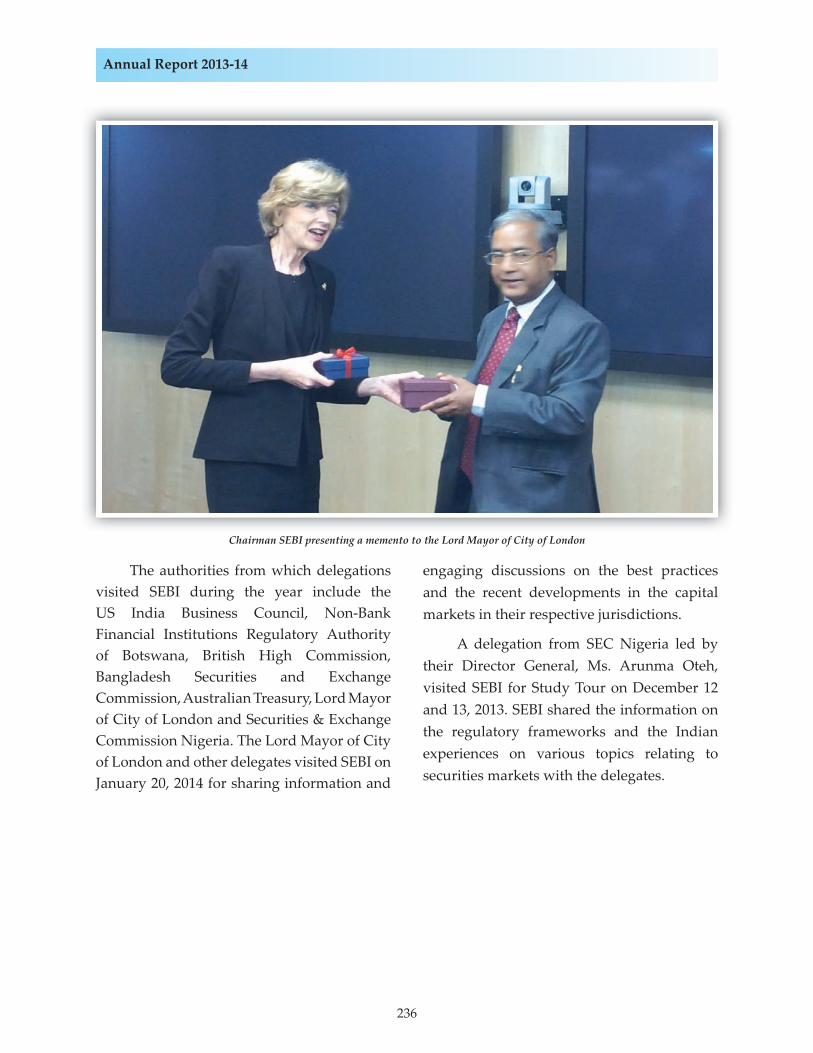
236
Annual Report 2013-14
Chairman SEBI presenting a memento to the Lord Mayor of City of London
engaging discussions on the best practices and the recent developments in the capital markets in their respective jurisdictions.
A delegation from SEC Nigeria led by their Director General, Ms. Arunma Oteh, visited SEBI for Study Tour on December 12 and 13, 2013. SEBI shared the information on the regulatory frameworks and the Indian experiences on various topics relating to securities markets with the delegates.
The authorities from which delegations visited SEBI during the year include the US India Business Council, Non-Bank Financial Institutions Regulatory Authority of Botswana, British High Commission, Bangladesh Securities and Exchange Commission, Australian Treasury, Lord Mayor of City of London and Securities & Exchange Commission Nigeria. The Lord Mayor of City of London and other delegates visited SEBI on January 20, 2014 for sharing information and
Chairman SEBI presenting a memento to the Lord Mayor of City of London
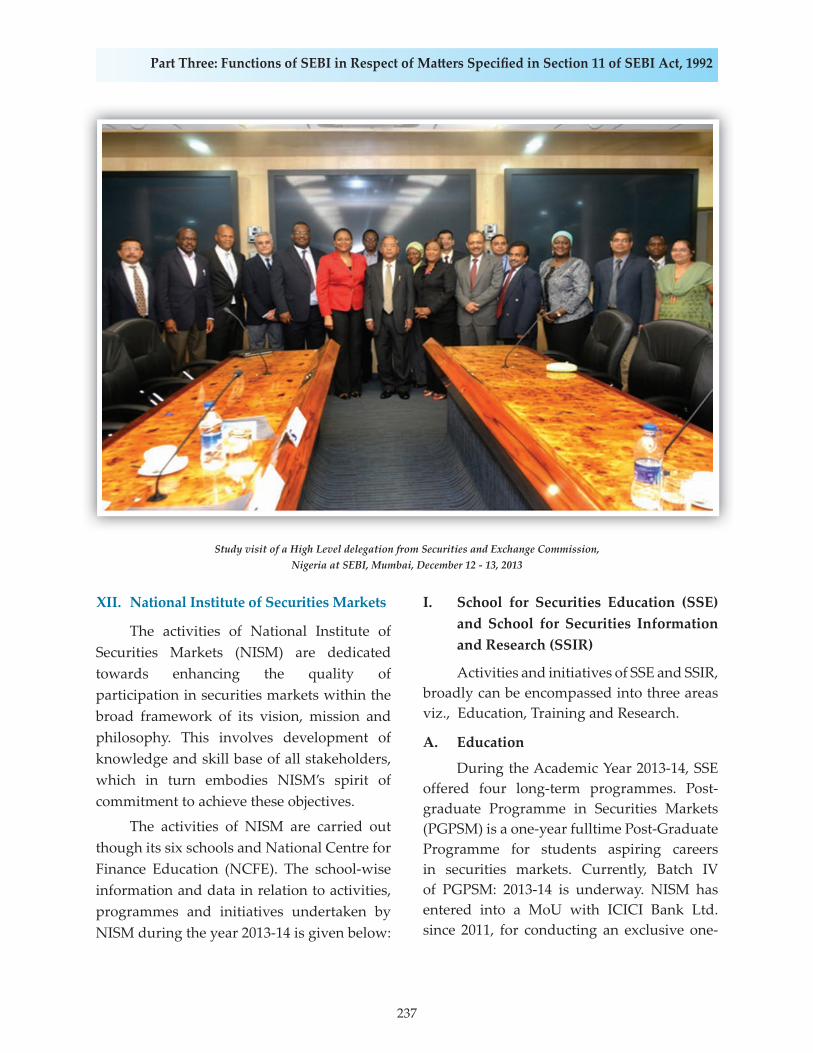
237
Part Three: Functions of SEBI in Respect of Ma� ers Specifi ed in Section 11 of SEBI Act, 1992
XII. National Institute of Securities Markets
The activities of National Institute of Securities Markets (NISM) are dedicated towards enhancing the quality of participation in securities markets within the broad framework of its vision, mission and philosophy. This involves development of knowledge and skill base of all stakeholders, which in turn embodies NISM’s spirit of commitment to achieve these objectives.
The activities of NISM are carried out though its six schools and National Centre for Finance Education (NCFE). The school-wise information and data in relation to activities, programmes and initiatives undertaken by NISM during the year 2013-14 is given below:
I. School for Securities Education (SSE) and School for Securities Information and Research (SSIR)
Activities and initiatives of SSE and SSIR, broadly can be encompassed into three areas viz., Education, Training and Research.
A. Education
During the Academic Year 2013-14, SSE offered four long-term programmes. Post-graduate Programme in Securities Markets (PGPSM) is a one-year fulltime Post-Graduate Programme for students aspiring careers in securities markets. Currently, Batch IV of PGPSM: 2013-14 is underway. NISM has entered into a MoU with ICICI Bank Ltd. since 2011, for conducting an exclusive one-
Study visit of a High Level delegation from Securities and Exchange Commission, Nigeria at SEBI, Mumbai, December 12 - 13, 2013
238
Annual Report 2013-14
year fulltime programme, Post-Graduate Certificate in Securities Market (PGCSM), for applicants seeking various roles in ICICI Group. NISM has successfully completed two batches of PGCSM.
Certificate in Financial Engineering and Risk Management (CFERM) is offered over weekends spread over nine months and also on contact modules format which is spread over a year’s time. Currently, Batch V are undergoing their academic sessions. CFERM is benchmarked with the best content and is listed in the International Association of Financial Engineers (IAFE) site and has also been appreciated by the Public Pension Authority of Saudi Arabia. CFERM is now a recognized qualification for the Certificate in International Investment Analyst (CIIA) programme of ACIIA, Switzerland. Certificate in Securities Law (CSL) offered as a part-time programme for working executives, across 26 Saturdays.
NISM had received recognition as a Research Centre for PhD studies, by the Symbiosis International University, Pune. In order to enrich the education processes, NISM entered into a number of collaborative relationships with the following national and international organizations viz. ICSI; National Academy of Direct Taxes, Nagpur; Indian Corporate Law Service Academy, Manesar; CFA Institute, USA; Chartered Institute of Securities and Investment, UK.
B. Training
SSE carved out six training programmes from various subjects being taught in the various long-term programmes of SSE. The training programmes benefited over 200 professionals and included Behavioural Finance for Principal Retirement Solutions, Financial Derivatives and Risk Management for SBI Societe Generale Global Securities,
training on Securities Markets for 66th Batch of IRS from NADT and Indian Corporate Law Officers (ICLS). Pursuant to an MoU signed with ICSI for undertaking various initiatives for capacity building in securities markets, NISM conducted two training programmes for ICSI members viz., Securities Law Documentation and Compliance with Listing Agreement.
C. Research
Research activities carried out in Academic Year 2013-14 included publication of research papers and project research.
Research papers: During 2013-14, a number of Research papers were published by NISM faculty during the year in international journals and presented in national and international conferences. A few of them are listed below:
a. “Factors Affecting the SMILE Effect and Implied Volatility in the Context of Option Pricing Models” presented at the Actuarial & Financial Mathematics Conference, is published by the Royal Flemish Academy of Belgium for Science & Arts;
b. “Affine and Modular Option Pricing: An Integration of Stochastic Factors Affecting Option Prices”, published in Journal of Financial and Economic Practices, (Springer, Fall 2013);
c. Outstanding Paper Presentation award for “An Unified Risk Management Framework for Option Valuation: A Fourier Transform Approach” presented at International Mathematical Finance Conference 2014, at Bradley University, USA;
d. A paper titled “Structure of the Indian Corporate Bond Market: A Post 2005 View” was published in the Jan-June 2013 issue of International Economics and
239
Part Three: Functions of SEBI in Respect of Ma� ers Specifi ed in Section 11 of SEBI Act, 1992
Finance Journal (IEFJ), a peer-reviewed publication, Peking University;
e. “Reference Price Effect in Indian Mergers & Acquisitions” presented at the Indian Econometric Society Conference at IGIDR, Mumbai;
f. “Can Business Groups Survive with Institutional Development: Theory and Evidence” presented in India Finance Conference and Emerging Markets Finance Conference;
g. “Economic Shocks, Fund Flows and Market Returns” presented at the NYU NSE Indian Capital Market Conference at Mumbai.
Project Research
In order to influence policy and practice, NISM faculty engaged in the following research projects:
a. The Study on Arbitration Mechanism in Stock Exchanges and Depositories submitted to SEBI;
b. Associated with SEBI for organising the First International Research Conference with SEBI on Algorithmic Trading, High Frequency Trading and Co-Location in January 27-28, 2014.
II. School for Regulatory Studies and Supervision (SRSS)
During year 2013-14, NISM conducted 12 training programmes/workshops in addition to three one-day talks arranged for officers of SEBI. Training programmes for 149 man-days were conducted for the benefit of 639 participants. Apart from the various induction programmes, training was also provided to SEBI officers on overview of securities market, International Financial Reporting Standards and Macro Economic Review. In addition,
training on Compliance of SEBI Regulations was provided for officers of banks and a workshop was conducted for Mutual Fund Trustees and Independent Directors.
NISM also organised various lectures for the benefit of middle and senior officers of SEBI during the year. This included “Program on Risk Management: International Perspective,” by Prof Richard Flavel, a renowned international risk management expert; “Talk on Designing the Future Perfect”, by Prof Tyrone Pitsis of Newcastle University Business School, UK; and “Talk on Integrity at Work”, by Prof. Kevin Moore, Director with Chartered Institute of Securities and Investment.
III. School for Investor Education and Financial Literacy (SIEFL)
A. Refresher Workshop for SEBI Financial Education Resource Persons
During the year 2013-14, NISM organised two Review Workshops covering 69 SEBI Financial Education Resource Persons at Bengaluru and New Delhi.
B. Investor Education Sessions
During the year, NISM organised investor education / careers in securities markets sessions at 25 management/academic institutions/colleges.
IV. School of Certification of Intermediaries (SCI)
The School for Certification of Intermediaries (SCI) set up at NISM is involved in developing certification examinations for professionals employed in various segments of the Indian securities markets. These examinations are being developed by NISM as mandated under SEBI (Certification of Associated Persons in the Securities Markets) Regulation, 2007.
240
Annual Report 2013-14
V. School for Corporate Governance (SCG)
NISM has entered into an MoU with ICSI for undertaking various activities in capacity building for securities markets. One of the initiatives in this regard is to organise conference on ‘Ethics and Corporate Governance’ at strategic centres. During the year, four conferences were organised at Mumbai, Delhi, Chennai and Kolkata in association with ICSI. The deliberations at these conferences focused on three aspects of the topic – Ethics and Corporate Governance viz. Regulatory Perspective, Practitioners’ Perspective and Academic Perspective. Senior functionaries from the industry spoke on these occasions. VI. National Centre for Finance Education
(NCFE): Activities during 2013-14
A. NCFE – National Financial Literacy Assessment Test (NCFE-NFLAT)
NCFE invited all school students in India, from classes VIII to X to participate in the NFLAT, a first of its kind national level assessment to measure the financial literacy quotient in a range of concepts like inflation, compounding, basic money management, banking, insurance, pension, etc. The response was overwhelming with around 1,00,000 plus students and 2,000 schools registering from all over the country. The test was conducted in partnership with IBPS over two days, 11th and 12th January, 2014. Results of the test were declared on 23rd January 2014.
B. NCFE – Financial Literacy and Inclusion Survey (NCFE-FLIS)
As a very first step towards improving financial literacy and inclusion in India, a nation-wide baseline survey with a sample
size of 75,000 people covering all the states and UTs of India is being carried out through a survey agency, for assessing the state of financial inclusion and financial literacy.
C. Financial Education through school curriculum
The Core Committee for implementation of NSFE now has representation from NCERT and both the major education boards in India, CBSE and ICSE. The boards have been actively and regularly participating in the discussions of the Core Committee. NCERT has already developed supplementary material on Personal Finance for school students.
NISM has been in continuous dialogue with NCERT to facilitate the inclusion of the financial literacy material as a part of the compulsory syllabus. It has proposed to introduce the concepts of finance in an integral manner in their school curriculum from Class VI to X. To facilitate this process, NISM has formally approached NCERT and MHRD to get representation in the National Curriculum Framework Committee that is due to be constituted in 2014 and as apprised by NCERT efforts are on for taking this matter forward.
NCFE – Financial Education Website (NCFE-FEW)
The NCFE website (www.ncfeindia.org) was recently inaugurated by Dr. K C Chakrabarty, Chairman, Technical Group on Financial Inclusion and Financial Literacy of the Sub-Committee of the FSDC and Deputy Governor, RBI. Currently, the website is being enriched to be developed into a one stop repository for all the financial education material and actions.
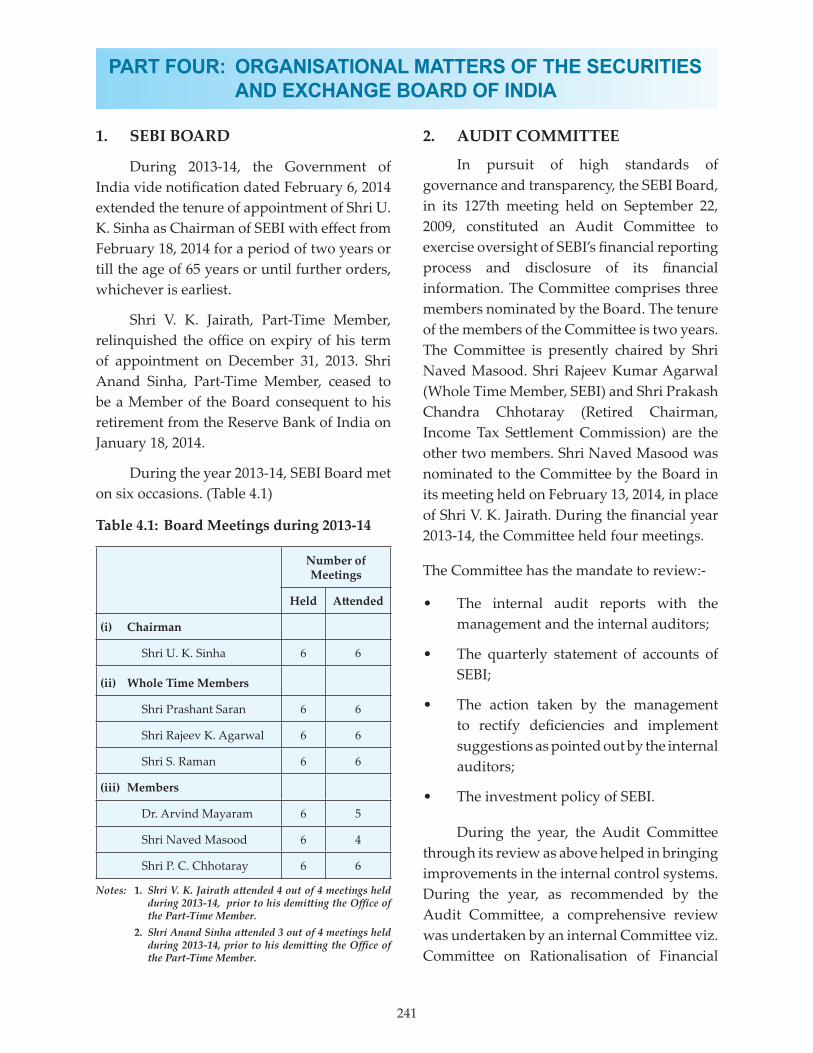
PART FOUR: ORGANISATIONAL MATTERS OF THE SECURITIES AND EXCHANGE BOARD OF INDIA
1. SEBI BOARD
During 2013-14, the Government of India vide notifi cation dated February 6, 2014 extended the tenure of appointment of Shri U. K. Sinha as Chairman of SEBI with eff ect from February 18, 2014 for a period of two years or till the age of 65 years or until further orders, whichever is earliest.
Shri V. K. Jairath, Part-Time Member, relinquished the offi ce on expiry of his term of appointment on December 31, 2013. Shri Anand Sinha, Part-Time Member, ceased to be a Member of the Board consequent to his retirement from the Reserve Bank of India on January 18, 2014.
During the year 2013-14, SEBI Board met on six occasions. (Table 4.1)
Table 4.1: Board Meetings during 2013-14
Number of Meetings
Held A� ended
(i) Chairman
Shri U. K. Sinha 6 6
(ii) Whole Time Members
Shri Prashant Saran 6 6
Shri Rajeev K. Agarwal 6 6
Shri S. Raman 6 6
(iii) Members
Dr. Arvind Mayaram 6 5
Shri Naved Masood 6 4
Shri P. C. Chhotaray 6 6
Notes: 1. Shri V. K. Jairath a� ended 4 out of 4 meetings held during 2013-14, prior to his demi� ing the Offi ce of the Part-Time Member.
2. Shri Anand Sinha a� ended 3 out of 4 meetings held during 2013-14, prior to his demi� ing the Offi ce of the Part-Time Member.
2. AUDIT COMMITTEE
In pursuit of high standards of governance and transparency, the SEBI Board, in its 127th meeting held on September 22, 2009, constituted an Audit Commi� ee to exercise oversight of SEBI’s fi nancial reporting process and disclosure of its fi nancial information. The Commi� ee comprises three members nominated by the Board. The tenure of the members of the Commi� ee is two years. The Commi� ee is presently chaired by Shri Naved Masood. Shri Rajeev Kumar Agarwal (Whole Time Member, SEBI) and Shri Prakash Chandra Chhotaray (Retired Chairman, Income Tax Se� lement Commission) are the other two members. Shri Naved Masood was nominated to the Commi� ee by the Board in its meeting held on February 13, 2014, in place of Shri V. K. Jairath. During the fi nancial year 2013-14, the Commi� ee held four meetings.
The Commi� ee has the mandate to review:-
• The internal audit reports with the management and the internal auditors;
• The quarterly statement of accounts of SEBI;
• The action taken by the management to rectify defi ciencies and implement suggestions as pointed out by the internal auditors;
• The investment policy of SEBI.
During the year, the Audit Commi� ee through its review as above helped in bringing improvements in the internal control systems. During the year, as recommended by the Audit Commi� ee, a comprehensive review was undertaken by an internal Commi� ee viz. Commi� ee on Rationalisation of Financial
241
242
Annual Report 2013-14
Resources (CRFR) of SEBI, for augmentation and rationalization of the fi nancial resources. CRFR was constituted for rationalization of fi nancial resources with following terms of reference:
• To examine the present revenue sources and suggest measures for harmonization of resources in line with the evolving market structure; and
• To review the expenditure so as to align with the thrust areas and growing organisational and regulatory needs.
The Commi� ee has submi� ed its Report to the Board in its meeting held on March 20, 2014.
During the year, the Audit Commi� ee has reviewed and discussed the annual statement of accounts of SEBI for the year 2013-14 with the management of SEBI and internal auditors. Relying on the review and discussions conducted with the management and internal auditors, the Audit Commi� ee believes that SEBI’s annual statements of accounts are fairly presented in conformity with the Generally Accepted Accounting Principles (GAAPs) in all material aspects. The Commi� ee also reviewed the internal control systems put in place and expressed its satisfaction with the same. The members of the Commi� ee discussed among themselves, without the management or the internal auditors being present, the information disclosed in the Annual Statement of Accounts. The Commi� ee fulfi lled its responsibilities in compliance with its charter.
3. ORGANISATIONAL RESTRUCTURING CELL AND PROJECT MANAGEMENT OFFICE
SEBI had engaged an independent consultant to revisit the structural and organisational issues, re-prioritize areas of focus and to look at the technological and
manpower needs of SEBI. The SEBI Board thereby approved engagement of an external consultant, M/s Oliver Wyman, to study and make appropriate recommendations in the areas of:
• Identifi cation of areas of focus for regulatory oversight;
• Developing a best suited organisational structure;
• Defi ning a new human resource model;
• Identifi cation of technological needs and resources;
• Development of a mechanism to share regulation and oversight with SROs.
Based on its fi ndings, the consultant has made several recommendations. The key recommendations, included greater focus on mobilising household savings into capital market assets, enhanced focus on supervisory functions, oversight of listed companies, re-organisation of functional departments, increase in manpower, IT strategy for organisational effi ciency and improving training and performance management system. The recommendations were considered and approved by the Board in its meeting held on August 12, 2013.
A Project Management Offi ce has been set up to look a� er the implementation of the recommendations made by the consultant. The Project Management Offi ce has initiated steps to implement various action points in phased manner.
4. HUMAN RESOURCES
Human Resources Development (HRD) Division continued to play an important role with prime focus on implementation of policies on capacity-building, training, promotions, placements and transfers.
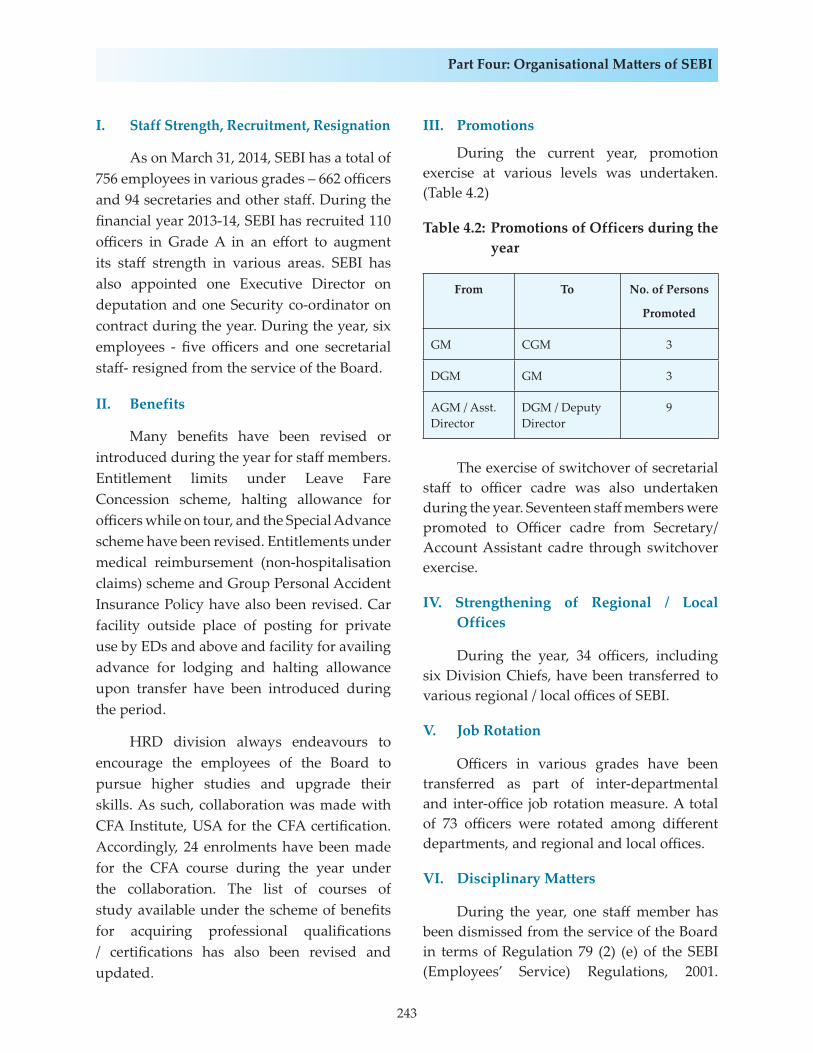
243
Part Four: Organisational Ma� ers of SEBI
I. Staff Strength, Recruitment, Resignation
As on March 31, 2014, SEBI has a total of 756 employees in various grades – 662 offi cers and 94 secretaries and other staff . During the fi nancial year 2013-14, SEBI has recruited 110 offi cers in Grade A in an eff ort to augment its staff strength in various areas. SEBI has also appointed one Executive Director on deputation and one Security co-ordinator on contract during the year. During the year, six employees - fi ve offi cers and one secretarial staff - resigned from the service of the Board.
II. Benefits
Many benefi ts have been revised or introduced during the year for staff members. Entitlement limits under Leave Fare Concession scheme, halting allowance for offi cers while on tour, and the Special Advance scheme have been revised. Entitlements under medical reimbursement (non-hospitalisation claims) scheme and Group Personal Accident Insurance Policy have also been revised. Car facility outside place of posting for private use by EDs and above and facility for availing advance for lodging and halting allowance upon transfer have been introduced during the period.
HRD division always endeavours to encourage the employees of the Board to pursue higher studies and upgrade their skills. As such, collaboration was made with CFA Institute, USA for the CFA certifi cation. Accordingly, 24 enrolments have been made for the CFA course during the year under the collaboration. The list of courses of study available under the scheme of benefi ts for acquiring professional qualifi cations / certifi cations has also been revised and updated.
III. Promotions
During the current year, promotion exercise at various levels was undertaken. (Table 4.2)
Table 4.2: Promotions of Officers during the year
From To No. of Persons
Promoted
GM CGM 3
DGM GM 3
AGM / Asst. Director
DGM / Deputy Director
9
The exercise of switchover of secretarial staff to offi cer cadre was also undertaken during the year. Seventeen staff members were promoted to Offi cer cadre from Secretary/ Account Assistant cadre through switchover exercise.
IV. Strengthening of Regional / Local Offices
During the year, 34 offi cers, including six Division Chiefs, have been transferred to various regional / local offi ces of SEBI.
V. Job Rotation
Offi cers in various grades have been transferred as part of inter-departmental and inter-offi ce job rotation measure. A total of 73 offi cers were rotated among diff erent departments, and regional and local offi ces.
VI. Disciplinary Matters
During the year, one staff member has been dismissed from the service of the Board in terms of Regulation 79 (2) (e) of the SEBI (Employees’ Service) Regulations, 2001.
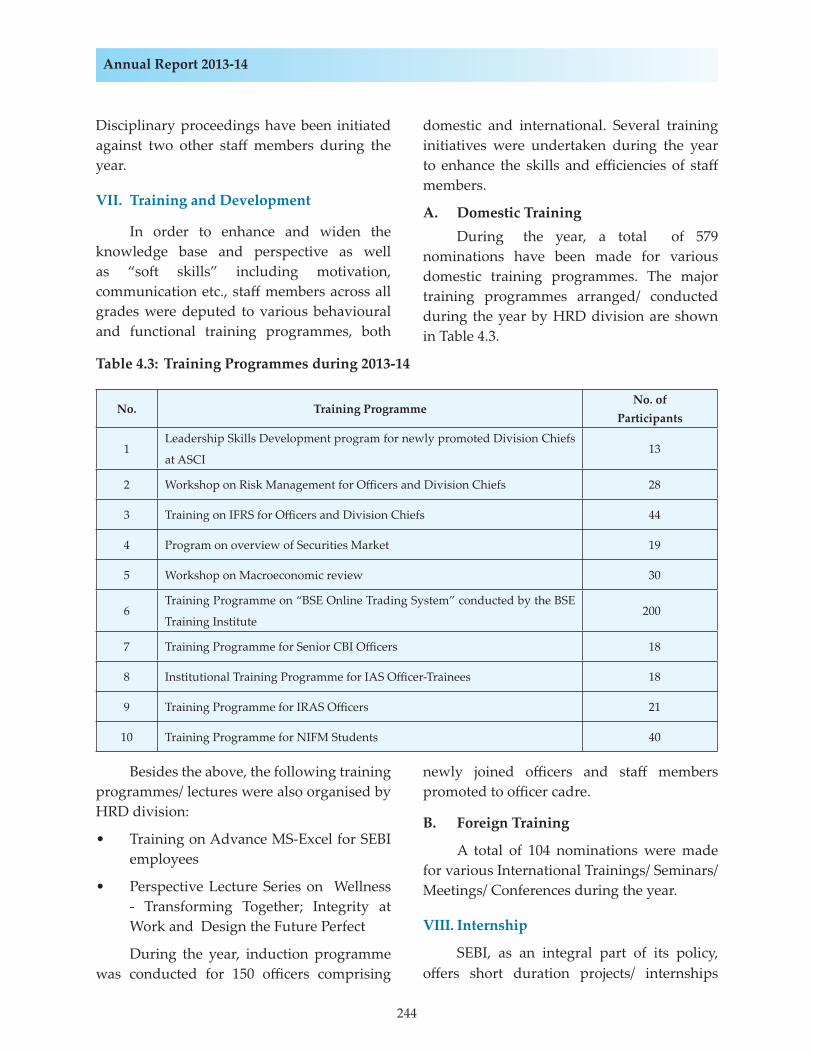
244
Annual Report 2013-14
Disciplinary proceedings have been initiated against two other staff members during the year.
VII. Training and Development
In order to enhance and widen the knowledge base and perspective as well as “so� skills” including motivation, communication etc., staff members across all grades were deputed to various behavioural and functional training programmes, both
domestic and international. Several training initiatives were undertaken during the year to enhance the skills and effi ciencies of staff members.
A. Domestic Training During the year, a total of 579 nominations have been made for various domestic training programmes. The major training programmes arranged/ conducted during the year by HRD division are shown in Table 4.3.
Table 4.3: Training Programmes during 2013-14
No. Training ProgrammeNo. of
Participants
1Leadership Skills Development program for newly promoted Division Chiefs
at ASCI13
2 Workshop on Risk Management for Offi cers and Division Chiefs 28
3 Training on IFRS for Offi cers and Division Chiefs 44
4 Program on overview of Securities Market 19
5 Workshop on Macroeconomic review 30
6Training Programme on “BSE Online Trading System” conducted by the BSE
Training Institute200
7 Training Programme for Senior CBI Offi cers 18
8 Institutional Training Programme for IAS Offi cer-Trainees 18
9 Training Programme for IRAS Offi cers 21
10 Training Programme for NIFM Students 40
Besides the above, the following training programmes/ lectures were also organised by HRD division:
• Training on Advance MS-Excel for SEBI employees
• Perspective Lecture Series on Wellness - Transforming Together; Integrity at Work and Design the Future Perfect
During the year, induction programme was conducted for 150 offi cers comprising
newly joined offi cers and staff members promoted to offi cer cadre.
B. Foreign Training
A total of 104 nominations were made for various International Trainings/ Seminars/ Meetings/ Conferences during the year.
VIII. Internship
SEBI, as an integral part of its policy, off ers short duration projects/ internships
245
Part Four: Organisational Ma� ers of SEBI
to students of reputed management and law schools. SEBI off ered internships to 32 students from such schools during the year.
IX. Extracurricular activities within SEBI
A SEBI Sports Commi� ee has been constituted that organised intra-SEBI sports tournament during the year, wherein SEBI staff members participated in games like table tennis, carom, chess and cricket. Aadhaar Card registration and Voter ID Card registration drives were organised for staff members and their families. SEBI also published its quarterly in-house magazine ‘Insider’.
X. Initiatives in the realm of corporate social responsibility
Contribution towards Prime Minister’s National Relief Fund was collected from staff members for relief eff ort for the victims of fl ood-aff ected areas in U� arakhand. A total sum of `10,98,790 was donated towards this cause.
A blood donation camp was organised by SEBI Shakti in collaboration with KEM Hospital. It received an overwhelming response from staff members with over 100 donors voluntarily giving blood. Further, mammography camp was organized in association with ‘Helping Hand’ wherein 41 ladies a� ended the camp. In its eff orts towards social service, SEBI Shakti organised a visit to the Bandra East Community Centre (BECC), which is a registered NGO looking a� er street children, senior citizens and local community and donated food items of daily use with the funds collected from SEBI colleagues.
XI. Scheme for recognizing and rewarding academic excellence of children of employees
During the fi nancial year, nine children
of employees were rewarded for academic excellence in 10th / 12th standard. They were also presented Certifi cate of Recognition by the Chairman on Republic Day.
5. PROMOTION OF OFFICIAL LANGUAGE
In order to ensure the compliance of offi cial language policy of the Government of India on implementation of offi cial language, Hindi, in the offi ces of SEBI, various eff orts were made during 2013-14:
I. Bilingualisation
During the year, various documents, viz. all notifi cations, registration certifi cates granted to various market participants, intermediaries, etc., were issued in both the languages, i.e. Hindi and English. All the papers were submi� ed before various Parliamentary Commi� ees in diglot form. Further, the reports like Annual Report, Audit Report were also issued in Hindi and English.
II. Rajbhasha Competitions
In order to encourage the staff members for the usage of Hindi in day-to-day offi cial work, various Hindi competitions were organized during the year, namely, Katha Lekhan Pratiyogita, Kavita Lekhan Pratiyogita, Lekh Pratiyogita, Rajbhasha Prachar Banner Pratiyogita, Ashubhashan Pratiyogita, Bolati Tasveer Pratiyogita, Prashno� ari Pratiyogita, Hindi Karyalayeen Kaamkaaj Pratiyogita, Hindi Tankan Pratiyogita, Varg Paheli Pratiyogita, Abhinay Pratiyogita and Kavita Pathh Pratiyogita. Staff members took part in these competitions with zeal.
III. Aaj Ka Shabd
To make the staff members conversant
246
Annual Report 2013-14
with Hindi vocabulary, one new Hindi word was displayed daily through SEBI Portal during the year.
IV. Hindi Notings and Hindi Quotes
The practice of displaying one phrase, generally used in Hindi notings, and one Hindi Quote daily through SEBI Portal for staff members of SEBI has been continued.
V. Incentive Schemes
During the year, in order to promote the use of Offi cial Language Hindi, the incentive schemes (Hindi ka Karyasadhak Gyan, Hindi Tankan /Aashulipi Gyan, Hindi Karya, Rajbhasha Shilpi, Rajbhasha Gaurav, Rajbhasha Pratishtha and Rajbhasha Shiromani) were continued. Information about such incentive schemes was also provided through Hindi workshops organised during the year.
VI. Hindi Workshops
During the year, Hindi Workshops were organised for newly recruited offi cers in the offi ces of SEBI. Thus, through these workshops, the newly recruited offi cers were made aware of various requirements relating to offi cial language policy of the Government of India, in order to enable them to ensure timely implementation of various requirements of offi cial language policy of the Government of India in their day-to-day offi cial work.
VII. Rajbhasha Meetings and Seminars
In order to ensure compliance and implementation of the offi cial language policy of the Government of India in the offi ces of the Board, meetings of the Offi cial Language Implementation Commi� ee were conducted. Accordingly, during 2013-14, various crucial decisions were taken with regard to the usage of Hindi in day-to-day offi cial work,
and follow-up actions were taken to ensure the implementation of these decisions. In addition, offi cials of the Board also took part in the Rajbhasha Seminars organised by other institutions.
VIII. Investor Website and SCORES
Eff orts are in progress to make the investor website available in Hindi and to ensure bilingualisation of SEBI Complaints Redress System (SCORES), so as to make available the investor website and the SCORES for investors in their language.
IX. Regional Offices
Eff orts are being made in the regional offi ces also towards compliance of the offi cial language policy of the Government of India, which includes meetings of the Offi cial Language Implementation Commi� ee, bilingualisation, reply in Hindi to the le� ers received in Hindi, correspondence in Hindi, etc. In addition, by way of various meetings, discussions and workshops, etc., staff members were encouraged to use the offi cial language Hindi in their day-to-day offi cial work.
Thus, during the year, besides compliance of the offi cial language policy in the regional offi ces, all possible eff orts were continued to be made towards the use of Hindi in day-to-day offi cial work.
6. LOCAL OFFICES
SEBI Board in its meeting held on March 25, 2011 had suggested SEBI to explore the scope of strengthening its regional offi ces and open local offi ces in various state capitals for the development of pan-India securities market. It was felt that physical proximity of SEBI offi ce to investors and intermediaries would promote deepening and broadening of the securities market. The proposal was approved by the Board on July 28, 2011 and
247
Part Four: Organisational Ma� ers of SEBI
the implementation of the decision to open local offi ces was done in phases, with Phase I starting from 2011-12. During 2013-14, Phase III was implemented and it was decided to open the local offi ces at the remaining state capitals not covered in Phase I and II, excluding North East. Accordingly, four new offi ces have been opened in Ranchi, Raipur, Panaji and Dehradun.
7. FACILITIES MANAGEMENT
The following initiatives were taken in 2013-14 towards expansion of infrastructure and increase in facilities management:
I. National Building Construction Corporation (NBCC) has allo� ed offi ce space and Guest House accommodation in their upcoming project at East Kidwai Nagar, New Delhi for NRO. The possession is expected in 2017.
II. State of the art conference room was furnished and made operational in SEBI Bhavan.
III. The offi ce premise at Mi� al Court was refurnished and some of the Divisions have been shi� ed to Mi� al Court offi ce premises.
IV. Local offi ces at Chandigarh, Kochi, Ranchi, Raipur and Panaji have been made operational.
8. VIGILANCE CELL
Vigilance Awareness Week for the year 2013 was observed from October 28 – November 2, 2013. The observance of the week commenced with the pledge administered by WTM to the Executive Directors and Division Chiefs, who in turn, administered the pledge to their staff . The Regional Manager located at the four regional offi ces – Northern Regional Offi ce, Eastern Regional Offi ce, Southern Regional Offi ce and Western Regional Offi ce
administered the pledge to their staff . A banner on ‘Vigilance Awareness Week’ was prominently displayed outside the offi ce premises at Mumbai and all four regional offi ces and local offi ces during the above mentioned week.
9. INFORMATION TECHNOLOGY
The major information technology (IT) initiatives during 2013-14 include completion of scanning of closed fi les, electronic workfl ow implementation.
I. Implementation of unified communication across SEBI offices and upgradation of SEBI network and security systems
Unifi ed communication systems was successfully implemented across SEBI offi ces including regional and local offi ces. Using unifi ed communication staff members posted across various SEBI offi ces can communicate through IP Phones via audio/video calling, Instant Messaging and are also able to participate in video conferencing resulting in substantial savings in inter offi ce audio/video communications. The networking equipments such as switches, routers, voice gateways, etc. which were end of life/ support were replaced with the latest and high performance equipments to cater the future computational requirements. The latest security solution such as fi rewall VPN solution with two factor authentication was implemented for secured access to SEBI online resources through the internet by staff members and other intermediaries who are authorized to access these online resources. The Two factor authentication system is integrated with the Short Message Service (SMS) gateway solution to send One Time Password (OTP) code to user mobile phones through Short Message Service (SMS).
248
Annual Report 2013-14
II. Disaster Recovery (DR) Drill
A Disaster Recovery Drill (DR Drill) was conducted successfully for mail and messaging systems.
III. Software for Investigation Department
A new so� ware system for analysing trade and order data was developed by SEBI. The system was developed with the aim of increasing the effi ciency of the investigation process at SEBI. The input data formats required by the system were standardized to enable data to be loaded in the system in an effi cient manner. The report formats were designed for all scenarios. This system has the ability to identify pa� erns, links and relationships from vast disparate data sets in a fast manner. The quality of the investigations has also improved as the system can analyse large volumes of trade and order log data running into lakh of rows in a faster and effi cient manner.
IV. Connectivity to local offices
Connectivity to various new local and regional offi ces like Bengaluru, Bhubaneswar, Goa, Guwahati, Hyderabad, Indore , Jaipur, Kochi, Patna, Dehradun, Lucknow, Chandigarh, Ranchi offi ces was established.
V. CIS Complaint System
A so� ware system for monitoring of cases for Collective Investment Department was developed in-house and installed. This system will help to maintain a central database of all
the CIS cases across all the offi ces of SEBI and help to monitor and manage them eff ectively.
VI. System for managing Resource Persons
A system for managing resource persons was developed and implemented. This system helps to eff ectively manage and make payments to resource persons providing investor education camps.
VII. Software development for Recovery Division
In light of section 28A of SEBI Act as amended by Securities Law (Amendment) Ordinance, 2013, SEBI is empowered to recover money from persons who fail to pay the penalty imposed by adjudicating offi cer or fail to comply with any direction of the Board for refund of money or fail to comply with a direction of disgorgement order or fail to pay any fees due to the Board. Recovery involves complicated procedures at each stage and needs to be monitored continuously by the division. Further, it is necessary to have a centralized exhaustive Recovery So� ware facilitating real time status of recovery proceedings. In this connection, a system is being developed for effi cient and eff ective management of information and to keep a record of all developments in recovery proceedings.
VIII. Implementation of Centralized Biometric Attendance System
A new centralized biometric system for recording a� endance across all the offi ces of SEBI was implemented.
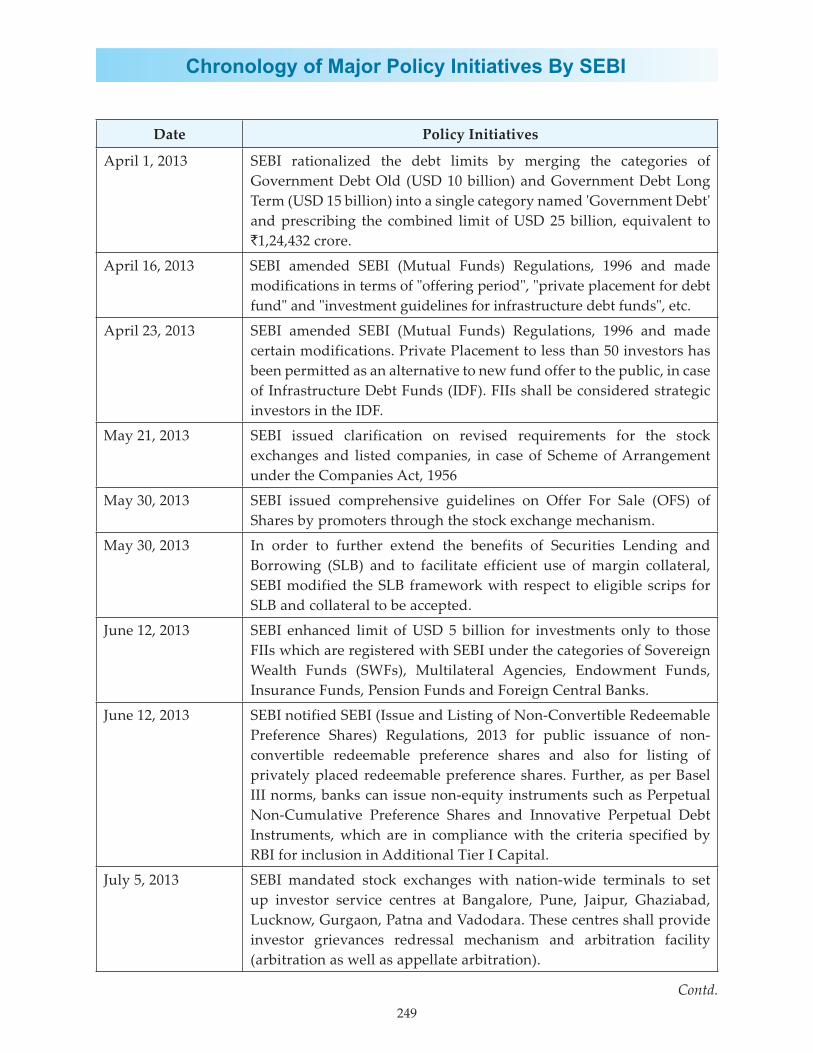
249
Chronology of Major Policy Initiatives By SEBI
Contd.
Date Policy Initiatives
April 1, 2013 SEBI rationalized the debt limits by merging the categories of Government Debt Old (USD 10 billion) and Government Debt Long Term (USD 15 billion) into a single category named 'Government Debt' and prescribing the combined limit of USD 25 billion, equivalent to `1,24,432 crore.
April 16, 2013 SEBI amended SEBI (Mutual Funds) Regulations, 1996 and made modifications in terms of "offering period", "private placement for debt fund" and "investment guidelines for infrastructure debt funds", etc.
April 23, 2013 SEBI amended SEBI (Mutual Funds) Regulations, 1996 and made certain modifications. Private Placement to less than 50 investors has been permitted as an alternative to new fund offer to the public, in case of Infrastructure Debt Funds (IDF). FIIs shall be considered strategic investors in the IDF.
May 21, 2013 SEBI issued clarification on revised requirements for the stock exchanges and listed companies, in case of Scheme of Arrangement under the Companies Act, 1956
May 30, 2013 SEBI issued comprehensive guidelines on Offer For Sale (OFS) of Shares by promoters through the stock exchange mechanism.
May 30, 2013 In order to further extend the benefits of Securities Lending and Borrowing (SLB) and to facilitate efficient use of margin collateral, SEBI modified the SLB framework with respect to eligible scrips for SLB and collateral to be accepted.
June 12, 2013 SEBI enhanced limit of USD 5 billion for investments only to those FIIs which are registered with SEBI under the categories of Sovereign Wealth Funds (SWFs), Multilateral Agencies, Endowment Funds, Insurance Funds, Pension Funds and Foreign Central Banks.
June 12, 2013 SEBI notified SEBI (Issue and Listing of Non-Convertible Redeemable Preference Shares) Regulations, 2013 for public issuance of non-convertible redeemable preference shares and also for listing of privately placed redeemable preference shares. Further, as per Basel III norms, banks can issue non-equity instruments such as Perpetual Non-Cumulative Preference Shares and Innovative Perpetual Debt Instruments, which are in compliance with the criteria specified by RBI for inclusion in Additional Tier I Capital.
July 5, 2013 SEBI mandated stock exchanges with nation-wide terminals to set up investor service centres at Bangalore, Pune, Jaipur, Ghaziabad, Lucknow, Gurgaon, Patna and Vadodara. These centres shall provide investor grievances redressal mechanism and arbitration facility (arbitration as well as appellate arbitration).
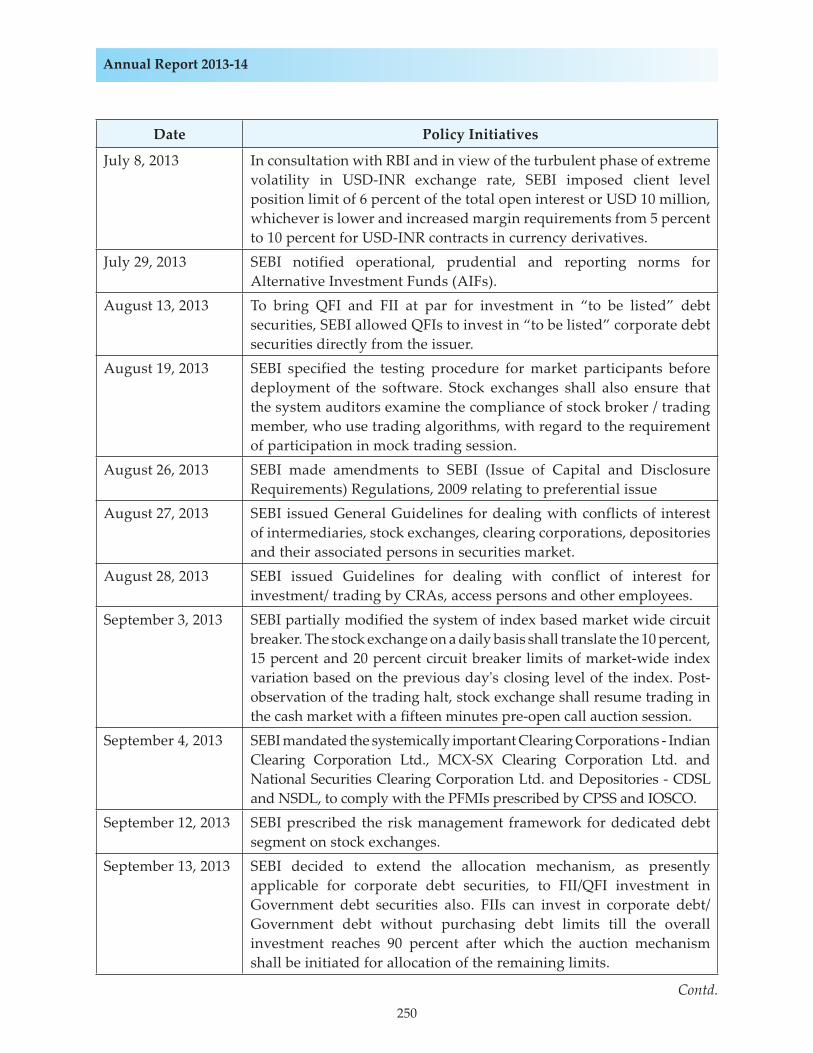
250
Annual Report 2013-14
Contd.
Date Policy Initiatives
July 8, 2013 In consultation with RBI and in view of the turbulent phase of extreme volatility in USD-INR exchange rate, SEBI imposed client level position limit of 6 percent of the total open interest or USD 10 million, whichever is lower and increased margin requirements from 5 percent to 10 percent for USD-INR contracts in currency derivatives.
July 29, 2013 SEBI notified operational, prudential and reporting norms for Alternative Investment Funds (AIFs).
August 13, 2013 To bring QFI and FII at par for investment in “to be listed” debt securities, SEBI allowed QFIs to invest in “to be listed” corporate debt securities directly from the issuer.
August 19, 2013 SEBI specified the testing procedure for market participants before deployment of the software. Stock exchanges shall also ensure that the system auditors examine the compliance of stock broker / trading member, who use trading algorithms, with regard to the requirement of participation in mock trading session.
August 26, 2013 SEBI made amendments to SEBI (Issue of Capital and Disclosure Requirements) Regulations, 2009 relating to preferential issue
August 27, 2013 SEBI issued General Guidelines for dealing with conflicts of interest of intermediaries, stock exchanges, clearing corporations, depositories and their associated persons in securities market.
August 28, 2013 SEBI issued Guidelines for dealing with conflict of interest for investment/ trading by CRAs, access persons and other employees.
September 3, 2013 SEBI partially modified the system of index based market wide circuit breaker. The stock exchange on a daily basis shall translate the 10 percent, 15 percent and 20 percent circuit breaker limits of market-wide index variation based on the previous day's closing level of the index. Post-observation of the trading halt, stock exchange shall resume trading in the cash market with a fifteen minutes pre-open call auction session.
September 4, 2013 SEBI mandated the systemically important Clearing Corporations - Indian Clearing Corporation Ltd., MCX-SX Clearing Corporation Ltd. and National Securities Clearing Corporation Ltd. and Depositories - CDSL and NSDL, to comply with the PFMIs prescribed by CPSS and IOSCO.
September 12, 2013 SEBI prescribed the risk management framework for dedicated debt segment on stock exchanges.
September 13, 2013 SEBI decided to extend the allocation mechanism, as presently applicable for corporate debt securities, to FII/QFI investment in Government debt securities also. FIIs can invest in corporate debt/ Government debt without purchasing debt limits till the overall investment reaches 90 percent after which the auction mechanism shall be initiated for allocation of the remaining limits.
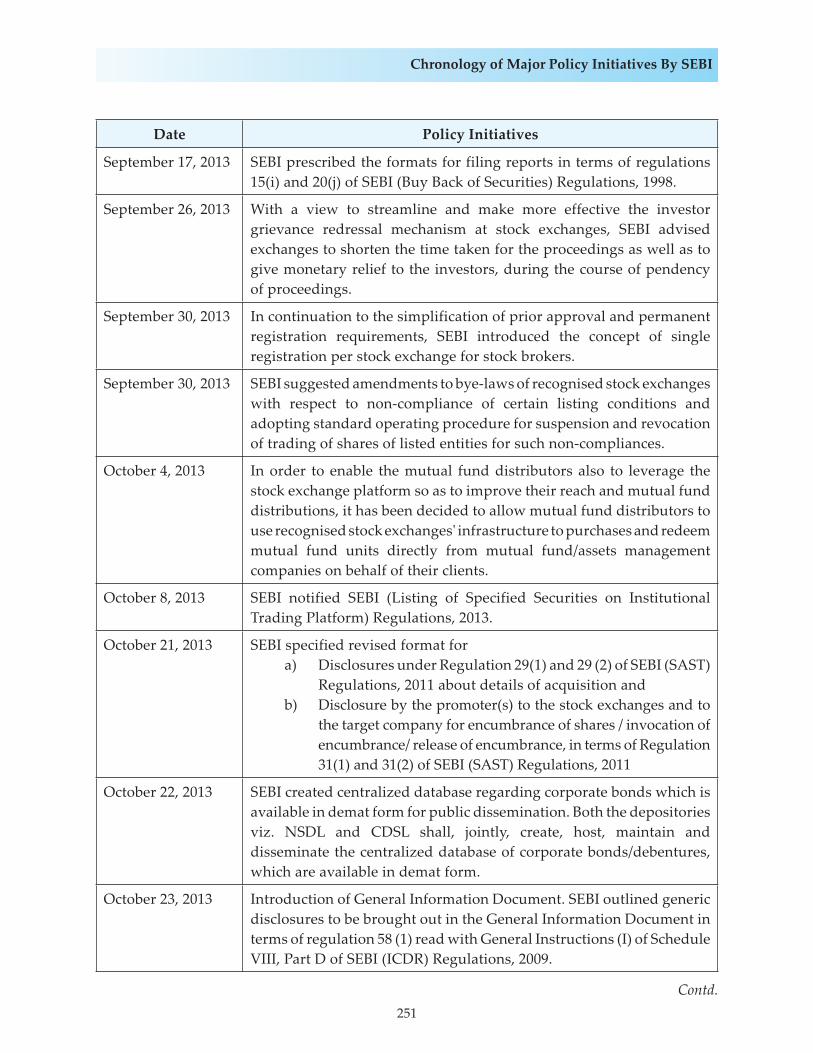
251
Chronology of Major Policy Initiatives By SEBI
Contd.
Date Policy Initiatives
September 17, 2013 SEBI prescribed the formats for filing reports in terms of regulations 15(i) and 20(j) of SEBI (Buy Back of Securities) Regulations, 1998.
September 26, 2013 With a view to streamline and make more effective the investor grievance redressal mechanism at stock exchanges, SEBI advised exchanges to shorten the time taken for the proceedings as well as to give monetary relief to the investors, during the course of pendency of proceedings.
September 30, 2013 In continuation to the simplification of prior approval and permanent registration requirements, SEBI introduced the concept of single registration per stock exchange for stock brokers.
September 30, 2013 SEBI suggested amendments to bye-laws of recognised stock exchanges with respect to non-compliance of certain listing conditions and adopting standard operating procedure for suspension and revocation of trading of shares of listed entities for such non-compliances.
October 4, 2013 In order to enable the mutual fund distributors also to leverage the stock exchange platform so as to improve their reach and mutual fund distributions, it has been decided to allow mutual fund distributors to use recognised stock exchanges' infrastructure to purchases and redeem mutual fund units directly from mutual fund/assets management companies on behalf of their clients.
October 8, 2013 SEBI notified SEBI (Listing of Specified Securities on Institutional Trading Platform) Regulations, 2013.
October 21, 2013 SEBI specified revised format for a) Disclosures under Regulation 29(1) and 29 (2) of SEBI (SAST)
Regulations, 2011 about details of acquisition and b) Disclosure by the promoter(s) to the stock exchanges and to
the target company for encumbrance of shares / invocation of encumbrance/ release of encumbrance, in terms of Regulation 31(1) and 31(2) of SEBI (SAST) Regulations, 2011
October 22, 2013 SEBI created centralized database regarding corporate bonds which is available in demat form for public dissemination. Both the depositories viz. NSDL and CDSL shall, jointly, create, host, maintain and disseminate the centralized database of corporate bonds/debentures, which are available in demat form.
October 23, 2013 Introduction of General Information Document. SEBI outlined generic disclosures to be brought out in the General Information Document in terms of regulation 58 (1) read with General Instructions (I) of Schedule VIII, Part D of SEBI (ICDR) Regulations, 2009.
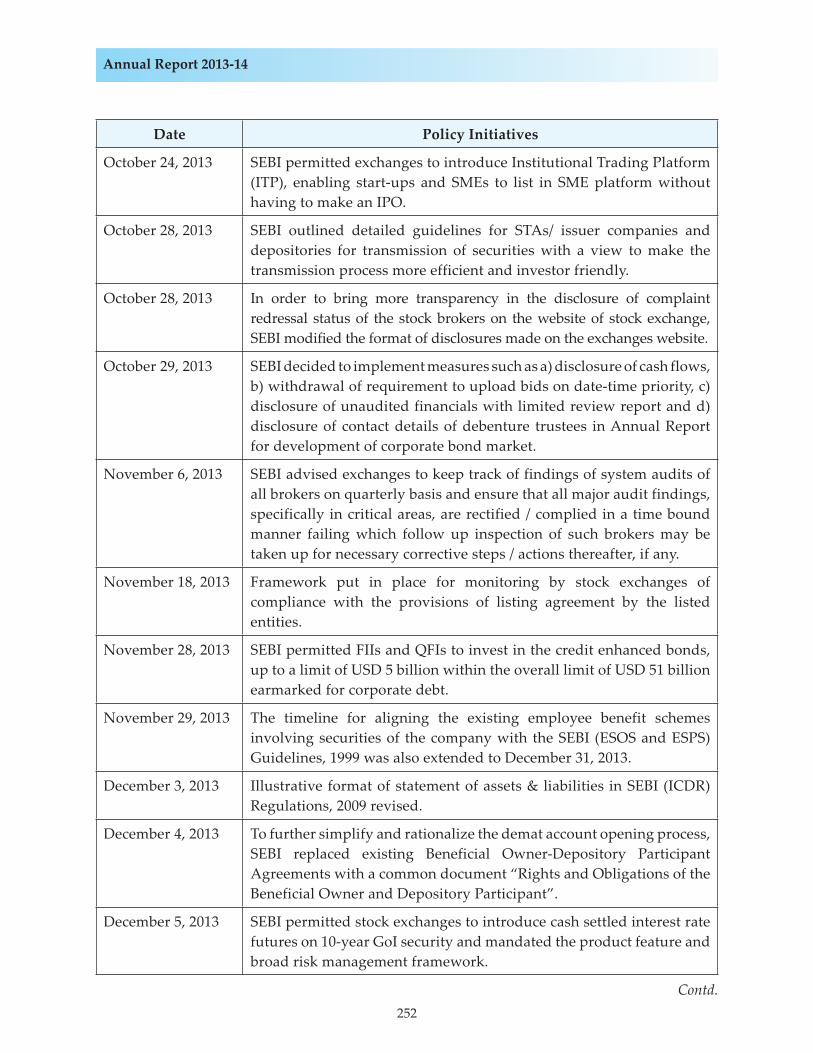
252
Annual Report 2013-14
Contd.
Date Policy Initiatives
October 24, 2013 SEBI permitted exchanges to introduce Institutional Trading Platform (ITP), enabling start-ups and SMEs to list in SME platform without having to make an IPO.
October 28, 2013 SEBI outlined detailed guidelines for STAs/ issuer companies and depositories for transmission of securities with a view to make the transmission process more efficient and investor friendly.
October 28, 2013 In order to bring more transparency in the disclosure of complaint redressal status of the stock brokers on the website of stock exchange, SEBI modified the format of disclosures made on the exchanges website.
October 29, 2013 SEBI decided to implement measures such as a) disclosure of cash flows, b) withdrawal of requirement to upload bids on date-time priority, c) disclosure of unaudited financials with limited review report and d) disclosure of contact details of debenture trustees in Annual Report for development of corporate bond market.
November 6, 2013 SEBI advised exchanges to keep track of findings of system audits of all brokers on quarterly basis and ensure that all major audit findings, specifically in critical areas, are rectified / complied in a time bound manner failing which follow up inspection of such brokers may be taken up for necessary corrective steps / actions thereafter, if any.
November 18, 2013 Framework put in place for monitoring by stock exchanges of compliance with the provisions of listing agreement by the listed entities.
November 28, 2013 SEBI permitted FIIs and QFIs to invest in the credit enhanced bonds, up to a limit of USD 5 billion within the overall limit of USD 51 billion earmarked for corporate debt.
November 29, 2013 The timeline for aligning the existing employee benefit schemes involving securities of the company with the SEBI (ESOS and ESPS) Guidelines, 1999 was also extended to December 31, 2013.
December 3, 2013 Illustrative format of statement of assets & liabilities in SEBI (ICDR) Regulations, 2009 revised.
December 4, 2013 To further simplify and rationalize the demat account opening process, SEBI replaced existing Beneficial Owner-Depository Participant Agreements with a common document “Rights and Obligations of the Beneficial Owner and Depository Participant”.
December 5, 2013 SEBI permitted stock exchanges to introduce cash settled interest rate futures on 10-year GoI security and mandated the product feature and broad risk management framework.
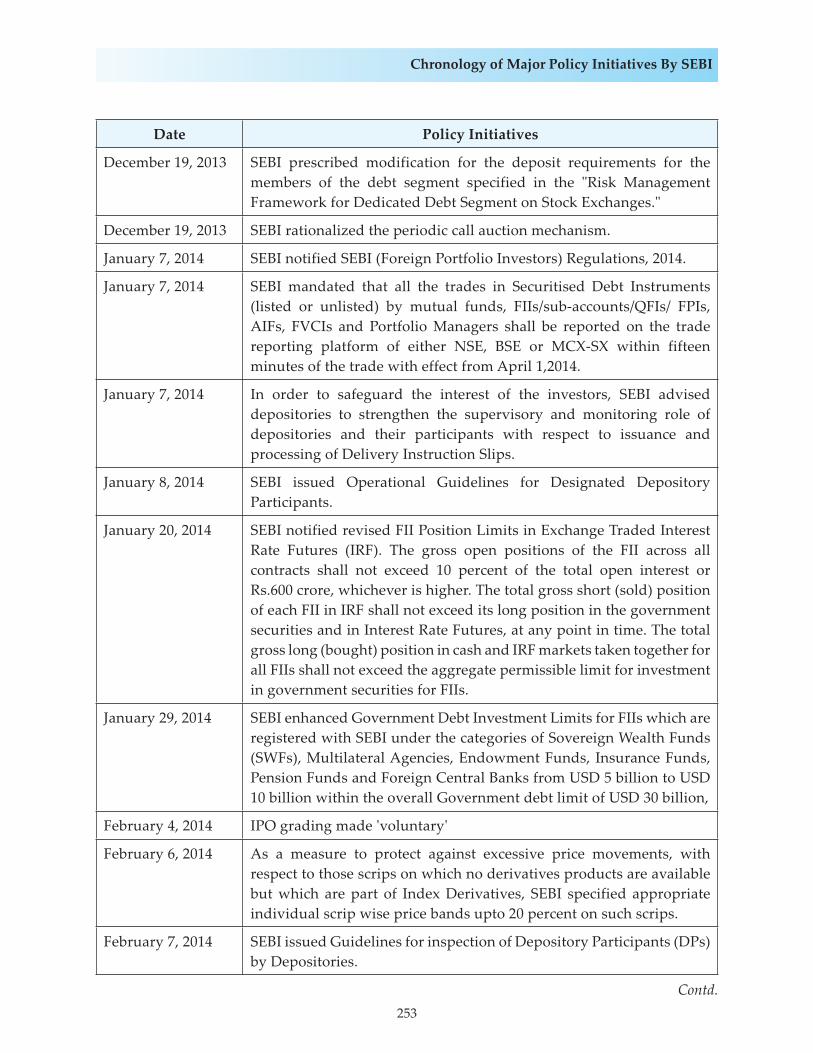
253
Chronology of Major Policy Initiatives By SEBI
Contd.
Date Policy Initiatives
December 19, 2013 SEBI prescribed modification for the deposit requirements for the members of the debt segment specified in the "Risk Management Framework for Dedicated Debt Segment on Stock Exchanges."
December 19, 2013 SEBI rationalized the periodic call auction mechanism.
January 7, 2014 SEBI notified SEBI (Foreign Portfolio Investors) Regulations, 2014.
January 7, 2014 SEBI mandated that all the trades in Securitised Debt Instruments (listed or unlisted) by mutual funds, FIIs/sub-accounts/QFIs/ FPIs, AIFs, FVCIs and Portfolio Managers shall be reported on the trade reporting platform of either NSE, BSE or MCX-SX within fifteen minutes of the trade with effect from April 1,2014.
January 7, 2014 In order to safeguard the interest of the investors, SEBI advised depositories to strengthen the supervisory and monitoring role of depositories and their participants with respect to issuance and processing of Delivery Instruction Slips.
January 8, 2014 SEBI issued Operational Guidelines for Designated Depository Participants.
January 20, 2014 SEBI notified revised FII Position Limits in Exchange Traded Interest Rate Futures (IRF). The gross open positions of the FII across all contracts shall not exceed 10 percent of the total open interest or Rs.600 crore, whichever is higher. The total gross short (sold) position of each FII in IRF shall not exceed its long position in the government securities and in Interest Rate Futures, at any point in time. The total gross long (bought) position in cash and IRF markets taken together for all FIIs shall not exceed the aggregate permissible limit for investment in government securities for FIIs.
January 29, 2014 SEBI enhanced Government Debt Investment Limits for FIIs which are registered with SEBI under the categories of Sovereign Wealth Funds (SWFs), Multilateral Agencies, Endowment Funds, Insurance Funds, Pension Funds and Foreign Central Banks from USD 5 billion to USD 10 billion within the overall Government debt limit of USD 30 billion,
February 4, 2014 IPO grading made 'voluntary'
February 6, 2014 As a measure to protect against excessive price movements, with respect to those scrips on which no derivatives products are available but which are part of Index Derivatives, SEBI specified appropriate individual scrip wise price bands upto 20 percent on such scrips.
February 7, 2014 SEBI issued Guidelines for inspection of Depository Participants (DPs) by Depositories.
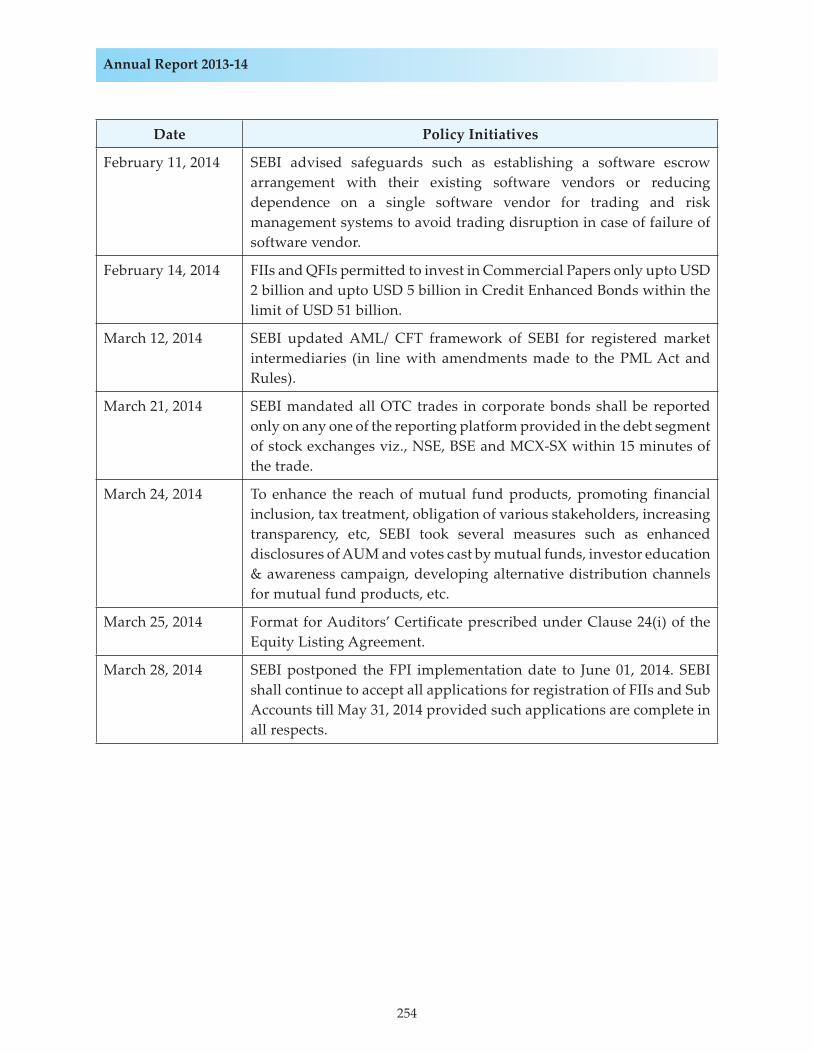
254
Annual Report 2013-14
Date Policy Initiatives
February 11, 2014 SEBI advised safeguards such as establishing a software escrow arrangement with their existing software vendors or reducing dependence on a single software vendor for trading and risk management systems to avoid trading disruption in case of failure of software vendor.
February 14, 2014 FIIs and QFIs permitted to invest in Commercial Papers only upto USD 2 billion and upto USD 5 billion in Credit Enhanced Bonds within the limit of USD 51 billion.
March 12, 2014 SEBI updated AML/ CFT framework of SEBI for registered market intermediaries (in line with amendments made to the PML Act and Rules).
March 21, 2014 SEBI mandated all OTC trades in corporate bonds shall be reported only on any one of the reporting platform provided in the debt segment of stock exchanges viz., NSE, BSE and MCX-SX within 15 minutes of the trade.
March 24, 2014 To enhance the reach of mutual fund products, promoting financial inclusion, tax treatment, obligation of various stakeholders, increasing transparency, etc, SEBI took several measures such as enhanced disclosures of AUM and votes cast by mutual funds, investor education & awareness campaign, developing alternative distribution channels for mutual fund products, etc.
March 25, 2014 Format for Auditors’ Certificate prescribed under Clause 24(i) of the Equity Listing Agreement.
March 28, 2014 SEBI postponed the FPI implementation date to June 01, 2014. SEBI shall continue to accept all applications for registration of FIIs and Sub Accounts till May 31, 2014 provided such applications are complete in all respects.