Embed Size (px)
Citation preview

FEDERAL RESERVE BANK of NEW YORK
An Update on the COMPETITIVENESS of PUERTO RICO’S ECONOMY

This report was prepared by the project team of Jaison Abel, Jason Bram, Richard Deitz, Andrew Haughwout, Thomas Klitgaard, and James Orr of the Research and Statistics Group; Hunter Clark, Tricia Kissinger, Jonathan Landesman,
and Monica Sanz of the Emerging Markets and International Affairs Group; Rae Rosen and Javier Silva of the Communications Group; and Akash Kanojia of the Markets Group. The views expressed in this report are those of the authors
and do not necessarily represent the views of the Federal Reserve Bank of New York or the Federal Reserve System.
An Update on the COMPETITIVENESS of PUERTO RICO’S ECONOMY
July 31, 2014

FOREWORDOur Commitment to Puerto RicoAt the Federal Reserve Bank of New York (popularly known as the New York Fed), we are proud that Puerto Rico is part of the Second District, which we represent in the Federal Reserve System. We have a deep commitment to the people of Puerto Rico and to the future growth and prosperity of the Commonwealth. Our commitment is reflected in the ongoing work of our Outreach and Edu-cation teams with our many partners on the Island, and in the research conducted by our economists, who monitor local economic conditions and analyze issues that affect the Island’s economy.
In support of this work, senior New York Fed officials and I visit Puerto Rico regularly and meet with a wide range of local stakeholders, including business people, community representatives, workers, elected officials, and regional lead-ers. On my visit to the Island in 2011 I witnessed some bright spots in the economy but also saw that growth and expansion were not happening broadly enough. Conditions for many families, businesses, and communities were difficult. At that time, I was asked by a group of business and community leaders to look at what might be holding back economic growth on the Island. In 2012, a team of economists from our Research group and other experts from our Outreach and International teams produced a report that analyzed the challenges facing the Puerto Rico economy and put forward a series of recommendations on how to capitalize on the Island’s strengths to restore competitiveness and growth.
Since that report was issued, positive steps toward reform have been made in some areas. More recently, however, serious fiscal challenges have surfaced that are closely interrelated with the Island’s ongoing weak economic performance. Persistent deficits in the Commonwealth’s fiscal accounts as well as mounting deficits in the operation of several public-sector corporations have substantially raised the Island’s overall level of public debt and led to considerable concern about the sustainability of the Island’s fiscal position.
Update of the Report on CompetitivenessIn light of the fiscal pressures that have been developing in Puerto Rico, I commissioned a team made up of staff from our Research, Outreach, International, and Markets groups to update the New York Fed’s earlier report, with a special focus on improving Puerto Rico’s fiscal outcomes. On a recent visit to the Island, members of the team and I met with a range of stakeholders to learn how these fiscal challenges are playing out across the economy and to gain insights that could inform our analysis. This report is the product of the team’s work. The report was written in the spirit of assisting Puerto Rico in its efforts to address its fiscal challenges, and outlines a number of steps that the Island should consider taking over the next several years in order to restore its fiscal health. I have read it closely and commend it to your attention.
The report notes that the steps outlined will require changes to a number of past policies and practices as well as some degree of sacrifice by all sectors of the Island’s population. While these adjustments can be difficult, the experience of New York City suggests that it is possible to tackle fiscal pressures head on and come out stronger. Puerto Rico clearly has the assets and attributes to do so.
Ongoing EngagementThe steps recommended in the report should be viewed as potential ways to improve Puerto Rico’s public finances over time. I hope that they prompt a constructive and bipartisan debate that will promote good public policy and a better future for the people of Puerto Rico.
In the months and years ahead, the New York Fed will continue to engage with stakeholders across the Island to discuss the topics raised in this report and others. We want to continue to hear firsthand the economic and financial issues that are important for businesses and families, and we will continue to do all that we can to support local communities and decision makers in advancing good economic and fiscal outcomes.
William C. DudleyPresident of the Federal Reserve Bank of New YorkJuly 31, 2014
An Update on the COMPETITIVENESS of PUERTO RICO’S ECONOMY
i

CONTENTS
I. INTRODUCTION 1
II. PUERTO RICO’S RECENT ECONOMIC PERFORMANCE 3
III. KEY CHALLENGES TO RAISING ECONOMIC GROWTH IN PUERTO RICO 6 1. Improving Labor Market Opportunities 2. Developing Human Capital 3. Reducing the Cost of Doing Business 4. Mobilizing Finance for Business Development and Growth 5. Reducing Dependence on a Shrinking Industry
Focus on Puerto Rico’s Fiscal Situation 9
IV. PUERTO RICO’S FISCAL INSTITUTIONAL ENVIRONMENT 11
V. REVENUE, EXPENDITURE, AND DEBT PATTERNS 12
1. Comparisons with U.S. States a. Revenues b. Expenditures c. Debt 2. Comparisons with Advanced and Emerging-Market Economies 3. Comparisons with Puerto Rico’s Recent History
VI. FISCAL DEVELOPMENTS IN PUERTO RICO: 2012–14 20
1. Rising Debt Levels and Market Access Concerns 2. Effects of Stress in Puerto Rico on Financial Markets 3. Government Efforts to Strengthen Public Finances
VII. THE ISLAND’S FISCAL OUTLOOK 23
VIII. STEPS TOWARD FISCAL SUSTAINABILITY 24
An Update on the COMPETITIVENESS of PUERTO RICO’S ECONOMY
iii


1
1 See Report on the Competitiveness of Puerto Rico’s Economy, Federal Reserve Bank of New York, 2012. Available in English at http://www.newyorkfed.org/regional/puertorico/index.html or in Spanish at http://www.newyorkfed.org/regional/puertorico/spanish.html.
I. INTRODUCTION
Economic activity in Puerto Rico remains generally flat at a depressed level and there are no strong signs that a mean-ingful recovery is taking hold. While Puerto Rico’s econ-omy has historically paralleled the U.S. mainland economy, the Island’s latest downturn started earlier and was much steeper and more prolonged. Puerto Rico has now been in a slump since 2006.
More recently, serious fiscal challenges have surfaced that are closely interrelated with the Island’s weak economic per-formance. Persistent deficits in the Commonwealth’s fiscal accounts as well as mounting deficits in the operation of several major public corporations have substantially raised the Island’s overall public debt, leading to serious concerns about whether public debt at these levels can be sustained.
In light of the rising fiscal pressures Puerto Rico faces, the Federal Reserve Bank of New York has undertaken this update of an earlier report that examined the competitive-ness of the Island’s economy.1 That report highlighted a number of features of the economic environment in Puerto Rico that were constraining economic growth. Here, we focus on an analysis of the Island’s financial health. The recent downgrading of Puerto Rico’s public debt to non- investment-grade was a strong signal that the current fiscal situation poses potentially serious risks to the Island’s eco-nomic future. Our analysis focuses on the factors leading to the sizable buildup of public debt and the key variables that will determine its trend.
The clear challenge going forward will be for the Common-wealth government to continue making progress on efforts to raise the economic growth rate while at the same time taking credible steps to constrain the buildup of debt. Other countries as well as some U.S. states and municipalities,
including New York City, have faced difficult economic choices similar to those that Puerto Rico must now address. The leadership of many of these jurisdictions took the steps necessary to manage this trade-off and successfully returned their economies to fiscal health.
The Island appears to face two alternatives: either manage its own economic adjustment and put the Commonwealth on a secure fiscal basis, or wait for outmigration and the disci-pline of the market to force an even more painful adjustment, particularly for those unable or unwilling to leave the Island. Thus, the demanding choices Puerto Rico makes today will affect its long-run economic prospects and the future liveli-hood of its residents. A better future for Puerto Rico requires decisive leadership today.
We begin this update with a brief description of current eco-nomic conditions on the Island. In Section III, we review the challenges to raising the competitiveness of Puerto Rico’s economy that were outlined in the earlier report and note positive steps toward reform in some areas. The report then turns to the special focus on the Island’s fiscal condition. We highlight a number of important differences between the budget policies and practices on the Island and those in the U.S. mainland states, and we use revenue and expendi-ture patterns to show the buildup of debt and to measure the Island’s current fiscal health. A particular emphasis is on the fiscal condition of Puerto Rico’s public-sector corporations, which have played a sizable role in the Island’s rising debt. We then discuss the outlook for the sustainability of Puerto Rico’s debt and outline recent Commonwealth efforts to strengthen the Island’s public finances.
A final section presents further steps that we believe the Island needs to consider in order to complement recent efforts and show the firmness of its commitment to improving its fiscal health. The steps we outline are
An Update on the COMPETITIVENESS of PUERTO RICO’S ECONOMY
2
based, in part, on the experiences of other countries as well as the U.S. mainland states and municipalities that have faced fiscal pressures similar to Puerto Rico’s and that have developed successful strategies to manage and overcome them. We believe these steps will help form a
pathway forward to fiscal health in Puerto Rico. We pre-sent these steps in the spirit of focusing debate and dis-cussion on these critically important issues, and we invite feedback regarding their feasibility and implementation from stakeholders on the Island.
An Update on the COMPETITIVENESS of PUERTO RICO’S ECONOMY

II. PUERTO RICO’S RECENT ECONOMIC PERFORMANCE
By most measures, Puerto Rico’s economic activity has been steady at a depressed level for most of the past year and has shown no strong signs of recovery.2 After declining for five straight years, real (inflation-adjusted) gross national prod-uct (GNP)—a more representative measure of the Island’s economy than GDP—rose 0.9 percent in fiscal 2012 and 0.3 percent in FY 2013 [Figure 1].3 These rates are consid-erably below those for the U.S. mainland and suggest that a strong recovery has yet to take hold. On a per capita basis, real GNP declined steadily from 2005 to 2011, though that measure has edged up recently as the population has fallen [Figure 2].4 The Economic Activity Index produced by Puerto Rico’s Government Development Bank paints a similar pic-ture of an economy that is relatively steady but at a depressed level. The index shows that the Island’s economy picked up somewhat during 2012, but weakened in the first half of 2013. Since then it has been generally flat [Figure 3].5
Puerto Rico’s labor market is also quite weak. Overall employment fell by about 10 percent between 2006 and 2010 and has leveled off since then. Employment in the private sector has been increasing modestly, but cutbacks in govern-ment employment have weighed heavily against any private- sector gains realized over the past few years [Figure 4].6 The
3
2 The economic and fiscal data cited in this report are as of the end of June 2014. 3 The GNP measure of output captures the income actually accruing to Island residents, in contrast to the measure of output used in most countries, gross domestic product (GDP), which includes some income generated on the Island accruing to non- Island residents. The divergence between GDP and GNP on the Island is large: In fiscal year 2013, nominal GDP on the Island was about $103 billion while nominal GNP was roughly $70 billion. 4 Per capita GNP in Puerto Rico was roughly $19,000 in FY 2013, about one-third of the average level on the U.S. mainland.5 The Economic Activity Index, a composite measure reported monthly, is available at http://www.gdb-pur.com/economy/pr-monthly-economic-indicators-time-series.html.6 Some notable pockets of relatively brisk job creation include the leisure and hospitality (tourism) industry, where total employment now far exceeds its prerecession peaks, and the professional and business services and private education and health services sectors.
-4
-2
0
2
4
6
8
10
-4
-2
0
2
4
6
8
10
1981 1984 1987 1990 1993 1996 1999 2002 2005 2008 2011 2014
Figure 1. Real GNP Growth in Puerto Rico and the United States
Percent Percent
Puerto Rico
United States
Sources: Puerto Rico Planning Board; U.S. Bureau of Economic Analysis.Note: Puerto Rico GNP is on a fiscal year basis; U.S. GNP is on an annual basis.
10
15
20
25
1969 1973 1977 1981 1985 1989 1993 1997 2001 2005 2009 2013
Figure 2. Real GNP Per Capita: Puerto Rico
2013 $U.S. thousands
Source: Puerto Rico Planning Board.
120
125
130
135
140
145
150
155
160
2001 2003 2005 2007 2009 2011 2013
Figure 3. Economic Activity Index: Puerto Rico
Index (Jan1980 = 100)
Source: Government Development Bank for Puerto Rico.
An Update on the COMPETITIVENESS of PUERTO RICO’S ECONOMY

4
7 See Maria E. Enchautegui and Richard B. Freeman, “Why Don’t More Puerto Rican Men Work? The Rich Uncle (Sam) Hypothesis,” in Susan M. Collins, Barry P. Bosworth, and Miguel A. Soto-Class, eds., The Economy of Puerto Rico, Brookings Institution and Center for a New Economy, 2006.8 See Jaison Abel and Richard Deitz, “The Causes and Consequences of Puerto Rico’s Declining Population,” Federal Reserve Bank of New York Current Issues in Economics and Finance 20, no. 4, 2014, http://nyfed.org/PRpopulation. 9 The Island’s projected loss is the seventh highest in the world. See https://www.cia.gov/library/publications/the-world-factbook/rankorder/2002rank.html.
unemployment rate on the Island has consistently exceeded the rate on the U.S. mainland by several percentage points, and although the rate declined from 2009 to 2012, it rose again in 2013. It has retreated thus far in 2014, but the gap with the mainland remains wide [Figure 5]. Our earlier report cited low labor force participation, particularly among the younger and less educated workers, as an important factor limiting the island’s competitiveness. Since that report, the utilization of human capital has not improved; in fact, overall labor force participation has continued to decline.
Our earlier report also noted the presence of a relatively large underground, or informal, economy in Puerto Rico that employs a large segment of the population. Activity in this informal economy goes unrecorded, thus allowing workers and firms to avoid many of the taxes and other costs associated with formal employment. Employment there also allows workers to continue to collect work- or means-tested government benefits like those available through
the Nutrition Assistance Program. While the underground economy is difficult to measure accurately, estimates of its size are on the order of 23 percent of GNP.7 The magni-tude of this sector suggests that a relatively large fraction of economic activity in Puerto Rico is unrecorded and not currently subject to either income or sales taxes. Signifi-cantly reducing the size of the nonmarket sector should be an important policy objective.
In large part because of the poor labor market opportuni-ties for many workers, the Island’s rate of outmigration has increased significantly, contributing to an acceleration in the population decline.8 Puerto Rico’s population fell from its peak of 3.8 million in 2004 to about 3.6 million in 2013, a decline of 212,000 residents, or 5.5 percent, over this nine-year period [Figure 6]. Moreover, the Island’s pop-ulation is projected to fall by 0.65 percent in 2014—one of the steepest projected population declines among countries around the globe.9
240
280
320
360
550
600
650
700
750
2002 2004 2006 2008 2010 2012 2014
Figure 4. Trends in Puerto Rico’s Payroll Employment
Thousands Thousands
Source: Bureau of Labor Statistics.Note: Data are seasonally adjusted.
Private Employment
Government Employment
0
5
10
15
20
25
30
1976 1980 1984 1988 1992 1996 2000 2004 2008 2012
Figure 5. Unemployment Rate in Puerto Rico and the United States
Percent
Source: Bureau of Labor Statistics.Notes: Data are seasonally adjusted; shading indicates periods designated recessions (mainland) by the National Bureau of Economic Research.
Puerto Rico
United States
An Update on the COMPETITIVENESS of PUERTO RICO’S ECONOMY

5
10 The debt measure used in this calculation is total fiscal debt on the Island, defined as the sum of general obligation debt, debt payable from specific taxes, revenue streams or appropriations, COFINA debt (Spanish acronym for the Puerto Rico Sales Tax Financing Corporation), debt of municipalities, debt of public-sector corporations, and tax revenue anticipation notes. 11 Debt-to-income ratios above 60 percent in countries that are members of the European Union, for example, violate the EU’s Stability and Growth Pact and require countries to put their debt on a path back toward 60 percent.
The prolonged period of weak economic growth has com-pounded Puerto Rico’s fiscal problems. For more than a decade, the Island has financed deficits in its general fund account, and that practice has continued through the current downturn. In addition, the debt of many of the Island’s public corporations has risen sharply in recent years. The level of out-standing public debt expressed as a percentage of annual GNP rose from about 60 percent in 2000 to more than 100 percent in 2013 [Figure 7].10 Debt ratios in this range can inhibit eco-nomic growth because they generally lead to higher financing
costs, which in turn can lead to constraints on access to addi-tional financing.11
Moreover, in an environment where income is not growing, government austerity measures to address fiscal deficits can potentially weaken the economy further in the short run—through, for example, layoffs of public employees or increases in taxes. Fiscal policies to put debt levels on a more sustain-able path in Puerto Rico will need to limit potentially adverse effects on an already weak economy.
2500
2750
3000
3250
3500
3750
4000
1969 1973 1977 1981 1985 1989 1993 1997 2001 2005 2009 2013
Figure 6. Population of Puerto Rico
Thousands
Source: U.S. Census Bureau.
0
20
40
60
80
100
120
2000 2002 2004 2006 2008 2010 2012
Figure 7. Debt-to-Income Ratio: Puerto Rico
Debt/GNP (percent)
Sources: Office of Management and Budget; Commonwealth’s Comprehensive Annual Financial Report; 2014 Series A Bond Prospectus.Note: Total government debt is shown as a percentage of annual GNP.
An Update on the COMPETITIVENESS of PUERTO RICO’S ECONOMY

6
12 See Abel and Deitz, “The Causes and Consequences of Puerto Rico’s Declining Population,” http://nyfed.org/PRpopulation.
III. KEY CHALLENGES TO RAISING ECONOMIC GROWTH IN PUERTO RICO
In our 2012 report, we highlighted some of the key chal-lenges facing Puerto Rico’s economy. In this section we revisit each of these challenges and discuss the progress made in several areas.
1. Improving Labor Market OpportunitiesLabor market opportunities in Puerto Rico continue to be challenging. Unemployment remains particularly high for the young and less skilled segments of the workforce, as has been the case throughout much of Puerto Rico’s recent his-tory. Further, labor force participation continues to be alarm-ingly weak for this segment of the workforce. Overall, the labor force participation rate has declined even further since the release of our initial report two years ago and now stands at just 45 percent, suggesting that the underutilization of the Island’s workforce remains substantial.
The Island’s high minimum wage, equal to the federal min-imum wage on the U.S. mainland, was cited in our previ-ous report as one potentially strong disincentive for firms to expand their hiring of young workers. The mainland is currently considering an increase in the federal minimum wage level, and there have been recent increases in mini-mum wages by some states and local governments. Since the per capita level of income in Puerto Rico is far below that of the U.S. mainland, and the Island’s productivity growth has not kept pace with the mainland’s, passage of a significant hike in the federal minimum wage could potentially harm job and training opportunities for lower-skilled workers.
2. Developing Human Capital Another challenge identified in our earlier report lies in developing the Island’s human capital. The average level of education in Puerto Rico remains below that of the U.S. mainland: An outsized share of the population possesses less than a high school diploma. However, the educational attainment gap between Puerto Rico and the U.S. mainland
has closed significantly over the past few decades, a trend that has continued in recent years. At the upper end of the spectrum, the share of Puerto Rico’s working-age popula-tion with a college degree increased from slightly more than 25 percent to nearly 28 percent between 2010 and 2012. As a result, the college attainment gap between Puerto Rico and the U.S. mainland has narrowed from 4.5 percentage points to 3 percentage points. At the lower end of the spectrum, the share of Puerto Rico’s working-age population with less than a high school diploma shrank from 21 percent to less than 18 percent. While these trends in educational attainment are driven in part by an aging population and a somewhat dis-proportionate share of outmigrants with less than a college degree, they do represent an encouraging development for the Island’s economy.12
However, as noted in our earlier report, equally important to human capital development is the need to build skills through workforce experience. With long spells of unemployment for many workers continuing and labor force participation quite low, skill atrophy and missed opportunities to build skills and experience through work remain significant concerns, espe-cially for young workers who are just starting their careers. Thus, continuing to develop the Island’s human capital is a long-term process that will require sustained investments in the education system, as well as significant improvement in the labor market to create job opportunities.
3. Reducing the Cost of Doing BusinessSome aspects of Puerto Rico’s business environment are favorable to business development. However, regulatory burdens, transportation costs, and, most notably, energy costs on the Island can raise the cost of operating businesses. In addition, bureaucracy and red tape remain key issues hin-dering the establishment of new businesses and the growth of existing ones, and progress on this front appears to have stalled since 2012. Puerto Rico’s ranking in both the World Bank’s annual “Doing Business” study (40th out of 189 economies) and the World Economic Forum’s Global Com-petitiveness Index (30th out of 148 economies) rose modestly
An Update on the COMPETITIVENESS of PUERTO RICO’S ECONOMY

7
An Update on the COMPETITIVENESS of PUERTO RICO’S ECONOMY
13 These goals were articulated in Commonwealth of Puerto Rico, “Update on Fiscal and Economic Progress,” FY 2014:Q1 Investor Webcast, October 15, 2013.14 See “The Role of a Power Sector Regulator to Strengthen Sector Performance in Puerto Rico,” prepared by the Regulatory Assistance Project for the Center for a New Economy, February 2014.15 See “Characteristics of the Island’s Maritime Trade and Potential Effects of the Jones Act,” Government Accountability Office 13-206, March 2013, available at http://www.gao.gov/products/GAO-13-260.16 See “Maritime Cabotage Complicates Logistics and Adds Costs,” in Enabling Trade: Valuing Growth Opportunities, World Economic Forum, 2013, available at http://reports.weforum.org/global-enabling-trade-2013/view/shipping-co/.
since the studies were conducted in 2011 and 2012. How-ever, Puerto Rico’s underlying scores improved little, and the higher rankings seemed to reflect some movement of its peers and/or methodological changes.
Furthermore, while efforts by Puerto Rico’s government in 2012 to streamline the new-company naming, registration, and permitting process helped reduce the time and cost asso-ciated with these steps (as measured by the World Bank), it is important that these efforts be sustained. The stated goals of making Puerto Rico a stable, business-friendly jurisdiction and stimulating local entrepreneurship are a step in the right direction.13
Our earlier report pointed out that high electricity rates charged by the Puerto Rico Electric Power Authority (PREPA), a government-owned monopoly, are restraining economic growth on the Island. Two key recommendations were made in that report: 1) that an independent regulatory commission be set up to protect consumers and improve the efficiency of PREPA’s operations, and 2) that Puerto Rico adopt the rules set by the Federal Energy Regulatory Com-mission for allowing independent power producers to access the power grid.
There have been some notable signs of progress since our report. A useful analysis of Puerto Rico’s energy market was completed by the Regulatory Assistance Project (RAP), a nonprofit group that provides advice to governments on energy policy.14 The report, commissioned by the Center for a New Economy (CNE), offered a detailed justification for an energy commission and provided a set of recommendations for reforming the electricity sector. Many of the ideas in the RAP/CNE report are contained in legislation signed into law
in May 2014. That bill, the Act for the Transformation and Energy Relief of Puerto Rico, creates an independent regula-tory board to oversee PREPA, with responsibility for setting efficiency standards, increasing the use of alternative sources of energy, and setting rates. It also creates an Office of the Consumer Advocate to help support customers in their inter-actions with the utility. The legislation should foster mean-ingful progress in lowering Puerto Rico’s electricity rates. However, it remains to be seen how the new law will be imple-mented and how its provisions will play out over time.
Less movement is seen in the efforts to address shipping costs. One issue raised in our 2012 report involved the rel-atively high cost of shipping goods between the U.S. main-land and Puerto Rico. Much of this high cost is attributable to the Jones Act—also known as the Merchant Marine Act of 1920—which imposes restrictions on goods shipped between Puerto Rico and the mainland. Since our earlier report, the Government Accountability Office (GAO) has issued a study assessing a range of effects of the Jones Act, although the findings regarding shipping costs were largely inconclusive.15
Identifying possible alternatives to completely exempting Puerto Rico from the Jones Act or maintaining the sta-tus quo, the GAO report suggests an exemption from the provision that ships be U.S.-built. Others have suggested exempting natural gas shipments from the Jones Act, since no U.S.-flagged vessels currently have the capability of such shipping. A report from the World Economic Forum also addressed the barriers to trade in the Jones Act.16 While not discussing effects on Puerto Rico specifically, this report suggested that restrictions such as those in the Jones Act did substantially raise shipping costs.
17 See Commonwealth of Puerto Rico, “Agenda for the Economic Recovery of Puerto Rico 2014–2018,” April 29, 2014.
4. Mobilizing Finance for Business Development and GrowthOur earlier report noted that both cyclical and longer-term chal-lenges were dampening credit availability to local businesses in Puerto Rico. Since then, the availability of credit to local busi-nesses remains constrained, as Puerto Rico’s private commer-cial banks have continued to deleverage. Bank loan portfolios have contracted since 2008, driven primarily by a reduction in loans to the real estate and construction sectors. Banks continue to work through the sizable overhang of problem assets on their balance sheets; indeed, the share of nonperforming loans as a percentage of total loans declined steadily from its 2010-11 peak. But while the pace of credit contraction has slowed from its trough, lending activity appeared to take another leg down in recent quarters. More broadly, banks continue to face chal-lenges growing their core deposit base amid the crowding-out effects of the government’s substantial funding needs, with non-core-deposit funding (particularly brokered deposits) rep-resenting an important portion of bank funding.
5. Reducing Dependence on a Shrinking IndustryWhile the pharmaceuticals industry is still an important employer on the Island, the sector does not appear posi-
tioned to be a strong driver of future growth. The Com-monwealth’s recently announced economic development agenda, however, seeks to capitalize on the strong phar-maceuticals presence on the Island by supporting devel-opment of a number of spinoff industries, such as medi-cal devices and biopharma.17 The agenda also outlines plans to promote tourism and knowledge-based services, industries considered to have a strong growth potential on the Island and already a focus of initiatives for new job creation. The Island is also seeking to build upon its aerospace industry presence by promoting maintenance, repair, and operations clusters to support regional com-mercial and military aviation needs.
Apart from efforts that focus on specific industries, a notable element of the Island’s approach to developing the economy is an emphasis on improving the general business environment—by reducing energy costs, for example—and thus creating conditions for a variety of industries to take hold. These efforts to reduce costs and improve conditions for all sectors should complement the initiatives to develop specific sectors.
8
An Update on the COMPETITIVENESS of PUERTO RICO’S ECONOMY
9
An Update on the COMPETITIVENESS of PUERTO RICO’S ECONOMY
18 The Act focuses on service-providing corporations. It specifically excludes from eligibility a number of public corporations, including the GDB and COFINA, as well as the Commonwealth, debts guaranteed by the Commonwealth, and debts owed by the seventy-eight municipalities of the Commonwealth.
Puerto Rico has faced significant fiscal pressures following years of public-sector deficits, weak economic performance, and, most recently, a faltering in market confidence that led to a surge in borrowing costs and a near-loss of access to debt capital markets. The debt buildup reflects, in part, some of the unique features of the fiscal institutions, poli-cies, and practices on the Island. In particular, the public sector, as defined in this report, comprises not only the Com-monwealth government itself (the central government), but also the municipal governments and the public-sector cor-porations. Most prominent among these corporations are the Puerto Rico Electric Power Authority (PREPA), the Puerto Rico Highway and Transportation Authority (PRHTA), the Puerto Rico Aqueduct and Sewer Authority (PRASA), and the Public Buildings Authority (PBA). Two additional important public-sector corporations are the Government Development Bank (GDB), which acts as fiscal agent, bank, and financial advisor to the Commonwealth, and the Puerto Rico Sales Tax Financing Corporation (COFINA), which is a special-purpose entity set up for issuance of bonds to refi-nance certain debts of the Commonwealth.
The public-sector corporations are especially impor- tant both for the role they have played in generating debt and for the scale of the public services they provide to the Island’s population. Generally, debts of these pub-lic-sector corporations are not legal obligations of the central government, but historically, market participants may have perceived them to be contingent liabilities of the government. Hence the corporations’ financial stand-ing can impair the central government’s credit standing. The recent passage of Puerto Rico’s new Public Corpora-tions Debt Enforcement and Recovery Act, which creates a restructuring process for certain public corporations in financial distress, may change investor perceptions
regarding the relationship between the central govern-ment and the public corporations.18
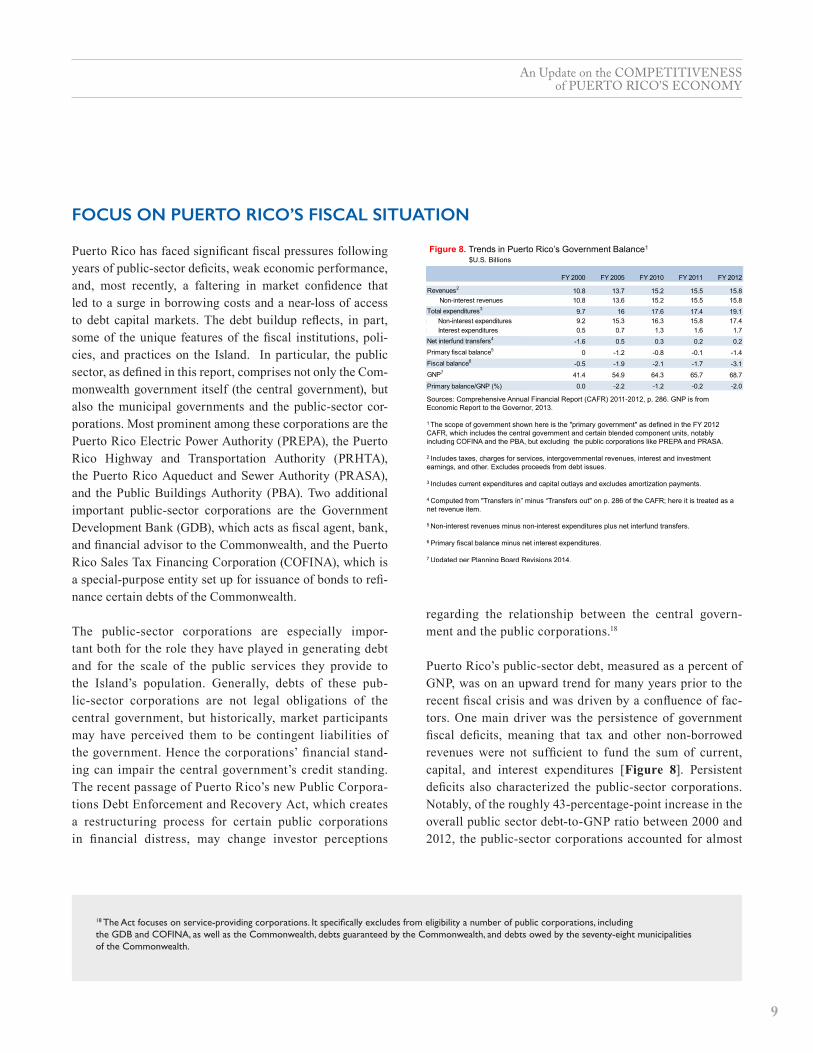
Puerto Rico’s public-sector debt, measured as a percent of GNP, was on an upward trend for many years prior to the recent fiscal crisis and was driven by a confluence of fac-tors. One main driver was the persistence of government fiscal deficits, meaning that tax and other non-borrowed revenues were not sufficient to fund the sum of current, capital, and interest expenditures [Figure 8]. Persistent deficits also characterized the public-sector corporations. Notably, of the roughly 43-percentage-point increase in the overall public sector debt-to-GNP ratio between 2000 and 2012, the public-sector corporations accounted for almost
FOCUS ON PUERTO RICO’S FISCAL SITUATION
Figure 8. Trends in Puerto Rico’s Government Balance1
$U.S. Billions
FY 2000 FY 2005 FY 2010 FY 2011 FY 2012
10.8 13.7 15.2 15.5 15.8 rest revenues 10.8 13.6 15.2 15.5 15.8
tures3 9.7 16 17.6 17.4 19.1 est expenditures 9.2 15.3 16.3 15.8 17.4 xpenditures 0.5 0.7 1.3 1.6 1.7
transfers4 -1.6 0.5 0.3 0.2 0.2 l balance5 0 -1.2 -0.8 -0.1 -1.4
e6 -0.5 -1.9 -2.1 -1.7 -3.1
41.4 54.9 64.3 65.7 68.7
nce/GNP (%) 0.0 -2.2 -1.2 -0.2 -2.0
FY 2000 FY 2005 FY 2010 FY 2011
Revenues2 10.8 13.7 15.2 15.5 Non-interest revenues 10.8 13.6 15.2 15.5Total expenditures3 9.7 16 17.6 17.4
Non-interest expenditures 9.2 15.3 16.3 15.8 Interest expenditures 0.5 0.7 1.3 1.6
Net interfund transfers4 -1.6 0.5 0.3 0.2Primary fiscal balance5 0 -1.2 -0.8 -0.1Fiscal balance6 -0.5 -1.9 -2.1 -1.7GNP7 41.4 54.9 64.3 65.7
Primary balance/GNP (%) 0.0 -2.2 -1.2 -0.2
Sources: Comprehensive Annual Financial Report (CAFR) 2011-2012, p. 286. GNP is from Economic Report to the Governor, 2013.
1 The scope of government shown here is the "primary government" as defined in the FY 2012 CAFR, which includes the central government and certain blended component units, notably including COFINA and the PBA, but excluding the public corporations like PREPA and PRASA.
2 Includes taxes, charges for services, intergovernmental revenues, interest and investment earnings, and other. Excludes proceeds from debt issues.
3 Includes current expenditures and capital outlays and excludes amortization payments.
4 Computed from "Transfers in” minus “Transfers out" on p. 286 of the CAFR; here it is treated as a net revenue item.
5 Non-interest revenues minus non-interest expenditures plus net interfund transfers.
6 Primary fiscal balance minus net interest expenditures.
7 Updated per Planning Board Revisions 2014.

10
19 As indicated in the FY 2013 Comprehensive Annual Financial Report, “COFINA was originally created for the purpose of financing the payment, retirement or defeasance of certain debt obligations of the Commonwealth outstanding at June 30, 2006 (the 2006 Appropriation Debt). During 2009, the Commonwealth’s Legislative Assembly expanded the purposes of COFINA to assist operational expenses of the Commonwealth for 2009 through 2011 and for 2012, to the extent included in the annual budget of the Commonwealth.” For a description of COFINA, the purpose of its debt issues, and the operational structure of the Commonwealth, see pp. 40, 77-78, and 143 of the “Commonwealth of Puerto Rico: Basic Financial Statements and Required Supplementary Information,” June 30, 2013.
85 percent, or about 37 percentage points, while the cen-tral government and municipalities together accounted for about 15 percent. In this measurement of the public-sector corporations we include COFINA, which has designated some proceeds of its bond issuances to fund operational expenses of the broader public sector. COFINA’s borrowing comprised about 23 of the 37 percentage point increase while the other public-sector corporations accounted for the remaining 14 percentage points.19
Another major driver of public-sector debt was the stagna-tion of the economy, which contributed to the rising debt
ratio through both larger fiscal deficits and a slower rate of increase in GNP. Despite the weak economy, the combina-tion of high yields and the “triple tax” exemption of a large portion of Puerto Rico securities—meaning exemption from federal, state, and local income taxes anywhere in the United States—has made Puerto Rico’s debt attractive to main-land municipal-debt investors. The existence of this robust demand has allowed the Commonwealth to borrow in order to finance deficits and provide some fiscal stimulus to the economy. The Island’s high level of public debt, however, has become a dominant feature of the economy and the central focus of its fiscal and economic policy.
An Update on the COMPETITIVENESS of PUERTO RICO’S ECONOMY

11
20 See Commonwealth of Puerto Rico, Financial Information and Operating Data Report, October 18, 2013, p. 20.21 In addition, section 2 of Article VI limits debt service on certain direct or guaranteed debt of the Commonwealth to no more than 15 percent of annual internal fiscal revenues.22 Commonwealth residents pay social security taxes and Commonwealth income taxes.23 For a discussion of balanced-budget requirements in Puerto Rico and the U.S. mainland states, see a report from the National Conference of State Legislatures, available at http://www.ncsl.org/research/fiscal-policy/state-balanced-budget-requirements.aspx.
IV. PUERTO RICO’S FISCAL INSTITUTIONAL ENVIRONMENT
Our analysis of the Island’s fiscal pressures begins by describing the features of the institutional environment in which the Commonwealth conducts its fiscal policy. These features include the Commonwealth’s extremely close rela-tionship with the U.S. government, which in many ways makes it analogous to a mainland state. The U.S. main-land states and the Island share a common market and a common currency, leading to strong economic interdepen-dencies reflected in the fact that more than 70 percent of Puerto Rico’s 2012 exports were to the U.S. mainland.20 In addition, federal aid is a major source of revenues for the Commonwealth, and residents of Puerto Rico participate in large federal social insurance programs like Social Secu-rity and Medicare. Puerto Rico government debt trades as a municipal security in the U.S. capital markets, and, as noted, interest earned on much of this debt is exempt from income taxation at the local, state, and federal government levels. Like all but one mainland state (Vermont), Puerto Rico has a self-imposed requirement to balance its budget.
The requirement appears in Article VI of the Puerto Rican Constitution.21
In many ways, however, the Commonwealth operates more independently than other jurisdictions on the mainland. The residents of Puerto Rico, unlike those of the main-land states, do not pay U.S. personal income taxes unless employed by the federal government.22 The many large public-sector corporations on the Commonwealth’s bal-ance sheet also distinguish it from many mainland states, although some states—New York, for example—also house a complex web of public-sector corporations and authorities. In addition, the Census of Governments does not survey Puerto Rico as part of its annual program to col-lect information on the fiscal policies of the states and their constituent localities. Finally, a notable difference from other mainland jurisdictions is that Puerto Rico’s balanced budget requirement, while found in the constitution and relatively stringent in form, directly applies to the Com-monwealth central government only and appears to have been considerably less effective in constraining the growth of the Island’s overall public-sector debt.23
An Update on the COMPETITIVENESS of PUERTO RICO’S ECONOMY

12
24 This follows the analysis in James Alm, “Assessing Puerto Rico’s Fiscal Policy,” in Collins, Bosworth, and Soto-Class, eds., The Economy of Puerto Rico. We use FY 2012 data to facilitate comparison with the most recent state and other economy data. There is some year-to-year volatility in the Commonwealth’s finances, and FY 2012 was a relatively weak year with a relatively high fiscal deficit. 25 Most of our comparisons will be based on the share of aggregate income for various fiscal measures. It is important to implement some kind of normalization, such as shares of income, to account for differences in the size of jurisdictions. Other normalizations, such as per capita amounts, would produce results largely consistent with those reported here.26 Comparisons here are made to the total of states and their constituent localities.27 In comparing Puerto Rico to the states, we use the Census Bureau’s Census of Governments data, which compile, on a consistent basis, financial informa-tion about states and their constituent localities. Washington, D.C., is included in the Bureau’s surveys, but Puerto Rico, with its special status, is not. We have attempted to put Puerto Rico’s financial information into the familiar and economically useful categories used by the Bureau, culling information from various Commonwealth financial documents, especially the 2012 Comprehensive Annual Financial Report (FY 2012 CAFR) and Financial Information and Operating Data Report (FI&ODR) dated October 18, 2013.28 The components of these figures are as follows. Intergovernmental revenue is found on p. 286 of the FY 2012 CAFR. Public enterprise charges for services are on p. 55. General revenue from own sources is the sum of property taxes of $966.2 million (FI&ODR, p. 131), personal income taxes of $2129 million, (FY 2012 CAFR, p. 290), corporate income taxes of $1460.4 million (FY 2012 CAFR, p. 290), excise taxes of $2695.5 million (FY 2012 CAFR, p. 286) and sales and use taxes of $1144.7 million (FY 2012 CAFR, p. 286), withholding taxes to nonresidents of $890.8 million (FY 2012 CAFR, p. 290), and tollgate taxes of $27.7 million (FY 2012 CAFR, p. 290), plus nontax revenues to the general fund of $335.2 million (FY 2012 CAFR, p. 289).
V. REVENUE, EXPENDITURE, AND DEBT PATTERNS
We assess Puerto Rico’s current fiscal situation by develop-ing alternative measures of its fiscal condition. The Common-wealth’s unique institutions mean that no single measure is fully satisfactory, so we present several in order to provide the appropriate context.24 Indeed, the fact that we cannot directly compare Puerto Rico to any other government is an indication that its institutions afford it opportunities that neither the states nor other nations enjoy; however, they also leave it particularly vulnerable for reasons that will become apparent as we proceed.
Three comparisons are offered in order to shed light on the Commonwealth’s current fiscal situation. We begin by compar-ing Puerto Rico’s tax revenue, expenditure, and debt patterns with those of U.S. mainland states—an approach that puts Puerto Rico’s fiscal health in a familiar context. We then com-pare the revenue, expenditure, and debt patterns on the Island with those of a set of advanced and emerging-market econo-mies, jurisdictions that operate much more independently than U.S. mainland states. Finally, we look to the Island’s own fiscal history, particularly the buildup of its public debt, and compare its current fiscal situation with that of a decade ago.25
1. Comparisons with U.S. States26, 27
a. RevenuesRecall that Puerto Rico’s “public sector” as we define it here includes those entities whose activities have a direct
material effect on the Commonwealth government’s ability to deliver public services. We divide Puerto Rico’s pub-lic-sector revenues into three major components: 1) taxes and other own-source general revenue, 2) charges received by the public-sector corporations, and 3) intergovernmental revenue (primarily received from the U.S. federal govern-ment). Altogether, these three sources constituted the Com-monwealth’s 2012 total revenues of $27 billion [Figure 9].28
Readers will note that the revenues reported in Figure 9 are significantly higher than those appearing in Figure 8. The main source of these differences is the inclusion here of rev-enues of several of the largest public-sector enterprises, as
Figure 9. Composition of Puerto Rico’s Public-Sector Revenues
6,778
9,650
10,082
Intergovernmental revenue
General revenue from ownsources
Public enterprise revenue
Note: Revenues are in millions of dollars.
Sources: Office of Management and Budget; Commonwealth’s Comprehensive Annual Financial Report; 2014 Series A Bond Prospectus.
An Update on the COMPETITIVENESS of PUERTO RICO’S ECONOMY

13
An Update on the COMPETITIVENESS of PUERTO RICO’S ECONOMY
29 The descriptions that follow are adapted from the FY 2012 CAFR, pp. 59-60. The public-sector corporations listed here are known as the “major compo-nent units.” A number of other public-sector corporations, notably COFINA and the Public Building Authority (PBA), are known as “blended component units” and are included within the “primary government” in the CAFR.30 These are described in the FY 2012 CAFR, pp. 60-70.31 See FI&ODR, October 13, 2013, p. 130. As such, the FY 2012 CAFR reports property tax revenues of $66 million in 2012 (p. 286), apparently referring to the amount available for the general fund.
well as some additional property tax revenue. There are six major “component units” whose revenues from charges for services figure prominently here:29
• Government Development Bank for Puerto Rico (GDB) acts as bank and fiscal agent for the Commonwealth and its municipalities and public corporations.
• Puerto Rico Aqueduct and Sewer Authority (PRASA) owns and operates the Commonwealth’s system of public water supply and sanitary sewer facilities. The Common-wealth provides financial support to PRASA through leg-islative appropriations.
• Puerto Rico Electric Power Authority (PREPA) owns and operates the Commonwealth’s electrical power gen-eration, transmission, and distribution system. The Com-monwealth provides financial support to PREPA through legislative appropriations.
• Puerto Rico Health Insurance Administration (PRHIA) operates a health insurance system for government employees, police officers, and low-income residents. The Commonwealth provides financial support to PRHIA through legislative appropriations.
• Puerto Rico Highways and Transportation Authority (PRHTA) plans and manages the construction of all major projects relating to the Commonwealth’s toll high-way system, undertakes major repairs, and maintains the toll ways. The Commonwealth has the ability to signifi-cantly influence the toll rates charged by PRHTA.
• University of Puerto Rico (UPR) is the Commonwealth’s public university. The Commonwealth provides financial support to UPR through legislative appropriations.
In addition, dozens of smaller enterprises make up the “non-major component units.”30
We include the public corporations’ revenues, expenditures, and debt in our discussion for two principal reasons. First, the market—the pool of investors and potential investors in Commonwealth and public corporation debt—frequently includes the public-sector corporations when referring to the entire public sector. Second, the Commonwealth has to this point provided significant financial support to these entities when their expenditures exceeded their revenues. This has reasonably led investors to believe that the Commonwealth provides some backing for these entities’ debts. Nonetheless, the complexity imparted by this structure inhibits analysis of the Commonwealth’s balance sheet. The difficulty in assem-bling even basic, comprehensive, and reliable statistics about the Commonwealth’s fiscal situation is an issue to which we will return.
Of the $10 billion collected in own-source general revenues, the vast majority is made up of tax revenues: Total tax rev-enue in FY 2012 was about $9.3 billion, or 13.6 percent of GNP. General and selective sales taxes made up a large share (about 37 percent) of tax revenue in 2012, and personal and corporate income taxes also brought a large share of tax revenue, 23 and 16 percent, respectively. The remaining tax revenue is primarily composed of property taxes and with-holding tax for nonresidents. Both of these taxes contributed nearly $1 billion in revenue to the public sector in FY 2012. The property tax raised $956 million in 2012. Its primary function is to pay the expenses of municipalities, but a small portion is remitted to the Commonwealth for the purpose of paying general obligation debt.31 Similarly, but less dra-matically, the sales and use tax is the funding source for COFINA bonds and, as such, contributes just $543 million to the general fund and the remaining $601 million to COFINA

14
32 In most states, the property tax is the principal local tax and the source of funding for most local public services. Similarly, in Puerto Rico, a large share of the property tax is reserved for municipal government purposes.33 See footnote 18.
(FY 2012 CAFR, p. 41). The multiple uses and commitments of the revenues raised by the Commonwealth complicate comparisons to other governments and, since these arrange-ments change, even to the Commonwealth itself over time.
Puerto Rico’s overall state and local tax burden, at 14 per-cent of GNP, is heavy compared with that of most mainland states [Figure 10]. Among the fifty states plus the District of Columbia, Puerto Rico would rank second in terms of total tax burden, behind only Alaska with its unusually large sev-erance taxes. New York, by comparison, collected 12.4 per-cent of income in taxes in FY 2011. Puerto Rico’s primary reliance on income and sales taxation is common among the states, although the Commonwealth leans more heavily on the personal income tax than all but a few states (Massa-chusetts, New York, Delaware, Maryland, and Oregon). If Puerto Rico were a state, its reliance on sales and use taxes would rank it fifteenth.
Property taxes in Puerto Rico are lower than in most states, which is particularly notable in light of the Commonwealth’s relatively high overall tax burden.32 The overall property levy, which accounts for about 10 percent of tax revenues and 1.4 percent of GNP, is quite low. In the states, property taxes’ shares of total revenues and of GDP are two to three times the levels of these ratios in Puerto Rico.
Puerto Rico’s tax system has several weaknesses that have been the focus of prior discussions, notably James Alm’s contribution to a 2006 volume from the Brookings Institution and the Center for a New Economy.33 Among the system’s many deficiencies are low collection rates on major taxes, an income tax code plagued by many exceptions, deductions, and preferences, and liberal use of tax incentives for favored purposes. Further, one driver of the large informal sector of the Island’s economy is likely the avoidance of taxes, and thus no revenues are collected from the significant activity taking place there.
In combination, these issues have fostered a system in which activities that are the most difficult to reduce and to conceal from tax authorities—especially labor in the formal sector— are taxed disproportionately heavily. Important principles of good taxation—efficiency and vertical and horizontal equity—are nearly impossible to achieve under these cir-cumstances. As a result, it is likely that the Commonwealth’s slow growth has been exacerbated by its inefficient tax sys-tem that encourages and rewards evasion. Puerto Rico’s 2011 tax reform was intended to improve the system incremen-tally, and the government has recently prioritized improve-ments in the administration of major taxes. Nonetheless, many challenges remain and more comprehensive tax reform would likely improve the equity of the current system as well as provide a boost to economic growth.
In summary, if it were a state, Puerto Rico would be a rela-tively high-tax jurisdiction, with especially high reliance on income taxes and notably low reliance on property taxes. However, on a more like-for-like basis, combining the bur-den of state plus federal taxes, Puerto Rico appears to be less of an outlier. Recall that Puerto Rico residents do not pay U.S. federal income taxes unless employed by the federal government, so while the burden of the Commonwealth’s taxes is high, the comparison with mainland state and local taxes alone understates the total income tax burden on resi-dents of the mainland.
Figure 10. Revenues: Puerto Rico Compared with the States and Washington, D.C.
Sources: Government Development Bank for Puerto Rico; Commonwealth’s 2012 Comprehensive Annual Financial Report; Census of Governments, 2012; U.S. Bureau of Economic Analysis.
Note: Gross national product is used for Puerto Rico and gross state product is used for the states and Washington, D.C.
Percentile of States and D.C.
(1) State Tax Revenuesas Percentage of Aggregate
Income
(2) Total State Revenuesas Percentage of Aggregate
Income25th 7.8 20.450th 8.7 22.975th 9.6 26.1
Puerto Rico 14.0 38.6Puerto Rico rank 2/52 1/52
An Update on the COMPETITIVENESS of PUERTO RICO’S ECONOMY

15
An Update on the COMPETITIVENESS of PUERTO RICO’S ECONOMY
34 See FY 2012 CAFR, p. 55. Since the Commonwealth also pays the public corporations for services, the revenue figures are subject to some amount of double counting. It is difficult to determine how much, since the public enterprises’ CAFRs do not distinguish revenue obtained from the sale of services to the Commonwealth from that obtained from other customers. Both PREPA and PRASA, however, indicate accounts receivable from government agencies and municipalities. These totaled around $500 million at the end of FY 2012. 35 In 2011, twenty states reported positive liquor store expenditures. All states reported utility revenues. Utilities include water supply, electric power, gas supply, and transit agencies.36 The components are all expenditure categories in FY 2012 CAFR (p. 286) other than principal payments (this is 21,035.6 million - 1,871.7 million = 19,163.9 million) plus public corporation expenditure of $15,244.6 million (found in FY 2012 CAFR, p. 55). This $34.4 billion figure exceeds that reported elsewhere partly because we are including the public corporations, although, as with revenues, our calculation may include double counting of expenditures from the central government paid to public corporations. While in principle we would exclude debt amortization for the public corporations, we were unable to identify a source for those data. In part because of these issues, the deficit implied here is somewhat higher than most official figures. Nonetheless, this figure is broadly consistent with the increase in outstanding debt reported from other official Commonwealth sources.37 This measure of education spending excludes the University of Puerto Rico and is thus analogous to K-12 spending in states.
Puerto Rico’s public-sector corporations received approxi-mately $10 billion in fees in 2012, amounting to 14.7 percent of GNP.34 The presence of such large enterprises on the balance sheet of the Commonwealth sets it completely apart from the U.S. states. In the Census data, the revenues of both state liquor stores and state-controlled utilities are considered part of the public-sector balance sheet.35 In FY 2011, Nebraska had the highest enterprise revenues as a share of state GDP, at just under 4 percent, while utilities in the lowest enter-prise revenue state, Maine, collected just over 0.25 percent of GDP. Puerto Rico’s 14.7 percent is roughly fifteen times the mean of the states, which is just below 1 percent.
Puerto Rico also receives sizable transfers from the federal government. In FY 2012, intergovernmental revenue totaled about $6.9 billion, roughly 10 percent of GNP. The bulk of this category is U.S. government grants to the Common-wealth, which totaled $5.2 billion, or 7.6 percent of GNP. The latter figure compares favorably to most states and would put the Commonwealth in fourth place (behind Mississippi, New Mexico, Vermont, and Wyoming) if it were a state.
Taken together, total revenues in Puerto Rico were about 40 per-cent of GNP, highest in comparison to all U.S. mainland states.
b. ExpendituresPuerto Rico’s total government expenditures in FY 2012 were $34.4 billion, or 50.1 percent of GNP, a share that includes the public corporations and is, again, significantly higher than that found in Figure 8.36 Like its revenues, the Commonwealth’s
spending represents a considerably higher share of GNP than is common across U.S. mainland states. Puerto Rico’s 50.1 percent share puts it at more than twice the level of the average state (21.1 percent) and far above even the high-est-spending states. Only six states had GDP shares greater than 25 percent in FY 2011; that list includes New York, at 25.7 percent, and Alaska, the highest at 28.7 percent.
As noted above, the presence of the public-sector corpo-rations in the Commonwealth’s public-sector accounts is largely responsible for its share differences with the states. In the states and their localities, liquor store and utility expenditure averages 1.25 percent of GDP, while in Puerto Rico spending by the major component units was over 22 percent of GNP in 2012. Absent this spending, Puerto Rico’s spending, at 27.8 percent of GNP in 2012, looks much closer to that of a typical state.
After the public corporations are removed, the composition of the Commonwealth’s spending is broadly similar to that of the states. The primary categories of expenditure are education (25 percent of direct general expenditure), housing and community development (19 percent), health (16 percent), and public safety (13 percent).37 Puerto Rico’s general expenditures are somewhat more heavily focused on these core functions of government than is true of a typical state. Transportation is an exception: In the Commonwealth, highway spending (and revenue) is attributed to PRHTA and thus appears as a public-sector corporation.

16
38 As noted, in March 2014, Puerto Rico issued $3.5 billion in bonds, bringing total debt (after up-front costs and capitalized interest) to $72.8 billion.39 The debt figures reported for the U.S. mainland states refer to debt held by the public and exclude debt held by government agencies. Most Puerto Rico debt is held by the public.40 U.S. federal debt held by the public was $11.281 trillion on September 30, 2012, according to the Office of Management and Budget, Historical Tables for the 2014 Budget, Table 7.1. We base this comparison on debt held by the public, rather than gross debt, because it more accurately reflects the external financing required by the U.S. government. See Congressional Budget Office, Federal Debt and the Risk of a Fiscal Crisis, July 27, 2010, footnote 2.
c. DebtPuerto Rico’s total public debt (as of December 2013) com-prised five major components [see Figure 11 for more detail]:38
1. General obligation and/or full faith and credit debt ($15.8 billion, or 21.9 percent of $71.9 billion outstanding)
2. COFINA ($15.6 billion, or 21.7 percent)
3. Municipalities and other ($13.2 billion, or 18.4 percent)
4. Tax revenue anticipation notes ($1.1 billion, or 1.4 percent)
5. Public corporations and agencies ($26.2 billion, or 36.4 percent).
The $71.9 billion total is, of course, quite high, at more than 100 percent of GNP. This is far higher than for any U.S. state [Figure 12]; among the states, the highest ratio is New York,
at 29 percent.39 Recalling, however, that most residents of Puerto Rico do not pay federal income taxes, one might con-jecture that the large U.S. federal debt (itself 72.6 percent of U.S. GDP) is a burden to residents of the states and D.C., but not to residents of Puerto Rico. Adding in this burden (allo-cating federal debt on a per capita basis) for U.S. mainland residents produces the second column in Figure 12, where we find Puerto Rico closer to the seventy-fifth percentile, ranking fourteenth.
Of course, how repayment of the U.S. federal debt will occur is not clear at this point. If the debt were discharged by raising personal income taxes while leaving other taxes and spend-ing programs as they are, then the second column would portray an accurate picture of the relative burdens. If, on the other hand, personal income taxes were left constant and the debt repaid through reductions in spending and changes in other tax rates, then Puerto Rico residents would make large contributions, and the first column is a more accurate depic-tion of the relative debt burdens. The actual outcome will likely be somewhere between these two extremes. Regard-less, even if its residents bear no responsibility for federal
Figure 11. Composition of Puerto Rico’s Outstanding Debt
Sources: March 2014 Series A Prospectus, p. 33; public corporation debt is sourced from Quarterly Report dated February 18, 2014, p. 36.
1 In March 2014, Puerto Rico issued $3.5 billion of debt securities. After refinancings anddeductions, total debt rose to $72.7 billion.
2 Debt payable from revenues from “internal sources,” that is, income taxes, is guaranteed by the Puerto Rican constitution.
Puerto Rico: General Government Debt1
As of December 2013
General obligation and/or full faith and credit debt2 15.8 22.0
COFINA 15.6 21.713.2 18.4
Tax revenue anticipation notes 1.1 1.5Public corporations and agencies 26.2 36.4
Total 71.9 100.0
$U.S. Billions
Percent of Total
Municipalities and other
Figure 12. 2012 Debt: Puerto Rico Compared with the States and Washington, D.C.
Sources: Government Development Bank for Puerto Rico; Commonwealth’s 2012 Comprehensive Annual Financial Report; Census of Governments, 2012; U.S. Bureau of Economic Analysis.
Note: Gross national product is used for Puerto Rico and gross state product for the states and Washington, D.C.
Percentile of States and D.C.
(1) Total State/Local Debtas Percentage of Aggregate
Income
(2) Federal and State/Local Debtas Percentage of Aggregate
Income25th 13.7 83.950th 16.8 94.175th 19.5 100.9
Puerto Rico total debt 100.7 100.7Puerto Rico rank 1/52 14/52
An Update on the COMPETITIVENESS of PUERTO RICO’S ECONOMY
8

17
An Update on the COMPETITIVENESS of PUERTO RICO’S ECONOMY
41 The IMF data are reported on either a cash or accrual basis, depending on the country. They include (for countries where the concepts are meaningful) central, state, and local governments, and the concept is debt held by the public. Unfortunately, for most of the advanced countries, public corporations are not included in the IMF data—as they are in the census data for U.S. mainland states—primarily because these operations are not as consequential in advanced economies as they are in Puerto Rico. Many of the emerging-market economies, however, do report on public corporation debts. These debts are included in the calculations reported in Figure 16.
debt, Puerto Rico is clearly a high-debt jurisdiction relative to most of the United States.
Overall, we find that Puerto Rico looks rather different from a U.S. mainland state. Its own outstanding debt is much higher than that owed by any state government, and its responsibility for the U.S. federal debt is quite unclear. In this sense, Puerto Rico looks more like a nation than do any of the mainland states, and for this reason additional light may be shed by comparing it with countries.
2.Comparisons with Advanced and Emerging-Market EconomiesBecause some elements of Puerto Rico’s fiscal position differ from the states’ positions in important ways, we place its rev-enue, expenditure, and debt patterns in the context of foreign economies. We compare debt in Puerto Rico with debt in a group of advanced and emerging-market economies found in the Fiscal Monitor database of the International Monetary Fund (IMF).41 As noted above, our primary approach is to compare fiscal measures as a percent of GDP.
The data indicate that Puerto Rico’s total revenue is roughly average for an advanced economy and in the upper part of the distribution for emerging-market economies [Figure 13]. We use the total revenue figure of $26.9 billion for this calcula-tion since it is the most expansive available for Puerto Rico
in 2012 and most closely corresponds to the composite data from the IMF. Note that this figure includes roughly $6 billion in U.S. federal government funding; such significant transfers from another country are, of course, unusual. With respect to expenditures, the story is broadly similar. When looked at in the context of advanced economies, Puerto Rico is in the upper part of the distribution of expenditures. When looked at in the context of emerging-market economies, however, Puerto Rico ranks the highest [Figure 14]. This fact is perhaps not surpris-ing given the Island’s large FY 2012 deficit. Nevertheless, the data show the Island’s relative share of expenditures running ahead of its relative share of revenues.
We compare total debt in Puerto Rico to the debt in advanced economies by looking at the debt-to-GNP ratio for Puerto Rico and the debt-to-GDP ratios for thirty advanced econo-mies [Figure 15]. Puerto Rico is obviously in the upper tail of this distribution. We repeat this exercise for the group of emerging-market economies. When Puerto Rico is compared with that group, its debt makes it a clear outlier [Figure 16].
These comparisons show that tax burdens on the Island are somewhat closer to those of a comparison group of advanced and emerging economies than to those of U.S. mainland states. The Island’s expenditure patterns, however, are at the high end of the distribution across these economies, and as
Figure 13. 2012 Revenues: Puerto Rico and Other Economies
Sources: Government Development Bank for Puerto Rico; Commonwealth’s 2012 Comprehensive Annual Financial Report; International Monetary Fund.
Note: Gross national product is used for Puerto Rico and gross domestic product for the others.
Percentile of 30 Nations
(1) Total Revenue as Percentage of GDP, Advanced Economies
(2) Total Revenueas Percentage of GDP, Emerging Economies
25th 34.6 22.150th 40.8 26.375th 46.8 35.6
Puerto Rico 38.6 38.6Puerto Rico rank 19/31 5/30
Figure 14. 2012 Expenditures: Puerto Rico and Other Economies
Sources: Government Development Bank for Puerto Rico; Commonwealth’s 2012 Comprehensive Annual Financial Report; International Monetary Fund.
Note: Gross national product is used for Puerto Rico and gross domestic product for the others.
Percentile of 30 Nations
(1) Total Expenditureas Percentage of GDP,Advanced Economies
(2) Total Expenditureas Percentage of GDP,Emerging Economies
25th 40.8 24.350th 44.0 30.575th 47.2 38.2
Puerto Rico 50.1 50.1Puerto Rico rank 6/31 1/30

18
42 The four corporations are PREPA, PRASA, PRHTA, and GDB. See the Commonwealth CAFRs for FY 2000, p. 159 and for FY 2012, p. 55.
with the comparison to U.S. mainland states, its debt levels are comparable to those of some of the most indebted economies.
3. Comparisons with Puerto Rico’s Recent History Puerto Rico’s unique institutional setting suggests that a final comparison—to the Island’s own history—may shed additional light on its fiscal situation. Here we find that the principal issue for the Commonwealth is that the sluggish eco-nomic growth that began as long ago as 2002 reduced revenue growth but has not been accompanied by a slowdown in gov-ernment spending. This is clear from Figure 8: Since 2000, total revenues have grown 45 percent (to $15.8 billion), while expenditures have more than doubled (to $19.1 billion).
Puerto Rico’s public-sector corporations, excluded from Fig-ure 8, have exacerbated this problem. Over the twelve-year period from FY 2000 to FY 2012, the revenues of the four major public-sector corporations grew at a compound annual rate of 8.5 percent, while their expenses grew 11 percent.42 These corporations went from running a small surplus in FY 2000 to a large deficit in 2012. The combination of increas-ing general government deficits and a worsening drag from the public-sector corporations has led to the increase in debt.
In addition to coping with the growing stock of publicly issued debt, Puerto Rico faces large future contingent lia-bilities through unfunded pension system liabilities. Indeed, Puerto Rico’s pension system faced one of the largest actu-arial deficits of all municipal governments in the United States, with an average funding ratio of only 8.4 percent across the main employee, teacher, and judiciary retirement systems. As of the end of FY 2012, the unfunded liabilities of the three pension funds totaled over $37 billion, producing large projected cash flow deficits averaging $0.9 billion per year beginning in 2019. Like its bonded debt, the Common-wealth’s pension debt has grown rapidly in recent years.43
While the Commonwealth has a variety of options for man-aging these liabilities, they are nonetheless obligations that are relevant in assessing the overall balance sheet.
In sum, Puerto Rico stands out as a highly indebted juris-diction. Comparisons of debt burdens on the Island and in the U.S. mainland states are difficult owing to the influence of large public-sector corporations in both revenues and expenditures and to the fact that most residents of Puerto Rico do not pay federal income taxes. A comparison with other countries, however, shows that Puerto Rico’s debt
Figure 15. Debt Burdens in Advanced Economies Including Puerto Rico
0
50
100
150
200
250
Perc
ent o
f Ann
ual G
DP
Sources: Government Development Bank for Puerto Rico; Commonwealth’s 2012 Comprehensive Annual Financial Report; International Monetary Fund.Note: Gross national product is used for Puerto Rico and gross domestic product for the others.
Figure 16. Debt Burdens in Emerging-Market Economies Including Puerto Rico
0
20
40
60
80
100
120
Perc
ent o
f Ann
ual G
DP
Sources: Government Development Bank for Puerto Rico; Commonwealth’s 2012 Comprehensive Annual Financial Report; International Monetary Fund.Note: Gross national product is used for Puerto Rico and gross domestic product for the others.
An Update on the COMPETITIVENESS of PUERTO RICO’S ECONOMY

19
An Update on the COMPETITIVENESS of PUERTO RICO’S ECONOMY
43 See Commonwealth of Puerto Rico, Financial Information and Operating Data Report, October 18, 2013, p. 96.
levels are among the highest in a group of advanced and emerging-market economies. It seems likely that many countries in a similar situation would have faced difficulty in continuing to raise money in the bond market. Also, it seems unlikely to be a coincidence that the other countries (excluding Japan and the United States) with debt levels
as large as Puerto Rico’s are also members of a currency union that have run large structural deficits. In Puerto Rico’s case, as noted earlier, subsidized access to the deep and liquid U.S. municipal bond market has likely allowed it to continue attracting investors and thus to persist in run-ning deficits.

44 Municipalities across the United States have a variety of public policy needs pertaining to infrastructure. Cities, states, and counties must provide for the education, health, and welfare of their citizens. When sourcing the capital needed to build schools, roads, and hospitals in pursuit of these policy objectives, municipalities usually turn to the capital markets. In sum, municipalities across the country have borrowed more than $3.7 trillion in pursuit of a variety of objectives. Without capital market access, municipalities are forced to finance new projects purely out of tax revenues—implying drastic increases in taxes or a delay in beginning projects as excess revenues are saved up.45 See “Troubling Winds,” Barron’s, August 26, 2013.46 Data on liquid assets are taken from the GDB’s Special Liquidity Update, March 5, 2014, p. 12.
VI. FISCAL DEVELOPMENTS IN PUERTO RICO: 2012–14
1. Rising Debt Levels and Market Access Concerns Puerto Rico’s rising debt level and weak economy did not appear to have a major impact on the availability and pricing of public financing for the Commonwealth during the 2000s, but they contributed to analysts’ growing concerns over the sustainability of its fiscal policy. A series of rating down-grades brought the Island’s credit rating to the lowest rung of investment grade by the end of 2012 and eventually to below investment grade in February 2014. During the course of 2013 and in early 2014 it became increasingly evident that the Puerto Rican government would have to implement fiscal and economic reforms in order to maintain access to debt capital markets on a sustainable basis.44
Market access in general is not easy to define. On the one hand, being able to borrow any money under even onerous terms could technically be considered having “access” to capital. On the other hand, many market participants regard an issuer whose bond yields are trading near distressed lev-els as not having normal market access.
The Commonwealth formally lost access to a large portion of its investor base after its debt was downgraded to below investment grade. Municipal mutual funds—which repre-sented roughly 20 percent of Puerto Rico’s investor base as of December 2013—often have restrictions on the types of debt they can invest in. Investment-grade funds, for example, typically have a limit on how much below-investment-grade debt they can hold in their portfolios. Market contacts believe that this category of funds is largely locked out of participating in future bond issuances by Puerto Rico, unless they sell enough existing Puerto Rico debt to get under their speculative-grade caps.
The mounting financial pressures on the Commonwealth also have been evident in the difference, or “spread,” between the yields on Puerto Rico’s debt and those of major municipal issu-ers with credit standings perceived to be strong. This spread is an indicator of how the market perceives the Island’s relative default risk. By the end of 2012, the spread was already among the widest of any U.S. state or territory. It increased slightly during May through June 2013, when prospects for Federal Reserve tapering sparked a period of global market volatility. Then the spread ballooned beginning in August 2013, when concerns over the Commonwealth’s fiscal sustainability inten-sified as its fiscal pressures became increasingly known to retail investors, as reflected in a front-page article in Barron’s high-lighting the Commonwealth’s economic difficulties.45
Holding only $1.2 billion in liquid assets at the Government Development Bank as of March 2014 and in the face of mount-ing market concerns about liquidity, the Island successfully reentered the capital markets on March 11 with a $3.5 billion bond issue.46 However, these bonds were issued at yields above 8 percent—a borrowing cost that would be clearly unsustain-able if applied to Puerto Rico’s entire debt load. The success of the bond offering, combined with its high costs, suggests that the Commonwealth retains limited market access.
2. Effects of Stress in Puerto Rico on Financial MarketsSome market participants have speculated that ongoing economic or market stress in Puerto Rico could represent a systemic risk to the U.S. municipal market. Thus far, based on market-based measures of stress such as yield spreads, it does not appear that investor concerns regarding Puerto Rico have spread to other municipal borrowers.
For example, since the onset of Puerto Rico’s recent period of market stress in August 2013, spreads on Puerto Rico’s
20
An Update on the COMPETITIVENESS of PUERTO RICO’S ECONOMY

21
An Update on the COMPETITIVENESS of PUERTO RICO’S ECONOMY
47 See Financial Information and Operating Data Report, October 18, 2013, pp. 122-24 and 128-29.
securities have diverged considerably from those of the broader municipal market [Figure 17]. From August 2013 to May 2014, the spread between an index of Puerto Rico’s securities and ten-year Treasury bonds rose by roughly 300 basis points, indicating that investors’ perceptions of risk surrounding Puerto Rico’s bonds have increased. By con-trast, the spread to Treasuries on a broad basket of AAA-rated municipal securities has actually declined. Likewise, Illinois—considered to be the riskiest U.S. state borrower by market participants—and Michigan—Detroit’s home state—have seen their spreads to Treasuries narrow as well.
Other market participants have suggested that contagion from Puerto Rico’s financial difficulties could spread to other mar-kets through monoline bond insurers. As of this writing, it does appear that events in Puerto Rico have coincided with declines in the share prices of two monoline insurers: Assured Guaranty and MBIA’s National Public Finance Guarantee Corporation [Figure 18]. Although some market participants have linked the two, market participants have also pointed out that monoline insurers are far less involved in the munic-ipal market today than they were prior to the financial cri-sis—implying that liquidity or solvency issues at a monoline insurer are significantly less likely to lead to contagion in the municipal market today than in the pre-2008 period.
3. Government Efforts to Strengthen Public FinancesEfforts by the Commonwealth government to strengthen Puerto Rico’s fiscal position began well before the Island’s recent fiscal crisis, but have intensified over the past two years. Early responses involved reducing the size of the public-sec-tor workforce over the course of 2007 through 2009—during which government employment fell by about 10 percent, or 40,000 workers—and introducing a fiscal stabilization plan in 2009 designed to reduce government expenditure and increase tax revenues. Despite these efforts, public-sector defi-cits remained substantial and the Island’s debt-to-GNP ratio increased an average of 4 percentage points annually from FY 2009 through FY 2012. As noted, public-sector corporations, including COFINA, accounted for nearly all of the increase.
More recent efforts to stabilize the fiscal accounts have focused on increasing revenues, expanding the tax base, and controlling expenses with a particular focus on pension reform. Major fiscal measures to raise tax revenue include raising income taxes on the self-employed and on high- income earners, introducing a tax on the gross receipts of the financial sector, and broadening the tax base by limiting or eliminating exemptions from sales taxes.47 In 2011, the government also passed Act 154, a special excise tax falling predominantly on multinational corporations. Tax payments
200
300
400
500
600
700
800
Aug-12 Feb-13 Aug-13 Feb-14-100
0
100
200
300
Figure 17. Municipal Single-State GO Spreads to U.S. TreasuryBasis points Basis points
Source: Thomson Reuters.
PR GO 10yr
AAA GO 10yr
MI GO 10yr
IL GO 10yr
Note: GO is general obligation.
200
300
400
500
600
700
800
Aug-12 Feb-13 Aug-13 Feb-140
5
10
15
20
25
30
35
40
Figure 18. Monoline Insurance Companies with Exposure to Puerto Rico Basis points Dollar Price
Sources: Thomson Reuters; Bloomberg L.P.
PR GO 10yr Spread
MBIA
Assured Guaranty
AMBAC

22
48 Ibid., pp. 28-29.49 For a review of the key revenue and expense provisions of the FY 2015 budget, see Center for a New Economy, “Fiscal Situation Update,” vol. 8, no. 1, June 2014.50 See Office of the Secretary, Department of the Treasury, “Preliminary May 2014 Tax Collections Up $141 Million Compared to Prior Year Period; Exceed Estimates by $29 Million,” June 10, 2014.
from this act have become a major source of Commonwealth government revenue. Regarding the public-sector corpora-tions, both water rates and fuel taxes were raised.48
On the expenditure side, government department budgets have been reduced and government payrolls remain flat. The government has begun to address the pension debt by carry-ing out a reform of the government employee retirement sys-tem and has made efforts to reform the teacher and judiciary retirement systems, although these reforms have met with only mixed success in the courts.
The Commonwealth’s recently enacted FY 2015 General Fund budget projects a balance. The budget is an import-ant step in the direction of following the government’s stated intention of ending the practice of running central government budget deficits.49 The projected balance in this
year’s budget comes a year earlier than had been previously planned. If they are achieved, the spending and revenue goals in the budget, together with the stance of not using deficit financing to support public-sector corporations, should greatly limit the issuance of new debt.
In addition to seeking to raise revenue, the Commonwealth is currently engaged with external consultants from KPMG who are working with government and private-sector ana-lysts to evaluate the Island’s corporate income, consumer, and property taxes.50 This is a broad effort to consider potential reforms to the tax structure. The goals of that study include looking carefully at the complex range of tax rates, exemptions, and other features that make up the sys-tem and pointing out where the tax structure may be inhib-iting growth and equity. Results and recommendations are expected by the end of 2014.
An Update on the COMPETITIVENESS of PUERTO RICO’S ECONOMY

23
An Update on the COMPETITIVENESS of PUERTO RICO’S ECONOMY
51 Nominal GNP growth has been significantly below 5.0 percent in recent years. Average interest rates on the Island’s outstanding debt are in the 4 to 5 percent range, although the rates on newly issued debt have greatly exceeded this average in the past several years. 52 For a full list of exclusions and other information, see http://www.gdb-pur.com/documents/06-25-14-PressRelease-RecoveryAct-Final.pdf.
VII. THE ISLAND’S FISCAL OUTLOOK
From a longer-term perspective, Puerto Rico faces a number of risks in stabilizing and reducing its public debt to levels that can be considered “sustainable.” Debt sustainability is generally defined as a condition where government debt is at a reasonable level—one with acceptable risks to market confidence and long-term economic growth—and not on a path to increase indefinitely relative to some measure of income. Stabilizing the Island’s debt as a share of GNP and then reducing debt to more sustainable levels has to be a key goal of the Island’s fiscal and economic policy.
While the precise path toward a lower debt burden is uncertain, the trend is largely determined by the interaction of three factors: 1) the government’s fiscal policy, 2) the growth rate of the economy, and 3) the interest rate on the public debt [see Box on page 30]. Future values of each of these variables are uncertain, and different combinations of debt issuance, interest rates, and growth rates will be consistent with sustainability. Moreover, the sustainability of a government’s fiscal policy is likely to be viewed in terms of a distribution of possible outcomes based on current and projected values of these variables, with the view of the range of likely outcomes varying over time.
The fiscal adjustments put in place already have had some success in cutting the projected FY 2014 budget gap. A
key risk, however, is that a weaker-than-expected economy could reduce income and tax revenues below projected lev-els. As noted earlier in this report, the growth rate of Puerto Rico’s economy has been weak for some time and, impor-tantly, in recent years it has been significantly lower than the interest rates on newly issued or refinanced debt.51 If Puerto Rico were to return to the higher annual rates of nominal GNP growth that prevailed prior to the mid-2000s, it would help move the debt situation toward sustainability, although it would still require the government to maintain a commit-ment to eliminate deficit financing.
Another factor that may affect Puerto Rico’s future public- sector debt level is the passage on June 25 of new legis-lation—the Public Corporations Debt Enforcement and Recovery Act—which would allow some public-sector corporations to restructure their debt. The law creates two tracks for a restructuring: an out-of-court negotiated pro-cess and an in-court process. The legislation is designed for certain public corporations and specifically excludes general obligation debt of, or debt guaranteed by, the Com-monwealth, the municipalities, and certain other entities including sales-tax-backed and pension bonds.52 As of this writing, no public-sector corporation has availed itself of the law. However, many market participants believe that PREPA is a likely candidate to make use of the new law in the coming months.

24
VIII. STEPS TOWARD FISCAL SUSTAINABILITY
In some ways, Puerto Rico’s fiscal data make it look like an advanced economy, but in other ways, it looks like a U.S. state. The major exception is debt. Conventionally measured, Puerto Rico’s debt levels are far higher than those of any state and are comparable to those of the most highly indebted countries. Some of these countries have encountered severe crises in recent years. As documented above, Puerto Rico itself has encountered difficulties in the last year—a sign that investors are expecting the Commonwealth to change several dimensions of its financial practices over the next several years if it is to restore its credit rating and regain access to low-cost credit.
Puerto Rico is not alone in facing fiscal problems like these. Governments frequently find that public-sector management becomes especially challenging when their economies are undergoing major transitions of the sort that Puerto Rico has experienced in the last decade. Within the United States, cit-ies like New York, Washington, and Philadelphia experienced major fiscal stresses as they adjusted to the transition from manufacturing to service-based economies. Those cities, faced with market pressures not unlike those facing the Common-wealth today, summoned the strong leadership and political will required to tackle their issues head-on and have emerged stron-ger. Detroit took longer to face the realities of its diminished fiscal capacity and is currently paying the price in the form of a painful bankruptcy process. The problems that these cities faced required the government and the private sector to work together to find solutions. In all cases, those solutions called for important changes and sacrifices. These adjustments were most effective when they were shared broadly rather than con-centrated in a single group. Puerto Rico has an opportunity to restore its fiscal health, but it needs to act.
In the spirit of assisting the Commonwealth in this endeavor, we describe the steps required to improve fiscal outcomes and restore access to low-cost credit.
Step 1: Reinvigorate efforts to raise economic growth While Puerto Rico has a number of features that make it a potentially strong economy, growth has been weak for almost a decade. It is critically important for policymak-ers to expand efforts to marshal the Island’s considerable
strengths—a bilingual and well-educated adult population, an open economy occupying a central position in the Carib-bean, wide experience as host to multinational corporations, and close ties to the U.S. mainland economy—in order to restore growth and raise living standards. Fundamentally, the government needs to reinvigorate its efforts to make the economic environment more supportive of growth, develop-ment, and innovation. Significant improvements in the econ-omy will help address the strikingly high unemployment and low labor force participation on the Island as well as contrib-ute to restoring the stability of public finances.
While the challenges to restoring growth are clearly com-plex, we want to highlight three key areas where policies to support efficiency and growth should be strengthened. First, barriers to job creation and labor force participation need to be reduced. The current structure of labor market incentives should be examined to ensure that firms do not face significant hurdles in creating jobs and that workers are not discouraged from entering the labor force. Second, policymakers should continue working to create a more dynamic business environment. Current efforts in this area could be strengthened, including the easing of unnecessary costs in setting up and operating a firm, particularly with respect to energy costs. Third, the Island should take a more proactive approach to utilizing its educated workforce and already established higher education system in the interest of economic development. One way is to consider expand-ing support for the formation of partnerships between higher education and industry, which have proven to be effective ways for regions to promote innovation, entrepreneurship, and economic growth. Puerto Rico has many of the requi-site characteristics for harnessing the benefits of these part-nerships between industry and education, and policymakers should begin looking for promising opportunities for mutu-ally beneficial collaboration.
Step 2: Reform the Commonwealth’s tax systemThe Commonwealth’s tax system tends to levy high rates on narrow bases. When tax rates are high, it increases incentives for activities to be shielded from taxes, perhaps by moving activity to the informal sector or by halting the activity alto-gether. Either way, collecting the necessary revenue requires rates to be even higher on activities that remain in the tax base, reinforcing the problem. Typically, comprehensive
An Update on the COMPETITIVENESS of PUERTO RICO’S ECONOMY

25
An Update on the COMPETITIVENESS of PUERTO RICO’S ECONOMY
53 See Denvil Duncan and Klara Peter, “Switching on the Lights: Do Higher Income Taxes Push Economic Activity into the Shade? National Tax Journal 67, no. 2, June 2014:,321-49.54 See F. Hameed, “Budget Transparency and Financial Markets,” IBP Working Paper 1, International Budget Partnership, 2011.
reform is necessary to break the cycle by simultaneously broadening the tax base and reducing rates across a range of taxes. Such a reform would likely produce a significant bonus in terms of faster economic growth, particularly in the formal sector. Recent research indicates that reducing rates and broadening the tax base can have very large effects on the relative size of the formal sector.53
As noted, a formal effort is currently under way to evaluate the effects of Puerto Rico’s current tax system on economic efficiency, equity, and growth. That effort, the Governor’s Advisory Group for a Tax Reform, is planning to release its report at the end of 2014. At this time no details of the study are available, although its intentions appear consistent with our proposal for a comprehensive reform. Following a review, the government will consider implementing proposed recom-mendations to the Island’s tax system in FY 2016.
Step 3: Improve the Commonwealth’s financial reportingPuerto Rico’s unique status means that it is one of the few places in the world where finances are not regularly surveyed by a public agency. As mentioned earlier, U.S. states report annually to the Census Bureau, and their localities report either annually or on a schedule determined by their size. The IMF generally reports on the finances of nations. These surveys were useful in the present study to compare other governmental entities to Puerto Rico, and in general they bring significant transparency to the finances of those enti-ties. This transparency is invaluable for policymakers and citizens wishing to understand, monitor, and exert control and discipline over the fiscal policies of their governments. The reports may also serve the purpose of increasing inves-tor understanding of how the Commonwealth’s finances compare with those of other governments. Since Puerto Rico falls through the cracks of these reporting systems, it may need to devise its own reports that are accessible to nonaccountants and allow comparability. Improved finan-cial reporting should enhance the Island’s access to financial
markets and will facilitate implementation of the following steps toward fiscal sustainability.
New York City’s experience in the 1970s shows the value of better reporting. Prior to its fiscal crisis in 1975-77, New York had poor financial reporting practices. As part of its recovery from that crisis, the city’s reporting improved dra-matically and has now won several awards. Along with those improvements, the city’s access to credit markets steadily increased. Economic research indicates that more transpar-ent budgets are associated with lower public-sector funding costs, other things equal.54 One method for achieving this end would be to strengthen the mandate and capacity of the Office of Management and Budget, the Puerto Rico Planning Board, and/or the Puerto Rico Institute of Statistics.
Step 4: Strengthen performance and harden budget constraints for public-sector corporationsA major difference between Puerto Rico’s balance sheet and those of the states is the presence of large, heavily indebted corporate-like entities that continue to lose money and increase borrowing. These entities have surely benefited from the Commonwealth’s access to the U.S. municipal bond market, but as noted above, they have now harmed that access, threatening the delivery of the Commonwealth’s core public services. For any financial reform agenda to be suc-cessful, it must confront this issue head-on.
Key elements of a successful reform strategy should include strengthening the public-sector corporations’ financial stand-ing and greatly increasing the efficiency of their operations. Additionally, future financial discipline could be enhanced through reform of public-sector corporations’ governance and ownership structures, including implementing selective privatization, setting targets for profitability and payments of dividends to the central government, strictly limiting and/or putting on a fully market basis Government Devel-opment Bank lending to the public-sector corporations, and

26
55 For data on the positive fiscal discipline that accrues from a multiyear budget, see Grigoli et al., “MTEFs and Fiscal Performance: Panel Data Evidence,” World Bank, September 2012. 56 See IMF Staff, “Functions and Impact of Fiscal Councils,” July 6, 2013, available at http://www.imf.org/external/np/pp/eng/2013/071613.pdf.
transparently budgeting for any remaining subsidies from the central government to these corporations within a reformed budget process.
Puerto Rico should also seek out the opportunity to benefit from outside expertise, especially the experiences of mainland states. As noted above, for utilities throughout the United States an independent regulator has become the norm. By leveraging the expertise and reputation of existing independent regulatory agencies, Puerto Rico can improve the efficiency of its pub-lic-sector corporations while reassuring investors.
Step 5: Adopt a capital budget and a binding balanced-budget rule for the central governmentThe Commonwealth’s large public-sector debt and the diffi-culty it currently faces in additional borrowing make it clear that its recent history of persistent structural deficits must come to an end, at least temporarily, if it is to regain full credit market access. Given the Commonwealth’s many similarities to main-land states, it is apparent that it would benefit from adopting fiscal institutions like those of the states. Balanced-budget rules in the states are far from perfect—there remain many ways that states can elude their intent—but it is indisputable that Puerto Rico has been far less inhibited about borrowing than any state. Most likely the ability of the Commonwealth to access the municipal bond market fostered this borrowing. By following the states’ model—splitting the budget into an operating piece that must be balanced and a capital piece that can be financed with debt—Puerto Rico could better align financing methods with its spending priorities. In addition, Puerto Rico should implement a strengthened rule for building and maintaining a “rainy day” fiscal reserve fund to improve the budget’s resil-ience to future economic shocks.
Step 6: Adopt a legislative framework requiring multiyear budgeting, specific fiscal targets, and monitoring mechanisms to help ensure that targets are metThe Commonwealth should supplement the actions recom-
mended in step 5 with legislative action that establishes a budget framework designed to stabilize and thereafter reduce public-sector debt to levels that would allow for flexibility in responding to future economic shocks and for financing of the Island’s investment expenditure needs. A key aspect of such a framework should be a requirement that the author-ities implement multiyear budgeting, in which revenue and expenditure plans are articulated over a three- to five-year horizon.55 Such a framework should also incorporate a review of the central government’s macroeconomic and fiscal forecasts by a nonpartisan independent entity, whose views and analysis should be published in coordination with the Commonwealth’s proposed budget for any given fiscal year. Recent IMF studies have shown that indepen-dent “fiscal councils,” analogous to the U.S. Congressional Budget Office or the U.K. Office for Budget Responsibility, can promote sustainable fiscal planning.56 The Independent Budget Office is a publically funded agency that performs a similar function in New York City. In addition, the authori-ties should adopt specific targets for public-sector debt and deficits designed as a first priority to stabilize overall debt and then to gradually lower it to levels more commensu-rate with that of other states and/or sovereigns. Such targets should help to focus and parameterize multiyear budgeting, enhance near-term market access, and eventually widen scope for new debt issuance to fund investment spending by the central and municipal governments.
In establishing these targets, the Commonwealth will face trade-offs between transparency, flexibility, accountability, and the strength of the link between the target and ultimate policy goal. We recommend that the Island set a target for the public-sector debt-to-GNP ratio using the overall public- sector budget balance as the main control variable. There are no hard and fast rules on appropriate debt target levels or time periods for achieving them, and Puerto Rico’s situation is additionally complicated by the debt of its public-sector corporations and their capital investment needs. If applied
An Update on the COMPETITIVENESS of PUERTO RICO’S ECONOMY

27
An Update on the COMPETITIVENESS of PUERTO RICO’S ECONOMY
57 Examples of the 60 percent threshold can be found in the EU’s Stability and Growth Pact and the debt target adopted by the Eastern Caribbean Currency Union.
to the overall public sector (including the general govern-ment and all of the public corporations), the long-term debt level target should probably be around 60 percent, though it should be emphasized that such a target should be imple-mented as a long-term goal so as to be minimally disruptive to Puerto Rico’s economic performance.57
These steps should be viewed as potential ways to address Puerto Rico’s fiscal stress. They will require changes to a number of past policies and practices as well as some degree of sacrifice by all sectors of the Island’s population—adjust-ments that can be difficult. But the experiences of many U.S. mainland cities suggest that it is possible to tackle these fis-cal pressures head-on and emerge stronger, and Puerto Rico clearly has the assets and attributes to do so. What is needed is a combination of short-term actions to solve Puerto Rico’s immediate problems and a clearly articulated longer-term plan for the fiscal and economic future of Puerto Rico. That plan should be communicated regularly and consistently
both within the Island and to the markets so that it can serve as the strategic framework for the needed short-term fixes. The recently released Agenda for the Economic Recovery of Puerto Rico appears to be a useful step in that direction.
To be successful, any plan to overcome the Island’s current fiscal problems needs to be the product of a shared sense of purpose by the major political parties. A plan that is deemed credible by the markets and is sustained through successive administrations will greatly help the Island get beyond the current fiscal crisis and allow the local economy to move for-ward. Further, the responsibility should not be thought of as exclusively that of the government. The experiences of U.S. mainland cities show that problems are best addressed when the government and private sector work together to find solu-tions. It is crucial that all parties act now to put the Island on the road to improving its fiscal health so that it can move toward becoming a more competitive economy and achieve higher standards of living for all its residents.

28
DEBT DYNAMICS AND SUSTAINABILITY• Starting from any given amount of accumulated government debt in year t-1, Dt-1, or equivalently the
beginning of year t, the change in that debt at the end of the year is equal to the budget deficit in t, which is defined as the difference between government spending on goods and services in year t, Gt, tax revenues, Tt, and interest payments on the outstanding debt, i * Dt-1, where i is the interest rate. Formally, we can write the following accounting identity:
Dt = Dt-1 + (i*Dt-1 + Gt – Tt). (1)
• The term Gt - Tt is the “primary deficit” referred to in the main text. The change in the government debt between year t-1 and year t is equal to the deficit in year t:
Dt – Dt-1 = (i*Dt-1 + Gt –Tt). (2)
• A deficit in the government fiscal account in any year adds to debt, a balanced budget keeps debt constant, and a surplus will reduce debt. This can be done either through increases in taxes, T, or declines in spending, G. If we further decompose the change in the debt into interest payments on the debt, (i*Dt-1), and the difference between spending and taxes, (Gt- Tt), then the debt can be held constant by a cut in spending or an increase in taxes that generates an excess of Gt over Tt, usually referred to as the primary surplus, sufficient to cover the interest payments on the debt. A primary surplus in excess of interest payments can thus repay part of the outstanding debt. In a more dynamic setting, as governments run deficits, the debt levels will rise over time. In order to stabilize the debt, and thus not have debt levels continuing to increase into the future, the government needs to run primary surpluses equal to the interest payments on the debt.
• Because economies grow over time, analyses of the evolution of government debt typically scale the level of debt to the level of output, or the debt-to-GNP ratio. Correspondingly, debt sustainability is often summarized as a condition whereby the debt-to-GNP ratio is constant.
• Dividing each term in (2) by GNP, written as Yt, and defining its (constant) growth rate as (1+g) = Yt/Yt-1 and using lowercase letters for variables written as a share of GNP, the change in the debt-to-income ratio in year t will depend on the initial level of outstanding debt to GNP, dt-1, the interest rate, i, the growth rate of the economy, g, and the size of the primary deficit, written as pdt. We can write this (approximately) as
(dt – dt-1) = (i – g) *dt-1 + pdt. (3)
• Thus the increase in the debt-to-GNP ratio will be larger the higher the difference between the interest rate and the economy’s growth rate, the higher the initial debt-to-GNP ratio, and the higher the ratio of the primary deficit to GNP. Alternatively, one could subtract inflation, measured in terms of the GDP deflator, from both i and g and arrive at the same condition expressed in terms of real interest and growth rates.
• This identity provides a guide to the determinants of the path of the debt-to-GNP ratio in Puerto Rico over time and, importantly, what it will take to achieve debt sustainability. One of the challenges is that the Island has a high debt-to-GNP ratio that has been rising for more than a decade. The real interest rate on the majority of the Island’s debt, particularly the debt that has been issued recently, is well above its real growth rate of the past decade. This high debt ratio, combined with relatively high interest rates and slow economic growth, implies a need to be on a path to achieve a primary surplus.
An Update on the COMPETITIVENESS of PUERTO RICO’S ECONOMY

FEDERAL RESERVE BANK of NEW YORK