Embed Size (px)
DESCRIPTION
Citation preview
© 2009 Ameriprise Financial, Inc. All rights reserved
Ameriprise FinancialInvested Assets as of December 31, 2008
This presentation has been revised to conform to the Company’s 2008 10-K presentation of Total Invested Assets.
2
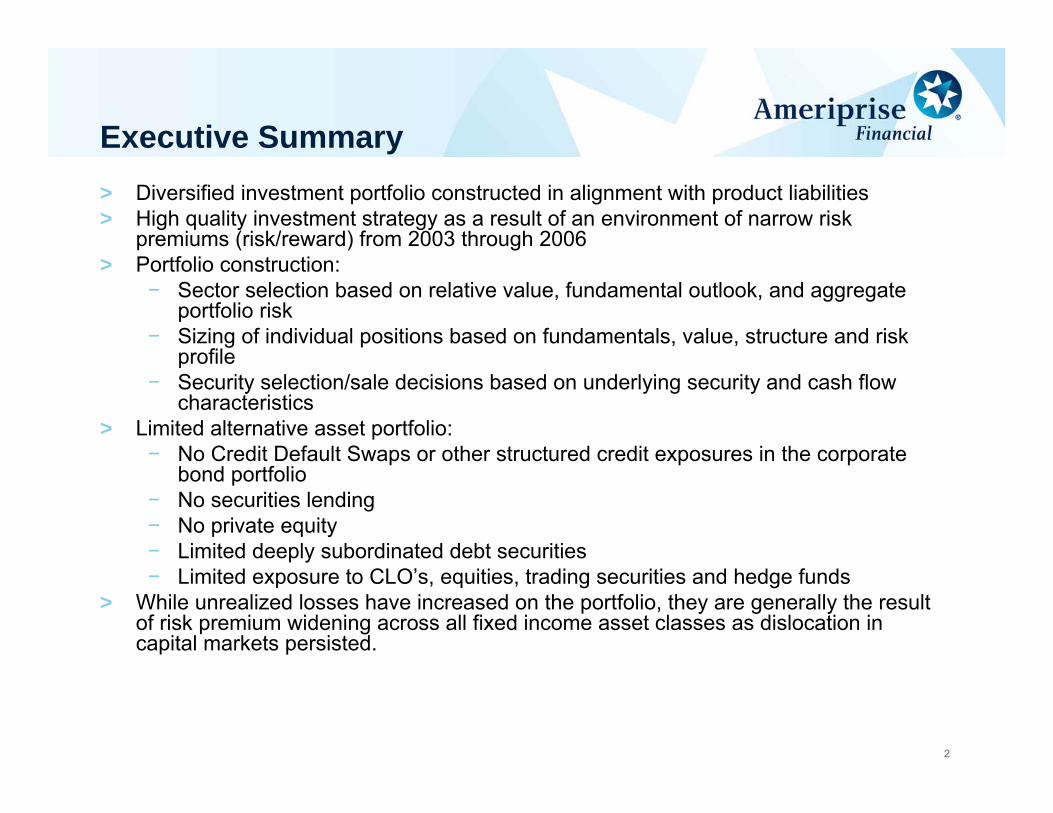
Executive Summary> Diversified investment portfolio constructed in alignment with product liabilities> High quality investment strategy as a result of an environment of narrow risk
premiums (risk/reward) from 2003 through 2006> Portfolio construction:
− Sector selection based on relative value, fundamental outlook, and aggregate portfolio risk
− Sizing of individual positions based on fundamentals, value, structure and risk profile
− Security selection/sale decisions based on underlying security and cash flow characteristics
> Limited alternative asset portfolio:− No Credit Default Swaps or other structured credit exposures in the corporate
bond portfolio− No securities lending− No private equity− Limited deeply subordinated debt securities− Limited exposure to CLO’s, equities, trading securities and hedge funds
> While unrealized losses have increased on the portfolio, they are generally the result of risk premium widening across all fixed income asset classes as dislocation in capital markets persisted.
3
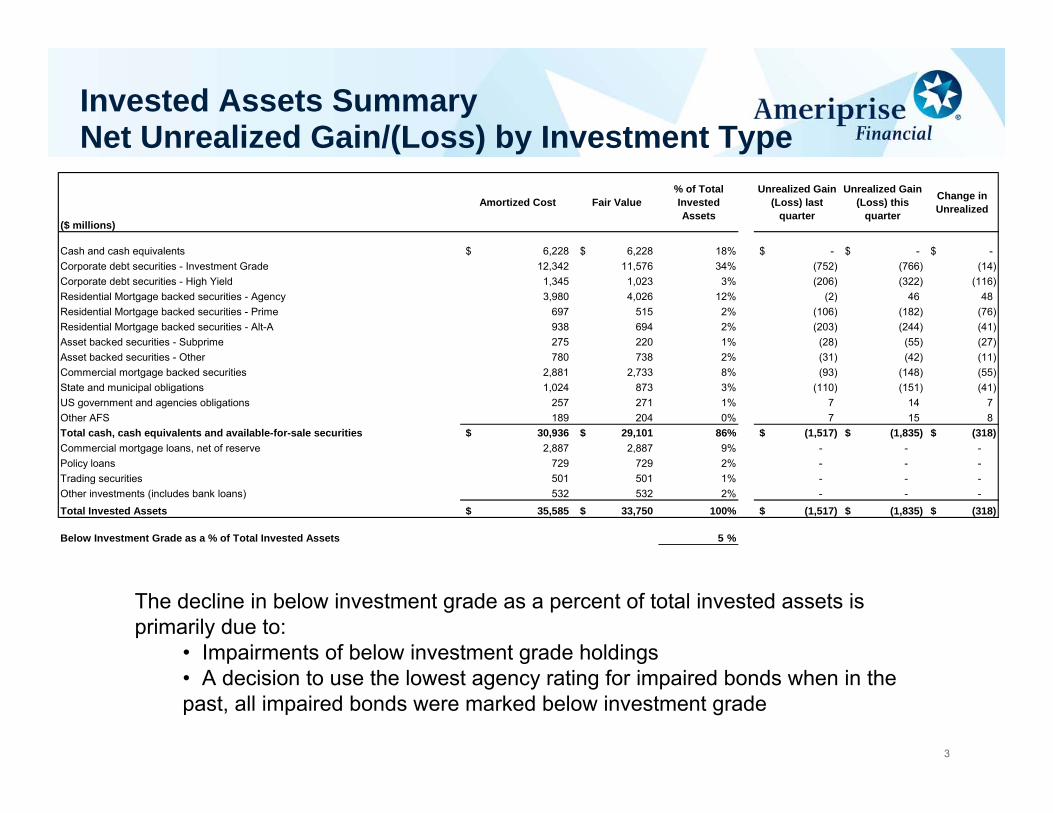
Invested Assets SummaryNet Unrealized Gain/(Loss) by Investment Type
The decline in below investment grade as a percent of total invested assets is primarily due to:
• Impairments of below investment grade holdings• A decision to use the lowest agency rating for impaired bonds when in the past, all impaired bonds were marked below investment grade
($ millions)
Amortized Cost Fair Value% of Total Invested Assets
Unrealized Gain (Loss) last
quarter
Unrealized Gain (Loss) this
quarter
Change in Unrealized
Cash and cash equivalents 6,228$ 6,228$ 18% -$ -$ -$ Corporate debt securities - Investment Grade 12,342 11,576 34% (752) (766) (14) Corporate debt securities - High Yield 1,345 1,023 3% (206) (322) (116) Residential Mortgage backed securities - Agency 3,980 4,026 12% (2) 46 48 Residential Mortgage backed securities - Prime 697 515 2% (106) (182) (76) Residential Mortgage backed securities - Alt-A 938 694 2% (203) (244) (41) Asset backed securities - Subprime 275 220 1% (28) (55) (27) Asset backed securities - Other 780 738 2% (31) (42) (11) Commercial mortgage backed securities 2,881 2,733 8% (93) (148) (55) State and municipal obligations 1,024 873 3% (110) (151) (41) US government and agencies obligations 257 271 1% 7 14 7 Other AFS 189 204 0% 7 15 8 Total cash, cash equivalents and available-for-sale securities 30,936$ 29,101$ 86% (1,517)$ (1,835)$ (318)$ Commercial mortgage loans, net of reserve 2,887 2,887 9% - - - Policy loans 729 729 2% - - - Trading securities 501 501 1% - - - Other investments (includes bank loans) 532 532 2% - - -
Total Invested Assets 35,585$ 33,750$ 100% (1,517)$ (1,835)$ (318)$
Below Investment Grade as a % of Total Invested Assets 5 %

4
Impairments by Investment Type
($ millions)
Amortized Cost Fair Value Govt Amortized Cost
Unrealized Loss Excl Govt
Unrealized Loss % of Amortized Cost Excl
Govt
Q4 Impairment/ Reserve Increases
Cash and cash equivalents 6,228$ 6,228$ -$ -$ -$ Available For Sale:
Corporate debt securities - Investment Grade 12,342 11,576 - (766) 6% (29) Corporate debt securities - High Yield 1,345 1,023 - (322) 24% (70) Residential Mortgage backed securities - Agency 3,980 4,026 3,980 - 0% - Residential Mortgage backed securities - Prime 697 515 - (182) 26% (16) Residential Mortgage backed securities - Alt-A 938 694 - (244) 26% (261) Asset backed securities - Subprime 275 220 - (55) 20% (10) Asset backed securities - Other 780 738 398 (45) 12% - Commercial mortgage backed securities 2,881 2,733 1,104 (172) 10% - State and municipal obligations 1,024 873 - (151) 15% - US government and agencies obligations 257 271 257 - 0% - Other AFS 189 204 - 15 -8% (3)
Total Available for Sale 24,708$ 22,873$ 5,739$ (1,922)$ 10% (389)$ Other Investments:Commercial mortgage loans, net of reserve 2,887 2,887 - - 0% (1) Policy loans 729 729 - - 0% - Trading securities 501 501 163 - 0% - Other investments (includes bank loans) 532 532 - - 0% (19)
Total Other Investments 4,649$ 4,649$ 163$ -$ 0% (20)$ Total Invested Assets 35,585$ 33,750$ 5,902$ (1,922)$ 6% (409)$
Notes:Impairments do not include Low Income Housing write-down ($11mm) due to revaluation.Does not include Gross Realized Gains ($1mm) or Gross Realized Losses ($1mm) on AFS investment dispositions during the quarter.
5
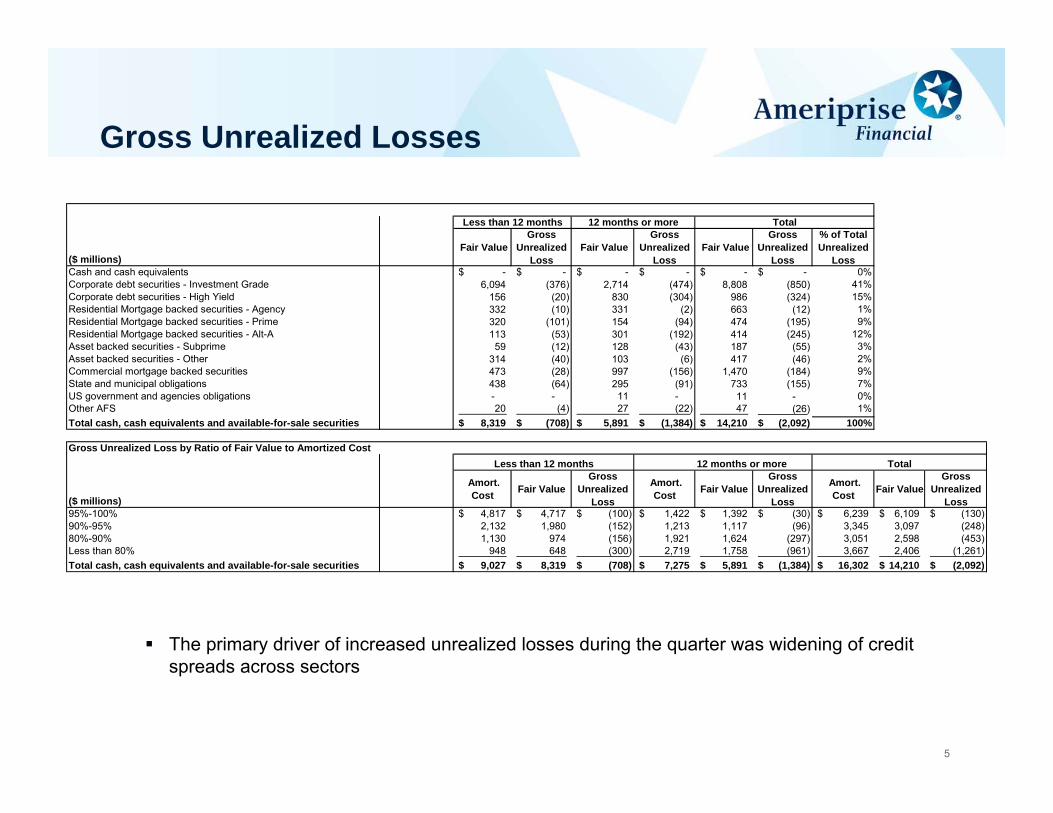
Gross Unrealized Losses
The primary driver of increased unrealized losses during the quarter was widening of credit spreads across sectors
($ millions) Fair Value
Gross Unrealized
Loss Fair Value
Gross Unrealized
Loss Fair Value
Gross Unrealized
Loss
% of Total Unrealized
LossCash and cash equivalents -$ -$ -$ -$ -$ -$ 0%Corporate debt securities - Investment Grade 6,094 (376) 2,714 (474) 8,808 (850) 41%Corporate debt securities - High Yield 156 (20) 830 (304) 986 (324) 15%Residential Mortgage backed securities - Agency 332 (10) 331 (2) 663 (12) 1%Residential Mortgage backed securities - Prime 320 (101) 154 (94) 474 (195) 9%Residential Mortgage backed securities - Alt-A 113 (53) 301 (192) 414 (245) 12%Asset backed securities - Subprime 59 (12) 128 (43) 187 (55) 3%Asset backed securities - Other 314 (40) 103 (6) 417 (46) 2%Commercial mortgage backed securities 473 (28) 997 (156) 1,470 (184) 9%State and municipal obligations 438 (64) 295 (91) 733 (155) 7%US government and agencies obligations - - 11 - 11 - 0%Other AFS 20 (4) 27 (22) 47 (26) 1%Total cash, cash equivalents and available-for-sale securities 8,319$ (708)$ 5,891$ (1,384)$ 14,210$ (2,092)$ 100%
12 months or more
($ millions)
Amort. Cost Fair Value
Gross Unrealized
Loss
Amort. Cost Fair Value
Gross Unrealized
Loss
Amort. Cost Fair Value
Gross Unrealized
Loss95%-100% 4,817$ 4,717$ (100)$ 1,422$ 1,392$ (30)$ 6,239$ 6,109$ (130)$ 90%-95% 2,132 1,980 (152) 1,213 1,117 (96) 3,345 3,097 (248) 80%-90% 1,130 974 (156) 1,921 1,624 (297) 3,051 2,598 (453) Less than 80% 948 648 (300) 2,719 1,758 (961) 3,667 2,406 (1,261) Total cash, cash equivalents and available-for-sale securities 9,027$ 8,319$ (708)$ 7,275$ 5,891$ (1,384)$ 16,302$ 14,210$ (2,092)$
Less than 12 months TotalGross Unrealized Loss by Ratio of Fair Value to Amortized Cost
Less than 12 months 12 months or more Total
6
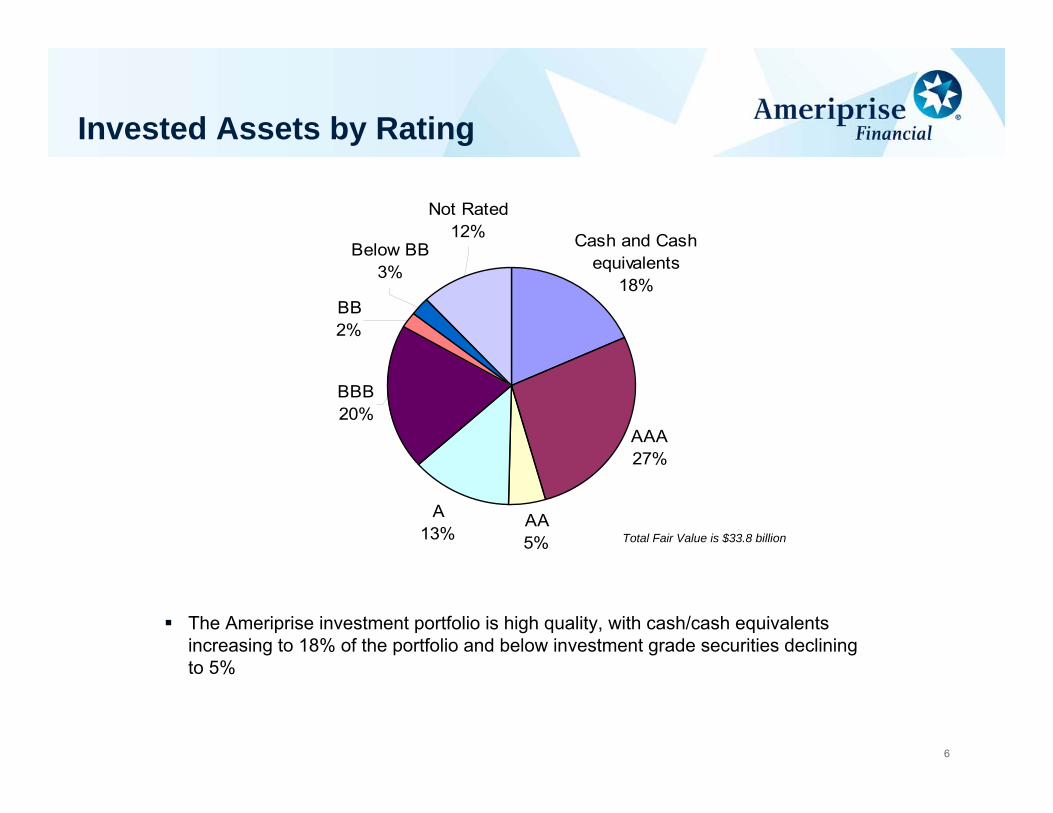
AAA27%
AA5%
A13%
BBB20%
Cash and Cash equivalents
18%
Below BB3%
BB2%
Not Rated12%
Invested Assets by Rating
The Ameriprise investment portfolio is high quality, with cash/cash equivalents increasing to 18% of the portfolio and below investment grade securities declining to 5%
Total Fair Value is $33.8 billion
7
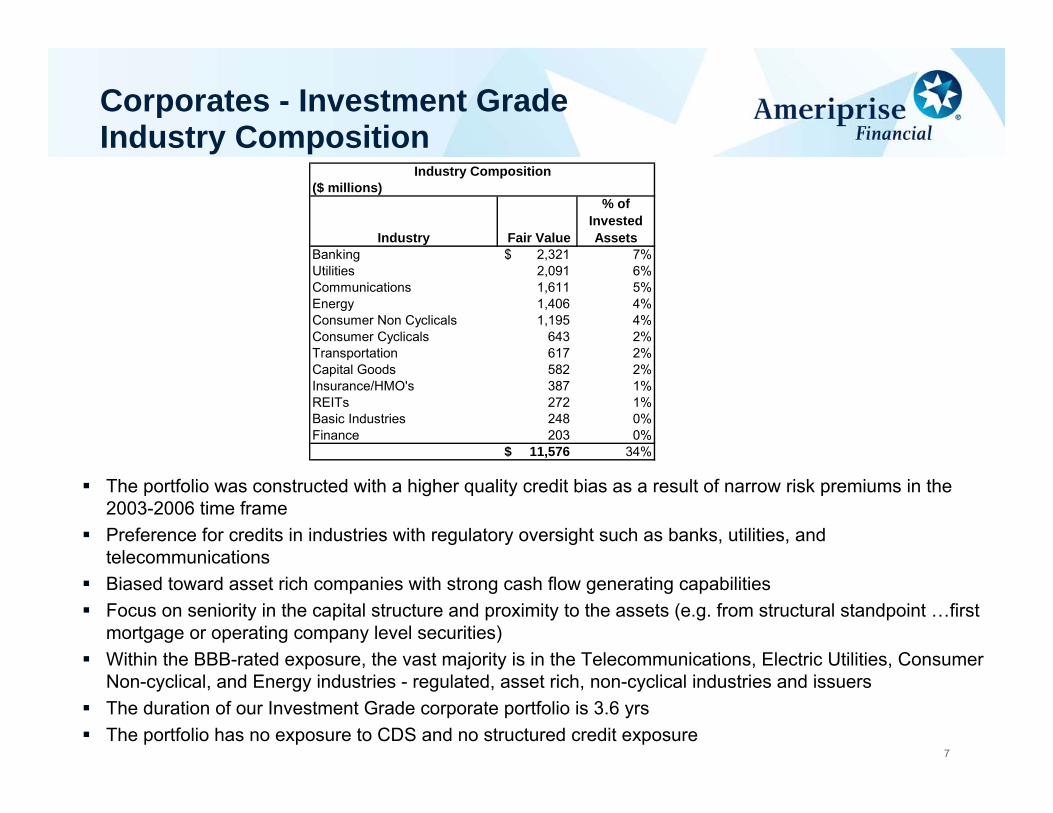
Corporates - Investment GradeIndustry Composition
The portfolio was constructed with a higher quality credit bias as a result of narrow risk premiums in the 2003-2006 time frame Preference for credits in industries with regulatory oversight such as banks, utilities, and telecommunicationsBiased toward asset rich companies with strong cash flow generating capabilitiesFocus on seniority in the capital structure and proximity to the assets (e.g. from structural standpoint …first mortgage or operating company level securities)Within the BBB-rated exposure, the vast majority is in the Telecommunications, Electric Utilities, Consumer Non-cyclical, and Energy industries - regulated, asset rich, non-cyclical industries and issuersThe duration of our Investment Grade corporate portfolio is 3.6 yrsThe portfolio has no exposure to CDS and no structured credit exposure
($ millions)
Industry Fair Value
% of Invested Assets
Banking 2,321$ 7%Utilities 2,091 6%Communications 1,611 5%Energy 1,406 4%Consumer Non Cyclicals 1,195 4%Consumer Cyclicals 643 2%Transportation 617 2%Capital Goods 582 2%Insurance/HMO's 387 1%REITs 272 1%Basic Industries 248 0%Finance 203 0%
11,576$ 34%
Industry Composition
8
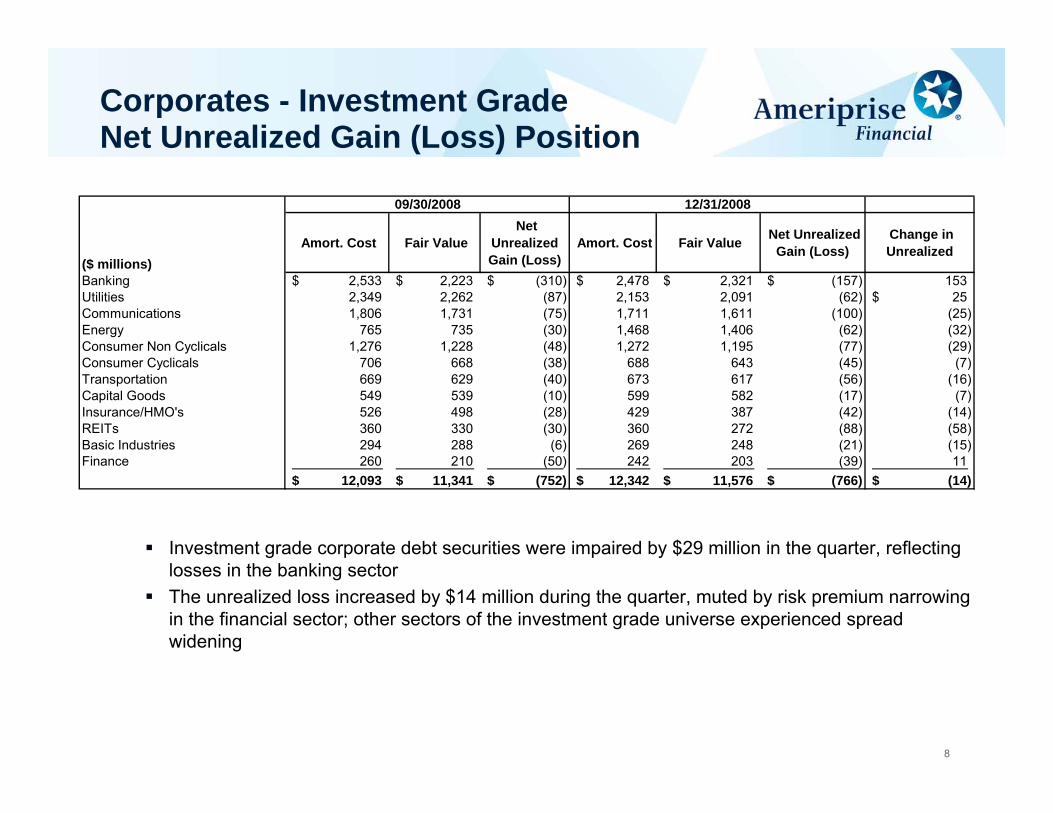
Corporates - Investment GradeNet Unrealized Gain (Loss) Position
Investment grade corporate debt securities were impaired by $29 million in the quarter, reflecting losses in the banking sectorThe unrealized loss increased by $14 million during the quarter, muted by risk premium narrowing in the financial sector; other sectors of the investment grade universe experienced spread widening
($ millions) Amort. Cost Fair Value
Net Unrealized Gain (Loss)
Amort. Cost Fair Value Net Unrealized Gain (Loss)
Change in Unrealized
Banking 2,533$ 2,223$ (310)$ 2,478$ 2,321$ (157)$ 153 Utilities 2,349 2,262 (87) 2,153 2,091 (62) 25$ Communications 1,806 1,731 (75) 1,711 1,611 (100) (25) Energy 765 735 (30) 1,468 1,406 (62) (32) Consumer Non Cyclicals 1,276 1,228 (48) 1,272 1,195 (77) (29) Consumer Cyclicals 706 668 (38) 688 643 (45) (7) Transportation 669 629 (40) 673 617 (56) (16) Capital Goods 549 539 (10) 599 582 (17) (7) Insurance/HMO's 526 498 (28) 429 387 (42) (14) REITs 360 330 (30) 360 272 (88) (58) Basic Industries 294 288 (6) 269 248 (21) (15) Finance 260 210 (50) 242 203 (39) 11
12,093$ 11,341$ (752)$ 12,342$ 11,576$ (766)$ (14)$
09/30/2008 12/31/2008
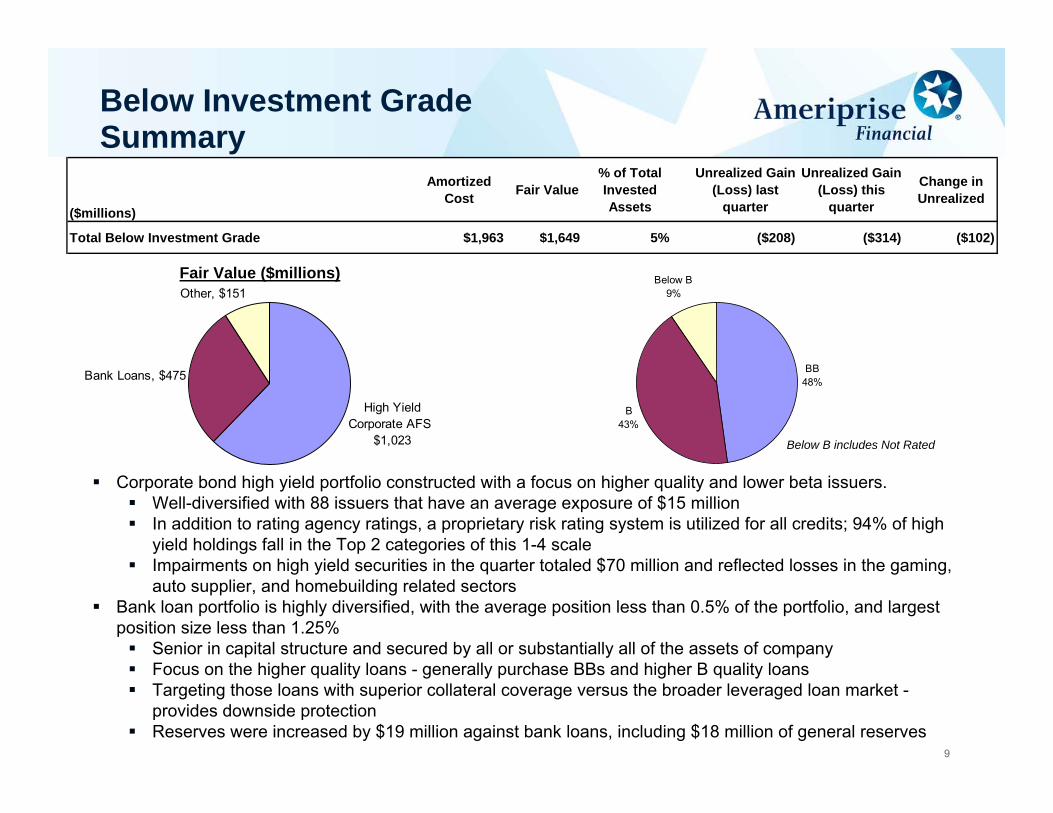
BB48%
B43%
Below B9%
9
Below Investment GradeSummary
Below B includes Not Rated
High Yield Corporate AFS
$1,023
Bank Loans, $475
Other, $151Fair Value ($millions)
($millions)
Amortized Cost Fair Value
% of Total Invested Assets
Unrealized Gain (Loss) last
quarter
Unrealized Gain (Loss) this
quarter
Change in Unrealized
Total Below Investment Grade $1,963 $1,649 5% ($208) ($314) ($102)
Corporate bond high yield portfolio constructed with a focus on higher quality and lower beta issuers.Well-diversified with 88 issuers that have an average exposure of $15 million In addition to rating agency ratings, a proprietary risk rating system is utilized for all credits; 94% of high yield holdings fall in the Top 2 categories of this 1-4 scale Impairments on high yield securities in the quarter totaled $70 million and reflected losses in the gaming, auto supplier, and homebuilding related sectors
Bank loan portfolio is highly diversified, with the average position less than 0.5% of the portfolio, and largest position size less than 1.25%
Senior in capital structure and secured by all or substantially all of the assets of companyFocus on the higher quality loans - generally purchase BBs and higher B quality loansTargeting those loans with superior collateral coverage versus the broader leveraged loan market -provides downside protectionReserves were increased by $19 million against bank loans, including $18 million of general reserves
10
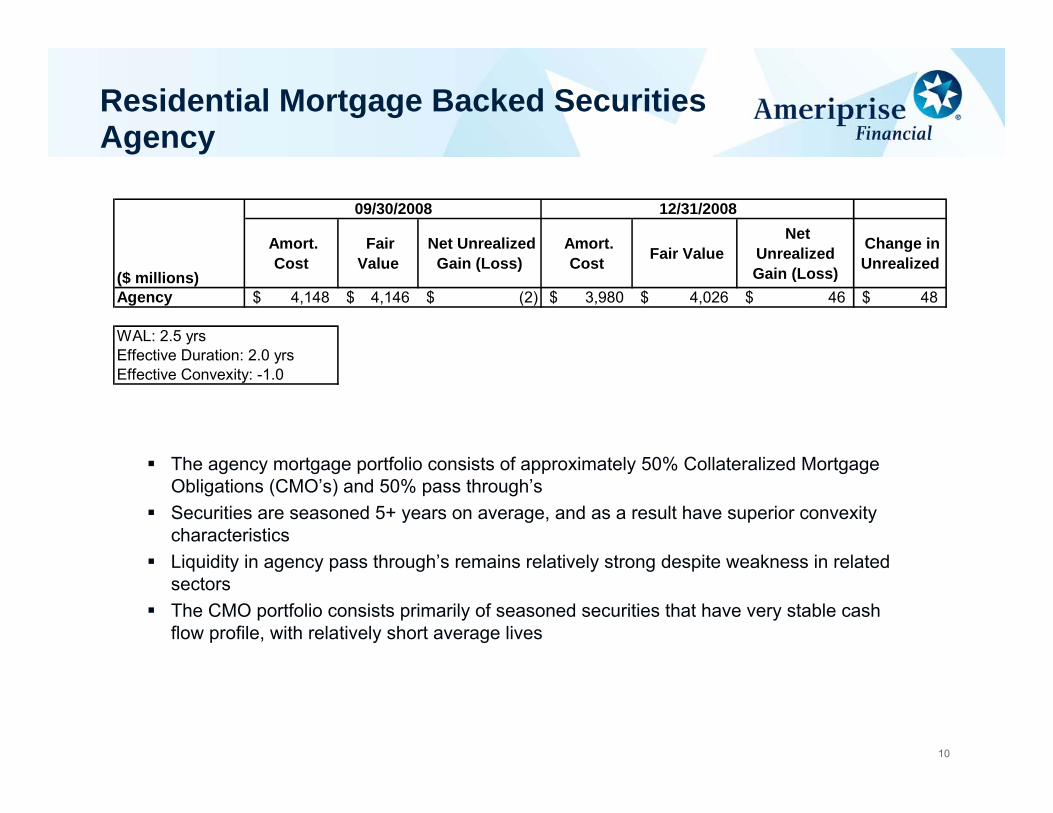
Residential Mortgage Backed SecuritiesAgency
The agency mortgage portfolio consists of approximately 50% Collateralized Mortgage Obligations (CMO’s) and 50% pass through’sSecurities are seasoned 5+ years on average, and as a result have superior convexity characteristicsLiquidity in agency pass through’s remains relatively strong despite weakness in related sectorsThe CMO portfolio consists primarily of seasoned securities that have very stable cash flow profile, with relatively short average lives
($ millions)
Amort. Cost
Fair Value
Net Unrealized Gain (Loss)
Amort. Cost Fair Value
Net Unrealized Gain (Loss)
Change in Unrealized
Agency 4,148$ 4,146$ (2)$ 3,980$ 4,026$ 46$ 48$
WAL: 2.5 yrs Effective Duration: 2.0 yrs Effective Convexity: -1.0
09/30/2008 12/31/2008
11
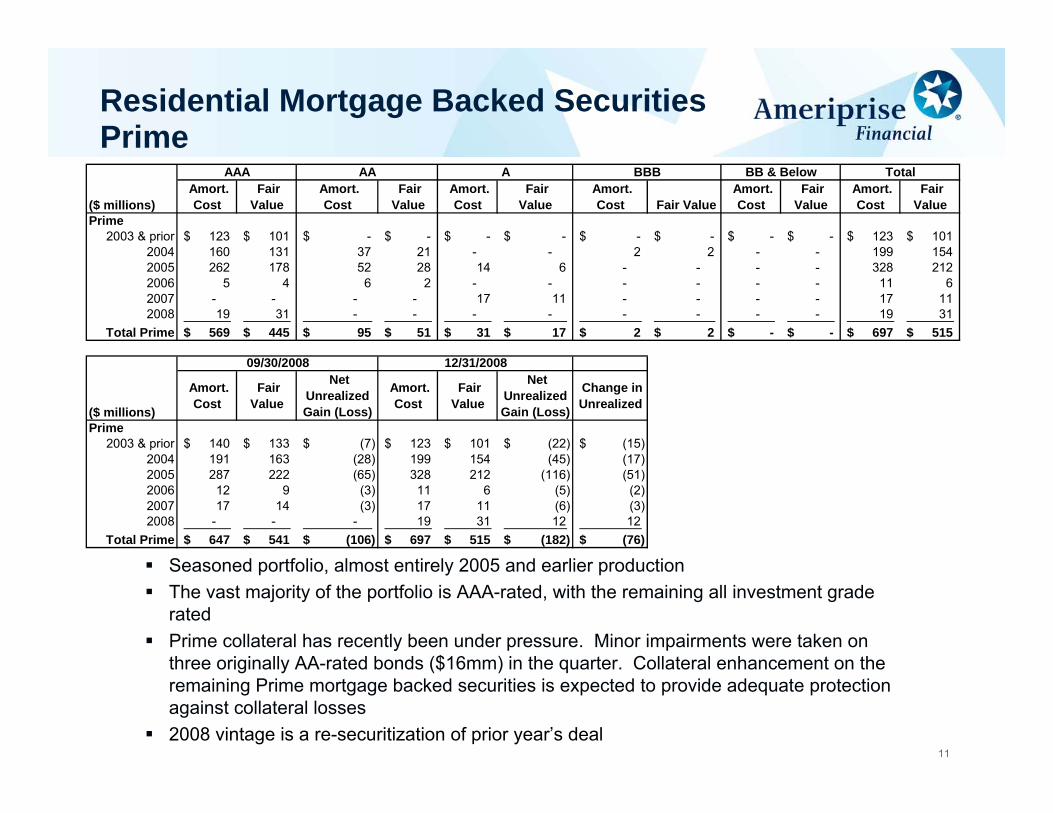
Residential Mortgage Backed SecuritiesPrime
Seasoned portfolio, almost entirely 2005 and earlier productionThe vast majority of the portfolio is AAA-rated, with the remaining all investment grade ratedPrime collateral has recently been under pressure. Minor impairments were taken on three originally AA-rated bonds ($16mm) in the quarter. Collateral enhancement on the remaining Prime mortgage backed securities is expected to provide adequate protection against collateral losses2008 vintage is a re-securitization of prior year’s deal
AAA AA A BBB BB & Below Total
($ millions) Amort.
Cost Fair
Value Amort.
Cost Fair Value
Amort. Cost
Fair Value
Amort. Cost Fair Value
Amort. Cost
Fair Value
Amort. Cost
Fair Value
Prime2003 & prior 123$ 101$ -$ -$ -$ -$ -$ -$ -$ -$ 123$ 101$
2004 160 131 37 21 - - 2 2 - - 199 154 2005 262 178 52 28 14 6 - - - - 328 212 2006 5 4 6 2 - - - - - - 11 6 2007 - - - - 17 11 - - - - 17 11 2008 19 31 - - - - - - - - 19 31
Total Prime 569$ 445$ 95$ 51$ 31$ 17$ 2$ 2$ -$ -$ 697$ 515$
($ millions)
Amort. Cost
Fair Value
Net Unrealized Gain (Loss)
Amort. Cost
Fair Value
Net Unrealized Gain (Loss)
Change in Unrealized
Prime2003 & prior 140$ 133$ (7)$ 123$ 101$ (22)$ (15)$
2004 191 163 (28) 199 154 (45) (17) 2005 287 222 (65) 328 212 (116) (51) 2006 12 9 (3) 11 6 (5) (2) 2007 17 14 (3) 17 11 (6) (3) 2008 - - - 19 31 12 12
Total Prime 647$ 541$ (106)$ 697$ 515$ (182)$ (76)$
09/30/2008 12/31/2008
12
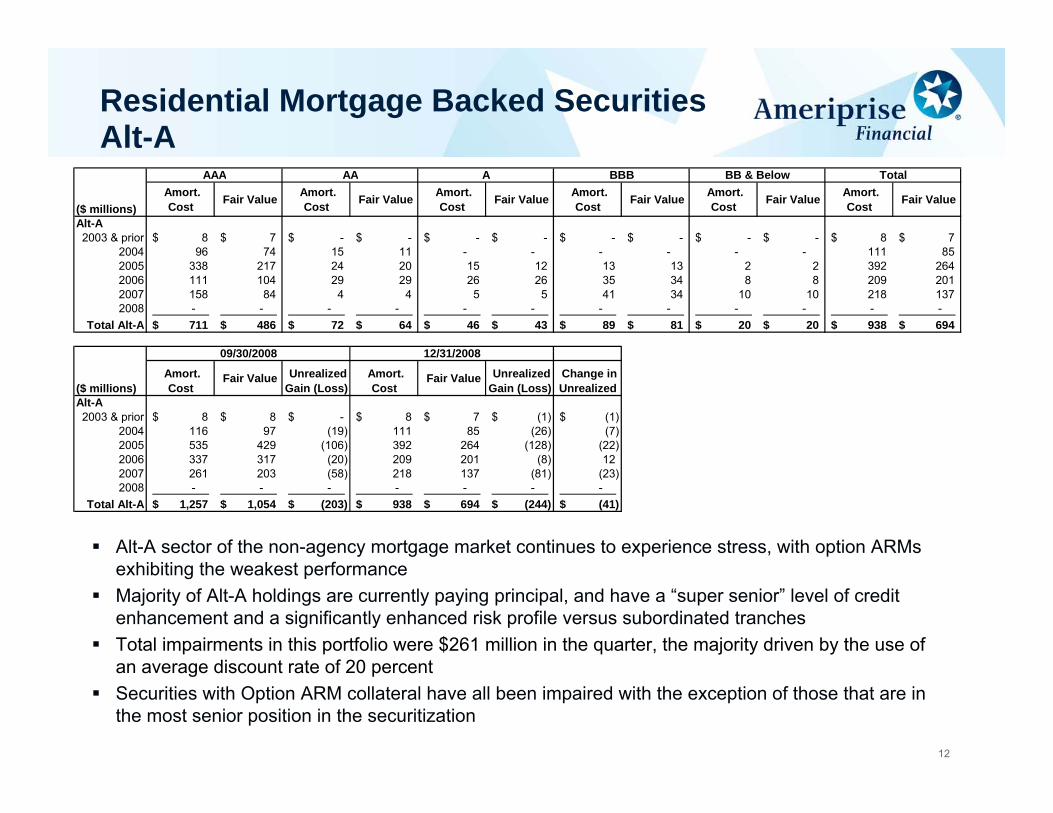
Residential Mortgage Backed SecuritiesAlt-A
Alt-A sector of the non-agency mortgage market continues to experience stress, with option ARMsexhibiting the weakest performanceMajority of Alt-A holdings are currently paying principal, and have a “super senior” level of credit enhancement and a significantly enhanced risk profile versus subordinated tranchesTotal impairments in this portfolio were $261 million in the quarter, the majority driven by the use of an average discount rate of 20 percentSecurities with Option ARM collateral have all been impaired with the exception of those that are in the most senior position in the securitization
AAA AA A BBB BB & Below Total
($ millions) Amort.
Cost Fair Value Amort. Cost Fair Value Amort.
Cost Fair Value Amort. Cost Fair Value Amort.
Cost Fair Value Amort. Cost Fair Value
Alt-A2003 & prior 8$ 7$ -$ -$ -$ -$ -$ -$ -$ -$ 8$ 7$
2004 96 74 15 11 - - - - - - 111 85 2005 338 217 24 20 15 12 13 13 2 2 392 264 2006 111 104 29 29 26 26 35 34 8 8 209 201 2007 158 84 4 4 5 5 41 34 10 10 218 137 2008 - - - - - - - - - - - -
Total Alt-A 711$ 486$ 72$ 64$ 46$ 43$ 89$ 81$ 20$ 20$ 938$ 694$
($ millions) Amort.
Cost Fair Value Unrealized
Gain (Loss) Amort.
Cost Fair Value Unrealized
Gain (Loss) Change in Unrealized
Alt-A2003 & prior 8$ 8$ -$ 8$ 7$ (1)$ (1)$
2004 116 97 (19) 111 85 (26) (7) 2005 535 429 (106) 392 264 (128) (22) 2006 337 317 (20) 209 201 (8) 12 2007 261 203 (58) 218 137 (81) (23) 2008 - - - - - - -
Total Alt-A 1,257$ 1,054$ (203)$ 938$ 694$ (244)$ (41)$
09/30/2008 12/31/2008
13
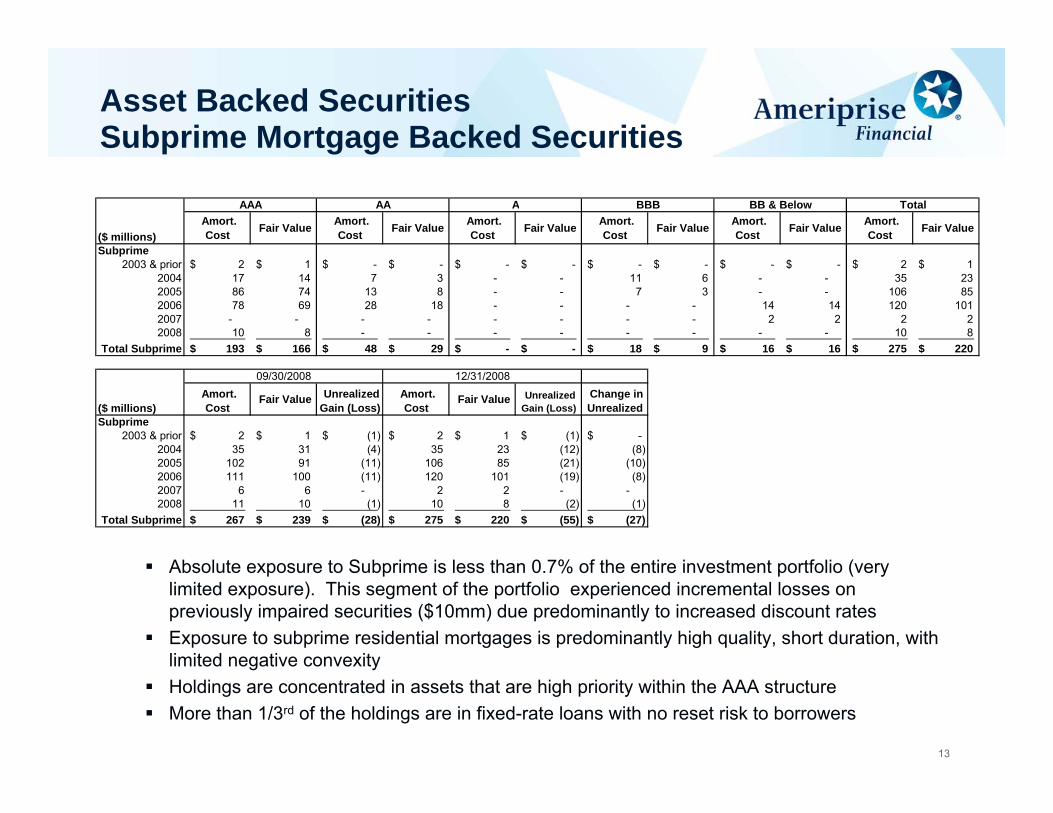
Asset Backed SecuritiesSubprime Mortgage Backed Securities
Absolute exposure to Subprime is less than 0.7% of the entire investment portfolio (very limited exposure). This segment of the portfolio experienced incremental losses on previously impaired securities ($10mm) due predominantly to increased discount ratesExposure to subprime residential mortgages is predominantly high quality, short duration, with limited negative convexityHoldings are concentrated in assets that are high priority within the AAA structureMore than 1/3rd of the holdings are in fixed-rate loans with no reset risk to borrowers
AAA AA A BBB BB & Below Total
($ millions) Amort.
Cost Fair Value Amort. Cost Fair Value Amort.
Cost Fair Value Amort. Cost Fair Value Amort.
Cost Fair Value Amort. Cost Fair Value
Subprime2003 & prior 2$ 1$ -$ -$ -$ -$ -$ -$ -$ -$ 2$ 1$
2004 17 14 7 3 - - 11 6 - - 35 23 2005 86 74 13 8 - - 7 3 - - 106 85 2006 78 69 28 18 - - - - 14 14 120 101 2007 - - - - - - - - 2 2 2 2 2008 10 8 - - - - - - - - 10 8
Total Subprime 193$ 166$ 48$ 29$ -$ -$ 18$ 9$ 16$ 16$ 275$ 220$
($ millions) Amort.
Cost Fair Value Unrealized
Gain (Loss) Amort.
Cost Fair Value Unrealized
Gain (Loss) Change in Unrealized
Subprime2003 & prior 2$ 1$ (1)$ 2$ 1$ (1)$ -$
2004 35 31 (4) 35 23 (12) (8) 2005 102 91 (11) 106 85 (21) (10) 2006 111 100 (11) 120 101 (19) (8) 2007 6 6 - 2 2 - - 2008 11 10 (1) 10 8 (2) (1)
Total Subprime 267$ 239$ (28)$ 275$ 220$ (55)$ (27)$
09/30/2008 12/31/2008
14
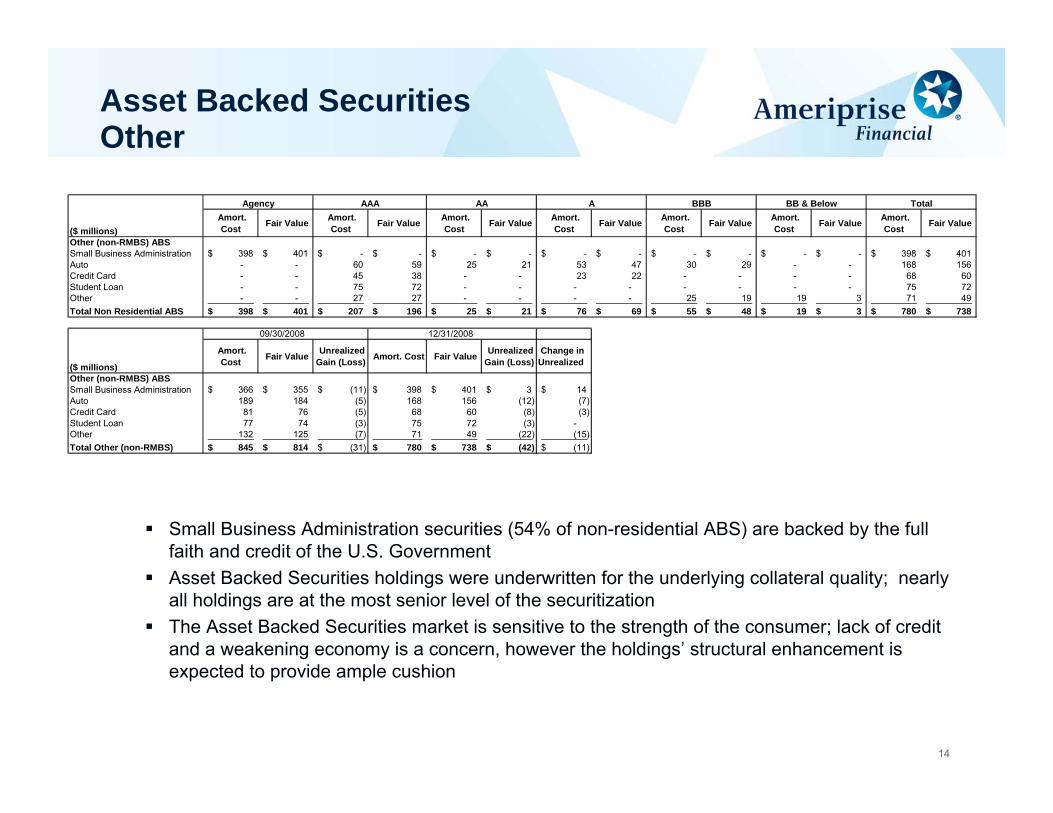
Asset Backed SecuritiesOther
Small Business Administration securities (54% of non-residential ABS) are backed by the full faith and credit of the U.S. GovernmentAsset Backed Securities holdings were underwritten for the underlying collateral quality; nearly all holdings are at the most senior level of the securitizationThe Asset Backed Securities market is sensitive to the strength of the consumer; lack of credit and a weakening economy is a concern, however the holdings’ structural enhancement is expected to provide ample cushion
Agency AAA AA A BBB BB & Below Total
($ millions) Amort.
Cost Fair Value Amort. Cost Fair Value Amort.
Cost Fair Value Amort. Cost Fair Value Amort.
Cost Fair Value Amort. Cost Fair Value Amort.
Cost Fair Value
Other (non-RMBS) ABSSmall Business Administration 398$ 401$ -$ -$ -$ -$ -$ -$ -$ -$ -$ -$ 398$ 401$ Auto - - 60 59 25 21 53 47 30 29 - - 168 156 Credit Card - - 45 38 - - 23 22 - - - - 68 60 Student Loan - - 75 72 - - - - - - - - 75 72 Other - - 27 27 - - - - 25 19 19 3 71 49 Total Non Residential ABS 398$ 401$ 207$ 196$ 25$ 21$ 76$ 69$ 55$ 48$ 19$ 3$ 780$ 738$
09/30/2008 12/31/2008
($ millions)
Amort. Cost Fair Value Unrealized
Gain (Loss) Amort. Cost Fair Value Unrealized Gain (Loss)
Change in Unrealized
Other (non-RMBS) ABSSmall Business Administration 366$ 355$ (11)$ 398$ 401$ 3$ 14$ Auto 189 184 (5) 168 156 (12) (7) Credit Card 81 76 (5) 68 60 (8) (3) Student Loan 77 74 (3) 75 72 (3) - Other 132 125 (7) 71 49 (22) (15) Total Other (non-RMBS) 845$ 814$ (31)$ 780$ 738$ (42)$ (11)$
15
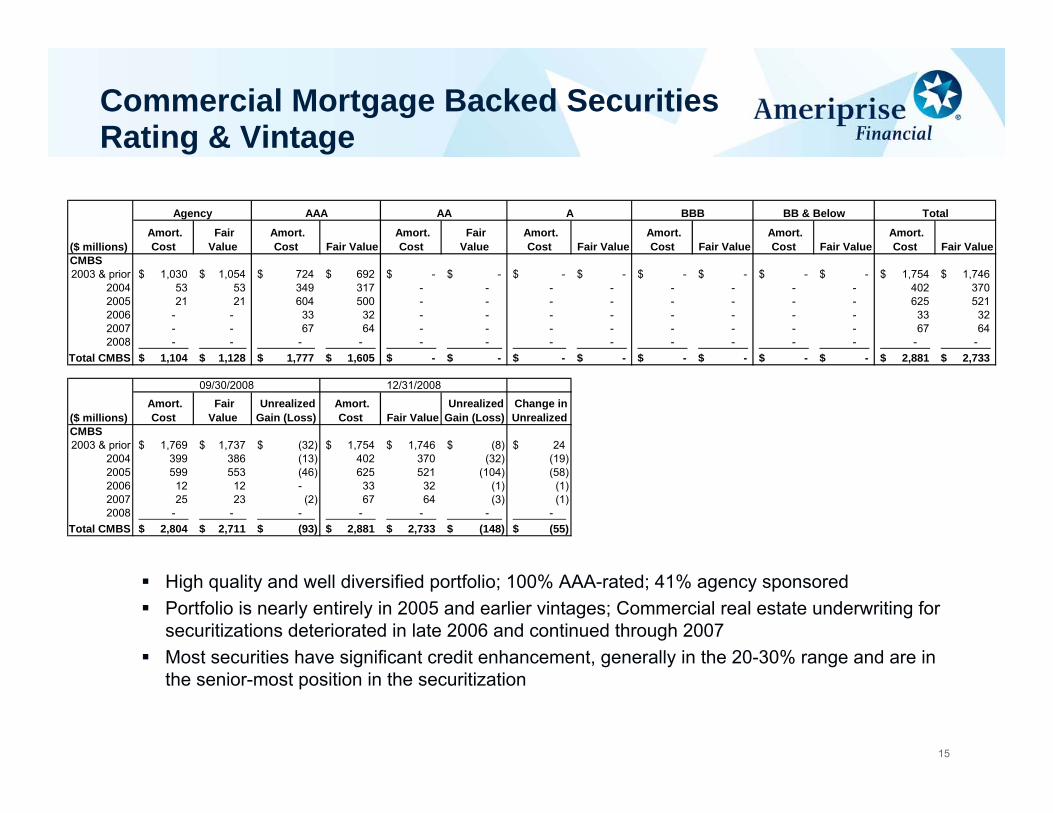
Commercial Mortgage Backed SecuritiesRating & Vintage
High quality and well diversified portfolio; 100% AAA-rated; 41% agency sponsoredPortfolio is nearly entirely in 2005 and earlier vintages; Commercial real estate underwriting for securitizations deteriorated in late 2006 and continued through 2007Most securities have significant credit enhancement, generally in the 20-30% range and are in the senior-most position in the securitization
Agency AAA AA A BBB BB & Below Total
($ millions) Amort.
Cost Fair Value
Amort. Cost Fair Value
Amort. Cost
Fair Value
Amort. Cost Fair Value
Amort. Cost Fair Value
Amort. Cost Fair Value
Amort. Cost Fair Value
CMBS2003 & prior 1,030$ 1,054$ 724$ 692$ -$ -$ -$ -$ -$ -$ -$ -$ 1,754$ 1,746$
2004 53 53 349 317 - - - - - - - - 402 370 2005 21 21 604 500 - - - - - - - - 625 521 2006 - - 33 32 - - - - - - - - 33 32 2007 - - 67 64 - - - - - - - - 67 64 2008 - - - - - - - - - - - - - -
Total CMBS 1,104$ 1,128$ 1,777$ 1,605$ -$ -$ -$ -$ -$ -$ -$ -$ 2,881$ 2,733$
($ millions) Amort.
Cost Fair Value
Unrealized Gain (Loss)
Amort. Cost Fair Value
Unrealized Gain (Loss)
Change in Unrealized
CMBS2003 & prior 1,769$ 1,737$ (32)$ 1,754$ 1,746$ (8)$ 24$
2004 399 386 (13) 402 370 (32) (19) 2005 599 553 (46) 625 521 (104) (58) 2006 12 12 - 33 32 (1) (1) 2007 25 23 (2) 67 64 (3) (1) 2008 - - - - - - -
Total CMBS 2,804$ 2,711$ (93)$ 2,881$ 2,733$ (148)$ (55)$
09/30/2008 12/31/2008
AA37%
A26%
BBB20%
BB0.1% AAA
17%
16
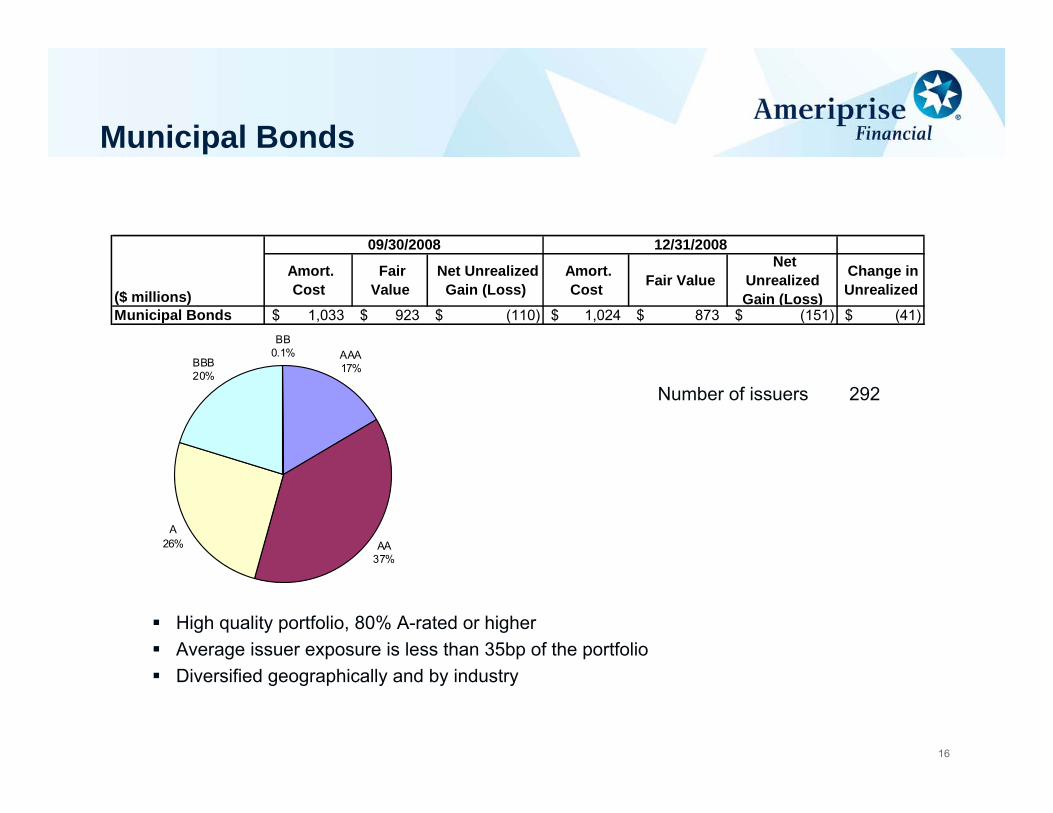
Municipal Bonds
High quality portfolio, 80% A-rated or higherAverage issuer exposure is less than 35bp of the portfolioDiversified geographically and by industry
Number of issuers 292
($ millions)
Amort. Cost
Fair Value
Net Unrealized Gain (Loss)
Amort. Cost Fair Value
Net Unrealized Gain (Loss)
Change in Unrealized
Municipal Bonds 1,033$ 923$ (110)$ 1,024$ 873$ (151)$ (41)$
09/30/2008 12/31/2008
17
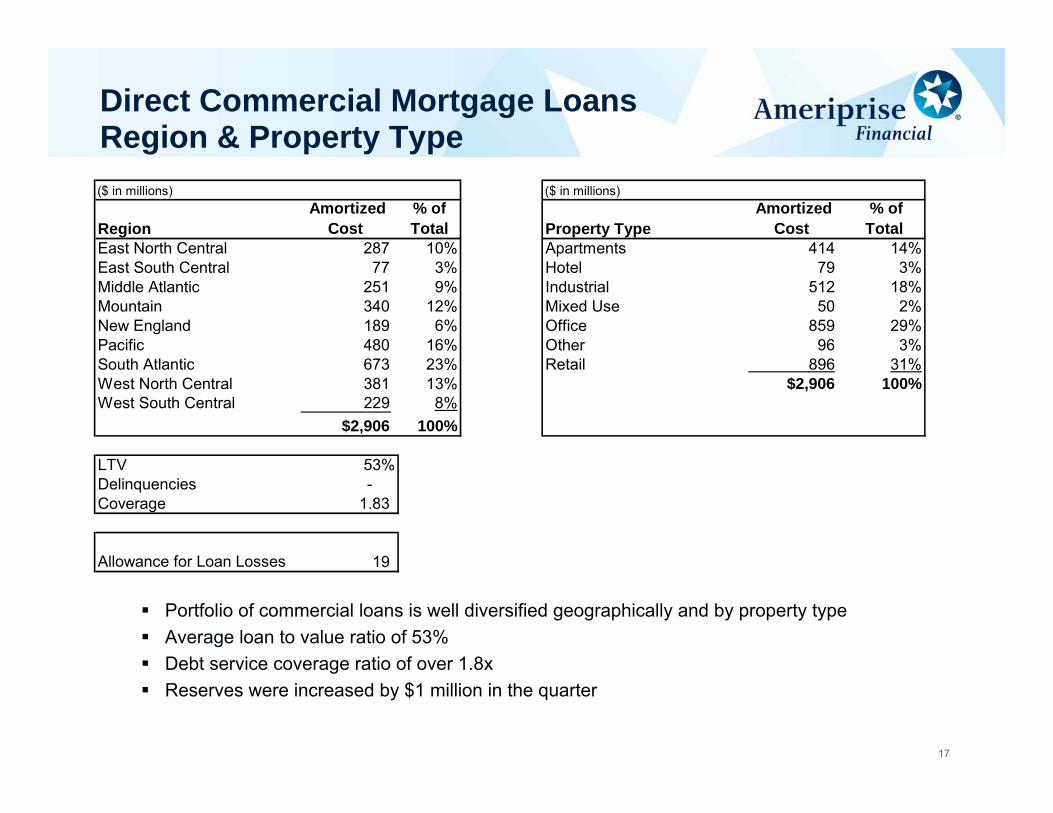
Direct Commercial Mortgage LoansRegion & Property Type
Portfolio of commercial loans is well diversified geographically and by property typeAverage loan to value ratio of 53%Debt service coverage ratio of over 1.8xReserves were increased by $1 million in the quarter
($ in millions) ($ in millions)
Region Amortized
Cost % of Total Property Type
Amortized Cost
% of Total
East North Central 287 10% Apartments 414 14%East South Central 77 3% Hotel 79 3%Middle Atlantic 251 9% Industrial 512 18%Mountain 340 12% Mixed Use 50 2%New England 189 6% Office 859 29%Pacific 480 16% Other 96 3%South Atlantic 673 23% Retail 896 31%West North Central 381 13% $2,906 100%West South Central 229 8%
$2,906 100%
LTV 53%Delinquencies - Coverage 1.83
Allowance for Loan Losses 19


![CHKSUM Content: CLEAN Merrill Corp - Ameriprise Financial ... · Merrill Corp - Ameriprise Financial [MCS] SCTPP Tuition Prepayment Program Annual Report [Funds] 06-30-2016 ED](https://img.pdfslide.us/doc/110x75/5f7fd34463dc0418df707254/chksum-content-clean-merrill-corp-ameriprise-financial-merrill-corp-ameriprise.jpg)