Embed Size (px)
Citation preview

SCHEDULE 14A INFORMATIONProxy Statement Pursuant to Section 14(a) of the Securities Exchange Act of 1934
Filed by the Registrant H
Filed by a party other than the registrant □
Check the appropriate box:
□ Preliminary proxy statement
□ Confidential, for use of the Commission only (as permitted by Rule 14a-6(e)(2))
H Definitive proxy statement
□ Definitive additional materials
□ Soliciting material pursuant to Rule 14a-11(c) or Rule 14a-12
The Allstate Corporation(Name of Registrant as Specified In Its Charter)
N/A(Name of Person(s) Filing Proxy Statement if other than the Registrant)
Payment of filing fee (check the appropriate box):
H No fee required.
□ Fee computed on table below per Exchange Act Rules 14a-6(i)(1) and 0-11
(1) Title of each class of securities to which transaction applies:
(2) Aggregate number of securities to which transaction applies:
(3) Per unit price or other underlying value of transaction computed pursuant to Exchange Act Rule 0-11 (setforth the amount on which the filing fee is calculated and state how it was determined):
(4) Proposed maximum aggregate value of transaction:
(5) Total fee paid:
□ Fee paid previously with preliminary materials.
□ Check box if any part of the fee is offset as provided by Exchange Act Rule 0-11(a)(2) and identify the filingfor which the offsetting fee was paid previously. Identify the previous filing by registration statement number, orthe form or schedule and the date of its filing.
(1) Amount previously paid:
(2) Form, Schedule or Registration Statement No.:
(3) Filing party:
(4) Date filed:

THE ALLSTATE CORPORATION
2775 Sanders Road
Northbrook, Illinois 60062-6127
March 27, 2000
Notice of Annual Meeting and Proxy Statement
Dear Stockholder:
You are invited to attend Allstate’s 2000 annual meeting of stockholders to be heldon Thursday, May 18, 2000. The meeting will be held at 11 a.m. in the Bank OneAuditorium, 1 Bank One Plaza (located at Dearborn and Madison), Chicago, Illinois.
Following this page are the following:
● The notice of meeting
● The proxy statement
● Financial information about Allstate and management’s discussion andanalysis of Allstate’s operations and financial condition
Also enclosed are the following:
● A proxy card
● A postage-paid envelope
● Allstate’s 1999 summary Annual Report
Your vote is important. You may vote by telephone, internet or mail. Pleaseuse one of these methods to vote before the meeting even if you plan to attend themeeting.
Sincerely,
Edward M. LiddyChairman, President andChief Executive Officer

THE ALLSTATE CORPORATION
2775 Sanders Road
Northbrook, Illinois 60062-6127
March 27, 2000
Notice of Annual Meeting of Stockholders
The annual meeting of stockholders of The Allstate Corporation will be held at theBank One Auditorium which is located on the Plaza level of the Bank One building, 1Bank One Plaza, Chicago, Illinois on Thursday, May 18, 2000, at 11 a.m. for thefollowing purposes:
1. To elect to the Board of Directors thirteen directors to serve until the 2001annual meeting
2. To ratify the appointment of Deloitte & Touche LLP as Allstate’s independentauditors for 2000
3. To consider a stockholder proposal for cumulative voting in elections ofdirectors
4. To consider a stockholder proposal for the endorsement of CERES principles
In addition, any other business properly presented may be acted upon at themeeting.
Allstate began mailing this proxy statement and proxy cards to its stockholders andto participants in its profit sharing fund on March 27, 2000.
By Order of the Board,
Robert W. PikeSecretary

Table of Contents
Page
Proxy and Voting Information . . . . . . . . . . . . . . . . . . . . . . . . . . . . . . . . . . . . . . . . . . . . . . . . . . . . . . . . . . . 1Item 1. Election of Directors . . . . . . . . . . . . . . . . . . . . . . . . . . . . . . . . . . . . . . . . . . . . . . . . . . . . . . . . . . . . 3
Nominees . . . . . . . . . . . . . . . . . . . . . . . . . . . . . . . . . . . . . . . . . . . . . . . . . . . . . . . . . . . . . . . . . . . . . . 3Meetings of the Board and Board Committees . . . . . . . . . . . . . . . . . . . . . . . . . . . . . . . . . . . . . . . . . . . . 5Functions of Board Committees . . . . . . . . . . . . . . . . . . . . . . . . . . . . . . . . . . . . . . . . . . . . . . . . . . . . . . 6Compensation Committee Interlocks and Insider Participation . . . . . . . . . . . . . . . . . . . . . . . . . . . . . . . . 6Directors’ Compensation and Benefits . . . . . . . . . . . . . . . . . . . . . . . . . . . . . . . . . . . . . . . . . . . . . . . . . 7Security Ownership of Directors and Executive Officers . . . . . . . . . . . . . . . . . . . . . . . . . . . . . . . . . . . . 8Security Ownership of Certain Beneficial Owners . . . . . . . . . . . . . . . . . . . . . . . . . . . . . . . . . . . . . . . . . 9
Item 2. Ratify Appointment of Auditors . . . . . . . . . . . . . . . . . . . . . . . . . . . . . . . . . . . . . . . . . . . . . . . . . . . . 9Item 3. Consideration of Stockholder Proposal on Cumulative Voting . . . . . . . . . . . . . . . . . . . . . . . . . . . . . . 9Item 4. Consideration of Stockholder Proposal Regarding CERES Principles . . . . . . . . . . . . . . . . . . . . . . . . . 11Executive Compensation . . . . . . . . . . . . . . . . . . . . . . . . . . . . . . . . . . . . . . . . . . . . . . . . . . . . . . . . . . . . . . . 13
Summary Compensation Table . . . . . . . . . . . . . . . . . . . . . . . . . . . . . . . . . . . . . . . . . . . . . . . . . . . . . . . 13Option/SAR Grants in 1999 . . . . . . . . . . . . . . . . . . . . . . . . . . . . . . . . . . . . . . . . . . . . . . . . . . . . . . . . . 14Option Exercises in 1999 and Option Values on December 31, 1999 . . . . . . . . . . . . . . . . . . . . . . . . . . . 14Long-Term Executive Incentive Compensation Plans . . . . . . . . . . . . . . . . . . . . . . . . . . . . . . . . . . . . . . . 15Pension Plans . . . . . . . . . . . . . . . . . . . . . . . . . . . . . . . . . . . . . . . . . . . . . . . . . . . . . . . . . . . . . . . . . . . 15Termination of Employment and Change-in-Control Arrangements . . . . . . . . . . . . . . . . . . . . . . . . . . . . 16Compensation and Succession Committee Report . . . . . . . . . . . . . . . . . . . . . . . . . . . . . . . . . . . . . . . . . 17Stock Performance Graph . . . . . . . . . . . . . . . . . . . . . . . . . . . . . . . . . . . . . . . . . . . . . . . . . . . . . . . . . . . 20
Section 16(a) Beneficial Ownership Reporting Compliance . . . . . . . . . . . . . . . . . . . . . . . . . . . . . . . . . . . . . . 20Certain Transactions . . . . . . . . . . . . . . . . . . . . . . . . . . . . . . . . . . . . . . . . . . . . . . . . . . . . . . . . . . . . . . . . . . 21Stockholder Proposals for Year 2001 Meeting . . . . . . . . . . . . . . . . . . . . . . . . . . . . . . . . . . . . . . . . . . . . . . . 21Proxy Solicitation . . . . . . . . . . . . . . . . . . . . . . . . . . . . . . . . . . . . . . . . . . . . . . . . . . . . . . . . . . . . . . . . . . . . 22Appendix A . . . . . . . . . . . . . . . . . . . . . . . . . . . . . . . . . . . . . . . . . . . . . . . . . . . . . . . . . . . . . . . . . . . . . . . . A-1
11-Year Summary of Selected Financial Data . . . . . . . . . . . . . . . . . . . . . . . . . . . . . . . . . . . . . . . . . . . . A-2Management’s Discussion and Analysis of Financial Condition and Results of Operations . . . . . . . . . . . A-4Consolidated Financial Statements A-33
Consolidated Statements of Operations . . . . . . . . . . . . . . . . . . . . . . . . . . . . . . . . . . . . . . . . . . . . . A-33Consolidated Statements of Comprehensive Income . . . . . . . . . . . . . . . . . . . . . . . . . . . . . . . . . . . . A-34Consolidated Statements of Financial Position . . . . . . . . . . . . . . . . . . . . . . . . . . . . . . . . . . . . . . . . A-35Consolidated Statements of Shareholders’ Equity . . . . . . . . . . . . . . . . . . . . . . . . . . . . . . . . . . . . . . A-36Consolidated Statements of Cash Flows . . . . . . . . . . . . . . . . . . . . . . . . . . . . . . . . . . . . . . . . . . . . . A-37
Notes to Consolidated Financial Statements . . . . . . . . . . . . . . . . . . . . . . . . . . . . . . . . . . . . . . . . . . . . . A-38Independent Auditors’ Report . . . . . . . . . . . . . . . . . . . . . . . . . . . . . . . . . . . . . . . . . . . . . . . . . . . . . . . . A-73

Proxy and Voting InformationWho is asking for your vote and why
The annual meeting will be held only if a majority of the outstanding common stock entitled to vote isrepresented at the meeting. If you vote before the meeting or if you attend the meeting in person, your shares will becounted for the purpose of determining whether there is a quorum. To ensure that there will be a quorum, the AllstateBoard of Directors is requesting that you vote before the meeting and allow your Allstate stock to be represented atthe annual meeting by the proxies named on the enclosed proxy card. Voting before the meeting will not prevent youfrom voting in person at the meeting. If you vote in person at the meeting, your previous vote will be automaticallyrevoked.
Who can vote
You are entitled to vote if you were a stockholder of record at the close of business on March 20, 2000. OnMarch 20, 2000, there were 751,791,781 Allstate common shares outstanding and entitled to vote at the annualmeeting.
How to vote
If you hold your shares in your own name as a record holder, you may instruct the proxies how to vote yourshares in any of the following ways:
● By using the toll-free telephone number printed on the proxy card
● By using the internet voting site listed on the proxy card
● By signing and dating the proxy card and mailing it in the enclosed postage-paid envelope to The AllstateCorporation, c/o First Chicago Trust Company, a division of EquiServe, P.O. Box 8010, Edison, NJ08818-9007
You may vote by telephone or internet 24 hours a day, seven days a week. If you hold your shares through abroker, bank or other nominee (in other words, in ‘‘street name’’), you may vote your shares by following theinstructions they have provided.
How votes are counted and discretionary voting authority of proxies
When you vote you may direct the proxies to withhold your votes from particular director nominees and to vote‘‘for,’’ ‘‘against,’’ or ‘‘abstain’’ with respect to each of the other proposals.
The thirteen nominees who receive the most votes will be elected to the open directorships even if they get lessthan a majority of the votes. For any other item to be voted on, more votes must be cast for it than against it.
Abstention with respect to any of items 2 through 4 will be counted as shares present at the meeting and willhave the effect of a vote against the matter. Broker non-votes (that is, if the broker holding your shares in street namedoes not vote with respect to a proposal) and shares as to which proxy authority is withheld with respect to aparticular matter will not be counted as shares voted on the matter and will have no effect on the outcome of thevote.
If you use the telephone, the internet or the proxy card to allow your shares to be represented at the annualmeeting by the proxies but you do not give voting instructions, then the proxies will vote your shares as follows onthe four matters set forth in this proxy statement:
● For all of the nominees for director listed in this proxy statement
● For the appointment of Deloitte & Touche LLP as Allstate’s independent auditors for 2000
● Against the stockholder proposal for cumulative voting in elections of directors
● Against the stockholder proposal for CERES principles
1

Other than the four items set forth in this proxy statement, Allstate knows of no other matters to be broughtbefore the meeting. If you use the telephone, the internet or the proxy card to allow your shares to be represented atthe annual meeting, the proxies may vote your shares in accordance with their judgment on any other matterspresented at the meeting.
How to change your vote
Before your shares have been voted at the annual meeting by the proxies, you may change or revoke your votein the following ways:
● Voting again by telephone, by internet or in writing
● Attending the meeting and voting your shares in person
Unless you attend the meeting and vote your shares in person, you should use the same method as when youfirst voted—telephone, internet or writing. That way, the inspectors of election will be able to identify your latestvote.
If you hold your shares in street name and you plan to attend the meeting, please bring documentation from therecord holder of your shares to demonstrate that you have the right to attend and to personally vote your shares.
Confidentiality
All proxies, ballots and tabulations that identify the vote of a particular stockholder are kept confidential, exceptas necessary to allow the inspectors of election to certify the voting results or to meet certain legal requirements.Representatives of First Chicago Trust Company, a division of EquiServe, will act as the inspectors of election andwill count the votes. They are independent of Allstate and its directors, officers and employees.
Comments written on proxy cards or ballots may be provided to the Secretary of Allstate with the name andaddress of the stockholder. The comments will be provided without reference to the vote of the stockholder, unlessthe vote is mentioned in the comment or unless disclosure of the vote is necessary to understand the comment. AtAllstate’s request, the inspectors of election may provide Allstate with a list of stockholders who have not voted andperiodic status reports on the aggregate vote. These status reports may include breakdowns of vote totals by differenttypes of stockholders, as long as Allstate is not able to determine how a particular stockholder voted.
Profit Sharing Participants
Participants in the Allstate profit sharing fund will receive a voting instruction form instead of a proxy card toprovide their voting instructions to The Northern Trust, the profit sharing fund trustee.
2

Item 1Election of Directors
Except for F. Duane Ackerman, Mary Alice Taylor and Judith A. Sprieser, each nominee was previously electedby the stockholders at Allstate’s 1999 Annual Meeting on May 18, 1999, and has served continuously as a directorfor the period succeeding the date of his or her election. The terms of all directors will expire at this annual meetingin May 2000. No person, other than the directors of Allstate acting solely in that capacity, is responsible for thenaming of the nominees. The Board of Directors expects all nominees named in this proxy statement to be availablefor election. If any nominee is not available, then the proxies may vote for a substitute.
Information as to each nominee follows. Unless otherwise indicated, each nominee has served for at least fiveyears in the business position currently or most recently held.
NomineesF. Duane Ackerman (Age 58)Director since October 1999
Chairman, President and Chief Executive Officer since 1997 of BellSouthCorporation, a communications services company. Mr. Ackerman previously served asPresident and Chief Executive Officer of BellSouth Corporation from 1996 to 1997 and asChief Operating Officer and Vice Chairman from 1995 to 1996.
James G. Andress (Age 61)Director since 1993
Chairman and Chief Executive Officer since February 1997 of Warner Chilcott PLC,a pharmaceutical company. Mr. Andress had been President, Chief Executive Officer and adirector of Warner Chilcott since 1996. Mr. Andress also served as its President and ChiefExecutive Officer from November 1996 until 1998. Previously, Mr. Andress was Co-ChiefExecutive Officer, Chief Operating Officer and President of Information Resources, Inc.(‘‘IRI’’), a market research and corporate software organization, from May 1994 untilSeptember 1995. Mr. Andress is also a director of IRI, OptionCare, Inc., Sepracor, Inc.,The Liposome Company, Inc. and Xoma Corporation.
Warren L. Batts (Age 67)Director since 1993
Chairman and Chief Executive Officer of Tupperware Corporation, a consumerproducts company, from June 1996 until his retirement in September 1997. He served asChairman and Chief Executive Officer of Premark International, Inc. from September 1986to June 1996 and as Chairman of the Board of Premark International, Inc. until September1997. He is also a director of Cooper Industries, Inc., The Derby Cycle Corporation, Sears,Roebuck and Co., and Sprint Corporation.
Edward A. Brennan (Age 66)Director since 1993
Chairman of the Board, President and Chief Executive Officer of Sears, Roebuck andCo. from January 1986 until his retirement in August 1995. Mr. Brennan is also a directorof AMR Corporation, Dean Foods Company, Minnesota Mining and ManufacturingCompany, Morgan Stanley Dean Witter & Co., The SABRE Group Holdings, Inc., andUnicom Corporation.
3

James M. Denny (Age 67)Director since 1993
Managing Director since September 1995 of William Blair Capital Partners, a privateequity fund. Mr. Denny served as Vice Chairman of Sears, Roebuck and Co. fromFebruary 1992 until his retirement in August 1995. He is also a director of ChoicePoint,Inc., GATX Corporation, and Gilead Sciences, Inc.
W. James Farrell (Age 57)Director since 1999
Chairman since May 1996 and Chief Executive Officer since September 1995 ofIllinois Tool Works Inc., a manufacturer of engineering and industrial components. Mr.Farrell served as President of Illinois Tool Works from September 1994 to May 1996 andas Executive Vice President from 1983 to 1994. He is also a director of Sears, Roebuckand Co. and the Quaker Oats Company.
Ronald T. LeMay (Age 54)Director since 1999
President and Chief Operating Officer since October 1997 of Sprint Corporation, aglobal communications company. Mr. LeMay was Chairman, President and ChiefExecutive Officer of Waste Management, Inc., a provider of waste management services,from July 1997 to October 1997. Previously, Mr. LeMay was President and ChiefOperating Officer of Sprint from February 1996 to July 1997 and Vice Chairman fromApril 1995 to February 1996. He was Chief Executive Officer of Sprint Spectrum L.P.from March 1995 to September 1996, and President of Sprint’s Long Distance Divisionfrom October 1989 to March 1995. Mr. LeMay is also as a director of CeridianCorporation, Imation Corporation, Sprint Corporation, Yellow Corporation, and Utilicorp.
Edward M. Liddy (Age 54)Director since 1999
Chairman, President and Chief Executive Officer of Allstate since January 1999. Mr.Liddy served as President and Chief Operating Officer of Allstate from January 1995 until1999. Before joining Allstate, Mr. Liddy was Senior Vice President and Chief FinancialOfficer of Sears, Roebuck and Co. He is also a director of The Kroger Co.
Michael A. Miles (Age 60)Director since 1993
Special Limited Partner since 1995 of Forstmann Little & Co., an investment bankingcompany. He is also a director of Dell Computer Corporation, The Interpublic Group ofCompanies, Inc., Morgan Stanley Dean Witter & Co., Sears, Roebuck and Co., and TimeWarner Inc.
H. John Riley, Jr. (Age 59)Director since 1998
Chairman, President and Chief Executive Officer since April 1996 of CooperIndustries Inc., a diversified manufacturer of electrical products and tools and hardware.Mr. Riley had served as President and Chief Executive Officer of Cooper since 1995 andas President and Chief Operating Officer from 1992 to 1995. He is also a director of BakerHughes Inc.
4

Joshua I. Smith (Age 58)Director since 1997
Chairman and Chief Executive Officer since 1978 of The MAXIMA Corporation, aprovider of technology systems support services. In June 1998, The MAXIMA Corporationfiled a voluntary petition for reorganization under Chapter 11 of the Bankruptcy ReformAct of 1978 in the United States Bankruptcy Court, District of Maryland. Mr. Smith is alsoa director of Caterpillar, Inc. and FDX Corporation.
Judith A. Sprieser (Age 46)Director since July 1999
Executive Vice President since 1998 of Sara Lee Corporation, a global consumerpackaged goods company. Ms. Sprieser served as Chief Financial Officer of Sara LeeCorporation from 1994 to 1998. Ms. Sprieser also serves as a director of The ChicagoNetwork and USG Corporation, and is a trustee of Northwestern University.
Mary Alice Taylor (Age 50)
Chairman and Chief Executive Officer of HomeGrocer.com since September 1999, aninternet e-commerce company. Ms. Taylor was Corporate Executive Vice President ofCitigroup, Inc. from January 1997 until September 1999. Previously, Ms. Taylor wasSenior Vice President of Federal Express Corporation from June 1980 until December1996. Ms. Taylor also serves as a director of Autodesk, Inc. and Dell ComputerCorporation. Ms. Taylor had previously served as a director of Allstate from March 1996until October 1998 when, because of her position at Citigroup, Inc. and its merger withThe Traveler’s Group in 1998, she resigned from the Allstate board.
Meetings of the Board and Board Committees
The Board held 8 meetings during 1999. Each incumbent director attended at least 75% of the Board meetingsand meetings of committees of which he or she was a member. The following table identifies the members of eachcommittee of the Board and states the number of meetings held by each such committee during 1999. A summary ofeach committee’s functions and responsibilities follows the table.
Director Audit Compensation andSuccession
Nominating andGovernance
F. Duane Ackerman U
James G. Andress U U
Warren L. Batts U* U
Edward A. Brennan U U*
James M. Denny U U
W. James Farrell U
Ronald T. LeMay U U
Michael A. Miles U* U
H. John Riley, Jr. U U
Joshua I. Smith U U
Judith A. Sprieser U
Number of Meetings in 1999 4 6 2
* Committee Chair
5

Audit Committee Functions:
● Review Allstate’s annual financial statements, annual report on Form 10-K and annual report tostockholders
● Review recommendations by the internal auditors and the independent auditors on accounting matters andinternal controls
● Advise the Board on the scope of audits
● Review reports by the internal auditors on management’s compliance with law and with Allstate’s policieson ethics and business conduct
● Confer with the General Counsel on the status of potentially material legal matters affecting Allstate’sfinancial statements
● Advise the Board on the appointment of independent auditors
● May conduct independent inquiries
Compensation and Succession Committee Functions:
● Recommend nominees for certain officer positions
● Administer Allstate’s executive compensation, stock option and benefit plans
● Advise the Board on the proxy statement and form of proxy for the annual meeting
● Annual review of management organization and succession plans for the senior officers of each significantoperating subsidiary
Nominating and Governance Committee Functions:
● Recommend nominees for election to the Board and its committees
● Recommend nominees for election as Chairman and Chief Executive Officer
● Determine the criteria for the assessment of the performance of the Board and administer non-employeedirector compensation
● Conduct periodic reviews of the performance of the Chairman and Chief Executive Officer
● Advise the Board on the proxy statement and form of proxy for the annual meeting
● Advise the Board on the establishment of guidelines on corporate governance
● Advise the Board on policies and practices on stockholder voting
Compensation Committee Interlocks and Insider Participation
During 1999, the Compensation and Succession Committee consisted of Warren L. Batts, Chairman, F. DuaneAckerman, James G. Andress, Edward A. Brennan, W. James Farrell, Ronald T. LeMay and H. John Riley, Jr.Mr. Ackerman was elected to the committee on November 3, 1999. None is a current or former officer of Allstate orany of its subsidiaries. There were no committee interlocks with other companies in 1999 within the meaning of theSecurities and Exchange Commission’s proxy rules.
6

Directors’ Compensation and Benefits
The following table lists the compensation and benefits provided in 1999 to directors who are not employees ofAllstate or its affiliates (‘‘non-employee directors’’):
Non-Employee Directors’ Compensation and Benefits
CashCompensation Equity Compensation
AnnualRetainer Fee(a)
Grant ofAllstate
Shares(b)
Stock Optionfor AllstateShares(c)
Board Membership $25,000 1,000 shares 3,000 sharesCommittee Chairperson:Audit, Compensation and Succession, Nominating and
Goverance Committees $ 5,000Committee Members:Audit, Compensation and Succession, Nominating and
Goverance Committees –0–
(a) Under Allstate’s Deferred Compensation Plan for Directors, directors may elect to defer directors’ fees to an account whichgenerates earnings based on:1. The market value of and dividends on Allstate’s common shares (‘‘common share equivalents’’)2. The average interest rate payable on 90-day dealer commercial paper3. Standard & Poor’s 500 Composite Stock Price Index (with dividends reinvested)4. A money market fundNo director has voting or investment powers in common share equivalents, which are payable solely in cash. Subject tocertain restrictions, amounts deferred under the plan (together with earnings thereon) may be transferred between accountsand are distributed in a lump sum or over a period not in excess of ten years.
(b) Granted each December 1st under the Equity Incentive Plan for Non-Employee Directors (the ‘‘Equity Plan’’) and subject torestrictions on transfer until the earliest of six months after grant, death or disability or termination of service. Grants areaccompanied by a cash payment to offset the increase in the director’s federal, state and local tax liabilities (assuming themaximum prevailing individual tax rates) resulting from the grant of shares. Directors who are elected to the board betweenannual shareholder meetings are granted a pro-rated number of Allstate shares on June 1st following the date of the director’sinitial election.
(c) Granted each June 1st at exercise prices equal to 100% of value on the date of grant. Directors who are elected to the boardbetween annual shareholder meetings are granted an option for a pro-rated number of shares on the date of their election at anexercise price equal to 100% of value on the date of their election. The options become exercisable in three equal annualinstallments, expire ten years after grant, and have a ‘‘reload’’ feature. The reload feature permits payment of the exerciseprice by tendering Allstate common stock, which in turn gives the option holder the right to purchase the same number ofshares tendered at a price equal to the fair market value on the exercise date. The options permit the option holder to exchangeshares owned or have option shares withheld to satisfy all or part of the exercise price. The vested portion of options may betransferred to any immediate family member, to a trust for the benefit of the director or immediate family members, or to afamily limited partnership.
7

Security Ownership of Directors and Executive Officers
The following table sets forth certain information as to shares of Allstate common stock beneficially owned byeach director and nominee, each executive officer named in the Summary Compensation Table, and by all executiveofficers and directors of Allstate as a group. Shares reported include shares held as nontransferable restricted sharesawarded under Allstate’s employee benefit plans, subject to forfeiture under certain circumstances, and shares subjectto stock options exercisable on or prior to April 1, 2000. The percentage of Allstate shares beneficially owned by anyAllstate director or nominee or by all directors and officers of Allstate as a group does not exceed 1%. Unlessindicated otherwise in the footnotes below, all shares are directly owned as of January 31, 2000.
NameAmount and Nature of BeneficialOwnership of Allstate Shares (a)
F. Duane Ackerman 11,029James G. Andress 11,660Warren L. Batts 24,350Edward A. Brennan 282,152(b)James M. Denny 140,596(c)W. James Farrell 1,000Ronald T. LeMay 1,750(d)Edward M. Liddy 1,160,374(e)Michael A. Miles 28,498H. John Riley, Jr. 13,834(f)Joshua I. Smith 7,250(g)Judith A. Sprieser 560Mary Alice Taylor 4,267Robert W. Gary 476,403(h)Louis G. Lower, II 313,489(i)Casey J. Sylla 196,860(j)Thomas J. Wilson, II 371,739(k)All directors and officers as a group 4,522,045(l)
(a) Each of the totals for Messrs. Andress, Batts, Brennan, Denny and Miles includes 6,000 Allstate shares subjectto option.
(b) Does not include 36,894 shares held by Mr. Brennan’s spouse. Mr. Brennan disclaims beneficial ownership ofthese shares.
(c) Does not include 18,000 shares held by Northcote LLC, of which Mr. Denny’s spouse is a managing member.Also does not include 370 shares held in a trust of which Mr. Denny is co-trustee. Mr. Denny disclaimsbeneficial ownership of these shares.
(d) Includes 250 shares subject to option.
(e) Includes 973,078 shares subject to option.
(f) Includes 834 shares subject to option. Also includes 10,000 shares purchased March 14, 2000.
(g) Includes 3,750 shares subject to option.
(h) Includes 451,622 shares subject to option. Does not include 100 shares held by Mr. Gary’s adult children;Mr. Gary disclaims beneficial ownership of these shares.
(i) Includes 265,290 shares subject to option.
(j) Includes 183,529 shares subject to option.
(k) Includes 356,227 shares subject to option.
(l) Includes 3,527,196 shares subject to option.
8

Security Ownership of Certain Beneficial Owners
Title ofClass
Name and Addressof Beneficial Owner
Amount and Nature ofBeneficial Ownership
Percentof Class
Common Northern Trust Corporation50 S. LaSalle StreetChicago, IL 60675 52,444,960(a) 6.7%
Common Capital Research & Management Company333 South Hope Street, 55th FloorLos Angeles, CA 90071 46,445,000(b) 5.9%
(a) As of December 31, 1999. Held by Northern Trust Corporation together with certain subsidiaries (collectively‘‘Northern’’). Of such shares, Northern holds 2,146,695 with sole voting power; 50,194,669 with shared votingpower; 3,021,312 with sole investment power; and 210,536 with shared investment power. 48,897,997 of suchshares are held by The Northern Trust Company as trustee on behalf of participants in Allstate’s profit sharingplan. Information is provided for reporting purposes only and should not be construed as an admission of actualbeneficial ownership.
(b) As of December 31, 1999 based on Form 13G reflecting sole investment power over shares, filed by CapitalResearch and Management Company on February 14, 2000.
Item 2Ratification of Appointment of Auditors
Item 2 is the ratification of the recommendation of the Audit Committee and the Board that Deloitte & ToucheLLP be appointed auditors for 2000. Representatives of Deloitte & Touche LLP will be present at the meeting, willbe available to respond to questions and may make a statement if they so desire.
The Board unanimously recommends that stockholders vote for the ratification of the appointment ofDeloitte & Touche LLP as auditors for 2000 as proposed.
Item 3Stockholder Proposal on Cumulative Voting
Mr. William E. Parker and Ms. Terri K. Parker, 544 Ygnacio Valley Road, Suite B, Walnut Creek, California94596, registered owners of 209.7 shares of Allstate common stock as of February 15, 2000, have given notice oftheir intention to propose the following resolution at the Annual Meeting. The proposal, as submitted, reads asfollows:
‘‘Resolved: That the stockholders of The Allstate Corporation, assembled at the annual meeting in person andby proxy, hereby request the Board of Directors to take steps necessary to provide for cumulative voting in theelection of directors, which means each stockholder shall be entitled to as many votes as shall equal the number ofshares he or she owns multiplied by the number of directors to be elected, and he or she may cast all of the votes fora single candidate, or any two or more of them as he or she may see fit.’’
The following statement has been submitted in support of the resolution:
‘‘At the 1998 Stockholders meeting of The Allstate Corporation, this proposal received more than 95,000,000votes, and last year it received over 184,000,000 votes. This shows a strong interest by the stockholders on the issueof corporate affairs and management accountability.
We believe that the company’s financial performance is directly related to its corporate governance proceduresand policies.
9

In the past we pointed out that negative events, like Criminal Investigations and the reopening of the earthquakeclaims were not good for business.
The company is under investigation from the Department of Labor with regard to the classification of agents asexempt or non-exempt from the requirements of the Fair Labor Standards Act. In addition, agents have asked theDepartment of Labor to investigate Allstate’s classification of its Exclusive Agency Independent Contractor Programas an independent contractor program for purposes of the Fair Labor Standards Act. Also the company is a defendantin lawsuits involving car repairs which allege non-original manufacturers’ parts are inferior to original equipmentmanufacturers’ parts.
Cumulative voting increases the possibility of electing independent minded directors that will enforcemanagement’s accountability to shareholders.
Corporations that have independent minded directors can help foster improved financial performance and greaterstockholder wealth.
Management nominees to the board often bow to the chairman’s desires on business issues and executive paywithout question.
Currently, the company’s Board of Directors is composed entirely of management nominees. Cumulative votingwould aid in placing a check on management nominees by creating more competitive elections. The National BankAct provides for cumulative voting for bank company boards. California law provides that all state pension and statecollege funds, invested in shares must vote for cumulative voting. Sears, Roebuck and Company, founded theAllstate Insurance Company in 1931 and adopted cumulative voting in 1906. The argument that the adoption ofcumulative voting will lead to the election of dissidents to the Board that will only represent the special interests ismisleading, because the standards of fiduciary duty compel all directors to act in the best interest of all shareholders.Directors who fail to respect the duties of loyalty and/or care expose themselves to significant liability. We believethat honest differences of opinion are good for a corporation. Dissent stimulates debate, which leads to thoughtfulaction and deters complacency on the Board of Directors.
Please vote yes on this resolution, or abstain from voting, as a non vote is considered a no vote.’’
The Board unanimously recommends that stockholders vote against this proposal for the following reasons:
The General Corporation Law of Delaware, the state in which Allstate is incorporated, allows cumulative votingonly if it is provided for in a corporation’s certificate of incorporation. Allstate’s certificate of incorporation does notprovide for cumulative voting. Consequently, each director of Allstate must be elected by a plurality of the votes ofall shares present in person or represented by proxy.
At present, Allstate’s entire Board must stand for election each year, and Allstate’s By-Laws permit stockholdersto nominate candidates to serve as directors, subject to compliance with the procedures provided in the By-Laws. TheBoard believes that a change in the method of stockholder voting would be appropriate only if another method wouldbetter serve the interests of the stockholders as a whole. The Board believes that cumulative voting would empower alimited group of stockholders with the ability to support only a special interest group by electing one or moredirectors representing primarily the interests of that group. The Board believes directors elected by this method mayview themselves as representatives of only the group that elected them. They may feel obligated to represent thatgroup’s interests, regardless of whether the furtherance of those interests would benefit all stockholders generally.This would lead to the promotion of narrow interests rather than those of stockholders at large. Election of directorsby a plurality vote of all voted shares is designed to produce a Board that views its accountability as being to allstockholders.
The Board believes that cumulative voting introduces the possibility of partisanship among Board membersrepresenting particular groups of stockholders, which could destroy the ability of the Board to work together. Thesefactors could operate to the disadvantage of Allstate and its stockholders. The present method of electing directors,where each director is elected by a plurality vote of the shares held by all stockholders, encourages the directors toadminister the affairs of Allstate for the benefit of all of its stockholders. The Board believes each director shouldserve on the Board only if a plurality of shares held by all voting stockholders elect the director to that position.
10

The percentage of shares that voted in favor of the cumulative voting proposal actually declined in 1999. Thenumber of favorable votes cited to in the proposal does not take into account the effect of the two-for-one stock splitwhich occurred on July 1, 1998.
The Board is confident that this method will continue to work successfully for the benefit of all stockholders.The Board agrees that financial performance is driven in part by strong corporate governance standards which is whyit is continuing to cooperate fully with the federal government’s investigation of the 1994 Northridge, Californiaearthquake claims handling. To date, no criminal charges have been brought against Allstate and we cannot yetdetermine the impact of resolving the matter. Regarding the reopening of claims, Allstate has resolved the vastmajority of all Northridge claims and related litigation. The pending lawsuits relating to the use of non-originalequipment manufacturer replacement parts are in various stages of development and the outcome of these disputes iscurrently uncertain. Lastly, Allstate has received confirmation from the Department of Labor that it does not intend topursue the matter of alleged Fair Labor Standards Act violations at this time.
For the reasons stated above, the Board recommends a vote against this proposal.
Item 4Stockholder Proposal Relating to CERES Principles
Ms. Elizabeth R. Welsh, beneficial owner of 95 shares of Allstate common stock as of December 10, 1999,(shares held through Trillium Asset Management Corporation, 711 Atlantic Avenue, Boston Massachusetts02111-2809) has given notice of her intention to propose the following resolution at the Annual Meeting. Theproposal, as submitted, reads as follows:
‘‘ENDORSEMENT OF THE CERES PRINCIPLESFOR PUBLIC ENVIRONMENTAL ACCOUNTABILITY
WHEREAS: Leaders of industry in the United States now acknowledge their obligation to pursue superiorenvironmental performance and to disclose information about the performance to their investors and otherstakeholders.
The integrity, utility, and comparability of environmental disclosure depend on using a common format, crediblemetrics, and a set of generally accepted standards. This will enable investors to assess environmental progress withinand across industries.
The Coalition for Environmentally Responsible Economies (CERES)—a ten-year partnership between largeinvestors, environmental groups, and corporations—has established what we believe is the most thorough andwell-respected environmental disclosure form in the United States. CERES has also taken the lead internationally,convening major organizations together with the United Nations Environment Programme in the Global ReportingInitiative, which has produced guidelines for standardizing environmental disclosure worldwide.
Companies that endorse the CERES Principles engage with stakeholders in transparent environmentalmanagement and agree to a single set of consistent standard for environmental reporting. That standard is set by theendorsing companies together with CERES.
The CERES Principles and CERES Report have been adopted by leading firms in various industries: ArizonaPublic Service, Bank America, BankBoston, Baxter International, Bethlehem Steel, Coca-Cola, General Motors,Interface, ITT Industries, Northeast Utilities, Pennsylvania Power and Light, and Polaroid, and Sun company.
We believe endorsing the CERES Principles commits a company to the prudent oversight of its financial andphysical resources through: 1) protection of the biosphere; 2) sustainable use of natural resources; 3) waste reduction;4) energy conservation; 5) risk reduction; 6) safe products/services; 7) environmental restoration; 8) informing thepublic; 9) management commitment; 10) audits and reports. (The full text of the CERES Principles andaccompanying CERES Report form are obtainable from CERES, 11 Arlington Street, Boston, Massachusetts 02116,(617) 247-0700/ www.ceres.org.)
11

RESOLVED: Shareholders request that the company endorse the CERES Principles as a reasonable andbeneficial component of their corporate commitment to be publicly accountable for environmental performance.
SUPPORTING STATEMENT: Recent studies show that the integration of environmental commitment intobusiness operations provides competitive advantage and improves long-term financial performance for companies. Inaddition, the depth of a firm’s environmental commitment and the quality with which it manages its environmentalperformance are indicators of prudent foresight exercised by management.
Given investors’ needs for credible information about a firm’s environmental performance and given the numberof companies that have already endorsed the CERES Principles and adopted its report format, it is a reasonable,widely accepted step for a company to endorse these Principles if it wishes to demonstrate its seriousness aboutsuperior environmental performance.
Your vote FOR this resolution serves the best interests of our Company and its shareholders.’’
The Board unanimously recommends that stockholders vote against this proposal for the followingreasons:
Allstate has long been committed to conducting its business and operations in an environmentally sound mannerand agrees, in principle, with the objectives espoused by the CERES organization. However, Allstate’s environmentalefforts and commitments need to be closely aligned with that of its stockholders as well as its policyholders and theircommunities. The Board does not believe that the formal endorsement of the CERES principles would effectivelyadvance those interests.
Allstate’s environmental efforts have been underway for many years and reflect its commitment to operating in ahuman-healthy and environmentally sound manner. Allstate locations engage in recycling programs that includepaper, newspaper, plastics, cans, cutting blades, fluorescent lamps, fuel oil, solvents, automobile tires, coolants andscrap metals. Allstate operates an energy-friendly vanpool program for its home office employees. Allstate’s Tech-Cor research and training facility works with auto manufacturers to develop innovative ways to make cars moredamage resistant, safe and cost-efficient.
Allstate prides itself on its history of commitment to various community service programs. This commitment isdemonstrated through external partnerships, financial support and by encouraging employee volunteerism. A few ofthe community-focused organizations that Allstate supports include America’s Promise, the Boys and Girls Clubs ofAmerica, the NeighborWorks Network, the All-America Cities Awards and the National Council of LaRaza. Inaddition to its community service investments, Allstate also manages its investment portfolio with considerationgiven to environmental and community value criteria.
Allstate’s commitment to human safety and risk aversion lies at the very core of its business. We continuouslystrive to promote awareness of issues aimed at accident- and injury-prevention and safety. In this regard, we publishhundreds of safety-related pamphlets and post an annual safety calendar of events on our website. Topics are targetedto health and safety issues arising in any given month—from child passenger safety month to alcohol awarenessmonth to tornado, hurricane and wildfire preparedness months.
Allstate has considered the CERES Principles carefully and while it agrees with their fundamental objectives,the Board does not recommend their formal endorsement. As a service business, we do not feel it is appropriate toadopt mandatory principles that for us would add administrative burden and an unnecessary financial drain. As aninsurer, Allstate must comply with the state laws of all fifty states as well as all relevant federal laws. Adding theexpense of compliance with the CERES Principles as well as the payment of the organization’s dues would not be inthe best interests of Allstate or its shareholders.
For the reasons stated above, the Board recommends a vote against this proposal.
12

Executive Compensation
The following Summary Compensation Table sets forth information on compensation earned in 1997, 1998 and1999 by Mr. Liddy (Allstate’s Chief Executive Officer since January 1, 1999) and by each of Allstate’s four mosthighly compensated executive officers (with Mr. Liddy, the ‘‘named executives’’).
Summary Compensation Table
Annual Compensation Long-Term Compensation
Name andPrincipal Position Year
Salary($)
Bonus($)(1)
Other AnnualCompensation
($)(2)
Awards Payouts
All OtherCompensation
($)(6)
RestrictedStock
Award(s)($)(3)
SecuritiesUnderlying
Options/SARs(#)(4)
LTIPPayouts
($)(5)
Edward M. Liddy 1999 890,000 538,873 13,218 –0– 400,000 2,468,250 7,292(Chairman, President and 1998 762,143 1,714,823 11,552 –0– 225,000 –0– 8,626Chief Executive Officer) 1997 709,167 1,595,625 306,765 849,912 177,952 1,027,032 8,626
Robert W. Gary 1999 518,100 219,896 19,168 –0- 105,000 1,222,004 7,124(President of Personal 1998 459,333 602,874 12,973 –0– 67,824 –0– 8,684Property and Casualty) 1997 414,667 544,251 13,270 315,053 52,762 512,204 8,684
Louis G. Lower, II 1999 458,700 409,213 94,044 –0– 50,000 1,204,088 7,081(Chairman, Allstate 1998 458,700 505,999 25,064 –0– 55,417 –0– 8,694Life and Savings) 1997 453,225 500,000 22,933 280,589 51,828 570,068 8,694
Casey J. Sylla 1999 409,200 494,632 3,688 –0– 137,662 811,230 7,142(Chief Investment 1998 386,000 362,913 3,742 –0– 35,511 –0– 8,569Officer of Allstate 1997 364,000 636,618 3,106 239,510 36,384 373,013 8,000Insurance Company)
Thomas J. Wilson, II 1999 458,700 409,213 79,589 –0– 165,340 930,864 6,998(President, Allstate 1998 405,100 510,001 2,393 –0– 53,850 –0– 8,646Life and Savings) 1997 383,333 468,375 634 301,776 38,934 384,738 8,646
(1) Payments under Allstate’s Annual Executive Incentive Compensation Plan and Allstate’s Annual Covered Employee IncentiveCompensation Plan, received in the year following performance.
(2) The amount attributed to Mr. Liddy in 1997 represents principally income tax benefit rights payments under stock options granted toMr. Liddy by Sears, Roebuck and Co. and assumed by Allstate when it was spun off from Sears in June 1995. The amount reflected forMr. Lower in 1999 includes $40,691 representing amounts paid for business related spousal travel expenses. Similarly, the amountattributed to Mr. Wilson in 1999 includes $35,868 paid for business related spousal travel expenses. The remainder of the amounts foreach of the named executives represent tax gross-up payments attributable to income taxes payable on certain travel benefits, tax returnpreparation fees and financial planning.
(3) The 1997 awards of restricted stock became unrestricted on or before April 1, 1998.
(4) The 1999 awards are set forth below in detail in the table titled ‘‘Option/SAR Grants in 1999.’’ The number of shares listed for the 1997awards were adjusted for the 2-for-1 stock split in July 1998.
(5) Payments under Allstate’s Long-Term Executive Incentive Compensation Plan, received in year following performance cycle.
(6) Each of the named executives participated in group term life insurance and in Allstate’s profit sharing plan, a qualified definedcontribution plan sponsored by Allstate. The amounts shown represent the premiums paid for the group term life insurance by Allstate onbehalf of each named executive officer and the value of the allocations to each named executive’s account derived from employermatching contributions to the profit sharing plan.
13

Option/SAR Grants in 1999
The following table is a summary of all Allstate stock options granted to the named executives during 1999.Individual grants are listed separately for each named executive. In addition, this table shows the potential gain thatcould be realized if the fair market value of Allstate’s common shares were not to appreciate, or were to appreciate ateither a five or ten percent annual rate over the period of the option term:
Individual Grants Potential Realizable Valueat Assumed Annual Rates ofStock Price Appreciation for
Option Term
Number of SecuritiesUnderlying
Options/SARsGranted(1)
% of TotalOptions/SARsGranted to All
Employees in 1999
Exercise orBase
Price ($/SH)Expiration
Date 0% 5%($) 10%($)
Edward M. Liddy 400,000 5.39 35.00 8/12/09 –0– $8,804,525 $22,312,394
Robert W. Gary 55,000 .74 39.19 1/4/09 –0– $1,355,551 $ 3,435,23250,000 .67 35.00 8/12/09 –0– $1,100,566 $ 2,789,049
Louis G. Lower, II 50,000 .67 35.00 8/12/09 –0– $1,100,566 $ 2,789,049
Casey J. Sylla 40,000 .54 39.19 1/4/09 –0– $ 985,855 $ 2,498,3516,642(2) .09 37.91 7/26/05 –0– $ 92,516 $ 212,218
91,020 1.23 35.00 8/12/09 –0– $2,003,470 $ 5,077,185
Thomas J. Wilson, II 50,000 .67 39.19 1/4/09 –0– $1,232,319 $ 3,122,938115,340 1.55 35.00 8/12/09 –0– $2,538,785 $ 6,433,779
(1) These options are exercisable in three or four equal annual installments, were granted with an exercise price equal to or higherthan the fair market value of Allstate’s common shares on the date of grant, expire ten years from the date of grant, andinclude tax withholding rights and a ‘‘reload’’ feature. Tax withholding rights permit the option holder to elect to have shareswithheld to satisfy federal, state and local tax withholding requirements. The reload feature permits payment of the exerciseprice by tendering Allstate common stock, which in turn gives the option holder the right to purchase the same number ofshares tendered, at a price equal to the fair market value on the exercise date. The options permit the option holder to exchangeshares owned or to have option shares withheld to satisfy all or part of the exercise price. The vested portions of all the optionsmay be transferred to any immediate family member, to a trust for the benefit of the executive or immediate family membersor to a family limited partnership.
(2) Options granted to replace shares tendered in exercise of options under the reload feature.
Option Exercises in 1999 and Option Values on December 31, 1999
The following table shows Allstate stock options that were exercised during 1999 and the number of shares andthe value of grants outstanding as of December 31, 1999 for each named executive:
SharesAcquired
on Exercise (#)Value
Realized ($)
Number of SecuritiesUnderlying Unexercised
Options/SARs at12/31/99(#)
Value of UnexercisedIn-The-Money
Options/SARs at12/31/99($)(1)
Exercisable Unexercisable Exercisable Unexercisable
Edward M. Liddy -0- -0- 961,412 628,066 8,638,811 -0-Robert W. Gary -0- -0- 451,622 -0- 1,946,201 -0-Louis G. Lower, II -0- -0- 264,284 108,195 1,784,094 -0-Casey J. Sylla 16,575 376,523 171,315 176,423 1,033,190 -0-Thomas J. Wilson, II -0- -0- 343,727 218,705 3,097,636 -0-
(1) Value is based on the closing price of Company common stock ($24.00) on December 31, 1999, minus the exercise price.
14

Long-Term Executive Incentive Compensation Plans
LONG-TERM INCENTIVE PLANS — AWARDS IN LAST FISCAL YEAR
Name
Number ofShares, Units or
Other Rights($)(a)
Performance orOther PeriodUntil Payout
Estimated Future Payouts UnderNon-Stock Price-Based Plans($)(b)
Threshold Target Maximum(c)
Edward M. Liddy 2,759,000 1/1/99-12/31/01 689,750 2,759,000 7,242,375Robert W. Gary 518,100 1/1/99-12/31/01 129,525 518,100 1,360,013Louis G. Lower, II 458,700 1/1/99-12/31/01 114,675 458,700 1,204,088Casey J. Sylla 327,360 1/1/99-12/31/01 81,840 327,360 859,320Thomas J. Wilson, II 458,700 1/1/99-12/31/01 114,675 458,700 1,204,088
(a) Awards represent potential cash incentive to be paid upon achievement of threshold, target or maximum performance objectives.
(b) Target awards are set for participants at the beginning of each cycle based on a percentage of aggregate salary during the cycle.Actual awards are based on each participant’s actual salary earned during the cycle. In years in which performance cycles overlap,50% of the participants’ salaries are applied to each cycle. If threshold level performance (80% of goal) were achieved, the awardswould be 25% of the participant’s target award. If maximum level of performance (125% of goal) or greater were achieved, the awardwould be 263% of the participant’s target award. The performance goal for the 1999-2001 cycle is based solely on return on averageequity which is subject to adjustment, in specific calibrations, depending on the relative performance of the Company with respect toits operating earnings per share growth as compared with the performance of an identified peer group, the S&P Property & CasualtyIndex, with respect to such goal.
(c) Up to $3.5 million of any individual award opportunity may be paid from The Allstate Corporation Long-Term Executive IncentiveCompensation Plan. The remainder, if any, will be paid under an arrangement subject to Board approval.
Pension Plans
The following table indicates the estimated total annual benefits payable to the named executives uponretirement under the specified compensation and years of service classifications, pursuant to the combined currentbenefit formulas of the Allstate Retirement Plan and the unfunded Supplemental Retirement Income Plan. TheSupplemental Retirement Income Plan will pay the portion of the benefits shown below which exceeds InternalRevenue Code limits or is based on compensation in excess of Internal Revenue Code limits. Benefits are computedon the basis of a participant’s years of credited service (generally limited to 28) and average annual compensationover the participant’s highest five successive calendar years of earnings out of the ten years immediately precedingretirement. Only annual salary and annual bonus amounts as reflected in the Summary Compensation Table areconsidered annual compensation in determining retirement benefits.
Annual retirement benefits are generally payable monthly and benefits accrued from January 1, 1978 throughDecember 31, 1988 are reduced by a portion of a participant’s estimated social security benefits. Effective January 1,1989 the retirement benefit calculation was integrated with the employees’ social security wage base. Benefits shownbelow are based on retirement at age 65 and selection of a straight life annuity.
As of December 31, 1999, Messrs. Liddy and Wilson had 12 and 7 years, respectively, of combinedAllstate/Sears service and Messrs. Gary, Lower and Sylla had 38, 23 and 4 years of service, respectively, withAllstate. As a result of their prior Sears service, a portion of Mr. Liddy’s and Mr. Wilson’s retirement benefits will bepaid from the Sears Plan. Allstate has agreed to provide Mr. Liddy with enhanced pension benefits when he reaches60. The enhanced benefit will be calculated based on the existing pension formula assuming an additional five yearsof age and five years of service. This enhancement will be phased out at a rate of 20% a year.
Years of Service
Remuneration 15 20 25 30 35
$1,000,000 $ 327,000 $ 436,000 $ 545,000 $ 610,000 $ 610,000
$1,500,000 $ 492,000 $ 656,000 $ 820,000 $ 918,000 $ 918,000
$2,000,000 $ 657,000 $ 876,000 $1,095,000 $1,226,000 $1,226,000
$2,500,000 $ 822,000 $1,096,000 $1,370,000 $1,534,000 $1,534,000
$3,000,000 $ 987,000 $1,316,000 $1,645,000 $1,842,000 $1,842,000
$3,500,000 $1,152,000 $1,536,000 $1,920,000 $2,150,000 $2,150,000
$4,000,000 $1,317,000 $1,756,000 $2,195,000 $2,458,000 $2,458,000
15
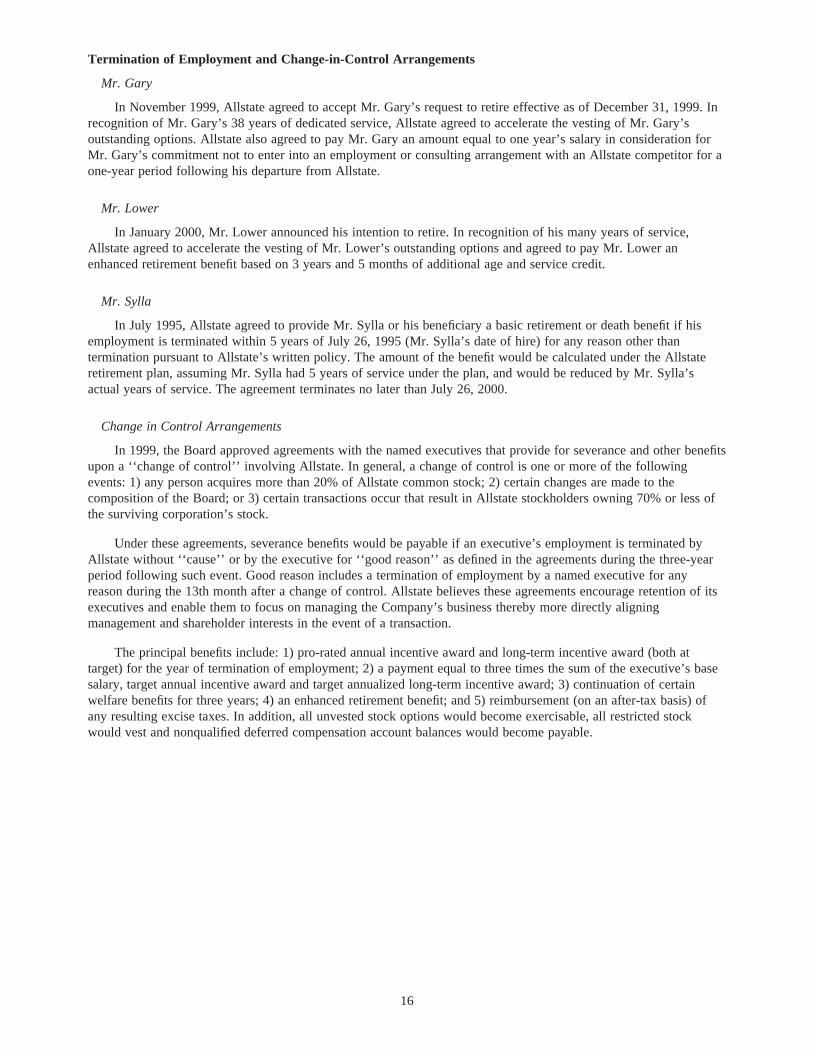
Termination of Employment and Change-in-Control Arrangements
Mr. Gary
In November 1999, Allstate agreed to accept Mr. Gary’s request to retire effective as of December 31, 1999. Inrecognition of Mr. Gary’s 38 years of dedicated service, Allstate agreed to accelerate the vesting of Mr. Gary’soutstanding options. Allstate also agreed to pay Mr. Gary an amount equal to one year’s salary in consideration forMr. Gary’s commitment not to enter into an employment or consulting arrangement with an Allstate competitor for aone-year period following his departure from Allstate.
Mr. Lower
In January 2000, Mr. Lower announced his intention to retire. In recognition of his many years of service,Allstate agreed to accelerate the vesting of Mr. Lower’s outstanding options and agreed to pay Mr. Lower anenhanced retirement benefit based on 3 years and 5 months of additional age and service credit.
Mr. Sylla
In July 1995, Allstate agreed to provide Mr. Sylla or his beneficiary a basic retirement or death benefit if hisemployment is terminated within 5 years of July 26, 1995 (Mr. Sylla’s date of hire) for any reason other thantermination pursuant to Allstate’s written policy. The amount of the benefit would be calculated under the Allstateretirement plan, assuming Mr. Sylla had 5 years of service under the plan, and would be reduced by Mr. Sylla’sactual years of service. The agreement terminates no later than July 26, 2000.
Change in Control Arrangements
In 1999, the Board approved agreements with the named executives that provide for severance and other benefitsupon a ‘‘change of control’’ involving Allstate. In general, a change of control is one or more of the followingevents: 1) any person acquires more than 20% of Allstate common stock; 2) certain changes are made to thecomposition of the Board; or 3) certain transactions occur that result in Allstate stockholders owning 70% or less ofthe surviving corporation’s stock.
Under these agreements, severance benefits would be payable if an executive’s employment is terminated byAllstate without ‘‘cause’’ or by the executive for ‘‘good reason’’ as defined in the agreements during the three-yearperiod following such event. Good reason includes a termination of employment by a named executive for anyreason during the 13th month after a change of control. Allstate believes these agreements encourage retention of itsexecutives and enable them to focus on managing the Company’s business thereby more directly aligningmanagement and shareholder interests in the event of a transaction.
The principal benefits include: 1) pro-rated annual incentive award and long-term incentive award (both attarget) for the year of termination of employment; 2) a payment equal to three times the sum of the executive’s basesalary, target annual incentive award and target annualized long-term incentive award; 3) continuation of certainwelfare benefits for three years; 4) an enhanced retirement benefit; and 5) reimbursement (on an after-tax basis) ofany resulting excise taxes. In addition, all unvested stock options would become exercisable, all restricted stockwould vest and nonqualified deferred compensation account balances would become payable.
16

Compensation and Succession Committee Report
Allstate’s Compensation and Succession Committee, which is composed entirely of independent, non-employeedirectors, administers Allstate’s executive compensation program. The purposes of the program are to:
● Link executives’ goals with stockholders’ interests
● Attract and retain talented management
● Reward annual and long-term performance
In 1996, the Committee created stock ownership goals for executives at the vice president level and above. Thegoals are for these executives to own, within five years, common stock worth a multiple of base salary, ranging fromone times salary to up to three times salary for the Chairman, President and Chief Executive Officer. In 1997, theCommittee weighted the compensation opportunities for executive officers, including each of the named executives,more heavily towards compensation payable upon the attainment of specified performance objectives andcompensation in the form of Allstate common stock. In 1999, the Committee increased the target award levels forcommon stock awards for executive officers, including each of the named executives.
Allstate executives can receive three types of compensation, each of which is described in more detail below:
● Annual cash compensation
● Long-term cash compensation
● Long-term equity compensation
Annual Compensation
Annual cash compensation includes base salary and annual incentive awards.
Base salaries of Allstate executives are set by the Committee at a level designed to be competitive in the U.S.insurance industry. At least annually, the Committee reviews a report based on data prepared by independentcompensation consultants comparing Allstate’s base salary levels for its executives with base salaries paid toexecutives in comparable positions at other companies in the peer group of large U.S. public insurance companies.The Committee attempts to set Allstate base salaries at the median level of the peer group.
Annual incentive awards are designed to provide certain employees, including each of the named executives,with a cash award based on the achievement of annual performance objectives. These objectives are approved by theCommittee prior to the end of the first quarter of the relevant year. Threshold, target and maximum benchmarks areset for each objective. Each award opportunity is based on that individual’s potential contribution to the achievementof a particular objective and is stated as a specified percentage of base salary for the year. For 1999, no award waspayable with respect to an objective if the threshold level of performance was not attained. In addition, no awardwould be payable if Allstate sustained a net loss for the year.
Annual incentive awards are paid in March of the year following the year of performance, after the Committeehas certified attainment of the objectives. The Committee has the authority to adjust the amount of awards but, withrespect to the chief executive officer and the other named executives, has no authority to increase any award abovethe amount specified for the level of performance achieved with respect to the relevant objective.
For 1999, 75% of Mr. Liddy’s annual incentive cash award was based on an operating earnings per shareobjective. The other 25% was based on a revenue growth objective for the personal property and casualty segmentand the life and savings segment.
For 1999, 50% of the annual incentive cash awards for the other named executives was based on one or moreperformance objectives related to their particular business units. Another 30% was based on achievement of thecorporate goals for operating earnings per share and revenue growth. The remaining 20% was based on individualperformance priorities.
Allstate met the threshold level of performance on the operating earnings per share objective. On average, thebusiness units achieved slightly less than the target level of performance for their objectives. Allstate did not meet thethreshold level of revenue growth for the personal property and casualty segment. However, it achieved themaximum level of revenue growth for the life and savings segment. The investment department also achieved themaximum level of performance on its objectives.
17

Long-Term Cash Compensation
Long-term incentive cash awards are designed to provide certain employees, including each of the namedexecutives, with a cash award based on the achievement of a performance objective over a three-year period. Theobjective is established by the Committee at the beginning of the three-year cycle. Threshold, target and maximumlevels of performance are established on which individual award opportunities are based, stated as a specifiedpercentage of aggregate base salary over the period. A new cycle commences every two years. In years in whichperformance cycles overlap, 50% of participants’ salaries are applied to each cycle. The awards will be adjusted, inspecific calibrations, by up to 50%, depending on Allstate’s performance as compared to the performance of a groupof peer companies over the same period. The Committee must certify in writing the attainment of the objectivebefore awards may be paid. Awards are payable in March of the year following the end of the cycle.
Long-term incentive cash awards for the 1997-1999 cycle were paid in March 2000. In this cycle the objectivefor all participants, including the named executives, was the achievement of a specified return on average equity. Themaximum level of performance was achieved on this objective, as well as the maximum level of performance asmeasured against the peer group. Payments to each of the named executives for the 1997-1999 cycle are set forthunder the ‘‘LTIP Payouts’’ column of the Summary Compensation Table.
The current cycle for long-term incentive cash awards covers the years 1999-2001. In this cycle the objective forall participants, including the named executives, is the achievement of a specified return on average equity. For thiscycle, the Committee determined that the peer calibration should be based on growth in operating earnings per shareand that the peer group of companies would be the Standard & Poor’s Property & Casualty Index. This change isintended to more closely link long-term cash compensation to shareholder value.
Long-Term Equity Compensation
The Equity Incentive Plan provides for the grant of stock options and restricted or unrestricted common stock ofAllstate to plan participants.
In January 1999, the Committee granted stock options to a select group of executives, including some namedexecutives, to recognize an increase in the level of their responsibility occasioned by the transition of the ChiefExecutive Officer.
In August 1999, the Committee granted stock options to a number of key Allstate employees, including each ofthe named executives. The size of each named executive’s grant was based on a specified percentage of his basesalary and the Committee’s assessment of his performance. All stock option grants under this plan have been made inthe form of nonqualified stock options at exercise prices equal to 100% of the fair market value of Allstate commonstock on the date of grant. These options are not fully-exercisable until four years or, in some cases, three years afterthe date of grant and expire in ten years. The vested portions of options may be transferred to immediate familymembers, to trusts for the benefit of the executive or immediate family members or to a family limited partnership.
Chief Executive Officer Compensation
In 1999, approximately 12% of Mr. Liddy’s total compensation opportunity was base salary. The remaining88% was variable compensation that was at risk and tied to Allstate’s business results.
Mr. Liddy’s previous increase in base salary was in November 1998 and reflected his being named Allstate’sChairman, President and Chief Executive Officer. In February 2000, Mr. Liddy’s base salary was increased 7.9% to$960,000. This 15-month interval of increase aligns with normal review cycles for Allstate’s executive officers.
For 1999, 75% of Mr. Liddy’s annual cash incentive award was based upon the achievement of an operatingearnings per share objective and 25% was based on the achievement of revenue growth objectives. Allstate met thethreshold level of performance for the operating earnings per share objective; did not meet the threshold on theproperty and casualty revenue growth objective; and achieved the maximum level on the life and savings revenuegrowth objective. The payout was calculated accordingly.
Mr. Liddy’s 1997-1999 long-term cash award was based on Allstate’s achievement of the maximum return onaverage equity objective as well as the maximum level of performance as measured against the relevant peer group.
18

On August 12, 1999, the Committee awarded Mr. Liddy a stock option under the Equity Incentive Plan for400,000 shares. The Committee used the Black-Scholes valuation formula to determine the amount of this award,which was based on a specified percentage of Mr. Liddy’s 1999 base salary.
Mr. Liddy’s 1999 base salary, annual incentive cash award, long-term incentive cash award and stock optiongrant follow the policies and plan provisions described above. Amounts paid and granted under these policies andplans are disclosed in the Summary Compensation Table.
Limit on Tax Deductible Compensation
Under Section 162(m) of the Internal Revenue Code, Allstate cannot deduct compensation paid in any year tocertain executives in excess of $1,000,000, unless it is performance-based. The Committee continues to emphasizeperformance-based compensation for executives and this is expected to minimize the effect of Section 162(m).However, the Committee believes that its primary responsibility is to provide a compensation program that attracts,retains and rewards the executive talent that is necessary to Allstate’s success. Consequently, in any year theCommittee may authorize compensation in excess of $1,000,000 that is not performance-based. The Committeerecognizes that the loss of a tax deduction may be unavoidable in these circumstances.
Compensation and Succession Committee
Warren L. Batts (Chairman)F. Duane AckermanJames G. AndressH. John Riley, Jr.
Edward A. BrennanW. James FarrellRonald T. LeMay
19

Stock Performance Graph
The following performance graph compares the performance of Allstate’s common stock during the five-yearperiod from December 31, 1994 through December 31, 1999 with the performance of the S&P 500 index and theS&P Property-Casualty Insurance Index. The graph plots the changes in value of an initial $100 investment over theindicated time periods, assuming all dividends are reinvested quarterly.
COMPARISON OF TOTAL RETURNDecember 31, 1994 to December 31, 1999
Allstate v. Published Indices
12/31/94 12/31/95 12/31/96 12/31/97 12/31/98 12/31/99
Allstate . . . . . . . . . . . . . . . . 100.00 $176.44 $251.95 $398.16 $343.52 $220.05S&P 500 . . . . . . . . . . . . . . . 100.00 $137.12 $168.22 $223.90 $287.35 $347.36S&P Prop./Cas. . . . . . . . . . . 100.00 $134.96 $164.37 $233.92 $212.78 $154.71
Section 16(a) Beneficial Ownership Reporting Compliance
Section 16(a) of the Securities Exchange Act of 1934, as amended, requires Allstate’s officers, directors andpersons who beneficially own more than ten percent of a registered class of Allstate’s equity securities to file reportsof securities ownership and changes in such ownership with the SEC.
Based solely upon a review of copies of such reports, or written representations that all such reports were timelyfiled, Allstate believes that each of its officers, directors and greater than ten-percent beneficial owners complied withall Section 16(a) filing requirements applicable to them during 1999.
20

Certain Transactions
The Northern Trust Company maintains banking relationships, including credit lines, with Allstate and variousof its subsidiaries, in addition to performing services for the profit sharing plan. In 1999, revenues received byNorthern Trust for cash management activities, trustee, custodian, credit lines and other services for all such entitieswere approximately $947,123.
Stockholder Proposal For Year 2001 Annual Meeting
Proposals which stockholders intend to be included in Allstate’s proxy material for presentation at the annualmeeting of stockholders in the year 2001 must be received by the Secretary of Allstate, Robert W. Pike, The AllstateCorporation, 2775 Sanders Road, Suite F8, Northbrook, Illinois 60062-6127 by November 27, 2000, and mustotherwise comply with rules promulgated by the Securities and Exchange Commission in order to be eligible forinclusion in the proxy material for the 2001 annual meeting.
If a stockholder desires to bring business before the meeting which is not the subject of a proposal meeting theSEC proxy rule requirements for inclusion in the proxy statement, the stockholder must follow procedures outlined inAllstate’s By-Laws in order to personally present the proposal at the meeting. A copy of these procedures is availableupon request from the Secretary of Allstate. One of the procedural requirements in the By-Laws is timely notice inwriting of the business the stockholder proposes to bring before the meeting. Notice of business proposed to bebrought before the 2001 annual meeting must be received by the Secretary of Allstate no earlier than January 18,2001 and no later than February 17, 2001 to be presented at the meeting. The notice must describe the businessproposed to be brought before the meeting, the reasons for bringing it, any material interest of the stockholder in thebusiness, the stockholder’s name and address and the number of shares of Allstate stock beneficially owned by thestockholder. It should be noted that these By-law procedures govern proper submission of business to be put before astockholder vote at the annual meeting.
Under Allstate’s By-Laws, if a stockholder wants to nominate a person for election to the Board at Allstate’sannual meeting, the stockholder must provide advance notice to Allstate. Notice of stockholder nominations forelection at the 2001 annual meeting must be received by the Secretary, The Allstate Corporation, 2775 Sanders Road,Suite F8, Northbrook, Illinois 60062-6127, no earlier than January 18, 2001 and no later than February 17, 2001.With respect to the proposed nominee, the notice must set forth the name, age, principal occupation, number ofshares of Allstate stock beneficially owned and business and residence address. With respect to the stockholderproposing to make the nomination, the notice must set forth the name, address and number of shares of Allstate stockbeneficially owned. A copy of these By-law provisions is available from the Secretary of Allstate upon request.
Alternatively, a stockholder may propose an individual to the Nominating and Governance Committee for itsconsideration as a nominee for election to the Board by writing to the office of the Secretary, The AllstateCorporation, 2775 Sanders Road, Suite F-8, Northbrook, Illinois 60062-6127.
21

Proxy Solicitation
Officers and other employees of Allstate and its subsidiaries may solicit proxies by mail, personal interview,telephone, telex, facsimile, or electronic means. None of these individuals will receive special compensation for theseservices which will be performed in addition to their regular duties, and some of them may not necessarily solicitproxies. Allstate has also made arrangements with brokerage firms, banks, nominees and other fiduciaries to forwardproxy solicitation materials for shares held of record by them to the beneficial owners of such shares. Allstate willreimburse them for reasonable out-of-pocket expenses. Corporate Investors’ Communications, Inc., 111 CommerceRoad, Carlstadt, New Jersey 07072 will assist in the distribution of proxy solicitation materials, for a fee estimated at$7,500 plus out-of-pocket expenses. Allstate will pay the cost of all proxy solicitation.
By order of the Board,
Robert W. PikeSecretary
Dated: March 27, 2000
22

Appendix A
A-1

11-Year Summary of Selected Financial Data($ in millions except per share data) 1999 1998 1997 1996
Consolidated Operating ResultsInsurance premiums and contract charges $21,735 $20,826 $20,106 $19,702Net investment income 4,112 3,890 3,861 3,813Realized capital gains and losses 1,112 1,163 982 784Total revenues 26,959 25,879 24,949 24,299Operating income (loss) 2,082 2,573 2,429 1,600Realized capital gains and losses, after-tax 691 694 638 510Equity in net income of unconsolidated subsidiary – 10 34 29Income (loss) from continuing operations 2,720 3,294 3,105 2,075Gain (loss) from discontinued operations, after-tax – – – –Cumulative effect of changes in accounting principle – – – –Net income (loss) 2,720 3,294 3,105 2,075Earnings (loss) per share:
Diluted:Income (loss) before cumulative effect of changes in accounting 3.38 3.94 3.56 2.31Cumulative effect of changes in accounting – – – –Net income (loss) 3.38 3.94 3.56 2.31
Basic:Income (loss) before cumulative effect of changes in accounting 3.40 3.96 3.58 2.33Cumulative effect of changes in accounting – – – –Net income (loss) 3.40 3.96 3.58 2.33
Dividends declared per share 0.60 0.54 0.48 0.43
Consolidated Financial PositionInvestments $69,645 $66,525 $62,548 $58,329Total assets 98,119 87,691 80,918 74,508Reserves for claims and claims expense and life-contingent contract
benefits and contractholder funds 50,610 45,615 44,874 43,789Debt 2,851 1,746 1,696 1,386Mandatorily redeemable preferred securities of subsidiary trusts 964 750 750 750Shareholders’ equity 16,601 17,240 15,610 13,452Shareholders’ equity per diluted share 21.05 21.00 18.28 15.14
Property-Liability OperationsPremiums written $20,389 $19,515 $18,789 $18,586Premiums earned 20,112 19,307 18,604 18,366Net investment income 1,761 1,723 1,746 1,758Operating income (loss) 1,717 2,211 2,079 1,266Realized capital gains and losses, after-tax 609 514 511 490Equity in net income of unconsolidated subsidiary – 10 34 29Income (loss) before cumulative effect of changes in accounting 2,312 2,760 2,670 1,725Net income (loss) 2,312 2,760 2,670 1,725Operating ratios
Claims and claims expense (‘‘loss’’) ratio 73.0 70.4 71.7 78.9Expense ratio 24.4 22.8 22.3 21.6Combined ratio 97.4 93.2 94.0 100.5
Life and Savings OperationsPremiums and contract charges $ 1,623 $ 1,519 $ 1,502 $ 1,336Net investment income 2,260 2,115 2,085 2,045Operating income 384 392 377 368Realized capital gains and losses, after-tax 101 158 123 20Income from continuing operations before cumulative effect of changes in
accounting 485 550 497 388Net income 485 550 497 388Statutory premiums and deposits 8,497 5,902 4,946 5,157Investments including Separate Accounts 48,301 41,863 37,341 33,588*Operating income (loss) is ‘‘Income before dividends on preferred securities and equity in net income of unconsolidated subsidiary’’ excludingrealized capital gains and losses, after-tax, and gain (loss) on disposition of operations, after-tax. *The supplemental operating income (loss)information presented above allows for a more complete analysis of results of operations. The net effect of gains and losses have been excludeddue to their volatility between periods and because such data are often excluded when evaluating the overall financial performance of insurers.Operating income (loss) should not be considered as a substitute for any GAAP measure of performance. Our method of calculating operatingincome (loss) may be different from the method used by other companies and therefore comparability may be limited.
A-2

1995 1994 1993 1992 1991 1990 1989
$18,908 $17,566 $17,118 $16,670 $16,215 $15,342 $14,2513,627 3,343 3,269 3,153 2,954 2,528 2,195
258 200 215 161 4 182 22422,793 21,109 20,602 19,984 19,173 18,052 16,6701,587 268 1,083 (718) 662 518 626
168 130 140 106 3 118 14856 86 79 112 58 54 41
1,904 484 1,302 (500) 723 690 815– – – – – 11 –– – – (325) – – –
1,904 484 1,302 (825) 723 701 815
2.12 0.54 1.49 (0.58)– – – (0.38)
2.12 0.54 1.49 (0.96)
2.12 0.54 1.49 (0.58)– – – (0.38)
2.12 0.54 1.49 (0.96)0.39 0.36 0.18
$56,505 $47,227 $47,932 $40,971 $38,213 $32,972 $28,14470,029 60,988 58,994 51,817 47,173 41,246 35,369
42,904 39,961 37,275 35,776 31,576 27,058 22,1931,228 869 850 1,800 – – –
– – – – – – –12,680 8,426 10,300 5,383 8,151 7,127 6,79314.09 9.37 11.45 8.52
$17,965 $16,739 $16,292 $15,774 $15,107 $14,572 $13,38517,540 16,513 16,039 15,542 15,018 14,176 13,0391,630 1,515 1,406 1,420 1,350 1,254 1,2121,301 81 963 (867) 475 355 481
158 145 146 166 24 108 13256 86 79 112 58 54 41
1,608 312 1,188 (589) 557 517 6541,608 312 1,188 (900) 557 517 654
78.1 88.0 79.7 97.4 83.3 85.7 82.822.3 23.3 23.5 24.0 24.8 24.5 24.7
100.4 111.3 103.2 121.4 108.1 110.2 107.5
$ 1,368 $ 1,053 $ 1,079 $ 1,128 $ 1,197 $ 1,166 $ 1,2121,992 1,827 1,858 1,733 1,604 1,274 983
327 226 169 149 187 163 14510 (15) (6) (60) (21) 10 16
337 211 163 89 166 173 161337 211 163 75 166 184 161
4,874 4,539 4,086 3,851 4,222 4,252 3,27631,065 26,197 24,909 21,829 19,050 15,732 11,787
*Consolidated financial position for 1993 and thereafter are not comparable to prior years due to adoption of new accounting rules for debt andequity securities. *Per share amounts for years prior to 1998 have been restated for a 2-for-1 stock split in 1998. *Shareholders’ equity ispresented pro forma for 1992 reflecting the formation of The Allstate Corporation. *Net income (loss) and financial position for 1992 andthereafter are not comparable to prior years due to adoption of new accounting rules for postretirement and postemployment benefits. *Earnings(loss) per share is presented pro forma for 1993 and 1992 and is not applicable prior to 1992.
A-3

The following discussion highlights significant factors influencing the consolidated results of operationsand financial position of The Allstate Corporation (the ‘‘Company’’ or ‘‘Allstate’’). It should be read inconjunction with the consolidated financial statements and related notes appearing on pages A-33 throughA-72 and the 11-year summary of selected financial data on pages A-2 and A-3. Further analysis of theCompany’s insurance segments is provided in Property-Liability Operations (which includes the PersonalProperty and Casualty (‘‘PP&C’’) and Discontinued Lines and Coverages segments) and Life and SavingsOperations (which represents the Life and Savings segment) beginning on pages A-5 and A-15, respectively.The segments are defined based upon the components of the Company for which financial information is usedinternally to evaluate segment performance and determine the allocation of resources.
1999 HIGHLIGHTS
● Announced a strategic initiative to provide customers with access to Allstate sales and service through theInternet and call centers. The intent of this initiative is to aggressively expand selling and customer servicecapabilities, by combining ease of access with the expertise and local presence of an Allstate agency.
● Completed the acquisition of the personal lines auto and homeowners insurance business of CNA FinancialCorporation (‘‘CNA personal lines’’) and the acquisition of American Heritage Life Investment Corporation(‘‘AHL’’), which provide the Company a strong presence in the independent agency and workplace marketingdistribution channels, respectively.
● Established an alliance with Putnam Investments which generated additional Life and Savings sales of$832 million during the year.
● Expanded the existing $2 billion share repurchase program by an additional $2 billion. The combined$4 billion program is expected to be completed by December 31, 2000.
Consolidated revenues
For the years ended December 31, 1999 1998 1997
($ in millions)
Property-Liability insurance premiums $20,112 $19,307 $18,604Life and Savings premiums and contract charges 1,623 1,519 1,502Net investment income 4,112 3,890 3,861Realized capital gains and losses 1,112 1,163 982
Total revenues $26,959 $25,879 $24,949
Consolidated revenues increased 4.2% in 1999 due primarily to higher Property-Liability earned premiums andrevenues from acquisitions. Consolidated revenues increased 3.7% in 1998 due to higher Property-Liability earnedpremiums and realized capital gains.
Consolidated net income
For the years ended December 31, 1999 1998 1997
($ in millions except per share data)
Net income $2,720 $3,294 $3,105Net income per share (Basic) 3.40 3.96 3.58Net income per share (Diluted) 3.38 3.94 3.56Cash dividends declared per share .60 .54 .48Realized capital gains and losses, net of tax 691 694 638Restructuring and acquisition related charges, net of tax 116 – –
1999 over 1998
Net income decreased 17.4% due primarily to decreased operating results including the impact of restructuringcharges and the affect of acquisitions. Net income per diluted share decreased 14.2% in 1999 as the decline in netincome was partially offset by the effects of share repurchases.
1998 over 1997
Net income for 1998 increased 6.1% as a result of increased operating results and realized capital gains. Netincome per diluted share increased 10.7% due to increased net income and the positive impacts of share repurchases.
Management’s Discussion and Analysisof Financial Condition and Results of Operations
A-4

PROPERTY-LIABILITY 1999 HIGHLIGHTS
● Property-Liability premiums written increased 4.5% in 1999, as a result of the acquisition of CNA personallines business and increases in policies in force.
● Property-Liability underwriting income decreased to $527 million compared to $1.30 billion in 1998, asearned premium growth was offset by unfavorable loss costs, restructuring and acquisition related charges andincreased operating expenses.
● Completed the acquisition of CNA personal lines.
● Announced a series of strategic initiatives to expand selling and service capabilities to customers.
● Commenced a restructuring plan to reduce expenses and to finance strategic initiatives.
● Commenced a reorganization of the multiple employee agency programs to a single exclusive agencyindependent contractor program.
PROPERTY-LIABILITY OPERATIONS
Overview The Company’s Property-Liability operations consist of two business segments: PP&C and DiscontinuedLines and Coverages. PP&C is principally engaged in the sale of property and casualty insurance, primarily privatepassenger auto and homeowners insurance to individuals in the United States, and to a lesser extent, other countries.Discontinued Lines and Coverages represents business no longer written by Allstate, and includes the results fromenvironmental, asbestos and other mass tort exposures and other commercial lines of business in run-off. Thissegment also included mortgage pool insurance business, which the Company exited in 1999. Such groupings offinancial information are consistent with that used internally for evaluating segment performance and determining theallocation of resources.
Underwriting results for each segment are discussed separately beginning on page A-6. Summarized financialdata and key operating ratios for Allstate’s Property-Liability operations for the years ended December 31, arepresented in the following table.
($ in millions except ratios) 1999 1998 1997
Premiums written $20,389 $19,515 $18,789
Premiums earned $20,112 $19,307 $18,604Claims and claims expense 14,679 13,601 13,336Operating costs and expenses 4,833 4,402 4,145Restructuring charges 73 – –
Underwriting income 527 1,304 1,123Net investment income 1,761 1,723 1,746Realized capital gains and losses, after-tax 609 514 511Gain (loss) on disposition of operations, after-tax (14) 25 46Income tax expense on operations 571 816 790
Income before equity in net income of unconsolidated subsidiary 2,312 2,750 2,636Equity in net income of unconsolidated subsidiary – 10 34
Net income $ 2,312 $ 2,760 $ 2,670
Catastrophe losses $ 816 $ 780 $ 365
Operating ratiosClaims and claims expense (‘‘loss’’) ratio 73.0 70.4 71.7Expense ratio 24.4 22.8 22.3
Combined ratio 97.4 93.2 94.0
Effect of catastrophe losses on combined ratio 4.1 4.0 2.0
Effect of restructuring and acquisition related charges on combinedratio 0.7 – –
A-5

PERSONAL PROPERTY AND CASUALTY (‘‘PP&C’’) SEGMENT
In 1999, the Company announced a series of strategic initiatives to aggressively expand selling and servicecapabilities to its customers. These initiatives include creating a platform that will provide consumers with sales andservice capabilities through the Internet and call centers, as well as through locally established Allstate agencies.Other initiatives include the introduction of new competitive pricing and underwriting techniques, new agency andclaim technology and enhanced marketing and advertising. The Company believes successful implementation of theinitiatives will result in selling and customer service advantages in an increasingly competitive marketplace.
Summarized financial data and key operating ratios for Allstate’s PP&C segment for the years endedDecember 31, are presented in the following table.
($ in millions except ratios) 1999 1998 1997
Premiums written $20,381 $19,516 $18,787
Premiums earned $20,103 $19,307 $18,600Claims and claims expense 14,642 13,572 13,333Other costs and expenses 4,812 4,380 4,126Restructuring charges 73 – –
Underwriting income $ 576 $ 1,355 $ 1,141
Catastrophe losses $ 816 $ 780 $ 365
Operating ratiosClaims and claims expense (‘‘loss’’) ratio 72.8 70.3 71.7Expense ratio 24.3 22.7 22.2
Combined ratio 97.1 93.0 93.9
Effect of catastrophe losses on combined ratio 4.1 4.0 2.0
PP&C premiums PP&C sells primarily private passenger auto and homeowners insurance to individuals throughthe exclusive Allstate agency channel, and in 1999 with the acquisition of CNA personal lines, an expandedindependent agency channel. The Company has historically separated the voluntary personal auto insurance businessinto two categories for underwriting purposes: the standard market and the non-standard market. Generally, standardauto customers are expected to have lower risks of loss than non-standard customers. The Company distinguishesbetween these risk categories using factors unique to each customer such as the driving records of the various driverson the policy, the existence of prior insurance coverage, the type of car owned or the customer’s financial stability.The Company is implementing a refined pricing program that uses its underwriting experience for these factors toprice auto coverage for each customer using a unique tier-based pricing model. Tier-based pricing allows a muchbroader range of premiums to be offered to customers within the two existing categories of risks. As a result,management believes that tier-based pricing will allow the Company to compete more effectively and operate moreprofitably. The Company’s ability to implement these strategies is generally subject to regulatory approval. Currently,management expects to implement these strategies in approximately 15 states during 2000 and the remaining states in2001, or as the strategy receives regulatory approval in each state. The Company’s underwriting strategy forhomeowners is to target customers whose risk of loss provides the best opportunity for profitable growth. Thisincludes managing exposure on policies in areas where the potential loss from catastrophes exceeds acceptable levels.
The Company’s marketing strategy is to provide sales and service to new and existing customers in thedistribution channel of their choice. With the implementation of its strategic initiatives, the Company will provideproducts in four major channels of distribution. Customers will be able to access Allstate products through exclusiveagencies, call centers and the Internet, which will provide consistent pricing and enhanced customer service. CNApersonal lines and Deerbrook Insurance Company products will be accessible through independent agencies.Management expects the execution of this strategy, in conjunction with the execution of new underwriting andpricing strategies, to improve the opportunity for profitable growth.
Standard auto premiums written increased 2.8% in 1999, to $11.44 billion, from $11.13 billion in 1998, dueprimarily to the acquisition of CNA personal lines during the fourth quarter of 1999 and a 1.9% increase in the
Management’s Discussion and Analysisof Financial Condition and Results of Operations—(Continued)
A-6

number of policies in force, offset by a 1.1% decrease in average premiums per policy. Standard auto premiumswritten increased 2.6% in 1998, from $10.85 billion in 1997, due primarily to an increase in the number of renewalpolicies in force and higher average premiums.
Average premium decreases in 1999 were caused by competitive rate pressures due, in part, to increasedconsolidation in the industry and competitors expanding and redefining their underwriting risk selection andtolerance, favorable loss trends in recent years and regulatory activities in some states. (See the discussion ofregulatory actions in New Jersey below.) Increases in average premiums in 1998 were primarily attributable to a shiftto newer and more expensive autos, and to a lesser extent, rate increases. The Company expects premium growth tocontinue to be limited by the competitive environment and the implementation of new underwriting and pricingguidelines.
Excluding standard auto premiums written in New Jersey, standard auto premiums written increasedapproximately 4.8% in 1999 as compared to 1998. Since the implementation of regulated rate and coveragereductions in the state of New Jersey in March 1999, the Company has experienced decreased premiums in the state,but also expects to see corresponding improvement in future loss experience. While the impacts of the rate reductionson premiums written will generally be fully realized in the first quarter of 2000, impacts of coverage reductions onlosses will not be fully determinable until 2001.
Non-standard auto premiums written increased 3.3% in 1999, to $3.46 billion, from $3.35 billion in 1998. Theincrease was due to a 4.4% increase in the number of new policies in force, primarily due to the expansion of non-standard auto into the states of California and South Carolina, and additional independent agency appointmentsduring the year. This increase was partially offset by a 2.8% decline in average premiums due to decreases in ratesand a shift to policyholders selecting less coverage. In 1998, non-standard auto premiums written increased 6.0%,from $3.16 billion in 1997, due to an increase in the number of renewal policies in force and, to a lesser extent,higher average premiums. Management believes non-standard auto premiums written for 1999 and 1998 wereadversely impacted by competitive pressures. In addition, the introduction of new administrative requirements whichwere intended to improve retention and decrease expenses related to the collection of premiums, also negativelyimpacted the 1998 results.
Management is implementing programs to address the emergence of adverse profitability trends in non-standardauto. These programs include additional down payment requirements, new underwriting guidelines and new ratingplans, and are expected to adversely impact written premium growth in the near term while improving profitability inthe future. The Company has filed, or plans to file additional rate increases during 2000.
Homeowners premiums written increased 9.2% in 1999, to $3.51 billion, from $3.21 billion in 1998.Homeowners premiums written increased 7.8% in 1998, from $2.98 billion in 1997. Increases in 1999 were due toimpacts from the acquisition of CNA personal lines during the fourth quarter of 1999, and increases of 3.1% inpolicies in force and 2.0% in average premium. The increase in premiums written in 1998 was due to an increase inthe number of policies in force combined with higher average premiums. Higher average premiums were due toincreases in rates and insured values in both years. The Company has filed, or plans to file additional rate increasesduring 2000.
PP&C underwriting results Underwriting income decreased to $576 million in 1999 from $1.36 billion in 1998.The decrease was due primarily to increases in premiums earned being more than offset by the impacts of increasedloss costs and the restructuring and acquisition related charges incurred. Loss costs increased during 1999 due toincreased auto claim frequency (rate of claim occurrence) and auto and homeowners claim severity (average cost perclaim). Underwriting income increased in 1998 from $1.14 billion in 1997, due to increased premiums earned,favorable claim frequency and favorable auto injury claim severity, partially offset by increased catastrophe lossesand increased homeowners claim severity. Catastrophe losses for 1999 were $816 million compared with$780 million and $365 million in 1998 and 1997, respectively.
Changes in claim severity are generally influenced by inflation in the medical and auto repair sectors of theeconomy. The Company mitigates these effects through various loss control programs. Injury claims are affectedlargely by medical cost inflation while physical damage claims are affected largely by auto repair cost inflation andused car prices. Increases in injury claim severity experienced during 1999 were due in part to medical cost
A-7

inflationary pressures and were consistent with relevant medical cost indices. Management believes the Company’sclaim settlement initiatives, such as special investigative units used to detect fraud and handle suspect claims, arecontributing to the positive 1999 and 1998 injury severity trends. Management believes severity may continue to beadversely affected as inflationary pressures on medical costs outweigh the benefit of claim settlement initiativesaimed at reducing claim severity.
For physical damage coverage, the Company monitors its rate of increase in average cost per claim against theBody Work price index and the Used Car price index. In 1999 and 1998, the Company’s physical damage coverageseverity was consistent with prior years, whereas related indices increased slightly during the year. Managementbelieves that the 1999 and 1998 results were largely impacted by the application of enhanced claim settlementpractices for auto physical damage claims.
The restructuring charge incurred during 1999 was the result of implementing the cost reduction programannounced on November 10, 1999. The impact of the charge on the PP&C segment was $73 million, or $48 millionafter-tax, and related specifically to the elimination of certain employee positions, the consolidation of operations andfacilities and the reorganization of its multiple employee agency programs to a single exclusive agency independentcontractor program. See Note 11 to the consolidated financial statements for a more detailed discussion of thesecharges.
Based on information developed from the post-closing review of the acquired CNA personal lines business, theCompany recorded an acquisition charge of $58 million, or $37 million after-tax, relating to different estimates ofloss and loss expense reserves and asset valuation allowances. The pretax charge is reflected in Claims and claimsexpense and Other costs and expenses.
The 1999 and 1998 expense ratios increased compared to prior years due primarily to the Company’s investmentin various initiatives, such as increased advertising and technology, which are intended to expand the business.
PP&C catastrophe losses and catastrophe management Catastrophes are an inherent risk of the property-liabilityinsurance industry which have contributed, and will continue to contribute, to potentially material year-to-yearfluctuations in Allstate’s results of operations and financial position. A ‘‘catastrophe’’ is defined by Allstate as anevent that produces pre-tax losses before reinsurance in excess of $1 million, and involves multiple first partypolicyholders. Catastrophes are caused by various events including, but not limited to, earthquakes, wildfires,tornadoes, hailstorms, hurricanes, tropical storms, high winds and winter storms.
The level of catastrophic losses experienced in any year cannot be predicted and could potentially be material toresults of operations and financial position. While management believes the Company’s catastrophe managementinitiatives, described below, have reduced the magnitude of possible future losses, the Company continues to beexposed to catastrophes that may materially impact the Company’s results of operations and financial position.
The establishment of appropriate reserves for losses incurred from catastrophes, as for all outstanding Property-Liability claims, is an inherently uncertain process. Catastrophe reserve estimates are regularly reviewed and updated,using the most current information and estimation techniques. Any resulting adjustments, which may be material, arereflected in current operations.
Allstate has limited, over time, its aggregate insurance exposures in certain regions prone to catastrophes. Theselimits include restrictions on the amount and location of new business production, limitations on the availability ofcertain policy coverages, policy brokering and increased participation in catastrophe pools. Allstate has also requestedand received rate increases and has expanded its use of increased hurricane and earthquake deductibles in certainregions prone to catastrophes. During 1999, the Company continued to make progress in reducing its exposure tocatastrophes in the northeastern United States (‘‘Northeast’’). However, the initiatives are somewhat mitigated byrequirements of state insurance laws and regulations, as well as by competitive considerations.
Allstate continues to support the enactment of federal legislation that would reduce the impact to Allstate ofcatastrophic natural disasters, such as earthquakes and hurricanes. Allstate is a founding member of a coalition, the
Management’s Discussion and Analysisof Financial Condition and Results of Operations—(Continued)
A-8

Home Insurance Federation of America, whose members include property insurers and insurance agents. The group ispromoting measures in Congress that would enable insurers and other eligible parties, including state disaster plans,to purchase catastrophic-level reinsurance from the federal government. In 1999, the House Committee on Bankingand Financial Services voted to refer a bill, H.R. 21, the Homeowners’ Insurance Availability Act, to the full Houseof Representatives for further consideration. H.R. 21 was not acted upon by the House during its 1999 session. Acomparable bill, S. 1361, Natural Disaster Protection and Insurance Act of 1999, is pending in the Senate Commerce,Science and Transportation Committee. Allstate cannot predict whether this natural disaster legislation will beenacted or the effect on Allstate if it were enacted.
For Allstate, areas of potential catastrophe losses due to hurricanes include major metropolitan centers near theeastern and gulf coasts of the United States. Exposure to potential earthquake losses in California is limited by theCompany’s participation in the California Earthquake Authority (‘‘CEA’’). Other areas in the United States withexposure to potential earthquake losses include areas surrounding the New Madrid fault system in the Midwest andfaults in and surrounding Seattle, Washington and Charleston, South Carolina. Allstate continues to evaluatealternative business strategies to more effectively manage its exposure to catastrophe losses in these and other areas.
Florida Hurricanes Allstate Floridian Insurance Company (‘‘Floridian’’) and Allstate Floridian IndemnityCompany (‘‘AFI’’) sell and service Florida residential property policies. Floridian has access to reimbursement fromthe Florida Hurricane Catastrophe Fund (‘‘FHCF’’) for 90% of hurricane losses in excess of approximately the first$255 million for each storm, up to an aggregate of $900 million (90% of approximately $1.00 billion) in a singlehurricane season, and $1.23 billion total reimbursement over all hurricane seasons.
The FHCF has the authority to issue bonds to pay its obligations to participating insurers. The bonds issued bythe FHCF are funded by assessments on all property and casualty premiums written in the state, except workers’compensation and accident and health insurance. These assessments are limited to 4% in the first year of assessment,and up to a total of 6% for assessments in the second and subsequent years. Assessments are recoupable immediatelythrough increases in policyholder rates. A rate filing or any portion of a rate change attributable entirely to theassessment is deemed approved when made with the State of Florida Department of Insurance (the ‘‘Department’’),subject to the Department’s statutory authority to review the ‘‘adequacy’’ of any rate at any time.
In addition to direct hurricane losses, Floridian and AFI are also subject to assessments from the FloridaWindstorm Underwriting Association (‘‘FWUA’’) and the Florida Residential Property and Casualty JointUnderwriting Association (‘‘FRPCJUA’’), which are organizations created to provide coverage for catastrophiclosses to property owners unable to obtain coverage in the private market. Regular assessments are levied onparticipating companies if the deficit in the calendar year is less than or equal to 10% of Florida property premiumsindustry-wide for that year. An insurer may recoup a regular assessment through a surcharge to policyholders subjectto a cap on the amount that can be charged in any one year. If the deficit exceeds 10%, the FWUA and/or FRPCJUAwill fund the deficit through the issuance of bonds. The costs of these bonds are then funded through a regularassessment in the first year following the deficit and emergency assessments in subsequent years. Companies arerequired to collect the emergency assessments directly from the policyholder and remit these monies to theorganizations as they are collected. Participating companies are obligated to purchase any unsold bonds issued by theFWUA and/or FRPCJUA. The insurer must file any recoupment surcharge with the Department at least 15 days priorto imposing the surcharge on any policies. The surcharge may be used automatically after the expiration of the 15days, unless the Department has notified the insurer in writing that any of its calculations are incorrect.
While the statutes are designed so that the ultimate cost is borne by the policyholders, the exposure toassessments and availability of recoveries may not offset each other in the financial statements due to timing and thepossibility of policies not being renewed in subsequent years.
Northeast Hurricanes The Company has a three-year excess of loss reinsurance contract covering propertypolicies in the Northeast, effective June 1, 1997. The reinsurance program provides up to 95% of $500 million ofreinsurance protection for catastrophe losses in excess of an estimated $750 million retention subject to a limit of$500 million in any one year and an aggregate limit of $1.00 billion over the three-year contract period. To limitinsurance exposure to catastrophe losses, deductibles on residential property policies in the New York metropolitanarea now include a hurricane deductible that is triggered by hurricane winds greater than 100 miles per hour.
A-9

California Earthquakes Allstate participates in the CEA which is a privately-financed, publicly-managed stateagency created to provide insurance coverage for earthquake damage. Insurers selling homeowners insurance inCalifornia are required to offer earthquake insurance to their customers either through their company or byparticipation in the CEA. The Company’s homeowners policy continues to include coverages for losses caused byexplosions, theft, glass breakage and fires following an earthquake, which are not underwritten by the CEA.
Should losses arising from an earthquake cause a deficit in the CEA, additional capital needed to operate theCEA would be obtained through assessments of participating insurance companies, payments received underreinsurance agreements and bond issuances funded by future policyholder assessments. Participating insurers arerequired to fund an assessment, not to exceed $2.15 billion, if the capital of the CEA falls below $350 million.Participating insurers are required to fund a second assessment, not to exceed $1.43 billion, if aggregate CEAearthquake losses exceed $5.86 billion or the capital of the CEA falls below $350 million. At December 31, 1999,the CEA’s capital balance was approximately $485 million. If the CEA assesses its member insurers for any amount,the amount of future assessments on members is reduced by the amounts previously assessed. To date, the CEA hasnot assessed member insurers beyond the startup assessment issued to participating insurers in 1996. The authority ofthe CEA to assess participating insurers expires when it has completed twelve years of operation. All futureassessments to participating CEA insurers are based on their CEA insurance market share as of December 31 of thepreceding year. As of December 31, 1999, the Company had 25.7% of the CEA market share. Assuming its currentCEA market share does not materially change, Allstate does not expect its portion of these additional contingentassessments, if any, to exceed $553 million, as the likelihood of an event exceeding the CEA claims paying capacityof $5.86 billion is remote. Management believes Allstate’s exposure to earthquake losses in California has beensignificantly reduced as a result of its participation in the CEA.
PP&C Outlook
● The competitive environment has caused Allstate and other participants in the industry to implement autoinsurance rate decreases during 1999 and in prior years. Management expects to see a stabilization of ratesbeginning in 2000, as many competitors have publicly indicated their intentions to file rate increases duringthe year. Planned rate changes and the Company’s new pricing and underwriting strategies may also adverselyimpact premium revenues while intending to improve profitability.
● The Company expects to incur additional restructuring and related expenses of approximately $100 millionthroughout 2000. The costs will be incurred as employee positions are eliminated, as the transition to a singleexclusive agency independent contractor program proceeds, and to a lesser extent, as operations and facilitiesare consolidated. These costs will be incurred as part of a larger initiative to reduce expenses by $600 millionto finance the new strategic initiatives. The Company estimates it will invest approximately $300 million incapital expenditures over the next two years, and will spend approximately $700 million in systemsdevelopment and implementation costs, rollout costs and advertising for the new strategy over the next twoyears.
● The Company implemented a program to transition from multiple employee agency programs to a singleexclusive agency independent contractor program, as part of its restructuring initiative. This program isintended to service agencies and customers more efficiently and cost-effectively. With this program, theCompany expects transitioning agents to select one of three alternatives: i) conversion to an exclusive agencyindependent contractor; ii) conversion to an exclusive agency independent contractor and sale of an economicinterest in their existing business; or iii) separation from the Company either through a voluntary separation orretirement. If a substantial number of transitioning agents do not convert to the new contract or if convertingagents have a decline in productivity, adverse impacts to premiums could be experienced. Currently, theCompany believes these impacts will not be material.
● The Company has experienced favorable trends in injury severity that are expected to be adversely impactedby inflationary increases in medical costs in the future.
● Federal legislation has been passed that eliminates many federal and state law barriers to affiliations amongbanks, securities firms, insurers and other financial service providers. The impact this may have on the PP&Csegment is unknown at this time.
Management’s Discussion and Analysisof Financial Condition and Results of Operations—(Continued)
A-10

DISCONTINUED LINES AND COVERAGES SEGMENT
Summarized underwriting results for the years ended December 31, for the Discontinued Lines and Coveragessegment are presented in the following table.
($ in millions) 1999 1998 1997
Total underwriting loss $49 $51 $18
Discontinued Lines and Coverages consists of business no longer written by Allstate, including results fromenvironmental, asbestos and other mass tort exposures and other commercial business in run-off. This segment alsoincluded mortgage pool insurance business, which the Company exited in 1999.
During 1999, the Company strengthened its net asbestos reserves by $346 million, which was partially offset bythe reduction of net reserves for environmental and other losses of $155 million and the release of a reserve held as aprovision for future losses on the run-off of the mortgage pool business of $114 million. The strengthening of netasbestos reserves and the release of net environmental and other reserves was primarily the result of the Company’sannual assessment of these liabilities completed during the third quarter of the year. The release of the provision forfuture losses on the mortgage pool business was the result of a recapture, by The PMI Group, Inc., of the reinsuredbusiness and all related assets and future liabilities of the mortgage pool business.
PROPERTY-LIABILITY NET INVESTMENT INCOME AND REALIZED CAPITAL GAINS
Pretax net investment income Net investment income increased in 1999 after decreasing in 1998 as compared to1997. In 1999, positive cash flows from operations, assets acquired with the CNA personal lines business andincreases in income from partnership interests, were partially offset by dividends paid to The Allstate Corporationand lower investment yields. Despite recent increases in interest rates, current investment yields are still lower thanaverage portfolio yields, therefore funds from called or maturing investments were generally reinvested at loweryields resulting in reduced investment income. If interest rates continue to rise, this trend may reverse over time. Thedecrease in 1998 was primarily due to higher investment balances being offset by the impact of lower investmentyields.
Realized capital gains and losses after-tax Realized capital gains and losses, after-tax were $609 million in 1999compared to $514 million in 1998 and $511 million in 1997. Increased realized gains in 1999 were largely the resultof the timing of sales decisions reflecting management’s decision on positioning the portfolio, as well as assessmentsof individual securities and overall market conditions. Realized gains in 1998 were impacted by gains on the sale of amajority of the Company’s real estate property portfolio, partially offset by a decrease in gains on the sales ofsecurities due to less favorable market conditions.
Investment Outlook
● Investment income growth for the Property-Liability operations will continue to be adversely impacted bydividends paid to The Allstate Corporation and lower yields as funds from called or maturing investments arereinvested at lower yields.
PROPERTY-LIABILITY CLAIMS AND CLAIMS EXPENSE RESERVES
Underwriting results of the Company’s two Property-Liability segments are significantly influenced by estimatesof property-liability claims and claims expense reserves (see Note 7 to the consolidated financial statements). Thesereserves are an accumulation of the estimated amounts necessary to settle all outstanding claims, including claimswhich are incurred but not reported (‘‘IBNR’’), as of the reporting date. These reserve estimates are based on knownfacts and circumstances, internal factors including Allstate’s experience with similar cases, historical trends involvingclaim payment patterns, loss payments, pending levels of unpaid claims and product mix. In addition, the reserveestimates are also influenced by external factors including court decisions, economic conditions and public attitudes.The Company, in the normal course of business, may also supplement its claims processes by utilizing third partyadjusters, appraisers, engineers, inspectors, other professionals and information sources to assess and settlecatastrophe and non-catastrophe related claims. The effects of inflation are implicitly considered in the reservingprocess.
A-11

The establishment of appropriate reserves, including reserves for catastrophes, is an inherently uncertain process.Allstate regularly updates its reserve estimates as new facts become known and further events occur which mayimpact the resolution of unsettled claims. Changes in prior year reserve estimates, which may be material, arereflected in the results of operations in the period such changes are determined to be necessary.
Changes in Allstate’s estimate of prior year net loss reserves at December 31 are summarized in the followingtable.
($ in millions) 1999 1998 1997
Reserve re-estimates due to:Environmental and asbestos claims $ 254 $ 100 $ –All other property-liability claims (841) (800) (677)
Pretax reserve decrease $(587) $(700) $(677)
Favorable calendar year reserve development in 1999, 1998 and 1997 was the result of favorable injury severitytrends, as compared to the Company’s anticipated trends, in each of the three years. In 1999 and 1998, this favorabledevelopment more than offset adverse developments in environmental, asbestos and other mass tort reserves. Thefavorable injury severity trend during this three-year period was largely due to moderate medical cost inflationmitigated by the Company’s loss control programs. The impacts of the moderate medical cost inflation trend havedeveloped over time as actual claim settlements validate the effect of the rate of inflation. While the claim settlementprocess changes are believed to have contributed to favorable severity trends on closed claims, these changesintroduce a greater degree of variability in reserve estimates for the remaining outstanding claims at December 31,1999. Future reserve development releases, if any, are expected to be adversely impacted by anticipated increases inmedical cost inflation rates.
Allstate’s exposure to environmental, asbestos and other mass tort claims stem principally from excess andsurplus business written from 1972 through 1985, including substantial excess and surplus general liability coverageson Fortune 500 companies and reinsurance coverage written during the 1960s through the 1980s, includingreinsurance on primary insurance written on large United States companies. Other mass tort exposures primarilyrelate to product liability claims, such as those for medical devices and other products, and general liabilities.
In 1986, the general liability policy form used by Allstate and others in the property-liability industry wasamended to introduce an ‘‘absolute pollution exclusion’’, which excluded coverage for environmental damage claimsand added an asbestos exclusion. Most general liability policies issued prior to 1987 contain annual aggregate limitsfor product liability coverage, and policies issued after 1986 also have an annual aggregate limit on all coverages.Allstate’s experience to date is that these policy form changes have effectively limited its exposure to environmentaland asbestos claim risks.
Establishing net loss reserves for environmental, asbestos and other mass tort claims is subject to uncertaintiesthat are greater than those presented by other types of claims. Among the complications are lack of historical data,long reporting delays, uncertainty as to the number and identity of insureds with potential exposure, unresolved legalissues regarding policy coverage, availability of reinsurance and the extent and timing of any such contractualliability. The legal issues concerning the interpretation of various insurance policy provisions and whether thoselosses are, or were ever intended to be covered, are complex. Courts have reached different and sometimesinconsistent conclusions as to when losses are deemed to have occurred and which policies provide coverage; whattypes of losses are covered; whether there is an insured obligation to defend; how policy limits are determined; howpolicy exclusions are applied and interpreted; and whether clean-up costs represent insured property damage.Management believes these issues are not likely to be resolved in the near future.
Management’s Discussion and Analysisof Financial Condition and Results of Operations—(Continued)
A-12

The table below summarizes reserves and claim activity for environmental and asbestos claims before (Gross)and after (Net) the effects of reinsurance for the past three years.
1999 1998 1997
($ in millions) Gross Net Gross Net Gross Net
ENVIRONMENTAL CLAIMSBeginning reserves $ 840 $641 $885 $685 $ 947 $722Incurred claims and claims expense (109) (96) 21 – – –Claims and claims expense paid (66) (39) (66) (44) (62) (37)
Ending reserves $ 665 $506 $840 $641 $ 885 $685
Survival ratio – environmental claims 10.1 13.0 12.7 14.6 14.3 18.5
ASBESTOS CLAIMSBeginning reserves $ 686 $459 $605 $417 $ 774 $510Incurred claims and claims expense 447 350 225 100 – –Claims and claims expense paid (86) (51) (144) (58) (169) (93)
Ending reserves $1,047 $758 $686 $459 $ 605 $417
Survival ratio – asbestos claims 12.2 14.9 4.8 7.9 3.6 4.5
Survival ratio – environmental and asbestos combined 11.3 14.0 7.3 10.8 6.5 8.5
The survival ratio is calculated by taking the Company’s ending reserves divided by payments made during theyear. The survival ratio, however, is an extremely simplistic approach to measuring the adequacy of environmentaland asbestos reserve levels. Many factors, such as mix of business, level of coverage provided and settlementprocedures have significant impacts on the amount of environmental and asbestos claims and claims expensereserves, ultimate payments thereof and the resultant ratio. As payments result in corresponding reserve reductions,survival ratios can be expected to vary over time. In 1999, the environmental survival ratio decreased due to reducedreserve levels. In 1999 and 1998, the asbestos survival ratio increased due to increased reserve levels and a decline inpayments.
Pending, new, total closed and closed without payment claims for environmental and asbestos exposures for theyears ended December 31, are summarized in the following table.
Number of Claims 1999 1998 1997
Pending, beginning of year 16,027 15,965 16,075New 2,991 2,032 1,728Total closed (3,154) (1,970) (1,838)
Pending, end of year 15,864 16,027 15,965
Closed without payment 2,357 1,460 1,311
Approximately 59%, 58% and 57% of the total net environmental and asbestos reserves at December 31, 1999,1998 and 1997, respectively, represents IBNR.
Allstate’s reserves for environmental exposures could be affected by the existing federal Superfund law andsimilar state statutes. There can be no assurance that any Superfund reform legislation will be enacted or that anysuch legislation will provide for a fair, effective and cost-efficient system for settlement of Superfund related claims.Management is unable to determine the effect, if any, that such legislation will have on results of operations orfinancial position.
Management believes its net loss reserves for environmental, asbestos and other mass tort exposures areappropriately established based on available facts, technology, laws and regulations. However, due to theinconsistencies of court coverage decisions, plaintiffs’ expanded theories of liability, the risks inherent in majorlitigation and other uncertainties, the ultimate cost of these claims may vary materially from the amounts currently
A-13

recorded, resulting in an increase in loss reserves. In addition, while the Company believes the improved actuarialtechniques and databases have assisted in its ability to estimate environmental, asbestos and other mass tort net lossreserves, these refinements may subsequently prove to be inadequate indicators of the extent of probable losses. Dueto the uncertainties and factors described above, management believes it is not practicable to develop a meaningfulrange for any such additional net loss reserves that may be required.
Property-Liability reinsurance ceded The Company purchases reinsurance to limit aggregate and singleexposures on large risks. Allstate has purchased reinsurance primarily to mitigate losses arising from catastrophes andlong-tail liability lines, including environmental, asbestos and other mass tort exposures. The Company retainsprimary liability as a direct insurer for all risks reinsured. In connection with the Company’s acquisition of CNApersonal lines, Allstate and CNA entered into a four-year aggregate stop loss reinsurance agreement. The Companycurrently has a reinsurance recoverable from CNA on unpaid losses of $147 million that is subject to the reinsuranceagreement. Allstate also has access to reimbursement provided by the FHCF for 90% of hurricane losses in excess ofapproximately the first $255 million for each storm, up to an aggregate of $900 million (90% of approximately$1.00 billion) in a single hurricane season, and $1.23 billion total reimbursement over all hurricane seasons. Allstatealso entered into a three-year excess of loss reinsurance contract covering property policies in the Northeast, effectiveJune 1, 1997. The reinsurance program provides up to 95% of $500 million of reinsurance protection for catastrophelosses in excess of an estimated $750 million retention subject to a limit of $500 million in any one year and anaggregate limit of $1.00 billion over the three-year contract period. Additionally, in connection with the sale of theCompany’s reinsurance business to SCOR U.S. Corporation in 1996, Allstate entered into a reinsurance agreementfor the post-1984 reinsurance liabilities. These reinsurance arrangements have not had a material effect on Allstate’sliquidity or capital resources.
The impact of reinsurance activity on Allstate’s reserve for claims and claims expense at December 31, 1999 issummarized in the following table.
($ in millions)
Gross claimsand claims
expense reserves
Reinsurancerecoverable on
unpaid claims, net
Mandatory pools & facilities $ 969 $ 662Environmental & asbestos 1,712 448Other 15,133 543
Total property-liability $17,814 $1,653
Reinsurance has been placed with insurance companies after an evaluation of the financial security of thereinsurer, as well as the terms and price of coverage. Developments in the insurance industry have often led to thesegregation of environmental, asbestos and other mass tort exposures into separate legal entities with dedicatedcapital. These actions have been supported by regulatory bodies in certain cases. The Company is unable todetermine the impact, if any, that these developments will have on the collectibility of reinsurance recoverables in thefuture. The Company had amounts recoverable from Lloyd’s of London of $89 million and $99 million atDecember 31, 1999 and 1998, respectively. Lloyd’s of London implemented a restructuring plan in 1996 to solidifyits capital base and to segregate claims for years prior to 1993. The impact, if any, of the restructuring on thecollectibility of the recoverable from Lloyd’s of London is uncertain at this time. The recoverable from Lloyd’s ofLondon syndicates is spread among thousands of investors who have unlimited liability. Excluding mandatory poolsand facilities and the CNA recoverable on unpaid losses, no other amount due or estimated to be due from any oneproperty-liability reinsurer was in excess of $85 million and $84 million at December 31, 1999 and 1998,respectively.
Estimating amounts of reinsurance recoverables is also impacted by the uncertainties involved in theestablishment of loss reserves. Management believes the recoverables are appropriately established; however, as theCompany’s underlying reserves continue to develop, the amount ultimately recoverable may vary from amountscurrently recorded. The reinsurers and amounts recoverable therefrom are regularly evaluated by the Company and aprovision for uncollectible reinsurance is recorded, if needed. The allowance for uncollectible reinsurance was $111million and $141 million at December 31, 1999 and 1998, respectively.
Allstate enters into certain intercompany insurance and reinsurance transactions for the Property-Liability andLife and Savings operations. Allstate enters into these transactions as a sound and prudent business practice in orderto maintain underwriting control and spread insurance risk among various legal entities. These reinsurance
Management’s Discussion and Analysisof Financial Condition and Results of Operations—(Continued)
A-14

agreements have been approved by the appropriate regulatory authorities. All significant intercompany transactionshave been eliminated in consolidation.
LIFE AND SAVINGS 1999 HIGHLIGHTS
● Statutory premiums and deposits increased 44.0% to $8.50 billion in 1999.
● An alliance with Putnam Investments, commenced in May 1999, generated sales of $832 million.
● Separate Accounts assets increased 37.2% driven by 60.4% growth in variable annuity product sales, as wellas strong performance in the underlying funds.
● Completed the acquisition of AHL, giving the Company a strong presence in the workplace marketingdistribution channel.
● Income from operations decreased 2.0% as higher profitability on life products and variable annuities wasoffset by the impacts of restructuring and acquisition related charges.
● Net income decreased 11.8% due primarily to decreased realized capital gains and lower operating income.
LIFE AND SAVINGS OPERATIONS
($ in millions) 1999 1998 1997
Statutory premiums and deposits $ 8,497 $ 5,902 $ 4,946
Investments $34,444 $31,765 $29,759Separate Accounts assets 13,857 10,098 7,582
Investments, including Separate Accounts assets $48,301 $41,863 $37,341
GAAP Premiums $ 891 $ 889 $ 955Contract charges 732 630 547Net investment income 2,260 2,115 2,085Contract benefits 1,318 1,225 1,248Credited interest 1,260 1,190 1,167Operating costs and expenses 706 623 602Restructuring charges 8 – –
Operating income before tax 591 596 570Income tax expense 207 204 193
Operating income(1) 384 392 377Realized capital gains and losses, after-tax(2) 101 158 123Loss on disposition of operations, after-tax – – (3)
Net income $ 485 $ 550 $ 497
(1) The supplemental operating information presented above allows for a more complete analysis of results of operations. The net effects of gains andlosses have been excluded due to the volatility between periods and because such data is often excluded when evaluating the overall financialperformance of insurers. Operating income should not be considered as a substitute for any GAAP measure of performance. Our method ofcalculating operating income may be different from the method used by other companies and therefore comparability may be limited.
(2) Net of the effect of related amortization of deferred policy acquisition costs in 1999 and 1998.
Life and Savings statutory premiums, deposits and contract charges Life and Savings markets primarily lifeinsurance, savings and group pension products. Life insurance products consist of traditional products, including termand whole life, interest-sensitive life, immediate annuities with life contingencies, variable life and indexed lifeinsurance. Savings products include deferred annuities and immediate annuities without life contingencies. Grouppension products include contracts with fixed or indexed rates and fixed terms, such as guaranteed investmentcontracts, funding agreements and deferred and immediate annuities, or retirement annuities. The segment also usesseveral brand identities. Generally, Allstate brand products are sold through exclusive agencies, specialized brokersand direct response marketing. Other brands such as Glenbrook Life and Annuity, Northbrook Life, Lincoln BenefitLife and American Heritage Life sell products through both exclusive and independent agencies, securities firms,banks and direct response marketing. The products offered in each brand are of similar types, with the exception ofAmerican Heritage Life, which includes health and disability insurance in addition to life and annuity products.
A-15

Statutory premiums and deposits, which include premiums and deposits for all products, are used to analyzesales trends. The following table summarizes statutory premiums and deposits by product line.
($ in millions) 1999 1998 1997
Life productsInterest-sensitive $ 777 $ 821 $ 804Traditional 367 325 317Other 534 241 188
Total life products 1,678 1,387 1,309Annuity products
Variable 2,647 1,650 1,427Fixed 2,497 1,629 1,638
Group pension products 1,675 1,236 572
Total $8,497 $5,902 $4,946
Total statutory premiums and deposits increased 44.0% in 1999, as compared to 1998. Statutory premiums onlife products increased 21.0% due to an increase in term life products with higher face amounts, and correspondinglyhigher premiums, sales of a new bank-owned life product, and the acquisition of AHL. In 1999, sales of variableannuities increased 60.4% over 1998, primarily driven by $832 million of sales from the alliance with PutnamInvestments which began in May of 1999. Fixed annuities grew 53.3% in 1999 through the introduction of newproducts and new marketing partnerships in the independent agency and banking distribution channels, and theacquisition of AHL. Additional statutory premiums on group pension products were generated during the yearprimarily through the sale of funding agreements. Period to period fluctuations in sales of group pension products,including funding agreements, are largely due to management’s actions based on the assessment of marketopportunities.
In 1998, statutory premiums and deposits increased 19.3% from 1997 due to an increase of 15.6% in variableannuity deposits impacted by strong sales in the securities firms, bank and independent agency channels. Sales ofinterest-sensitive life and traditional life products through Allstate agencies and independent agencies also contributedto the growth.
Life and Savings sales during 1999 continued to move toward products with greater sales volumes and lowerprofit margins. In addition, the current interest rate environment and strong stock market conditions continue to fuelstrong growth in the fixed and variable annuity product lines. Through the use of multiple distribution channels and awide range of product offerings, Life and Savings is well positioned to meet changing customer needs.
Life and Savings GAAP premiums and contract charges Under generally accepted accounting principles(‘‘GAAP’’), premiums represent revenue generated from traditional life products with significant mortality risk.Revenues for interest-sensitive life insurance and fixed and variable annuity contracts, for which deposits are treatedas liabilities, are reflected as contract charges. Immediate annuities may be purchased with a life contingencywhereby the mortality risk is a significant factor. For this reason the GAAP revenues generated on these contracts arerecognized as premiums. The following table summarizes GAAP premiums and contract charges.
($ in millions) 1999 1998 1997
PremiumsTraditional life $ 342 $ 316 $ 319Immediate annuities with life contingencies 240 305 347Other 309 268 289
Total premiums 891 889 955Contract ChargesInterest-sensitive life 527 474 430Variable annuities 177 130 96Other 28 26 21
Total contract charges 732 630 547
Total Premiums and Contract Charges $1,623 $1,519 $1,502
Management’s Discussion and Analysisof Financial Condition and Results of Operations—(Continued)
A-16

In 1999, total premiums were consistent with 1998 as higher traditional life premiums were offset by lower salesof immediate annuities with life contingencies. Traditional life premiums increased due to an increase in term lifeproducts with higher face amounts, and correspondingly higher premiums, and an increase in renewal policies inforce. The types of immediate annuities sold may fluctuate significantly from year to year, which impacts premiumsreported. Other premiums increased during 1999 due to the acquisition of AHL. Premiums decreased 6.9% in 1998primarily due to lower sales of immediate annuities with life contingencies.
Total contract charges increased 16.2% during 1999 as compared to 1998 due to higher variable annuity andinterest-sensitive life contract charges. Interest-sensitive life contract charges increased primarily due to highermortality charges as policyholders age. Variable annuity contract charges increased primarily due to increases inaccount value inforce, which was approximately $12.94 billion during 1999 compared to $9.15 billion in 1998, or anincrease of 41.3%. Variable annuity account values are increased by sales and market performance, which is offset bysurrenders, withdrawals and benefit payments, during each year. During 1999, sales added $1.90 billion and marketperformance added $2.07 billion to the account value. This was offset by $1.13 billion in surrenders, withdrawals andbenefit payments. In 1998 the account values increased $1.80 billion due to sales and $1.25 billion in marketperformance, offset by $966 million in surrenders, withdrawals and benefit payments. As variable annuity accountvalues are impacted directly by market performance, total variable annuity contract charges, which are calculated as apercentage of each annuity account value, will fluctuate during the year.
Life and Savings net investment income Net investment income increased 6.9% and 1.4% in 1999 and 1998,respectively. Increases in both years were due to higher investment balances, partially offset by lower portfolio yields.Investments, excluding Separate Accounts assets and unrealized gains on fixed income securities, grew 16.0% and 6.1%in 1999 and 1998, respectively. In 1999, the increase was due to increased premiums and contract charges, and also theimpacts of the acquisition of AHL. Despite recent increases in interest rates, current investment yields are still lowerthan average portfolio yields, therefore funds from maturing investments were generally reinvested at lower yieldsresulting in reduced investment income. If interest rates continue to rise, this trend may reverse over time.
Life and Savings realized capital gains and losses Realized capital gains and losses decreased in 1999 ascompared to 1998, as 1998 capital gains reflected the sale of real estate and certain fixed income securities during theyear. In 1998, realized capital gains increased over 1997, due primarily to the sales of equity-linked securities, realestate and pre-payments of fixed income securities.
Life and Savings operating income Operating income decreased 2.0% in 1999, as increased investment marginsand contract charges were offset by less favorable mortality margins, higher expenses and the impacts of therestructuring and acquisition related charges. The 1998 operating income increased 4.0% as compared to 1997 due tohigher investment and mortality margins, offset by increased expenses.
Investment margin, which represents the excess of investment income earned over interest credited topolicyholders and contractholders, increased 8.8% due to increases in asset balances from new sales. The differencebetween average investment yields and interest credited during the year remained relatively constant with the prioryear. In 1998, the investment margins increased due to new sales, partly offset by a slight decrease in the averageinvestment yield. The weighted average investment yield and the weighted average interest crediting rates during1999, 1998 and 1997 are in the following table.
Weighted averageinvestment yield
Weighted averageinterest crediting rate
1999 1998 1997 1999 1998 1997
Interest-sensitive life products 7.5% 7.8% 7.8% 5.5% 5.8% 5.8%Fixed rate contracts 8.0 8.3 8.4 7.3 7.5 7.5Flexible rate contracts 7.3 7.6 7.7 5.2 5.6 5.7
Fixed rate contracts include funding agreements, immediate annuities and group pension products, while flexiblerate contracts include all other fixed annuities.
Mortality margin, which represents premiums and cost of insurance charges in excess of related policy benefits,decreased 9.0% during 1999. The decrease, which negatively impacts operating income, was the result of a return to
A-17

an expected level of claims and average claim size as compared to favorable mortality results in 1998. The 1998favorable margin was due to an increase in life insurance inforce and fewer claims.
Increased expenses during 1999 and 1998 are due to additional investments in technology.
The restructuring charge incurred during 1999 was the result of the cost reduction program announced onNovember 10, 1999. The impact of the charge on the Life and Savings segment totaled $8 million, or $5 millionafter-tax, and related primarily to the elimination of employee positions. See Note 11 to the consolidated financialstatements for a more detailed discussion of these charges.
Based on information developed from the post-closing review of the acquired AHL business, the Companyrecorded an acquisition charge of $32 million, or $26 million after-tax, primarily relating to different estimates ofloss reserves and asset valuation allowances. The pretax charge is reflected in Contract charges, Contract benefits andOperating costs and expenses.
Life and Savings Outlook
● Life and Savings product growth will continue to be driven by a focus on multiple channels of distributionand multiple products. With this focus management plans to:
* Emphasize alliance partners, Putnam Investments, Morgan Stanley Dean Witter and PNC Bank;
* Perform ongoing market assessments to capture opportunities for group pension and immediate annuityproducts;
* Develop the Allstate Financial Advisor initiative, which includes implementing financial planning servicesfor customers;
* Utilize a funding agreement program;
* Continue wholesaling activities; and
* Expand its Internet presence.
● Consistent with the marketplace, Life and Savings sales continued to move towards lower profit marginproducts, such as term life and variable annuities. These lower profit margin products require a higher volumeof business to increase the Life and Savings operating results. Life and Savings achieved this increasedvolume in 1999 and expects product growth to continue.
● Benefits derived from investments in technology, distribution systems and restructuring are expected tocontribute to profitability.
● The Company is currently experiencing increased competition in the Life and Savings segment. Thiscompetition is expected to continue and therefore increase the need to reduce costs of distribution andincrease economies of scale in order to compete with larger traditional insurance companies, as well as non-traditional competitors, such as banks and securities firms. Federal legislation has also been passed thateliminates many federal and state law barriers to affiliations among banks, securities firms, insurers and otherfinancial service providers. The impact this may have on the Life and Savings segment is unknown at thistime.
MARKET RISK
Market risk is the risk that the Company will incur losses due to adverse changes in equity, interest, commodity,or currency exchange rates and prices. The Company’s primary market risk exposures are to changes in interest rates,although the Company also has certain exposures to changes in equity prices and foreign currency exchange rates.
The active management of market risk is integral to the Company’s results of operations. The Company may usethe following approaches to manage its exposure to market risk within defined tolerance ranges: 1) rebalance itsexisting asset or liability portfolios, 2) change the character of future investments purchased or 3) use derivativeinstruments to modify the market risk characteristics of existing assets and liabilities or assets expected to be
Management’s Discussion and Analysisof Financial Condition and Results of Operations—(Continued)
A-18

purchased. The derivative financial instruments section in ‘‘Investments’’ and Note 6 to the consolidated financialstatements provides a more detailed discussion of these instruments.
Corporate Oversight The Company generates substantial investable funds from its primary business operations,Property-Liability and Life and Savings. In formulating and implementing policies for investing new and existingfunds, the Company seeks to earn returns that enhance its ability to offer competitive rates and prices to customerswhile contributing to attractive and stable profits and long-term capital growth for the Company. Accordingly, theCompany’s investment decisions and objectives are a function of the underlying risks and product profiles of eachprimary business operation.
The Company administers and oversees the investment risk management processes primarily through the Boardsof Directors and Investment Committees of its operating subsidiaries, and the Credit and Risk Management Committee(‘‘CRMC’’). The Boards of Directors and Investment Committees provide executive oversight of investment activities.The CRMC is a senior management committee consisting of the Chief Investment Officer, the Investment RiskManager, and other investment officers who are responsible for the day-to-day management of market risk. TheCRMC meets at least monthly to provide detailed oversight of investment risk, including market risk.
The Company has investment guidelines that define the overall framework for managing market and otherinvestment risks, including the accountabilities and controls over these activities. In addition, the Company hasspecific investment policies for each of its affiliates that delineate the investment limits and strategies that areappropriate given each entity’s liquidity, surplus, product, and regulatory requirements.
The Company manages its exposure to market risk through asset allocation limits, duration limits, value-at-risklimits, through the use of simulation and, as appropriate, stress tests. Asset allocation limits place restrictions on theaggregate fair value which may be invested within an asset class. The Company has duration limits on the Property-Liability and Life and Savings investment portfolios, and, as appropriate, on individual components of theseportfolios. These duration limits place restrictions on the amount of interest rate risk which may be taken. Value-at-risk limits the potential loss in fair value that could arise from adverse movements in the fixed income, equity, andcurrency markets over a time interval based on historical volatilities and correlations between market risk factors.Simulation and stress tests measure downside risk to fair value and earnings over longer time intervals and/or foradverse market scenarios.
The day-to-day management of market risk within defined tolerance ranges occurs as portfolio managers buyand sell within their respective markets based upon the acceptable boundaries established by the asset allocation,duration and other limits, including but not limited to credit and liquidity.
Although the Company applies a common overall governance approach to market risk where appropriate, theunderlying asset-liability frameworks and accounting and regulatory environments differ markedly between Property-Liability and Life and Savings operations. These differing frameworks affect each operation’s investment decisionsand risk parameters.
Interest Rate Risk Interest rate risk is the risk that the Company will incur economic losses due to adversechanges in interest rates. This risk arises from many of the Company’s primary activities, as the Company investssubstantial funds in interest-sensitive assets and also has certain interest-sensitive liabilities, primarily in its Life andSavings operations.
The Company manages the interest rate risk inherent in its assets relative to the interest rate risk inherent in itsliabilities. One of the measures the Company uses to quantify this exposure is duration. Duration measures thesensitivity of the fair value of assets and liabilities to changes in interest rates. For example, if interest rates increase1%, the fair value of an asset with a duration of 5 years is expected to decrease in value by approximately 5%. AtDecember 31, 1999, the difference between the Company’s asset and liability duration was approximately 0.62 years,versus a 0.11 year gap at December 31, 1998. This positive duration gap indicates that the fair value of theCompany’s assets is somewhat more sensitive to interest rate movements than the fair value of its liabilities.
The major portion of the Company’s duration gap is determined by its Property-Liability operations, with theprimary liabilities of these operations being auto and homeowners claims. In the management of investmentssupporting this business, Property-Liability adheres to an objective of maximizing total after-tax return on capital and
A-19

earnings while ensuring the safety of funds under management and adequate liquidity. This objective generallyresults in a duration mismatch between Property-Liability’s assets and liabilities within a defined tolerance range.
Life and Savings seeks to invest premiums and deposits to generate future cash flows that will fund futureclaims, benefits and expenses, and earn stable margins across a wide variety of interest rate and economic scenarios.In order to achieve this objective and limit its exposure to interest rate risk, Life and Savings adheres to a philosophyof managing the duration of assets and related liabilities. Life and Savings uses interest rate swaps, futures, forwards,caps and floors to reduce the interest rate risk resulting from duration mismatches between assets and liabilities. Inaddition, Life and Savings uses financial futures to hedge the interest rate risk related to anticipatory purchases andsales of investments and product sales to customers.
To calculate duration, the Company projects asset and liability cash flows, and discounts them to a net presentvalue basis using a risk-free market rate adjusted for credit quality, sector attributes, liquidity and other specific risks.Duration is calculated by revaluing these cash flows at an alternative level of interest rates, and determining thepercentage change in fair value from the base case. The cash flows used in the model reflect the expected maturityand repricing characteristics of the Company’s derivative financial instruments, all other financial instruments (asdepicted in Note 6 to the consolidated financial statements), and certain non-financial instruments including unearnedpremiums, Property-Liability claims and claims expense reserves and interest-sensitive annuity liabilities. Theprojections include assumptions (based upon historical market and Company specific experience) reflecting theimpact of changing interest rates on the prepayment, lapse, leverage and/or option features of instruments, whereapplicable. Such assumptions relate primarily to mortgage-backed securities, collateralized mortgage obligations,municipal housing bonds, callable municipal and corporate obligations, and fixed rate single and flexible premiumdeferred annuities. Additionally, the projections incorporate certain assumptions regarding the renewal of Property-Liability policies.
Based upon the information and assumptions the Company uses in its duration calculation and interest rates ineffect at December 31, 1999, management estimates that a 100 basis point immediate, parallel increase in interestrates (‘‘rate shock’’) would decrease the net fair value of its assets and liabilities identified above by approximately$779 million, versus $660 million at December 31, 1998. In addition, there are $3.10 billion of assets supporting lifeinsurance products which are not financial instruments and have not been included in the above analysis. Thisamount has decreased from the $3.32 billion in assets reported for December 31, 1998. According to the durationcalculation, in the event of a 100 basis point immediate increase in interest rates, these assets would decrease in valueby $131 million, comparable to a decrease of $123 million reported for December 31, 1998. The selection of a 100basis point immediate parallel increase in interest rates should not be construed as a prediction by the Company’smanagement of future market events, but rather, is intended to illustrate the potential impact of such an event.
To the extent that actual results differ from the assumptions utilized, the Company’s duration and rate shockmeasures could be significantly impacted. Additionally, the Company’s calculation assumes that the currentrelationship between short-term and long-term interest rates (the term structure of interest rates) will remain constantover time. As a result, these calculations may not fully capture the impact of non-parallel changes in the termstructure of interest rates and/or large changes in interest rates.
Equity Price Risk Equity price risk is the risk that the Company will incur economic losses due to adverse changesin a particular stock or stock index. At December 31, 1999, the Company had approximately $5.38 billion incommon stocks and $1.89 billion in other equity investments (including primarily convertible securities and privateequity securities). Approximately 94% and 56% of these totals, respectively, represented invested assets of theProperty-Liability operations. At December 31, 1998, the Company had $4.90 billion in common stocks and$1.90 billion in other equity investments, and approximately 95% and 58%, respectively, represented invested assetsof the Property-Liability operations.
In addition to the above, at December 31, 1999 and December 31, 1998, Life and Savings had $1.25 billion and$823 million, respectively, in equity-indexed annuity liabilities which provide customers with contractuallyguaranteed participation in price appreciation of the Standard & Poor’s 500 Composite Price Index (‘‘S&P 500’’).Life and Savings hedges the risk associated with the price appreciation component of the equity-indexed annuityliabilities through the purchase of equity-indexed options, futures, and futures options and eurodollar futures (the‘‘hedging portfolio’’). Any tracking error is maintained within specified value-at-risk limits. In addition to the options
Management’s Discussion and Analysisof Financial Condition and Results of Operations—(Continued)
A-20

purchased to hedge these annuity liabilities, Life and Savings has purchased equity-indexed options as a means todiversify overall portfolio risk.
The Company’s largest equity exposure is to declines in the S&P 500. As of December 31, 1999, theCompany’s portfolio of equity instruments has a beta of approximately 0.87. Beta represents a widely acceptedmethodology to describe, in mathematical terms, an investment’s market risk characteristic. For example, if the S&P500 decreases by 10%, management estimates that the fair value of its equity portfolio will decrease byapproximately 8.7%. Likewise, if the S&P 500 increases by 10%, management estimates that the fair value of itsequity portfolio will increase by approximately 8.7%. At December 31, 1998, the Company’s equity portfolio had abeta of 0.89.
Based upon the information and assumptions the Company uses in its beta calculation and in effect atDecember 31, 1999, management estimates that an immediate decrease in the S&P 500 of 10% would decrease thenet fair value of the Company’s assets and liabilities identified above by approximately $630 million, versus $603million at December 31, 1998. The selection of a 10% immediate decrease in the S&P 500 should not be construedas a prediction by the Company’s management of future market events, but rather, is intended to illustrate thepotential impact of such an event.
Beta was measured by regressing the monthly stock price movements of the equity portfolio against movementsin the S&P 500 over a three year historical period. Portfolio beta was also measured for the domestic equity portfolioby weighting individual stock betas by the market value of the holding in the portfolio. The two approaches tocalculating portfolio beta yielded virtually identical results. Since beta is historically based, projecting future pricevolatility using this method involves an inherent assumption that historical volatility and correlation relationships willremain stable. Therefore, the results noted above may not reflect the Company’s actual experience if future volatilityand correlation relationships differ from such historical relationships.
Foreign Currency Exchange Rate Risk Foreign currency risk is the risk that the Company will incur economiclosses due to adverse changes in foreign currency exchange rates. This risk arises from the Company’s foreign equityinvestments and its international operations. The Company also has certain fixed income securities that aredenominated in foreign currencies; however, the Company uses derivatives to hedge the foreign currency risk ofthese securities (both interest payments and the final maturity payment). At December 31, 1999, the Company hadapproximately $1.18 billion in foreign currency denominated equity securities and an additional $520 million netinvestment in foreign subsidiaries. These amounts have increased from $886 million and $472 million, respectively,as of December 31, 1998. The increase in equity securities is due to increases in public equity holdings.Approximately 94% of the total of these two sources of currency exposure represents invested assets of the Property-Liability operations. This percentage has increased from 89% as of December 31, 1998.
Based upon the information and assumptions in effect at December 31, 1999, management estimates that, holdingeverything else constant, a 10% immediate unfavorable change in each of the foreign currency exchange rates towhich the Company is exposed would decrease the net fair value of its foreign currency denominated instruments(identified above) by approximately $170 million, versus $136 million at December 31, 1998. The selection of a 10%immediate decrease in all currency exchange rates should not be construed as a prediction by the Company’smanagement of future market events, but rather, is intended to illustrate the potential impact of such an event. TheCompany’s currency exposure is well diversified across 32 countries, modestly decreased from 44 countries atDecember 31, 1998. The largest individual exposures at December 31, 1999 are to Canada (26%) and Japan (22%).The largest individual exposures at December 31, 1998 were to Canada (30%) and Japan (12%). The Company’sprimary regional exposure is to Western Europe with approximately 47%, versus 50% at December 31, 1998.
The modeling technique the Company uses to calculate its currency exposure does not take into accountcorrelation among foreign currency exchange rates, or correlation among various markets (i.e., the foreign exchange,equity and fixed-income markets). Even though the Company believes it to be unlikely that all of the foreigncurrency exchange rates to which it is exposed would simultaneously decrease by 10%, the Company finds itmeaningful to ‘‘stress test’’ its portfolio under this and other hypothetical extreme adverse market scenarios. TheCompany’s actual experience may differ from the results noted above due to the correlation assumptions utilized, orif events occur that were not included in the methodology, such as significant liquidity or market events.
A-21

CAPITAL RESOURCES AND LIQUIDITY
Capital resources Allstate’s capital resources consist of shareholders’ equity, mandatorily redeemable preferredsecurities and debt, representing funds deployed or available to be deployed to support business operations. Thefollowing table summarizes our capital resources at the end of the last three years:
($ in millions) 1999 1998 1997
Common stock and retained earnings $15,256 $14,284 $12,825Accumulated other comprehensive income 1,345 2,956 2,785
Total shareholders’ equity 16,601 17,240 15,610Mandatorily redeemable preferred securities 964 750 750Debt 2,851 1,746 1,696
Total capital resources $20,416 $19,736 $18,056
Ratio of debt to total capital resources(1) 16.3% 10.7% 11.5%
(1) When analyzing the Company’s ratio of debt to total capital resources, various formulas are used. In this presentation, debt includes 50% ofmandatorily redeemable preferred securities.
Shareholders’ equity Shareholders’ equity decreased in 1999, as net income was offset by share repurchases and adecline in unrealized capital gains. Shareholders’ equity increased in 1998 primarily as a result of net income.
Since 1995, the Company has repurchased 156 million shares of its common stock at a cost of $5.43 billion aspart of stock repurchase programs totaling $7.83 billion. The remaining programs are expected to be completed byDecember 31, 2000. The Company has reissued 43.6 million shares, including 34.1 million shares used to fund theAHL acquisition during 1999.
Mandatorily redeemable preferred securities The balance of mandatorily redeemable preferred securitiesincreased in 1999, as the outstanding mandatorily redeemable preferred securities ‘‘FELINE PRIDES’’ originallyissued by AHL, were consolidated into the Company’s results upon acquisition. FELINE PRIDES, consist of a unitwith a stated amount of $50 comprising i) a stock purchase contract under which the holder will purchase from theCompany on August 16, 2000, a number of Allstate common shares equal to a specified rate, and ii) a beneficialownership of a 6.75% trust preferred security representing a preferred undivided beneficial interest in the assets ofAHL Financing (the ‘‘Trust’’), a Delaware statutory business trust. The assets of the Trust are 6.75% debentures dueAugust 16, 2002. Under a shelf registration statement filed with the Securities and Exchange Commission (‘‘SEC’’)in February 2000, the Company may issue up to 7,398,387 shares of Allstate common stock upon settlement of thepurchase contracts of the FELINE PRIDES.
Debt Consolidated debt increased in 1999, due to an increase in short-term debt, the issuance of $750 million of7.20% Senior Notes due 2009 and the issuance of a $75 million, 10-year note to CNA Financial Corporation(‘‘CNA’’). The proceeds from the 7.20% Senior Note issuance were used for general corporate purposes, includingstock repurchases.
Consolidated debt increased in 1998, the result of increased short-term debt and the issuance of $250 million of6.75% senior debentures due 2018 and $250 million of 6.90% senior debentures due 2038. The net proceeds wereused to fund the maturity of $300 million of 5.875% notes due June 15, 1998, and for general corporate purposes.These increases were offset by the conversion of $357 million of 6.76% Automatically Convertible Equity Securitiesinto approximately 8.6 million common shares of The PMI Group, Inc. held by Allstate.
The Company has access to additional borrowing as follows:
● Allstate has a commercial paper program with an authorized borrowing limit of up to $1.00 billion to coverits short-term cash needs. At December 31, 1999, the Company had outstanding commercial paper borrowingsof $594 million with a weighted average interest rate of 5.86%.
● Allstate maintains two credit facilities totaling $1.55 billion as a potential source of funds to meet short-termliquidity requirements, including a $1.50 billion, five-year revolving line of credit expiring in 2001 and a$50 million, one-year revolving line of credit expiring in 2000. In order to borrow on the five-year line ofcredit, Allstate Insurance Company (‘‘AIC’’), a wholly owned subsidiary of the Company, is required to
Management’s Discussion and Analysisof Financial Condition and Results of Operations—(Continued)
A-22

maintain a specified statutory surplus level, and the Company’s debt to equity ratio (as defined in theagreement) must not exceed a designated level. These requirements are currently being met and managementexpects to continue to meet them in the future. There were no borrowings under these lines of credit during1999. Total borrowings under the combined commercial paper program and the Allstate lines of credit arelimited to $1.55 billion.
● AHL maintains three lines of credit totaling $92 million as a potential source of funds to meet short-termliquidity requirements. At December 31, 1999, $71 million was outstanding on these lines with a weightedaverage interest rate of 6.47%.
● At December 31, 1999, under a shelf registration statement filed with the SEC in August 1998, the Companymay issue up to an additional $1.25 billion of debt securities, preferred stock or debt warrants.
Capital Transactions
● On October 1, 1999, the Company completed the acquisition of the personal lines auto and homeownersinsurance business of CNA. At closing, AIC made a cash payment of $140 million to CNA for: i) certainassets of CNA used in connection with that business; ii) access to the CNA agency distribution channel; iii)infrastructure and employees of the business; iv) renewal rights to the in-force business; and v) an option toacquire certain licensed companies of CNA in the future. AIC will pay a license fee to CNA for the use ofcertain of CNA’s trademarks and access to the CNA personal lines distribution channel for a period of up tosix years. The license fee will be based on a percentage of the aggregate premiums produced by independentagents appointed by CNA personal lines prior to the acquisition date. At closing, Allstate also issued a $75million, 10-year note to CNA, the principal repayment of which at maturity is contingent upon certainprofitability measures of the acquired business. The maximum amount of principal which would have to bepaid is $85 million and the minimum amount is $65 million. In addition, as consideration for entering into a100% indemnity reinsurance agreement with CNA to reinsure the in-force policy obligations of the business,AIC received cash of approximately $1.2 billion and other assets.
● On October 31, 1999, Allstate acquired all of the outstanding shares of AHL pursuant to a merger agreementfor $32.25 per share in cash and Allstate common stock, in a transaction valued at $1.1 billion. AHLspecializes in selling life, health and disability insurance to individuals through their workplaces. In order tofund the equity component of the consideration, the Company reissued 34.1 million shares of Allstatecommon stock held in treasury to AHL shareholders. The remaining $87 million portion of the considerationwas funded with cash.
● In connection with the acquisition of AHL, Allstate assumed AHL’s obligations under the outstandingmandatorily redeemable preferred securities originally issued by AHL and the Trust.
● On April 14, 1998, the Company completed the purchase of Pembridge Inc. (‘‘Pembridge’’) forapproximately $275 million. Pembridge primarily sells non-standard auto insurance in Canada through itswholly-owned subsidiary, Pafco Insurance Company.
Financial ratings and strength The following table summarizes the Company’s and its major subsidiaries’ debtand commercial paper ratings and the insurance claims-paying ratings from various agencies at December 31, 1999.
Moody’sStandard& Poor’s
A.M.Best
The Allstate Corporation (debt) A 1 A+ –The Allstate Corporation (commercial paper) P-1 A-1 –Allstate Insurance Company (claims-paying ability) Aa2 AA A+Allstate Life Insurance Company (claims-paying ability) Aa2 AA+ A+American Heritage Life Insurance Company (claims-paying ability) Aa3 AA A+
The Company’s and its major subsidiaries’ ratings are influenced by many factors including the amount offinancial leverage (i.e. debt), exposure to risks such as catastrophes, as well as the current level of operating leverage.
A-23

Operating leverage for property-liability companies is measured by the ratio of net premiums written to statutorysurplus and serves as an indicator of the Company’s premium growth capacity. Ratios in excess of 3 to 1 areconsidered outside the usual range by insurance regulators and rating agencies. AIC’s premium to surplus ratio was1.5x and 1.4x at December 31, 1999 and 1998, respectively.
The National Association of Insurance Commissioners (‘‘NAIC’’) has a standard for assessing the solvency ofinsurance companies, which is referred to as risk-based capital (‘‘RBC’’). The requirement consists of a formula fordetermining each insurer’s RBC and a model law specifying regulatory actions if an insurer’s RBC falls belowspecified levels. The RBC formula for property-liability companies includes asset and credit risks but places moreemphasis on underwriting factors for reserving and pricing. The RBC formula for life insurance companiesestablishes capital requirements relating to insurance, business, asset and interest rate risks. At December 31, 1999,RBC for each of the Company’s domestic insurance companies was significantly above levels that would requireregulatory actions.
Liquidity The Allstate Corporation is a holding company whose principal operating subsidiaries include AIC andAHL. The Company’s principal sources of funds are dividend payments from AIC, intercompany borrowings, fundsfrom the settlement of Company benefit plans and funds that may be raised periodically from the issuance ofadditional debt, including commercial paper, or stock. The payment of dividends by AIC is limited by Illinoisinsurance law, to formula amounts based on statutory net income and statutory surplus, as well as the timing andamount of dividends paid in the preceding twelve months. In the twelve month period beginning January 1, 1999,AIC paid dividends of $2.96 billion, the maximum amount allowed based on the 1998 formula amounts. Based on1999 statutory net income, the maximum amount of dividends AIC will be able to pay without prior IllinoisDepartment of Insurance approval at a given point in time beginning in May 2000 is $1.96 billion, less dividendspaid during the preceding twelve months measured at that point in time. The Company’s principal uses of funds arethe payment of dividends to shareholders, share repurchases, intercompany lending to its insurance affiliates, debtservice, additional investments in its subsidiary affiliates and acquisitions.
The principal sources of funds for the Property-Liability operations are premiums, reinsurance, collections ofprincipal, interest and dividends from the investment portfolio, and intercompany loans or equity investments fromThe Allstate Corporation. The principal uses of funds by the Property-Liability operations are the payment of claimsand related expenses, operating expenses, dividends to The Allstate Corporation, the purchase of investments, therepayment of intercompany loans and the settlement of Company benefit plans.
The Company’s Property-Liability operations typically generate substantial positive cash flows from operationsas a result of most premiums being received in advance of the time when claim payments are required. Thesepositive operating cash flows, along with that portion of the investment portfolio that is held in cash and highly liquidsecurities, commercial paper borrowings and the Company’s lines of credit have met, and are expected to continue tomeet, the liquidity requirements of the Property-Liability operations. Catastrophe claims, the timing and amount ofwhich are inherently unpredictable, may create increased liquidity requirements for the Property-Liability operationsof the Company.
The principal sources of funds for Life and Savings are premiums, deposits, collection of principal, interest anddividends from the investment portfolio, and capital contributions from AIC, its parent. The primary uses of thesefunds are to purchase investments and pay policyholder claims, benefits, contract maturities, contract surrenders andwithdrawals, operating costs, and dividends to AIC.
The maturity structure of Life and Savings’ fixed income securities, which represent 81.6% of Life and Savings’total investments, is managed to meet the anticipated cash flow requirements of the underlying liabilities. A portionof Life and Savings’ diversified product portfolio, primarily fixed deferred annuity and interest-sensitive lifeinsurance products, is subject to discretionary surrender and withdrawal by contractholders. Total surrender andwithdrawal amounts for Life and Savings were $2.78 billion, $2.11 billion and $1.90 billion in 1999, 1998 and 1997,respectively. As Life and Savings’ interest-sensitive life policies and annuity contracts in force grow and age, thedollar amount of surrenders and withdrawals could increase, as experienced in 1999 and 1998. While the overallamount of surrenders may increase in the future, a significant increase in the level of surrenders relative to total
Management’s Discussion and Analysisof Financial Condition and Results of Operations—(Continued)
A-24

contractholder account balances is not anticipated. Management believes the assets are sufficiently liquid to meetfuture obligations to the Life and Savings contractholders under various interest rate scenarios.
The following table summarizes liabilities for interest-sensitive Life and Savings products by their contractualwithdrawal provisions at December 31, 1999. Approximately 11.2% of these liabilities are subject to discretionarywithdrawal without adjustment.
($ in millions) 1999
Not subject to discretionary withdrawal $10,624Subject to discretionary withdrawal with adjustments:
Specified surrender charges(1) 14,223Market value 2,473
Subject to discretionary withdrawal without adjustments 3,463
Total $30,783
(1) Includes $5.79 billion of liabilities with a contractual surrender charge of less than 5% of the account balance.
INVESTMENTS
The composition of the investment portfolio at December 31, 1999 is presented in the table below (see Notes 2 and5 to the consolidated financial statements for investment accounting policies and additional information).
Property-Liability Life and SavingsCorporateand Other Total
($ in millions)
Percentto total
Percentto total
Percentto total
Percentto total
Fixed income securities(1) $25,405 77.1% $28,106 81.6% $1,775 78.6% $55,286 79.4%Equity securities 6,113 18.6 624 1.8 1 – 6,738 9.7Mortgage loans 187 0.6 3,881 11.3 – – 4,068 5.8Short-term 1,227 3.7 713 2.1 482 21.4 2,422 3.5Other 11 – 1,120 3.2 – – 1,131 1.6
Total $32,943 100.0% $34,444 100.0% $2,258 100.0% $69,645 100.0%
(1) Fixed income securities are carried at fair value. Amortized cost for these securities was $25.47 billion, $27.94 billion and $1.88 billion forProperty-Liability, Life and Savings and Corporate and Other, respectively.
Total investments increased to $69.65 billion at December 31, 1999 from $66.53 billion at December 31, 1998.Property-Liability investments were $32.94 billion at December 31, 1999 as compared to $33.73 billion atDecember 31, 1998, as amounts invested from positive cash flows generated from operations and additional assetsacquired with the CNA personal lines, were offset by dividends paid to The Allstate Corporation during the year anddeclines in unrealized positions on fixed income securities.
Life and Savings investments increased to $34.44 billion at December 31, 1999, from $31.77 billion atDecember 31, 1998. The increase in Life and Savings investments was primarily due to amounts invested frompositive cash flows generated from operations and additional investments acquired with AHL, partially offset bydecreased unrealized capital gains on fixed income and equity securities.
Fixed income securities Allstate’s fixed income securities portfolio consists of tax-exempt municipal bonds,publicly traded corporate bonds, privately-placed securities, mortgage-backed securities, asset-backed securities,foreign government bonds, redeemable preferred stock and U.S. government bonds. Allstate generally holds its fixedincome securities to maturity, but has classified all of these securities as available for sale to allow maximumflexibility in portfolio management. At December 31, 1999, unrealized net capital losses on the fixed incomesecurities portfolio totaled $7 million compared to an unrealized gain of $3.61 billion as of December 31, 1998. Thedecrease in the unrealized gain position is primarily attributable to an increase in interest rates at the end of the year.As of December 31, 1999, 68.9% of the consolidated fixed income securities portfolio was invested in taxablesecurities.
A-25

At December 31, 1999, 93.7% of the Company’s fixed income securities portfolio was rated investment grade,which is defined by the Company as a security having an NAIC rating of 1 or 2, a Moody’s rating of Aaa, Aa, A orBaa, or a comparable Company internal rating. The quality mix of Allstate’s fixed income securities portfolio atDecember 31, 1999 is presented in the following table.
($ in millions)NAIC ratings Moody’s equivalent description Fair value Percent to total
1 Aaa/Aa/A $ 42,697 77.2%2 Baa 9,135 16.53 Ba 1,867 3.44 B 1,241 2.25 Caa or lower 261 .56 In or near default 85 .2
$ 55,286 100.0%
Included among the securities that are rated below investment grade are both public and privately-placed high-yield bonds and securities that were purchased at investment grade but have since been downgraded. The Companymitigates the credit risk of investing in below investment grade fixed income securities by limiting the percentage ofthese investments that can be carried in its portfolio, and through diversification of the portfolio. Based on theselimits, a minimum of 93% of the Company’s fixed income securities portfolio will be investment grade.
Over 34% of the Company’s fixed income securities portfolio at December 31, 1999 was invested in municipalbonds of which 92.2% are rated as investment grade. The municipal bond portfolio consisted of approximately 6,000issues from nearly 2,000 issuers. The largest exposure to a single issuer was less than 1.0% of the portfolio.
As of December 31, 1999, the fixed income securities portfolio contained $8.62 billion of privately-placedcorporate obligations, compared with $9.69 billion at December 31, 1998. The benefits of privately-placed securitiesas compared to public securities are generally higher yields, improved cash flow predictability through pro-ratasinking funds on many bonds, and a combination of covenant and call protection features designed to better protectthe holder against losses resulting from credit deterioration, reinvestment risk and fluctuations in interest rates. Arelative disadvantage of privately-placed securities as compared to public securities is reduced liquidity. AtDecember 31, 1999, 91.3% of the privately-placed securities were rated as investment grade by either the NAIC orthe Company’s internal ratings. The Company determines the fair value of privately-placed fixed income securitiesbased on discounted cash flows using current interest rates for similar securities.
At December 31, 1999 and 1998, $7.88 billion of the fixed income securities portfolio was invested inmortgage-backed securities (‘‘MBS’’). The MBS portfolio consists primarily of securities which were issued by orhave underlying collateral that is guaranteed by U.S. government agencies or sponsored entities, thus minimizingcredit risk.
The MBS portfolio is subject to interest rate risk since the price volatility and ultimate realized yield are affectedby the rate of repayment of the underlying mortgages. Allstate attempts to limit interest rate risk on these securitiesby investing a portion of the portfolio in securities that provide prepayment protection. At December 31, 1999, over33% of the MBS portfolio was invested in planned amortization class bonds.
The fixed income securities portfolio contained $3.90 billion and $4.25 billion of asset-backed securities(‘‘ABS’’) at December 31, 1999 and 1998, respectively. The ABS portfolio is subject to credit and interest rate risk.Credit risk is mitigated by monitoring the performance of the collateral. Approximately 51% of all securities arerated in the highest rating category by one or more credit rating agencies. Interest rate risk is similar to the risksposed by MBS, however to a lesser degree because of the nature of the underlying assets. Over 45% of theCompany’s ABS are invested in securitized credit card receivables. The remainder of the portfolio is backed bysecuritized home equity, manufactured housing and auto loans.
Allstate closely monitors its fixed income securities portfolio for declines in value that are other than temporary.Securities are placed on non-accrual status when they are in default or when the receipt of interest payments is indoubt.
Management’s Discussion and Analysisof Financial Condition and Results of Operations—(Continued)
A-26

Mortgage loans and real estate Allstate’s $4.07 billion investment in mortgage loans at December 31, 1999 iscomprised primarily of loans secured by first mortgages on developed commercial real estate, and is primarily held inthe Life and Savings operations. Geographical and property type diversification are key considerations used tomanage Allstate’s mortgage loan risk.
Allstate closely monitors its commercial mortgage loan portfolio on a loan-by-loan basis. Loans with anestimated collateral value less than the loan balance, as well as loans with other characteristics indicative of higherthan normal credit risk, are reviewed by financial and investment management at least quarterly for purposes ofestablishing valuation allowances and placing loans on non-accrual status. The underlying collateral values are basedupon discounted property cash flow projections, which are updated as conditions change or at least annually.
During 1998, the Company sold the majority of its real estate properties but continues to hold equity interests inseveral publicly traded real estate investment trusts and private securities which are classified as equity securities.
Equity securities and short-term investments The Company’s equity securities portfolio was $6.74 billion atDecember 31, 1999 compared to $6.42 billion in 1998. The increase can be attributed to general market appreciation.
The Company’s short-term investment portfolio was $2.42 billion and $2.48 billion at December 31, 1999 and1998, respectively. Allstate invests available cash balances primarily in taxable short-term securities having a finalmaturity date or redemption date of one year or less.
YEAR 2000
In 1995, the Company commenced a four phase plan which included reprogramming, remediating or replacingcomputer systems and equipment which may have failed to operate properly in or after the year 1999, due to theinability of the systems and equipment to recognize the last two digits of the year in any date (‘‘Year 2000’’).Because of the comprehensiveness of this plan, and its timely completion, the Company has experienced no materialimpacts on its results of operations, liquidity or financial position due to the Year 2000 issue. The Company expectsto incur total costs related to this plan of $109 million between the years of 1995 and 2000. These costs are expensedas incurred.
The Company is also potentially exposed to Year 2000 risks associated with certain personal lines policies thathave been issued. While coverage may exist for some Year 2000 related losses under Allstate’s personal auto orhomeowners insurance policies, many Year 2000 related losses will not be covered by these policies. Losses incurreddue to mere failures of personal electronic devices to function as intended by their manufacturer or distributor, or asexpected by the policyholder, are not the type of losses which would be covered by the Company’s personal auto orhomeowners insurance policies. Such product failures are considered to be product warranty issues best addressedbetween the policyholder and the manufacturer or distributor of the products. However, certain other types of Year2000-related losses may be covered under the Company’s policies, depending upon the particular circumstances ofthe loss and the type of policy in force at the time of loss. Some of the Company’s homeowners policies, forinstance, provide significantly broader protection than others, and therefore may provide coverage for certain types oflosses. The Company also is exposed to Year 2000 risks associated with certain commercial policies that have beenissued. Since the commercial business written by the Company is not material to the overall results of operations ofthe Company, management believes that Year 2000-related losses associated with these lines do not pose a materialrisk to the Company. However, with respect to both personal lines and commercial policies, in determining whethercoverage exists in any particular circumstance, all facts of the loss as well as the applicable policy terms, conditionsand exclusions will be reviewed. The Company currently does not expect the impacts of such losses, if any, on itsresults of operations, liquidity or financial position to be material.
REGULATION AND LEGAL PROCEEDINGS
Regulation The Company’s insurance businesses are subject to the effects of changing social, economic andregulatory environments. Public and regulatory initiatives have varied and have included efforts to adversely
A-27

influence and restrict premium rates, restrict the Company’s ability to cancel policies, impose underwriting standardsand expand overall regulation. The ultimate changes and eventual effects, if any, of these initiatives are uncertain.
Legal proceedings Allstate and plaintiffs’ representatives have agreed to settle certain civil suits filed in California,including a class action, related to the 1994 Northridge, California earthquake. The class action settlement receivedfinal approval from the Superior Court of the State of California for the County of Los Angeles on June 11, 1999.The plaintiffs in these civil suits challenged licensing and engineering practices of certain firms Allstate retained andalleged that Allstate systematically pressured engineering firms to improperly alter their reports to reduce the lossamounts paid to some insureds with earthquake claims. Under the terms of the settlement, Allstate sent notice toapproximately 11,500 homeowner customers inviting them to participate in a court-administered program which mayallow for review of their claims by an independent engineer and an independent adjusting firm to ensure that theyhave been adequately compensated for all structural damage from the 1994 Northridge earthquake covered under theterms of their Allstate policies. It is anticipated that approximately 2,500 of these customers will ultimatelyparticipate in this independent review process. Allstate has agreed to retain an independent consultant to review,among other things, Allstate’s practices and procedures for handling catastrophe claims, and has helped fund acharitable foundation devoted to consumer education on loss prevention and consumer protection and other insuranceissues. The Company does not expect that the effect of the proposed settlement will exceed the amounts currentlyreserved. During August 1999, a group of objectors filed an appeal from the order approving the settlement. Thatappeal is pending.
In April 1998, Federal Bureau of Investigation agents executed search warrants at three Allstate offices fordocuments relating to the handling of certain claims for losses resulting from the Northridge earthquake. Allstate iscooperating with the investigation, which is being directed by the United States Attorney’s Office for the CentralDistrict of California. At present, the Company cannot determine the impact of resolving the investigation.
For the past five years, the Company has been distributing to certain PP&C claimants, documents regarding theclaims process and the role that attorneys may play in that process. Suits challenging the use of these documents havebeen filed against the Company, including purported class action suits. In addition to these suits, the Company hasreceived inquires from states’ attorneys general, bar associations and departments of insurance. In certain states, theCompany continues to use these documents after agreeing to make certain modifications. The Company is vigorouslydefending its rights to use these documents. The outcome of these disputes is currently uncertain.
There are currently several state and nationwide putative class action lawsuits pending in various state courtsseeking actual and punitive damages from Allstate alleging breach of contract and fraud because of its specificationof aftermarket (non-original equipment manufacturer) replacement parts in the repair of insured vehicles. Plaintiffs inthese suits allege that aftermarket parts are not ‘‘of like kind and quality’’ as required by the insurance policies. Thelawsuits are in various stages of development with no class action having been certified. The outcome of thesedisputes is currently uncertain.
Allstate is defending lawsuits, including two putative class actions, regarding worker classification. Two suitsrelate to the classification of California exclusive agents as independent contractors. These suits were filed afterAllstate’s reorganization of its California agency programs in 1996. The plaintiffs, among other things, seek adetermination that they have been treated as employees notwithstanding agent contracts that specify that they areindependent contractors for all purposes. Another suit relates to the classification of staff working in agency offices.In this putative class action, plaintiffs seek damages under the Employee Retirement Income Security Act and theRacketeer Influenced and Corrupt Organizations Act alleging that 10,000 agency secretaries were terminated asemployees by Allstate and rehired by agencies through outside staffing vendors for the purpose of avoiding thepayment of employee benefits. Allstate is vigorously defending these lawsuits. The outcome of these disputes iscurrently uncertain.
Various other legal and regulatory actions are currently pending that involve Allstate and specific aspects of itsconduct of business, including some related to the Northridge earthquake, and like other members of the insuranceindustry, the Company is the target of an increasing number of class action lawsuits. These class actions are based ona variety of issues including insurance and claim settlement practices. At this time, based on their present status, it isthe opinion of management that the ultimate liability, if any, in one or more of these other actions in excess ofamounts currently reserved is not expected to have a material effect on the results of operations, liquidity or financialposition of the Company.
Management’s Discussion and Analysisof Financial Condition and Results of Operations—(Continued)
A-28

Shared Markets As a condition of its license to do business in various states, the Company is required toparticipate in mandatory property-liability shared market mechanisms or pooling arrangements, which providevarious insurance coverages to individuals or other entities that otherwise are unable to purchase such coveragevoluntarily provided by private insurers. Underwriting results related to these organizations have been immaterial tothe results of operations.
Guaranty Funds Under state insurance guaranty fund laws, insurers doing business in a state can be assessed, upto prescribed limits, for certain obligations of insolvent insurance companies to policyholders and claimants. TheCompany’s expenses related to these funds have been immaterial.
OTHER DEVELOPMENTS
● The NAIC has approved a January 1, 2001 implementation date for newly developed statutory accountingprinciples (‘‘codification’’). Each company, however, must adhere to the implementation date adopted by theirstate of domicile. Forty-nine states have indicated their intention to adopt the codification as of January 1,2001. States continue to review codification requirements to determine if revisions to existing state laws andregulations are necessary. The implementation of codification is not expected to have a material impact on thestatutory surplus of the Company’s insurance subsidiaries.
PENDING ACCOUNTING STANDARDS
In June 1999, the Financial Accounting Standards Board (‘‘FASB’’) delayed the effective date of Statement ofFinancial Accounting Standard (‘‘SFAS’’) No. 133, ‘‘Accounting for Derivative Instruments and HedgingActivities.’’ SAFS No. 133 replaces existing pronouncements and practices with a single, integrated accountingframework for derivatives and hedging activities. This statement requires that all derivatives be recognized on thebalance sheet at fair value. Derivatives that are not hedges must be adjusted to fair value through income. If thederivative is a hedge, depending on the nature of the hedge, changes in the fair value of derivatives will either beoffset against the change in fair value of the hedged assets, liabilities or firm commitments through earnings orrecognized in other comprehensive income until the hedged item is recognized in earnings. Additionally, the changein fair value of a derivative which is not effective as a hedge will be immediately recognized in earnings. The delaywas effected through the issuance of SFAS No. 137, which extends the effective date of SFAS No. 133 requirementsto fiscal years beginning after June 15, 2000. As such, the Company expects to adopt the provisions of SFAS No.133 as of January 1, 2001. The impact of this statement is dependent upon the Company’s derivative positions andmarket conditions existing at the date of adoption. Based on existing interpretations of the requirements of SFAS No.133, the impact of adoption is not expected to be material to the results of operations or financial position of theCompany.
FORWARD-LOOKING STATEMENTS AND RISK FACTORS AFFECTING ALLSTATE
This document contains ‘‘forward-looking statements’’ that anticipate results based on management’s plans thatare subject to uncertainty. These statements are made subject to the safe-harbor provisions of the Private SecuritiesLitigation Reform Act of 1995.
Forward-looking statements do not relate strictly to historical or current facts and may be identified by their useof words like ‘‘plans,’’ ‘‘expects,’’ ‘‘will,’’ ‘‘anticipates,’’ ‘‘estimates,’’ ‘‘intends,’’ ‘‘believes’’ and other wordswith similar meanings. These statements may address, among other things, our strategy for growth, productdevelopment, regulatory approvals, market position, expenses, financial results and reserves. Forward-lookingstatements are based on management’s current expectations of future events. We cannot guarantee that any forward-looking statement will be accurate. However, we believe that our forward-looking statements are based onreasonable, current expectations and assumptions. We assume no obligation to update any forward-looking statementsas a result of new information or future events or developments.
If the expectations or assumptions underlying our forward-looking statements prove inaccurate or if risks oruncertainties arise, actual results could differ materially from those communicated in our forward-looking statements.In addition to the normal risks of business, Allstate is subject to significant risk factors, including those listed belowwhich apply to it as an insurance business.
A-29

● The implementation of Allstate’s multi-access distribution model involves risks and uncertainties that couldhave a material adverse effect on Allstate’s results of operations, liquidity or financial position. Morespecifically, the following factors could affect Allstate’s ability to successfully implement various aspects ofits new multi-access distribution model:
—The success of Allstate’s proposed direct response call centers may be adversely affected by the limitedpool of individuals suited and trained to do such work in any geographic area, particularly in light of thecurrent low unemployment rate. The absence of seasoned staff could be a factor impeding the training ofstaff and the roll-out of the call centers because they represent a new initiative by Allstate involvingvirtually all new hires.
—Allstate’s reorganization of its multiple employee agency programs into a single exclusive agencyindependent contractor program may have a temporary negative impact on written premium. As thereorganization proceeds, many agents will be deciding whether to convert to independent contractor statusand remain with Allstate; to convert to independent contractor status and sell their economic interest intheir book of businesses to an Allstate-approved buyer; or to retire or otherwise voluntarily separate fromAllstate. The distractions of this decision making process and the possible departure of some agents maylead to decreased sales. In addition, possible litigation regarding the reorganization could diminish the gainsin efficiency and cost-effectiveness that Allstate expects to realize from the transition to one program.
—Allstate’s reorganization of its multiple employee agency programs into a single exclusive agencyindependent contractor program, as well as its plans to sell and service its products through direct responsecall centers and the Internet, are dependent upon its ability to adapt current computer systems and todevelop and implement new systems.
● There is inherent uncertainty in the process of establishing property-liability loss reserves, particularlyreserves for the cost of environmental, asbestos and other mass tort claims. This uncertainty arises from anumber of factors, including ongoing interpretation of insurance policy provisions by courts, inconsistentdecisions in lawsuits regarding coverage and expanded theories of liability. In addition, on-going changes inclaims settlement practices can lead to changes in loss payment patterns. Moreover, while managementbelieves that improved actuarial techniques and databases have assisted in estimating environmental, asbestosand other mass tort net loss reserves, these refinements may subsequently prove to be inadequate indicators ofthe extent of probable loss. Consequently, ultimate losses could materially exceed established loss reservesand have a material adverse effect on our results of operations, liquidity or financial position.
● Allstate has experienced, and continues to expect to experience, catastrophe losses. While we believe that ourcatastrophe management initiatives have reduced the magnitude of possible future losses, Allstate continues tobe exposed to catastrophes that could have a material adverse impact on results of operations, liquidity orfinancial position. Catastrophic events in the future may indicate that the techniques and data that are used topredict the probability of catastrophes and the extent of the resulting losses are inaccurate.
● Changes in market interest rates can have adverse effects on Allstate’s investment portfolio, investmentincome and product sales. Increases in market interest rates have an adverse impact on the value of theinvestment portfolio by decreasing capital gains. In addition, increases in market interest rates as compared torates offered on some of the Life and Savings segment’s products make those products less attractive andtherefore decrease sales. Declining market interest rates have an adverse impact on Allstate’s investmentincome as Allstate invests positive cash flows from operations and reinvests proceeds from maturing andcalled investments in new investments yielding less than the portfolio’s average rate. Despite recent increases,current market interest rates are lower than the Allstate portfolio average rate.
● In order to meet the anticipated cash flow requirements of its obligations to policyholders, from time to timeAllstate adjusts the effective duration of the assets and liabilities of the Life and Savings segment’sinvestment portfolio. Those adjustments may have an impact on the value of the investment portfolio and oninvestment income.
● The insurance business is subject to extensive regulation—particularly at the state level. Many of theserestrictions affect Allstate’s ability to operate and grow its businesses in a profitable manner. In particular, thePP&C segment’s implementation of a tiered-based pricing model for its private passenger auto business issubject to state regulation of auto insurance rates.
Management’s Discussion and Analysisof Financial Condition and Results of Operations—(Continued)
A-30

● Recently, the competitive pricing environment for private passenger auto insurance has put pressure on thePP&C segment’s premium growth and profit margins. Allstate’s management believes that this pressure isabating and that industry participants may begin to raise auto insurance rates in 2000. However, becauseAllstate’s PP&C segment’s loss ratio compares favorably to the industry, state regulatory authorities mayresist our efforts to raise rates or to maintain them at current levels.
● Allstate is a holding company with no significant business operations of its own. Consequently, to a largeextent, its ability to pay dividends and meet its debt payment obligations is dependent on dividends from itssubsidiaries, primarily AIC.
● State insurance regulatory authorities require insurance companies to maintain specified levels of statutorycapital and surplus. In addition, competitive pressures require Allstate’s subsidiaries to maintain financialstrength or claims-paying ability ratings. These restrictions affect Allstate’s ability to pay shareholderdividends and use its capital in other ways.
● There is uncertainty involved in estimating the availability of reinsurance and the collectibility of reinsurancerecoverables. This uncertainty arises from a number of factors, including segregation by the industry generallyof reinsurance exposure into separate legal entities.
● The Life and Savings segment distributes some of its products under agreements with other financial servicesentities. Termination of such agreements due to changes in control of these non-affiliated entities could have adetrimental effect on the segment’s sales. This risk may be increased due to the recent enactment of theGramm-Leach-Bliley Act of 1999, which eliminates many federal and state law barriers to affiliations amongbanks, securities firms, insurers and other financial service providers.
● In November 1999, Allstate announced a program to reduce expenses by approximately $600 million, to befully realized beginning in 2001. These expense reductions are dependent on the elimination of certainemployee positions, the consolidation of Allstate’s operations and facilities, and the reorganization of itsmultiple employee agency programs to a single exclusive agency independent contractor program. Thesavings are to be invested in technology, competitive pricing and advertising.
● Allstate maintains a $1.50 billion, five-year revolving line of credit and a $50 million one-year revolving lineof credit as potential sources of funds to meet short-term liquidity requirements. In order to borrow on thefive-year line of credit, AIC is required to maintain a specified statutory surplus level and the Allstate debt toequity ratio (as defined in the credit agreement) must not exceed a designated level. The ability of Allstateand AIC to meet the requirements is dependent upon their financial condition. If AIC were to sustainsignificant losses from catastrophes, Allstate and AIC’s ability to borrow on the lines of credit could bediminished or eliminated during a period when they might be most in need of capital resources and liquidity.
● Changes in the severity of claims have an impact on the profitability of Allstate’s business. Changes in injuryclaim severity are driven primarily by inflation in the medical sector of the economy. Changes in autophysical damage claim severity are driven primarily by inflation in auto repair costs and used car prices.
● For its non-standard auto insurance business, Allstate is implementing programs to address the emergence ofadverse profitability trends. These programs include additional down-payment requirements, new underwritingguidelines and new rating plans. Allstate expects these programs to have a temporary adverse impact onwritten premium growth; however, they should improve profitability over time.
● A number of enacted and pending legislative measures may lead to increased consolidation and increasedcompetition in the financial services industry. At the federal level, these measures include the recently enactedGramm-Leach-Bliley Act of 1999, which eliminates many federal and state law barriers to affiliations amongbanks, securities firms, insurers and other financial service providers. At the state level, these measuresinclude legislation to permit mutual insurance companies to convert to a hybrid structure known as a mutualholding company, thereby allowing insurance companies owned by their policyholders to become stockinsurance companies owned (through one or more intermediate holding companies) at least 51% by theirpolicyholders and potentially up to 49% by stockholders. Also several large mutual life insurers have used orare expected to use existing state laws and regulations governing the conversion of mutual insurancecompanies into stock insurance companies (demutualization). These measures may also increase competitionfor capital among financial service providers.
A-31

● Deferred annuities and interest-sensitive life insurance products receive favorable policyholder taxation undercurrent tax laws and regulations. Any legislative or regulatory changes that adversely alter this treatment arelikely to negatively affect the demand for these products.
● Due to legislative and regulatory reform of the auto insurance system in New Jersey that included regulatedrate reductions and coverage changes effective for new policies written and renewals processed on and afterMarch 22, 1999, Allstate New Jersey Insurance Company, a wholly owned Allstate subsidiary, experienceddecreased average premiums in 1999. Management expects that these reforms will also lead to improved lossexperience in the future. However, it is possible that losses may increase or that any decrease in losses willnot be commensurate with the reductions in premiums.
● The adoptions of SFAS No. 133, ‘‘Accounting for Derivative Instruments and Hedging Activities’’ is notexpected to be material to the results of operations of the Company. However, the impact is dependent uponmarket conditions and our investment portfolio existing at the date of adoption, which for Allstate will beJanuary 1, 2001.
● Additional risk factors regarding market risk are incorporated by reference to the discussion of ‘‘MarketRisk’’ beginning on page A-18 of the Proxy Statement.
Management’s Discussion and Analysisof Financial Condition and Results of Operations—(Continued)
A-32

THE ALLSTATE CORPORATION AND SUBSIDIARIES
CONSOLIDATED STATEMENTS OF OPERATIONS
Year Ended December 31,
1999 1998 1997
(in millions except per share data)
RevenuesProperty-liability insurance premiums (net of reinsurance ceded of $389, $433 and
$366) $20,112 $19,307 $18,604Life and annuity premiums and contract charges (net of reinsurance ceded of $260,
$178 and $194) 1,623 1,519 1,502Net investment income 4,112 3,890 3,861Realized capital gains and losses 1,112 1,163 982
26,959 25,879 24,949
Costs and expensesProperty-liability insurance claims and claims expense (net of reinsurance recoveries
of $567, $318 and $314) 14,679 13,601 13,336Life and annuity contract benefits (net of reinsurance recoveries of $179, $50 and $49) 2,578 2,415 2,415Amortization of deferred policy acquisition costs 3,282 3,021 2,789Operating costs and expenses 2,313 2,066 1,937Restructuring charges 81 – –Interest expense 129 118 100
23,062 21,221 20,577
Gain on disposition of operations 10 87 62
Income from operations before income tax expense, dividends on preferredsecurities, and equity in net income of unconsolidated subsidiary 3,907 4,745 4,434
Income tax expense 1,148 1,422 1,324
Income before dividends on preferred securities and equity in net income ofunconsolidated subsidiary 2,759 3,323 3,110
Dividends on preferred securities of subsidiary trusts (39) (39) (39)
Equity in net income of unconsolidated subsidiary – 10 34
Net income $ 2,720 $ 3,294 $ 3,105
Earnings per share:Net Income per share–basic $ 3.40 $ 3.96 $ 3.58
Net Income per share–diluted $ 3.38 $ 3.94 $ 3.56
Weighted average shares–basic 800.2 832.2 867.9
Weighted average shares–diluted 803.8 836.6 872.8
See notes to consolidated financial statements.
A-33

THE ALLSTATE CORPORATION AND SUBSIDIARIES
CONSOLIDATED STATEMENTS OF COMPREHENSIVE INCOME
Year Ended December 31,
1999 1998 1997
($ in millions)
Net income $ 2,720 $3,294 $3,105
Other comprehensive income, after-taxChanges in:
Unrealized net capital gains and losses (1,625) 173 818Unrealized foreign currency translation adjustments 14 (2) (57)
Other comprehensive income (loss), after-tax (1,611) 171 761
Comprehensive income $ 1,109 $3,465 $3,866
See notes to consolidated financial statements.
A-34

THE ALLSTATE CORPORATION AND SUBSIDIARIES
CONSOLIDATED STATEMENTS OF FINANCIAL POSITION
December 31,
1999 1998
($ in millions except par value data)AssetsInvestments
Fixed income securities, at fair value (amortized cost $55,293 and $49,946) $55,286 $53,560Equity securities, at fair value (cost $4,565 and $4,231) 6,738 6,421Mortgage loans 4,068 3,458Short-term 2,422 2,477Other 1,131 609
Total investments 69,645 66,525
Cash 254 258Premium installment receivables, net 3,927 3,082Deferred policy acquisition costs 4,119 3,096Reinsurance recoverables, net 2,209 1,932Accrued investment income 812 751Deferred income taxes 211 –Property and equipment, net 916 803Other assets 2,169 1,146Separate Accounts 13,857 10,098
Total assets $98,119 $87,691
LiabilitiesReserve for property-liability insurance claims and claims expense $17,814 $16,881Reserve for life-contingent contract benefits 7,597 7,601Contractholder funds 25,199 21,133Unearned premiums 7,671 6,425Claim payments outstanding 860 778Other liabilities and accrued expenses 4,705 4,578Deferred income taxes – 461Short-term debt 665 393Long-term debt 2,186 1,353Separate Accounts 13,857 10,098
Total liabilities 80,554 69,701
Commitments and Contingent Liabilities (Notes 6, 7 and 12)
Mandatorily Redeemable Preferred Securities of Subsidiary Trusts 964 750
Shareholders’ EquityPreferred stock, $1 par value, 25 million shares authorized, none issued – –Common stock, $.01 par value, 2.0 billion shares authorized and 900 million issued, 787 million
and 818 million shares outstanding 9 9Additional capital paid-in 2,664 3,102Retained income 16,728 14,490Deferred ESOP expense (216) (252)Treasury stock, at cost (113 million and 82 million shares) (3,929) (3,065)Accumulated other comprehensive income:
Unrealized net capital gains 1,369 2,994Unrealized foreign currency translation adjustments (24) (38)
Total accumulated other comprehensive income 1,345 2,956
Total shareholders’ equity 16,601 17,240
Total liabilities and shareholders’ equity $98,119 $87,691
See notes to consolidated financial statements.
A-35

THE ALLSTATE CORPORATION AND SUBSIDIARIES
CONSOLIDATED STATEMENTS OF SHAREHOLDERS’ EQUITY
December 31,
($ in millions except per share data) 1999 1998 1997
Common stock $ 9 $ 9 $ 9
Additional capital paid-inBalance, beginning of year 3,102 3,116 3,129Shares reissued for AHL acquisition (423) – –Equity incentive plans activity (15) (14) (13)
Balance, end of year 2,664 3,102 3,116
Retained incomeBalance, beginning of year 14,490 11,646 8,958Net income 2,720 3,294 3,105Dividends ($.60, $.54 and $.48 per share) (482) (450) (417)
Balance, end of year 16,728 14,490 11,646
Deferred ESOP expenseBalance, beginning of year (252) (281) (280)Reduction (addition) 36 29 (1)
Balance, end of year (216) (252) (281)
Treasury stockBalance, beginning of year (3,065) (1,665) (388)Shares acquired (2,173) (1,489) (1,358)Shares reissued for AHL acquisition 1,240 – –Shares reissued under equity incentive plans 69 89 81
Balance, end of year (3,929) (3,065) (1,665)
Accumulated other comprehensive incomeBalance, beginning of year 2,956 2,785 2,024Change in unrealized foreign currency translation adjustments 14 (2) (57)Change in unrealized net capital gains and losses (1,625) 173 818
Balance, end of year 1,345 2,956 2,785
Total shareholders’ equity $16,601 $17,240 $15,610
See notes to consolidated financial statements.
A-36

THE ALLSTATE CORPORATION AND SUBSIDIARIES
CONSOLIDATED STATEMENTS OF CASH FLOWS
Year Ended December 31,
($ in millions) 1999 1998 1997
Cash flows from operating activitiesNet income $ 2,720 $ 3,294 $ 3,105Adjustments to reconcile net income to net cash provided by operating activities
Depreciation, amortization and other non-cash items (17) (22) (22)Realized capital gains and losses (1,112) (1,163) (982)Gain on disposition of operations (10) (87) (62)Interest credited to contractholder funds 1,362 1,247 1,209Changes in:
Policy benefit and other insurance reserves (706) (716) (73)Unearned premiums 70 137 59Deferred policy acquisition costs (245) (311) (304)Premium installment receivables (156) (86) (73)Reinsurance recoverables (69) 154 99Income taxes payable 58 44 261Other operating assets and liabilities 372 400 125
Net cash provided by operating activities 2,267 2,891 3,342
Cash flows from investing activitiesProceeds from sales
Fixed income securities 21,679 13,634 12,924Equity securities 9,633 4,909 3,657Real estate – 813 144
Investment collectionsFixed income securities 5,356 6,700 6,597Mortgage loans 453 440 600
Investment purchasesFixed income securities (31,094) (21,870) (21,788)Equity securities (8,849) (3,999) (3,515)Mortgage loans (969) (875) (449)
Change in short-term investments, net 454 (610) 427Change in other investments, net (34) (95) (105)Acquisitions, net of cash received 971 (275) –Proceeds from disposition of operations – 49 138Purchases of property and equipment, net (212) (188) (150)
Net cash used in investing activities (2,612) (1,367) (1,520)
Cash flows from financing activitiesChange in short-term debt, net 202 181 47Proceeds from issuance of long-term debt 833 513 263Repayment of long-term debt – (300) –Contractholder fund deposits 5,593 3,275 2,657Contractholder fund withdrawals (3,684) (3,306) (3,076)Dividends paid (471) (443) (323)Treasury stock purchases (2,173) (1,489) (1,358)Other 41 83 72
Net cash provided by (used in) financing activities 341 (1,486) (1,718)
Net increase (decrease) in cash (4) 38 104Cash at beginning of year 258 220 116
Cash at end of year $ 254 $ 258 $ 220
See notes to consolidated financial statements.
A-37
1. General
Basis of presentation
The accompanying consolidated financial statements include the accounts of The Allstate Corporation and itswholly owned subsidiaries, primarily Allstate Insurance Company (‘‘AIC’’), a property-liability insurance companywith various property-liability and life and savings subsidiaries, including Allstate Life Insurance Company(‘‘ALIC’’) (collectively referred to as the ‘‘Company’’ or ‘‘Allstate’’). These consolidated financial statements havebeen prepared in conformity with generally accepted accounting principles. All significant intercompany accounts andtransactions have been eliminated.
To conform with the 1999 presentation, certain amounts in the prior years’ financial statements and notes havebeen reclassified.
Nature of operations
Allstate is engaged, principally in the United States and Canada, in the property-liability and life and savingsbusinesses. Allstate’s primary business is the sale of private passenger auto and homeowners insurance. TheCompany also sells life insurance, savings and group pension products, and selected commercial property andcasualty coverages.
Allstate’s personal property and casualty (‘‘PP&C’’) segment is principally engaged in private passenger autoand homeowners insurance, writing approximately 71% of Allstate’s total 1999 premiums as determined understatutory accounting practices. Allstate was the country’s second largest insurer for both private passenger auto andhomeowners insurance in 1998.
Allstate has exposure to catastrophes, which are an inherent risk of the property-liability insurance business,which have contributed, and will continue to contribute, to material year-to-year fluctuations in the Company’s resultsof operations and financial condition. The Company also has exposure to environmental and asbestos claims andother mass tort exposures (see Note 7).
Allstate’s life and savings (‘‘Life and Savings’’) segment markets a broad line of life insurance, savings andgroup pension products countrywide, accounting for approximately 29% of Allstate’s 1999 statutory premiums,which include premiums and deposits for all products. Life insurance consists of traditional products, including termand whole life, interest-sensitive life, immediate annuities with life contingencies, variable life and indexed lifeinsurance. Savings products include deferred annuities and immediate annuities without life contingencies. Grouppension savings products include contracts with fixed or indexed rates and fixed terms, such as guaranteed investmentcontracts and funding agreements, and deferred and immediate annuities, or retirement annuities. In 1999, annuitypremiums and deposits represented approximately 61% of Life and Savings total statutory premiums and deposits.
The Company monitors economic and regulatory developments which have the potential to impact its business.Recently enacted federal legislation will allow for banks and other financial organizations to have greaterparticipation in the securities and insurance businesses. This legislation may present an increased level of competitionfor sales of the Company’s products. Furthermore, the market for deferred annuities and interest-sensitive lifeinsurance is enhanced by the tax incentives available under current law. Any legislative changes which lessen theseincentives are likely to negatively impact the demand for these products.
Additionally, traditional demutualizations of mutual insurance companies and enacted and pending statelegislation to permit mutual insurance companies to convert to a hybrid structure known as a mutual holdingcompany could have a number of significant effects on the Company by (1) increasing industry competition throughconsolidation caused by mergers and acquisitions related to the new corporate form of business; and (2) increasingcompetition in the capital markets.
Allstate, through a variety of companies, is authorized to sell property-liability and life and savings products inall 50 states, the District of Columbia and Puerto Rico. The Company is also authorized to sell certain insuranceproducts in various foreign countries. The top geographic locations for statutory premiums earned by the PP&Csegment were New York, California, Florida, Texas and Pennsylvania for the year ended December 31, 1999. Topgeographic locations for statutory premiums and deposits by the Life and Savings segment were California, Florida,
Notes to Consolidated Financial Statements
A-38

Illinois and Pennsylvania for the year ended December 31, 1999. No other jurisdiction accounted for more than 5%of statutory premiums for PP&C or Life and Savings. Allstate distributes the majority of its PP&C products throughover 15,500 Allstate agents, primarily non-employee exclusive agents, but also utilizes independent agents andspecialized brokers to expand market reach including over 20,000 independent agents appointed to sell auto andhomeowners insurance. Life and Savings distributes its products using Allstate agents, which include life specialistsand financial advisors, as well as banks, independent agents, securities firms and through direct response and worksitemarketing methods. Although the Company currently benefits from agreements with financial services entities whomarket and distribute its products, change in control of these non-affiliated entities with which the Company hasalliances could negatively impact Life and Savings sales.
2. Summary of Significant Accounting Policies
Investments
Fixed income securities include bonds, mortgage-backed and asset-backed securities, and redeemable preferredstocks. All fixed income securities are carried at fair value and may be sold prior to their contractual maturity(‘‘available for sale’’). The difference between amortized cost and fair value, net of deferred income taxes, certainlife and annuity deferred policy acquisition costs, and certain reserves for life contingent contract benefits, is reflectedas a component of Shareholders’ equity. Provisions are recognized for declines in the value of fixed income securitiesthat are other than temporary. Such writedowns are included in Realized capital gains and losses.
Equity securities include common and non-redeemable preferred stocks, and real estate investment trusts whichare carried at fair value. The difference between cost and fair value of equity securities, less deferred income taxes, isreflected as a component of Shareholders’ equity.
Mortgage loans are carried at outstanding principal balance, net of unamortized premium or discount andvaluation allowances. Valuation allowances are established for impaired loans when it is probable that contractualprincipal and interest will not be collected. Valuation allowances for impaired loans reduce the carrying value to thefair value of the collateral or the present value of the loan’s expected future repayment cash flows discounted at theloan’s original effective interest rate. Valuation allowances on loans not considered to be impaired are establishedbased on consideration of the underlying collateral, borrower financial strength, current and expected marketconditions, and other factors.
Short-term investments are carried at cost or amortized cost which approximates fair value, and includescollateral received in connection with securities lending activities. Other investments, which consist primarily ofpolicy loans, are carried at the unpaid principal balances.
Investment income consists primarily of interest and dividends. Interest is recognized on an accrual basis anddividends are recorded at the ex-dividend date. Interest income on mortgage-backed and asset-backed securities isdetermined on the effective yield method, based on estimated principal repayments. Accrual of income is suspendedfor fixed income securities and mortgage loans that are in default or when the receipt of interest payments is indoubt. Realized capital gains and losses are determined on a specific identification basis.
Derivative financial instruments
Derivative financial instruments include swaps, futures, forwards, and options, including caps and floors. Whenderivatives meet specific criteria they may be designated as accounting hedges and accounted for on either a fairvalue, deferral, or accrual basis, depending upon the nature of the hedge strategy, the method used to account for thehedged item and the derivative used. Derivatives that are not designated as accounting hedges are accounted for on afair value basis.
If, subsequent to entering into a hedge transaction, the derivative becomes ineffective (including if the hedgeditem is sold or otherwise extinguished or the occurrence of a hedged anticipatory transaction is no longer probable),the Company terminates the derivative position. Gains and losses on these terminations are reported in realizedcapital gains and losses in the period they occur. The Company may also terminate derivatives as a result of otherevents or circumstances. Gains and losses on these terminations are deferred and amortized over the remaining life ofeither the hedge or the hedged item, whichever is shorter.
A-39

Fair value accounting Under fair value accounting, realized and unrealized gains and losses on derivatives arerecognized in either earnings or Shareholders’ equity when they occur.
The Company accounts for certain of its interest rate swaps, certain equity-indexed options, certain equity-indexed futures, and foreign currency swaps and forwards as hedges on a fair value basis when specific criteria aremet. For swaps or options, the derivative must reduce the primary market risk exposure (e.g., interest rate risk, equityprice risk or foreign currency risk) of the hedged item in conjunction with the specific hedge strategy; be designatedas a hedge at the inception of the transaction; and have a notional amount and term that does not exceed the carryingvalue and expected maturity, respectively, of the hedged item. In addition, options must have a reference index (e.g.,S&P 500) that is the same as, or highly correlated with, the reference index of the hedged item. For futures orforward contracts, the derivative must reduce the primary market risk exposure on an enterprise or transaction basisin conjunction with the hedge strategy; be designated as a hedge at the inception of the transaction; and be highlycorrelated with the fair value of, or interest income or expense associated with, the hedged item at inception andthroughout the hedge period.
For such interest rate swaps, equity-indexed options, foreign currency swaps, and forwards, changes in fair valueare reported net of tax in Shareholders’ equity, exclusive of interest accruals. Changes in fair value of certain equity-indexed options and certain equity-indexed futures are reflected as an adjustment of the hedged item. Accrued interestreceivable and payable on swaps are reported in Net investment income. Premiums paid for certain equity-indexedoptions are reported as Equity securities and amortized to Net investment income over the lives of the agreements.
The Company also has certain derivatives that are used for risk management purposes for which hedgeaccounting is not applied and are therefore accounted for on a fair value basis. These derivatives primarily consist ofequity-indexed instruments and certain interest rate futures. Based upon certain interest rate or equity price riskreduction strategies, gains and losses on these derivatives are recognized in Net investment income, Realized capitalgains and losses or Life and annuity contract benefits during the period on a current basis.
Deferral Accounting Under deferral accounting, gains and losses on derivatives are deferred and recognized inearnings in conjunction with earnings on the hedged item. The Company accounts for interest rate futures and certainforeign currency forwards as hedges using deferral accounting for anticipatory investment purchases, sales and capitalinfusions, when the criteria for futures and forwards (discussed above) are met. In addition, anticipated transactionsmust be probable of occurrence and their significant terms and characteristics identified.
Changes in fair values of these derivatives are initially deferred and reported as Other liabilities and accruedexpenses. Once the anticipated transaction occurs, the deferred gains or losses are considered part of the cost basis ofthe asset and reported net of tax in Shareholders’ equity or recognized as a gain or loss from disposition of the asset,as appropriate. The Company reports initial margin deposits on futures in Short-term investments. Fees andcommissions paid on these derivatives are also deferred as an adjustment to the carrying value of the hedged item.
Accrual Accounting Under accrual accounting, interest income or expense related to the derivative is accruedand recorded as an adjustment to the interest income or expense on the hedged item. The Company accounts forcertain interest rate swaps, caps and floors, and certain foreign currency swaps as hedges on an accrual basis whenthe criteria for swaps or options (discussed above) are met.
Premiums paid for interest rate caps and floors are reported as investments and amortized to Net investmentincome over the lives of the agreements.
Recognition of premium revenues and contract charges
Property-liability premiums are deferred and earned on a pro rata basis over the terms of the policies. Theportion of premiums written applicable to the unexpired terms of the policies is recorded as Unearned premiums.Premiums for traditional life insurance and certain life-contingent annuities are recognized as revenue when due.Revenues on interest-sensitive life contracts consist of fees assessed against the contractholder account balance forcost of insurance (mortality risk), contract administration and surrender charges. Revenues on investment contractsinclude contract charges and fees for contract administration and surrenders. These revenues are recognized whenlevied against the contract balance. Gross premium in excess of the net premium on limited payment contracts aredeferred and recognized over the contract period.
Notes to Consolidated Financial Statements—(Continued)
A-40

Deferred policy acquisition costs
Certain costs which vary with and are primarily related to acquiring property-liability insurance business,principally agents’ remuneration, premium taxes and inspection costs, are deferred and amortized to income aspremiums are earned. Future investment income is considered in determining the recoverability of deferred policyacquisition costs.
Certain costs which vary with and are primarily related to acquiring life and savings business, principallyagents’ remuneration, premium taxes, certain underwriting costs and direct mail solicitation expenses, are deferredand amortized to income. For traditional life insurance and limited payment contracts, these costs are amortized inproportion to the estimated revenues on such business. For interest sensitive life and investment contracts, the costsare amortized in relation to the present value of estimated gross profits on such business over the estimated lives ofthe contract periods. Changes in the amount or timing of estimated gross profits will result in adjustments in thecumulative amortization of these costs. To the extent that unrealized gains or losses on fixed income securitiescarried at fair value would result in an adjustment of deferred policy acquisition costs had those gains or lossesactually been realized, the related unamortized deferred policy acquisition costs are recorded as a reduction of theunrealized gains or losses included in Shareholders’ equity.
The fair value of acquired life and savings blocks of business, representing the present value of future profitsfrom such blocks of business, is also classified as deferred policy acquisition costs. Present value of future profits isamortized over the life of the blocks of business using current crediting rates. To the extent that unrealized gains orlosses on securities carried at fair value would result in an adjustment of present value of future profits had thosegains or losses actually been realized, the related unamortized present value of future profits are recorded as areduction of the unrealized gains or losses included in Shareholders’ equity.
Reinsurance recoverable
In the normal course of business, the Company seeks to limit aggregate and single exposure to losses on largerisks by purchasing reinsurance from other insurers (see Note 9). The amounts reported in the Consolidatedstatements of financial position include amounts billed to reinsurers on losses paid as well as estimates of amountsexpected to be recovered from reinsurers on incurred losses that have not yet been paid. Reinsurance recoverables onunpaid losses are estimated based upon assumptions consistent with those used in establishing the liabilities related tothe underlying reinsured contract. Insurance liabilities are reported gross of reinsurance recoverables. Prepaidreinsurance premiums are deferred and reflected in income in a manner consistent with the recognition of premiumson the reinsured contracts. Reinsurance does not extinguish the Company’s primary liability under the policieswritten and therefore reinsurers and amounts recoverable therefrom are regularly evaluated by the Company andallowances for uncollectible reinsurance are established as appropriate.
Goodwill
Goodwill represents the excess of amounts paid for acquiring businesses over the fair value of the net assetsacquired. The Company amortizes goodwill using a straight-line method over the period in which the expectedbenefits from an acquisition will be realized, generally 20 to 30 years. The Company reviews goodwill forimpairment whenever events or changes in circumstances indicate that the carrying amounts may not be recoverable.Goodwill is classified in Other assets in the Consolidated statements of financial position.
Property and equipment
Property and equipment is carried at cost less accumulated depreciation. In 1998, the Company begancapitalizing costs related to computer software developed for internal use during the application development stage ofsoftware development projects. These costs generally consist of certain external, payroll and payroll related costs.Depreciation is provided on the straight-line method over the estimated useful lives of the assets, generally 3 to 10years for equipment and 40 years for real property. Accumulated depreciation on property and equipment was $1.25billion and $1.17 billion at December 31, 1999 and 1998, respectively. Depreciation expense on property andequipment was $167 million, $154 million and $123 million for the years ended December 31, 1999, 1998 and 1997,respectively. The Company reviews its property and equipment for impairment whenever events or changes incircumstances indicate that the carrying amount may not be recoverable.
A-41

Income taxes
The income tax provision is calculated under the liability method. Deferred tax assets and liabilities are recordedbased on the difference between the financial statement and tax bases of assets and liabilities at the enacted tax rates.The principal assets and liabilities giving rise to such differences are insurance reserves, unearned premiums, deferredpolicy acquisition costs, and property and equipment. Deferred income taxes also arise from unrealized capital gainsand losses on equity securities and fixed income securities carried at fair value, and unrealized foreign currencytranslation adjustments.
Separate Accounts
The Company issues deferred variable annuities, variable life contracts and certain guaranteed investmentcontracts, the assets and liabilities of which are legally segregated and recorded as assets and liabilities of theSeparate Accounts. Absent any guarantees wherein the Company contractually guarantees either a minimum return oraccount value to the beneficiaries of the contractholders in the form of a death benefit, variable annuity and variablelife contractholders bear the investment risk that the Separate Accounts’ funds may not meet their stated investmentobjectives.
The assets of the Separate Accounts are carried at fair value. Separate Account liabilities represent thecontractholders’ claim to the related assets and are carried at the fair value of the assets. In the event that the assetvalue of certain contractholder accounts is projected to be below the value guaranteed by the Company, a liability isestablished through a charge to earnings. Investment income and realized capital gains and losses of the SeparateAccounts accrue directly to the contractholders and therefore, are not included in the Company’s Consolidatedstatements of operations. Revenues to the Company from the Separate Accounts consist of contract maintenance andadministration fees, and mortality, surrender and expense risk charges.
Reserves for claims and claims expense and life-contingent contract benefits
The property-liability reserve for claims and claims expense is the estimated amount necessary to settle bothreported and unreported claims of insured property-liability losses, based upon the facts in each case and theCompany’s experience with similar cases. Estimated amounts of salvage and subrogation are deducted from thereserve for claims and claims expense. The establishment of appropriate reserves, including reserves for catastrophes,is an inherently uncertain process. Reserve estimates are regularly reviewed and updated, using the most currentinformation available. Any resulting adjustments are reflected in current operations (see Note 7). These adjustmentsmay be material.
The reserve for life-contingent contract benefits, which relates to traditional life insurance, group retirementannuities and immediate annuities with life contingencies is computed on the basis of assumptions as to futureinvestment yields, mortality, morbidity, terminations and expenses. These assumptions, which for traditional lifeinsurance are applied using the net level premium method, include provisions for adverse deviation and generallyvary by such characteristics as type of coverage, year of issue and policy duration. Detailed reserve assumptions andreserve interest rates for Life and Savings products are outlined in Note 8. To the extent that unrealized gains onfixed income securities would result in a premium deficiency had those gains actually been realized, the relatedincrease in reserves is recorded as a reduction of the unrealized gains included in Shareholders’ equity.
Contractholder funds
Contractholder funds arise from the issuance of individual or group policies and contracts that include aninvestment component, including most fixed annuities, interest-sensitive life policies and certain other investmentcontracts. Deposits received are recorded as interest-bearing liabilities. Contractholder funds are equal to depositsreceived net of commissions and interest credited to the benefit of the contractholder less withdrawals, mortalitycharges and administrative expenses. Detailed information on crediting rates and surrender and withdrawal protectionon contractholder funds are outlined in Note 8.
Off-balance-sheet financial instruments
Commitments to invest, commitments to extend mortgage loans and financial guarantees have only off-balance-sheet risk because their contractual amounts are not recorded in the Company’s Consolidated statements of financialposition. The contractual amounts and fair values of these instruments are presented in Note 6.
Notes to Consolidated Financial Statements—(Continued)
A-42

Foreign currency translation
The Company has subsidiaries in foreign countries where the local currency is deemed to be the functionalcurrency in which these entities operate. The financial statements of the Company’s foreign subsidiaries are translatedinto U.S. dollars at the exchange rate in effect at the end of a reporting period for assets and liabilities and at averageexchange rates during the period for results of operations. The unrealized gains or losses from the translation of thenet assets are recorded as unrealized foreign currency translation adjustments, and included in Accumulated othercomprehensive income in the Consolidated statements of financial position. Changes in unrealized foreign currencytranslation adjustments are included in Other comprehensive income. Gains and losses from foreign currencytransactions are reported in Operating costs and expenses and have not been significant.
Use of estimates
The preparation of financial statements in conformity with generally accepted accounting principles requiresmanagement to make estimates and assumptions that affect the amounts reported in the financial statements andaccompanying notes. Actual results could differ from those estimates.
Earnings per share
Basic earnings per share is computed based on the weighted average number of common shares outstanding.Diluted earnings per share is computed based on the weighted average number of common and dilutive potentialcommon shares outstanding. For Allstate, dilutive potential common shares consist of outstanding stock options andshares issuable under its mandatorily redeemable preferred securities (see Note 10). Earnings per share and weightedaverage shares for 1997 have been retroactively adjusted to reflect a two-for-one stock split paid on July 1, 1998. Thecomputation of basic and diluted earnings per share for the years ended December 31 are presented in the followingtable.
(in millions, except per share data) 1999 1998 1997
Numerator:Net income applicable to common shareholders $2,720 $3,294 $3,105
Denominator:Weighted average common shares outstanding 800.2 832.2 867.9Effect of potential dilutive securities:
Stock options 3.0 4.4 4.9Shares issuable under FELINE PRIDES contract(1) .6 – –
3.6 4.4 4.9
Weighted average common and dilutive potential common sharesoutstanding 803.8 836.6 872.8
Earnings per share:Basic $ 3.40 $ 3.96 $ 3.58Diluted 3.38 3.94 3.56
(1) See Note 10.
Options to purchase 11.1 million Allstate common shares, with exercise prices ranging from $34.38 to $50.72,were outstanding at December 31, 1999 but were not included in the computation of diluted earnings per share sinceinclusion of those options would have an anti-dilutive effect as the options’ exercise prices exceed the averagemarket price of Allstate common shares in 1999. Outstanding options excluded from diluted earnings per sharecomputations due to anti-dilutive effects at December 31, 1998 and 1997 were insignificant.
New accounting standards
In 1999, the Company adopted Statement of Position (‘‘SOP’’) 97-3, ‘‘Accounting by Insurance and OtherEnterprises for Insurance-related Assessments.’’ The SOP provides guidance concerning when to recognize a liabilityfor insurance-related assessments and how those liabilities should be measured. Specifically, insurance-relatedassessments should be recognized as liabilities when all of the following criteria have been met: 1) an assessment has
A-43

been imposed or it is probable that an assessment will be imposed, 2) the event obligating an entity to pay anassessment has occurred and 3) the amount of the assessment can be reasonably estimated. Adoption of thisstatement was not material to the Company’s results of operations or financial position.
Pending accounting standards
In June 1999, the Financial Accounting Standards Board (‘‘FASB’’) delayed the effective date of Statement ofFinancial Accounting Standard (‘‘SFAS’’) No. 133, ‘‘Accounting for Derivative Instruments and HedgingActivities.’’ SFAS No. 133 replaces existing pronouncements and practices with a single, integrated accountingframework for derivatives and hedging activities. This statement requires that all derivatives be recognized on thebalance sheet at fair value. Derivatives that are not hedges must be adjusted to fair value through income. If thederivative is a hedge, depending on the nature of the hedge, changes in the fair value of derivatives will either beoffset against the change in fair value of the hedged assets, liabilities, or firm commitments through earnings orrecognized in other comprehensive income until the hedged item is recognized in earnings. Additionally, the changein fair value of a derivative which is not effective as a hedge will be immediately recognized in earnings. The delaywas effected through the issuance of SFAS No. 137, which extends the SFAS No. 133 requirements to fiscal yearsbeginning after June 15, 2000. As such, the Company expects to adopt the provisions of SFAS No. 133 as of January1, 2001. The impact of this statement is dependent upon the Company’s derivative positions and market conditionsexisting at the date of adoption. Based on existing interpretations of the requirements of SFAS No. 133, the impact ofadoption is not expected to be material to the results of operations or financial position of the Company.
3. Acquisitions and Dispositions
Acquisition of CNA personal lines
On October 1, 1999, Allstate completed the acquisition of the personal lines auto and homeowners insurancebusiness (‘‘CNA personal lines’’) of CNA Financial Corporation (‘‘CNA’’). At closing, AIC made a cash payment of$140 million to CNA for: i) certain assets of CNA personal lines used in connection with that business; ii) access tothe CNA personal lines agency distribution channel; iii) infrastructure and employees of the business; iv) renewalrights to the in-force business; and v) an option to acquire certain licensed companies of CNA in the future. Theacquisition was also in part effected through a 100% indemnity reinsurance agreement, whereby CNA provided cashand other assets equal to the reserves and other liabilities associated with CNA personal lines as of the closing date.The transaction was accounted for as a purchase and the excess of the acquisition cost over the fair value of the CNApersonal lines net assets acquired of $218 million was recorded as goodwill and will be amortized on a straight-linebasis over twenty years. The results of CNA personal lines were included in the Company’s consolidated results fromthe October 1, 1999 acquisition date. AIC also will pay a license fee to CNA for the use of certain of CNA’strademarks and access to the CNA personal lines distribution channel for a period of up to six years that is contingentupon the amount of premiums written by independent agents appointed by CNA personal lines prior to theacquisition date. These license fees will be expensed as incurred. At closing, Allstate also issued a $75 million,10-year note to CNA (see Note 10), the principal repayment of which at maturity is contingent upon certainprofitability measures of the acquired business.
In the fourth quarter of 1999, the Company conducted a review of the statement of financial position of theacquired CNA personal lines business, which included assessing the appropriateness of the carrying value of certainnon-financial assets and liabilities and asset allowances based on the application of Allstate’s accounting policies andestimation techniques. Based on information developed from this post-closing review, Allstate recorded a $58 millionpretax charge ($37 million after-tax) relating to different estimates of loss and loss expense reserves and assetvaluation allowances. The pretax charge is reflected in the Consolidated statement of operations in Property-liabilityinsurance claims and claims expense ($47 million) and Operating costs and expenses ($11 million).
Acquisition of AHL
Effective October 31, 1999, Allstate acquired all of the outstanding shares of American Heritage Life InvestmentCorporation (‘‘AHL’’) pursuant to a merger agreement for $32.25 per share in cash and Allstate common stock, in atransaction valued at $1.1 billion. AHL specializes in selling life, health and disability insurance to individuals
Notes to Consolidated Financial Statements—(Continued)
A-44

through their workplaces. In connection with the acquisition, Allstate assumed AHL’s obligations under theoutstanding mandatorily redeemable preferred securities issued by AHL and AHL Financing (the ‘‘Trust’’), aDelaware statutory business trust (see Note 10). In order to fund the equity component of the consideration, theCompany reissued 34.1 million shares of Allstate common stock held in treasury to AHL shareholders. Theremaining $87 million of consideration was funded with cash. The transaction was accounted for as a purchase andthe excess of the acquisition cost over the fair value of AHL’s net assets acquired of $838 million was recorded asgoodwill and will be amortized on a straight-line basis over thirty years. The results of AHL were included in theCompany’s consolidated results from the October 31, 1999 acquisition date.
In the fourth quarter of 1999, the Company conducted a review of the statement of financial position of AHL,which included assessing the appropriateness of the carrying value of certain non-financial assets and liabilities andasset allowances based on the application of Allstate’s accounting policies and estimation techniques. Based oninformation developed from this post-closing review, Allstate recorded a $32 million pretax charge ($26 millionafter-tax) relating to different estimates of loss reserves and asset valuation allowances. The pretax charge is reflectedin the Consolidated statement of operations in Life and annuity premiums and contract charges ($3 million), Life andannuity contract benefits ($26 million) and Operating costs and expenses ($3 million).
Other acquisitions and dispositions
In 1998, the Company acquired all of the outstanding common stock of Pembridge Inc. for approximately $275million. Pembridge primarily sells non-standard auto insurance in Canada.
In 1998, the Company disposed of its remaining interest in The PMI Group, Inc. (‘‘PMI Group’’) through theconversion of $357 million of 6.76% Automatically Convertible Equity Securities (‘‘ACES’’) into approximately 8.6million shares of PMI Group and through additional sales on the open market. A gain of $87 million ($56 millionafter-tax) was recognized on the conversion.
In 1997, the Company sold its ownership interests in two Japanese joint ventures to The Saison Group, its jointventure partner. Allstate received gross proceeds of $105 million and recognized a gain of $70 million ($48 millionafter-tax) on the sale.
4. Supplemental Disclosure of Non-Cash Flow Information
Acquisitions and dispositions
In 1999, Allstate acquired the assets of CNA personal lines, AHL and other businesses using cash and commonstock and by assuming liabilities and mandatorily redeemable preferred securities. In 1998, the Company disposed ofits remaining interest in PMI Group through the conversion of the ACES (see Note 3). The following is a summaryof the effects of these transactions on Allstate’s consolidated financial position.
($ in millions) 1999
Acquisitions:Fair value of assets acquired $ 6,201Fair value of liabilities assumed (4,904)Fair value of mandatorily redeemable preferred securities (214)Common shares issued (817)
Cash paid 266Cash received (1,237)
Net cash received $ 971
1998
Dispositions:Conversion of ACES to common shares of The PMI Group Inc. $ 357
A-45

5. Investments
Fair values
The amortized cost, gross unrealized gains and losses, and fair value for fixed income securities are as follows:
Gross Unrealized
($ in millions)
Amortizedcost Gains Losses
Fairvalue
At December 31, 1999U.S. government and agencies $ 3,075 $ 229 $ (31) $ 3,273Municipal 19,071 450 (549) 18,972Corporate 20,229 557 (556) 20,230Foreign government 741 16 (25) 732Mortgage-backed securities 7,974 89 (177) 7,886Asset-backed securities 3,941 8 (54) 3,895Redeemable preferred stock 262 42 (6) 298
Total fixed income securities $55,293 $1,391 $(1,398) $55,286
At December 31, 1998U.S. government and agencies $ 3,171 $ 794 $ (5) $ 3,960Municipal 17,589 1,198 (16) 18,771Corporate 16,508 1,387 (116) 17,779Foreign government 625 35 (7) 653Mortgage-backed securities 7,612 270 (3) 7,879Asset-backed securities 4,197 64 (10) 4,251Redeemable preferred stock 244 23 – 267
Total fixed income securities $49,946 $3,771 $ (157) $53,560
Scheduled maturities
The scheduled maturities for fixed income securities are as follows at December 31, 1999:
($ in millions)
Amortizedcost
Fairvalue
Due in one year or less $ 1,369 $ 1,372Due after one year through five years 9,025 9,101Due after five years through ten years 11,935 11,744Due after ten years 21,049 21,288
43,378 43,505Mortgage- and asset-backed securities 11,915 11,781
Total $55,293 $55,286
Actual maturities may differ from those scheduled as a result of prepayments by the issuers.
Net investment income
Year ended December 31, 1999 1998 1997
($ in millions)
Fixed income securities $3,569 $3,458 $3,455Equity securities 207 160 142Mortgage loans 291 261 270Other 142 109 70
Investment income, before expense 4,209 3,988 3,937Investment expense 97 98 76
Net investment income $4,112 $3,890 $3,861
Notes to Consolidated Financial Statements—(Continued)
A-46

Realized capital gains and losses
Year ended December 31, 1999 1998 1997
($ in millions)
Fixed income securities $ (76) $ 258 $195Equity securities 1,005 640 794Other investments 183 265 (7)
Realized capital gains and losses 1,112 1,163 982Income taxes 397 422 344
Realized capital gains and losses, after-tax $ 715 $ 741 $638
Excluding calls and prepayments, gross gains of $389 million, $277 million and $250 million and gross lossesof $383 million, $95 million and $153 million were realized on sales of fixed income securities during 1999, 1998and 1997, respectively.
Unrealized net capital gains
Unrealized net capital gains on fixed income and equity securities included in shareholders’ equity at December31, 1999 are as follows:
Cost/ Gross unrealized Unrealized
($ in millions) amortized costFairvalue Gains Losses net gains
Fixed income securities $55,293 $55,286 $1,391 $(1,398) $ (7)Equity securities 4,565 6,738 2,333 (160) 2,173
Total $59,858 $62,024 $3,724 $(1,558) 2,166
Deferred income taxes, deferred policyacquisition costs and other (797)
Unrealized net capital gains $1,369
At December 31, 1998, equity securities had gross unrealized gains of $2.3 billion and gross unrealized losses of$109 million.
Change in unrealized net capital gains
Year ended December 31, 1999 1998 1997
($ in millions)
Fixed income securities $(3,621) $ 442 $1,134Equity securities (17) 39 589
Total (3,638) 481 1,723Deferred income taxes, deferred policy acquisition costs and other 2,013 (308) (905)
Increase (decrease) in unrealized net capital gains $(1,625) $ 173 $ 818
Investment loss provisions and valuation allowances
Pretax provisions for investment losses, principally relating to other than temporary declines in value of fixedincome securities and equity securities, and valuation allowances on mortgage loans were $72 million, $105 millionand $80 million in 1999, 1998 and 1997, respectively.
Mortgage loan impairment
A mortgage loan is impaired when it is probable that the Company will be unable to collect all amounts dueaccording to the contractual terms of the loan agreement.
A-47

The components of impaired loans at December 31 are as follows:
($ in millions) 1999 1998
Impaired loansWith valuation allowances $25 $35Less: valuation allowances (7) (9)Without valuation allowances 11 36
Net carrying value of impaired loans $29 $62
The net carrying value of impaired loans at December 31, 1999 and 1998 comprised $22 million and$60 million, respectively, measured at the fair value of the collateral, and $7 million and $2 million, respectively,measured at the present value of the loan’s expected future cash flows discounted at the loan’s effective interest rate.Impaired loans without valuation allowances include collateral dependent loans where the fair value of the collateralis greater than the recorded investment in the loans.
Interest income is recognized on a cash basis for impaired loans carried at the fair value of the collateral,beginning at the time of impairment. For other impaired loans, interest is accrued based on the net carrying value.The Company recognized interest income of $2 million, $5 million and $8 million on impaired loans during 1999,1998 and 1997, respectively, of which $2 million, $5 million and $7 million was received in cash during 1999, 1998and 1997, respectively. The average balance of impaired loans was $43 million, $53 million and $103 million during1999, 1998 and 1997, respectively.
Valuation allowances for mortgage loans at December 31, 1999, 1998 and 1997, were $14 million, $15 millionand $32 million, respectively. For the years ended December 31, 1999, 1998 and 1997, direct write-downs ofmortgage loan valuation allowances against mortgage loan gross carrying amounts were $0, $1 million and $8million, respectively. For the years ended December 31, 1999, 1998 and 1997, net reductions to mortgage loanvaluation allowances, which are reported in Realized capital gains and losses, were $1 million, $16 million and $25million, respectively.
Investment concentration for municipal bond and commercial mortgage portfolios and other investmentinformation
The Company maintains a diversified portfolio of municipal bonds. The largest concentrations in the portfolioare presented below. Except for the following, holdings in no other state exceeded 5% of the portfolio at December31, 1999:
(% of municipal bond portfolio carrying value) 1999 1998
Texas 14.0% 12.7%Illinois 10.7 11.1New York 10.1 10.0Pennsylvania 5.6 6.3California 5.0 5.4
The Company’s mortgage loans are collateralized by a variety of commercial real estate property types locatedthroughout the United States. Substantially all of the commercial mortgage loans are non-recourse to the borrower.The states with the largest portion of the commercial mortgage loan portfolio are listed below. Except for thefollowing, holdings in no other state exceeded 5% of the portfolio at December 31, 1999:
(% of commercial mortgage portfolio carrying value) 1999 1998
California 19.6% 22.7%Florida 9.2 5.5Illinois 7.7 8.1New York 7.0 8.7Texas 5.9 5.1New Jersey 5.4 3.9
Notes to Consolidated Financial Statements—(Continued)
A-48

The types of properties collateralizing the commercial mortgage loans at December 31, are as follows:
(% of commercial mortgage portfolio carrying value) 1999 1998
Office buildings 33.0% 28.6%Retail 26.9 29.7Apartment complex 16.7 16.9Warehouse 16.0 16.4Industrial 2.2 2.5Other 5.2 5.9
100.0% 100.0%
The contractual maturities of the commercial mortgage loan portfolio as of December 31, 1999, for loans thatwere not in foreclosure are as follows:
($ in millions)
Numberof loans
Carryingvalue Percent
2000 42 $ 257 6.4%2001 53 259 6.42002 65 279 6.92003 74 309 7.62004 59 299 7.4Thereafter 634 2,643 65.3
Total 927 $4,046 100.0%
In 1999, $208 million of commercial mortgage loans were contractually due. Of these, 81.8% were paid as due,14.5% were refinanced at prevailing market terms, 1.5% were foreclosed or are in the process of foreclosure, and2.2% were in the process of refinancing or restructuring discussions.
At December 31, 1999, the carrying value of investments, excluding equity securities, that were non-incomeproducing during 1999 was $4 million.
At December 31, 1999, fixed income securities with a carrying value of $280 million were on deposit withregulatory authorities as required by law.
6. Financial Instruments
In the normal course of business, the Company invests in various financial assets, incurs various financialliabilities and enters into agreements involving derivative financial instruments and other off-balance-sheet financialinstruments. The fair value estimates of financial instruments presented below are not necessarily indicative of theamounts the Company might pay or receive in actual market transactions. Potential taxes and other transaction costshave not been considered in estimating fair value. The disclosures that follow do not reflect the fair value of theCompany as a whole since a number of the Company’s significant assets (including deferred policy acquisition costs,property and equipment and reinsurance recoverables) and liabilities (including property-liability, traditional life andinterest sensitive life insurance reserves, and deferred income taxes) are not considered financial instruments and arenot carried at fair value. Other assets and liabilities considered financial instruments such as premium installmentreceivables, accrued investment income, cash and claim payments outstanding are generally of a short-term nature.Their carrying values are deemed to approximate fair value.
A-49

Financial assets
The carrying value and fair value of financial assets at December 31, are as follows:
1999 1998
Carryingvalue
Fairvalue
Carryingvalue
Fairvalue
($ in millions)
Fixed income securities $55,286 $55,286 $53,560 $53,560Equity securities 6,738 6,738 6,421 6,421Mortgage loans 4,068 3,973 3,458 3,664Short-term investments 2,422 2,422 2,477 2,477Policy loans 1,090 1,090 569 569Separate Accounts 13,857 13,857 10,098 10,098
Carrying value and fair value includes the effects of derivative financial instruments where applicable.
Fair values for fixed income securities are based on quoted market prices where available. Non-quoted securitiesare valued based on discounted cash flows using current interest rates for similar securities. Equity securities arevalued based principally on quoted market prices. Mortgage loans are valued based on discounted contractual cashflows. Discount rates are selected using current rates at which similar loans would be made to borrowers with similarcharacteristics, using similar properties as collateral. Loans that exceed 100% loan-to-value are valued at theestimated fair value of the underlying collateral. Short-term investments are highly liquid investments with maturitiesof less than one year whose carrying value are deemed to approximate fair value.
The carrying value of policy loans are deemed to approximate fair value. Separate Accounts assets are carried inthe Consolidated statements of financial position at fair value based on quoted market prices.
Financial liabilities and trust preferred securities
The carrying value and fair value of financial liabilities and trust preferred securities at December 31, are asfollows:
1999 1998
Carryingvalue
Fairvalue
Carryingvalue
Fairvalue
($ in millions)
Contractholder funds on investment contracts $19,790 $19,122 $16,757 $16,509Short-term debt 665 665 393 393Long-term debt 2,186 2,045 1,353 1,417Separate Accounts 13,857 13,857 10,098 10,098Mandatorily redeemable preferred securities of
subsidiary trusts 964 852 750 795
The fair value of contractholder funds on investment contracts is based on the terms of the underlying contracts.Reserves on investment contracts with no stated maturities (single premium and flexible premium deferred annuities)are valued at the account balance less surrender charges. The fair value of immediate annuities and annuities withoutlife contingencies with fixed terms is estimated using discounted cash flow calculations based on interest ratescurrently offered for contracts with similar terms and durations. Short-term debt is valued at carrying value due to itsshort-term nature. The fair value of long-term debt and trust preferred securities is based on quoted market prices orin certain cases, determined using discounted cash flow calculations based on interest rates of comparableinstruments. Separate Accounts liabilities are carried at the fair value of the underlying assets.
Derivative financial instruments
Derivative financial instruments include swaps, futures, forwards and options, including caps and floors. TheCompany primarily uses derivative financial instruments to reduce its exposure to market risk (principally interestrate, equity price and foreign currency risk) and in conjunction with asset/liability management, in its Life andSavings segment. The Company does not hold or issue these instruments for trading purposes.
Notes to Consolidated Financial Statements—(Continued)
A-50
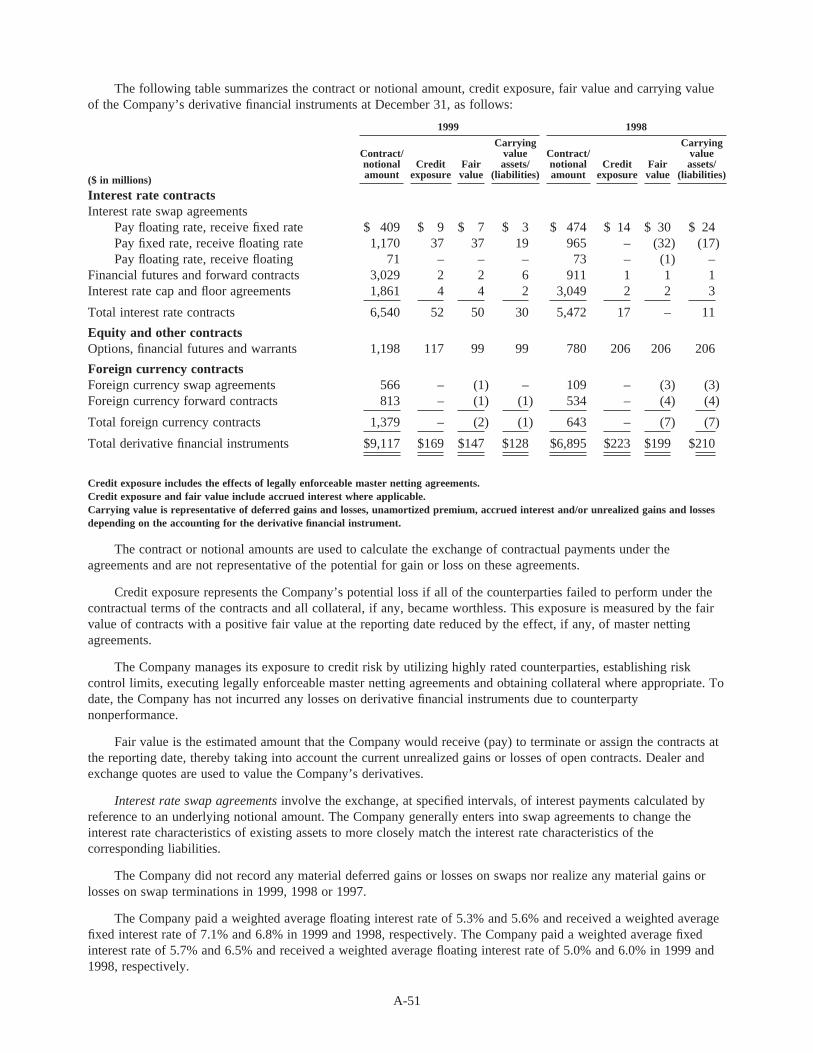
The following table summarizes the contract or notional amount, credit exposure, fair value and carrying valueof the Company’s derivative financial instruments at December 31, as follows:
1999 1998
($ in millions)
Contract/notionalamount
Creditexposure
Fairvalue
Carryingvalueassets/
(liabilities)
Contract/notionalamount
Creditexposure
Fairvalue
Carryingvalueassets/
(liabilities)
Interest rate contractsInterest rate swap agreements
Pay floating rate, receive fixed rate $ 409 $ 9 $ 7 $ 3 $ 474 $ 14 $ 30 $ 24Pay fixed rate, receive floating rate 1,170 37 37 19 965 – (32) (17)Pay floating rate, receive floating 71 – – – 73 – (1) –
Financial futures and forward contracts 3,029 2 2 6 911 1 1 1Interest rate cap and floor agreements 1,861 4 4 2 3,049 2 2 3
Total interest rate contracts 6,540 52 50 30 5,472 17 – 11
Equity and other contractsOptions, financial futures and warrants 1,198 117 99 99 780 206 206 206
Foreign currency contractsForeign currency swap agreements 566 – (1) – 109 – (3) (3)Foreign currency forward contracts 813 – (1) (1) 534 – (4) (4)
Total foreign currency contracts 1,379 – (2) (1) 643 – (7) (7)
Total derivative financial instruments $9,117 $169 $147 $128 $6,895 $223 $199 $210
Credit exposure includes the effects of legally enforceable master netting agreements.Credit exposure and fair value include accrued interest where applicable.Carrying value is representative of deferred gains and losses, unamortized premium, accrued interest and/or unrealized gains and lossesdepending on the accounting for the derivative financial instrument.
The contract or notional amounts are used to calculate the exchange of contractual payments under theagreements and are not representative of the potential for gain or loss on these agreements.
Credit exposure represents the Company’s potential loss if all of the counterparties failed to perform under thecontractual terms of the contracts and all collateral, if any, became worthless. This exposure is measured by the fairvalue of contracts with a positive fair value at the reporting date reduced by the effect, if any, of master nettingagreements.
The Company manages its exposure to credit risk by utilizing highly rated counterparties, establishing riskcontrol limits, executing legally enforceable master netting agreements and obtaining collateral where appropriate. Todate, the Company has not incurred any losses on derivative financial instruments due to counterpartynonperformance.
Fair value is the estimated amount that the Company would receive (pay) to terminate or assign the contracts atthe reporting date, thereby taking into account the current unrealized gains or losses of open contracts. Dealer andexchange quotes are used to value the Company’s derivatives.
Interest rate swap agreements involve the exchange, at specified intervals, of interest payments calculated byreference to an underlying notional amount. The Company generally enters into swap agreements to change theinterest rate characteristics of existing assets to more closely match the interest rate characteristics of thecorresponding liabilities.
The Company did not record any material deferred gains or losses on swaps nor realize any material gains orlosses on swap terminations in 1999, 1998 or 1997.
The Company paid a weighted average floating interest rate of 5.3% and 5.6% and received a weighted averagefixed interest rate of 7.1% and 6.8% in 1999 and 1998, respectively. The Company paid a weighted average fixedinterest rate of 5.7% and 6.5% and received a weighted average floating interest rate of 5.0% and 6.0% in 1999 and1998, respectively.
A-51

Financial futures and forward contracts are commitments to either purchase or sell designated financialinstruments at a future date for a specified price or yield. They may be settled in cash or through delivery. As part ofits asset/liability management, the Company generally utilizes futures and forward contracts to manage its market riskrelated to fixed income securities, equity securities, certain annuity contracts and anticipatory investment purchasesand sales. Futures and forwards used as hedges of anticipatory transactions pertain to identified transactions whichare probable to occur and are generally completed within 90 days. Futures contracts have limited off-balance-sheetcredit risk as they are executed on organized exchanges and require security deposits, as well as the daily cashsettlement of margins.
Interest rate cap and floor agreements give the holder the right to receive at a future date, the amount, if any, bywhich a specified market interest rate exceeds the fixed cap rate or falls below the fixed floor rate, applied to anotional amount. The Company purchases interest rate cap and floor agreements to reduce its exposure to rising orfalling interest rates relative to certain existing assets and liabilities in conjunction with asset/liability management.
Equity-indexed option contracts and equity-indexed financial futures provide returns based on a specified equityindex applied to the instrument’s notional amount. The Company utilizes these instruments to achieve equityappreciation, to reduce the market risk associated with certain annuity contracts and for other risk managementpurposes. Where required, counterparties post collateral to minimize credit risk.
Debt warrants provide the right to purchase a specified new issue of debt at a predetermined price. TheCompany purchases debt warrants to protect against long-term call risk.
Foreign currency contracts involve the future exchange or delivery of foreign currency on terms negotiated atthe inception of the contract. The Company enters into these agreements primarily to manage the currency riskassociated with investing in securities and issuing obligations which are denominated in foreign currencies.
Market risk is the risk that the Company will incur losses due to adverse changes in market rates and prices.Market risk exists for all of the derivative financial instruments that the Company currently holds, as theseinstruments may become less valuable due to adverse changes in market conditions. The Company mitigates this riskthrough established risk control limits set by senior management. In addition, the change in the value of theCompany’s derivative financial instruments designated as hedges is generally offset by the change in the value of therelated assets and liabilities.
Off-balance-sheet financial instruments
A summary of the contractual amounts and fair values of off-balance-sheet financial instruments at December31, follows:
($ in millions) 1999 1998
Contractualamount
Fairvalue
Contractualamount
Fairvalue
Commitments to invest $316 $ – $353 $ –Commitments to extend mortgage loans 96 1 87 1Financial guarantees 11 1 11 1Credit guarantees 89 – 93 –
Except for credit guarantees, the contractual amounts represent the amount at risk if the contract is fully drawnupon, the counterparty defaults and the value of any underlying security becomes worthless. Unless noted otherwise,the Company does not require collateral or other security to support off-balance-sheet financial instruments withcredit risk.
Commitments to invest generally represent commitments to acquire financial interests or instruments. TheCompany enters into these agreements to allow for additional participation in certain limited partnership investments.Because the equity investments in the limited partnerships are not actively traded, it is not practicable to estimate thefair value of these commitments.
Commitments to extend mortgage loans are agreements to lend to a borrower provided there is no violation ofany condition established in the contract. The Company enters these agreements to commit to future loan fundings at
Notes to Consolidated Financial Statements—(Continued)
A-52

a predetermined interest rate. Commitments generally have fixed expiration dates or other termination clauses.Commitments to extend mortgage loans, which are secured by the underlying properties, are valued based onestimates of fees charged by other institutions to make similar commitments to similar borrowers.
Financial guarantees represent conditional commitments to repurchase notes from a creditor upon default of thedebtor. The Company enters into these agreements primarily to provide financial support for certain equity investees.Financial guarantees are valued based on estimates of payments that may occur over the life of the guarantees.
Credit guarantees written represent conditional commitments to exchange identified AAA or AA rated credit riskfor identified A rated credit risk upon bankruptcy or other event of default of the referenced credits. The Companyreceives fees, which are reported in Net investment income over the lives of the commitments, for assuming thereferenced credit risk. The Company enters into these transactions in order to achieve higher yields than if thereferenced credits were directly owned.
The Company’s maximum amount at risk, assuming bankruptcy or other default of the referenced credits andthe value of the referenced credits becomes worthless, is the fair value of the identified AAA or AA rated securities.The identified AAA or AA rated securities had a fair value of $88 million at December 31, 1999. The Companyincludes the impact of credit guarantees in its analysis of credit risk, and the referenced credits were current withrespect to their contractual terms at December 31, 1999.
7. Reserve for Property-Liability Insurance Claims and Claims Expense
As described in Note 2, the Company establishes reserves for claims and claims expense on reported andunreported claims of insured losses. These reserve estimates are based on known facts and interpretation ofcircumstances, including the Company’s experience with similar cases and historical trends involving claim paymentpatterns, loss payments, pending levels of unpaid claims and product mix, as well as other factors including courtdecisions, economic conditions and public attitudes. The effects of inflation are implicitly considered in the reservingprocess. The Company, in the normal course of business, may also supplement its claims processes by utilizing thirdparty adjusters, appraisers, engineers, inspectors, other professionals and information sources to assess and settlecatastrophe and non-catastrophe claims.
The establishment of appropriate reserves, including reserves for catastrophes, is an inherently uncertain process.Allstate regularly updates its reserve estimates as new facts become known and further events occur which mayimpact the resolution of unsettled claims. Changes in prior year reserve estimates, which may be material, arereflected in the results of operations in the period such changes are determinable.
Activity in the reserve for property-liability insurance claims and claims expense is summarized as follows:
($ in millions) 1999 1998 1997
Balance at January 1 $16,881 $17,403 $17,382Less reinsurance recoverables 1,458 1,630 1,784
Net balance at January 1 15,423 15,773 15,598Acquisitions 1,023 58 –
Adjusted net balance 16,446 15,831 15,598Incurred claims and claims expense related to:
Current year 15,266 14,301 14,013Prior years (587) (700) (677)
Total incurred 14,679 13,601 13,336Claims and claims expense paid related to:
Current year 9,349 8,521 8,148Prior years 5,615 5,488 5,013
Total paid 14,964 14,009 13,161Net balance at December 31 16,161 15,423 15,773
Plus reinsurance recoverables 1,653 1,458 1,630
Balance at December 31 $17,814 $16,881 $17,403
A-53

Incurred claims and claims expense represents the sum of paid losses and reserve changes in the calendar year.This expense includes losses from catastrophes of $816 million, $780 million and $365 million in 1999, 1998 and1997, respectively. A ‘‘catastrophe’’ is defined by Allstate as an event that produces pre-tax losses before reinsurancein excess of $1 million, and involves multiple first party policyholders. Catastrophes are an inherent risk of theproperty-liability insurance business which have contributed, and will continue to contribute, to material year-to-yearfluctuations in the Company’s results of operations and financial position.
The level of catastrophic loss experienced in any year cannot be predicted and could be material to results ofoperations and financial position. For Allstate, areas of potential catastrophe losses due to hurricanes include majormetropolitan centers near the eastern and gulf coasts of the United States. Exposure to potential earthquake losses inCalifornia is limited by the Company’s participation in the California Earthquake Authority (‘‘CEA’’). Other areas inthe United States with exposure to potential earthquake losses include areas surrounding the New Madrid faultsystem in the Midwest and faults in and surrounding Seattle, Washington and Charleston, South Carolina. Allstatecontinues to evaluate alternative business strategies to more effectively manage its exposure to catastrophe losses inthese and other areas.
As part of Allstate’s catastrophe management strategy, the Company purchases reinsurance to limit aggregatelosses from large catastrophic insured events. Effective June 1, 1997, the Company entered into a three-year excessof loss reinsurance contract covering property policies in the northeastern portion of the United States. Thereinsurance program provides up to 95% of $500 million of reinsurance protection for catastrophe losses in excess ofan estimated $750 million retention subject to a limit of $500 million in any one year and an aggregate limit of $1.00billion over the three-year contract period. In addition, the Company has access to reimbursement provided by theFlorida Hurricane Catastrophe Fund (‘‘FHCF’’) for 90% of hurricane losses in Florida in excess of approximately thefirst $255 million for each storm, up to an aggregate of $900 million (90% of approximately $1.00 billion) in a singlehurricane season, and $1.23 billion total reimbursement over all hurricane seasons.
At the closing of Allstate’s October 1, 1999 acquisition of CNA personal lines, Allstate assumed $1.02 billion ofloss reserves (‘‘closing reserves’’), net of reinsurance, on policies written prior to the acquisition date. Concurrentwith the closing, Allstate and CNA entered into a four-year aggregate stop-loss agreement. Pursuant to theagreement, CNA will indemnify Allstate for upward loss development of the closing reserves in an amount equal to80% of the first $40 million of development, and 90% of all losses in excess of $40 million. The agreement expireson October 1, 2003 at which time a final settlement between Allstate and CNA will be made for any closing reservedeficiency (or redundancy) not yet settled. In connection with a review of the statement of financial position of CNApersonal lines (see Note 3), the Company increased the net loss reserves of the CNA personal lines business acquiredby $47 million in the fourth quarter of 1999.
Management believes that the reserve for claims and claims expense, net of reinsurance recoverables, atDecember 31, 1999 is appropriately established in the aggregate and adequate to cover the ultimate net cost ofreported and unreported claims arising from losses which had occurred by that date.
Favorable calendar year reserve development in 1999, 1998 and 1997 was the result of favorable injury severitytrends as compared to the Company’s anticipated trends, in each of the three years. For 1999 and 1998, this favorabledevelopment more than offset adverse development in Discontinued Lines and Coverages (described in Note 17). Thefavorable injury severity trend during this three-year period was largely due to moderate medical cost inflationmitigated by the Company’s loss control programs. The impacts of the moderate medical cost inflation trend haveemerged over time as actual claim settlements validate the effect of the rate of inflation. In addition, while the claimsettlement process changes are believed to have contributed to favorable severity trends on closed claims, thesechanges introduce a greater degree of variability in reserve estimates for the remaining outstanding claims atDecember 31, 1999. Future reserve development releases, if any, are expected to be adversely impacted by expectedincreases in medical cost inflation rates.
Allstate’s exposure to environmental, asbestos and other mass tort claims stem principally from excess andsurplus business written from 1972 through 1985, including substantial excess and surplus general liability coverageson Fortune 500 companies, and reinsurance coverage written during the 1960s through the 1980s, includingreinsurance on primary insurance written on large U.S. companies. Other mass tort exposures primarily relate toproduct liability claims, such as those for medical devices and other products, and general liabilities.
Notes to Consolidated Financial Statements—(Continued)
A-54

In 1986, the general liability policy form used by Allstate and others in the property-liability industry wasamended to introduce an ‘‘absolute pollution exclusion,’’ which excluded coverage for environmental damage claimsand added an asbestos exclusion. Most general liability policies issued prior to 1987 contain annual aggregate limitsfor product liability coverage, and policies issued after 1986 also have an annual aggregate limit on all coverages.Allstate’s experience to date is that these policy form changes have effectively limited its exposure to environmentaland asbestos claim risks.
Establishing net loss reserves for environmental, asbestos and other mass tort claims is subject to uncertaintiesthat are greater than those presented by other types of claims. Among the complications are lack of historical data,long reporting delays, uncertainty as to the number and identity of insureds with potential exposure, unresolved legalissues regarding policy coverage, availability of reinsurance and the extent and timing of any such contractualliability. The legal issues concerning the interpretation of various insurance policy provisions and whether thoselosses are, or were ever intended to be covered, are complex. Courts have reached different and sometimesinconsistent conclusions as to when losses are deemed to have occurred and which policies provide coverage; whattypes of losses are covered; whether there is an insured obligation to defend; how policy limits are determined; howpolicy exclusions are applied and interpreted; and whether clean-up costs represent insured property damage.Management believes these issues are not likely to be resolved in the near future.
In 1999, the Company completed an annual assessment of its environmental, asbestos and other mass tortexposures. This assessment resulted in a strengthening of net asbestos reserves of $346 million, and a $155 millionrelease of net environmental and other reserves. Allstate’s reserves for environmental claims were $506 million and$641 million, net of reinsurance recoverables of $159 million and $199 million at December 31, 1999 and 1998,respectively. Reserves for asbestos claims were $758 million and $459 million, net of reinsurance recoverables of$289 million and $227 million at December 31, 1999 and 1998, respectively. Approximately 59% and 58% of thetotal net environmental and asbestos reserves at December 31, 1999 and 1998, respectively, are for incurred but notreported (‘‘IBNR’’) estimated losses. The survival ratios (ending reserves divided by claims and claims expense paid)for net environmental and asbestos reserves at December 31, 1999 and 1998, were 14.0 and 10.8, respectively. In1999, the survival ratio increased primarily as the result of increased asbestos reserve levels. Management believes itsnet loss reserves for environmental, asbestos and other mass tort claims are appropriately established based onavailable facts, technology, laws and regulations. However, due to the inconsistencies of court coverage decisions,plaintiffs’ expanded theories of liability, the risks inherent in major litigation and other uncertainties, the ultimatecost of these claims may vary materially from the amounts currently recorded, resulting in an increase in the lossreserves. In addition, while the Company believes the improved actuarial techniques and databases have assisted inits ability to estimate environmental, asbestos and other mass tort net loss reserves, these refinements maysubsequently prove to be inadequate indicators of the extent of probable losses. Due to the uncertainties and factorsdescribed above, management believes it is not practicable to develop a meaningful range for any such additional netloss reserves that may be required.
8. Reserve for Life-Contingent Contract Benefits and Contractholder Funds
At December 31, the Reserve for life-contingent contract benefits consists of the following:
($ in millions) 1999 1998
Immediate annuities:Structured settlement annuities $4,254 $4,694Other immediate annuities 1,525 1,669
Traditional life 1,701 1,125Other 117 113
Total life-contingent contract benefits $7,597 $7,601
The assumptions for mortality generally utilized in calculating reserves include, the U.S. population withprojected calendar year improvements and age setbacks for impaired lives for structured settlement annuities; the1983 group annuity mortality table for other immediate annuities; and actual company experience plus loading fortraditional life. Interest rate assumptions vary from 3.5% to 11.7% for immediate annuities and 4.0% to 11.3% fortraditional life. Other estimation methods used include the present value of contractually fixed future benefits forstructured settlement annuities, the present value of expected future benefits based on historical experience for otherimmediate annuities and the net level premium reserve method using the Company’s withdrawal experience rates fortraditional life.
A-55

Premium deficiency reserves are established, if necessary, and have been recorded for certain immediateannuities with life contingencies to the extent the unrealized gains on fixed income securities would result in apremium deficiency had those gains actually been realized. A liability of $65 million and $933 million is included inthe Reserve for life-contingent contract benefits with respect to this deficiency for the years ended December 31,1999 and 1998, respectively. The decrease in this liability in 1999 reflects declines in unrealized capital gains onfixed income securities.
At December 31, Contractholder funds consists of the following:
($ in millions) 1999 1998
Interest-sensitive life $ 5,872 $ 4,395Fixed annuities:
Immediate annuities 1,751 1,641Deferred annuities 13,060 10,874
Guaranteed investment contracts 2,953 3,233Other investment contracts 1,563 990
Total contractholder funds $25,199 $21,133
Contractholder funds are equal to deposits received net of commissions and interest credited to the benefit of thecontractholder less withdrawals, mortality charges and administrative expenses. Interest rates credited range from4.0% to 8.5% for interest-sensitive life contracts; 3.5% to 10.0% for immediate annuities; 1.6% to 26.2% for deferredannuities (which include equity-indexed annuities that are hedged, see Note 2 and Note 6); 4.9% to 9.9% forguaranteed investment contracts and 5.3% to 6.6% for other investment contracts. Withdrawal and surrender chargeprotection includes: i) for interest-sensitive life, either a percentage of account balance or dollar amount grading offgenerally over 20 years; and, ii) for deferred annuities not subject to a market value adjustment, either a declining orlevel percentage charge generally over nine years or less. Approximately 10% of deferred annuities are subject to amarket value adjustment.
9. Reinsurance
The Company purchases reinsurance to limit aggregate and single losses on large risks. The Company continuesto have primary liability as a direct insurer for risks reinsured. The information presented herein should be read inconnection with Note 7. Estimating amounts of reinsurance recoverable is also impacted by many of the uncertaintiesinvolved in the establishment of loss reserves.
The effects of reinsurance on premiums written and earned for the year ended December 31, are as follows:
($ in millions) 1999 1998 1997
Property-liability premiums writtenDirect $20,228 $19,878 $19,075Assumed 531 63 102Ceded (370) (426) (388)
Property-liability premiums written, net of reinsurance $20,389 $19,515 $18,789
Property-liability premiums earnedDirect $19,977 $19,666 $18,872Assumed 524 74 98Ceded (389) (433) (366)
Property-liability premiums earned, net of reinsurance $20,112 $19,307 $18,604
Life and annuity premiums and contract chargesDirect $ 1,849 $ 1,668 $ 1,675Assumed 34 29 21Ceded (260) (178) (194)
Life and annuity premiums and contract charges,net of reinsurance $ 1,623 $ 1,519 $ 1,502
Notes to Consolidated Financial Statements—(Continued)
A-56

The amounts recoverable from reinsurers at December 31, 1999 and 1998 include $110 million and$244 million, respectively, related to property-liability losses paid by the Company and billed to reinsurers, and $1.65billion and $1.46 billion, respectively, estimated by the Company with respect to ceded unpaid losses (includingIBNR) which are not billable until the losses are paid. Amounts recoverable from mandatory pools and facilitiesincluded above were $698 million and $637 million at December 31, 1999 and 1998, respectively. Recentdevelopments in the insurance industry have often led to the segregation of environmental, asbestos and other masstort exposures into separate legal entities with dedicated capital. These actions have been supported by regulatorybodies in certain cases. The Company is unable to determine the impact, if any, that these developments will have onthe collectibility of reinsurance recoverables in the future. The Company had amounts recoverable from Lloyd’s ofLondon of $89 million and $99 million at December 31, 1999 and 1998, respectively. Lloyd’s of Londonimplemented a restructuring plan in 1996 to solidify its capital base and to segregate claims for years before 1993.The impact, if any, of the restructuring on the collectibility of the recoverable from Lloyd’s of London is uncertain atthis time. The recoverable from Lloyd’s of London syndicates is spread among thousands of investors who haveunlimited liability.
In connection with the Company’s acquisition of CNA personal lines, Allstate and CNA entered into a four-yearaggregate stop loss agreement (see Note 7). The Company currently has a recoverable from CNA on unpaid losses of$147 million that is subject to the stop loss agreement. Excluding mandatory pools and facilities, and the CNArecoverable on unpaid losses, no other amount due or estimated to be due from any one property-liability reinsurerwas in excess of $85 million and $84 million at December 31, 1999 and 1998, respectively.
The Company also purchases reinsurance in its Life and Savings segment, primarily to limit mortality risk oncertain term life policies. The risk of reinsurance uncollectibility on Life and Savings recoverables is mitigated by anabsence of high concentrations with individual reinsurers.
Management believes the recoverables are appropriately established; however, as the Company’s underlyingreserves continue to develop, the amount ultimately recoverable may vary from amounts currently recorded. Thereinsurers and amounts recoverable therefrom are regularly evaluated by the Company and a provision foruncollectible reinsurance is recorded, if needed. There was a $3 million recovery of previous provisions forreinsurance in 1999 and there were no provisions for uncollectible reinsurance in 1998 and 1997. The allowance foruncollectible reinsurance was $111 million and $141 million at December 31, 1999 and 1998, respectively.
10. Capital Structure
Debt Outstanding
Total debt outstanding at December 31, consists of the following:
($ in millions) 1999 1998
6.75% Notes, due 2003 $ 300 $ 3007.20% Senior Notes, due 2009 750 –6.915% Equity-Linked Note, due 2009 75 –7.50% Debentures, due 2013 250 2506.75% Debentures, due 2018 250 2506.90% Debentures, due 2038 250 2507.125% Debentures, due 2097 250 250Floating rate notes, due 2009 to 2014 61 53
Total long-term debt 2,186 1,353Short-term debt and bank borrowings 665 393
Total debt $2,851 $1,746
In November 1999, the Company issued $750 million of 7.20% senior notes due 2009, the net proceeds ofwhich were used for general corporate purposes including share repurchases. In addition, a $75 million, 6.915%equity-linked note was issued in connection with the Company’s 1999 acquisition of CNA personal lines. Theprincipal repayment on the note at maturity is contingent upon certain profitability measures of the acquired CNApersonal lines business. The maximum amount of principal which would have to be paid is $85 million and the
A-57

minimum is $65 million. The 7.125% Debentures due in 2097 are subject to redemption at the Company’s option inwhole or in part beginning in 2002 at 100% of the principal amount plus accrued interest to the redemption date. TheCompany also has the right to shorten the maturity of the 7.125% Debentures to the extent required to preserve theCompany’s ability to deduct interest paid on the debentures.
To manage short-term liquidity, Allstate issues commercial paper and may draw on existing credit facilities. TheCompany maintains two credit facilities as a potential source of funds for The Allstate Corporation, AIC and ALIC.These include a $1.50 billion, five-year revolving line of credit, expiring in 2001 and a $50 million, one-yearrevolving line of credit expiring in 2000. In order to borrow from the five-year line of credit, AIC is required tomaintain a specified statutory surplus level and the Company’s debt to equity ratio (as defined in the agreement) mustnot exceed a designated level. In addition, the Company has three credit facilities available to provide up to $92million in funds for short-term liquidity purposes for the AHL operations. The Company pays commitment fees inconnection with these lines of credit. As of December 31, 1999, $71 million of borrowings were outstanding underthe AHL credit lines and no amounts were outstanding under the Company’s $1.50 billion and $50 million bank linesof credit. The weighted average interest rates of outstanding short-term debt at December 31, 1999 and 1998 were5.8% and 5.3%, respectively. The Company paid $114 million, $104 million and $87 million of interest on debt in1999, 1998 and 1997, respectively.
The Company filed a shelf registration statement with the Securities and Exchange Commission (‘‘SEC’’) inAugust 1998, under which up to $2 billion of debt securities, preferred stock or debt warrants may be issued. As ofDecember 31, 1999, $750 million of securities have been issued under the registration statement.
Mandatorily Redeemable Preferred Securities of Subsidiary Trusts
In 1996, Allstate Financing I (‘‘AF I’’), a wholly owned subsidiary trust of the Company, issued 22 millionshares of 7.95% Quarterly Income Preferred Securities (‘‘QUIPS’’) at $25 per share. The sole assets of AF I are$550 million of 7.95% Junior Subordinated Deferrable Interest Debentures (‘‘QUIDS’’) issued by the Company. TheQUIDS held by AF I will mature on December 31, 2026 and are redeemable by the Company at a liquidation valueof $25 per share in whole or in part beginning on November 25, 2001, at which time the QUIPS are callable. AF Imay elect to extend the maturity of its QUIPS to December 31, 2045. Dividends on the QUIPS are cumulative,payable quarterly in arrears, and are deferrable at the Company’s option for up to 5 years.
In 1996, Allstate Financing II (‘‘AF II’’), a wholly owned subsidiary trust of the Company, issued 200,000shares of 7.83% preferred securities (‘‘trust preferred securities’’) at $1,000 per share. The sole assets of AF II are$200 million of 7.83% Junior Subordinated Deferrable Interest Debentures (‘‘junior subordinated debentures’’) issuedby the Company. The junior subordinated debentures held by AF II will mature on December 1, 2045 and areredeemable by the Company at a liquidation value of $1,000 per share in whole or in part beginning on December 1,2006, at which time the trust preferred securities are callable. Dividends on the trust preferred securities arecumulative, payable semi-annually in arrears, and are deferrable at the Company’s option for up to 5 years.
In connection with the Company’s 1999 acquisition of AHL, Allstate assumed AHL’s obligations under theoutstanding mandatorily redeemable preferred securities issued by AHL and AHL Financing, a wholly ownedsubsidiary trust of AHL. The mandatorily redeemable preferred securities represent FELINE PRIDES, which consistof a unit with a stated amount of $50 comprising i) a stock purchase contract under which the holder will purchasefrom the Company on August 16, 2000, a number of Allstate common shares equal to a specified rate and ii)beneficial ownership of a 6.75% trust preferred security representing a preferred undivided beneficial interest in theassets of AHL Financing. The sole assets of AHL Financing are 6.75% subordinated debentures due August 16, 2002with a principal amount of $107 million for which the Company and AHL are co-obligors. Dividends on the FELINEPRIDES are cumulative, payable quarterly in arrears at a stated annual rate of 6.75%, and are deferrable until theAugust 16, 2002 maturity date. Each unit of FELINE PRIDES also pays a 1.75% annual yield enhancement, payablequarterly until the August 16, 2000 settlement of the stock purchase contract component.
The obligations of the Company with respect to the QUIDS, junior subordinated debentures and AHLsubordinated debentures constitute full and unconditional guarantees by the Company of AF I’s, AF II’s and AHLFinancing’s obligations under the respective preferred securities, including the payment of the liquidation orredemption price and any accumulated and unpaid interest and yield enhancements, but only to the extent of fundsheld by the trusts. The preferred securities are classified in the Company’s Consolidated statements of financial
Notes to Consolidated Financial Statements—(Continued)
A-58

position as Mandatorily Redeemable Preferred Securities of Subsidiary Trusts (representing the minority interest inthe trusts). The QUIPS and trust preferred securities are recorded at their redemption amounts of $550 million and$200 million, respectively. The FELINE PRIDES are recorded at their fair value at the date of acquisition of $214million as required by purchase accounting rules. The fair value exceeded the redemption amount by $110 million.Allstate will be prohibited from paying dividends on its preferred and common stock, or repurchasing capital stock ifthe Company elects to defer dividend payments on these preferred securities. Dividends on the preferred securitieshave been classified as minority interest in the Consolidated statements of operations. The total yield enhancementsto be paid on FELINE PRIDES units over the stock purchase contract were charged to Shareholders’ equity at thetime of issuance and therefore periodic yield enhancements are not reflected in the Consolidated statements ofoperations.
Capital stock
The Company has 900 million shares of issued common stock of which 787 million was outstanding and 113million was held in treasury as of December 31, 1999. In 1999, the Company repurchased 67 million shares at anaverage cost of $32.38 pursuant to authorized share repurchase programs of which, 34.1 million were reissuedpursuant to the AHL acquisition. On August 16, 2000, Allstate will issue common shares to settle the Company’sobligation under the stock purchase contract unit embedded in the FELINE PRIDES. The number of shares issuedwill be based on an applicable settlement rate multiplied by the 2,070,000 units of FELINE PRIDES outstanding.The settlement rate will depend on whether the holders of the FELINE PRIDES elect to settle the stock purchasecontract in cash or through the put of their beneficial interest in the trust preferred securities. If settled in cash, thenumber of shares issued will be based on a settlement rate of 3.5741; if holders elect to settle through the put of theirbeneficial interest in the trust preferred securities, the applicable settlement rate will be 3.5687. Under a shelfregistration statement filed with the SEC in February 2000, the Company may issue up to 7,398,387 shares ofAllstate common stock upon settlement of the FELINE PRIDES stock purchase contracts.
Shareholder Rights Agreement
On February 12, 1999, the Company announced a Rights Agreement under which shareholders of record onFebruary 26, 1999 received a dividend distribution of one share purchase right (a ‘‘Right’’) on each outstandingshare of the Company’s common stock. The Rights become exercisable ten days after it is publicly announced that aperson or group has acquired 15% or more of the Company’s common stock or ten business days after the beginningof a tender or exchange offer to acquire 15% or more of the Company’s common stock. The Rights then becomeexercisable at a price of $150 for a number of shares of the Company’s common stock having a market value equalto $300. The Company may redeem the Rights at a price of $.01 per Right. The Rights expire on February 12, 2009.The Rights are intended to protect shareholders from unsolicited takeover attempts that may unfairly pressureshareholders and deprive them of the full value of their shares.
11. Company Restructuring
On November 10, 1999, the Company announced a series of strategic initiatives to aggressively expand itsselling and service capabilities. The Company also announced that it is implementing a program to reduce expensesby approximately $600 million. The reduction in expenses will come from field realignment, the reorganization ofemployee agents to a single exclusive agency independent contractor program, the closing of a field support centerand four regional offices, and from reduced employee related expenses and professional services as a result ofreductions in force, attrition and consolidations. The reduction will result in the elimination of approximately 4,000current non-agent positions, across all employment grades and categories by the end of 2000, or approximately 10%of the Company’s non-agent work force.
These cost reductions are part of a larger initiative to redeploy the cost savings to finance new initiativesincluding investments in direct access and Internet channels for new sales and service capabilities, new competitivepricing, new agent and claim technology and enhanced marketing and advertising. As the result of the cost reductionprogram, Allstate recorded restructuring and related charges of $81 million pretax ($53 million after-tax) during thefourth quarter of 1999. The costs recognized primarily relate to the elimination of positions, the consolidation ofoperations and facilities and the transition of multiple employee agency programs to a single exclusive agencyindependent contractor program. All restructuring actions are anticipated to be completed by the end of 2000.
A-59

The pretax restructuring and other related charges accrued in the fourth quarter of 1999 comprised $59 millionfor employee termination benefits including the cost of incremental post-retirement benefits offered and $10 millionfor lease termination costs including post-exit rent expenses and asset impairments resulting from the restructuringdecision. An additional $12 million of pretax restructuring related costs, primarily consisting of agent separationcosts, were expensed as incurred during the fourth quarter of 1999. These charges are recorded in the 1999Consolidated statement of operations as ‘‘Restructuring charges’’. The Company anticipates that additional pretaxrestructuring related charges of approximately $100 million will be expensed as incurred throughout 2000 for agentconversion costs, retention and relocation bonuses, consulting and legal fees, training expenses and othermiscellaneous costs. As of December 31, 1999, 192 employees have been terminated pursuant to the restructuringplan and no payments have been applied against the restructuring liability for employee termination benefits, leasetermination costs or post-exit rent expenses.
12. Commitments and Contingent Liabilities
Leases
The Company leases certain office facilities and computer equipment. Total rent expense for all leases was $370million, $292 million and $256 million in 1999, 1998 and 1997, respectively.
Minimum rental commitments under noncancelable operating leases with an initial or remaining term of morethan one year as of December 31, are as follows:
($ in millions) 1999
2000 $2732001 2232002 1292003 772004 49Thereafter 112
$863
California Earthquake Authority (‘‘CEA’’)
Allstate participates in the CEA, which is a privately-financed, publicly-managed state agency created to provideinsurance coverage for earthquake damage. Insurers selling homeowners insurance in California are required to offerearthquake insurance to their customers either through their company or participation in the CEA. The Company’shomeowners policy continues to include coverages for losses caused by explosions, theft, glass breakage and firesfollowing an earthquake, which are not underwritten by the CEA.
Should losses arising from an earthquake cause a deficit in the CEA, additional capital needed to operate theCEA would be obtained through assessments of participating insurance companies, payments received underreinsurance agreements and bond issuances funded by future policyholder assessments. Participating insurers arerequired to fund an assessment, not to exceed $2.15 billion, if the capital of the CEA falls below $350 million.Participating insurers are required to fund a second assessment, not to exceed $1.43 billion, if aggregate CEAearthquake losses exceed $5.86 billion or the capital of the CEA falls below $350 million. At December 31, 1999,the CEA’s capital balance was approximately $485 million. If the CEA assesses its member insurers for any amount,the amount of future assessments on members is reduced by the amounts previously assessed. To date, the CEA hasnot assessed member insurers beyond the start-up assessment issued to participating insurers in 1996. The authorityof the CEA to assess participating insurers expires when it has completed twelve years of operation. All futureassessments to participating CEA insurers are based on their CEA insurance market share, as of December 31 of thepreceding year. As of December 31, 1999, the Company had a 25.7% CEA market share. Assuming its current CEAmarket share does not materially change, Allstate does not expect its portion of these additional contingentassessments, if any, to exceed $553 million, as the likelihood of an event exceeding the CEA claims paying capacityof $5.86 billion is remote.
Notes to Consolidated Financial Statements—(Continued)
A-60

Florida hurricane assessments
In Florida, the Company is subject to assessments from the Florida Windstorm Underwriting Association(‘‘FWUA’’) and the Florida Residential Property and Casualty Joint Underwriting Association (‘‘FRPCJUA’’),which are organizations created to provide coverage for catastrophic losses to property owners unable to obtaincoverage in the private market. Regular assessments are levied on participating companies if the deficit in thecalendar year is less than or equal to 10% of Florida property premiums industry-wide for that year. An insurer mayrecoup a regular assessment through a surcharge to policyholders subject to a cap on the amount that can be chargedin any one year. If the deficit exceeds 10%, the FWUA and/or FRPCJUA will fund the deficit through the issuance ofbonds. The costs of these bonds are then funded through a regular assessment in the first year following the deficitand emergency assessments in subsequent years. Companies are required to collect the emergency assessmentsdirectly from the policyholder and remit these monies to the organizations as they are collected. Participatingcompanies are obligated to purchase any unsold bonds issued by the FWUA and/or FRPCJUA. The insurer must fileany recoupment surcharge with the Florida Department of Insurance (‘‘the Department’’) at least 15 days prior toimposing the surcharge on any policies. The surcharge may be used automatically after the expiration of the 15 days,unless the Department has notified the insurer in writing that any of its calculations are incorrect.
The Company is also subject to assessments from the FHCF, which has the authority to issue bonds to pay itsobligations to participating insurers. The bonds issued by the FHCF are funded by assessments on all property andcasualty premiums written in the state, except workers’ compensation and accident and health insurance. Theseassessments are limited to 4% in the first year of assessment, and up to a total of 6% for assessments in the secondand subsequent years. Assessments are recoupable immediately through increases in policyholder rates. A rate filingor any portion of a rate change attributable entirely to the assessment is deemed approved when made with theDepartment, subject to the Department’s statutory authority to review the ‘‘adequacy’’ of any rate at any time.
While the statutes are designed so that the ultimate cost is borne by the policyholders, the exposure toassessments and the availability of recoveries may not offset each other in the financial statements due to timing andthe possibility of policies not being renewed in subsequent years.
Shared markets
As a condition of its license to do business in various states, the Company is required to participate inmandatory property-liability shared market mechanisms or pooling arrangements, which provide various insurancecoverages to individuals or other entities that otherwise are unable to purchase such coverage voluntarily provided byprivate insurers. Underwriting results related to these organizations have been immaterial to the results of operations.
Guaranty funds
Under state insurance guaranty fund laws, insurers doing business in a state can be assessed, up to prescribedlimits, for certain obligations of insolvent insurance companies to policyholders and claimants. The Company’sexpenses related to these funds have been immaterial.
Northbrook sale agreement
In connection with the sale of Northbrook Holdings, Inc. and its wholly owned subsidiaries (collectively‘‘Northbrook’’) in 1996 to St. Paul Fire & Marine Insurance Company (‘‘St. Paul’’), Allstate entered into anagreement with St. Paul whereby Allstate and St. Paul will share in any development of the closing net loss reservesof Northbrook, which will be settled as of July 31, 2000. The development of the closing net loss reserves has beenfavorable to date and the Company does not expect the ultimate settlement of the closing net loss reserves to varymaterially from recorded amounts.
PMI Runoff Support Agreement
The Company has certain limited rights and obligations under a capital support agreement (‘‘Runoff SupportAgreement’’) with PMI Mortgage Insurance Company (‘‘PMI’’), the primary operating subsidiary of PMI Group (seeNote 3). Under the Runoff Support Agreement, the Company would be required to pay claims on PMI policieswritten prior to October 28, 1994 if PMI fails certain financial covenants and fails to pay such claims. In the event
A-61

any amounts are so paid, the Company would receive a commensurate amount of preferred stock or subordinateddebt of PMI Group or PMI. The Runoff Support Agreement also restricts PMI’s ability to write new business andpay dividends under certain circumstances. Management does not believe this agreement will have a material adverseeffect on results of operations, liquidity or financial position of the Company.
Regulation
The Company’s insurance businesses are subject to the effects of changing social, economic and regulatoryenvironments. Public and regulatory initiatives have varied and have included efforts to adversely influence andrestrict premium rates, restrict the Company’s ability to cancel policies, impose underwriting standards and expandoverall regulation. The ultimate changes and eventual effects, if any, of these initiatives are uncertain.
Legal proceedings
Allstate and plaintiffs’ representatives have agreed to settle certain civil suits filed in California, including aclass action, related to the 1994 Northridge, California earthquake. The settlement received final approval from theSuperior Court of the State of California for the County of Los Angeles on June 11, 1999. The plaintiffs in thesecivil suits challenged licensing and engineering practices of certain firms Allstate retained and alleged that Allstatesystematically pressured engineering firms to improperly alter their reports to reduce the loss amounts paid to someinsureds with earthquake claims. Under the terms of the settlement, Allstate sent notice to approximately 11,500homeowners insurance customers inviting them to participate in a court-administered program which may allow forreview of their claims by an independent engineer and an independent adjusting firm to ensure that they have beencompensated for all structural damage from the 1994 Northridge earthquake covered under the terms of their Allstatepolicies. It is anticipated that approximately 2,500 of these customers will ultimately participate in this independentreview process. Allstate has agreed to retain an independent consultant to review, among other things, Allstate’spractices and procedures for handling catastrophe claims, and has helped fund a charitable foundation devoted toconsumer education on loss prevention and consumer protection and other insurance issues. The Company does notexpect that the effect of the proposed settlement will exceed the amounts currently reserved. During August 1999, agroup of objectors filed an appeal from the order approving the settlement. That appeal is pending.
In April 1998, Federal Bureau of Investigation agents executed search warrants at three Allstate offices fordocuments relating to the handling of certain claims for losses resulting from the Northridge earthquake. Allstate iscooperating with the investigation, which is being directed by the United States Attorney’s Office for the CentralDistrict of California. At present, the Company cannot determine the impact of resolving the investigation.
For the past five years, the Company has been distributing to certain PP&C claimants, documents regarding theclaims process and the role that attorneys may play in that process. Suits challenging the use of these documents havebeen filed against the Company, including purported class action suits. In addition to these suits, the Company hasreceived inquires from states’ attorneys general, bar associations and departments of insurance. In certain states, theCompany has continued to use these documents after agreeing to make certain modifications. The Company isvigorously defending its rights to use these documents. The outcome of these disputes is currently uncertain.
There are currently several state and nationwide putative class action lawsuits pending in various state courtsseeking actual and punitive damages from Allstate alleging breach of contract and fraud because of its specificationof after-market (non-original equipment manufacturer ) replacement parts in the repair of insured vehicles. Plaintiffsin these suits allege that after-market parts are not ‘‘of like kind and quality’’ as required by the insurance policies.The lawsuits are in various stages of development with no class action having been certified. The outcome of thesedisputes is currently uncertain.
Allstate is defending lawsuits, including two putative class actions, regarding worker classification. Two suitsrelate to the classification of California exclusive agents as independent contractors. These suits were filed afterAllstate’s reorganization of its California agency programs in 1996. The plaintiffs, among other things, seek adetermination that they have been treated as employees notwithstanding agent contracts that specify that they areindependent contractors for all purposes. Another suit relates to the classification of staff working in agency offices.In this putative class action, plaintiffs seek damages under the Employee Retirement Income Security Act and theRacketeer Influenced and Corrupt Organizations Act alleging that 10,000 agency secretaries were terminated asemployees by Allstate and rehired by agencies through outside staffing vendors for the purpose of avoiding thepayment of employee benefits. Allstate is vigorously defending these lawsuits. The outcome of these disputes iscurrently uncertain.
Notes to Consolidated Financial Statements—(Continued)
A-62
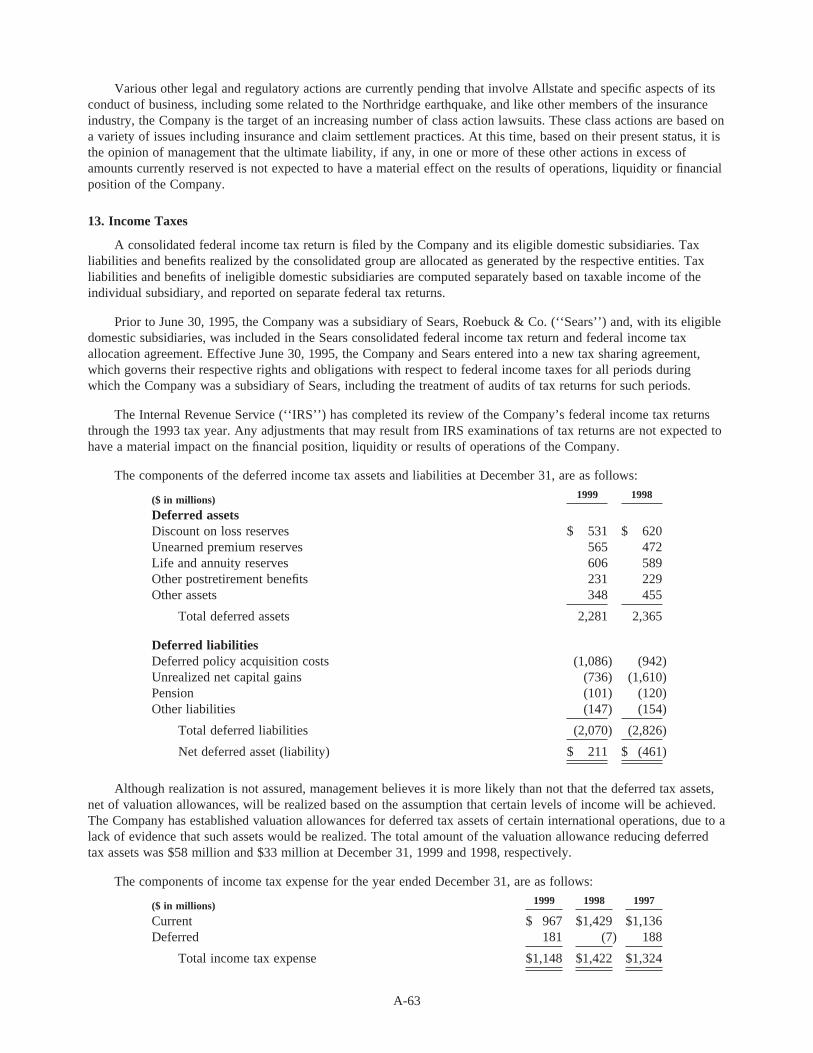
Various other legal and regulatory actions are currently pending that involve Allstate and specific aspects of itsconduct of business, including some related to the Northridge earthquake, and like other members of the insuranceindustry, the Company is the target of an increasing number of class action lawsuits. These class actions are based ona variety of issues including insurance and claim settlement practices. At this time, based on their present status, it isthe opinion of management that the ultimate liability, if any, in one or more of these other actions in excess ofamounts currently reserved is not expected to have a material effect on the results of operations, liquidity or financialposition of the Company.
13. Income Taxes
A consolidated federal income tax return is filed by the Company and its eligible domestic subsidiaries. Taxliabilities and benefits realized by the consolidated group are allocated as generated by the respective entities. Taxliabilities and benefits of ineligible domestic subsidiaries are computed separately based on taxable income of theindividual subsidiary, and reported on separate federal tax returns.
Prior to June 30, 1995, the Company was a subsidiary of Sears, Roebuck & Co. (‘‘Sears’’) and, with its eligibledomestic subsidiaries, was included in the Sears consolidated federal income tax return and federal income taxallocation agreement. Effective June 30, 1995, the Company and Sears entered into a new tax sharing agreement,which governs their respective rights and obligations with respect to federal income taxes for all periods duringwhich the Company was a subsidiary of Sears, including the treatment of audits of tax returns for such periods.
The Internal Revenue Service (‘‘IRS’’) has completed its review of the Company’s federal income tax returnsthrough the 1993 tax year. Any adjustments that may result from IRS examinations of tax returns are not expected tohave a material impact on the financial position, liquidity or results of operations of the Company.
The components of the deferred income tax assets and liabilities at December 31, are as follows:
($ in millions) 1999 1998
Deferred assetsDiscount on loss reserves $ 531 $ 620Unearned premium reserves 565 472Life and annuity reserves 606 589Other postretirement benefits 231 229Other assets 348 455
Total deferred assets 2,281 2,365
Deferred liabilitiesDeferred policy acquisition costs (1,086) (942)Unrealized net capital gains (736) (1,610)Pension (101) (120)Other liabilities (147) (154)
Total deferred liabilities (2,070) (2,826)
Net deferred asset (liability) $ 211 $ (461)
Although realization is not assured, management believes it is more likely than not that the deferred tax assets,net of valuation allowances, will be realized based on the assumption that certain levels of income will be achieved.The Company has established valuation allowances for deferred tax assets of certain international operations, due to alack of evidence that such assets would be realized. The total amount of the valuation allowance reducing deferredtax assets was $58 million and $33 million at December 31, 1999 and 1998, respectively.
The components of income tax expense for the year ended December 31, are as follows:
($ in millions) 1999 1998 1997
Current $ 967 $1,429 $1,136Deferred 181 (7) 188
Total income tax expense $1,148 $1,422 $1,324
A-63

The Company paid income taxes of $1.06 billion, $1.34 billion and $975 million in 1999, 1998 and 1997,respectively. The Company had a current income tax liability of $97 million and $226 million at December 31, 1999and 1998, respectively.
A reconciliation of the statutory federal income tax rate to the effective income tax rate on income fromoperations for the year ended December 31, is as follows:
1999 1998 1997
Statutory federal income tax rate 35.0% 35.0% 35.0%Tax-exempt income (7.7) (6.1) (6.2)Dividends received deduction (.6) (.7) (.5)Other 2.7 1.8 1.6
Effective income tax rate 29.4% 30.0% 29.9%
Prior to January l, 1984, ALIC and certain other life insurance subsidiaries included in the Life and Savingssegment were entitled to exclude certain amounts from taxable income and accumulate such amounts in a‘‘policyholder surplus’’ account. The balance in this account at December 31, 1999, approximately $105 million, willresult in federal income taxes payable of $37 million if distributed by these companies. No provision for taxes hasbeen made as the Company’s affected subsidiaries have no plan to distribute amounts from this account. No furtheradditions to the account have been permitted since the Tax Reform Act of 1984.
14. Statutory Financial Information
The following table reconciles consolidated net income for the year ended December 31, and shareholders’equity at December 31, as reported herein in conformity with generally accepted accounting principles with totalstatutory net income and capital and surplus of Allstate’s domestic insurance subsidiaries, determined in accordancewith statutory accounting practices prescribed or permitted by insurance regulatory authorities:
Net income Shareholders’ equity
($ in millions) 1999 1998 1997 1999 1998
Balance per generally accepted accounting principles $2,720 $3,294 $3,105 $16,601 $17,240Parent company and undistributed net income of certain subsidiaries 97 (76) (125) 670 897Unrealized gain/loss on fixed income securities – – – (114) (2,670)Deferred policy acquisition costs (254) (312) (279) (3,747) (3,023)Deferred income taxes 152 (26) 389 (161) 482Employee benefits (69) 27 (77) 263 288Financial statement impact of acquisitions/dispositions (152) 256 (81) (918) 174Reserves and non-admitted assets 36 92 99 181 99Other (201) 129 (126) 108 (86)
Balance per statutory accounting practices $2,329 $3,384 $2,905 $12,883 $13,401
Balances by major business type:Property-Liability $2,012 $2,998 $2,533 $10,132 $10,976Life and Savings 317 386 372 2,751 2,425
Balance per statutory accounting practices $2,329 $3,384 $2,905 $12,883 $13,401
The Property-Liability statutory capital and surplus balances above exclude wholly-owned subsidiaries includedin the Life and Savings segment.
Permitted statutory accounting practices
AIC and each of its domestic property-liability and life and savings subsidiaries prepare their statutory financialstatements in accordance with accounting practices prescribed or permitted by the insurance department of theapplicable state of domicile. Prescribed statutory accounting practices include a variety of publications of theNational Association of Insurance Commissioners (‘‘NAIC’’), as well as state laws, regulations and generaladministrative rules. Permitted statutory accounting practices encompass all accounting practices not so prescribed.Certain domestic subsidiaries of the Company follow permitted statutory accounting practices which differ from
Notes to Consolidated Financial Statements—(Continued)
A-64

those prescribed by regulatory authorities. The use of such permitted statutory accounting practices does not have asignificant impact on statutory surplus or statutory net income.
The NAIC’s codification initiative has produced a comprehensive guide of statutory accounting principles,which the Company will implement in January 2001. The requirements are not expected to have a material impact onthe statutory surplus of the Company’s insurance subsidiaries.
Dividends
The ability of the Company to pay dividends is dependent on business conditions, income, cash requirements ofthe Company, receipt of dividends from AIC and other relevant factors. The payment of shareholder dividends byAIC without the prior approval of the state insurance regulator is limited to formula amounts based on net incomeand capital and surplus, determined in accordance with statutory accounting practices, as well as the timing andamount of dividends paid in the preceding twelve months.
In the twelve-month period beginning January 1, 1999, AIC paid dividends of $2.96 billion, the maximumamount allowed under Illinois insurance law without the approval of the Illinois Department of Insurance (‘‘ILDepartment’’) based on 1998 formula amounts. Based on 1999 AIC statutory net income, the maximum amount ofdividends AIC will be able to pay without prior IL Department approval at a given point in time beginning in May2000 is $1.96 billion, less dividends paid during the preceding twelve months measured at that point in time.
Risk-based capital
The NAIC has a standard for assessing the solvency of insurance companies, which is referred to as risk-basedcapital (‘‘RBC’’). The requirement consists of a formula for determining each insurer’s RBC and a model lawspecifying regulatory actions if an insurer’s RBC falls below specified levels. At December 31, 1999, RBC for eachof the Company’s domestic insurance subsidiaries was significantly above levels that would require regulatoryactions.
15. Benefit Plans
Pension and other postretirement plans
Defined benefit pension plans cover most domestic full-time and certain part-time employees, as well asCanadian full-time employees and certain part-time employees. Benefits under the pension plans are based upon theemployee’s length of service, average annual compensation and estimated social security retirement benefits. TheCompany’s funding policy for the pension plans is to make annual contributions in accordance with acceptedactuarial cost methods.
The Company also provides certain health care and life insurance benefits for retired employees. Qualifiedemployees may become eligible for these benefits if they retire in accordance with the Company’s establishedretirement policy and are continuously insured under the Company’s group plans or other approved plans for ten ormore years prior to retirement. The Company shares the cost of the retiree medical benefits with retirees based onyears of service, with the Company’s share being subject to a 5% limit on annual medical cost inflation afterretirement. The Company’s postretirement benefit plans currently are not funded. The Company has the right tomodify or terminate these plans.
The components of net periodic benefit cost for all plans for the year ended December 31, are as follows:
Pension benefitsPostretirement
benefits
($ in millions) 1999 1998 1997 1999 1998 1997
Service cost $ 155 $ 155 $ 131 $14 $18 $13Interest cost 245 237 220 49 48 47Expected return on plan assets (358) (267) (245) – – –Amortization of prior service costs (6) (5) (6) (2) – –Amortization of unrecognized transition
obligation (2) (8) (8) – – –Settlement charge (benefit) (43) – 6 – – –Special termination benefits – – – 6 – –Recognized net actuarial loss (gain) 2 26 18 (3) – (1)
Net periodic benefit cost (benefit) $ (7) $ 138 $ 116 $64 $66 $59
A-65
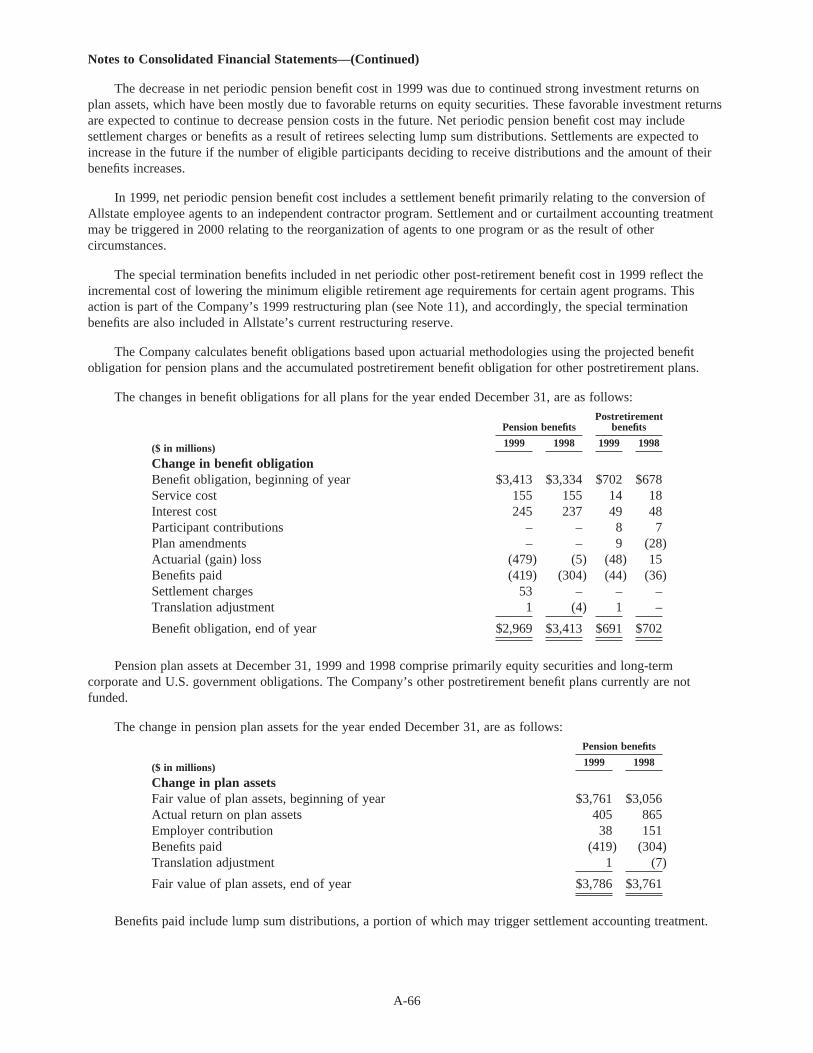
The decrease in net periodic pension benefit cost in 1999 was due to continued strong investment returns onplan assets, which have been mostly due to favorable returns on equity securities. These favorable investment returnsare expected to continue to decrease pension costs in the future. Net periodic pension benefit cost may includesettlement charges or benefits as a result of retirees selecting lump sum distributions. Settlements are expected toincrease in the future if the number of eligible participants deciding to receive distributions and the amount of theirbenefits increases.
In 1999, net periodic pension benefit cost includes a settlement benefit primarily relating to the conversion ofAllstate employee agents to an independent contractor program. Settlement and or curtailment accounting treatmentmay be triggered in 2000 relating to the reorganization of agents to one program or as the result of othercircumstances.
The special termination benefits included in net periodic other post-retirement benefit cost in 1999 reflect theincremental cost of lowering the minimum eligible retirement age requirements for certain agent programs. Thisaction is part of the Company’s 1999 restructuring plan (see Note 11), and accordingly, the special terminationbenefits are also included in Allstate’s current restructuring reserve.
The Company calculates benefit obligations based upon actuarial methodologies using the projected benefitobligation for pension plans and the accumulated postretirement benefit obligation for other postretirement plans.
The changes in benefit obligations for all plans for the year ended December 31, are as follows:
Pension benefitsPostretirement
benefits
($ in millions) 1999 1998 1999 1998
Change in benefit obligationBenefit obligation, beginning of year $3,413 $3,334 $702 $678Service cost 155 155 14 18Interest cost 245 237 49 48Participant contributions – – 8 7Plan amendments – – 9 (28)Actuarial (gain) loss (479) (5) (48) 15Benefits paid (419) (304) (44) (36)Settlement charges 53 – – –Translation adjustment 1 (4) 1 –
Benefit obligation, end of year $2,969 $3,413 $691 $702
Pension plan assets at December 31, 1999 and 1998 comprise primarily equity securities and long-termcorporate and U.S. government obligations. The Company’s other postretirement benefit plans currently are notfunded.
The change in pension plan assets for the year ended December 31, are as follows:
Pension benefits
($ in millions) 1999 1998
Change in plan assetsFair value of plan assets, beginning of year $3,761 $3,056Actual return on plan assets 405 865Employer contribution 38 151Benefits paid (419) (304)Translation adjustment 1 (7)
Fair value of plan assets, end of year $3,786 $3,761
Benefits paid include lump sum distributions, a portion of which may trigger settlement accounting treatment.
Notes to Consolidated Financial Statements—(Continued)
A-66

The plans’ funded status, which are calculated as the difference between the projected benefit obligation andplan assets for pension benefits, and the difference between the accumulated benefit obligation and plan assets forother postretirement benefits, are as follows:
Pension benefitsPostretirement
benefits
($ in millions) 1999 1998 1999 1998
Funded status $ 817 $ 349 $(691) $(702)Unamortized prior service cost (20) (28) (23) (29)Unamortized transition obligation 6 4 – –Unrecognized net actuarial gain (593) (164) (63) (17)
Prepaid (accrued) benefit cost $ 210 $ 161 $(777) $(748)
The $429 million change in the unrecognized net actuarial pension gain in 1999 reflects a higher discount rateassumption used in determining the projected benefit obligation. Allstate amortizes its excess unrecognized netactuarial gains over the average remaining service period of active employees expected to receive benefits. Includedin the prepaid benefit cost of the pension benefits are plans with aggregate accumulated benefit obligations in excessof the aggregate fair value of plan assets in the amount of $48 million and $54 million for 1999 and 1998,respectively.
Assumptions used in the determination of the projected pension benefit obligation and plan assets atDecember 31, which were based on an October 31 measurement date, were:
1999 1998 1997
Weighted average discount rate 8.00% 7.25% 7.25%Rate of increase in compensation levels 4.00–5.00 4.00–5.00 4.50–5.00Expected long-term rate of return on plan assets 9.50 9.50 9.50
The weighted average health care cost trend rate used in measuring the accumulated postretirement benefit costwas 6.10% for 1999, gradually declining to 5.00% in 2002 and remaining at that level thereafter. The weightedaverage discount rate used in determining the accumulated postretirement benefit obligation was 8.00% and 7.25% in1999 and 1998, respectively. Assumed health care cost trend rates have a significant effect on the amounts reportedfor the postretirement health care plans.
A one percentage-point increase in assumed health care cost trend rates would increase the total of the serviceand interest cost components of net periodic benefit cost of other postretirement benefits, and the accumulatedpostretirement benefit obligation by $2 million and $16 million, respectively. A one percentage-point decrease inassumed health care cost trend rates would decrease the total of the service and interest cost components of netperiodic benefit cost of other postretirement benefits, and the accumulated postretirement benefit obligation by $7million and $59 million, respectively.
Profit sharing plans
Employees of the Company and its domestic subsidiaries, with the exception of AHL, are also eligible tobecome members of The Savings and Profit Sharing Fund of Allstate Employees (‘‘Allstate Plan’’). The Companycontributions are based on the Company’s matching obligation and performance. The Allstate Plan includes anEmployee Stock Ownership Plan (‘‘ESOP’’) to pre-fund a portion of the Company’s anticipated contribution. Inconnection with the Allstate Plan, the Company has a note from the Allstate ESOP with a current principal balanceof $202 million. The ESOP note has a fixed interest rate of 7.9% and matures in 2019.
The Company’s defined contribution to the Allstate Plan was $80 million, $168 million and $159 million in1999, 1998 and 1997, respectively.
A-67

These amounts were reduced by the ESOP benefit computed for the year ended December 31, as follows:
($ in millions) 1999 1998 1997
Interest expense recognized by ESOP $ 17 $ 21 $ 25Less dividends accrued on ESOP shares (23) (22) (20)Cost of shares allocated 30 38 30
24 37 35Reduction of defined contribution due to ESOP 79 167 158
ESOP benefit $(55) $(130) $(123)
Net profit sharing expense relating to the Allstate Plan was $25 million, $38 million and $36 million for 1999,1998 and 1997, respectively. The Company contributed $60 million, $45 million and $7 million to the ESOP in1999, 1998 and 1997, respectively. At December 31, 1999, total committed to be released, allocated and unallocatedESOP shares were 3.3 million, 13.5 million and 22.2 million, respectively.
Allstate also has profit sharing plans for eligible employees of its Canadian insurance subsidiaries as well as foremployees of AHL. Profit sharing expense for these plans is not significant.
16. Equity Incentive Plans
The Company has two equity incentive plans which provide the Company the authority to grant nonqualifiedstock options, incentive stock options, and restricted or unrestricted shares of the Company’s stock to certainemployees and directors of the Company. A maximum of 41.1 million shares of common stock will be subject toawards under the plans, subject to adjustment in accordance with the plans’ terms. At December 31, 1999 and 1998,12.2 million and 19.8 million shares, respectively, were reserved for future issuance under these plans. To date, theCompany has not issued incentive stock options or unrestricted shares, and grants of restricted stock have beeninsignificant.
Options are granted under the plans at exercise prices equal to the fair value of the Company’s common stockon the applicable grant date. Effective with the 1999 acquisition of AHL, fixed stock options of Allstate wereexchanged for options outstanding under the previously outstanding AHL plan. The basis for the option exchangewas equal to the share conversion ratio pursuant to the merger agreement. The options granted under the Allstateplans vest ratably over a three or four-year period. The options granted may be exercised when vested and will expireten years after the date of grant.
The change in stock options for the year ended December 31, were as follows:
(thousands of shares) 1999
Weightedaverageexercise
price 1998
Weightedaverageexercise
price 1997
Weightedaverageexercise
price
Beginning balance 14,297 $24.29 13,533 $18.92 13,788 $14.20Granted 6,155 35.22 2,862 42.64 2,626 36.68AHL options exchanged 1,284 15.00 – – – –Exercised (1,095) 14.56 (1,993) 45.64 (2,708) 12.27Canceled or expired (261) 38.21 (105) 34.41 (173) 16.54
Ending balance 20,380 27.32 14,297 24.29 13,533 18.92
Exercisable 11,646 $21.03 9,678 $17.46 7,886 $13.71
Weighted average fair value(at grant date) for optionsgranted during the year $ 9.70 $ 12.25 $ 11.39
Notes to Consolidated Financial Statements—(Continued)
A-68

The fair value of each option grant is estimated on the date of grant using the Black-Scholes option-pricingmodel with the following weighted average assumptions for grants in 1999, 1998 and 1997; dividend yield of 1.7%,1.3% and 1.5%, respectively; volatility factor of 23%; risk-free interest rate of 5.99%, 5.33% and 6.01%,respectively; and expected life of seven years.
Information on the range of exercise prices for options outstanding as of December 31, 1999 is as follows:
(thousands of shares) Options outstanding Options exercisable
Range ofexercise prices
Numberoutstandingat 12/31/99
Weightedaverageexercise
price
Weightedaverage
remainingcontractual
life
Numberexercisableat 12/31/99
Weightedaverage
exercise price
$ 5.36–$15.85 7,451 $13.62 4.95 years 7,256 $13.64$17.04–$27.91 1,698 21.36 7.12 years 1,465 21.88$28.69–$39.34 8,410 35.53 8.98 years 1,781 36.54$40.09–$50.72 2,821 42.61 8.35 years 1,144 42.67
20,380 27.32 7.27 years 11,646 21.03
The Company has adopted the financial disclosure provisions of SFAS No. 123, ‘‘Accounting for Stock-BasedCompensation’’ with respect to its employee plan. The Company applies Accounting Principles Board OpinionNo. 25 and related Interpretations in accounting for its employee equity incentive plans. Accordingly, nocompensation cost has been recognized for its employee plan as the exercise price of the options equals the marketprice at the grant date. Furthermore, no compensation cost was recognized on the exchange of AHL fixed stockoptions for Allstate replacement options in 1999 since these options are not considered to be new option grants formeasurement purposes.
The effect of recording compensation cost for the Company’s employee stock-based compensation plan basedon SFAS No. 123’s fair value method would have reduced net income and earnings per share by the following proforma amounts:
($ in millions, except per share data) 1999 1998 1997
Net income:As reported $2,720 $3,294 $3,105Pro forma 2,702 3,281 3,094
Earnings per share—basic:As reported 3.40 3.96 3.58Pro forma 3.38 3.94 3.56
Earnings per share—diluted:As reported 3.38 3.94 3.56Pro forma 3.36 3.92 3.55
17. Business Segments
Allstate management is organized around products and services, and this structure is considered in theidentification of its four reportable segments. These segments and their respective operations are as follows:
Personal Property and Casualty (‘‘PP&C’’) sells primarily private passenger auto and homeowners insuranceto individuals in both the United States and in other countries. Revenues generated outside the United Stateswere immaterial with respect to PP&C’s total revenues for the years ended December 31, 1999, 1998 and 1997,respectively. The Company evaluates the results of this segment based upon premium growth and underwritingresults.
Discontinued Lines and Coverages consists of business no longer written by Allstate, including results fromenvironmental, asbestos and other mass tort exposures, the mortgage pool insurance business exited in 1999 andother commercial business in run-off. This segment also includes the historical results of the commercial andreinsurance businesses sold in 1996. The Company evaluates the results of this segment based uponunderwriting results.
A-69
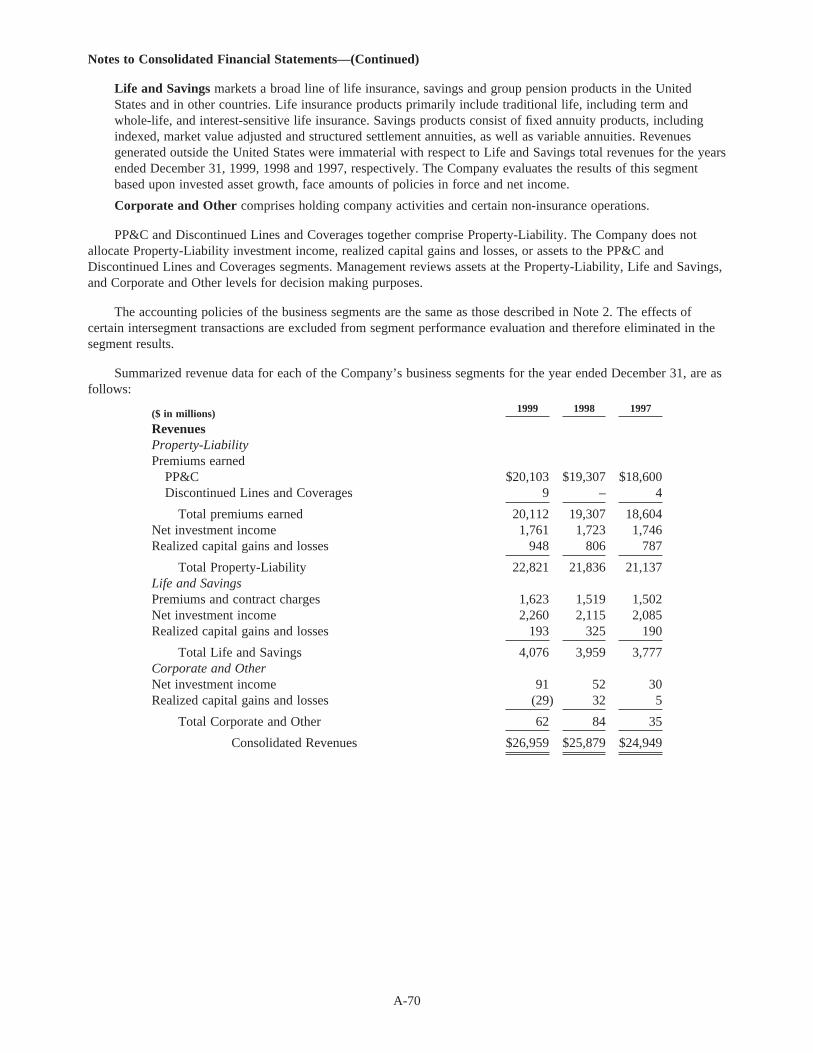
Life and Savings markets a broad line of life insurance, savings and group pension products in the UnitedStates and in other countries. Life insurance products primarily include traditional life, including term andwhole-life, and interest-sensitive life insurance. Savings products consist of fixed annuity products, includingindexed, market value adjusted and structured settlement annuities, as well as variable annuities. Revenuesgenerated outside the United States were immaterial with respect to Life and Savings total revenues for the yearsended December 31, 1999, 1998 and 1997, respectively. The Company evaluates the results of this segmentbased upon invested asset growth, face amounts of policies in force and net income.
Corporate and Other comprises holding company activities and certain non-insurance operations.
PP&C and Discontinued Lines and Coverages together comprise Property-Liability. The Company does notallocate Property-Liability investment income, realized capital gains and losses, or assets to the PP&C andDiscontinued Lines and Coverages segments. Management reviews assets at the Property-Liability, Life and Savings,and Corporate and Other levels for decision making purposes.
The accounting policies of the business segments are the same as those described in Note 2. The effects ofcertain intersegment transactions are excluded from segment performance evaluation and therefore eliminated in thesegment results.
Summarized revenue data for each of the Company’s business segments for the year ended December 31, are asfollows:
($ in millions) 1999 1998 1997
RevenuesProperty-LiabilityPremiums earned
PP&C $20,103 $19,307 $18,600Discontinued Lines and Coverages 9 – 4
Total premiums earned 20,112 19,307 18,604Net investment income 1,761 1,723 1,746Realized capital gains and losses 948 806 787
Total Property-Liability 22,821 21,836 21,137Life and SavingsPremiums and contract charges 1,623 1,519 1,502Net investment income 2,260 2,115 2,085Realized capital gains and losses 193 325 190
Total Life and Savings 4,076 3,959 3,777Corporate and OtherNet investment income 91 52 30Realized capital gains and losses (29) 32 5
Total Corporate and Other 62 84 35
Consolidated Revenues $26,959 $25,879 $24,949
Notes to Consolidated Financial Statements—(Continued)
A-70

Summarized financial performance data for each of the Company’s reportable segments for the year endedDecember 31, are as follows:
($ in millions) 1999 1998 1997
Income from operations before incometaxes and other itemsProperty-LiabilityUnderwriting income (loss)
PP&C $ 576 $1,355 $1,141Discontinued Lines and Coverages (49) (51) (18)
Total underwriting income 527 1,304 1,123Net investment income 1,761 1,723 1,746Realized capital gains and losses 948 806 787Gain on disposition of operations 10 38 67
Property-Liability income from operations before incometaxes and equity in net income of unconsolidatedsubsidiary 3,246 3,871 3,723
Life and SavingsPremiums and contract charges 1,623 1,519 1,502Net investment income 2,260 2,115 2,085Realized capital gains and losses 193 325 190Contract benefits 2,578 2,415 2,415Operating costs and expenses 751 695 602Loss on disposition of operations – – 5
Life and Savings income from operations before incometaxes 747 849 755
Corporate and OtherNet investment income 91 52 30Realized capital gains and losses (29) 32 5Operating costs and expenses 148 108 79Gain on disposition of operations – 49 –
Corporate and Other income (loss) from operations beforeincome taxes and dividends on preferred securities (86) 25 (44)
Consolidated income from operations before incometaxes and other items $3,907 $4,745 $4,434
Additional significant financial performance data for each of the Company’s reportable segments for the yearended December 31, are as follows:
($ in millions) 1999 1998 1997
Amortization of deferred policy acquisition costsPP&C $2,908 $2,644 $2,491Discontinued Lines and Coverages – – –Life and Savings 374 377 298
Consolidated $3,282 $3,021 $2,789
Income tax expenseProperty-Liability $ 934 $1,121 $1,087Life and Savings 262 299 258Corporate and Other (48) 2 (21)
Consolidated $1,148 $1,422 $1,324
Interest expense is primarily incurred in the Corporate and Other segment. Capital expenditures for long-livedassets are generally made at the Property-Liability level. A portion of these long-lived assets are utilized by entitiesincluded in the Life and Savings and Corporate and Other segments, and accordingly, are charged expenses inproportion to their use.
A-71

A-72
Summarized data for total assets and investments for each of the Company’s reportable segments as ofDecember 31, are as follows:
At December 31, 1999 1998
($ in millions)
AssetsProperty-Liability $41,416 $41,662Life and Savings 53,200 44,947Corporate and Other 3,503 1,082
Consolidated $98,119 $87,691
InvestmentsProperty-Liability $32,943 $33,733Life and Savings 34,444 31,765Corporate and Other 2,258 1,027
Consolidated $69,645 $66,525
18. Other Comprehensive Income
The components of other comprehensive income on a pretax and after-tax basis for the year endedDecember 31, are as follows:
1999 1998 1997
($ in millions) Pretax TaxAfter-
tax Pretax TaxAfter-
tax Pretax TaxAfter-
tax
Unrealized capital gains and losses:Unrealized holding gains (losses)
arising during the period $(1,507) $527 $ (980) $1,195 $(418) $777 $2,147 $(751) $1,396Less: reclassification adjustments 993 (348) 645 929 (325) 604 889 (311) 578
Unrealized net capital gains (losses) (2,500) 875 (1,625) 266 (93) 173 1,258 (440) 818Unrealized foreign currency
translation adjustments:Unrealized foreign currency
translation adjustments arisingduring the period 22 (8) 14 (3) 1 (2) (131) 46 (85)
Less: reclassification adjustments – – – – – – (43) 15 (28)
Unrealized foreign currency translationadjustments 22 (8) 14 (3) 1 (2) (88) 31 (57)
Other comprehensive income $(2,478) $867 $(1,611) $ 263 $ (92) $171 $1,170 $(409) $ 761
19. Quarterly Results (unaudited)
First quarter Second quarter Third quarter Fourth quarter
($ in millions except per share data) 1999 1998 1999 1998 1999 1998 1999 1998
Revenues $6,807 $6,450 $6,592 $6,539 $6,551 $6,436 $7,009 $6,454Net income 1,035 936 770 885 490 713 425 760
Earnings per shareBasic 1.27 1.11 .96 1.06 .63 .87 .54 .93Diluted 1.27 1.10 .95 1.05 .62 .86 .54 .93

Independent Auditors’ Report
TO THE BOARD OF DIRECTORS ANDSHAREHOLDERS OF THE ALLSTATE CORPORATION:
We have audited the accompanying Consolidated Statements of Financial Position of The Allstate Corporationand subsidiaries as of December 31, 1999 and 1998, and the related Consolidated Statements of Operations,Comprehensive Income, Shareholders’ Equity and Cash Flows for each of the three years in the period endedDecember 31, 1999. These financial statements are the responsibility of the Company’s management. Ourresponsibility is to express an opinion on these financial statements based on our audits.
We conducted our audits in accordance with generally accepted auditing standards. Those standards require thatwe plan and perform the audit to obtain reasonable assurance about whether the consolidated financial statements arefree of material misstatement. An audit includes examining, on a test basis, evidence supporting the amounts anddisclosures in the consolidated financial statements. An audit also includes assessing the accounting principles usedand significant estimates made by management, as well as evaluating the overall consolidated financial statementpresentation. We believe that our audits provide a reasonable basis for our opinion.
In our opinion, such consolidated financial statements present fairly, in all material respects, the financialposition of The Allstate Corporation and subsidiaries as of December 31, 1999 and 1998, and the results of theiroperations and their cash flows for each of the three years in the period ended December 31, 1999 in conformity withgenerally accepted accounting principles.
Chicago, IllinoisFebruary 25, 2000
A-73

XPlease mark yourvotes as in thisexample.
2469
The proxies are directed to vote as specified below and in their judgment on all other matters coming before the meeting. Except as specified to the contrary below,the shares represented by this proxy will be voted FOR all nominees listed on the reverse side, FOR Item 2 and AGAINST Items 3 and 4.
The Board of Directors recommends a vote FOR all nominees listed and FOR Item 2. The Board of Directors recommends a vote AGAINST Items 3 and 4.
1. Election ofdirectors.
FOR WITHHELD
For, except vote withheld from the following nominee(s):
2. Appointment ofDeloitte & ToucheLLP as independentauditors for 2000.
FOR AGAINST ABSTAIN
3. Provide cumulative votingfor Board of Directors.
FOR AGAINST ABSTAIN
4. Endorse CERES Principles.
Please sign exactly as name appears hereon. Joint Ownersshould each sign. Where applicable, indicate official positionor representative capacity.
SIGNATURE(S) DATE
¶ FOLD AND DETACH HERE 
The Allstate Corporation stockholders can now vote their shares over the telephone or theInternet. This eliminates the need to return the proxy card.
To vote your shares over the telephone or the Internet you must have your proxy card andSocial Security Number available. The Control Number that appears in the box above, justbelow the perforation, must be used in order to vote by telephone or over the Internet.These systems can be accessed 24 hours a day, seven days a week up until the day priorto the meeting.
1. To vote over the telephone:On a touch-tone telephone call 1-877-PRX-VOTE (1-877-779-8683).
2. To vote over the Internet:Log on to the Internet and go to the web site http://www.eproxyvote.com/all.
Your vote over the telephone or the Internet instructs the proxies in the same manner as ifyou marked, signed, dated and returned your proxy card.
If you choose to vote your shares over the telephone or the Internet, there is no need foryou to mail back your proxy card.
Your vote is important. Thank you for voting.
THE ALLSTATE CORPORATION
This Proxy is Solicited on behalf of the Board of Directorsfor the Annual Meeting to be Held May 18, 2000
The undersigned hereby appoints WARREN L. BATTS, EDWARD A. BRENNAN, JAMES M. DENNY, MICHAEL A. MILES, H. JOHNRILEY, JR., and JOSHUA I. SMITH and each of them, or if more than one is present and acting then a majority thereof, proxies, with fullpower of substitution and revocation, to vote the shares of The Allstate Corporation which the undersigned is entitled to vote at the annualmeeting of stockholders, and at any adjournment thereof, with all the powers the undersigned would possess if personally present,including authority to vote on the matters shown on the reverse in the manner directed, and upon any other matter which may properlycome before the meeting. Receipt is acknowledged of The Allstate Corporation’s 1999 Summary Annual Report to stockholders and Noticeand Proxy Statement for the 2000 Annual Meeting. Except as specified on the reverse side, the shares represented by this proxy will bevoted FOR all nominees listed below, FOR Item 2 and AGAINST Items 3 and 4. The undersigned hereby revokes any proxy previouslygiven to vote such shares at the meeting or at any adjournment.
Election of Directors
Nominees: (01) F. Duane Ackerman, (02) James G. Andress, (03) Warren L. Batts, (04) Edward A. Brennan,(05) James M. Denny, (06) W. James Farrell, (07) Ronald T. LeMay, (08) Edward M. Liddy, (09) Michael A. Miles,(10) H. John Riley, Jr., (11) Joshua I. Smith, (12) Judith A. Sprieser and (13) Mary Alice Taylor.
You are encouraged to specify your choices by marking the appropriate boxes (SEE REVERSE SIDE) but you need not mark any boxesif you wish to vote in accordance with the Board of Directors recommendations. Also see reverse side for instructions to vote your sharesover the telephone or the Internet.
PLEASE MARK, SIGN, DATE AND MAIL THE PROXY CARD PROMPTLYUSING THE ENCLOSED ENVELOPE
(Continued and to be signed on reverse side.)
¶ FOLD AND DETACH HERE 

XPlease mark yourvotes as in thisexample.
3009
The Trustee is directed to vote as specified below and in its discretion on all other matters coming before the meeting. Except as specified to the contrary below, theshares represented by this voting instruction form will be voted FOR all nominees listed on the reverse side, FOR Item 2 and AGAINST Items 3 and 4.
The Board of Directors recommends a vote FOR all nominees listed and FOR Item 2. The Board of Directors recommends a vote AGAINST Items 3 and 4.
1. Election ofdirectors.
FOR WITHHELD
For, except vote withheld from the following nominee(s):
2. Appointment ofDeloitte & ToucheLLP as independentauditors for 2000.
FOR AGAINST ABSTAIN
3. Provide cumulative votingfor Board of Directors.
FOR AGAINST ABSTAIN
4. Endorse CERES Principles.
Please sign exactly as name appears hereon.
SIGNATURE(S) DATE
¶ FOLD AND DETACH HERE 
Participants in The Savings and Profit Sharing Fund of Allstate Employees (the ‘‘Fund’’)can now vote their shares of stock of The Allstate Corporation over the telephone or theInternet. This eliminates the need to return this voting instruction form.
To vote your shares over the telephone or the Internet you must have your votinginstruction form and Social Security Number available. The Voter Control Number thatappears in the box above, just below the perforation, must be used in order to vote bytelephone or over the Internet. These systems can be accessed 24 hours a day, sevendays a week up until the day prior to the meeting.
1. To vote over the telephone:On a touch-tone telephone call 1-877-PRX-VOTE (1-877-779-8683).
2. To vote over the Internet:Log on to the Internet and go to the web site http://www.eproxyvote.com/all.
Your vote over the telephone or the Internet instructs the trustee for the Fund in the samemanner as if you marked, signed, dated and returned your voting instruction form.
If you choose to vote your shares over the telephone or the Internet, there is no need foryou to mail back your voting instruction form.
Your vote is important. Thank you for voting.

THE ALLSTATE CORPORATION
VOTING INSTRUCTION FORM
This card constitutes voting instructions by the undersigned to The Northern Trust Company (the ‘‘Trustee’’), trustee of the trust maintainedunder The Savings and Profit Sharing Fund of Allstate Employees (the ‘‘Fund’’) for all shares votable by the undersigned and held of recordby the Trustee. First Chicago Trust Company, a division of EquiServe, as agent for the Trustee, will tabulate all Fund voting instructionforms received prior to the 2000 Annual Meeting of The Allstate Corporation to be held on May 18, 2000. EXCEPT AS SPECIFIED ONTHE REVERSE SIDE, THE SHARES REPRESENTED BY THIS VOTING INSTRUCTION FORM ARE HEREBY INSTRUCTED TO VEVOTED BY THE TRUSTEE ‘‘FOR’’ ALL NOMINEES LISTED BELOW, ‘‘FOR’’ ITEM 2 AND ‘‘AGAINST’’ ITEMS 3 AND 4.
Election of Directors:
Nominees: (01) F. Duane Ackerman, (02) James G. Andress, (03) Warren L. Batts, (04) Edward A. Brennan,(05) James M. Denny, (06) W. James Farrell, (07) Ronald T. LeMay, (08) Edward M. Liddy, (09) Michael A. Miles,(10) H. John Riley, Jr., (11) Joshua I. Smith, (12) Judith A. Sprieser and (13) Mary Alice Taylor.
THE PROXY FOR WHICH YOUR INSTRUCTIONS ARE REQUESTED IS SOLICITED ON BEHALF OF THE BOARD OF DIRECTORS.You are encouraged to specify your choices by marking the appropriate boxes (SEE REVERSE SIDE) but you need not mark any boxesif you wish to vote in accordance with the Board of Directors recommendations. Please mark, sign, date and mail this voting instructionform in the enclosed business reply envelope or, if you prefer, see reverse side for instructions to vote your shares over the Internet or byphone.
PLEASE MARK, SIGN, DATE AND MAIL THE VOTING INSTRUCTION FORM PROMPTLYUSING THE ENCLOSED ENVELOPE
(Continued and to be signed on reverse side.)
¶ FOLD AND DETACH HERE 
TRUSTEE’S VOTING PROCEDURES
If there are any Fund shares votable for which instructions are not timely received, andas respects all unallocated shares held by the Fund, the Trustee will vote such sharesas follows: if the Trustee receives timely voting instructions for at least 50% of thevotable shares, then all such nonvoted shares and unallocated shares shall be voted inthe same proportion and in the same manner as the shares for which timely instructionshave been received, unless to do so would be inconsistent with the Trustee’s duties. Ifthe Trustee receives voting instructions with regard to less than 50% of the votableshares, the Trustee shall vote all unvoted and unallocated shares in its sole discretion.Discretionary authority will not be used in connection with voting on adjournment of themeeting in order to solicit further proxies. The undersigned hereby revokes any votinginstruction previously given to vote such shares at the meeting or at any adjournment.