Embed Size (px)
Citation preview
Addamjeee Insurance Comppany L
St
imited
rugglin
d (AICL
g to gea
Friday, J
L)
ar mom
July 04, 2014
AHCML
mentum
4
L
m
Friday, July 04, 2014
AHCML
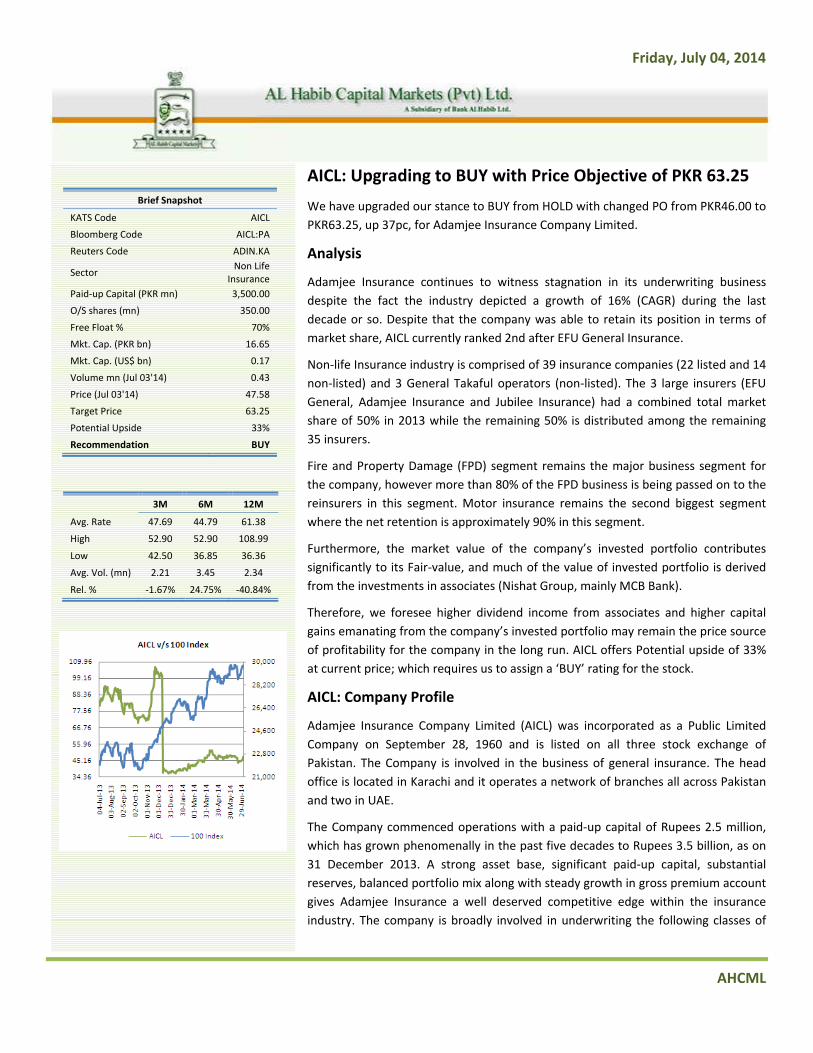
AICL: Upgrading to BUY with Price Objective of PKR 63.25
We have upgraded our stance to BUY from HOLD with changed PO from PKR46.00 to PKR63.25, up 37pc, for Adamjee Insurance Company Limited.
Analysis
Adamjee Insurance continues to witness stagnation in its underwriting business despite the fact the industry depicted a growth of 16% (CAGR) during the last decade or so. Despite that the company was able to retain its position in terms of market share, AICL currently ranked 2nd after EFU General Insurance.
Non‐life Insurance industry is comprised of 39 insurance companies (22 listed and 14 non‐listed) and 3 General Takaful operators (non‐listed). The 3 large insurers (EFU General, Adamjee Insurance and Jubilee Insurance) had a combined total market share of 50% in 2013 while the remaining 50% is distributed among the remaining 35 insurers.
Fire and Property Damage (FPD) segment remains the major business segment for the company, however more than 80% of the FPD business is being passed on to the reinsurers in this segment. Motor insurance remains the second biggest segment where the net retention is approximately 90% in this segment.
Furthermore, the market value of the company’s invested portfolio contributes significantly to its Fair‐value, and much of the value of invested portfolio is derived from the investments in associates (Nishat Group, mainly MCB Bank).
Therefore, we foresee higher dividend income from associates and higher capital gains emanating from the company’s invested portfolio may remain the price source of profitability for the company in the long run. AICL offers Potential upside of 33% at current price; which requires us to assign a ‘BUY’ rating for the stock.
AICL: Company Profile
Adamjee Insurance Company Limited (AICL) was incorporated as a Public Limited Company on September 28, 1960 and is listed on all three stock exchange of Pakistan. The Company is involved in the business of general insurance. The head office is located in Karachi and it operates a network of branches all across Pakistan and two in UAE.
The Company commenced operations with a paid‐up capital of Rupees 2.5 million, which has grown phenomenally in the past five decades to Rupees 3.5 billion, as on 31 December 2013. A strong asset base, significant paid‐up capital, substantial reserves, balanced portfolio mix along with steady growth in gross premium account gives Adamjee Insurance a well deserved competitive edge within the insurance industry. The company is broadly involved in underwriting the following classes of
Brief Snapshot
KATS Code AICL
Bloomberg Code AICL:PA
Reuters Code ADIN.KA
Sector Non Life
Insurance Paid‐up Capital (PKR mn) 3,500.00
O/S shares (mn) 350.00
Free Float % 70%
Mkt. Cap. (PKR bn) 16.65
Mkt. Cap. (US$ bn) 0.17
Volume mn (Jul 03'14) 0.43
Price (Jul 03'14) 47.58
Target Price 63.25
Potential Upside 33%
Recommendation BUY
3M 6M 12M
Avg. Rate 47.69 44.79 61.38
High 52.90 52.90 108.99
Low 42.50 36.85 36.36
Avg. Vol. (mn) 2.21 3.45 2.34
Rel. % ‐1.67% 24.75% ‐40.84%
Friday, July 04, 2014
AHCML
businesses:
Fire and Property Engineering Health Marine Motor Miscellaneous business
AICL acquiring 5.4pc stake in Security General Insurance Company
Adamjee Insurance intends to acquire 3.6 million ordinary shares of Rs10 each of SGIC, at a maximum price of PKR95 per share, however the book value per share of the company, as per the latest annual accounts, stands at PKR 116.00. Additionally the market value of company’s investment portfolio stands at PKR 15,728mn translating into a per share value of PKR 231.10 as on July 3, 2014.
The deal bodes favourably for the AICL; however, it may be assumed that such an acquisition may not be purely from the core business point of view but more related to strategic cross holdings as both the companies are part of the Nishat Group.
Valuation
We have arrived at a SOP based value of PKR63.25per share; which includes DCF based fair value of its core operations (insurance business) of PKR14.38 and a portfolio value of PKR48.87. Furthermore, we have applied a 25pc discount on the market price of quoted equity investments (excluding companies under coverage‐for which we have used our model based fair values) and investments in Government securities and in unquoted companies (associates) have been taken at carrying value in the balance sheet thereby arriving at the appropriate value of company’s invested portfolio.
Assumptions
We have used WACC (21.25%) for discounting the cash flows of the company. We have assumed that 50% of the Gross Written to be recorded as Premiums Earned in the current year and the remainder in following year. Loss & Loss Adjustment Expense (LAE) Ratio is assumed at 70% while the Loss Paid in Cash assumed at 95% of the Loss Expense. Reinsurance share have been assumed at 40% of the Gross Written Premium.
“A DCF based fair value of its core operations (insurance business) of PKR14 and a portfolio value of PKR49”
“Applying a 25% discount on the market price of quoted equity investments in the portfolio”
“MCB, HUBC, NML, UBL, NBP, FFBL, FFC, OGDC, POL, PPL & DGKC are taken on our model based fair values”
“Loss & Loss Adjustment Expense (LAE) Ratio is assumed at 70% while the Loss Paid in Cash assumed at 95% of the Loss Expense”

Friday, July 04, 2014
AHCML
IGI Insurance Company ‐ Discounted Cash Flow Statement
2014E 2015F 2016F 2017F 2018F
Underwriting Income: 16,413 2,005 2,066 2,128 2,192
Tax on Underwriting Income: ‐5,744 ‐702 ‐723 ‐745 ‐767
Cash Flow from Underwriting Activities 388,974 397,602 409,610 421,980 434,724
Cash Flow from Operations 501,296 407,375 438,039 449,091 462,443
Capex: ‐32,487 ‐141,884 ‐146,041 ‐150,329 ‐154,753
Cash Flow from Investing: ‐32,487 ‐141,884 ‐146,041 ‐150,329 ‐154,753
Total Free Cash Flow: 468,810 265,491 291,998 298,762 307,690
WACC: 21.25% 21.25% 21.25% 21.25% 21.25%
PV of after tax Cash Flows 426,215 199,072 180,484 152,585 129,368
Terminal Growth Rate 4%
Terminal Value 777,624
ENTERPRISE VALUE 1,865,347
Deduct: Net Debt ‐3,163,786
INTRINSIC VALUE 5,029,133
Per Share Value 14.38
Portfolio Value 48.87
Sum of the Parts Value 63.25
AHCML estimates
Friday, July 04, 2014
AHCML
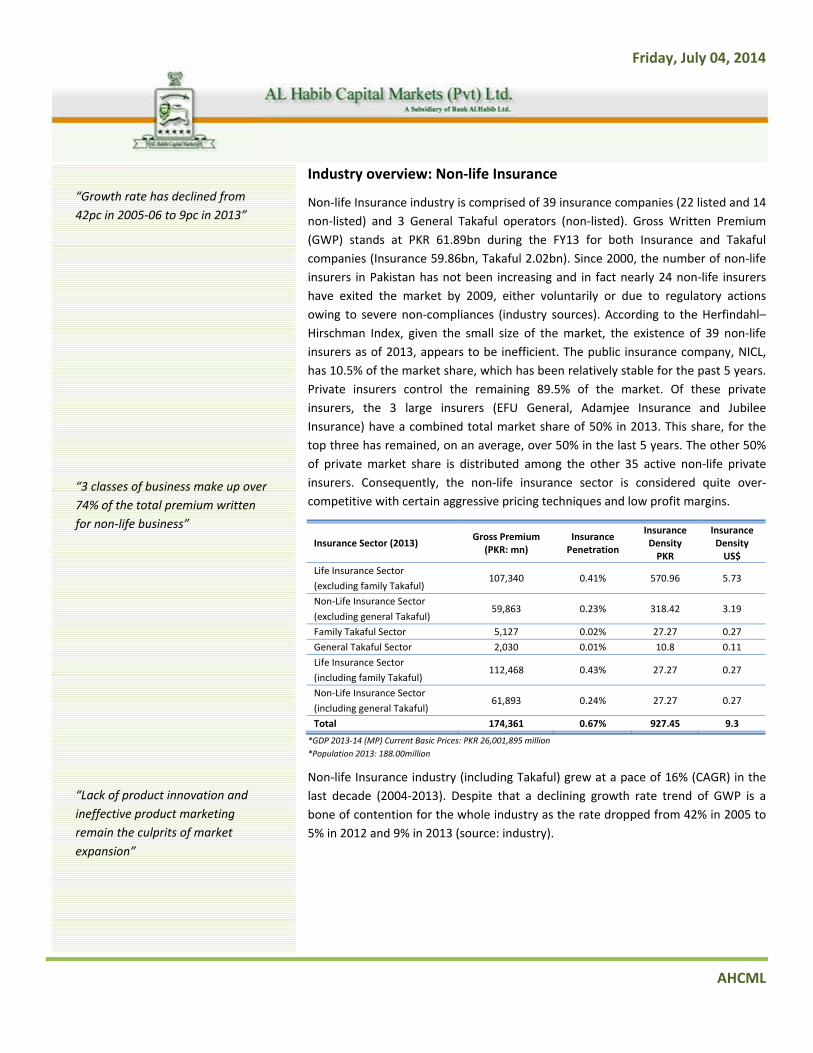
Industry overview: Non‐life Insurance
Non‐life Insurance industry is comprised of 39 insurance companies (22 listed and 14 non‐listed) and 3 General Takaful operators (non‐listed). Gross Written Premium (GWP) stands at PKR 61.89bn during the FY13 for both Insurance and Takaful companies (Insurance 59.86bn, Takaful 2.02bn). Since 2000, the number of non‐life insurers in Pakistan has not been increasing and in fact nearly 24 non‐life insurers have exited the market by 2009, either voluntarily or due to regulatory actions owing to severe non‐compliances (industry sources). According to the Herfindahl–Hirschman Index, given the small size of the market, the existence of 39 non‐life insurers as of 2013, appears to be inefficient. The public insurance company, NICL, has 10.5% of the market share, which has been relatively stable for the past 5 years. Private insurers control the remaining 89.5% of the market. Of these private insurers, the 3 large insurers (EFU General, Adamjee Insurance and Jubilee Insurance) have a combined total market share of 50% in 2013. This share, for the top three has remained, on an average, over 50% in the last 5 years. The other 50% of private market share is distributed among the other 35 active non‐life private insurers. Consequently, the non‐life insurance sector is considered quite over‐competitive with certain aggressive pricing techniques and low profit margins.
Insurance Sector (2013) Gross Premium
(PKR: mn) Insurance Penetration
InsuranceDensity PKR
InsuranceDensity US$
Life Insurance Sector 107,340 0.41% 570.96 5.73
(excluding family Takaful)
Non‐Life Insurance Sector 59,863 0.23% 318.42 3.19
(excluding general Takaful)
Family Takaful Sector 5,127 0.02% 27.27 0.27
General Takaful Sector 2,030 0.01% 10.8 0.11
Life Insurance Sector 112,468 0.43% 27.27 0.27
(including family Takaful)
Non‐Life Insurance Sector 61,893 0.24% 27.27 0.27
(including general Takaful)
Total 174,361 0.67% 927.45 9.3
*GDP 2013‐14 (MP) Current Basic Prices: PKR 26,001,895 million *Population 2013: 188.00million
Non‐life Insurance industry (including Takaful) grew at a pace of 16% (CAGR) in the last decade (2004‐2013). Despite that a declining growth rate trend of GWP is a bone of contention for the whole industry as the rate dropped from 42% in 2005 to 5% in 2012 and 9% in 2013 (source: industry).
“Growth rate has declined from 42pc in 2005‐06 to 9pc in 2013”
“3 classes of business make up over 74% of the total premium written for non‐life business”
“Lack of product innovation and ineffective product marketing remain the culprits of market expansion”

2
“‘Fire and Propclass of businethe insurance bMotor segmenmarket share i
“60% of the mcaptured by to2013”
“Bottom 25% ohardly able to the market sha
perty’ is the laress capturing 3business follownt, comprising in 2011”
arket share waop 4 companies
of the compancapture only 1are”
rgest 4% of wed by of 26%
as s in
ies is 1% of
Non‐Life In
Typically non‐classes of bus(iii) Motor. Infor non‐life bureduced in reyears, the groinflation; henof the non‐life
0
10
20
30
40
50
60
70
GWP in PKR
Billion
1%5%
surance Bus
‐life business issiness are founn 2013 these 3usiness. Howecent years, indowth rate in nce despite an e industry’s pre
2003
2004
2005
Non‐Li
27%
20%
Cl
siness Class‐
s short term wnd to be (i) Fir3 classes makever, in real terdicating a stagon‐life premiuaverage growtemium is facin
2006
2007
2008
ife Insurance In
ass‐wise indus(GWP
‐wise
with 12 month re & Property, up over 74% rms, the total pnant non‐life ium has not beth rate of apprng stagnation.
2008
2009
2010
ndustry: Perfor
33%
14%
try segmentatiP‐2013)
Friday, J
contracts in pl(ii) Marine & of the total prpremium writtnsurance marken able to maroximately 9%
2011
2012
2013
rmance
ion
Fire &
Mari
Moto
Liabl
Accid
Misc
July 04, 2014
AHCML
lace. The majoTransport, andremium writtenten has actuallyket. Over last 5atch the rate o, the real value
0%
5%
10%
15%
20%
25%
30%
35%
40%
45%
Growth Rate
& Property
ne & Transport
or
ity
dent & Health
ellaneous
4
L
or d n y 5 of e

2
“‘Fire and Propclass of businethe insurance bMotor segmenmarket share i
“60% of the mcaptured by to2013”
“Bottom 25pc hardly able to the market sha
perty’ is the laress capturing 3business follownt, comprising in 2011”
arket share waop 4 companies
of the compancapture only 1are”
rgest 4% of wed by of 26%
as s in
nies is 1pc of
Market Sha
Non‐life insurof the markethe market shmarket shareshared amonmarket shareand National share. It is alacompanies, ar
3%
37%
are: Oligopo
rance industry t being capturhare is capturee is distributedg 29 companie in non‐life inInsurance Comarming to obsere not able to
11%
oly with limit
depicts an oligred by a few med by top 4 cod among top 1ies. AICL rankensurance followmpany Limited erve that the bmake up to 1%
22%
11%
Marke(20
ted pricing p
gopolistic marmajor insurancmpanies. Addi10 companies ed 2nd in the wed by Jubileboth capturin
bottom 10 com% of market sha
16%
t Share013)
Friday, J
power
ket structure wce companies;ng further, abwhile the remFY13, capturie General Insung approximatempanies collectare in the indu
EFU General InCompany
Adamjee InsuraLimited
Jubilee GeneraLimited
National InsuraLimited
IGI Insurance Li
Others
July 04, 2014
AHCML
with larger par; about 60% oout 76% of themaining 24% iing 16% of theurance Limitedely 22% markeively, out of 39ustry.
surance
ance Company
l Insurance
ance Company
imited
4
L
rt of e s e d et 9

s
“AICL ranked 2companies inscapturing only
“Gross Writtengrowing as thecontinuously emanagement c
“Share of eachslightly changeyears”
2nd in the 39 urance sector y 16pc market s
n Premium is ne company experiences change”
h segment in Ged over the las
by share”
not
GWP has st 5
Adamjee In
AICL witnesseduring the prwhopping 63resulted fromlast 5 years. fairly stable dnegative, comshowing a hethe company related partieconcentration
Segment an
During the lasas being the insurance. Thcompany’s bu
‐40%
‐30%
‐20%
‐10%
0%
10%
36
Bu
Fire
Mar
Mot
Misc
nsurance: Co
ed meager 1%revious 5 year 3% in the samm increased ExpHowever, the during the sammission outealthy sign of iobtained appes which indicn risk to the or
nalysis
st 5 years Fire largest segm
hese two segusiness.
CAG
u
3
11%
18%
usiness SegmenGWP (2009)
& Property Dama
rine, Aviation & Tr
tor
cellaneous
ore business
% growth (CAGperiod; howe
me period. Sigpense ratio whClaims ratio (me period at tward outpacimprovement roximately 10%cate its less dganization.
Property & Daent of insurangments collect
GR (5 Years)
underwriting b
35%
1%
nts:
age
ransport
s
GR) in its Groever, Underwrignificant declhich increased Net Loss/Net around 65%. ed commissio14% over the % of the businependence on
amage (FPD) sence business itively contribu
business growth
3
B
Fir
Ma
Mo
Mi
Friday, J
oss Written Prting Income (Uine in underwfrom 17% to 2Written PremNet commiss
on inwards, h6 year periodness from the n associates th
egment overtoin 2013, followute more tha
h
Gross Wr
Net Prem
Net Claim
Expenses
Net Com
Underwr
7%2%
20%
Business SegmeGWP (2013)
re & Property Dam
arine, Aviation & T
otor
iscellaneous
July 04, 2014
AHCML
remium (GWPUI) declined bywriting income29% during theium) remainedsions remainedhowever, it id. Furthermoreassociated andhus minimizing
ok the positionwed by Moton 70% of the
ritten Premium
mium Revenue
ms Expense
s
mmission
riting Results
41%
ents: )
mage
Transport
4
L
P) y e e d d s e, d g
n or e
o
st
i
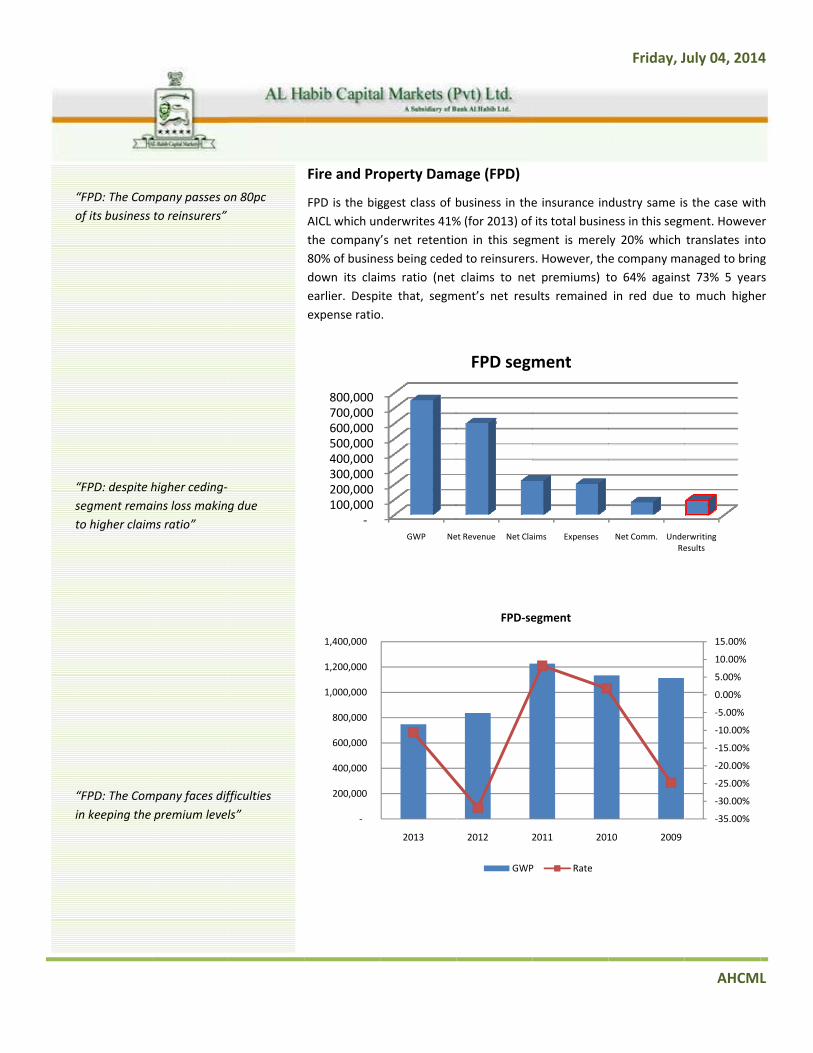
“FPD: The Comof its business
“FPD: despite hsegment remato higher claim
“FPD: The Comin keeping the
mpany passes oto reinsurers”
higher ceding‐ains loss makingms ratio”
mpany faces difpremium level
on 80pc
g due
fficulties ls”
Fire and Pro
FPD is the bigAICL which unthe company80% of businedown its claiearlier. Despiexpense ratio
‐
200,000
400,000
600,000
800,000
1,000,000
1,200,000
1,400,000
‐100,000 200,000 300,000 400,000 500,000 600,000 700,000 800,000
operty Dam
ggest class of bnderwrites 41%’s net retentioess being cedems ratio (net ite that, segm.
2013
GWP Ne
age (FPD)
business in the% (for 2013) of on in this segmd to reinsurersclaims to net
ment’s net resu
2012 2
FPD‐se
GWP
et Revenue Net Cla
FPD segm
e insurance inits total businment is merels. However, tht premiums) tults remained
2011 201
egment
P Rate
aims Expenses
ment
Friday, J
dustry same isess in this segmly 20% which e company mato 64% againsin red due to
10 2009
Net Comm. UndeRe
July 04, 2014
AHCML
s the case withment. Howevetranslates intoanaged to bringst 73% 5 yearo much highe
‐35.00%
‐30.00%
‐25.00%
‐20.00%
‐15.00%
‐10.00%
‐5.00%
0.00%
5.00%
10.00%
15.00%
erwriting esults
4
L
h er o g rs er
o
dr
o
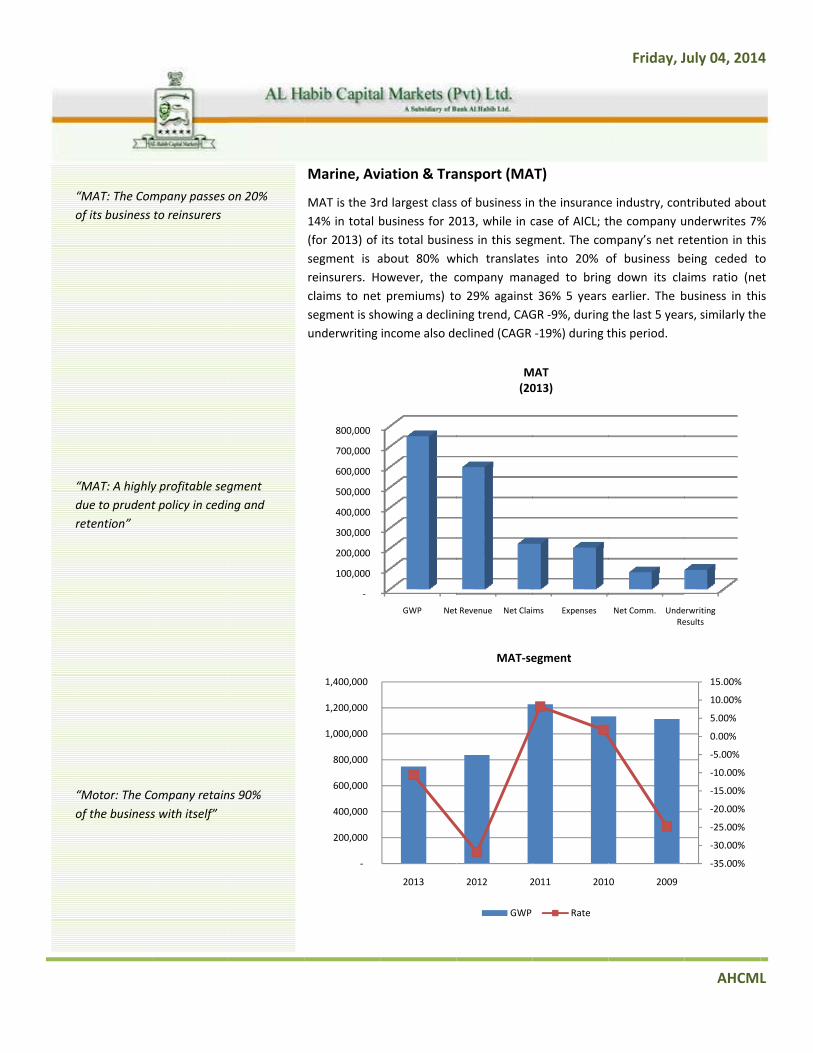
“MAT: The Comof its business
“MAT: A highlydue to prudentretention”
“Motor: The Coof the business
mpany passes to reinsurers
y profitable segt policy in cedin
ompany retains with itself”
on 20%
gment ng and
ns 90%
Marine, Av
MAT is the 3r14% in total b(for 2013) of segment is areinsurers. Hclaims to netsegment is shunderwriting
‐
100,000
200,000
300,000
400,000
500,000
600,000
700,000
800,000
‐
200,000
400,000
600,000
800,000
1,000,000
1,200,000
1,400,000
viation & Tra
rd largest classbusiness for 20its total businabout 80% wowever, the ct premiums) toowing a declinincome also de
GWP Net
2013
ansport (MA
s of business in013, while in cess in this seghich translatecompany mano 29% againstning trend, CAGeclined (CAGR
t Revenue Net Clai
M(20
2012 2
MAT‐se
GWP
AT)
n the insurancecase of AICL; tgment. The comes into 20% onaged to bringt 36% 5 years GR ‐9%, during‐19%) during t
ms Expenses
MAT013)
2011 201
egment
Rate
Friday, J
e industry, conthe company umpany’s net reof business bg down its claearlier. The b the last 5 yeathis period.
Net Comm. UndeRe
0 2009
July 04, 2014
AHCML
ntributed abouunderwrites 7%etention in thieing ceded toaims ratio (nebusiness in thirs, similarly the
erwriting esults
‐35.00%
‐30.00%
‐25.00%
‐20.00%
‐15.00%
‐10.00%
‐5.00%
0.00%
5.00%
10.00%
15.00%
4
L
ut % s o et s e

s
s
t
“Motor: declinhelping compasegment profit
“Motor: segmestagnation”
“Misc: The Comthe business w
ning claims ratiany to keep thitable”
ent also faced
mpany retains with itself”
ios is
with
59% of
Motor
Motor insuracontributed ahas underwritnet retentionbeing ceded treaches up‐tohighest net cremain in redThe profitabilother businesMotor segmethe insurance
500,00
1,000,00
1,500,00
2,000,00
‐
500,000
1,000,000
1,500,000
2,000,000
2,500,000
3,000,000
ance is the 2rbout 27% in totten 32% (for 2n in this segmeto reinsurers. o 58% making claims in termd as it continuelity in this segss segments. Tent stands at 2e company.
‐
00
00
00
00
GWP
2013
rd largest clasotal business fo2013) of its totent is about 8The company’a segment has of volume. e to hold on tgment depicts The underwrit28% in FY13 wh
Net Revenue Net C
Mo(20
2012
Motor‐
GWP
ss of businessor 2013, while tal business in 89% which tran’s claims ratio aving the 2nd Company’s neto its higher nea consoling piting income tohich is second
Claims Expenses
otor013)
2011 20
segment
P Rate
Friday, J
s in the insurin case of AICLthis segment. nslates into 11(net claims tohighest net clet commissionet retention inicture as compo gross writtenmost profitab
Net Comm. UndR
10 2009
July 04, 2014
AHCML
rance industryL; the companyThe company’1% of busineso net premiumlaims ratio and is expected on this segmentpared to a fewn premium foble segment fo
erwriting Results
‐30.00%
‐20.00%
‐10.00%
0.00%
10.00%
20.00%
30.00%
40.00%
4
L
y, y s s
m) d o t. w or or

pr
s
“Misc: Claims rtrend during th
“Misc: despite premiums the remains depreexpense ratio”
“Misc: segmenstagnation”
ratio on the dehe last 5 years
high written underwriting iessed due to hig”
nt also faced w
eclining ”
income gher
with
Miscellaneo
Miscellaneouindustry, contcompany has The companyof business bepremium) camthan the comcommission ibetween cedeto remain subhere that thcompany’s les
500,00
1,000,00
1,500,00
2,000,00
‐
500,000
1,000,000
1,500,000
2,000,000
2,500,000
3,000,000
ous
s insurance segtributed aboutalso underwri
y’s net retentioeing ceded to me down to 43mpany’s aggregs expected toent and the rebdued keepinge segment’s sser focus on t
‐
00
00
00
00
GWP
2013
gment is the 3t 20% in total bitten 20% (for on in this segmreinsurers. The3% from 55% fgate claims rato remain meaninsures. The pg in view the hgrowth is shohis segment.
Net Revenue Net C
Miscel(20
2012 2
Misc‐se
GWP
rd largest classbusiness for 202013) of its toent is about 59e company’s cive years earlieio i.e. 64%. In ningless as therofitability in thistorical resulowing a decl
Claims Expenses
laneous013)
2011 201
egment
Rate
Friday, J
s of business in013, while in caotal business in9% which tranclaims ratio (neer which is signthis segment e business is this segment ists. It is pertineining trend w
Net Comm. UndeR
10 2009
July 04, 2014
AHCML
n the insurancease of AICL; then this segmentslates into 41%et claims to nenificantly lowecompany’s neequally shareds also expectedent to mentionwhich indicate
erwriting esults
‐30.00%
‐20.00%
‐10.00%
0.00%
10.00%
20.00%
30.00%
40.00%
4
L
e e t. % et er et d d n s

f
“Portfolio valuthe fair value o
“MCB value cofair value of th
“BUY with 33p
ue constitutes 7of the company
onstitutes 32pche company”
pc upside poten
75pc of y”
c of the
ntial”
Portfolio Va
Equity portfoheld in the associates). Tquoted equitsecurities‐for Government carrying valucompany’s inv
It is pertinentholdings as pThe value of portfolio, conchange in MCchange in MC
Recommen
AICL is tradin33pc, which r
38%
alue: Gems
lio has been oquoted equityTherefore, we ty investmentswhich we havsecurities and e in the balanvested portfoli
t to note thatortfolio value MCB bank remntributing aboCB bank’s fair vCB bank’s value
ndation: BUY
ng at PKR 47.5equires us to a
55%5%
and Pearls
objectively valuy investment have applieds of both AFSve used our min unquoted cnce sheet theio.
the fair valueconstitutes momains the majoout 32pc in covalue may havee will change A
Y
8 on July 3, 2assign a ‘BUY’ r
6%5%
Top 5‐ Portf(Based on m
ue; consideringportfolio (bo
d a 25% discoS and associatmodel based facompanies (asereby arriving
e of AICL is higore than 75pcor value driverompany’s fair e a significant AICL’s fair value
014 closing, orating for the s
41%
folio Holdingsmarket value)
Friday, J
g the illiquidityoth AFS and iunt on the mtes (excludingir value), and sociates) haveat the approp
ghly sensitive of the compar for the compvalue. So animpact on AICe by 1.80pc.
offering a potestock.
MCB Bank
United Ba
MCB CashOptimizer
MCB Dyna
Fauji FertiLimited
Others
July 04, 2014
AHCML
y of the shareinvestments inmarket price og certain listedinvestments ine been taken apriate value o
to its portfolioany’s fair valuepany’s investedy fundamentaL’s value, a 5p
ential upside o
k Limited
nk Limited
h Management r Fund
amic Cash Fund
lizer Company
4
L
es n of d n at of
o e. d al c
of
Friday, July 04, 2014
AHCML
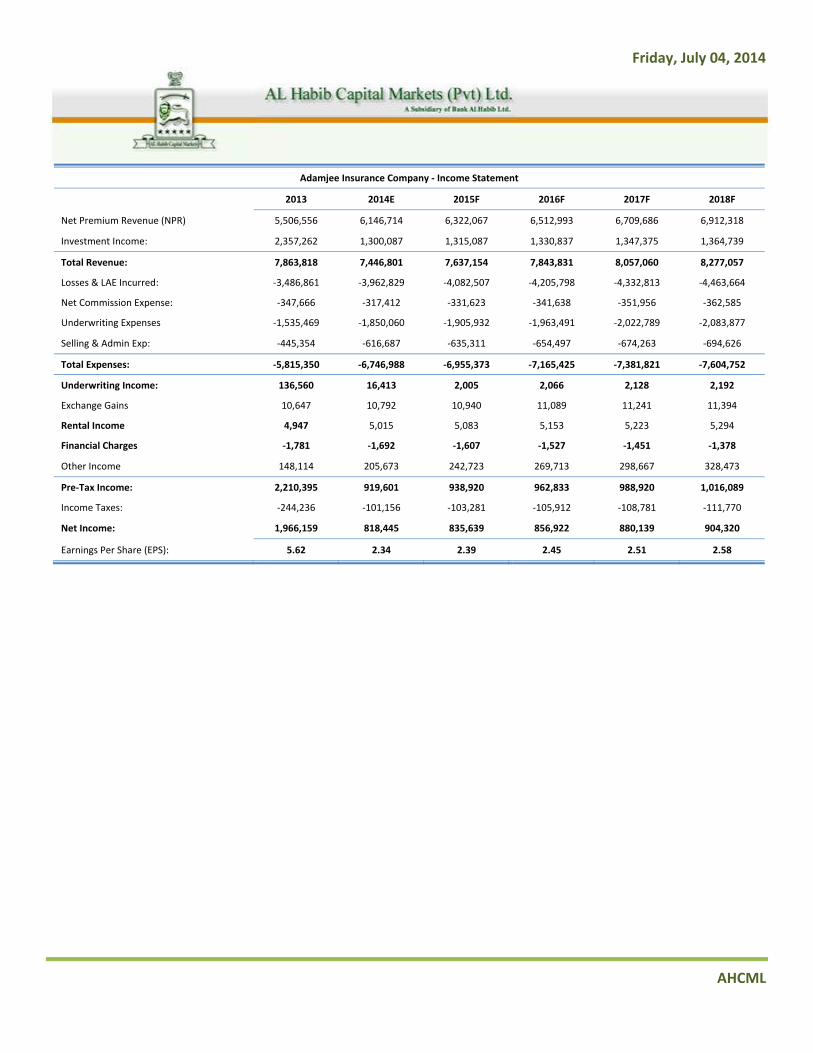
Adamjee Insurance Company ‐ Income Statement
2013 2014E 2015F 2016F 2017F 2018F
Net Premium Revenue (NPR) 5,506,556 6,146,714 6,322,067 6,512,993 6,709,686 6,912,318
Investment Income: 2,357,262 1,300,087 1,315,087 1,330,837 1,347,375 1,364,739
Total Revenue: 7,863,818 7,446,801 7,637,154 7,843,831 8,057,060 8,277,057
Losses & LAE Incurred: ‐3,486,861 ‐3,962,829 ‐4,082,507 ‐4,205,798 ‐4,332,813 ‐4,463,664
Net Commission Expense: ‐347,666 ‐317,412 ‐331,623 ‐341,638 ‐351,956 ‐362,585
Underwriting Expenses ‐1,535,469 ‐1,850,060 ‐1,905,932 ‐1,963,491 ‐2,022,789 ‐2,083,877
Selling & Admin Exp: ‐445,354 ‐616,687 ‐635,311 ‐654,497 ‐674,263 ‐694,626
Total Expenses: ‐5,815,350 ‐6,746,988 ‐6,955,373 ‐7,165,425 ‐7,381,821 ‐7,604,752
Underwriting Income: 136,560 16,413 2,005 2,066 2,128 2,192
Exchange Gains 10,647 10,792 10,940 11,089 11,241 11,394
Rental Income 4,947 5,015 5,083 5,153 5,223 5,294
Financial Charges ‐1,781 ‐1,692 ‐1,607 ‐1,527 ‐1,451 ‐1,378
Other Income 148,114 205,673 242,723 269,713 298,667 328,473
Pre‐Tax Income: 2,210,395 919,601 938,920 962,833 988,920 1,016,089
Income Taxes: ‐244,236 ‐101,156 ‐103,281 ‐105,912 ‐108,781 ‐111,770
Net Income: 1,966,159 818,445 835,639 856,922 880,139 904,320
Earnings Per Share (EPS): 5.62 2.34 2.39 2.45 2.51 2.58
Friday, July 04, 2014
AHCML
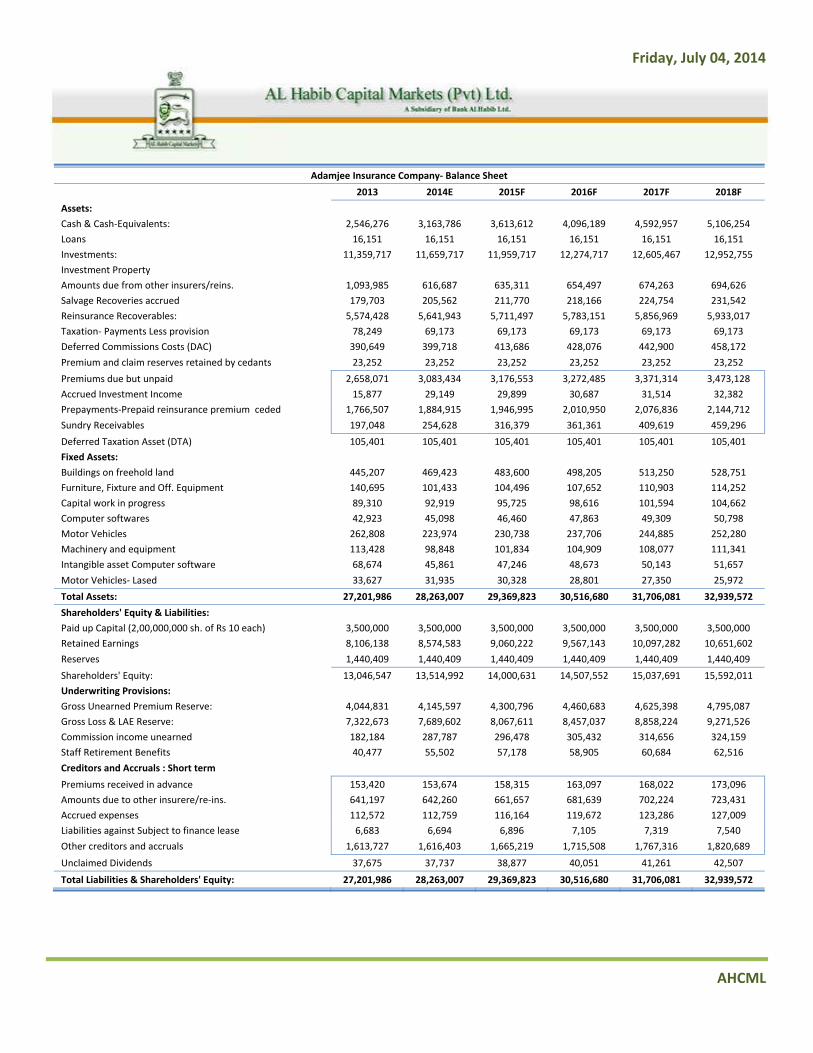
Adamjee Insurance Company‐ Balance Sheet
2013 2014E 2015F 2016F 2017F 2018F
Assets:
Cash & Cash‐Equivalents: 2,546,276 3,163,786 3,613,612 4,096,189 4,592,957 5,106,254
Loans 16,151 16,151 16,151 16,151 16,151 16,151
Investments: 11,359,717 11,659,717 11,959,717 12,274,717 12,605,467 12,952,755
Investment Property
Amounts due from other insurers/reins. 1,093,985 616,687 635,311 654,497 674,263 694,626
Salvage Recoveries accrued 179,703 205,562 211,770 218,166 224,754 231,542
Reinsurance Recoverables: 5,574,428 5,641,943 5,711,497 5,783,151 5,856,969 5,933,017
Taxation‐ Payments Less provision 78,249 69,173 69,173 69,173 69,173 69,173
Deferred Commissions Costs (DAC) 390,649 399,718 413,686 428,076 442,900 458,172
Premium and claim reserves retained by cedants 23,252 23,252 23,252 23,252 23,252 23,252
Premiums due but unpaid 2,658,071 3,083,434 3,176,553 3,272,485 3,371,314 3,473,128
Accrued Investment Income 15,877 29,149 29,899 30,687 31,514 32,382
Prepayments‐Prepaid reinsurance premium ceded 1,766,507 1,884,915 1,946,995 2,010,950 2,076,836 2,144,712
Sundry Receivables 197,048 254,628 316,379 361,361 409,619 459,296
Deferred Taxation Asset (DTA) 105,401 105,401 105,401 105,401 105,401 105,401
Fixed Assets:
Buildings on freehold land 445,207 469,423 483,600 498,205 513,250 528,751
Furniture, Fixture and Off. Equipment 140,695 101,433 104,496 107,652 110,903 114,252
Capital work in progress 89,310 92,919 95,725 98,616 101,594 104,662
Computer softwares 42,923 45,098 46,460 47,863 49,309 50,798
Motor Vehicles 262,808 223,974 230,738 237,706 244,885 252,280
Machinery and equipment 113,428 98,848 101,834 104,909 108,077 111,341
Intangible asset Computer software 68,674 45,861 47,246 48,673 50,143 51,657
Motor Vehicles‐ Lased 33,627 31,935 30,328 28,801 27,350 25,972
Total Assets: 27,201,986 28,263,007 29,369,823 30,516,680 31,706,081 32,939,572
Shareholders' Equity & Liabilities:
Paid up Capital (2,00,000,000 sh. of Rs 10 each) 3,500,000 3,500,000 3,500,000 3,500,000 3,500,000 3,500,000
Retained Earnings 8,106,138 8,574,583 9,060,222 9,567,143 10,097,282 10,651,602
Reserves 1,440,409 1,440,409 1,440,409 1,440,409 1,440,409 1,440,409
Shareholders' Equity: 13,046,547 13,514,992 14,000,631 14,507,552 15,037,691 15,592,011
Underwriting Provisions:
Gross Unearned Premium Reserve: 4,044,831 4,145,597 4,300,796 4,460,683 4,625,398 4,795,087
Gross Loss & LAE Reserve: 7,322,673 7,689,602 8,067,611 8,457,037 8,858,224 9,271,526
Commission income unearned 182,184 287,787 296,478 305,432 314,656 324,159
Staff Retirement Benefits 40,477 55,502 57,178 58,905 60,684 62,516
Creditors and Accruals : Short term
Premiums received in advance 153,420 153,674 158,315 163,097 168,022 173,096
Amounts due to other insurere/re‐ins. 641,197 642,260 661,657 681,639 702,224 723,431
Accrued expenses 112,572 112,759 116,164 119,672 123,286 127,009
Liabilities against Subject to finance lease 6,683 6,694 6,896 7,105 7,319 7,540
Other creditors and accruals 1,613,727 1,616,403 1,665,219 1,715,508 1,767,316 1,820,689
Unclaimed Dividends 37,675 37,737 38,877 40,051 41,261 42,507
Total Liabilities & Shareholders' Equity: 27,201,986 28,263,007 29,369,823 30,516,680 31,706,081 32,939,572
Friday, July 04, 2014
AHCML
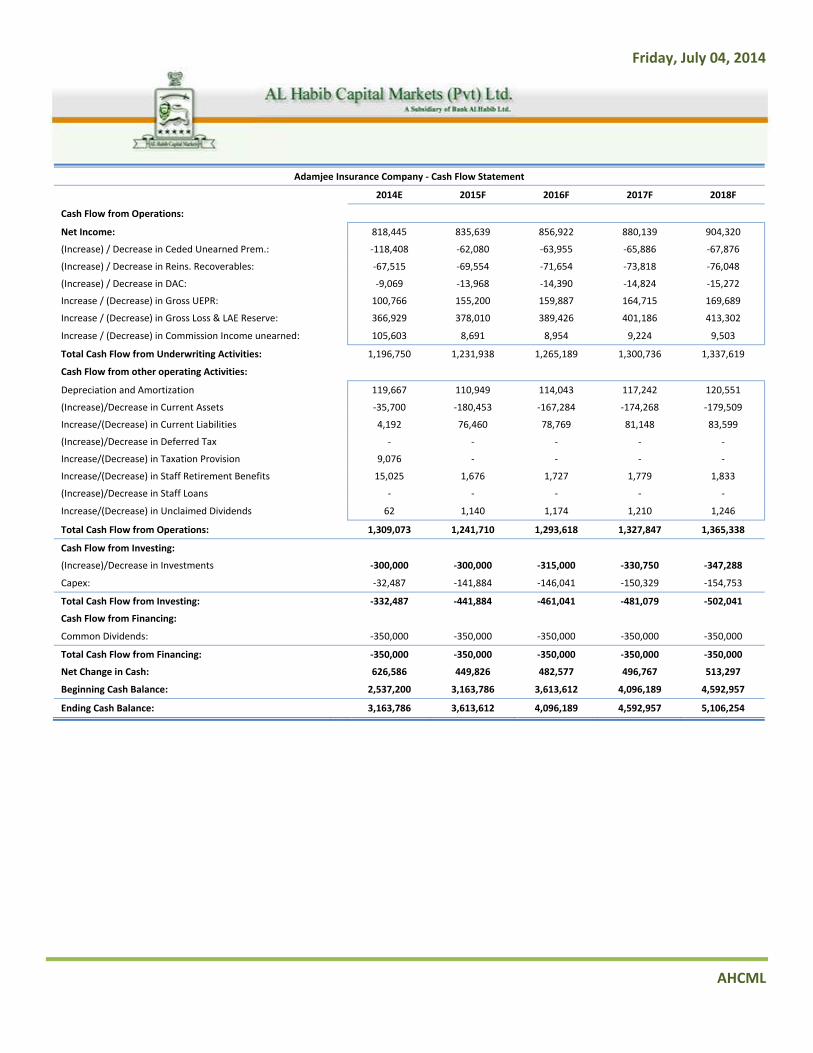
Adamjee Insurance Company ‐ Cash Flow Statement
2014E 2015F 2016F 2017F 2018F
Cash Flow from Operations:
Net Income: 818,445 835,639 856,922 880,139 904,320
(Increase) / Decrease in Ceded Unearned Prem.: ‐118,408 ‐62,080 ‐63,955 ‐65,886 ‐67,876
(Increase) / Decrease in Reins. Recoverables: ‐67,515 ‐69,554 ‐71,654 ‐73,818 ‐76,048
(Increase) / Decrease in DAC: ‐9,069 ‐13,968 ‐14,390 ‐14,824 ‐15,272
Increase / (Decrease) in Gross UEPR: 100,766 155,200 159,887 164,715 169,689
Increase / (Decrease) in Gross Loss & LAE Reserve: 366,929 378,010 389,426 401,186 413,302
Increase / (Decrease) in Commission Income unearned: 105,603 8,691 8,954 9,224 9,503
Total Cash Flow from Underwriting Activities: 1,196,750 1,231,938 1,265,189 1,300,736 1,337,619
Cash Flow from other operating Activities:
Depreciation and Amortization 119,667 110,949 114,043 117,242 120,551
(Increase)/Decrease in Current Assets ‐35,700 ‐180,453 ‐167,284 ‐174,268 ‐179,509
Increase/(Decrease) in Current Liabilities 4,192 76,460 78,769 81,148 83,599
(Increase)/Decrease in Deferred Tax ‐ ‐ ‐ ‐ ‐
Increase/(Decrease) in Taxation Provision 9,076 ‐ ‐ ‐ ‐
Increase/(Decrease) in Staff Retirement Benefits 15,025 1,676 1,727 1,779 1,833
(Increase)/Decrease in Staff Loans ‐ ‐ ‐ ‐ ‐
Increase/(Decrease) in Unclaimed Dividends 62 1,140 1,174 1,210 1,246
Total Cash Flow from Operations: 1,309,073 1,241,710 1,293,618 1,327,847 1,365,338
Cash Flow from Investing:
(Increase)/Decrease in Investments ‐300,000 ‐300,000 ‐315,000 ‐330,750 ‐347,288
Capex: ‐32,487 ‐141,884 ‐146,041 ‐150,329 ‐154,753
Total Cash Flow from Investing: ‐332,487 ‐441,884 ‐461,041 ‐481,079 ‐502,041
Cash Flow from Financing:
Common Dividends: ‐350,000 ‐350,000 ‐350,000 ‐350,000 ‐350,000
Total Cash Flow from Financing: ‐350,000 ‐350,000 ‐350,000 ‐350,000 ‐350,000
Net Change in Cash: 626,586 449,826 482,577 496,767 513,297
Beginning Cash Balance: 2,537,200 3,163,786 3,613,612 4,096,189 4,592,957
Ending Cash Balance: 3,163,786 3,613,612 4,096,189 4,592,957 5,106,254

Friday, July 04, 2014
AHCML
Disclaimer All rights reserved. The information presented in this report is compiled from sources we believed to be reliable in preparation of this report. However, we do not accept any responsibility for its accuracy and completeness. This report is not intended to be an offer or solicitation to buy or sell any security. AL Habib Capital Markets (Pvt.) Ltd. and its employees may or may not have a position in or with respect to the securities mentioned in this report. In particular, the report takes no account of investment objectives, financial situation & particular needs of investors who should seek further professional advice or rely upon their own judgment before making any investment.
Muhammad Ali Khan Senior Investment Analyst [email protected]
Abdul Samad Supervising Officer [email protected]
Head Office: GF‐01, Techno City, Hasrat Mohani Road, Karachi Ph: +92 21 32270808‐13 Fax: +92 21 32270519
Stock Office: Room No. 16 Ground Floor, New Stock Exchange Bldg., Stock Exchange Road, Karachi Ph: +92 21 32460867‐ 32460869