Embed Size (px)
DESCRIPTION
Citation preview
LeadershipResponsibilityPerformance
Access Bank PlcAnnual Report and Accounts 2012

Contents
Pg 18-19Retail Banking
Pg 20-21Commercial
Banking
Pg 26-27Transaction
Banking Division
Pg 32-37Corporate Social Responsibility
Pg 15 Chief Executive’s
Review
OverviewBuilding Africa’s most respected Bank 01Business and Financial Highlights 08At a Glance 10Locations and Offices 12Chairman’s Statement 14Chief Executive’s Review 15
Business ReviewCorporate Philosophy 16Reports of the External Consultant 17Retail Banking 18Commercial Banking 20Institutional Banking 22Financial Markets 24Transaction Banking 26IT Services 28Our People, Culture and Diversity 30Corporate Social Responsibility 32Managing Risk for a Sustainable Future 38
GovernanceBoard of Directors 81Directors, Officers and Advisors 85Management Team 86Directors’ Report 88Directors’ Responsibilities and Statutory Audit Committee Report 94Corporate Governance 95
Financial StatementsIndependent Auditor’s Report 103Consolidated Statement of Financial Position 104Consolidated Statement of Comprehensive Income 105Consolidated Statement of Changes in Equity 106Consolidated Statement of Cash Flows 110Notes to the Group Financial Statements 112Statement of Significant Accounting Policies 113Value Added Statement 182Five-Year Financial Summary – Group 182
Shareholder InformationNotice of Annual General Meeting 184Explanatory Notes to the Proposed Resolutions 185Capital Formation History 187E-dividend Mandate Form 189Shareholder Information Update Form 191Proxy Form 193
Corporate InformationCorporate Directory 195
Overview
01Access Bank Plc Annual Report and Accounts 2012
LeadershipWe apply international best practice, pioneer new standards, break new ground and challenge the status quo. We are determined to build the world’s most respected African bank.
ResponsibilityWe see it as our duty to help grow local communities and the real economy. We are determined to balance economic, environmental and social considerations in our work.
PerformanceWe surpass our targets, set new records and create new values in our industry and beyond. We have overcome many hurdles and are the best in all that we do.
Welcome to Access Bank
As we pursue our vision to be the world’s most respected African bank, we are experiencing an exciting period of development. We are determined to show true leadership, take responsibility for delivering positive outcomes to our Stakeholders, and be the very best in all that we do.
See pages 02-03For further information
See pages 04-05For further information
See pages 06-07For further information

02 Access Bank Plc Annual Report and Accounts 2012Access Bank Plc Annual Report and Accounts 201202
Pages 14-16For further information
We are focused on creating a responsible financial organisation that will be the pride of Africa.
At Access Bank we translate vision into reality. We are focused on leading by example throughout Africa. We apply international best practice, pioneer new standards, break new grounds, cross new frontiers and challenge the status quo.
We are determined to be the best and build the world’s most respected African bank. Our goal is to secure the future by building a sustainable business that brings prosperity to our stakeholders and the African continent.
Leadership

Overview
03Access Bank Plc Annual Report and Accounts 2012

04 Access Bank Plc Annual Report and Accounts 2012

As a bank of best practice, we have a responsibility to the society. We see it as our duty to help grow local communities and the real economy through the provision of capital, which in turn drives infrastructure development, creates jobs, and enables companies and individuals to purchase goods and do business every day.
We are determined to drive profitable and ethical economic growth that is environmentally responsible and socially relevant. We will be a force for good in all that we do. We take personal responsibility for delivering outcomes to our respective stakeholders. We are fully committed to our day-to-day actions and business decisions, and remain determined to balance economic, environmental and social considerations in our work.
Responsibility
Pages 32-37For further information
As a responsible organisation, we have aligned the way we manage our environmental impacts with global best environmental standards.
Overview
05Access Bank Plc Annual Report and Accounts 2012

Pages 24-27For further information
Our commitment to supporting economic growth is as strong as ever. We have consistently surpassed
our targets, set new records and created new values in our industry and beyond. We embody the change we want to see and have continuously created new opportunities to secure the prosperity of the Bank and its stakeholders. We have also mastered our operating environment and benchmarked our goals against the best. We have overcome many hurdles and are proud of our unique achievements. We are the best in all that we do.
Performance
06 Access Bank Plc Annual Report and Accounts 2012
Overview
07Access Bank Plc Annual Report and Accounts 2012
08 Access Bank Plc Annual Report and Accounts 2012
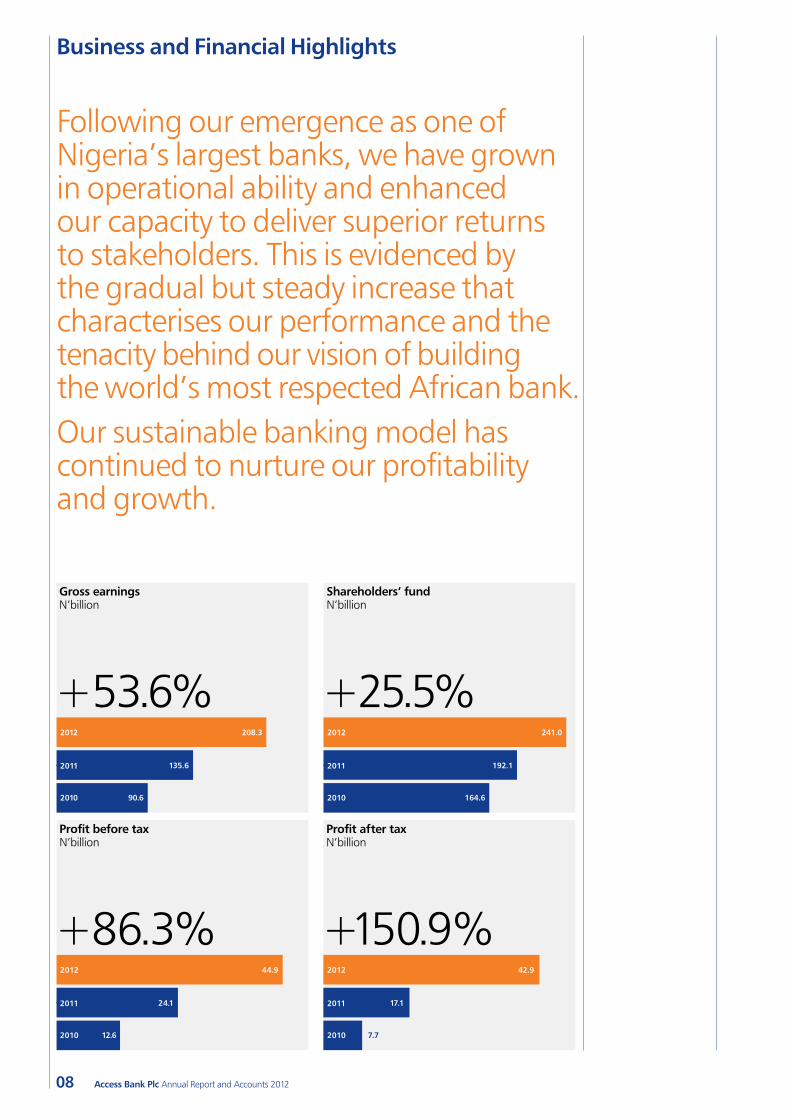
Following our emergence as one of Nigeria’s largest banks, we have grown in operational ability and enhanced our capacity to deliver superior returns to stakeholders. This is evidenced by the gradual but steady increase that characterises our performance and the tenacity behind our vision of building the world’s most respected African bank.Our sustainable banking model has continued to nurture our profitability and growth.
Business and Financial Highlights
Gross earningsN’billion
+53.6%2012
2011
2010
208.3
135.6
90.6
Shareholders’ fundN’billion
2012
2011
2010
241.0
192.1
164.6
+25.5%
Profit before taxN’billion
2012
2011
2010
44.9
24.1
12.6
+86.3%
Profit after taxN’billion
2012
2011
2010
42.9
17.1
7.7
+150.9%
Overview
09Access Bank Plc Annual Report and Accounts 2012
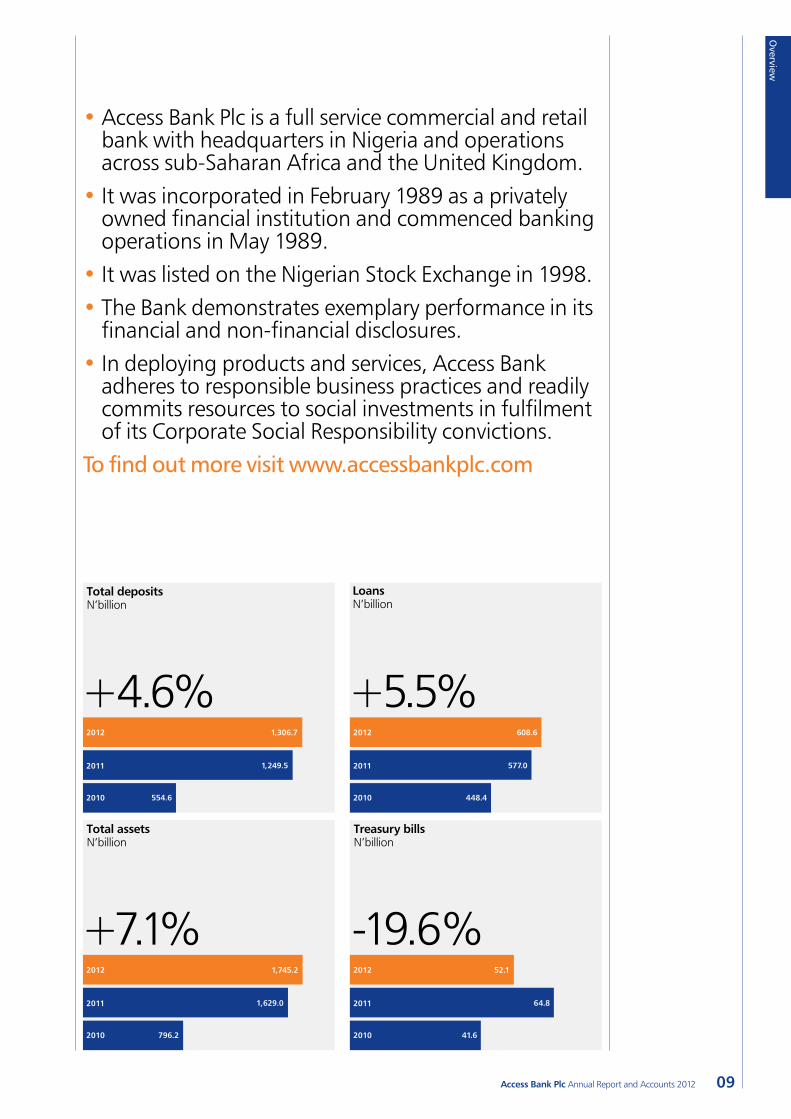
• Access Bank Plc is a full service commercial and retail bank with headquarters in Nigeria and operations across sub-Saharan Africa and the United Kingdom.
• It was incorporated in February 1989 as a privately owned financial institution and commenced banking operations in May 1989.
• It was listed on the Nigerian Stock Exchange in 1998.• The Bank demonstrates exemplary performance in its
financial and non-financial disclosures.• In deploying products and services, Access Bank
adheres to responsible business practices and readily commits resources to social investments in fulfilment of its Corporate Social Responsibility convictions.
To find out more visit www.accessbankplc.com
Total depositsN’billion
2012
2011
2010
1,306.7
1,249.5
554.6
+4.6%
LoansN’billion
2012
2011
2010
608.6
577.0
448.4
+5.5%
Total assetsN’billion
2012
2011
2010
1,745.2
1,629.0
796.2
+7.1%
Treasury billsN’billion
2012
2011
2010
52.1
64.8
41.6
-19.6%
10 Access Bank Plc Annual Report and Accounts 2012
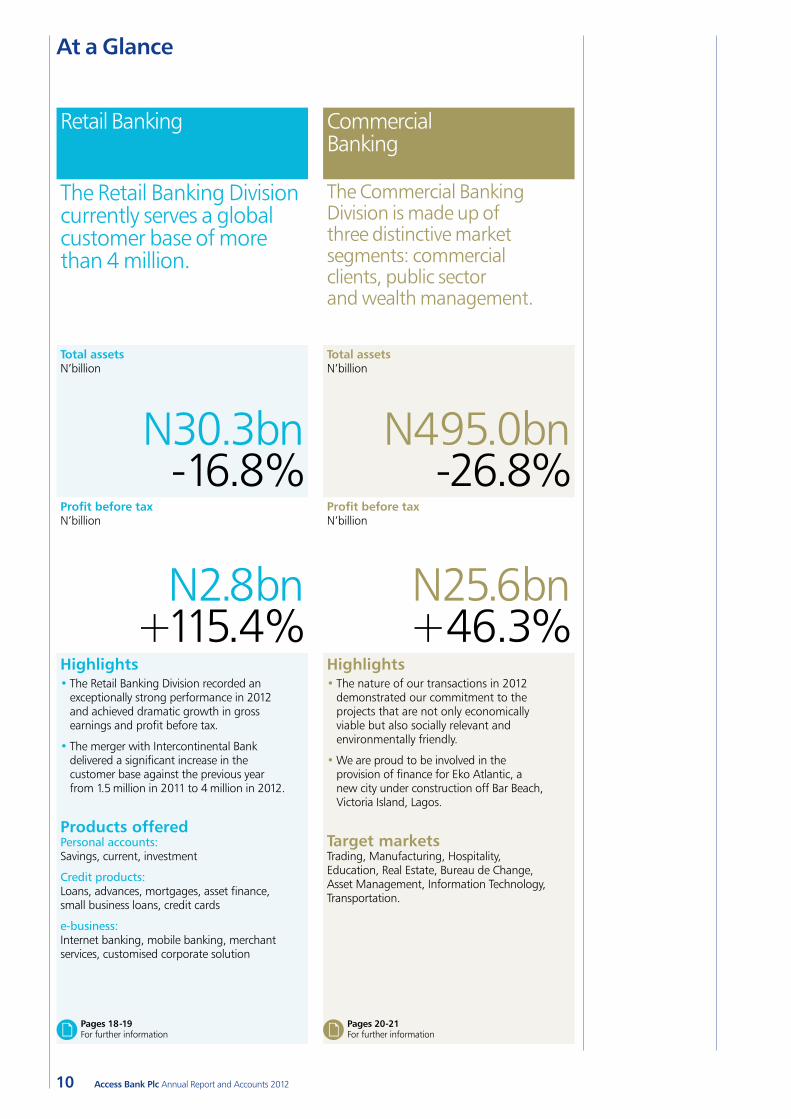
At a Glance
Retail Banking Commercial Banking
The Retail Banking Division currently serves a global customer base of more than 4 million.
The Commercial Banking Division is made up of three distinctive market segments: commercial clients, public sector and wealth management.
Total assetsN’billion
Total assetsN’billion
N30.3bn -16.8%
N495.0bn -26.8%
Profit before taxN’billion
Profit before taxN’billion
N2.8bn +115.4%
N25.6bn +46.3%
Highlights • The Retail Banking Division recorded an
exceptionally strong performance in 2012 and achieved dramatic growth in gross earnings and profit before tax.
• The merger with Intercontinental Bank delivered a significant increase in the customer base against the previous year from 1.5 million in 2011 to 4 million in 2012.
Products offeredPersonal accounts: Savings, current, investment
Credit products: Loans, advances, mortgages, asset finance, small business loans, credit cards
e-business: Internet banking, mobile banking, merchant services, customised corporate solution
Highlights• The nature of our transactions in 2012
demonstrated our commitment to the projects that are not only economically viable but also socially relevant and environmentally friendly.
•We are proud to be involved in the provision of finance for Eko Atlantic, a new city under construction off Bar Beach, Victoria Island, Lagos.
Target marketsTrading, Manufacturing, Hospitality, Education, Real Estate, Bureau de Change, Asset Management, Information Technology, Transportation.
Pages 18-19For further information
Pages 20-21For further information
Overview
11Access Bank Plc Annual Report and Accounts 2012
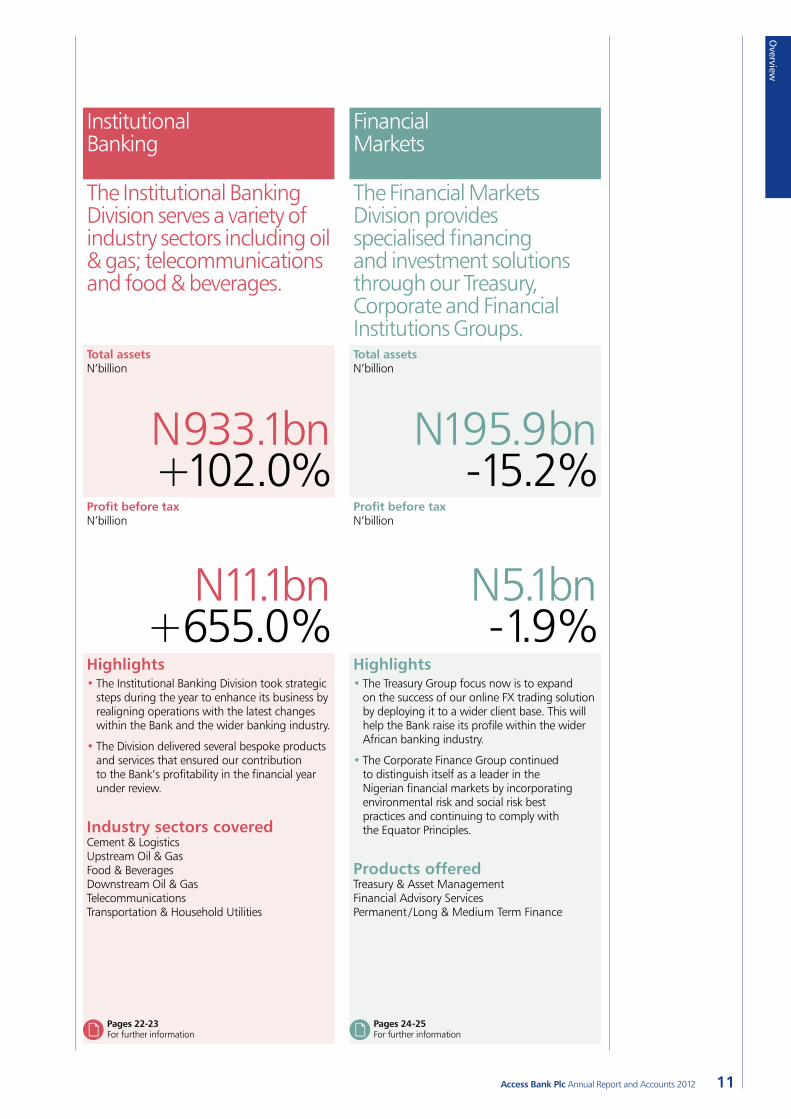
Institutional Banking
Financial Markets
The Institutional Banking Division serves a variety of industry sectors including oil & gas; telecommunications and food & beverages.
The Financial Markets Division provides specialised financing and investment solutions through our Treasury, Corporate and Financial Institutions Groups.
Total assetsN’billion
Total assetsN’billion
N933.1bn +102.0%
N195.9bn -15.2%
Profit before taxN’billion
Profit before taxN’billion
N11.1bn +655.0%
N5.1bn -1.9%
Highlights• The Institutional Banking Division took strategic
steps during the year to enhance its business by realigning operations with the latest changes within the Bank and the wider banking industry.
• The Division delivered several bespoke products and services that ensured our contribution to the Bank’s profitability in the financial year under review.
Industry sectors coveredCement & Logistics Upstream Oil & Gas Food & Beverages Downstream Oil & Gas Telecommunications Transportation & Household Utilities
Highlights• The Treasury Group focus now is to expand
on the success of our online FX trading solution by deploying it to a wider client base. This will help the Bank raise its profile within the wider African banking industry.
• The Corporate Finance Group continued to distinguish itself as a leader in the Nigerian financial markets by incorporating environmental risk and social risk best practices and continuing to comply with the Equator Principles.
Products offeredTreasury & Asset ManagementFinancial Advisory ServicesPermanent /Long & Medium Term Finance
Pages 22-23For further information
Pages 24-25For further information

12 Access Bank Plc Annual Report and Accounts 2012
Locations and Offices
We are one of the largest banks in Nigeria and serve 5.7 million customers from 345 branches.
Ghana
Zambia
United Kingdom
Rwanda
Nigeria
1 Nigeria2 United Kingdom3 Ghana4 Zambia5 Rwanda6 The Gambia7 Democratic Republic
of the Congo8 Sierra Leone9 Côte d’Ivoire10 Burundi
Number of branches 310Total Staff 11,670Number of accounts 5,994,660
Number of branches 3Total Staff 83Number of accounts 1,369
Number of branches 32Total Staff 757Number of accounts 200,410
Number of branches 5Total Staff 126Number of accounts 16,193
Number of branches 7Total Staff 159Number of accounts 16,052
1
2
3
4
5
2
68 9
31
7 510
4

Overview
13Access Bank Plc Annual Report and Accounts 2012
The Bank is licensed to carry out international banking services and provides a comprehensive range of financial services. The key business segments of the Bank are: Institutional Banking, Commercial and Consumer Banking, Financial Banking and Private Banking. The key customer segments include: Telecommunications, Beverages, Manufacturing, Construction, Oil & Gas, Parastatals, High Net Worth Individuals and Middle Income Professionals.
We take pride in our ability to add value to clients, leveraging our unique value proposition to provide innovative and proactive solutions across entire economic value chains. In deploying products and services, the Bank adheres to responsible business practices and readily commits resources to social investments in fulfilment of its corporate social responsibility convictions.
We are located in all major commercial centres and cities across Nigeria, eight other African countries and the United Kingdom.
For more about the Bank’s sustainable business practices, visit www.accessbankplc.com
Sierra Leone
Côte d’Ivoire
Democratic Republic of the Congo
Burundi
The Gambia
6
7
8
9
10
Number of branches 5Total Staff 133Number of accounts 50,971
Number of branches 2Total Staff 79Number of accounts 48,070
Number of branches 4Total Staff 86Number of accounts 11,771
Number of branches 2Total Staff 52Number of accounts 10,524
Number of branches 6Total Staff 96Number of accounts 5,582
14 Access Bank Plc Annual Report and Accounts 2012
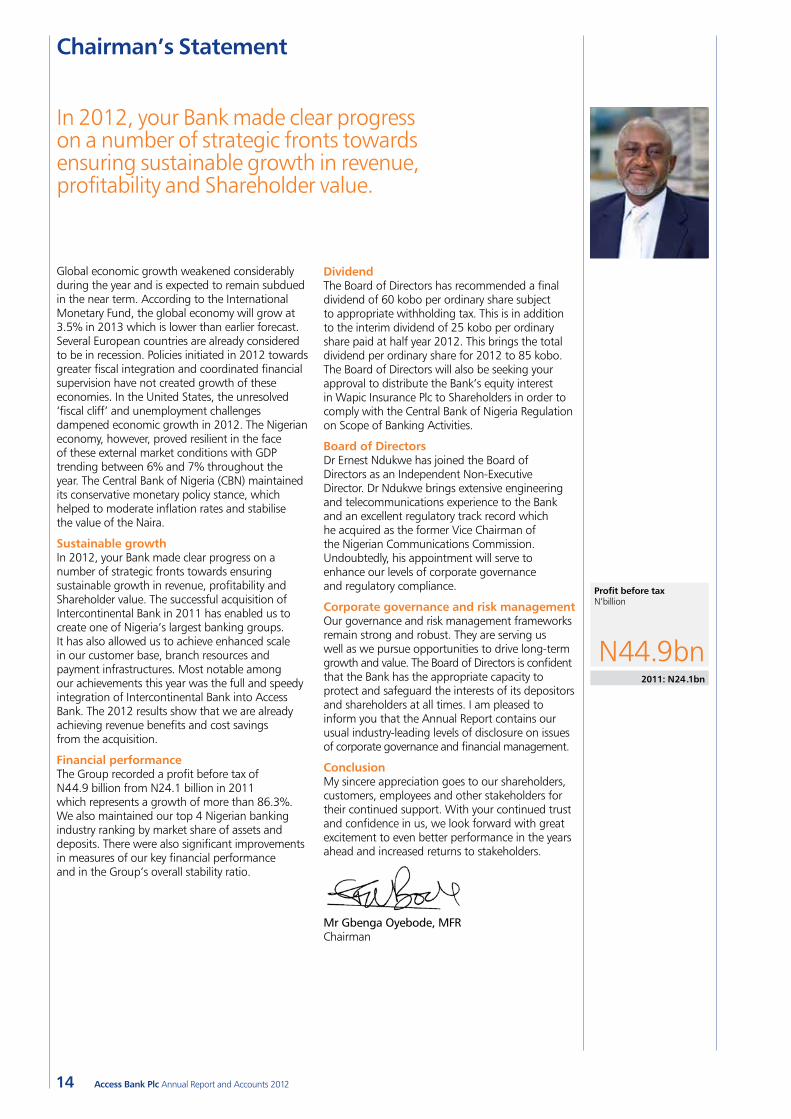
Chairman’s Statement
In 2012, your Bank made clear progress on a number of strategic fronts towards ensuring sustainable growth in revenue, profitability and Shareholder value.
Global economic growth weakened considerably during the year and is expected to remain subdued in the near term. According to the International Monetary Fund, the global economy will grow at 3.5% in 2013 which is lower than earlier forecast. Several European countries are already considered to be in recession. Policies initiated in 2012 towards greater fiscal integration and coordinated financial supervision have not created growth of these economies. In the United States, the unresolved ‘fiscal cliff’ and unemployment challenges dampened economic growth in 2012. The Nigerian economy, however, proved resilient in the face of these external market conditions with GDP trending between 6% and 7% throughout the year. The Central Bank of Nigeria (CBN) maintained its conservative monetary policy stance, which helped to moderate inflation rates and stabilise the value of the Naira.
Sustainable growthIn 2012, your Bank made clear progress on a number of strategic fronts towards ensuring sustainable growth in revenue, profitability and Shareholder value. The successful acquisition of Intercontinental Bank in 2011 has enabled us to create one of Nigeria’s largest banking groups. It has also allowed us to achieve enhanced scale in our customer base, branch resources and payment infrastructures. Most notable among our achievements this year was the full and speedy integration of Intercontinental Bank into Access Bank. The 2012 results show that we are already achieving revenue benefits and cost savings from the acquisition.
Financial performanceThe Group recorded a profit before tax of N44.9 billion from N24.1 billion in 2011 which represents a growth of more than 86.3%. We also maintained our top 4 Nigerian banking industry ranking by market share of assets and deposits. There were also significant improvements in measures of our key financial performance and in the Group’s overall stability ratio.
Profit before tax N’billion
N44.9bn2011: N24.1bn
Dividend The Board of Directors has recommended a final dividend of 60 kobo per ordinary share subject to appropriate withholding tax. This is in addition to the interim dividend of 25 kobo per ordinary share paid at half year 2012. This brings the total dividend per ordinary share for 2012 to 85 kobo. The Board of Directors will also be seeking your approval to distribute the Bank’s equity interest in Wapic Insurance Plc to Shareholders in order to comply with the Central Bank of Nigeria Regulation on Scope of Banking Activities.
Board of DirectorsDr Ernest Ndukwe has joined the Board of Directors as an Independent Non-Executive Director. Dr Ndukwe brings extensive engineering and telecommunications experience to the Bank and an excellent regulatory track record which he acquired as the former Vice Chairman of the Nigerian Communications Commission. Undoubtedly, his appointment will serve to enhance our levels of corporate governance and regulatory compliance.
Corporate governance and risk managementOur governance and risk management frameworks remain strong and robust. They are serving us well as we pursue opportunities to drive long-term growth and value. The Board of Directors is confident that the Bank has the appropriate capacity to protect and safeguard the interests of its depositors and shareholders at all times. I am pleased to inform you that the Annual Report contains our usual industry-leading levels of disclosure on issues of corporate governance and financial management.
ConclusionMy sincere appreciation goes to our shareholders, customers, employees and other stakeholders for their continued support. With your continued trust and confidence in us, we look forward with great excitement to even better performance in the years ahead and increased returns to stakeholders.
Mr Gbenga Oyebode, MFRChairman
Overview
15Access Bank Plc Annual Report and Accounts 2012
In 2002, when we commenced our journey of corporate transformation we lacked the resources required to compete effectively with Nigeria’s leading banks. Our compelling vision and corporate philosophy, however, motivated us to strive for the highest standards of excellence regardless of this limitation. I am grateful to God for ensuring that throughout our journey, we have maintained an upward trajectory improving our industry ranking year after year. Today, we have joined the ranks of Nigeria’s Tier 1 banks and are recognised as a point of reference among African financial institutions.
Following our October 2011 acquisition of Intercontinental Bank, we took steps to address in the shortest possible time all the post-acquisition issues which would constrain our competitiveness and prevent us from attaining the full potential of our Tier 1 position. We therefore designated 2012 as a year of integration, a time for implementing tough decisions and addressing all the issues and costs associated with business restructuring. I must say a big thank you to all our stakeholders, especially our customers and my colleagues in the Bank, whose loyalty and goodwill remained intact regardless of the difficulties and inconvenience they endured as we executed our business integration plan.
Having addressed the critical challenges associated with the Intercontinental Bank acquisition, we are now able to challenge for the position of Nigeria’s banking leader. We can now give undiluted attention to our customers and ensure that each and every user of our services enjoys an exceptional and value-added banking experience with Access Bank.
So to all our stakeholders, let me conclude by saying that I enter my final year in office with confidence and excitement. I know that by God’s grace we will build a bank of international quality and global standards. This in turn will deliver sustainable value for our stakeholders and help us attain our vision to be the world’s most respected African bank.
God bless.
Mr Aigboje Aig-Imoukhuede, CONGroup Managing Director/Chief Executive Officer
Chief Executive’s Review
Our compelling vision and corporate philosphy motivated us to strive for the highest standards.
16 Access Bank Plc Annual Report and Accounts 2012
Corporate Philosophy
Our visionTo be the most respected bank in Africa.Our missionSetting standards for sustainable business practices that unleash the talents of our employees, deliver superior value to our customers and provide innovative solutions for the markets and communities we serve.
Our core valuesExcellence•Surpassing ordinary standards to be the
best in all that we do•Setting the standards for what it means
to be exceptional•Never losing sight of our commitment to
excellence, even when the going gets tough•Remembering that excellence requires
dedication and commitment•Our approach is not “excellence at all costs”
but “excellence on all fronts” so that we deliver outcomes that are economically, environmentally and socially responsible
Leadership•Leading by example, leading with guts•Being first, being the best, sometimes
being the only•We must embody the change we
want to see•Setting the standard•Challenging the status quo•Market making•Self-awareness in being able to maintain
a balanced assessment of externalities and costs incurred in the pursuit of leadership
Passion for customers•We live to serve our customers• In addition to delivering excellent customer
service, we focus on: – Economic empowerment: enabling people to achieve more through provision of finance, lifting people up throughout the value chain
– Financial education: helping people clearly understand how our products and services work
– Financial inclusion: providing finance to those individuals and communities that traditionally have limited or no access to finance
– Treating customers fairly: building long-term relationships based on trust, fairness and transparency
Empowered employees •Recruiting and retaining the right people
and teams based on shared values and vision•Developing our people to become
world-class professionals•Encouraging a sense of ownership at individual
level whilst fostering team spirit and loyalty to a shared vision
•Promoting a sense of belonging and community•Facilitating continuous learning by providing
the training, tools and coaching to help our people grow
•Helping them take care of their health•Pursuing a positive work/life balance for increased
productivity and improved employee satisfaction•Encouraging a diverse workforce; respect for and
appreciation of differences in ethnicity, gender, age, national origin, disability, and religion
Professionalism •Putting our best foot forward in everything we
do, especially in high pressure situations •Consistently bringing the best of our knowledge
and expertise to the table in all of our interactions with our stakeholders
•Setting the highest standards in our work ethic, behaviours and activities in the way we treat our customers and – just as importantly – each other
•Putting our customers’ needs ahead of our own•Maintaining composure and clear thinking at
all times•Ensuring continuous learning; through
continuous growth and career development
Innovation • Identifying new market needs and opportunities•Creativity, invention, inspiration, exploration•Pioneering new ways of doing things, new
products and services, new approaches to clients/customers
•Being first, testing the waters, pushing boundaries•Going from concept to market/reality•Anticipating and responding quickly to market
needs with the right technology, products and services to achieve customer objectives
Business Review
17Access Bank Plc Annual Report and Accounts 2012
Reports of the External Consultant
Summary report on Corporate GovernanceThe corporate governance practices at Access Bank Plc have been reviewed, as required by the Securities and Exchange Commission Code of Corporate Governance for Public Companies in Nigeria and it has been found that the Bank is materially compliant with the requirements of the Code.
Basis of reviewThe Bank’s Memorandum and Articles of Association, Board Terms of Reference, Board papers, minutes of Board meetings, Risk Management Framework and Succession Planning Policy were reviewed for compliance. In addition, key principal officers of the Bank were interviewed in respect of the Board practices.
The Bank’s audit structures and credit processes were examined as well as the Directors’ understanding of their fiduciary duties and roles in providing financial oversight and enhancing shareholder value.
The review was conducted in January 2013.
Summary of findingsOur conclusion from the review of available documentation and discussions with principal officers is that the Bank is materially compliant with the requirements of the SEC Code of Corporate Governance.
Feedback from Executive Directors as well as Non-Executive Directors indicates that all Directors fully understand their fuduciary duties and roles in providing financial oversight and enhancing shareholder value.
The details of our findings and recommendations have been submitted to the Board of Directors.
Yours sincerely,
Accenture
Toluleke AdenmosunManaging Director, Financial Services Thursday, 28 March 2013
Accenture 2nd Floor, Citibank Building 27 Kofo Abayomi Street P.M.B 80085 Victoria Island Lagos, Nigeria Tel: +234 1 2707100 Fax +234 1 2707111 www.accenture.com
Summary report on Corporate GovernanceThe corporate governance arrangements at Access Bank Plc have been reviewed, with regards to the Central Bank Code on Corporate Governance for Banks, Post Consolidation and it has been found that the Bank is materially compliant with the reqiurements of the Code.
Basis of reviewThe Bank’s Memorandum and Articles of Association, Board Terms of Reference, Board papers, minutes of Board meetings, Risk Management Framework and Succession Planning Policy were reviewed for compliance. In addition, key principal officers of the Bank were interviewed in respect of the Board practices.
The Bank’s audit structures and credit processes were examined as well as the Directors’ understanding of their fiduciary duties and roles in providing financial oversight and enhancing shareholder value.
The review was conducted in January 2013.
Summary of findingsOur conclusion from the review of available documentation and discussions with principal officers is that the Bank is materially compliant with the requirements of the CBN Code of Corporate Governance.
Feedback from Executive Directors as well as Non-Executive Directors indicates that all Directors fully understand their fiduciary duties and roles in providing financial oversight and enhancing shareholder value.
The details of our findings and recommendations have been submitted to the Board of Directors.
Yours sincerely,
Accenture
Toluleke AdenmosunManaging Director, Financial Services Thursday, 28 March 2013
Accenture 2nd Floor, Citibank Building 27 Kofo Abayomi Street P.M.B 80085 Victoria Island Lagos, Nigeria Tel: +234 1 2707100 Fax +234 1 2707111 www.accenture.com
18 Access Bank Plc Annual Report and Accounts 2012
ProspectsLooking ahead, there are exciting opportunities for our Retail Banking Division. The Bank recently concluded its Retail Banking Strategy Realignment and Repositioning which will deliver beneficial changes to how our retail business will be run in 2013. Reflecting these changes, the Division will be renamed the Personal and Business Banking Division. It will employ a segmented approach built on a robust Customer Relationship Management platform to deliver superior services to our customers. The business will be divided into three groups based on customer turnover. These are:
•Private Banking Group – for customers above N20 million turnover
•Personal Banking Group – for customers below N20 million turnover
•Business Banking Group – for corporate customers with between N50 million and N500 million turnover
To further support our customers, a Telephone Banking Team and Issue Resolution and Management team will be established to address all customer issues promptly. We will also focus on our value chain customers with the aim of acquiring payroll mandates and providing consumer loans through salary loan schemes.
2012 2011 Increase
N’billion N’billion %
Total assets 30.3 36.4 -16.8
Total liabilities 263.4 85.3 209.4
Gross earnings 25.3 5.7 343.9
Profit before tax 2.8 1.3 115.4
The Retail Banking Division recorded an exceptionally strong performance in 2012 and achieved dramatic growth in gross earnings and profit before tax. This was the result of the increased customer base and balance sheet following the merger with Intercontinental Bank. We said last year that the merger created one of Africa’s largest financial institutions and the benefits have materialised quickly.
During 2012, the division focused more on deposit liabilities and less on risk assets, which naturally resulted in the decline in total risk assets. This in turn was compensated for by the growth in deposit liabilities due to the Bank’s increased emphasis on building the deposit customer base.
The merger delivered a significant increase in the customer base against the previous year from 1.5 million in 2011 to 4 million in 2012. This has strengthened the Bank’s retail brand and given it greater critical mass in the marketplace.
The retail business optimises the value chain of the Bank’s corporate and institutional clients by offering products and services tailored to meet the needs of vendors, dealerships, employees and others. There is also a focus on SMEs and churches as part of the retail strategy.
Business Review Retail Banking
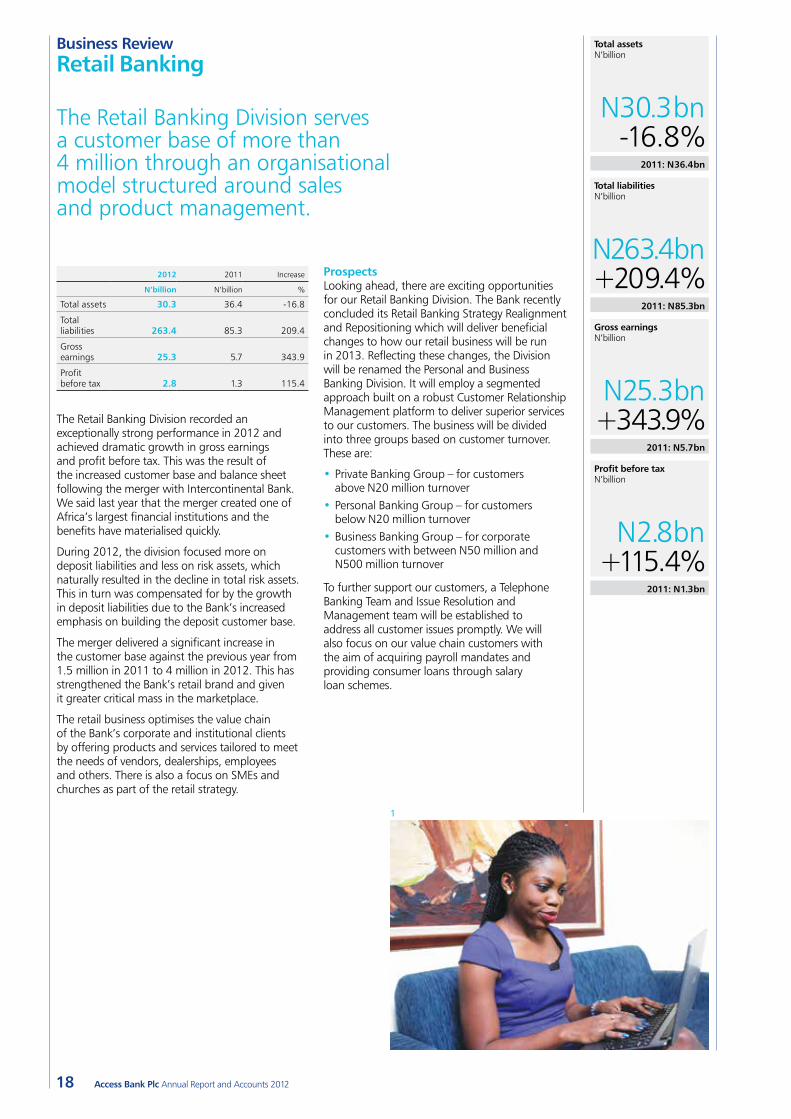
The Retail Banking Division serves a customer base of more than 4 million through an organisational model structured around sales and product management.
1
Total assets N’billion
N30.3bn-16.8%
2011: N36.4bn
Total liabilities N’billion
N263.4bn+209.4%
2011: N85.3bn
Gross earnings N’billion
N25.3bn+343.9%
2011: N5.7bn
Profit before tax N’billion
N2.8bn+115.4%
2011: N1.3bn
Business Review
19Access Bank Plc Annual Report and Accounts 2012
3
2
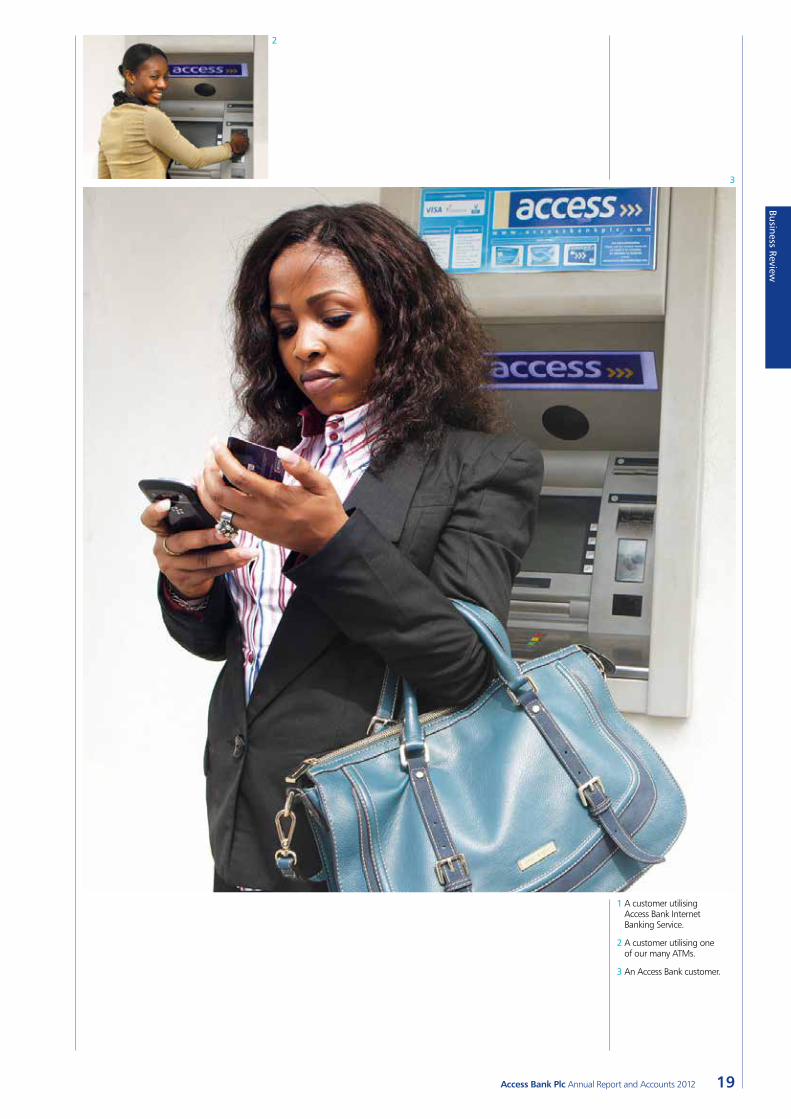
1 A customer utilising Access Bank Internet Banking Service.
2 A customer utilising one of our many ATMs.
3 An Access Bank customer.
20 Access Bank Plc Annual Report and Accounts 2012
Business Review continuedCommercial Banking
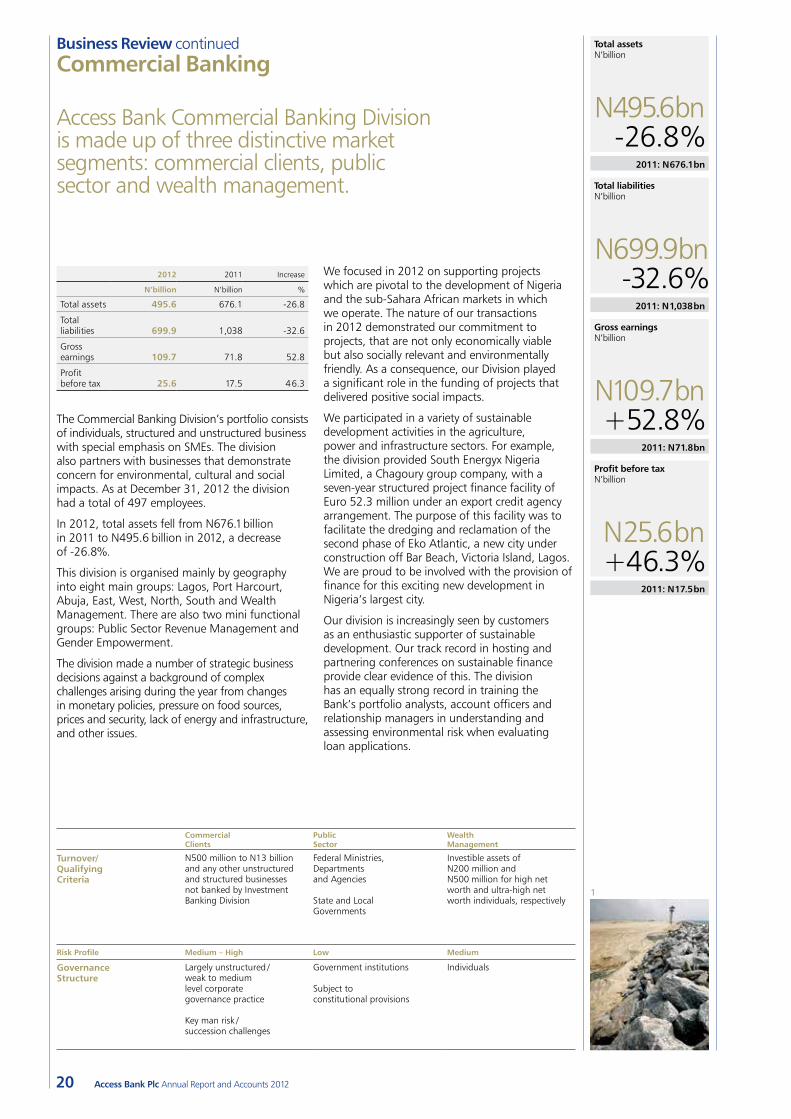
Access Bank Commercial Banking Division is made up of three distinctive market segments: commercial clients, public sector and wealth management.
We focused in 2012 on supporting projects which are pivotal to the development of Nigeria and the sub-Sahara African markets in which we operate. The nature of our transactions in 2012 demonstrated our commitment to projects, that are not only economically viable but also socially relevant and environmentally friendly. As a consequence, our Division played a significant role in the funding of projects that delivered positive social impacts.
We participated in a variety of sustainable development activities in the agriculture, power and infrastructure sectors. For example, the division provided South Energyx Nigeria Limited, a Chagoury group company, with a seven-year structured project finance facility of Euro 52.3 million under an export credit agency arrangement. The purpose of this facility was to facilitate the dredging and reclamation of the second phase of Eko Atlantic, a new city under construction off Bar Beach, Victoria Island, Lagos. We are proud to be involved with the provision of finance for this exciting new development in Nigeria’s largest city.
Our division is increasingly seen by customers as an enthusiastic supporter of sustainable development. Our track record in hosting and partnering conferences on sustainable finance provide clear evidence of this. The division has an equally strong record in training the Bank’s portfolio analysts, account officers and relationship managers in understanding and assessing environmental risk when evaluating loan applications.
2012 2011 Increase
N’billion N’billion %
Total assets 495.6 676.1 -26.8
Total liabilities 699.9 1,038 -32.6
Gross earnings 109.7 71.8 52.8
Profit before tax 25.6 17.5 46.3
The Commercial Banking Division’s portfolio consists of individuals, structured and unstructured business with special emphasis on SMEs. The division also partners with businesses that demonstrate concern for environmental, cultural and social impacts. As at December 31, 2012 the division had a total of 497 employees.
In 2012, total assets fell from N676.1 billion in 2011 to N495.6 billion in 2012, a decrease of -26.8%.
This division is organised mainly by geography into eight main groups: Lagos, Port Harcourt, Abuja, East, West, North, South and Wealth Management. There are also two mini functional groups: Public Sector Revenue Management and Gender Empowerment.
The division made a number of strategic business decisions against a background of complex challenges arising during the year from changes in monetary policies, pressure on food sources, prices and security, lack of energy and infrastructure, and other issues.
Commercial Clients
Public Sector
Wealth Management
Turnover/ Qualifying Criteria
N500 million to N13 billion and any other unstructured and structured businesses not banked by Investment Banking Division
Federal Ministries, Departments and Agencies
State and Local Governments
Investible assets of N200 million and N500 million for high net worth and ultra-high net worth individuals, respectively
Risk Profile Medium – High Low Medium
Governance Structure
Largely unstructured / weak to medium level corporate governance practice
Key man risk / succession challenges
Government institutions
Subject to constitutional provisions
Individuals
Total assets N’billion
N495.6bn-26.8%
2011: N676.1bn
Total liabilities N’billion
N699.9bn-32.6%
2011: N1,038bn
Gross earnings N’billion
N109.7bn+52.8%
2011: N71.8bn
Profit before tax N’billion
N25.6bn+46.3%
2011: N17.5bn
1

Business Review
21Access Bank Plc Annual Report and Accounts 2012
Eko Atlantic – one or the largest urban development projects in AfricaWhen completed, Eko Atlantic will be a city on reclaimed land of 9 million square metres. Located off Victoria Island on the Atlantic coast, it consists of an integrated mixed development comprising offices and homes. Around 250,000 people will live in the seven districts of Eko Atlantic and an estimated 150,000 are expected to commute into the new development each day.
Eko Atlantic will create a safe environment in which people can live, work and play. It will include open spaces with areas designated as public parks, shopping malls, banks, movie theatres and restaurants. The city will have its own independent power station to ensure uninterrupted power supplies, and will feature advanced voice and data infrastructure. A new public transport network comprising a tramway and a waterway will run through Eko Atlantic and link with public transport points on Victoria Island and into the rest of Lagos.
2
3
1 Recovered land at Atlantic coast of Victoria Island for the Eko Atlantic City Project, an integrated mixed development consisting of offices and residential abode for about 250,000 people and more than 150,000 more commuting to work each day.
2 Dredging activities towards creation of Eko Atlantic City on 9 million square metres of land.
3 Land reclamation at the second phase of creation of Eko Atlantic City.
22 Access Bank Plc Annual Report and Accounts 2012
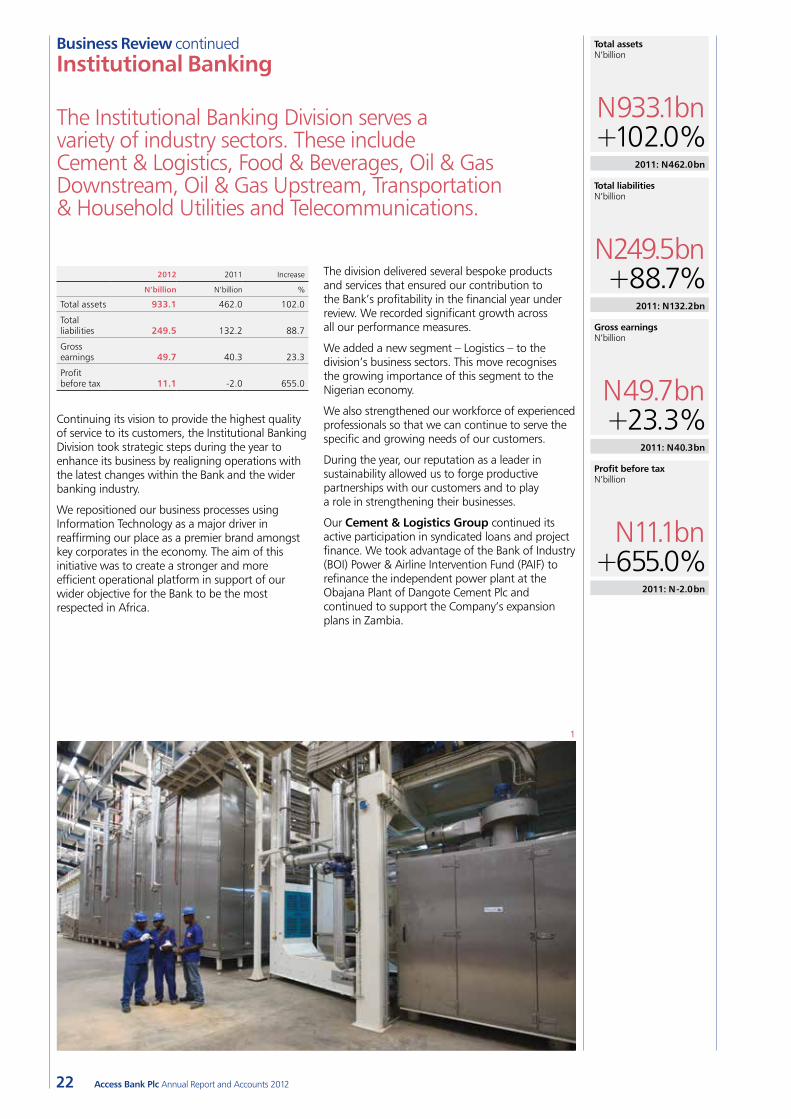
2012 2011 Increase
N’billion N’billion %
Total assets 933.1 462.0 102.0
Total liabilities 249.5 132.2 88.7
Gross earnings 49.7 40.3 23.3
Profit before tax 11.1 -2.0 655.0
Continuing its vision to provide the highest quality of service to its customers, the Institutional Banking Division took strategic steps during the year to enhance its business by realigning operations with the latest changes within the Bank and the wider banking industry.
We repositioned our business processes using Information Technology as a major driver in reaffirming our place as a premier brand amongst key corporates in the economy. The aim of this initiative was to create a stronger and more efficient operational platform in support of our wider objective for the Bank to be the most respected in Africa.
The division delivered several bespoke products and services that ensured our contribution to the Bank’s profitability in the financial year under review. We recorded significant growth across all our performance measures.
We added a new segment – Logistics – to the division’s business sectors. This move recognises the growing importance of this segment to the Nigerian economy.
We also strengthened our workforce of experienced professionals so that we can continue to serve the specific and growing needs of our customers.
During the year, our reputation as a leader in sustainability allowed us to forge productive partnerships with our customers and to play a role in strengthening their businesses.
Our Cement & Logistics Group continued its active participation in syndicated loans and project finance. We took advantage of the Bank of Industry (BOI) Power & Airline Intervention Fund (PAIF) to refinance the independent power plant at the Obajana Plant of Dangote Cement Plc and continued to support the Company’s expansion plans in Zambia.
Business Review continuedInstitutional Banking
The Institutional Banking Division serves a variety of industry sectors. These include Cement & Logistics, Food & Beverages, Oil & Gas Downstream, Oil & Gas Upstream, Transportation & Household Utilities and Telecommunications.
1
Total assets N’billion
N933.1bn+102.0%
2011: N462.0bn
Total liabilities N’billion
N249.5bn+88.7%
2011: N132.2bn
Gross earnings N’billion
N49.7bn+23.3%
2011: N40.3bn
Profit before tax N’billion
N11.1bn+655.0%
2011: N-2.0bn
Business Review
23Access Bank Plc Annual Report and Accounts 2012
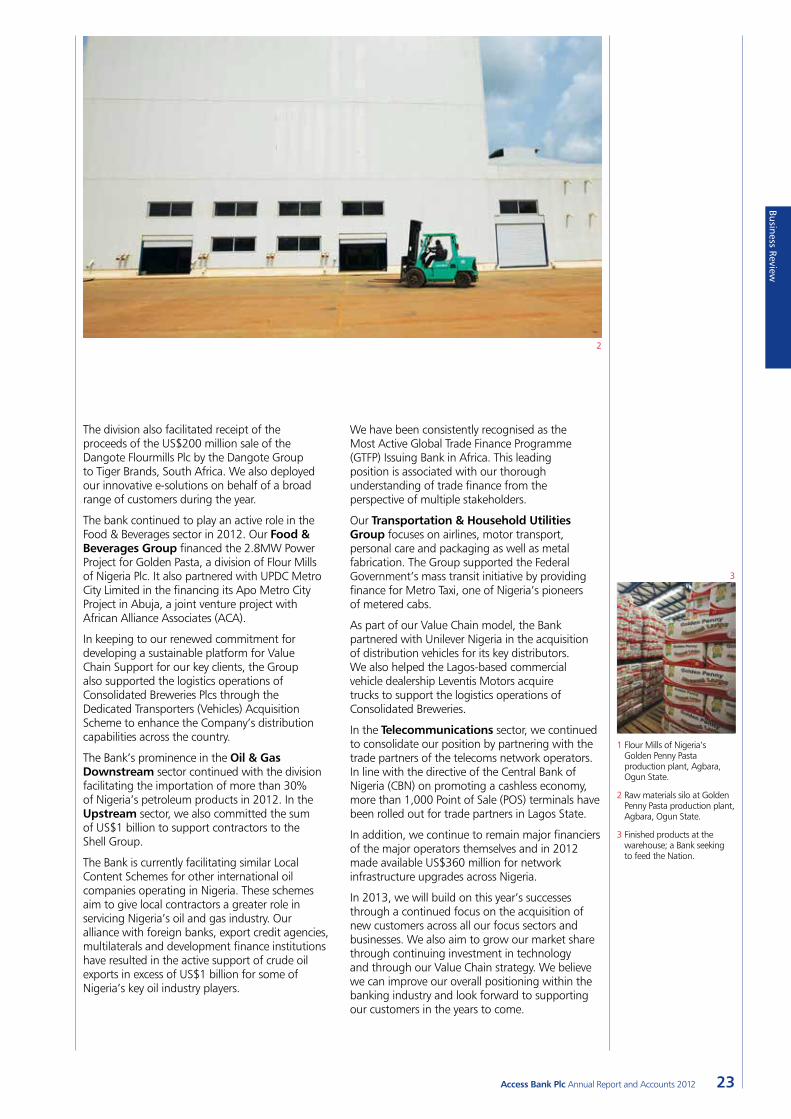
1 Flour Mills of Nigeria’s Golden Penny Pasta production plant, Agbara, Ogun State.
2 Raw materials silo at Golden Penny Pasta production plant, Agbara, Ogun State.
3 Finished products at the warehouse; a Bank seeking to feed the Nation.
3
The division also facilitated receipt of the proceeds of the US$200 million sale of the Dangote Flourmills Plc by the Dangote Group to Tiger Brands, South Africa. We also deployed our innovative e-solutions on behalf of a broad range of customers during the year.
The bank continued to play an active role in the Food & Beverages sector in 2012. Our Food & Beverages Group financed the 2.8MW Power Project for Golden Pasta, a division of Flour Mills of Nigeria Plc. It also partnered with UPDC Metro City Limited in the financing its Apo Metro City Project in Abuja, a joint venture project with African Alliance Associates (ACA).
In keeping to our renewed commitment for developing a sustainable platform for Value Chain Support for our key clients, the Group also supported the logistics operations of Consolidated Breweries Plcs through the Dedicated Transporters (Vehicles) Acquisition Scheme to enhance the Company’s distribution capabilities across the country.
The Bank’s prominence in the Oil & Gas Downstream sector continued with the division facilitating the importation of more than 30% of Nigeria’s petroleum products in 2012. In the Upstream sector, we also committed the sum of US$1 billion to support contractors to the Shell Group.
The Bank is currently facilitating similar Local Content Schemes for other international oil companies operating in Nigeria. These schemes aim to give local contractors a greater role in servicing Nigeria’s oil and gas industry. Our alliance with foreign banks, export credit agencies, multilaterals and development finance institutions have resulted in the active support of crude oil exports in excess of US$1 billion for some of Nigeria’s key oil industry players.
We have been consistently recognised as the Most Active Global Trade Finance Programme (GTFP) Issuing Bank in Africa. This leading position is associated with our thorough understanding of trade finance from the perspective of multiple stakeholders.
Our Transportation & Household Utilities Group focuses on airlines, motor transport, personal care and packaging as well as metal fabrication. The Group supported the Federal Government’s mass transit initiative by providing finance for Metro Taxi, one of Nigeria’s pioneers of metered cabs.
As part of our Value Chain model, the Bank partnered with Unilever Nigeria in the acquisition of distribution vehicles for its key distributors. We also helped the Lagos-based commercial vehicle dealership Leventis Motors acquire trucks to support the logistics operations of Consolidated Breweries.
In the Telecommunications sector, we continued to consolidate our position by partnering with the trade partners of the telecoms network operators. In line with the directive of the Central Bank of Nigeria (CBN) on promoting a cashless economy, more than 1,000 Point of Sale (POS) terminals have been rolled out for trade partners in Lagos State.
In addition, we continue to remain major financiers of the major operators themselves and in 2012 made available US$360 million for network infrastructure upgrades across Nigeria.
In 2013, we will build on this year’s successes through a continued focus on the acquisition of new customers across all our focus sectors and businesses. We also aim to grow our market share through continuing investment in technology and through our Value Chain strategy. We believe we can improve our overall positioning within the banking industry and look forward to supporting our customers in the years to come.
2
24 Access Bank Plc Annual Report and Accounts 2012
Business Review continuedFinancial Markets
The Financial Markets Division provides specialised financing and investment solutions. We conduct these activities through our Treasury, Corporate Finance and Financial Institutions Groups.
1
2012 2011 Increase
N’billion N’billion %
Total assets 195.9 230.9 -15.2
Total liabilities 246.1 156.2 57.6
Gross earnings 20.4 14.3 42.7
Profit before tax 5.1 5.2 -1.9
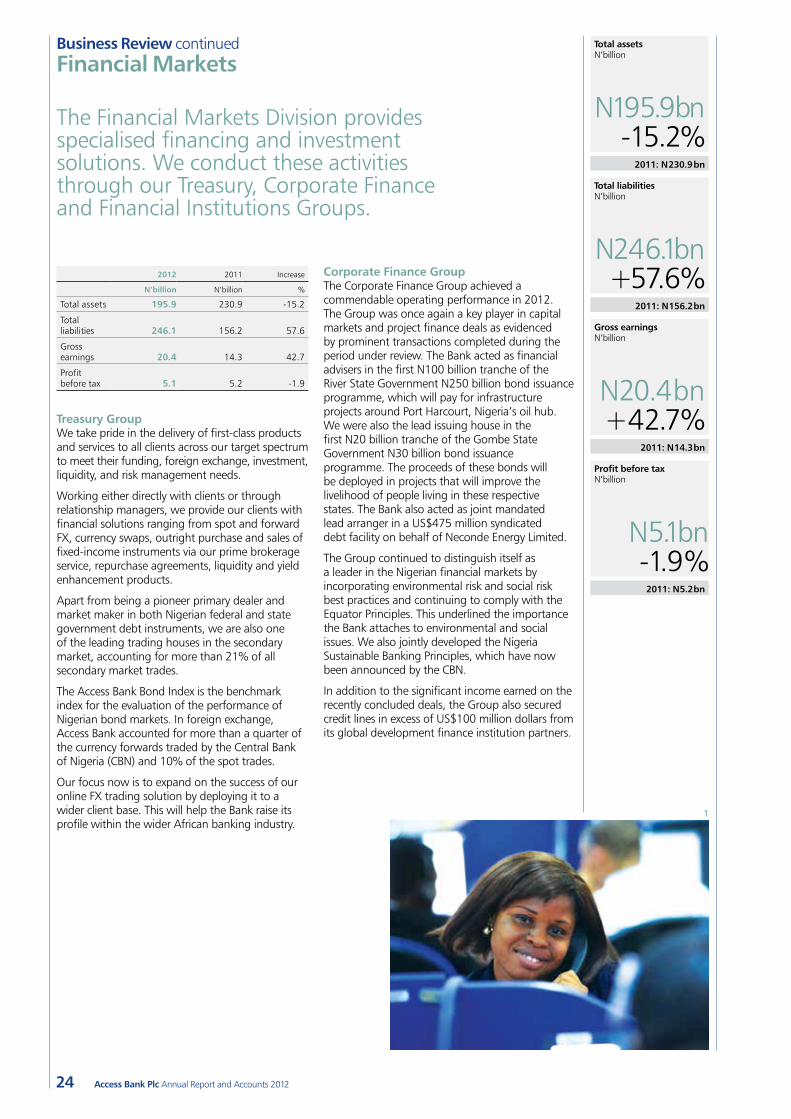
Treasury GroupWe take pride in the delivery of first-class products and services to all clients across our target spectrum to meet their funding, foreign exchange, investment, liquidity, and risk management needs.
Working either directly with clients or through relationship managers, we provide our clients with financial solutions ranging from spot and forward FX, currency swaps, outright purchase and sales of fixed-income instruments via our prime brokerage service, repurchase agreements, liquidity and yield enhancement products.
Apart from being a pioneer primary dealer and market maker in both Nigerian federal and state government debt instruments, we are also one of the leading trading houses in the secondary market, accounting for more than 21% of all secondary market trades.
The Access Bank Bond Index is the benchmark index for the evaluation of the performance of Nigerian bond markets. In foreign exchange, Access Bank accounted for more than a quarter of the currency forwards traded by the Central Bank of Nigeria (CBN) and 10% of the spot trades.
Our focus now is to expand on the success of our online FX trading solution by deploying it to a wider client base. This will help the Bank raise its profile within the wider African banking industry.
Corporate Finance GroupThe Corporate Finance Group achieved a commendable operating performance in 2012. The Group was once again a key player in capital markets and project finance deals as evidenced by prominent transactions completed during the period under review. The Bank acted as financial advisers in the first N100 billion tranche of the River State Government N250 billion bond issuance programme, which will pay for infrastructure projects around Port Harcourt, Nigeria’s oil hub. We were also the lead issuing house in the first N20 billion tranche of the Gombe State Government N30 billion bond issuance programme. The proceeds of these bonds will be deployed in projects that will improve the livelihood of people living in these respective states. The Bank also acted as joint mandated lead arranger in a US$475 million syndicated debt facility on behalf of Neconde Energy Limited.
The Group continued to distinguish itself as a leader in the Nigerian financial markets by incorporating environmental risk and social risk best practices and continuing to comply with the Equator Principles. This underlined the importance the Bank attaches to environmental and social issues. We also jointly developed the Nigeria Sustainable Banking Principles, which have now been announced by the CBN.
In addition to the significant income earned on the recently concluded deals, the Group also secured credit lines in excess of US$100 million dollars from its global development finance institution partners.
Total assets N’billion
N195.9bn-15.2%
2011: N230.9bn
Total liabilities N’billion
N246.1bn+57.6%
2011: N156.2bn
Gross earnings N’billion
N20.4bn+42.7%
2011: N14.3bn
Profit before tax N’billion
N5.1bn-1.9%
2011: N5.2bn

Business Review
25Access Bank Plc Annual Report and Accounts 2012
We offer a broad spectrum of services to our financial institutions customers including clearing, fund management, cash management, trade and project finance as well as treasury services.
Our primary objective is to institutionalise partnerships with organisations in our target market through our experienced and dedicated relationship management teams. This approach allows us to provide tailor-made solutions in support of our customers’ developmental goals while allowing them to benefit from the Bank’s expertise and global perspective.
In a move to drive our sustainability strategy, our Development Banking Group was re-engineered to provide complete banking services to development and multilateral organisations, NGOs, donor agencies as well as grants/funds recipients.
1 Excellent service is at the heart of our operations; professionalism is our watchword.
2 Our teams offer best-in-class financial advisory services and solutions to clients’ needs.2
These lines will provide a cost-effective source for funding key economic sectors such as agriculture and small- and medium-sized enterprises. In addition, we obtained a US$35 million risk-sharing facility from the International Finance Corporation, some 70% of which has been earmarked for women entrepreneurs.
We are anticipating a fruitful 2013 and hope once again to play key roles in power sector reforms and in agricultural as well as other key sectors of the economy. We will conduct business in a sustainable manner and strive to deliver superior value to our customers.
Financial Institutions GroupThe Financial Institutions Group provides a wide range of products and services to bank and non-bank financial institutions as well as non-governmental organisations (NGOs) and development finance businesses.
We are a one-stop shop comprising four specialised relationship-management teams. The Group manages relationships for financial institutions locally and within the African continent, including leading international banks, development banks, investment banks and insurance companies.
26 Access Bank Plc Annual Report and Accounts 2012
Access Bank. We have also cut overall turnaround time for resolution of customer complaints.
Payments and settlementsOur settlement banking team continues to be an active participant in the guided reforms around payments and settlement systems led by the Central Bank of Nigeria (CBN). As one of their key settlement banks, in 2012 we became one of the top four banks in Nigeria in terms of both the value and volume of payments and settlements transactions across national clearing and settlement platforms.
The Bank continued during the year to be a major payment and collection bank. This was due to our increased collaboration and partnership with payment service providers and payment terminal and switching companies. It also reflects our deployment of unique service and product offerings.
During 2012, the Bank consolidated its position as the third bank by market share for import trade in Nigeria and became one of the top three banks by market share for foreign currency transfers. The Bank won its fifth consecutive issuing bank award under the Global Trade Finance Programme of the International Finance Corporation. This prestigious award established our position as the dominant issuing bank in Africa over the past three years.
Our responsibility covers all critical customer touch points, from transaction initiation to processing and including delivery or fulfilment and feedback.
The key highlight of the year was our successful integration of the customers of Intercontinental Bank following our 2011 merger. We created one single IT system in March 2012 and now have a sophisticated platform for delivering excellent customer service to our enlarged customer base.
Resolve or ReferWe established our “Resolve or Refer” initiative to upgrade our ability to resolve customer complaints satisfactorily. This involved introducing a complaints management systems that directly linked branches and other complaint points of complaints to a Contact Centre where a dedicated team ensures that every customer complaint is resolved within 24 hours.
Branches are fully empowered to resolve complaints at the point of origin and only refer an issue upwards to the central complaints resolution team if they find they are unable to fully resolve them. This successful initiative has dramatically increased the percentage of complaints that are resolved before the customer leaves a branch of
Business Review continuedTransaction Banking Division
The Transaction Banking Division is responsible for ensuring that convenient channels and IT platforms and systems are optimised for fulfilment of customer banking transactions. It comprises Branch Operations, Global Payments, Domestic Payments, Channels Services and Information Technology Services.
1 2

Business Review
27Access Bank Plc Annual Report and Accounts 2012
Our product and service offering includes cash deposits and receipts, electronic funds transfers, ATM services, cash management, collection services and much more. During the year, our focus was on ensuring smooth alignment of all products and services following the integration process to deliver a world-class offering throughout our entire branch network.
We undertook regular training for all our employees to maintain the high standards of professionalism within the Branch Services Group, and to foster continued innovation. Our training was provided both by overseas and local organisations. We also made extensive use of on-the-job training.
As part of our corporate social responsibility (CSR) work, we collaborated with a non-government organisation in a project that seeks to combat anaemia in five zones in Nigeria.
Looking ahead to 2013, the Branch Services Group plans to build on foundations it has laid in terms of empowering its employees and delivering superior value to customers. We are confident our enlarged and unified branch network will support the Bank’s vision to be the most respected bank in Africa.
Branch Services GroupOur Branch Services Group is part of the Transaction Services Division and is responsible for the management of all the Bank’s 310 branches and more than 1,200 ATMs nationwide. To ensure excellent service delivery, we are well advanced in a programme that is transforming every customer touch point into a pleasant and fulfilling experience for the organisations and people we serve.
The Branch Services Group team operates in accordance with the Bank’s vision to be the most respected bank in Africa. To support that objective, we see it as our role to evolve through constant innovation.
During the year, we played a pivotal role in the successful and speedy integration of Access Bank and Intercontinental Bank following the merger of the two organisations. Connecting the respective processing systems of the two branch networks was a challenge. At the same time, it was an exciting opportunity to create a platform that would support the Bank’s objective to serve its customers better. In successfully meeting this challenge, the Branch Services Group achieved an improved audit rating during the year under review and protected the Bank’s interests during a period of potential operational risk.
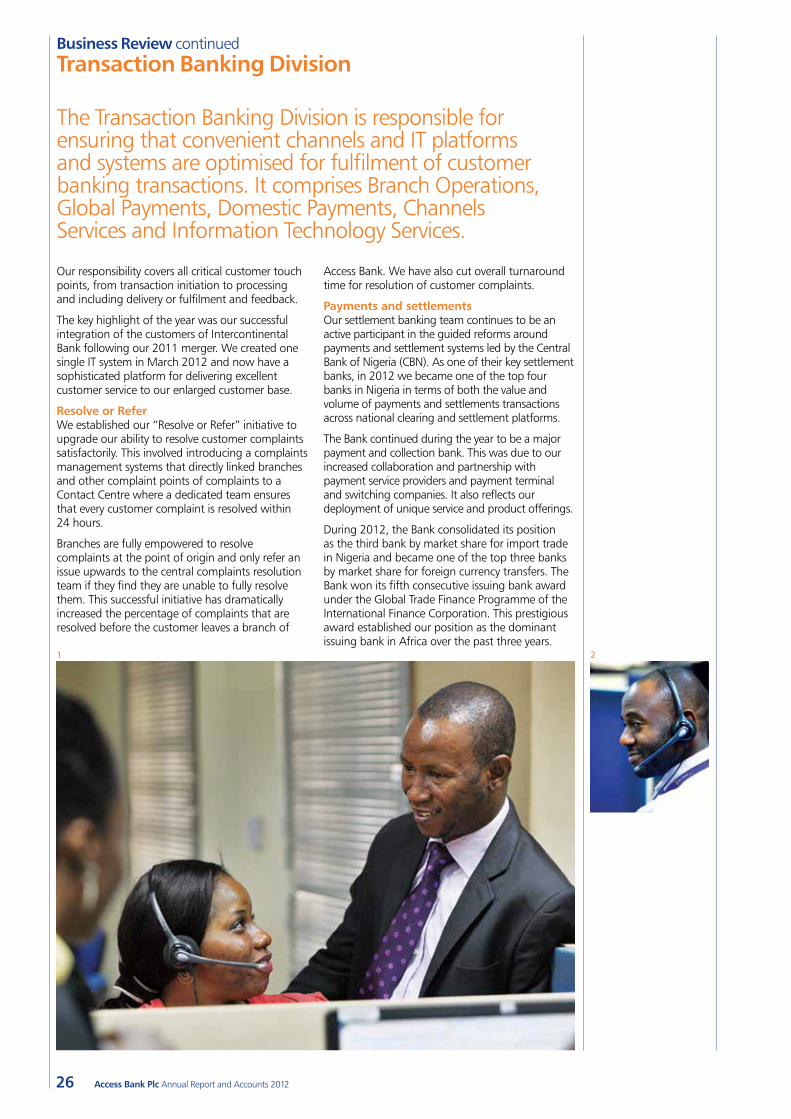
1 Collaboration towards value creation at work; we are a team of professionals.
2 Passion and commitment defines our employees’ outlook to their roles.
3 Our Contact Centre is staffed with passionate and well-trained employees seeking to offer solutions to customers’ needs.
3
28 Access Bank Plc Annual Report and Accounts 2012
The IT Services Division was an integral part of the Bank’s many exciting accomplishments in 2012.
The Bank’s technology group recommends and implements technology-based infrastructure and policies across all business and operational platforms. These include personal, commercial and institutional banking, our cards businesses, and our teams engaged in governance, assurance, technology risk, infrastructure and service delivery.
The IT Services Division was an integral part of the Bank’s many exciting accomplishments in 2012. Unprecedented changes in information technology have facilitated achievement of key performance indicators across the Bank, supported the Bank’s business strategy, and underpinned the Bank’s leadership position.
In 2012, the Bank successfully concluded its merger with Intercontinental Bank. This involved the complete integration of the core banking application and ancillary applications. To consolidate this, we have invested in an upgrade that comprises state-of-the-art database technology that is providing a platform for analytical processing and business and customer intelligence. This will offer greater insight into business operational efficiency and customer behaviour and in turn allow us to enhance the quality and range of products and services over time.
Achieving ISO27001 certificationThe Bank also successfully achieved ISO27001 certification, which is a key information security management system standard that aligns with global best practice. This complements the PCIDSS (Payment Card Industry Data Security Standard) certification that was earlier awarded to the Bank for its security and control processes.
During the year, we developed a new e-statement that runs on a more secure and sophisticated platform. This solution consolidates all customer accounts into a single document. A summary page details a transaction analysis on all accounts and a graphical representation of transactions across channels. This initiative underlines our desire continually to enhance customer service and information security. By offering a paperless solution, it also aligns with the Bank’s commitment to sustainability.
Risk management is an important discipline at Access Bank. A key innovation in this area during 2012 was the successful deployment of the Access Credit Portal (ACP) Corporate Lending Module in conjunction with Axe Finance of the Netherlands. This highly innovative and flexible solution enhances loan underwriting and credit appraisal effectiveness, offering a faster turnaround time to customers. It offers productivity gains and risk monitoring throughout the loan life cycle including collateral management.
From a network perspective, the Bank has consistently ensured high performance, fast and reliable banking operations across all branches. This has been achieved by deploying optical fibre connectivity in the majority of our branches across Nigeria, especially at our designated “mega branches”. We also implemented a direct connection to the Brussels office of SWIFT (the Society for Worldwide Interbank Financial Telecommunication) in Belgium during the year. This has resulted in better and faster communications via the SWIFT system with immediate benefits to our customers.
1
Business Review continuedTransaction Banking Division: IT Services
1 A robust and sophisticated IT infrastructure remains our edge in service excellence.
2 Our call centre operators contribute to delivering world-class services to customers.
3 We drive on diversity through access to varied perspectives to work.

Business Review
29Access Bank Plc Annual Report and Accounts 2012
Ghanaian integration:Following the approval of the merger between Access Bank Group and Intercontinental Bank in Nigeria, the Ghanaian subsidiaries of these banks amalgamated. Our job was to ensure the success of the integration at the technology level. Our solution met expectations for enhanced customer service at every point of service contact.
Technology Integration – In 2012 this included integration of the core banking application as well as ancillary applications, email messaging and collaboration infrastructure.
Data Centre Consolidation – The data centres for the two banks in Ghana were combined for more effective IT services delivery and efficiency. We increased the system capacity in readiness for the sharp rise in the customer base.
Network Upgrade – All networks (LAN, WAN & MAN) in all the branches and at Head Office were upgraded to fibre optics. This has enhanced connectivity and the customer experience across the branches.
FEP Deployment – We facilitated appropriate integration of the various ATM brands (NCR, Wincor, Dibold) and the Card services (Local ATM cards and VISA) provided by the Bank.
Power Cabling and Infrastructure adequacy – Following a power equipment and cabling audit, we increased power capacity at our Head Office to accommodate the merged IT systems.
GhIPPS – Access Bank Ghana was among the first 11 Banks to be migrated into the Ghana National switch (powered by GhIPPS) on the first cutover day.
2
3
30 Access Bank Plc Annual Report and Accounts 2012
Diversity and inclusion at Access Bank is more than a social value; it’s a business imperative.
Our People, Culture and Diversity
We are committed to being a diversity leader in the financial industry by providing an inclusive workplace where everyone has the opportunity to participate in the Bank’s operations and is valued for their distinct skills, experiences and perspectives. We work hard to ensure that our commitment to diversity is built into everything we do – from hiring our employees and building our company culture to running our business and developing our products, tools and services. We incorporate diversity into our business practices through socially responsible initiatives that improve the quality of life of our workforce and their families.
Value of diversityDiversity and inclusion at Access Bank is more than a social value; it’s a business imperative. Over the years, diversity has played a strong role in driving growth and innovation at the Bank. It has helped us meet the needs of our clients around the world, build strong relationships in the communities we serve and engage the many talents of our employees. Diversity will continue to benefit our employees, clients and communities and allow Access Bank to help create a better future.
With operations across Africa and in the United Kingdom, Access Bank sees its workforce diversity as a competitive advantage and will continue to maintain a diverse meritocracy in which people from all over the world can thrive knowing that their talents, ideas and aspirations are valued. We have encouraged a more collaborative and accountable culture where employees are empowered to create a superior customer experience. This culture is reflected in our customer-centric vision and mission which are built on our core values of leadership, excellence, passion for customers, professionalism, empowered employees and innovation.
As part of its commitment to diversity, the Bank has developed a Group Diversity Framework which charts diversity priorities, goals and objectives with a focus on three key areas – talent, marketplace and community. We will continue to be proactive in recruiting and retaining a diverse workforce and maximising human resources to enhance workplace outcomes. We have a strong sense of purpose in what we have set out to achieve in the year ahead.
Our 2012 Diversity Scorecard1 AwardsAccess Bank was named one of Nigeria’s Best Workplaces in the annual study conducted by the London-based Great Place To Work® Institute.
2 Women NetworkWomen make up 39% of our workforce and believes that retaining them and helping them advance in their careers is important to the Bank. The Access Women Network (AWN) is a platform designed to support the professional development and advancement of our female employees. It offers programmes and opportunities to help women receive mentoring and develop competencies that will help them demonstrate executive readiness, become champions and role models for the organisation, and have a significant positive impact on their respective communities. Since the AWN was launched in 2011, it has helped us create a more inclusive environment; create more awareness of diversity issues, develop leadership capabilities in our female managers and grow our business. The theme for 2012 was “Leadership and Women: Improving Performance in the Workplace”.
3 DemographicsAs at 31 December, 2012, our female workforce constituted:
•39% of our total employees•30.7% of our Management positions•20% of our top Management positions•13% of our Board positions
4 Employees with disabilitiesBy the end of 2012, the number of Bank employees with disabilities was 10, a 50% increase over 2011.
5 RecruitmentA total of 61.4% of entry level employees recruited for the period under review were female. Women accounted for 35% of total new hires in 2012.
Learning and DevelopmentOne of the strengths of Access Bank is the opportunity provided for continuous learning and development. Employees are adequately trained – across all levels and functions – to acquire the skills and industry insight they need to become world-class professionals.
Percentage of female employees
39%
Percentage of female Board members
13%
Business Review
31Access Bank Plc Annual Report and Accounts 2012
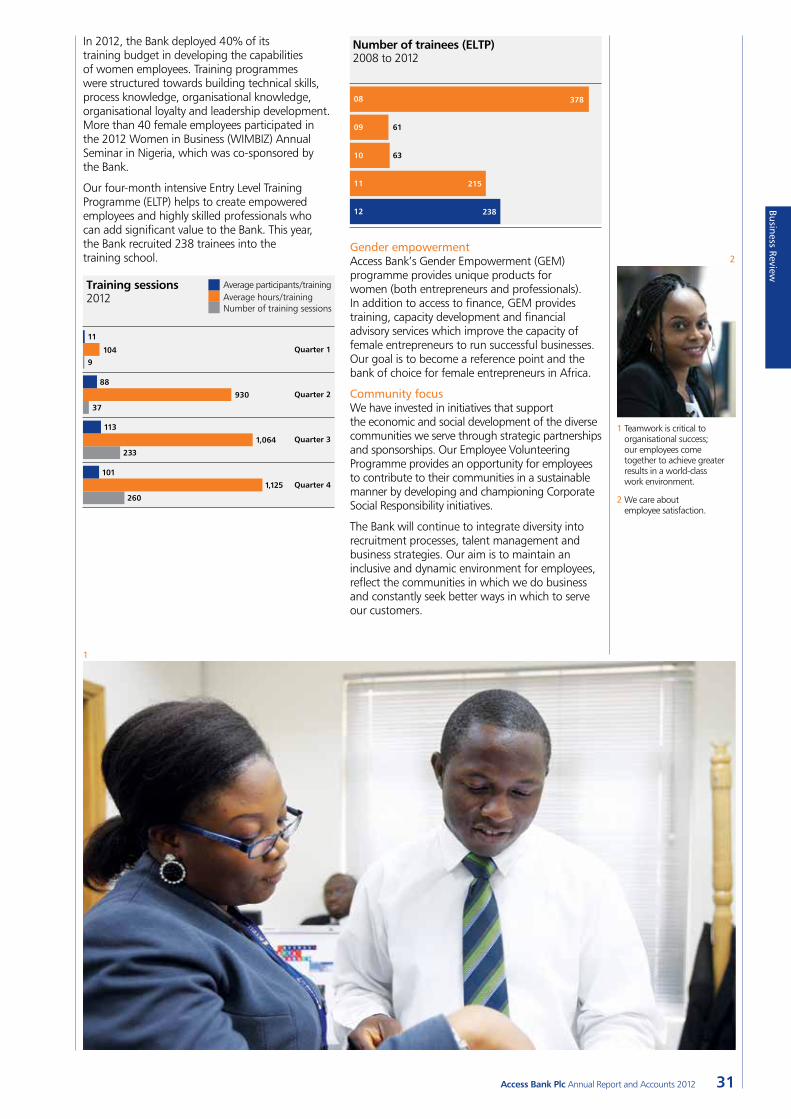
In 2012, the Bank deployed 40% of its training budget in developing the capabilities of women employees. Training programmes were structured towards building technical skills, process knowledge, organisational knowledge, organisational loyalty and leadership development. More than 40 female employees participated in the 2012 Women in Business (WIMBIZ) Annual Seminar in Nigeria, which was co-sponsored by the Bank.
Our four-month intensive Entry Level Training Programme (ELTP) helps to create empowered employees and highly skilled professionals who can add significant value to the Bank. This year, the Bank recruited 238 trainees into the training school.
Training sessions2012
104
11
9
930
88
37
1,064
113
233
1,125
101
260
Quarter 1
Quarter 2
Average participants/trainingAverage hours/trainingNumber of training sessions
Quarter 3
Quarter 4
Number of trainees (ELTP)2008 to 2012
08 378
215
238
09
10
11
12
61
63
Gender empowermentAccess Bank’s Gender Empowerment (GEM) programme provides unique products for women (both entrepreneurs and professionals). In addition to access to finance, GEM provides training, capacity development and financial advisory services which improve the capacity of female entrepreneurs to run successful businesses. Our goal is to become a reference point and the bank of choice for female entrepreneurs in Africa.
Community focusWe have invested in initiatives that support the economic and social development of the diverse communities we serve through strategic partnerships and sponsorships. Our Employee Volunteering Programme provides an opportunity for employees to contribute to their communities in a sustainable manner by developing and championing Corporate Social Responsibility initiatives.
The Bank will continue to integrate diversity into recruitment processes, talent management and business strategies. Our aim is to maintain an inclusive and dynamic environment for employees, reflect the communities in which we do business and constantly seek better ways in which to serve our customers.
2
1
1 Teamwork is critical to organisational success; our employees come together to achieve greater results in a world-class work environment.
2 We care about employee satisfaction.

32 Access Bank Plc Annual Report and Accounts 2012
Access Bank has embedded sustainability into the core of its operations.
Corporate Social Responsibility
1
Business Review
33Access Bank Plc Annual Report and Accounts 2012
In 2012, the Bank continued to promote responsibility through sustainable practices. The Bank takes sustainability to mean creating the future we dream of. This means ensuring that the our actions our relationships create enduring value for our stakeholders and the communities in which we operate, while ensuring that our operations do not adversely affect the natural environment.
We are committed to delivering quality services and creating innovative products that positively affect the lives of our people and meet our customers’ needs. We take responsibility for ensuring that everything we do or say is a catalyst for a better life within the communities that we serve and beyond.
On our sustainability journey, we are more determined than ever to improve on our processes while focusing on core efforts that will increase our performance and impact on society and people. We are in continuous competition with ourselves; seeking ways to improve in the core areas of our corporate social responsibility strategy while also charting viable leadership for our industry.
An enduring legacy We believe that creating a sustainable business is the right thing to do, as it creates equity for our business, environment and community. We have embedded sustainability into the core of our activities and decision making processes. It is the fulcrum on which our Bank runs and this has highly influenced our Bank’s strategy as it looks forward to the future.
Building a lasting institution that is environmentally and socially reliable entails sound judgement, high responsibility and commitment to our stakeholders. We believe we can create a sustainable institution that will stand the test of time and deliver prosperity to our investors, communities and people. We are determined to build an enduring legacy by providing long-term value to our Shareholders without compromising our core commitment to social and environmental good.
Our sustainability strategyAs part of our sustainability strategy, we continuously evaluate our performance to ensure that we adhere to best practices, set new milestones for ourselves and provide the necessary tools for the implementation of our sustainability objectives.
We also focus on building our institutional capacity. We do this by leading through example and engaging the wider financial industry to share in and understand our sustainability objectives.
Our Executive Management and Board are the highest decision-making bodies in the Bank. They are responsible for steering Access Bank’s sustainability strategy through the Corporate Social Responsibility (CSR) Committee. The CSR Committee is responsible for the overall supervision of the Bank’s CSR activities as implemented by the Sustainability team. This includes endorsing the Bank’s sustainability initiatives, monitoring performance and releasing reports in the public domain.
Community investment Access Bank is committed to ensuring the socio-economic development of the communities we serve. We deliver value on every front to our customers, our people and our communities. We drive change and set the standards for others to follow while continually measuring our impact on society.
The Bank’s community investment initiatives have achieved lasting impacts and touched the lives of people in the communities in which we operate. We have been particularly successful in areas such as sports, environment, gender empowerment and health. We have positively influenced the wider financial industry by championing innovative lending policies and projects that have changed the way banks do business in Nigeria and elsewhere in sub-Saharan Africa, and confirmed our industry leadership.
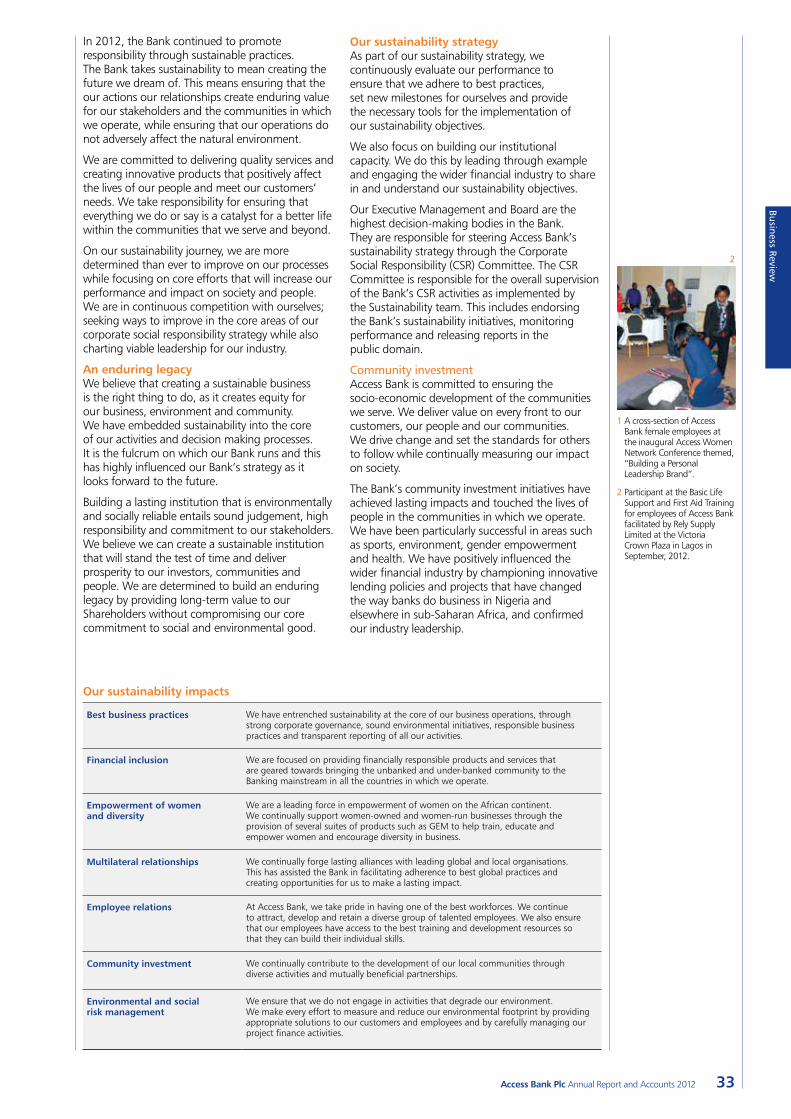
1 A cross-section of Access Bank female employees at the inaugural Access Women Network Conference themed, “Building a Personal Leadership Brand”.
2 Participant at the Basic Life Support and First Aid Training for employees of Access Bank facilitated by Rely Supply Limited at the Victoria Crown Plaza in Lagos in September, 2012.
2
Our sustainability impacts
Best business practices We have entrenched sustainability at the core of our business operations, through strong corporate governance, sound environmental initiatives, responsible business practices and transparent reporting of all our activities.
Financial inclusion We are focused on providing financially responsible products and services that are geared towards bringing the unbanked and under-banked community to the Banking mainstream in all the countries in which we operate.
Empowerment of women and diversity
We are a leading force in empowerment of women on the African continent. We continually support women-owned and women-run businesses through the provision of several suites of products such as GEM to help train, educate and empower women and encourage diversity in business.
Multilateral relationships We continually forge lasting alliances with leading global and local organisations. This has assisted the Bank in facilitating adherence to best global practices and creating opportunities for us to make a lasting impact.
Employee relations At Access Bank, we take pride in having one of the best workforces. We continue to attract, develop and retain a diverse group of talented employees. We also ensure that our employees have access to the best training and development resources so that they can build their individual skills.
Community investment We continually contribute to the development of our local communities through diverse activities and mutually beneficial partnerships.
Environmental and social risk management
We ensure that we do not engage in activities that degrade our environment. We make every effort to measure and reduce our environmental footprint by providing appropriate solutions to our customers and employees and by carefully managing our project finance activities.

34 Access Bank Plc Annual Report and Accounts 2012
Our financial inclusion strategy resulted in the creation of innovative products such as the Access Early Savers Account, which in 2012 helped provide banking services to more than 30,000 children aged at or below nine. We delivered practical financial and banking services and involved them in our financial literacy programme that aims to encourage financial awareness from an early age. This will help young people to enter formal financial systems, build assets in their youth and throughout their adult lives, and ultimately play a role in their own and their families’ personal economic and social advancement.
This financial inclusion strategy has also helped to build local structures that help the under-banked gain access to financial services. This in turn contributes to economic growth and wealth creation and has become key to tackling the ‘poverty trap’ seen in Nigeria and the other sub-Saharan markets in which we operate. Providing our customers with the opportunity to improve their financial literacy remains a key component of our wide focus on local communities.
In 2012, we supported several initiatives for community impact by collaborating with leading non-governmental organisations. We also contributed to community development by organising capacity development workshops and conferences in Nigeria and in other of our national markets, and by providing basic amenities for communities in need. The Bank also initiated, implemented and supported a number of health-related initiatives in collaboration with leading multilateral partners.
We also trained more than 2,200 small and medium-sized enterprises (SMEs) across Africa on how to develop and implement their own workplace health and HIV/AIDS policies.
Financial inclusionA key part of the Bank’s sustainability strategy, and indeed of our long-term success, is bringing the unbanked and under-banked into the mainstream economy. The development of products and services aimed at financial inclusion underlies our efforts to participate in the wider aim of addressing extreme poverty.
Corporate Social Responsibility continued
Number of children offered training on financial literacy
30,000
1

Business Review
35Access Bank Plc Annual Report and Accounts 2012
We also participated in the United Nations Global Compact (UNGC), Women Empowerment Principles (WEPs) Meeting held in March 2012 as part of our continuing commitment to Diversity. The WEPs for businesses have guided our efforts in empowering women in the workplace, marketplace and in the communities we serve. We are also part of the Women’s Empowerment Principles Leadership Group (WEPs LG) which is an umbrella body formed to provide strategic guidance and advice to WEPs. The WEPs LG also acts as a champion for the WEPs, encourages businesses around the world to adopt them and advises on issues concerning the private sector and women’s empowerment.
Employee volunteeringThrough our Employee Volunteering Scheme (EVS), our employees were positively able to impact our local communities through various initiatives. Our EVS allows our employees to volunteer during work hours for the purpose of community work, mentoring disadvantaged youths, participating in environmental action and offering their skills to local non-profit organisations.
To celebrate our employee volunteers, we produced a documentary entitled Access for All to portray the scheme’s impact on the community, environment and local people. The documentary also underlined the Bank’s leadership role, community service and social influence.
Female empowerment and diversityAccess Bank is committed to promoting diversity in the financial sector and has shown leadership on the African continent particularly on gender issues. This is reflected through our diverse contributions to the sustainability and economic empowerment of women both within the Bank, and in our operating environment. Through the Gender Empowerment Programme, and with the support of the World Bank’s International Finance Corporation (IFC), we were able to support more women-owned, women-run businesses and aspiring female entrepreneurs.
In 2012, beyond providing women with resources required to grow their businesses through capacity building workshops, networking opportunities, advisory services and market collaborations, the Bank also expanded the Access Women Network (AWN) during the year. The AWN focuses on providing the necessary platform for women within the Bank to ascend to the highest positions and reach the peak of their career.
The Network also held its inaugural AWN Conference entitled “Building a Personal Leadership Brand”. This conference provided a good platform for the Bank’s women to meet the Bank’s top tier of management and to hear leading speakers in Nigeria. The discussion explained how our female employees can achieve a balance between their career aspirations and personal life, while also developing themselves as leaders who are better able to succeed within the organisation.
Through our Employee Volunteering Scheme (EVS), our employees were positively able to impact our local communities through various initiatives.
1 Youths of Akodo-Ise Community participating at the football tournament organised by the Credit Risk Management Group as part of the Group’s employee volunteering initiative.
2 L-R: Executive Director, Access Bank Plc, Okey Nwuke; Chief Executive, ABSA Wealth, South Africa, Nomkhita Nqweni; and Managing Director, Standard Chartered Bank Zambia, Mizinga Melu, at the Access Bank’s sponsored 2nd African Women’s Economic Summit held in Lagos in July 2012.
3 A water project commissioned for the use of Akodo-Ise Community, in Ibeju Lekki Local Government Lagos, under Access Bank Employee Volunteering Initiative.
2
3

36 Access Bank Plc Annual Report and Accounts 2012
We continually engage global leaders with the aim of expanding our network. This has positioned the Bank as a leader in sustainability, particularly on the African continent. We remain committed to our existing partnerships with reputable local and international organisations.
Occupational health and safetyOur Occupational Health and Safety (OHS) processes advanced during the year with the start of the Second Phase of the Access Care project. This aims to train our employees in basic life support and first aid, including the use of automated external defibrillators, and to teach them how to respond to emergencies. More than 600 employees and 50 external stakeholders including journalists and NGOs participated. Our aim is to provide a safe, healthy and secure workplace for all our employees, contractors, visitors and customers, and to achieve a zero-harm environment. The Access Care training was part of the Bank’s wider aim to implement an OHS risk management process for the control of workplace hazards.
Another success was the “Community Empowerment through Sight Restoration and Skills Acquisition Programme”. As part of this initiative, our employees adopted the community of Akodo-Ise in Ibeju-Lekki and organised a free eyes-and-body examination, a skills acquisition programme and sporting activities with quiz competitions. More than 500 people benefited from the free eye test and treatment and locals were trained in basic entrepreneurial skills.
In addition, more than 5,000 primary school students benefited from the Bank’s EBS Employee Volunteering de-worming project at Ikate-Elegushi Community, and orphanages in rural Abuja were involved in a football competition organised in conjunction with the Peter Utaka Foundation.
Multilateral relationshipsAccess Bank has established successful alliances with reputable multilateral partners to enhance best practice regarding all aspects of our sustainability strategy and initiatives.
Corporate Social Responsibility continued
1
Number of people who benefited from free eye tests
500Number of employees on Health & Safety training courses
600
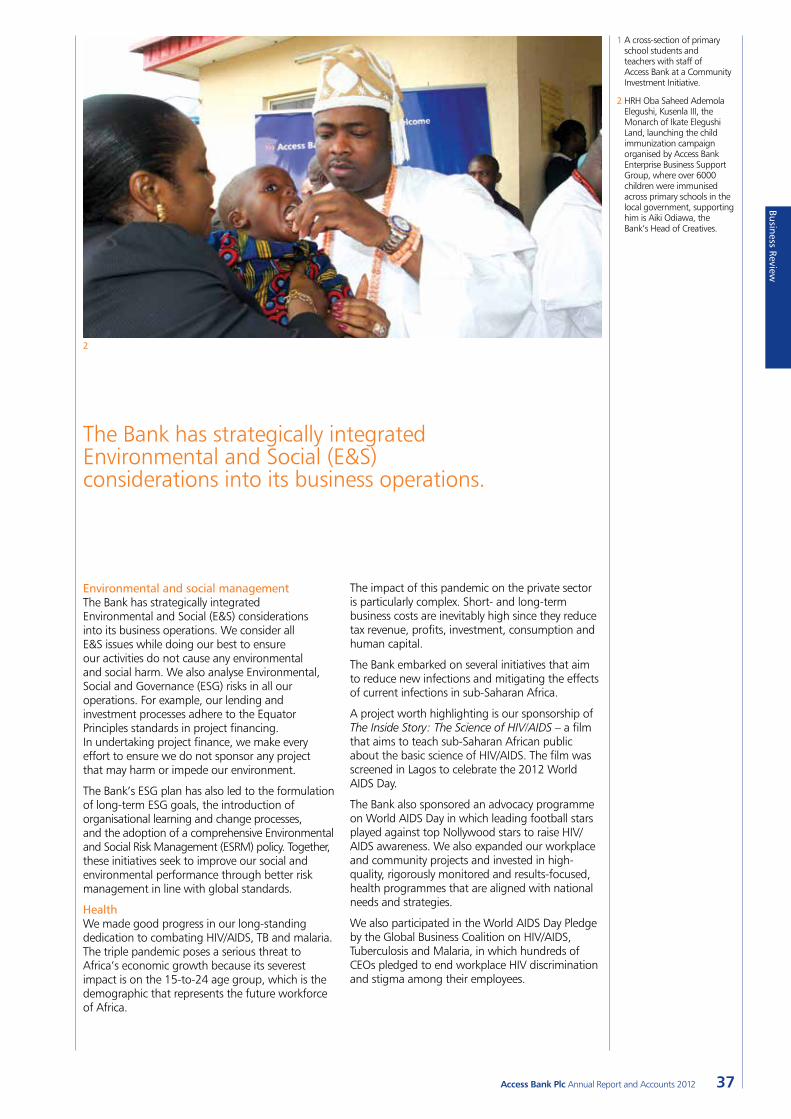
Business Review
37Access Bank Plc Annual Report and Accounts 2012
The impact of this pandemic on the private sector is particularly complex. Short- and long-term business costs are inevitably high since they reduce tax revenue, profits, investment, consumption and human capital.
The Bank embarked on several initiatives that aim to reduce new infections and mitigating the effects of current infections in sub-Saharan Africa.
A project worth highlighting is our sponsorship of The Inside Story: The Science of HIV/AIDS – a film that aims to teach sub-Saharan African public about the basic science of HIV/AIDS. The film was screened in Lagos to celebrate the 2012 World AIDS Day.
The Bank also sponsored an advocacy programme on World AIDS Day in which leading football stars played against top Nollywood stars to raise HIV/AIDS awareness. We also expanded our workplace and community projects and invested in high-quality, rigorously monitored and results-focused, health programmes that are aligned with national needs and strategies.
We also participated in the World AIDS Day Pledge by the Global Business Coalition on HIV/AIDS, Tuberculosis and Malaria, in which hundreds of CEOs pledged to end workplace HIV discrimination and stigma among their employees.
Environmental and social managementThe Bank has strategically integrated Environmental and Social (E&S) considerations into its business operations. We consider all E&S issues while doing our best to ensure our activities do not cause any environmental and social harm. We also analyse Environmental, Social and Governance (ESG) risks in all our operations. For example, our lending and investment processes adhere to the Equator Principles standards in project financing. In undertaking project finance, we make every effort to ensure we do not sponsor any project that may harm or impede our environment.
The Bank’s ESG plan has also led to the formulation of long-term ESG goals, the introduction of organisational learning and change processes, and the adoption of a comprehensive Environmental and Social Risk Management (ESRM) policy. Together, these initiatives seek to improve our social and environmental performance through better risk management in line with global standards.
Health We made good progress in our long-standing dedication to combating HIV/AIDS, TB and malaria. The triple pandemic poses a serious threat to Africa’s economic growth because its severest impact is on the 15-to-24 age group, which is the demographic that represents the future workforce of Africa.
2
1 A cross-section of primary school students and teachers with staff of Access Bank at a Community Investment Initiative.
2 HRH Oba Saheed Ademola Elegushi, Kusenla III, the Monarch of Ikate Elegushi Land, launching the child immunization campaign organised by Access Bank Enterprise Business Support Group, where over 6000 children were immunised across primary schools in the local government, supporting him is Aiki Odiawa, the Bank’s Head of Creatives.
The Bank has strategically integrated Environmental and Social (E&S) considerations into its business operations.
38 Access Bank Plc Annual Report and Accounts 2012
Access Bank recognises the role of responsible risk-management practices in achieving its strategic vision of being the most respected Bank in Africa. The Bank has a well-established risk-governance structure and an experienced risk team. Our risk-management framework provides essential tools to enable us take timely and informed decisions to maximise opportunities and mitigate potential threats.
Our approach to risk-managementRisk is an inherent part of Access Bank Plc and its subsidiary companies’ (“the Bank” or “the Group”) business activities. Access Bank’s overall risk tolerance is established in the context of the Bank’s earnings power, capital, and diversified business model. Effective risk-management is critical to any Bank for achieving financial soundness. In view of this, aligning risk-management to the Bank’s organisational structure and business strategy has become an integral part of our business. Access Bank’s risk-management framework and governance structure are intended to provide comprehensive controls and ongoing management of the major risks inherent in its business activities. It is also intended to create a culture of risk awareness and personal responsibility throughout the Bank.
Access Bank has been disciplined in its management of risk. The Group has increased its focus on the inter-relationships between risk types and, where appropriate, underwriting standards have been tightened. It has also conducted periodic reviews of risk exposure limits and risk control so as to position itself against any adverse scenarios. To mitigate against a higher level of market volatility and economic uncertainty, the Group regularly subjects its exposures to a range of stress tests across a wide variety of products, currencies, portfolios and customer segments.
The Bank’s risk-management architecture is carefully crafted to balance corporate oversight with well-defined risk-management functions which fall into one of three categories where risk must be managed: lines of business, governance and control, and corporate audit. The Board of Directors and management of the Bank are committed constantly to establishing, implementing and sustaining tested practices in risk-management to match those of leading international banks. We are convinced that the long-term sustainability of our Group depends critically on the proper governance and effective management of our business. As such, risk-management occupies a significant position of relevance and importance in the Bank.
The Board of Directors determines Access Bank’s overall objectives in terms of risk by issuing risk policies. These policies define acceptable levels of risk for day-to-day operations as well as the willingness of Access Bank to assume risk, weighed against the expected rewards. The umbrella risk policy is detailed in the Enterprise Risk-Management (ERM) Framework, which is a structured approach to identifying opportunities, assessing the risk inherent in these opportunities and actively managing these risks in a cost-effective manner. It is a top-level integrated approach to events identification and analysis for proper assessment, monitoring and identification of business opportunities. Specific policies are also in place for managing
risks in the different core risk areas of credit, market and operational risks as well as for other key risks covering areas such as liquidity, strategic and reputation.
The evolving nature of risk-management practices and the dynamic character of the banking industry necessitate regular review of the effectiveness of each enterprise risk-management component. In light of this, the Bank’s ERM Framework is subject to continuous review to ensure effective and cutting-edge risk-management. The review is conducted in either or both of the following ways: via continuous self-evaluation and monitoring by the risk-management and compliance functions in conjunction with internal audit; and through independent evaluation by external auditors, examiners and consultants.
The Chief Risk Officer has primary responsibility for risk-management and the review of the ERM Framework and for providing robust challenge to the management teams based on quantitative and qualitative metrics. All amendments to the Bank’s ERM Framework require Board approval. The Risk-Management and Compliance Division is responsible for the enforcement of the Bank’s risk policy by constantly monitoring risk, with the aim of identifying and quantifying significant risk exposures and acting upon such exposures as necessary.
Overall, we view risk not only as a threat or uncertainty, but also as a potential opportunity to grow and develop the business, within the context of our clearly articulated and Board-driven risk appetite. Hence our approach to risk-management is not limited to considering downside impacts or risk avoidance; it also encompasses taking risk knowingly for competitive advantage. Access Bank approaches risk, capital and value management robustly and we believe that our initiatives to date have positioned the Group at the leading edge of risk-management.
Risk-management frameworkWe believe effective risk-management is more than just the collection and analysis of data. It also encompasses the insights delivered by information that facilitates appropriate actions. Access Bank benefits from having enhanced its Group risk-management framework, which gives full Group-wide coverage of a variety of risks.
Our annual risk cycle is designed to give management relevant, up-to-date information from which trends can be observed and assessed. The governance structure supporting our risk cycle is designed to deliver the right information, at the right time, to the right people.
Ultimately, the success of our risk-management framework is determined by the extent to which it embeds into the corporate culture and leads to demonstrably better outcomes.
We are committed to the continued development of our risk-management framework.
We recognise the role of responsible risk-management practices in achieving our strategic vision, and have a well-established risk governance structure and an experienced risk team.
Managing Risk for a Sustainable Future
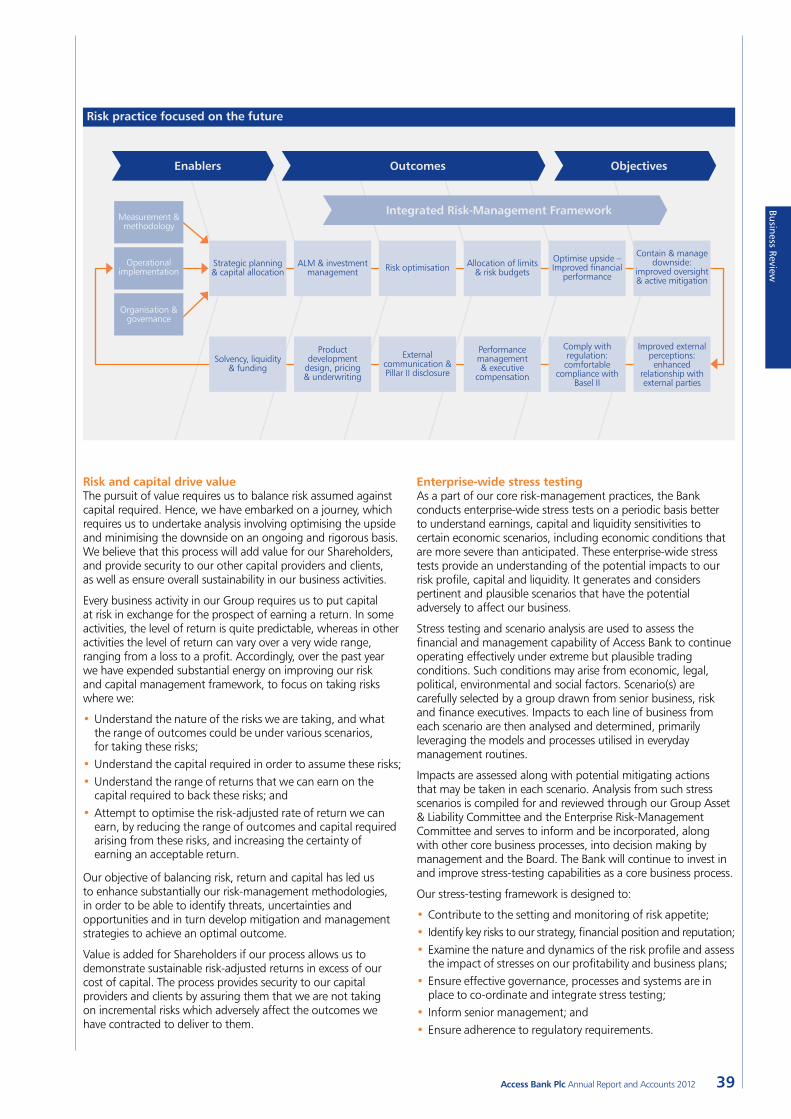
Business Review
39Access Bank Plc Annual Report and Accounts 2012
OutcomesEnablers
Integrated Risk-Management Framework
Objectives
Measurement & methodology
Strategic planning & capital allocation
Solvency, liquidity & funding
Product development
design, pricing & underwriting
External communication & Pillar II disclosure
Performance management & executive
compensation
Comply with regulation: comfortable
compliance with Basel II
Improved external perceptions: enhanced
relationship with external parties
ALM & investment management
Allocation of limits& risk budgets
Optimise upside – Improved financial
performance
Contain & manage downside:
improved oversight & active mitigation
Risk optimisationOperational implementation
Organisation & governance
Risk practice focused on the future
Risk and capital drive value The pursuit of value requires us to balance risk assumed against capital required. Hence, we have embarked on a journey, which requires us to undertake analysis involving optimising the upside and minimising the downside on an ongoing and rigorous basis. We believe that this process will add value for our Shareholders, and provide security to our other capital providers and clients, as well as ensure overall sustainability in our business activities.
Every business activity in our Group requires us to put capital at risk in exchange for the prospect of earning a return. In some activities, the level of return is quite predictable, whereas in other activities the level of return can vary over a very wide range, ranging from a loss to a profit. Accordingly, over the past year we have expended substantial energy on improving our risk and capital management framework, to focus on taking risks where we:
•Understand the nature of the risks we are taking, and what the range of outcomes could be under various scenarios, for taking these risks;
•Understand the capital required in order to assume these risks;•Understand the range of returns that we can earn on the
capital required to back these risks; and•Attempt to optimise the risk-adjusted rate of return we can
earn, by reducing the range of outcomes and capital required arising from these risks, and increasing the certainty of earning an acceptable return.
Our objective of balancing risk, return and capital has led us to enhance substantially our risk-management methodologies, in order to be able to identify threats, uncertainties and opportunities and in turn develop mitigation and management strategies to achieve an optimal outcome.
Value is added for Shareholders if our process allows us to demonstrate sustainable risk-adjusted returns in excess of our cost of capital. The process provides security to our capital providers and clients by assuring them that we are not taking on incremental risks which adversely affect the outcomes we have contracted to deliver to them.
Enterprise-wide stress testingAs a part of our core risk-management practices, the Bank conducts enterprise-wide stress tests on a periodic basis better to understand earnings, capital and liquidity sensitivities to certain economic scenarios, including economic conditions that are more severe than anticipated. These enterprise-wide stress tests provide an understanding of the potential impacts to our risk profile, capital and liquidity. It generates and considers pertinent and plausible scenarios that have the potential adversely to affect our business.
Stress testing and scenario analysis are used to assess the financial and management capability of Access Bank to continue operating effectively under extreme but plausible trading conditions. Such conditions may arise from economic, legal, political, environmental and social factors. Scenario(s) are carefully selected by a group drawn from senior business, risk and finance executives. Impacts to each line of business from each scenario are then analysed and determined, primarily leveraging the models and processes utilised in everyday management routines.
Impacts are assessed along with potential mitigating actions that may be taken in each scenario. Analysis from such stress scenarios is compiled for and reviewed through our Group Asset & Liability Committee and the Enterprise Risk-Management Committee and serves to inform and be incorporated, along with other core business processes, into decision making by management and the Board. The Bank will continue to invest in and improve stress-testing capabilities as a core business process.
Our stress-testing framework is designed to:
•Contribute to the setting and monitoring of risk appetite;• Identify key risks to our strategy, financial position and reputation;•Examine the nature and dynamics of the risk profile and assess
the impact of stresses on our profitability and business plans;•Ensure effective governance, processes and systems are in
place to co-ordinate and integrate stress testing;• Inform senior management; and •Ensure adherence to regulatory requirements.
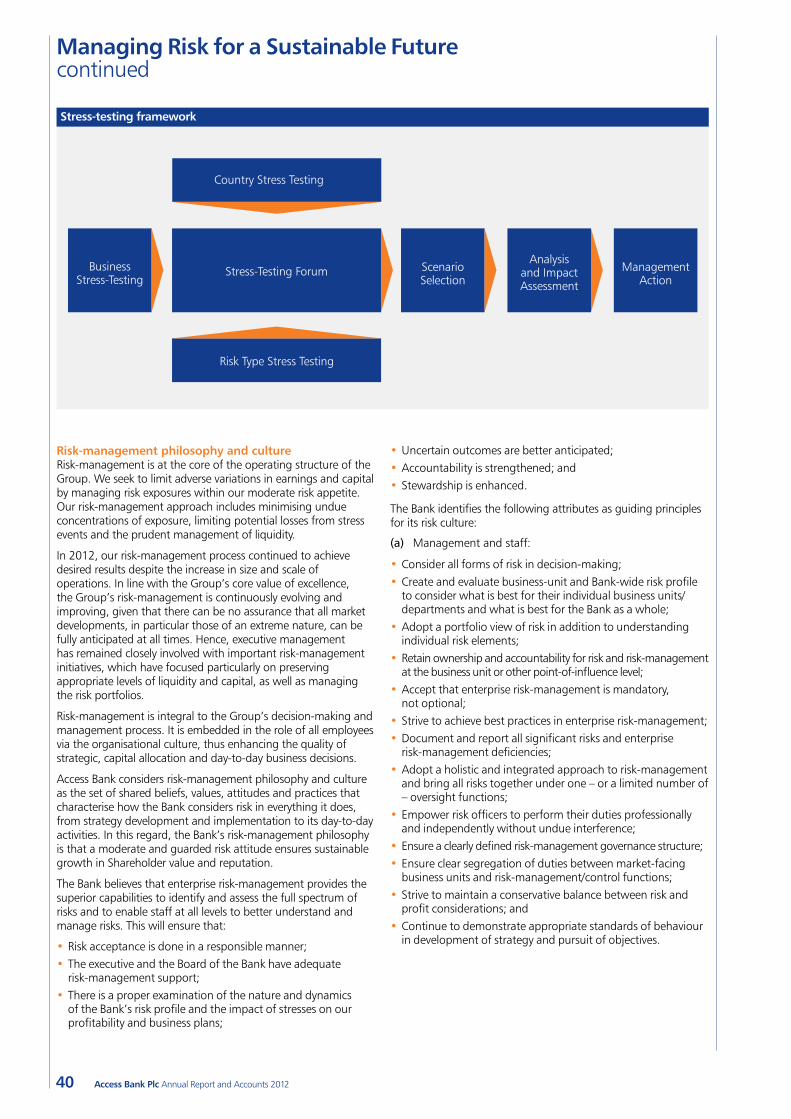
40 Access Bank Plc Annual Report and Accounts 2012
Risk-management philosophy and cultureRisk-management is at the core of the operating structure of the Group. We seek to limit adverse variations in earnings and capital by managing risk exposures within our moderate risk appetite. Our risk-management approach includes minimising undue concentrations of exposure, limiting potential losses from stress events and the prudent management of liquidity.
In 2012, our risk-management process continued to achieve desired results despite the increase in size and scale of operations. In line with the Group’s core value of excellence, the Group’s risk-management is continuously evolving and improving, given that there can be no assurance that all market developments, in particular those of an extreme nature, can be fully anticipated at all times. Hence, executive management has remained closely involved with important risk-management initiatives, which have focused particularly on preserving appropriate levels of liquidity and capital, as well as managing the risk portfolios.
Risk-management is integral to the Group’s decision-making and management process. It is embedded in the role of all employees via the organisational culture, thus enhancing the quality of strategic, capital allocation and day-to-day business decisions.
Access Bank considers risk-management philosophy and culture as the set of shared beliefs, values, attitudes and practices that characterise how the Bank considers risk in everything it does, from strategy development and implementation to its day-to-day activities. In this regard, the Bank’s risk-management philosophy is that a moderate and guarded risk attitude ensures sustainable growth in Shareholder value and reputation.
The Bank believes that enterprise risk-management provides the superior capabilities to identify and assess the full spectrum of risks and to enable staff at all levels to better understand and manage risks. This will ensure that:
•Risk acceptance is done in a responsible manner;•The executive and the Board of the Bank have adequate
risk-management support;•There is a proper examination of the nature and dynamics
of the Bank’s risk profile and the impact of stresses on our profitability and business plans;
•Uncertain outcomes are better anticipated;•Accountability is strengthened; and•Stewardship is enhanced.
The Bank identifies the following attributes as guiding principles for its risk culture:
(a) Management and staff:
•Consider all forms of risk in decision-making;•Create and evaluate business-unit and Bank-wide risk profile
to consider what is best for their individual business units/departments and what is best for the Bank as a whole;
•Adopt a portfolio view of risk in addition to understanding individual risk elements;
•Retain ownership and accountability for risk and risk-management at the business unit or other point-of-influence level;
•Accept that enterprise risk-management is mandatory, not optional;
•Strive to achieve best practices in enterprise risk-management;•Document and report all significant risks and enterprise
risk-management deficiencies;•Adopt a holistic and integrated approach to risk-management
and bring all risks together under one – or a limited number of – oversight functions;
•Empower risk officers to perform their duties professionally and independently without undue interference;
•Ensure a clearly defined risk-management governance structure;•Ensure clear segregation of duties between market-facing
business units and risk-management/control functions;•Strive to maintain a conservative balance between risk and
profit considerations; and•Continue to demonstrate appropriate standards of behaviour
in development of strategy and pursuit of objectives.
Managing Risk for a Sustainable Future continued
Business Stress-Testing
Scenario Selection
Analysis and Impact Assessment
Management Action
Stress-Testing Forum
Country Stress Testing
Risk Type Stress Testing
Stress-testing framework
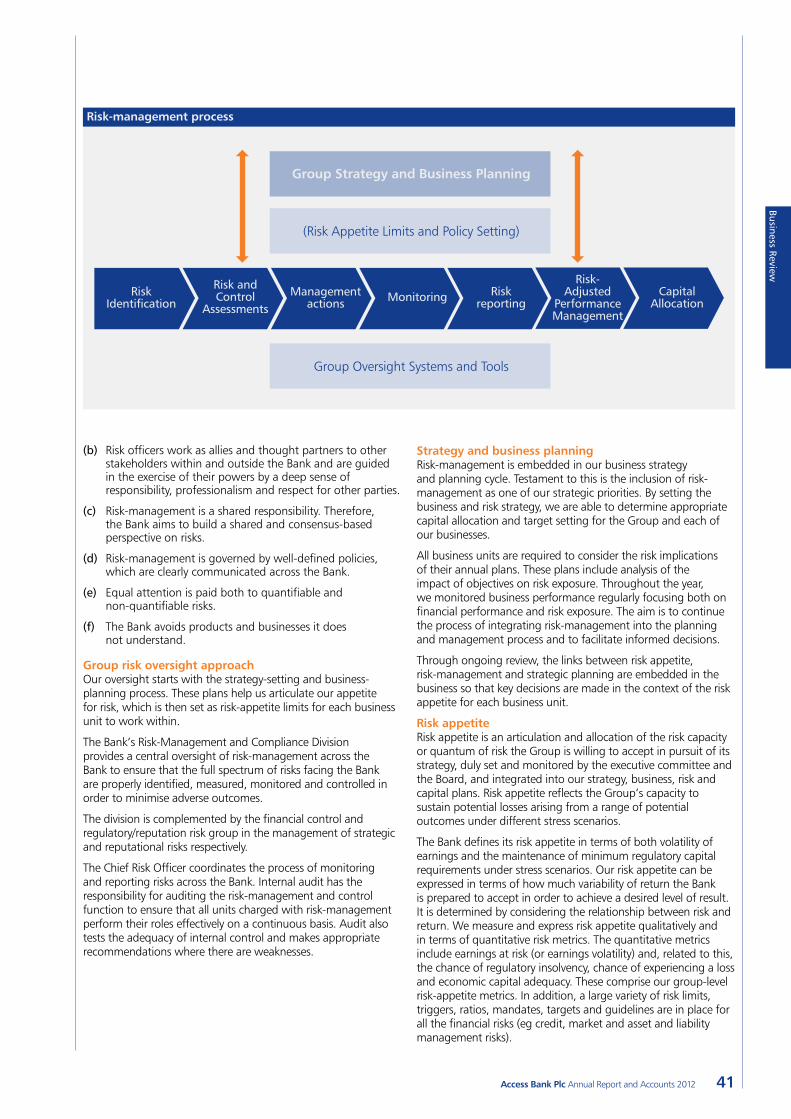
Business Review
41Access Bank Plc Annual Report and Accounts 2012
RiskIdentification
Risk andControl
AssessmentsManagement
actions Monitoring Riskreporting
Risk-Adjusted
PerformanceManagement
CapitalAllocation
Group Strategy and Business Planning
(Risk Appetite Limits and Policy Setting)
Group Oversight Systems and Tools
Risk-management process
(b) Risk officers work as allies and thought partners to other stakeholders within and outside the Bank and are guided in the exercise of their powers by a deep sense of responsibility, professionalism and respect for other parties.
(c) Risk-management is a shared responsibility. Therefore, the Bank aims to build a shared and consensus-based perspective on risks.
(d) Risk-management is governed by well-defined policies, which are clearly communicated across the Bank.
(e) Equal attention is paid both to quantifiable and non-quantifiable risks.
(f) The Bank avoids products and businesses it does not understand.
Group risk oversight approachOur oversight starts with the strategy-setting and business-planning process. These plans help us articulate our appetite for risk, which is then set as risk-appetite limits for each business unit to work within.
The Bank’s Risk-Management and Compliance Division provides a central oversight of risk-management across the Bank to ensure that the full spectrum of risks facing the Bank are properly identified, measured, monitored and controlled in order to minimise adverse outcomes.
The division is complemented by the financial control and regulatory/reputation risk group in the management of strategic and reputational risks respectively.
The Chief Risk Officer coordinates the process of monitoring and reporting risks across the Bank. Internal audit has the responsibility for auditing the risk-management and control function to ensure that all units charged with risk-management perform their roles effectively on a continuous basis. Audit also tests the adequacy of internal control and makes appropriate recommendations where there are weaknesses.
Strategy and business planning Risk-management is embedded in our business strategy and planning cycle. Testament to this is the inclusion of risk-management as one of our strategic priorities. By setting the business and risk strategy, we are able to determine appropriate capital allocation and target setting for the Group and each of our businesses.
All business units are required to consider the risk implications of their annual plans. These plans include analysis of the impact of objectives on risk exposure. Throughout the year, we monitored business performance regularly focusing both on financial performance and risk exposure. The aim is to continue the process of integrating risk-management into the planning and management process and to facilitate informed decisions.
Through ongoing review, the links between risk appetite, risk-management and strategic planning are embedded in the business so that key decisions are made in the context of the risk appetite for each business unit.
Risk appetiteRisk appetite is an articulation and allocation of the risk capacity or quantum of risk the Group is willing to accept in pursuit of its strategy, duly set and monitored by the executive committee and the Board, and integrated into our strategy, business, risk and capital plans. Risk appetite reflects the Group’s capacity to sustain potential losses arising from a range of potential outcomes under different stress scenarios.
The Bank defines its risk appetite in terms of both volatility of earnings and the maintenance of minimum regulatory capital requirements under stress scenarios. Our risk appetite can be expressed in terms of how much variability of return the Bank is prepared to accept in order to achieve a desired level of result. It is determined by considering the relationship between risk and return. We measure and express risk appetite qualitatively and in terms of quantitative risk metrics. The quantitative metrics include earnings at risk (or earnings volatility) and, related to this, the chance of regulatory insolvency, chance of experiencing a loss and economic capital adequacy. These comprise our group-level risk-appetite metrics. In addition, a large variety of risk limits, triggers, ratios, mandates, targets and guidelines are in place for all the financial risks (eg credit, market and asset and liability management risks).
42 Access Bank Plc Annual Report and Accounts 2012
Managing Risk for a Sustainable Future continued
The Bank’s risk profile is assessed through a “bottom-up” analytical approach covering all of the Group’s major businesses, countries and products. The risk appetite is approved by the Board and forms the basis for establishing the risk parameters within which the businesses must operate, including policies, concentration limits and business mix.
In 2012, the risk-appetite metrics were tracked against approved triggers and exceptions were reported to management for prompt corrective actions. Key issues were also escalated to the Enterprise Risk-Management Committee and the Board Risk-Management Committee.
Risk-management objectivesThe broad risk-management objectives of the Bank are:
•To identify and manage existing and new risks in a planned and coordinated manner with minimum disruption and cost;
•To protect against unforeseen losses and ensure stability of earnings;
•To maximise earnings potential and opportunities;•To maximise share price and stakeholder protection;•To enhance credit ratings and depositor, analyst, investor
and regulator perception; and•To develop a risk culture that encourages all staff to identify
risks and associated opportunities and to respond to them with cost-effective actions.
Scope of risksThe scope of risks that are directly managed by the Bank is as follows:
•Credit risk;•Operational risk;•Market and liquidity risk;•Legal and compliance risk;•Strategic risk;•Reputational risk; and•Capital risk.
These risks and the framework for their management are detailed in the ERM Framework.
Responsibilities and functionsThe responsibilities of the Risk-Management and Compliance Division, the Financial Control and Strategy Group and the Regulatory/Reputation Risk Group with respect to risk-management are highlighted below:
Risk-Management and Compliance Division(a) Champion the implementation of the ERM Framework
across the Bank and subsidiaries. Periodically receive risk reports from management highlighting key risk areas, control failures and remedial action steps taken by management;
(b) Develop risk policies, principles, process and reporting standards that define the Bank’s risk strategy and appetite in line with the Bank’s overall business objectives;
(c) Ensure that controls, skills and systems are in place to enable compliance with the Bank’s policies and standards;
(d) Facilitate the identification, measurement, assessment, monitoring and control of the level of risks in the Bank;
(e) Collect, process, verify, monitor and distribute risk information across the Bank and other material risk issues to senior management, the Board and regulators;
(f) Monitor compliance with Bank-wide risk policies and limits;
(g) Provide senior management with practical, cost-effective recommendations for improvement of risk-management;
(h) Act as a key contact for senior management who may wish to request ad hoc reviews/investigations;
(i) Ensure that laws, regulations and supervisory requirements are complied with including consequence management;
(j) Champion the implementation of Basel II;
(k) Promote risk awareness and provide education on risk; and
(l) Provide assurance on compliance with internal and external policies with respect to risk-management.
Financial Control and Strategy Group(a) Prepare and monitor the implementation of the
Bank’s strategic plan;
(b) Conduct strategic and operational review of the Bank’s activities;
(c) Conduct regular scanning of the Bank’s operating environment;
(d) Coordinate and monitor the Bank’s rating by external rating agencies;
(e) Prepare business intelligence reports for the Bank’s management;
(f) Prepare periodic management reports on subsidiaries and associates;
(g) Perform competitive analysis in comparison with industry peers; and
(h) Conduct strategic/operational review of branches.
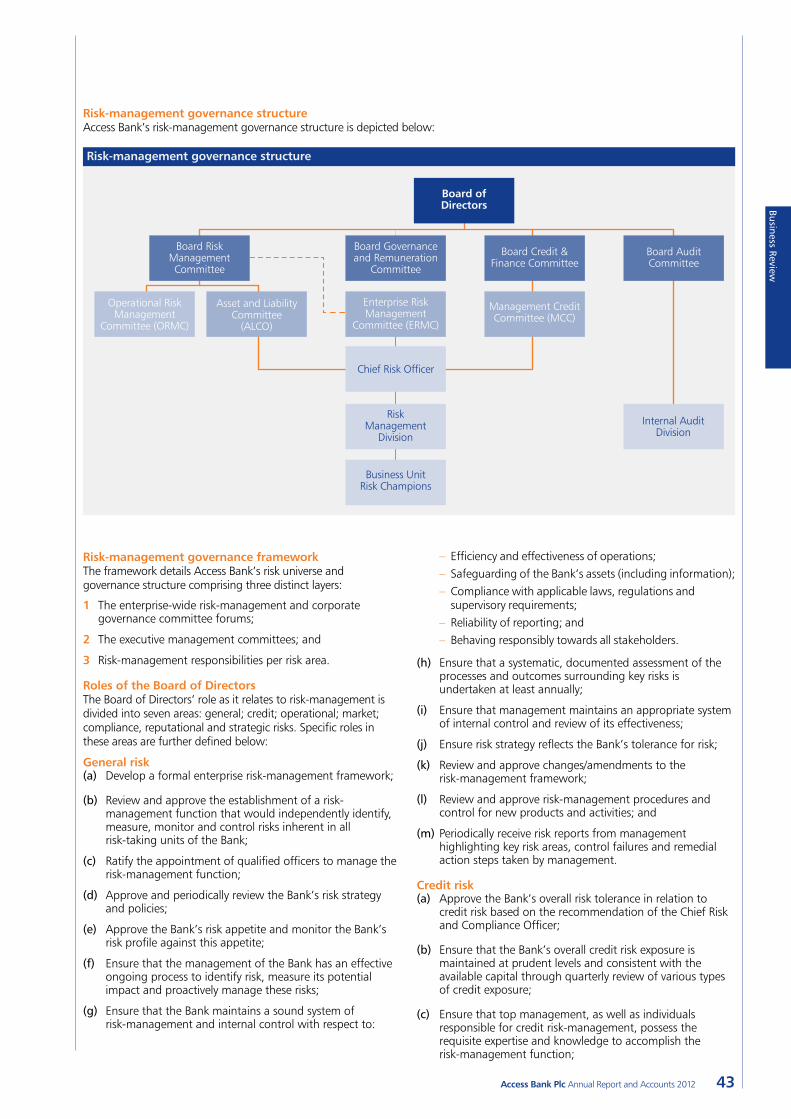
Business Review
43Access Bank Plc Annual Report and Accounts 2012
– Efficiency and effectiveness of operations; – Safeguarding of the Bank’s assets (including information); – Compliance with applicable laws, regulations and supervisory requirements;
– Reliability of reporting; and – Behaving responsibly towards all stakeholders.
(h) Ensure that a systematic, documented assessment of the processes and outcomes surrounding key risks is undertaken at least annually;
(i) Ensure that management maintains an appropriate system of internal control and review of its effectiveness;
(j) Ensure risk strategy reflects the Bank’s tolerance for risk;
(k) Review and approve changes/amendments to the risk-management framework;
(l) Review and approve risk-management procedures and control for new products and activities; and
(m) Periodically receive risk reports from management highlighting key risk areas, control failures and remedial action steps taken by management.
Credit risk(a) Approve the Bank’s overall risk tolerance in relation to
credit risk based on the recommendation of the Chief Risk and Compliance Officer;
(b) Ensure that the Bank’s overall credit risk exposure is maintained at prudent levels and consistent with the available capital through quarterly review of various types of credit exposure;
(c) Ensure that top management, as well as individuals responsible for credit risk-management, possess the requisite expertise and knowledge to accomplish the risk-management function;
Risk-management governance frameworkThe framework details Access Bank’s risk universe and governance structure comprising three distinct layers:
1 The enterprise-wide risk-management and corporate governance committee forums;
2 The executive management committees; and
3 Risk-management responsibilities per risk area.
Roles of the Board of DirectorsThe Board of Directors’ role as it relates to risk-management is divided into seven areas: general; credit; operational; market; compliance, reputational and strategic risks. Specific roles in these areas are further defined below:
General risk(a) Develop a formal enterprise risk-management framework;
(b) Review and approve the establishment of a risk-management function that would independently identify, measure, monitor and control risks inherent in all risk-taking units of the Bank;
(c) Ratify the appointment of qualified officers to manage the risk-management function;
(d) Approve and periodically review the Bank’s risk strategy and policies;
(e) Approve the Bank’s risk appetite and monitor the Bank’s risk profile against this appetite;
(f) Ensure that the management of the Bank has an effective ongoing process to identify risk, measure its potential impact and proactively manage these risks;
(g) Ensure that the Bank maintains a sound system of risk-management and internal control with respect to:
Board of Directors
Chief Risk Officer
Risk Management
Division
Internal Audit Division
Business UnitRisk Champions
Board RiskManagement Committee
Operational Risk Management
Committee (ORMC)
Asset and Liability Committee
(ALCO)
Enterprise Risk Management
Committee (ERMC)
Management Credit Committee (MCC)
Board Governance and Remuneration
Committee
Board Credit & Finance Committee
Board Audit Committee
Risk-management governance structure
Risk-management governance structureAccess Bank’s risk-management governance structure is depicted below:
44 Access Bank Plc Annual Report and Accounts 2012
Reputational risk(a) Set an appropriate tone and guidelines regarding the
development and implementation of effective reputation risk-management practices, including an explicit statement of a zero-tolerance policy for all unethical behaviour;
(b) Approve the Bank’s framework for the identification, measurement, control and management of reputational risk;
(c) Monitor the Bank’s compliance with its reputational risk-management policies and recommend sanctions for material breaches of internal policies;
(d) Review all exception reports by external parties such as regulators and auditors; ensure that appropriate sanctions are applied to erring officers; demand from management appropriate explanations for all exceptional items; ensure that management puts in place effective and remedial actions and reports on progress to the Board on an ongoing basis;
(e) Ensure that Board members do not compromise their fit and proper status with regulators. They shall ensure that only Board members who do not tarnish the Bank’s image and reputation remain as members; and
(f) Ensure that only fit and proper persons are appointed to senior management positions in the Bank.
Strategic risk(a) Oversee the strategic risk-management process;
(b) Ensure that the Bank has in place an appropriate strategic risk-management framework which suits its own circumstances and needs;
(c) Ensure that the strategic goals and objectives are set in line with the Bank’s corporate mission and values, culture, business direction and risk tolerance;
(d) Approve the strategic plan (including strategies contained therein) and any subsequent changes, and review the plan (at least annually) to ensure its appropriateness;
(e) Ensure the organisation’s structure, culture, infrastructure, financial means, managerial resources and capabilities, as well as systems and controls, are appropriate and adequate to support the implementation of its strategies;
(f) Review high-level reports periodically submitted to the Board on the overall strategic risk profile, and ensure that any material risks and strategic implications identified from those reports are properly addressed; and
(g) Ensure that senior management is competent in implementing strategic decisions approved by the Board, and in supervising such performance on a continuing basis.
Board committeesThe Board carries out its oversight function through its standing committees, each of which has a charter that clearly defines its purpose, composition, structure, frequency of meetings, duties, tenure and reporting lines to the Board.
In line with best practice, the Chairman of the Board does not sit on any of the committees. The Board’s four standing committees are: the Board Risk-Management Committee, the Board Audit Committee, the Board Governance & Remuneration Committee and the Board Credit & Finance Committee.
The management committees are: the Executive Committee (EXCO), the Enterprise Risk-Management Committee (ERMC), Management Credit Committee (MCC), Group Asset & Liability Committee (Group ALCO), and the Operational Risk-Management Committee (ORMC).
Managing Risk for a Sustainable Future continued
(d) Ensure that the Bank implements a sound methodology that facilitates the identification, measurement, monitoring and control of credit risk;
(e) Ensure that detailed policies and procedures for credit risk exposure creation, management and recovery are in place; and
(f) Appoint credit officers and delegate approval authorities to individuals and committees.
Operational risk(a) Oversee the overall governance of the Bank’s operational
risk-management process;
(b) Set the Bank’s operational risk strategy and direction in line with the Bank’s corporate strategy;
(c) Approve the Bank’s operational risk-management framework;
(d) Periodically review the framework to ensure its relevance and effectiveness;
(e) Ensure that senior management is performing their risk-management responsibilities; and
(f) Ensure that the Bank’s operational risk-management framework is subject to effective and comprehensive internal audit by operationally independent, appropriately trained and competent staff.
Market risk(a) Define the Bank’s overall risk appetite in relation to
market risk;
(b) Ensure that the Bank’s overall market risk exposure is maintained at levels consistent with the available capital;
(c) Ensure that top management, as well as individuals responsible for market risk-management, possess sound expertise and knowledge to accomplish the risk-management function;
(d) Approve the Bank’s strategic direction and tolerance level for liquidity risk;
(e) Ensure that the Bank’s senior management has the ability and required authority to manage liquidity risk;
(f) Approve the Bank’s liquidity risk-management framework; and
(g) Ensure that liquidity risk is identified, measured, monitored and controlled.
Compliance risk(a) Approve the Bank’s code of conduct and ethics;
(b) Monitor the Bank’s compliance with laws and regulations, its code of conduct and ethics and Corporate governance practices;
(c) Ensure new and changed legal and regulatory requirements are identified, monitored and reflected in Bank processes;
(d) Approve the compliance structure, mechanisms and processes established by management to ensure compliance with current laws, regulations and supervisory requirements; and
(e) Ensure the Bank has a compliance culture that contributes to the overall objective of risk-management.
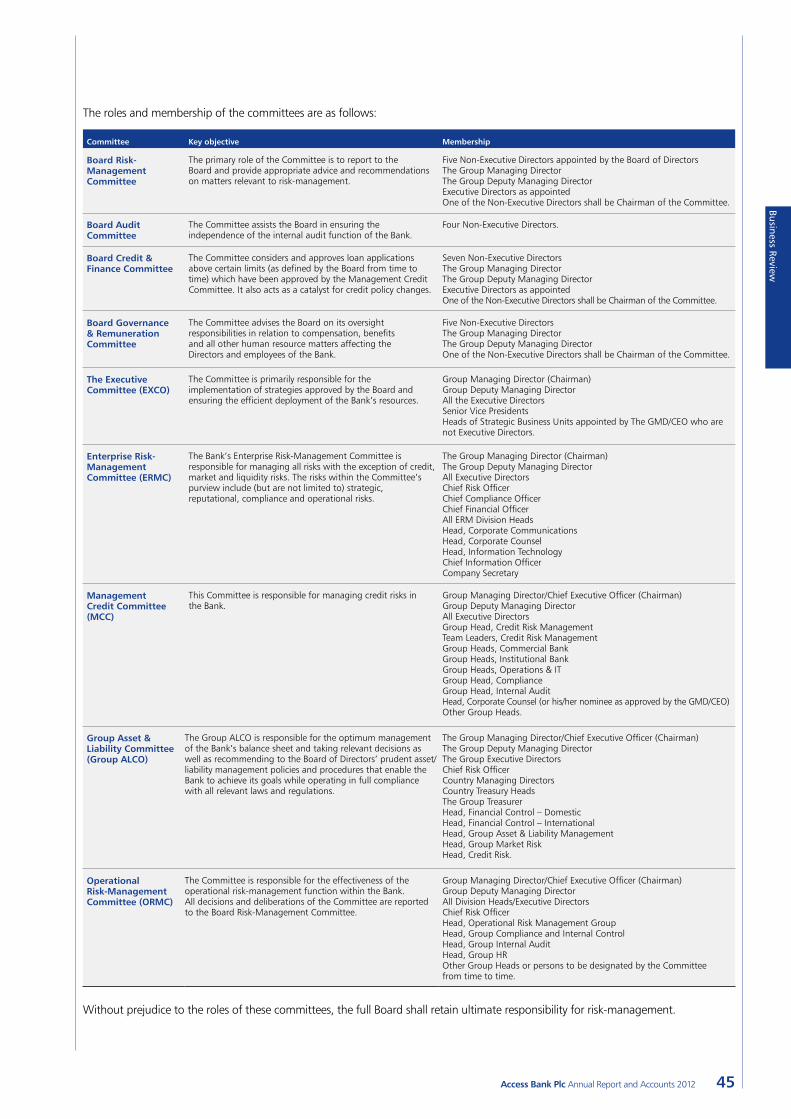
Business Review
45Access Bank Plc Annual Report and Accounts 2012
The roles and membership of the committees are as follows:
Committee Key objective Membership
Board Risk-Management Committee
The primary role of the Committee is to report to the Board and provide appropriate advice and recommendations on matters relevant to risk-management.
Five Non-Executive Directors appointed by the Board of DirectorsThe Group Managing DirectorThe Group Deputy Managing DirectorExecutive Directors as appointedOne of the Non-Executive Directors shall be Chairman of the Committee.
Board Audit Committee
The Committee assists the Board in ensuring the independence of the internal audit function of the Bank.
Four Non-Executive Directors.
Board Credit & Finance Committee
The Committee considers and approves loan applications above certain limits (as defined by the Board from time to time) which have been approved by the Management Credit Committee. It also acts as a catalyst for credit policy changes.
Seven Non-Executive DirectorsThe Group Managing DirectorThe Group Deputy Managing DirectorExecutive Directors as appointedOne of the Non-Executive Directors shall be Chairman of the Committee.
Board Governance & Remuneration Committee
The Committee advises the Board on its oversight responsibilities in relation to compensation, benefits and all other human resource matters affecting the Directors and employees of the Bank.
Five Non-Executive DirectorsThe Group Managing DirectorThe Group Deputy Managing DirectorOne of the Non-Executive Directors shall be Chairman of the Committee.
The Executive Committee (EXCO)
The Committee is primarily responsible for the implementation of strategies approved by the Board and ensuring the efficient deployment of the Bank’s resources.
Group Managing Director (Chairman)Group Deputy Managing DirectorAll the Executive DirectorsSenior Vice PresidentsHeads of Strategic Business Units appointed by The GMD/CEO who are not Executive Directors.
Enterprise Risk-Management Committee (ERMC)
The Bank’s Enterprise Risk-Management Committee is responsible for managing all risks with the exception of credit, market and liquidity risks. The risks within the Committee’s purview include (but are not limited to) strategic, reputational, compliance and operational risks.
The Group Managing Director (Chairman)The Group Deputy Managing DirectorAll Executive DirectorsChief Risk OfficerChief Compliance Officer Chief Financial OfficerAll ERM Division HeadsHead, Corporate CommunicationsHead, Corporate CounselHead, Information Technology Chief Information OfficerCompany Secretary
Management Credit Committee (MCC)
This Committee is responsible for managing credit risks in the Bank.
Group Managing Director/Chief Executive Officer (Chairman)Group Deputy Managing Director All Executive DirectorsGroup Head, Credit Risk ManagementTeam Leaders, Credit Risk ManagementGroup Heads, Commercial BankGroup Heads, Institutional BankGroup Heads, Operations & IT Group Head, ComplianceGroup Head, Internal Audit Head, Corporate Counsel (or his/her nominee as approved by the GMD/CEO)Other Group Heads.
Group Asset & Liability Committee (Group ALCO)
The Group ALCO is responsible for the optimum management of the Bank’s balance sheet and taking relevant decisions as well as recommending to the Board of Directors’ prudent asset/liability management policies and procedures that enable the Bank to achieve its goals while operating in full compliance with all relevant laws and regulations.
The Group Managing Director/Chief Executive Officer (Chairman)The Group Deputy Managing DirectorThe Group Executive DirectorsChief Risk OfficerCountry Managing DirectorsCountry Treasury Heads The Group TreasurerHead, Financial Control – DomesticHead, Financial Control – InternationalHead, Group Asset & Liability ManagementHead, Group Market RiskHead, Credit Risk.
Operational Risk-Management Committee (ORMC)
The Committee is responsible for the effectiveness of the operational risk-management function within the Bank. All decisions and deliberations of the Committee are reported to the Board Risk-Management Committee.
Group Managing Director/Chief Executive Officer (Chairman)Group Deputy Managing DirectorAll Division Heads/Executive DirectorsChief Risk OfficerHead, Operational Risk Management GroupHead, Group Compliance and Internal ControlHead, Group Internal AuditHead, Group HROther Group Heads or persons to be designated by the Committee from time to time.
Without prejudice to the roles of these committees, the full Board shall retain ultimate responsibility for risk-management.
46 Access Bank Plc Annual Report and Accounts 2012
Managing Risk for a Sustainable Future continued
Specific roles of the Board committeesThe Board’s risk-management oversight roles and responsibilities are delegated to the following committees:
Board Risk-Management CommitteeSpecifically, the Committee performs the following functions:
(a) Oversee the establishment of a formal written policy on the Bank’s overall risk-management framework. The policy defines risks and risk limits that are acceptable and unacceptable to the Bank. It provides guidelines and standards to administer the acceptance and ongoing management of all risks;
(b) Ensure that adequate policies are in place to manage and mitigate the adverse effects of both business and control risks in its operations;
(c) Ensure compliance with established policy through periodic review of reports provided by management, internal and statutory auditors and the supervisory authorities;
(d) Approve the appointment of qualified officers to manage the risk function;
(e) Oversee the management of all risks except credit risk in the Bank;
(f) Re-evaluate the risk-management policy of the Bank on a periodic basis to accommodate major changes in internal or external factors;
(g) Evaluate internal processes for identifying, assessing, monitoring and managing key risk areas, particularly:
– Important judgements and accounting estimates; – Business and operational risks in the areas of credit, market and operations;
– Specific risks relating to outsourcing; and – Consideration of environmental, community and social risks.
(h) Evaluate the adequacy of the Bank’s risk-management systems and control environment with management and auditors (internal and external);
(i) Evaluate the Bank’s risk profile, the action plans in place to manage risks, and monitors progress against plan to achieve these actions;
(j) Review the processes the Bank has in place for assessing and continuously improving internal controls, particularly those related to areas of significant risk; and
(k) Approve the provision of risk-management services by external providers.
Board Audit CommitteeThe Committee assists the Board in ensuring the independence of the internal audit function of the Bank and that it performs the following functions:
(a) Oversee the development of a procedure for the receipt, retention and treatment of complaints received by the Bank, regarding accounting, internal accounting controls, unethical activity/breach of the corporate governance code or audit matters, including a means for the Bank’s stakeholders (employees, customers, suppliers, applicants and others) to submit such complaints in a confidential and anonymous manner;
(b) Investigate any matter brought to its attention within the scope of its duties with the authority to retain counsel or other advisors, if in its judgement that is appropriate, at the expense of the Bank;
(c) Submit meeting minutes and, as appropriate, discuss the matters deliberated upon at each Committee meeting with the Board of Directors;
(d) Annually review and reassess its responsibilities, functions, pre-approval policy for audit and non-audit services, and charter, making changes as necessary, and conduct an annual performance evaluation of its activities;
(e) Ensure that the Bank provides adequate funding, as determined by the Committee, to the Committee for payment and compensation for advisers engaged by the Committee, and payment of ordinary administrative expenses incurred by the Committee in carrying out its duties;
(f) Review the proposed audit plan(s) and review the results of internal audits completed since the previous Committee meeting as well as the focus of upcoming internal audit projects;
(g) Approve the appointment and termination of the Chief Internal Auditor based on the recommendations of the Bank’s executive management;
(h) Evaluate the process the Bank has in place for monitoring and assessing the effectiveness of the internal audit function;
(i) Monitor the progress of the internal audit programme and consider the implications of internal audit findings on the control environment;
(j) Monitor the implementation of agreed action plans by management;
(k) Review reports from the internal auditors detailing their key findings and agreed management actions;
(l) Review the appropriateness of the qualification of the internal audit personnel and work resources; and
(m) Review the internal audit reporting lines and independence.
Business Review
47Access Bank Plc Annual Report and Accounts 2012
Specific roles of the management committeesThe following management committees are directly responsible for risk-management oversight:
Enterprise Risk-Management CommitteeThe Committee has the following responsibilities for all risks within its purview as follows:
(a) Formulate risk policies;
(b) Monitor implementation of risk policies;
(c) Review risk reports for presentation to the Board and Board committees;
(d) Implement Board decisions across the Bank.
Management Credit CommitteeThe Committee has the following responsibilities:
•Review credit policy recommendations for Board approval;•Approve individual credit exposure in line with its
approval limits;•Agree on portfolio plan/strategy for the Bank;•Review monthly credit risk reports and remedial action
plan; and•Co-ordinate the Bank’s response to material events that may
have an impact on the credit portfolio.
The Committee is assisted by the credit risk-management function, whose responsibilities are to:
•Establish and maintain effective credit risk-management environment in the Bank;
•Review proposals in respect of credit policies and standards and endorse to the Board of Directors for approval;
•Define the Bank risk and return preferences and target risk portfolio;
•Monitor on an ongoing basis the Bank’s risk quality and performance, review periodic credit portfolio reports and assess portfolio performance;
•Define the credit approval framework and assign credit approval limits in line with Bank policy;
•Review defined credit product programmes on recommendation of the head of credit risk-management and endorse to the Board of Directors for approval;
•Review credit policy changes initiated by management and endorse to the Board of Directors for approval;
•Ensure compliance with the Bank’s credit policies and statutory requirements prescribed by the regulatory/supervisory authorities;
•Approve credit facility requests within limits defined by Access Bank’s credit policy guideline (CPG), and within the statutory requirements set by the regulatory/supervisory authorities;
•Review and endorse credits approved by SBU heads;•Review and recommend to the Board Credit Committee,
credits beyond their approval limits;•Review periodic credit portfolio reports and assess portfolio
performance; and•Approve exceptions/write-offs, waivers and discounts on
non-performing credit facilities within specified limit.
Board Credit & Finance CommitteeThe Committee under delegated authority is responsible for the following:
(a) Facilitate the effective management of credit risk by the Bank;
(b) Approve credit risk-management policies, underwriting guidelines and standard proposals on the recommendation of the Management Credit Committee;
(c) Approve definition of risk and return preferences and target risk portfolio;
(d) Approve the Bank’s credit rating methodology and ensure its proper implementation;
(e) Approve credit-risk appetite and portfolio strategy;
(f) Approve lending decisions and limit setting;
(g) Approve new credit products and processes;
(h) Approve assignment of credit approval authority on the recommendation of the Management Credit Committee;
(i) Approve changes to credit policy guidelines on the recommendation of the Management Credit Committee;
(j) Approve credit facility requests and proposals within limits defined by the Bank’s credit policy and within the statutory requirements set by the regulatory/supervisory authorities;
(k) Recommend credit facility requests above stipulated limits to the Board;
(l) Review credit risk reports on a periodic basis;
(m) Approve credit exceptions in line with Board approval; and
(n) Make recommendations to the Board on credit policy and strategy where appropriate.
The Board Governance & Remuneration CommitteeThe Committee has responsibility for the following:
(a) Ensure the right calibre of executive management is attracted, retained, motivated and rewarded;
(b) Make recommendations on the remuneration of the Chairman, Non-Executive Directors and Executive Directors to the Board for ratification;
(c) Approve remuneration levels for senior management and other Bank personnel;
(d) Review and approve remuneration policies and strategy; and
(e) Monitor the Bank’s people-risk universe.
48 Access Bank Plc Annual Report and Accounts 2012
Other responsibilities include:Prudent management of market risk:
•To ensure the levels of market risk assumed by the Bank are effectively and prudently managed in accordance with the Market Risk Policy;
•To approve market risk limits and triggers in accordance with the risk appetite set by the Group ALCO and the Group’s Concentration Risk Policy;
•To note compliance with all market risk limits and triggers, and ensure actions to address breaches are promptly executed and reported to authorised bodies;
•To manage all forms of market risk firstly by using the Group ALCO’s mandate to set exposure levels and stop-loss limits, and secondly, if necessary, by hedging any form of market risk; and
•To review and approve all policies and procedures relating to market risk-management.
Prudent management of liquidity risk:
•To ensure the levels of tactical and strategic liquidity risk assumed by the Bank are effectively and prudently managed in accordance with the Liquidity Risk Policy;
•To approve liquidity risk limits and guidelines in accordance with the risk appetite set by the Group ALCO;
•To note compliance with all liquidity risk guidelines and limits, and ensure actions to address breaches are promptly executed and reported to authorising bodies;
•To ensure appropriate steps are taken where there is deterioration in liquidity;
•To approve funding and liquidity management strategies based on forecast balance sheet growth;
•To ensure the provision of standby funding facilities is kept within prudent levels;
•To review and approve all policies, procedures and contingency plans relating to liquidity risk-management; and
•To approve liquidity stress scenarios and associated contingency plans.
Prudent management of interest-rate risk:
•To ensure that the level of interest-rate risk assumed by the Bank is effectively and prudently managed;
•To note compliance with all guidelines and limits, and ensure actions to address breaches are promptly executed and reported to authorising bodies;
•To approve limits and guidelines in accordance with the risk appetite set by the Group ALCO and the Group Market Risk; and
•To approve the subsidiaries’ market risk and hedging strategies on a case-by-case basis, or explicitly delegate the approval of such strategies to the Country ALCO.
Managing Risk for a Sustainable Future continued
Group Asset & Liability CommitteeThe purpose of the Committee is to:
•Monitor and control all market, liquidity risk and interest-rate risk across the Bank and its subsidiaries in accordance with the risk appetite set by the Board of Directors;
•Review limit, guideline or trigger breaches and agree remedial actions in order to align exposures with agreed appetite;
•Approve Market Risk, Liquidity Risk and Banking Book Interest- Rate Risk Policies for each of the banking subsidiaries;
•Review and note the impact of internal and external factors on the net interest margin; and
•Recommend to the Board the policies and guidelines under which the Bank will manage balance sheet growth (including deposits, advances and investments, non-earning assets, foreign exchange activities and positions, market and liquidity management and capital management) and in so doing protect the Bank’s capital base and reputation.
Responsibilities and authorities•The ultimate responsibility for the proper management of
the Bank’s assets and liabilities lies with the Board of Directors;•The Board of Directors may delegate that responsibility to
Group ALCO and Group ALCO, through this mandate, is responsible for the establishment of appropriate policies and limits across the Group;
•Group ALCO is responsible for the implementation and monitoring of these policies and for the development of appropriate procedures and guidelines for adoption at Country ALCOs and specific ratification by the subsidiaries’ Board of Directors;
•Country ALCOs are responsible for providing information to Group ALCO to enable it to perform its function;
•Country ALCOs are responsible for proposing amendments to policies for approval and ratification by Group ALCO, such amendments having been first approved by the Country ALCO;
•Group ALCO reports to the Board of Directors through the Board Risk-Management Committee detailing strategies and risk positions since the last report received. Any excesses during the year under review must be supported by details quoting the relevant authority for the excess such as the Central Bank of Nigeria, Group ALCO etc;
•Group ALCO will delegate limits/authorities to line management to enable the smooth functioning of the Bank’s day-to-day operations; and
• In the event of a vote, the majority will prevail with the Group ALCO chairman casting the deciding vote in the event of a tie.
Business Review
49Access Bank Plc Annual Report and Accounts 2012
•Co-ordinate an ongoing appropriate awareness of operational risk, and an associated education programme in the Bank from top to bottom through the implementation of an enterprise-wide operational risk approach; and
•Set guidelines for identifying operational risk in all new products and processes.
Roles of risk champions in the business units•Coordinate all risk-management activities in the business
unit, including compliance with risk policies and procedures;•Provide on-the-job training on risk-management to other staff;•Liaise with the Risk-Management and Compliance Division
to obtain new systems, approaches and methods for managing risks and advise staff within the unit appropriately;
•Co-ordinate the gathering of risk-related information risk information gathered, analyse the information and periodically report to the Group head and the Risk-Management department in the agreed format;
• In conjunction with other managers in the business unit, articulate risk-management/optimisation strategies for managing risks, prepare a risk-mitigation plan and communicate these to the Risk-Management and Compliance Division; and
•Monitor and report on the effectiveness of risk-mitigation plans in reducing risk incidence in the unit.
Risk-Management and Compliance Division – relationship with other unitsThe relationships between the Risk-Management and Compliance (RMCD) and other units are highlighted in the diagram:
•RMCD sets policies and defines risk limits for other units in the Bank;
•RMCD performs bank-wide risk monitoring and reporting;•Other units provide relevant data to RMCD for risk monitoring
and reporting, and identify potential risks in their line of business, while RMCD provides a framework for managing such risks;
•RMCD and market-facing units collaborate in designing new products;
•RMCD and internal audit co-ordinate activities to provide a holistic view of risks across the Bank;
•RMCD makes recommendations with respect to capital allocation, pricing and reward/sanctions based on risk reports; and
• Information Technology Support Group provides relevant user support to the RMCD function in respect of the various risk-management software applications.
Prudent margin management:
•To review and note the impact of internal and external factors on the Bank’s current and forecasted net interest margin;
•To review and approve funds transfer pricing principles, methodologies and rates; and
•To review and approve policies and procedures relating to margin management.
General:
•To monitor adherence to regulatory requirements; and •To delegate to the Group Asset & Liability Management team
the responsibility for dealing with trigger, guideline or limit breaches across the Group on a day-to-day basis.
Roles of senior management The roles of senior management as it relates to risk management are as:
(a) Implement risk strategy approved by the Board of Directors;
(b) Develop policies and procedures for identifying, measuring and controlling risks identified in the Bank’s risk universe;
(c) Provide appropriate resources to evaluate and control all identified risks;
(d) Review risk reports on a regular and timely basis;
(e) Review periodic risk reports for operational and other risks separate from credit and market risks; and
(f) Provide all reports required by the Board and its committees for the effective performance of risk-management oversight functions.
Operational Risk-Management Committee (ORMC)The Committee has the following responsibilities:
•Review and recommend the Operational Risk-Management (ORM) framework and any amendments or enhancements to the Board of Directors for approval;
•Oversee the implementation of the ORM framework across the enterprise;
•Review methodologies and tools for identification, assessment, monitoring and control of operational risks and maintaining the loss event databases;
•Ensure operational risk exposures are within the risk tolerance limits set under the policy;
•Review the reports from the Group ORM unit, business lines and their respective risk profiles to determine areas of highest priority and put in place the related mitigation strategies;
•Ensure adequate resources are allotted at various levels to manage operational risk across the enterprise;
•Ensure adequate communication to the functional departments and emphasise the importance of operational risk-management and assure adequate participation;
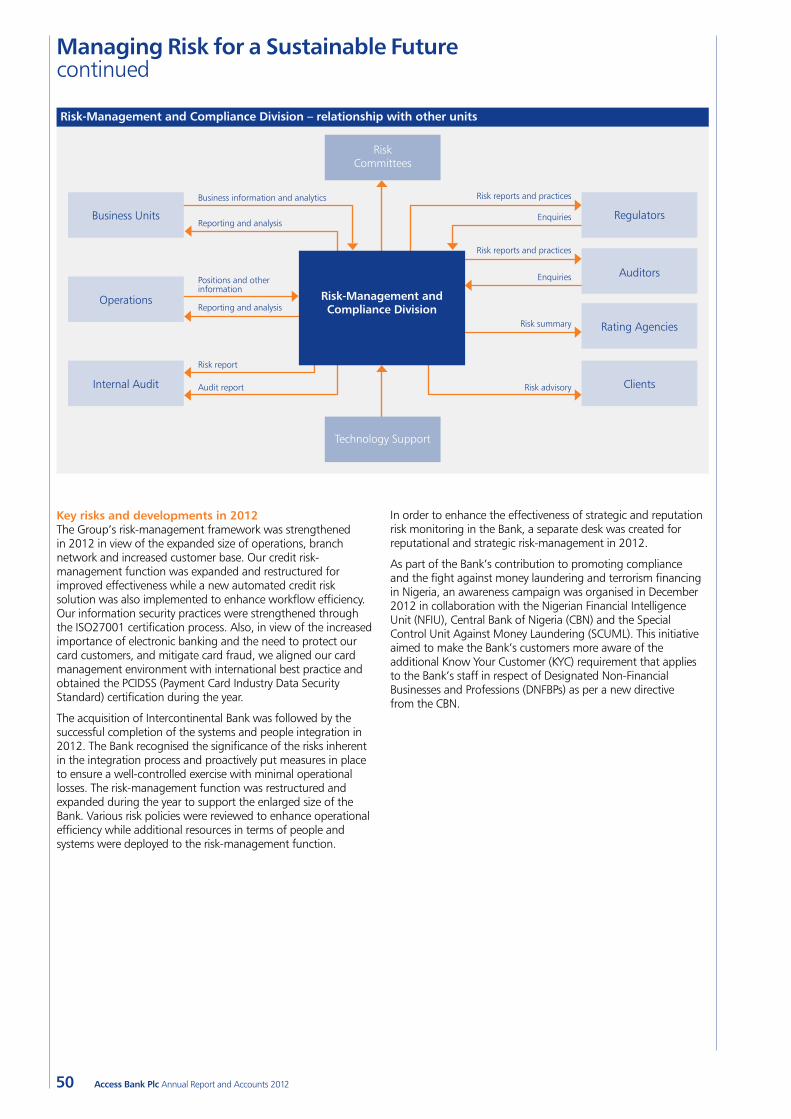
50 Access Bank Plc Annual Report and Accounts 2012
In order to enhance the effectiveness of strategic and reputation risk monitoring in the Bank, a separate desk was created for reputational and strategic risk-management in 2012.
As part of the Bank’s contribution to promoting compliance and the fight against money laundering and terrorism financing in Nigeria, an awareness campaign was organised in December 2012 in collaboration with the Nigerian Financial Intelligence Unit (NFIU), Central Bank of Nigeria (CBN) and the Special Control Unit Against Money Laundering (SCUML). This initiative aimed to make the Bank’s customers more aware of the additional Know Your Customer (KYC) requirement that applies to the Bank’s staff in respect of Designated Non-Financial Businesses and Professions (DNFBPs) as per a new directive from the CBN.
Managing Risk for a Sustainable Future continued
Key risks and developments in 2012The Group’s risk-management framework was strengthened in 2012 in view of the expanded size of operations, branch network and increased customer base. Our credit risk-management function was expanded and restructured for improved effectiveness while a new automated credit risk solution was also implemented to enhance workflow efficiency. Our information security practices were strengthened through the ISO27001 certification process. Also, in view of the increased importance of electronic banking and the need to protect our card customers, and mitigate card fraud, we aligned our card management environment with international best practice and obtained the PCIDSS (Payment Card Industry Data Security Standard) certification during the year.
The acquisition of Intercontinental Bank was followed by the successful completion of the systems and people integration in 2012. The Bank recognised the significance of the risks inherent in the integration process and proactively put measures in place to ensure a well-controlled exercise with minimal operational losses. The risk-management function was restructured and expanded during the year to support the enlarged size of the Bank. Various risk policies were reviewed to enhance operational efficiency while additional resources in terms of people and systems were deployed to the risk-management function.
Risk-Management and Compliance Division – relationship with other units
Business Units
Risk report
Reporting and analysis
Positions and other information
Reporting and analysis
Business information and analytics
Audit report Risk advisory
Risk summary
Enquiries
Enquiries
Risk reports and practices
Risk reports and practices
Risk Committees
Technology Support
Risk-Management and Compliance Division
Operations
Internal Audit
Regulators
Auditors
Rating Agencies
Clients
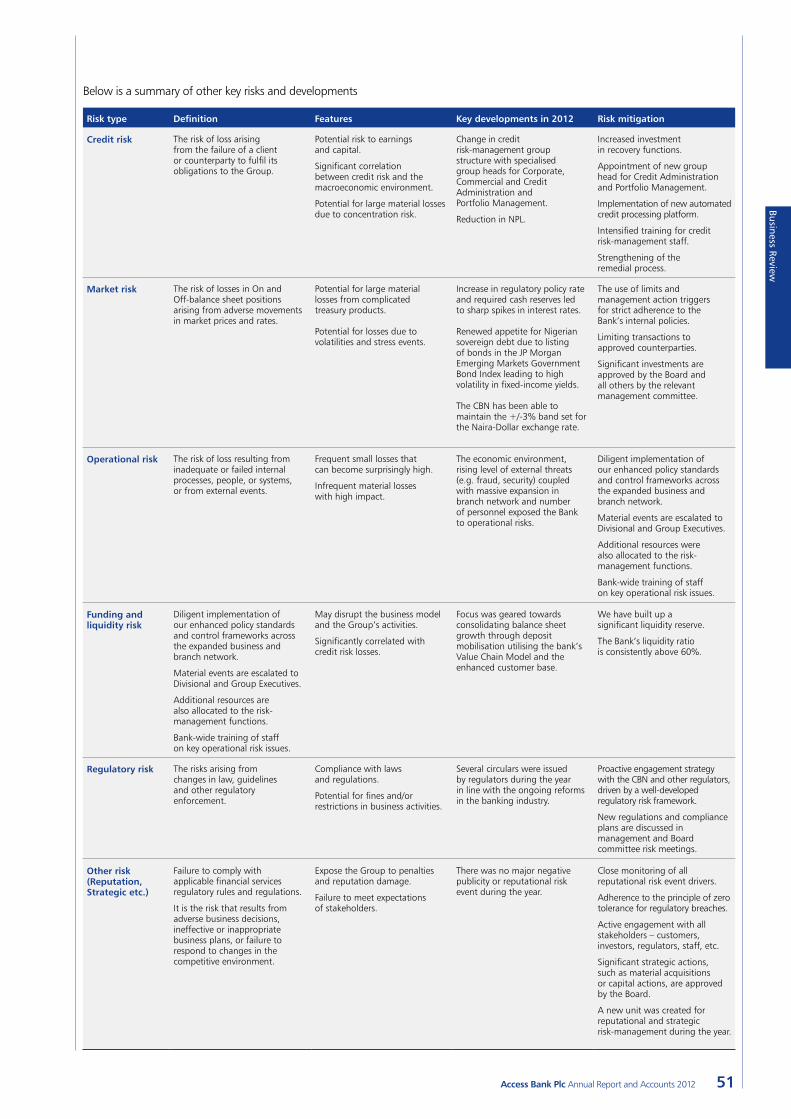
Business Review
51Access Bank Plc Annual Report and Accounts 2012
Below is a summary of other key risks and developments
Risk type Definition Features Key developments in 2012 Risk mitigation
Credit risk The risk of loss arising from the failure of a client or counterparty to fulfil its obligations to the Group.
Potential risk to earnings and capital.
Significant correlation between credit risk and the macroeconomic environment.
Potential for large material losses due to concentration risk.
Change in credit risk-management group structure with specialised group heads for Corporate, Commercial and Credit Administration and Portfolio Management.
Reduction in NPL.
Increased investment in recovery functions.
Appointment of new group head for Credit Administration and Portfolio Management.
Implementation of new automated credit processing platform.
Intensified training for credit risk-management staff.
Strengthening of the remedial process.
Market risk The risk of losses in On and Off-balance sheet positions arising from adverse movements in market prices and rates.
Potential for large material losses from complicated treasury products.
Potential for losses due to volatilities and stress events.
Increase in regulatory policy rate and required cash reserves led to sharp spikes in interest rates.
Renewed appetite for Nigerian sovereign debt due to listing of bonds in the JP Morgan Emerging Markets Government Bond Index leading to high volatility in fixed-income yields.
The CBN has been able to maintain the +/-3% band set for the Naira-Dollar exchange rate.
The use of limits and management action triggers for strict adherence to the Bank’s internal policies.
Limiting transactions to approved counterparties.
Significant investments are approved by the Board and all others by the relevant management committee.
Operational risk The risk of loss resulting from inadequate or failed internal processes, people, or systems, or from external events.
Frequent small losses that can become surprisingly high.
Infrequent material losses with high impact.
The economic environment, rising level of external threats (e.g. fraud, security) coupled with massive expansion in branch network and number of personnel exposed the Bank to operational risks.
Diligent implementation of our enhanced policy standards and control frameworks across the expanded business and branch network.
Material events are escalated to Divisional and Group Executives.
Additional resources were also allocated to the risk-management functions.
Bank-wide training of staff on key operational risk issues.
Funding and liquidity risk
Diligent implementation of our enhanced policy standards and control frameworks across the expanded business and branch network.
Material events are escalated to Divisional and Group Executives.
Additional resources are also allocated to the risk-management functions.
Bank-wide training of staff on key operational risk issues.
May disrupt the business model and the Group’s activities.
Significantly correlated with credit risk losses.
Focus was geared towards consolidating balance sheet growth through deposit mobilisation utilising the bank’s Value Chain Model and the enhanced customer base.
We have built up a significant liquidity reserve.
The Bank’s liquidity ratio is consistently above 60%.
Regulatory risk The risks arising fromchanges in law, guidelines and other regulatory enforcement.
Compliance with laws and regulations.
Potential for fines and/or restrictions in business activities.
Several circulars were issued by regulators during the year in line with the ongoing reforms in the banking industry.
Proactive engagement strategy with the CBN and other regulators, driven by a well-developed regulatory risk framework.
New regulations and compliance plans are discussed in management and Board committee risk meetings.
Other risk (Reputation, Strategic etc.)
Failure to comply with applicable financial services regulatory rules and regulations.
It is the risk that results from adverse business decisions, ineffective or inappropriate business plans, or failure to respond to changes in the competitive environment.
Expose the Group to penalties and reputation damage.
Failure to meet expectations of stakeholders.
There was no major negative publicity or reputational risk event during the year.
Close monitoring of all reputational risk event drivers.
Adherence to the principle of zero tolerance for regulatory breaches.
Active engagement with all stakeholders – customers, investors, regulators, staff, etc.
Significant strategic actions, such as material acquisitions or capital actions, are approved by the Board.
A new unit was created for reputational and strategic risk-management during the year.

52 Access Bank Plc Annual Report and Accounts 2012
•Credit Risk Rating Policy: The objective of this policy is to ensure reliable and consistent Obligor Risk Ratings (ORRs) and Facility Risk Ratings (FRRs) throughout Access Bank and to provide guidelines for risk rating for retail and non-retail exposures in the banking book covering the credit and investment books of the Bank.
•Country and Cross-Border Risk-Management Policy: The objective of this policy is to establish a consistent framework for the identification, measurement and management of country risk across Access Bank.
• Internal Capital Adequacy Assessment Process (ICAAP) Policy: The objectives of the policy are identification of material risks, measurement of material risks, monitoring and control of material risks and reporting of material risks.
•Enterprise-wide Risk-Management Policy: The core objective is to provide a reasonable degree of assurance to the Board of Directors that the risks threatening the Bank’s achievement of its vision are identified, measured, monitored and controlled through an effective, integrated risk-management system covering credit, market, operational, interest rate, liquidity and other material risks.
Responsibilities of business units and independent Credit Risk-ManagementIn Access Bank, Business units and Independent Credit Risk-Management have a joint responsibility for the overall accuracy of risk ratings assigned to obligors and facilities. Business Relationship Managers will be responsible for deriving the ORR and FRR using approved methodologies as set out in this policy, however Independent Credit Risk-Management may also perform this function.
Notwithstanding who derives the risk rating, Independent Credit Risk-Management is responsible for reviewing and ensuring the correctness of the ORR and FRR assigned to a borrower and facilities. This review includes ensuring the ongoing consistency of the risk-rating process with the Bank’s Risk Rating Policy; ongoing appropriate application of the risk-rating process and tools; review of judgemental and qualitative inputs into the risk rating process; ensuring the timeliness and thoroughness of risk-rating reviews; and ensuring that the documentation of the risk-rating process is complete and current.
Independent Credit Risk-Management has the final authority if there is a question about a specific rating.
Credit process The Bank’s credit process starts with portfolio planning and target market identification. Within identified target markets, credits are initiated by relationship managers. The proposed credits are subjected to review and approvals by applicable credit approval authorities. Further to appropriate approvals, loans are disbursed to beneficiaries.
Ongoing management of loans is undertaken by both relationship management teams and our Credit Risk-Management Group. The process is applied at the Head Office and in the subsidiaries.
If a preliminary analysis of a loan request by the account manager indicates that it merits further scrutiny, it is then analysed in greater detail by the account manager, with further detailed review by Credit Risk-Management. The agreement of Credit Risk-Management must be obtained for any credit extension. If the loan application passes the detailed analysis, it is then submitted to the appropriate approval authority for the size of facilities.
Managing Risk for a Sustainable Future continued
Credit risk-managementCredit risk arises from the failure of an obligor of the Bank to repay principal or interest at the stipulated time or failure otherwise to perform as agreed. This risk is compounded if the assigned collateral only partly covers the claims made to the borrower, or if its valuation is exposed to frequent changes due to changing market conditions (i.e. market risk).
The Bank’s risk-management philosophy is that a moderate and guarded risk attitude will ensure sustainable growth in Shareholder value and reputation. Extension of credit at Access Bank is guided by its Credit Risk and Portfolio Management Plan, which sets out specific rules for risk origination and management of the loan portfolio. The Plan also sets out the roles and responsibilities of different individuals and committees involved in the credit process.
We recognise the fact that our main asset is our loan portfolio. Therefore, we actively safeguard and strive continually to improve the health of our loan portfolio. We scrutinise all applications and weed out potential problem loans during the loan application phase, and we constantly monitor the existing loan portfolio.
The goal of the Bank is to apply sophisticated, but realistic, credit models and systems to monitor and manage credit risk. Ultimately these credit models and systems are the foundation for the application of an internal rating-based approach to calculation of capital requirements. The development, implementation and application of these models are guided by the Bank’s Basel II strategy.
The pricing of each credit granted reflects the level of risks inherent in the credit. Subject to competitive forces, Access Bank implements a consistent pricing model for loans to its different target markets. The client’s interest is guarded at all times, and collateral quality is never the sole reason for a positive credit decision.
Provisions for credit losses meet prudential guidelines set forth by the central bank of the countries in which we operate, both for loans for which specific provisions exist as well as for the portfolio of performing loans. Access Bank’s credit process requires rigorous proactive and periodic review of the quality of the loan portfolio. This helps us to identify and remediate credit issues proactively.
The Criticised Assets Committee performs a quarterly review of loans with emerging signs of weakness; the Management Credit Committee and the Board Credit Committee also perform reviews of the quality of our loan portfolio on a quarterly basis. These are in addition to daily reviews performed by our Credit Risk-Management department.
Principal credit policiesThe following are the principal credit policies of the Bank:
•Credit Risk-Management Policy: The core objective is to enable maximisation of returns on a risk-adjusted basis from banking book credit risk exposures that are brought under the ambit of Credit Risk Management Policy by putting in place robust credit risk-management systems consisting of risk identification, risk measurement, setting of exposure and risk limits, risk monitoring and control, and reporting of credit risk in the banking book.
•Credit Risk-Mitigant Management Policy: The objective is to aid in effective credit portfolio management through mitigation of credit risks by using credit risk mitigation techniques.
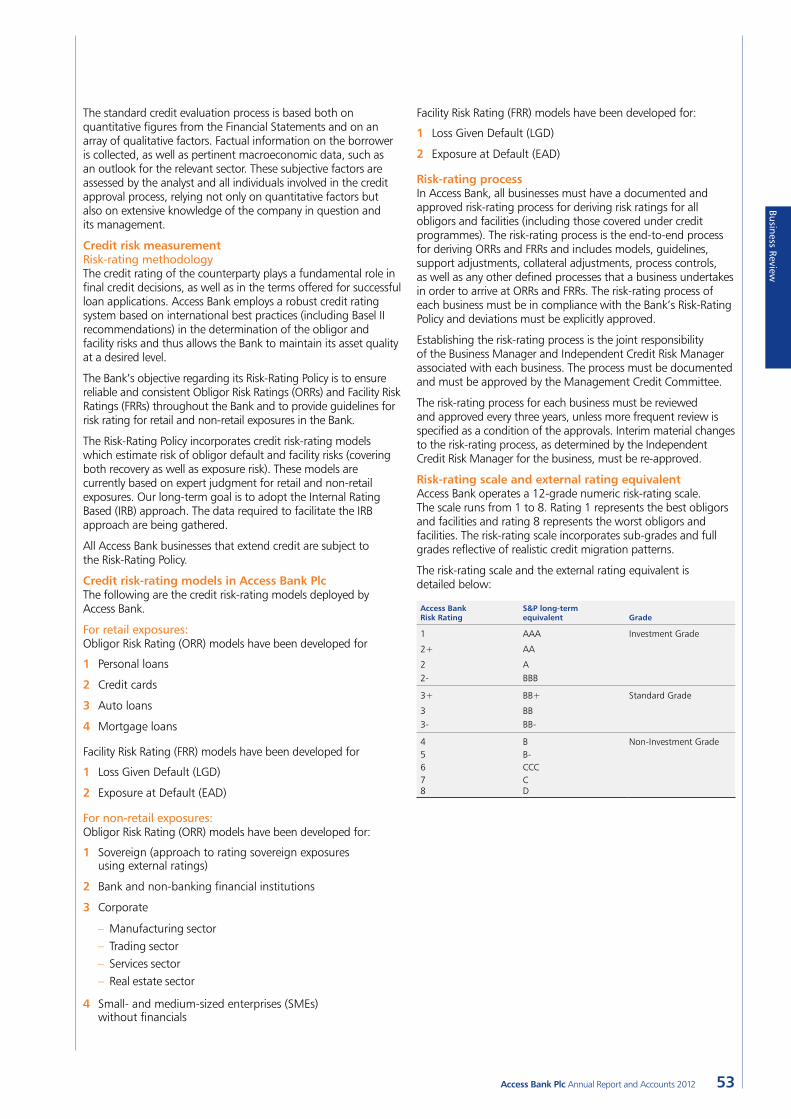
Business Review
53Access Bank Plc Annual Report and Accounts 2012
Facility Risk Rating (FRR) models have been developed for:
1 Loss Given Default (LGD)
2 Exposure at Default (EAD)
Risk-rating process In Access Bank, all businesses must have a documented and approved risk-rating process for deriving risk ratings for all obligors and facilities (including those covered under credit programmes). The risk-rating process is the end-to-end process for deriving ORRs and FRRs and includes models, guidelines, support adjustments, collateral adjustments, process controls, as well as any other defined processes that a business undertakes in order to arrive at ORRs and FRRs. The risk-rating process of each business must be in compliance with the Bank’s Risk-Rating Policy and deviations must be explicitly approved.
Establishing the risk-rating process is the joint responsibility of the Business Manager and Independent Credit Risk Manager associated with each business. The process must be documented and must be approved by the Management Credit Committee.
The risk-rating process for each business must be reviewed and approved every three years, unless more frequent review is specified as a condition of the approvals. Interim material changes to the risk-rating process, as determined by the Independent Credit Risk Manager for the business, must be re-approved.
Risk-rating scale and external rating equivalentAccess Bank operates a 12-grade numeric risk-rating scale. The scale runs from 1 to 8. Rating 1 represents the best obligors and facilities and rating 8 represents the worst obligors and facilities. The risk-rating scale incorporates sub-grades and full grades reflective of realistic credit migration patterns.
The risk-rating scale and the external rating equivalent is detailed below:
Access Bank Risk Rating
S&P long-term equivalent Grade
1 AAA Investment Grade
2+ AA
2 A2- BBB
3+ BB+ Standard Grade
3 BB3- BB-
4 B Non-Investment Grade5 B-6 CCC7 C8 D
The standard credit evaluation process is based both on quantitative figures from the Financial Statements and on an array of qualitative factors. Factual information on the borrower is collected, as well as pertinent macroeconomic data, such as an outlook for the relevant sector. These subjective factors are assessed by the analyst and all individuals involved in the credit approval process, relying not only on quantitative factors but also on extensive knowledge of the company in question and its management.
Credit risk measurementRisk-rating methodologyThe credit rating of the counterparty plays a fundamental role in final credit decisions, as well as in the terms offered for successful loan applications. Access Bank employs a robust credit rating system based on international best practices (including Basel II recommendations) in the determination of the obligor and facility risks and thus allows the Bank to maintain its asset quality at a desired level.
The Bank’s objective regarding its Risk-Rating Policy is to ensure reliable and consistent Obligor Risk Ratings (ORRs) and Facility Risk Ratings (FRRs) throughout the Bank and to provide guidelines for risk rating for retail and non-retail exposures in the Bank.
The Risk-Rating Policy incorporates credit risk-rating models which estimate risk of obligor default and facility risks (covering both recovery as well as exposure risk). These models are currently based on expert judgment for retail and non-retail exposures. Our long-term goal is to adopt the Internal Rating Based (IRB) approach. The data required to facilitate the IRB approach are being gathered.
All Access Bank businesses that extend credit are subject to the Risk-Rating Policy.
Credit risk-rating models in Access Bank PlcThe following are the credit risk-rating models deployed by Access Bank.
For retail exposures:Obligor Risk Rating (ORR) models have been developed for
1 Personal loans
2 Credit cards
3 Auto loans
4 Mortgage loans
Facility Risk Rating (FRR) models have been developed for
1 Loss Given Default (LGD)
2 Exposure at Default (EAD)
For non-retail exposures:Obligor Risk Rating (ORR) models have been developed for:
1 Sovereign (approach to rating sovereign exposures using external ratings)
2 Bank and non-banking financial institutions
3 Corporate
– Manufacturing sector – Trading sector – Services sector – Real estate sector
4 Small- and medium-sized enterprises (SMEs) without financials
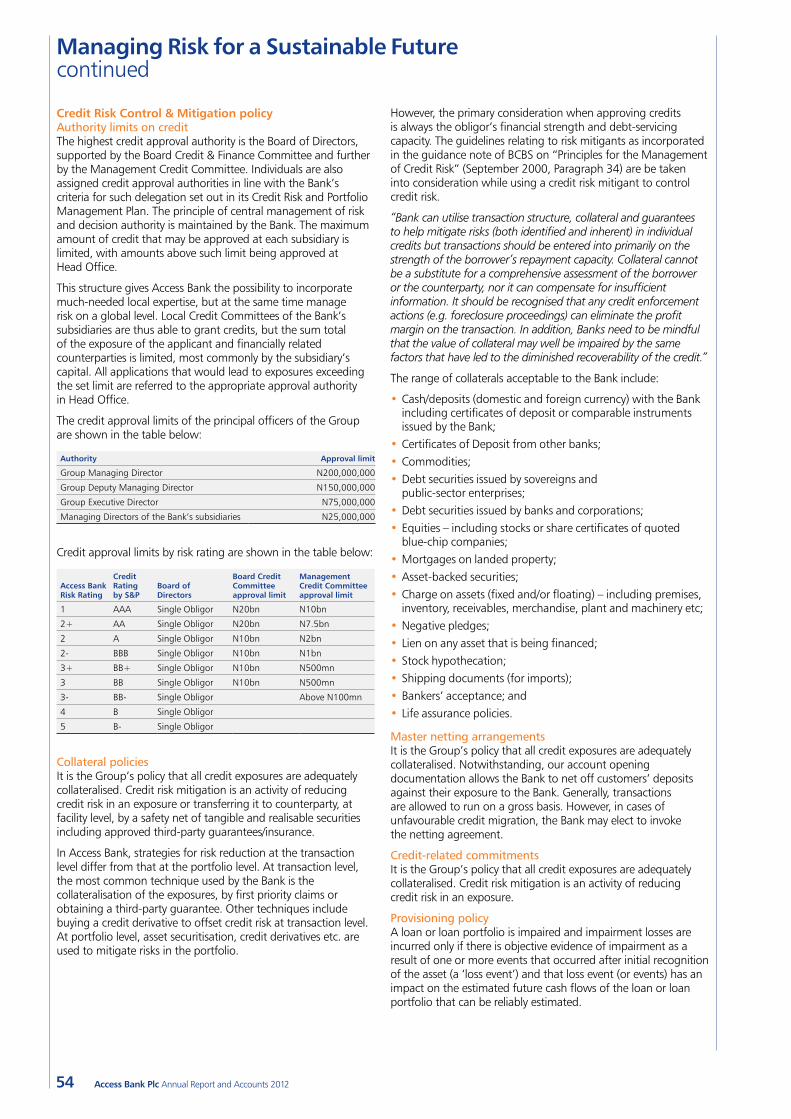
54 Access Bank Plc Annual Report and Accounts 2012
Managing Risk for a Sustainable Future continued
Credit Risk Control & Mitigation policyAuthority limits on creditThe highest credit approval authority is the Board of Directors, supported by the Board Credit & Finance Committee and further by the Management Credit Committee. Individuals are also assigned credit approval authorities in line with the Bank’s criteria for such delegation set out in its Credit Risk and Portfolio Management Plan. The principle of central management of risk and decision authority is maintained by the Bank. The maximum amount of credit that may be approved at each subsidiary is limited, with amounts above such limit being approved at Head Office.
This structure gives Access Bank the possibility to incorporate much-needed local expertise, but at the same time manage risk on a global level. Local Credit Committees of the Bank’s subsidiaries are thus able to grant credits, but the sum total of the exposure of the applicant and financially related counterparties is limited, most commonly by the subsidiary’s capital. All applications that would lead to exposures exceeding the set limit are referred to the appropriate approval authority in Head Office.
The credit approval limits of the principal officers of the Group are shown in the table below:
Authority Approval limit
Group Managing Director N200,000,000
Group Deputy Managing Director N150,000,000
Group Executive Director N75,000,000
Managing Directors of the Bank’s subsidiaries N25,000,000
Credit approval limits by risk rating are shown in the table below:
Access Bank Risk Rating
Credit Rating by S&P
Board of Directors
Board Credit Committee approval limit
Management Credit Committee approval limit
1 AAA Single Obligor N20bn N10bn
2+ AA Single Obligor N20bn N7.5bn
2 A Single Obligor N10bn N2bn
2- BBB Single Obligor N10bn N1bn
3+ BB+ Single Obligor N10bn N500mn
3 BB Single Obligor N10bn N500mn
3- BB- Single Obligor Above N100mn
4 B Single Obligor
5 B- Single Obligor
Collateral policiesIt is the Group’s policy that all credit exposures are adequately collateralised. Credit risk mitigation is an activity of reducing credit risk in an exposure or transferring it to counterparty, at facility level, by a safety net of tangible and realisable securities including approved third-party guarantees/insurance.
In Access Bank, strategies for risk reduction at the transaction level differ from that at the portfolio level. At transaction level, the most common technique used by the Bank is the collateralisation of the exposures, by first priority claims or obtaining a third-party guarantee. Other techniques include buying a credit derivative to offset credit risk at transaction level. At portfolio level, asset securitisation, credit derivatives etc. are used to mitigate risks in the portfolio.
However, the primary consideration when approving credits is always the obligor’s financial strength and debt-servicing capacity. The guidelines relating to risk mitigants as incorporated in the guidance note of BCBS on “Principles for the Management of Credit Risk” (September 2000, Paragraph 34) are be taken into consideration while using a credit risk mitigant to control credit risk.
“Bank can utilise transaction structure, collateral and guarantees to help mitigate risks (both identified and inherent) in individual credits but transactions should be entered into primarily on the strength of the borrower’s repayment capacity. Collateral cannot be a substitute for a comprehensive assessment of the borrower or the counterparty, nor it can compensate for insufficient information. It should be recognised that any credit enforcement actions (e.g. foreclosure proceedings) can eliminate the profit margin on the transaction. In addition, Banks need to be mindful that the value of collateral may well be impaired by the same factors that have led to the diminished recoverability of the credit.”
The range of collaterals acceptable to the Bank include:
•Cash/deposits (domestic and foreign currency) with the Bank including certificates of deposit or comparable instruments issued by the Bank;
•Certificates of Deposit from other banks;•Commodities;•Debt securities issued by sovereigns and
public-sector enterprises;•Debt securities issued by banks and corporations;•Equities – including stocks or share certificates of quoted
blue-chip companies;•Mortgages on landed property;•Asset-backed securities;•Charge on assets (fixed and/or floating) – including premises,
inventory, receivables, merchandise, plant and machinery etc;•Negative pledges;•Lien on any asset that is being financed;•Stock hypothecation;•Shipping documents (for imports);•Bankers’ acceptance; and•Life assurance policies.
Master netting arrangementsIt is the Group’s policy that all credit exposures are adequately collateralised. Notwithstanding, our account opening documentation allows the Bank to net off customers’ deposits against their exposure to the Bank. Generally, transactions are allowed to run on a gross basis. However, in cases of unfavourable credit migration, the Bank may elect to invoke the netting agreement.
Credit-related commitmentsIt is the Group’s policy that all credit exposures are adequately collateralised. Credit risk mitigation is an activity of reducing credit risk in an exposure.
Provisioning policyA loan or loan portfolio is impaired and impairment losses are incurred only if there is objective evidence of impairment as a result of one or more events that occurred after initial recognition of the asset (a ‘loss event’) and that loss event (or events) has an impact on the estimated future cash flows of the loan or loan portfolio that can be reliably estimated.
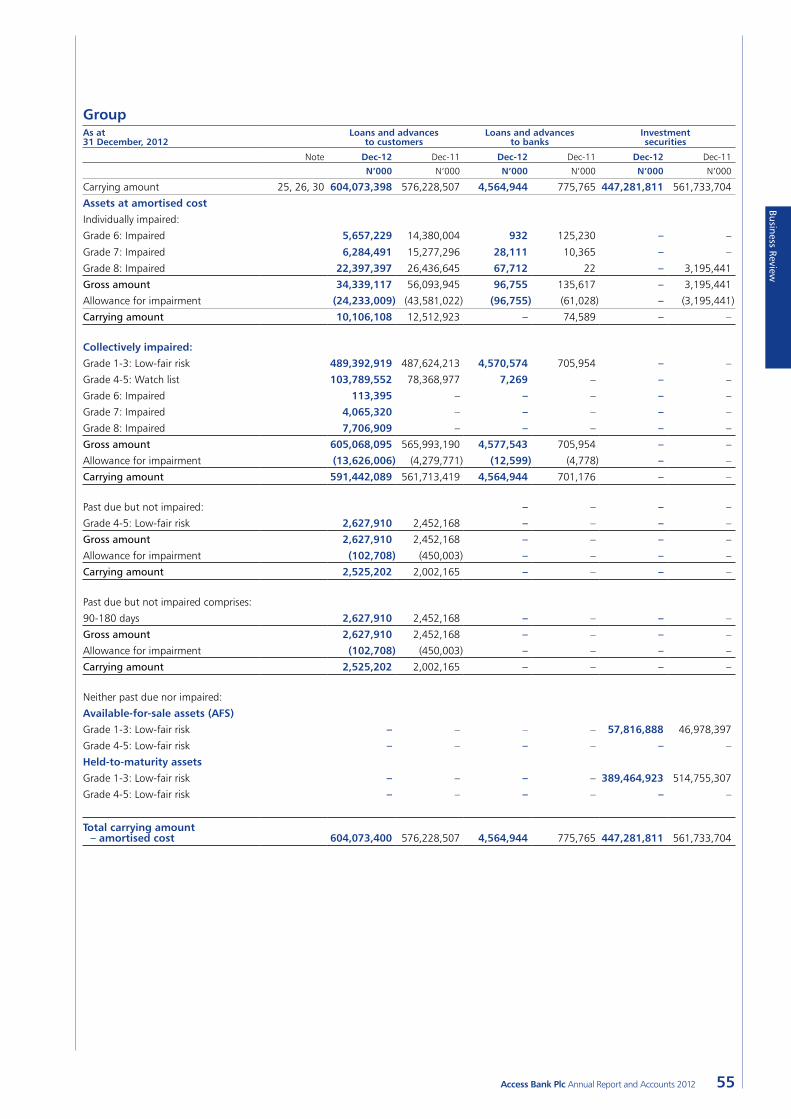
Business Review
55Access Bank Plc Annual Report and Accounts 2012
GroupAs at 31 December, 2012
Loans and advances to customers
Loans and advances to banks
Investment securities
Note Dec-12 Dec-11 Dec-12 Dec-11 Dec-12 Dec-11
N’000 N’000 N’000 N’000 N’000 N’000
Carrying amount 25, 26, 30 604,073,398 576,228,507 4,564,944 775,765 447,281,811 561,733,704
Assets at amortised cost
Individually impaired:
Grade 6: Impaired 5,657,229 14,380,004 932 125,230 – –
Grade 7: Impaired 6,284,491 15,277,296 28,111 10,365 – –
Grade 8: Impaired 22,397,397 26,436,645 67,712 22 – 3,195,441
Gross amount 34,339,117 56,093,945 96,755 135,617 – 3,195,441
Allowance for impairment (24,233,009) (43,581,022) (96,755) (61,028) – (3,195,441)
Carrying amount 10,106,108 12,512,923 – 74,589 – –
Collectively impaired:
Grade 1-3: Low-fair risk 489,392,919 487,624,213 4,570,574 705,954 – –
Grade 4-5: Watch list 103,789,552 78,368,977 7,269 – – –
Grade 6: Impaired 113,395 – – – – –
Grade 7: Impaired 4,065,320 – – – – –
Grade 8: Impaired 7,706,909 – – – – –
Gross amount 605,068,095 565,993,190 4,577,543 705,954 – –
Allowance for impairment (13,626,006) (4,279,771) (12,599) (4,778) – –
Carrying amount 591,442,089 561,713,419 4,564,944 701,176 – –
Past due but not impaired: – – – –
Grade 4-5: Low-fair risk 2,627,910 2,452,168 – – – –
Gross amount 2,627,910 2,452,168 – – – –
Allowance for impairment (102,708) (450,003) – – – –
Carrying amount 2,525,202 2,002,165 – – – –
Past due but not impaired comprises:
90-180 days 2,627,910 2,452,168 – – – –
Gross amount 2,627,910 2,452,168 – – – –
Allowance for impairment (102,708) (450,003) – – – –
Carrying amount 2,525,202 2,002,165 – – – –
Neither past due nor impaired:
Available-for-sale assets (AFS)
Grade 1-3: Low-fair risk – – – – 57,816,888 46,978,397
Grade 4-5: Low-fair risk – – – – – –
Held-to-maturity assets
Grade 1-3: Low-fair risk – – – – 389,464,923 514,755,307
Grade 4-5: Low-fair risk – – – – – –
Total carrying amount – amortised cost 604,073,400 576,228,507 4,564,944 775,765 447,281,811 561,733,704
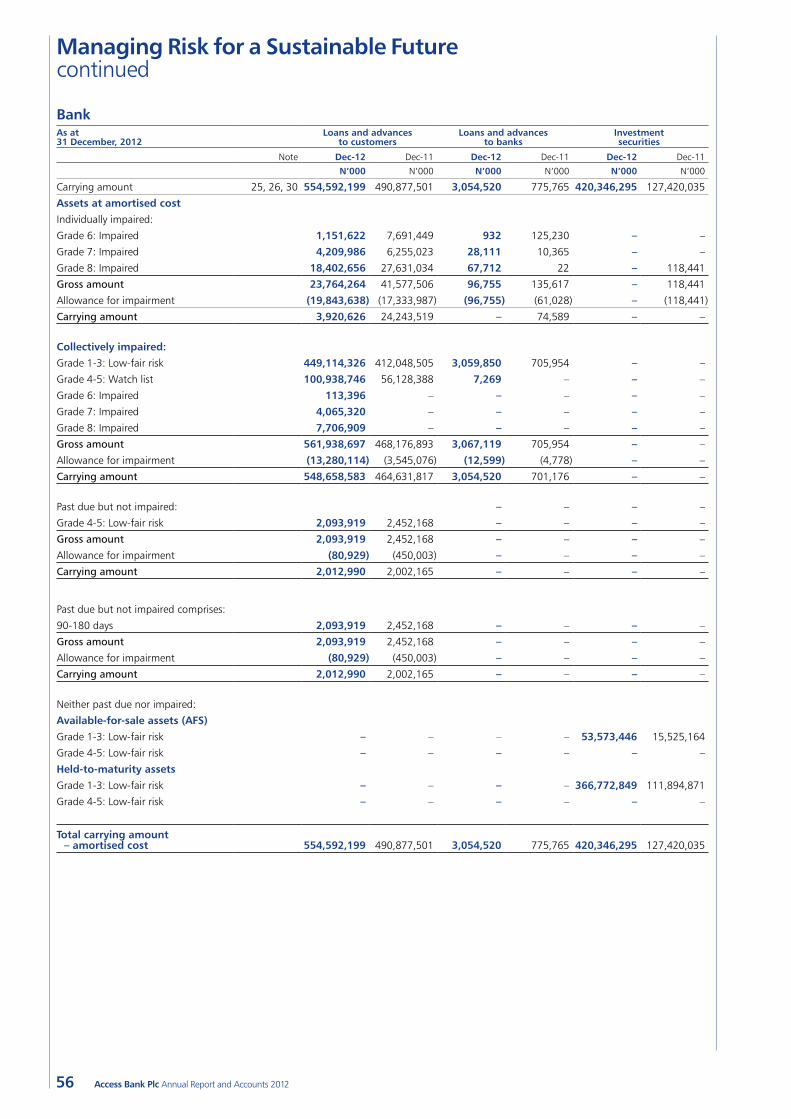
Managing Risk for a Sustainable Future continued
56 Access Bank Plc Annual Report and Accounts 2012
BankAs at31 December, 2012
Loans and advances to customers
Loans and advances to banks
Investment securities
Note Dec-12 Dec-11 Dec-12 Dec-11 Dec-12 Dec-11
N’000 N’000 N’000 N’000 N’000 N’000
Carrying amount 25, 26, 30 554,592,199 490,877,501 3,054,520 775,765 420,346,295 127,420,035
Assets at amortised cost
Individually impaired:
Grade 6: Impaired 1,151,622 7,691,449 932 125,230 – –
Grade 7: Impaired 4,209,986 6,255,023 28,111 10,365 – –
Grade 8: Impaired 18,402,656 27,631,034 67,712 22 – 118,441
Gross amount 23,764,264 41,577,506 96,755 135,617 – 118,441
Allowance for impairment (19,843,638) (17,333,987) (96,755) (61,028) – (118,441)
Carrying amount 3,920,626 24,243,519 – 74,589 – –
Collectively impaired:
Grade 1-3: Low-fair risk 449,114,326 412,048,505 3,059,850 705,954 – –
Grade 4-5: Watch list 100,938,746 56,128,388 7,269 – – –
Grade 6: Impaired 113,396 – – – – –
Grade 7: Impaired 4,065,320 – – – – –
Grade 8: Impaired 7,706,909 – – – – –
Gross amount 561,938,697 468,176,893 3,067,119 705,954 – –
Allowance for impairment (13,280,114) (3,545,076) (12,599) (4,778) – –
Carrying amount 548,658,583 464,631,817 3,054,520 701,176 – –
Past due but not impaired: – – – –
Grade 4-5: Low-fair risk 2,093,919 2,452,168 – – – –
Gross amount 2,093,919 2,452,168 – – – –
Allowance for impairment (80,929) (450,003) – – – –
Carrying amount 2,012,990 2,002,165 – – – –
Past due but not impaired comprises:
90-180 days 2,093,919 2,452,168 – – – –
Gross amount 2,093,919 2,452,168 – – – –
Allowance for impairment (80,929) (450,003) – – – –
Carrying amount 2,012,990 2,002,165 – – – –
Neither past due nor impaired:
Available-for-sale assets (AFS)
Grade 1-3: Low-fair risk – – – – 53,573,446 15,525,164
Grade 4-5: Low-fair risk – – – – – –
Held-to-maturity assets
Grade 1-3: Low-fair risk – – – – 366,772,849 111,894,871
Grade 4-5: Low-fair risk – – – – – –
Total carrying amount – amortised cost 554,592,199 490,877,501 3,054,520 775,765 420,346,295 127,420,035
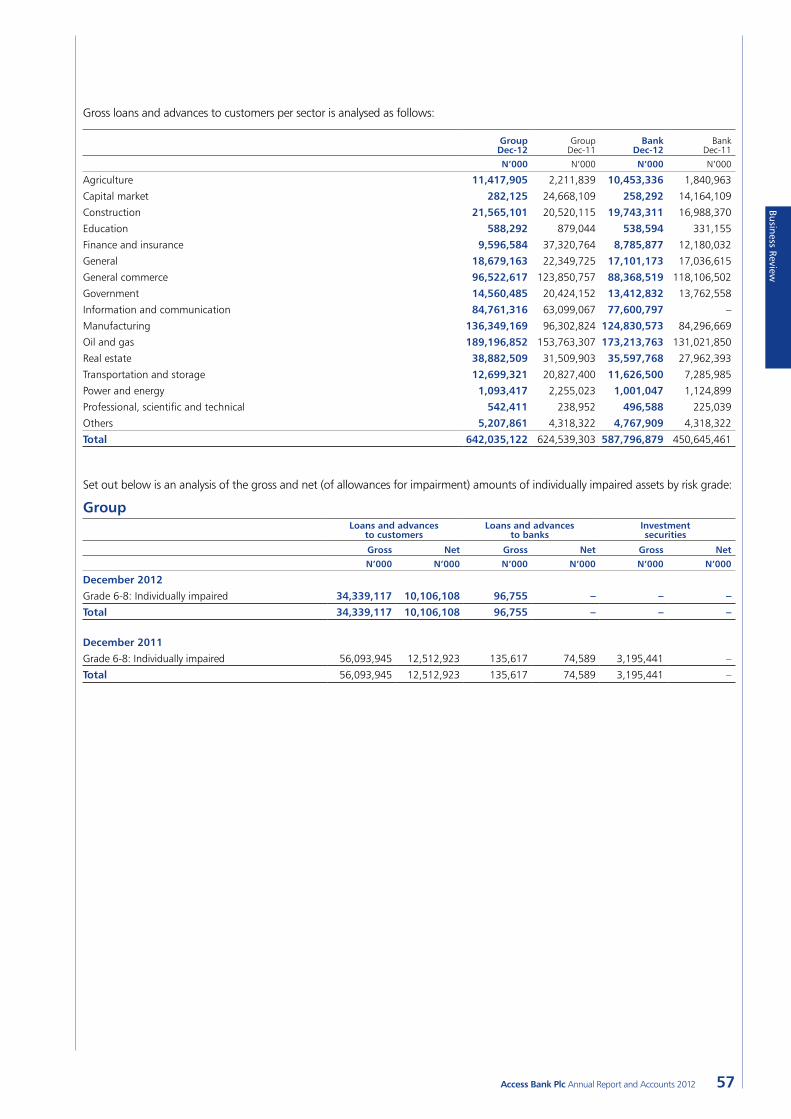
Business Review
57Access Bank Plc Annual Report and Accounts 2012
Gross loans and advances to customers per sector is analysed as follows:
Group Dec-12
Group Dec-11
Bank Dec-12
Bank Dec-11
N’000 N’000 N’000 N’000
Agriculture 11,417,905 2,211,839 10,453,336 1,840,963
Capital market 282,125 24,668,109 258,292 14,164,109
Construction 21,565,101 20,520,115 19,743,311 16,988,370
Education 588,292 879,044 538,594 331,155
Finance and insurance 9,596,584 37,320,764 8,785,877 12,180,032
General 18,679,163 22,349,725 17,101,173 17,036,615
General commerce 96,522,617 123,850,757 88,368,519 118,106,502
Government 14,560,485 20,424,152 13,412,832 13,762,558
Information and communication 84,761,316 63,099,067 77,600,797 –
Manufacturing 136,349,169 96,302,824 124,830,573 84,296,669
Oil and gas 189,196,852 153,763,307 173,213,763 131,021,850
Real estate 38,882,509 31,509,903 35,597,768 27,962,393
Transportation and storage 12,699,321 20,827,400 11,626,500 7,285,985
Power and energy 1,093,417 2,255,023 1,001,047 1,124,899
Professional, scientific and technical 542,411 238,952 496,588 225,039
Others 5,207,861 4,318,322 4,767,909 4,318,322
Total 642,035,122 624,539,303 587,796,879 450,645,461
Set out below is an analysis of the gross and net (of allowances for impairment) amounts of individually impaired assets by risk grade:
GroupLoans and advances
to customersLoans and advances
to banksInvestment securities
Gross Net Gross Net Gross NetN’000 N’000 N’000 N’000 N’000 N’000
December 2012
Grade 6-8: Individually impaired 34,339,117 10,106,108 96,755 – – –
Total 34,339,117 10,106,108 96,755 – – –
December 2011
Grade 6-8: Individually impaired 56,093,945 12,512,923 135,617 74,589 3,195,441 –
Total 56,093,945 12,512,923 135,617 74,589 3,195,441 –
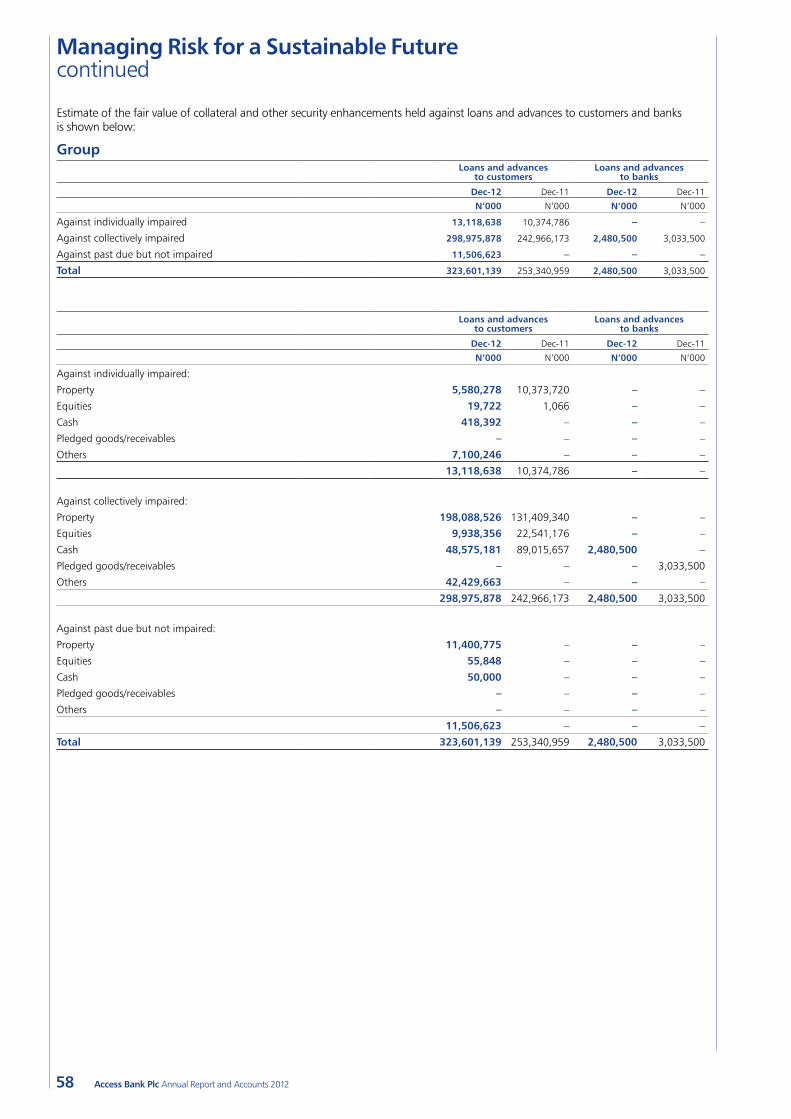
Managing Risk for a Sustainable Future continued
58 Access Bank Plc Annual Report and Accounts 2012
Estimate of the fair value of collateral and other security enhancements held against loans and advances to customers and banks is shown below:
GroupLoans and advances
to customersLoans and advances
to banks
Dec-12 Dec-11 Dec-12 Dec-11
N’000 N’000 N’000 N’000
Against individually impaired 13,118,638 10,374,786 – –
Against collectively impaired 298,975,878 242,966,173 2,480,500 3,033,500
Against past due but not impaired 11,506,623 – – –
Total 323,601,139 253,340,959 2,480,500 3,033,500
Loans and advances to customers
Loans and advances to banks
Dec-12 Dec-11 Dec-12 Dec-11
N’000 N’000 N’000 N’000
Against individually impaired:
Property 5,580,278 10,373,720 – –
Equities 19,722 1,066 – –
Cash 418,392 – – –
Pledged goods/receivables – – – –
Others 7,100,246 – – –
13,118,638 10,374,786 – –
Against collectively impaired:
Property 198,088,526 131,409,340 – –
Equities 9,938,356 22,541,176 – –
Cash 48,575,181 89,015,657 2,480,500 –
Pledged goods/receivables – – – 3,033,500
Others 42,429,663 – – –
298,975,878 242,966,173 2,480,500 3,033,500
Against past due but not impaired:
Property 11,400,775 – – –
Equities 55,848 – – –
Cash 50,000 – – –
Pledged goods/receivables – – – –
Others – – – –
11,506,623 – – –
Total 323,601,139 253,340,959 2,480,500 3,033,500
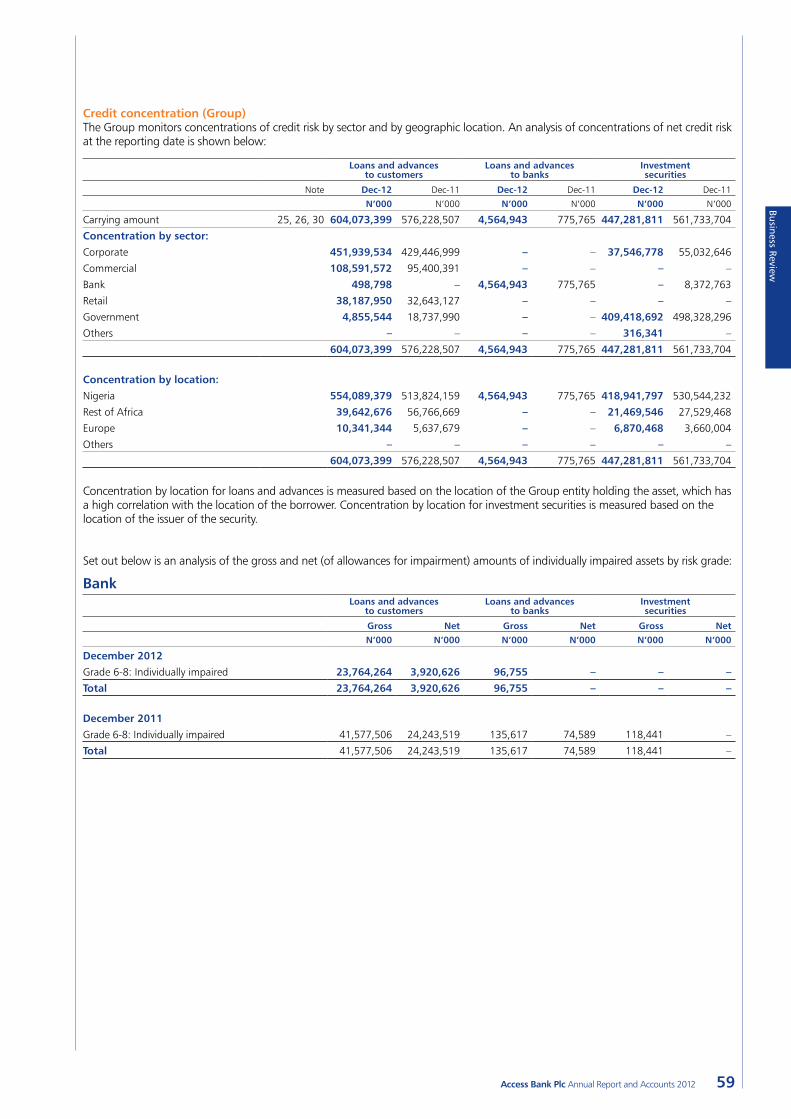
Business Review
59Access Bank Plc Annual Report and Accounts 2012
Credit concentration (Group)The Group monitors concentrations of credit risk by sector and by geographic location. An analysis of concentrations of net credit risk at the reporting date is shown below:
Loans and advances to customers
Loans and advances to banks
Investment securities
Note Dec-12 Dec-11 Dec-12 Dec-11 Dec-12 Dec-11
N’000 N’000 N’000 N’000 N’000 N’000
Carrying amount 25, 26, 30 604,073,399 576,228,507 4,564,943 775,765 447,281,811 561,733,704
Concentration by sector:
Corporate 451,939,534 429,446,999 – – 37,546,778 55,032,646
Commercial 108,591,572 95,400,391 – – – –
Bank 498,798 – 4,564,943 775,765 – 8,372,763
Retail 38,187,950 32,643,127 – – – –
Government 4,855,544 18,737,990 – – 409,418,692 498,328,296
Others – – – – 316,341 –
604,073,399 576,228,507 4,564,943 775,765 447,281,811 561,733,704
Concentration by location:
Nigeria 554,089,379 513,824,159 4,564,943 775,765 418,941,797 530,544,232
Rest of Africa 39,642,676 56,766,669 – – 21,469,546 27,529,468
Europe 10,341,344 5,637,679 – – 6,870,468 3,660,004
Others – – – – – –
604,073,399 576,228,507 4,564,943 775,765 447,281,811 561,733,704
Concentration by location for loans and advances is measured based on the location of the Group entity holding the asset, which has a high correlation with the location of the borrower. Concentration by location for investment securities is measured based on the location of the issuer of the security.
Set out below is an analysis of the gross and net (of allowances for impairment) amounts of individually impaired assets by risk grade:
BankLoans and advances
to customersLoans and advances
to banksInvestment securities
Gross Net Gross Net Gross NetN’000 N’000 N’000 N’000 N’000 N’000
December 2012
Grade 6-8: Individually impaired 23,764,264 3,920,626 96,755 – – –
Total 23,764,264 3,920,626 96,755 – – –
December 2011
Grade 6-8: Individually impaired 41,577,506 24,243,519 135,617 74,589 118,441 –
Total 41,577,506 24,243,519 135,617 74,589 118,441 –
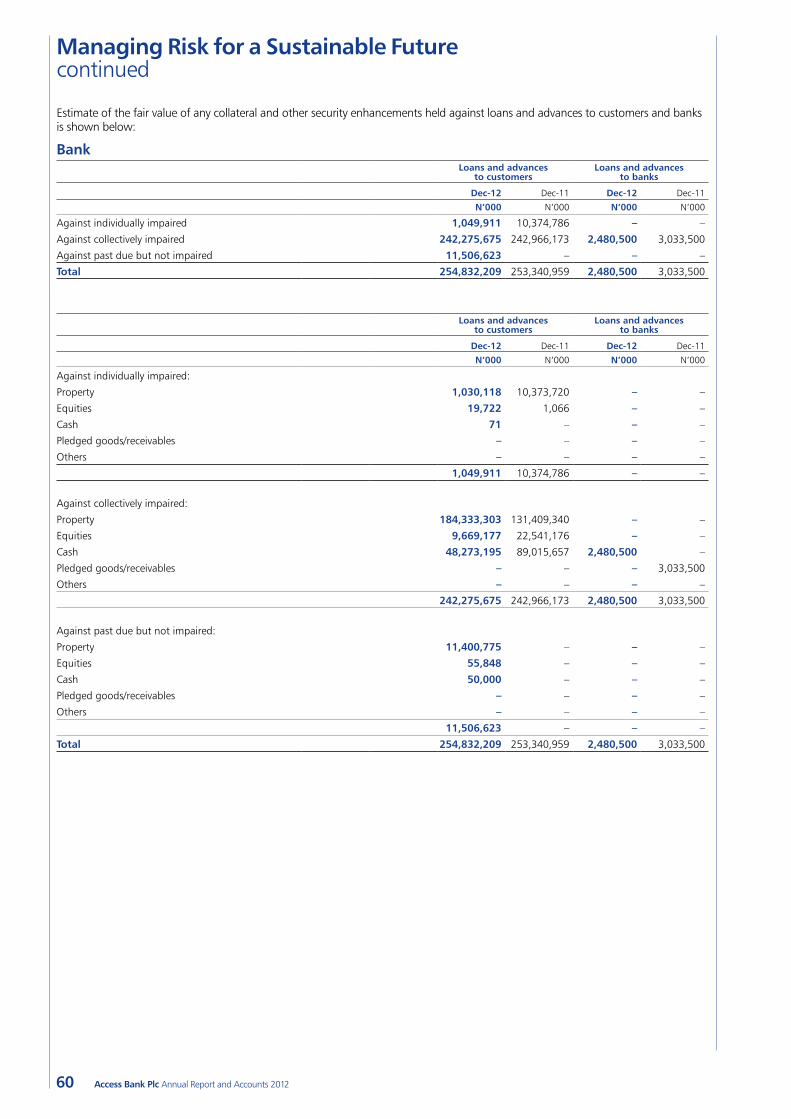
Managing Risk for a Sustainable Future continued
60 Access Bank Plc Annual Report and Accounts 2012
Estimate of the fair value of any collateral and other security enhancements held against loans and advances to customers and banks is shown below:
BankLoans and advances
to customersLoans and advances
to banks
Dec-12 Dec-11 Dec-12 Dec-11
N’000 N’000 N’000 N’000
Against individually impaired 1,049,911 10,374,786 – –
Against collectively impaired 242,275,675 242,966,173 2,480,500 3,033,500
Against past due but not impaired 11,506,623 – – –
Total 254,832,209 253,340,959 2,480,500 3,033,500
Loans and advances to customers
Loans and advances to banks
Dec-12 Dec-11 Dec-12 Dec-11
N’000 N’000 N’000 N’000
Against individually impaired:
Property 1,030,118 10,373,720 – –
Equities 19,722 1,066 – –
Cash 71 – – –
Pledged goods/receivables – – – –
Others – – – –
1,049,911 10,374,786 – –
Against collectively impaired:
Property 184,333,303 131,409,340 – –
Equities 9,669,177 22,541,176 – –
Cash 48,273,195 89,015,657 2,480,500 –
Pledged goods/receivables – – – 3,033,500
Others – – – –
242,275,675 242,966,173 2,480,500 3,033,500
Against past due but not impaired:
Property 11,400,775 – – –
Equities 55,848 – – –
Cash 50,000 – – –
Pledged goods/receivables – – – –
Others – – – –
11,506,623 – – –
Total 254,832,209 253,340,959 2,480,500 3,033,500
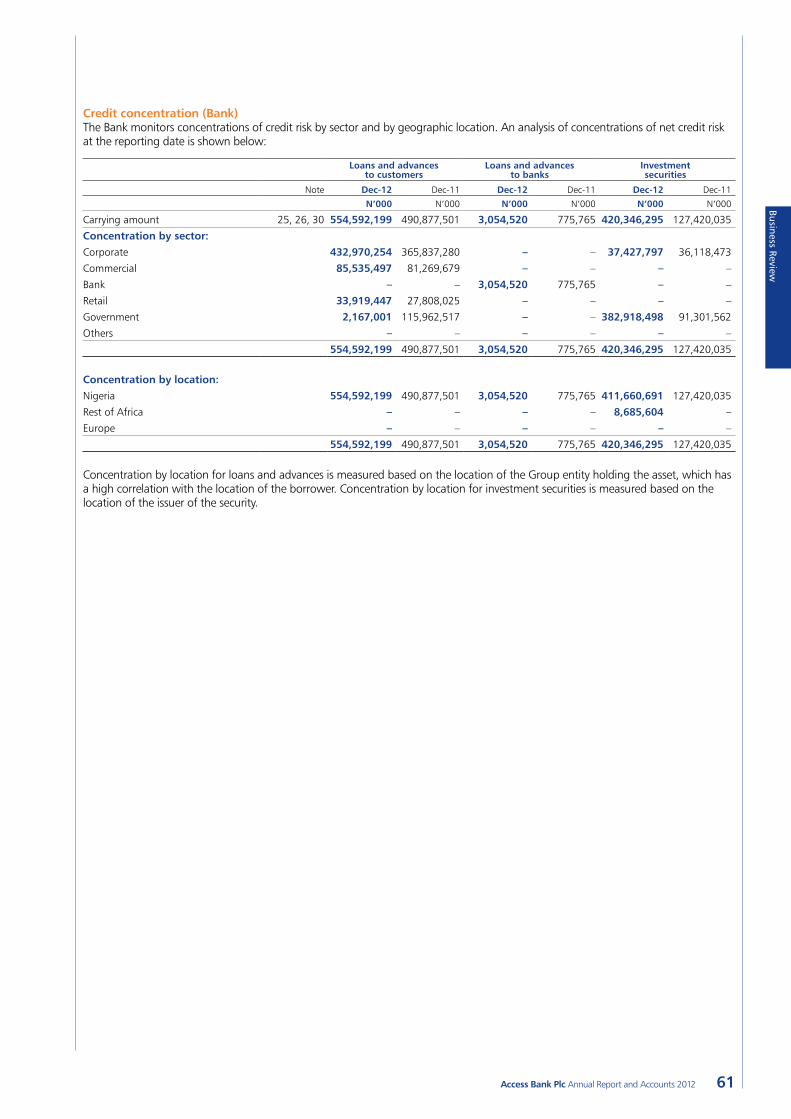
Business Review
61Access Bank Plc Annual Report and Accounts 2012
Credit concentration (Bank)The Bank monitors concentrations of credit risk by sector and by geographic location. An analysis of concentrations of net credit risk at the reporting date is shown below:
Loans and advances to customers
Loans and advances to banks
Investment securities
Note Dec-12 Dec-11 Dec-12 Dec-11 Dec-12 Dec-11
N’000 N’000 N’000 N’000 N’000 N’000
Carrying amount 25, 26, 30 554,592,199 490,877,501 3,054,520 775,765 420,346,295 127,420,035
Concentration by sector:
Corporate 432,970,254 365,837,280 – – 37,427,797 36,118,473
Commercial 85,535,497 81,269,679 – – – –
Bank – – 3,054,520 775,765 – –
Retail 33,919,447 27,808,025 – – – –
Government 2,167,001 115,962,517 – – 382,918,498 91,301,562
Others – – – – – –
554,592,199 490,877,501 3,054,520 775,765 420,346,295 127,420,035
Concentration by location:
Nigeria 554,592,199 490,877,501 3,054,520 775,765 411,660,691 127,420,035
Rest of Africa – – – – 8,685,604 –
Europe – – – – – –
554,592,199 490,877,501 3,054,520 775,765 420,346,295 127,420,035
Concentration by location for loans and advances is measured based on the location of the Group entity holding the asset, which has a high correlation with the location of the borrower. Concentration by location for investment securities is measured based on the location of the issuer of the security.
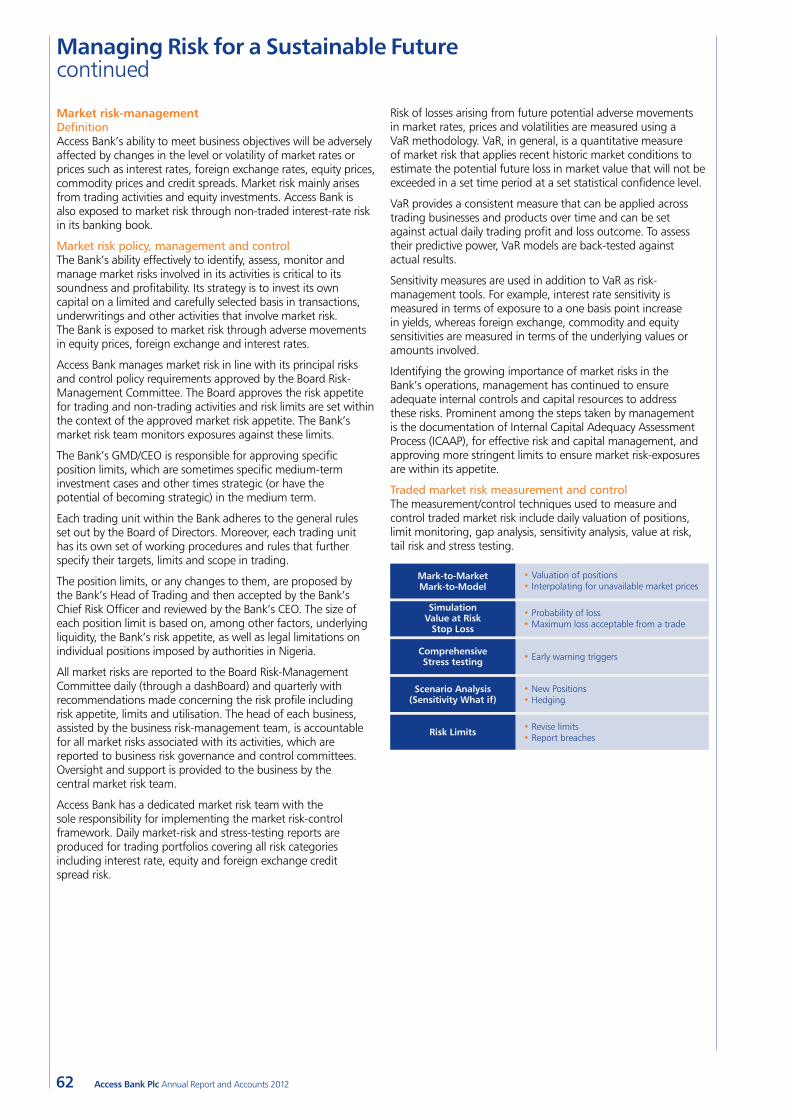
Managing Risk for a Sustainable Future continued
62 Access Bank Plc Annual Report and Accounts 2012
Risk of losses arising from future potential adverse movements in market rates, prices and volatilities are measured using a VaR methodology. VaR, in general, is a quantitative measure of market risk that applies recent historic market conditions to estimate the potential future loss in market value that will not be exceeded in a set time period at a set statistical confidence level.
VaR provides a consistent measure that can be applied across trading businesses and products over time and can be set against actual daily trading profit and loss outcome. To assess their predictive power, VaR models are back-tested against actual results.
Sensitivity measures are used in addition to VaR as risk-management tools. For example, interest rate sensitivity is measured in terms of exposure to a one basis point increase in yields, whereas foreign exchange, commodity and equity sensitivities are measured in terms of the underlying values or amounts involved.
Identifying the growing importance of market risks in the Bank’s operations, management has continued to ensure adequate internal controls and capital resources to address these risks. Prominent among the steps taken by management is the documentation of Internal Capital Adequacy Assessment Process (ICAAP), for effective risk and capital management, and approving more stringent limits to ensure market risk-exposures are within its appetite.
Traded market risk measurement and controlThe measurement/control techniques used to measure and control traded market risk include daily valuation of positions, limit monitoring, gap analysis, sensitivity analysis, value at risk, tail risk and stress testing.
Mark-to-MarketMark-to-Model
• Valuation of positions• Interpolating for unavailable market prices
• Probability of loss• Maximum loss acceptable from a trade
SimulationValue at Risk
Stop Loss
• Early warning triggersComprehensive Stress testing
• Revise limits• Report breaches
Risk Limits
• New Positions• Hedging
Scenario Analysis(Sensitivity What if)
Market risk-managementDefinitionAccess Bank’s ability to meet business objectives will be adversely affected by changes in the level or volatility of market rates or prices such as interest rates, foreign exchange rates, equity prices, commodity prices and credit spreads. Market risk mainly arises from trading activities and equity investments. Access Bank is also exposed to market risk through non-traded interest-rate risk in its banking book.
Market risk policy, management and controlThe Bank’s ability effectively to identify, assess, monitor and manage market risks involved in its activities is critical to its soundness and profitability. Its strategy is to invest its own capital on a limited and carefully selected basis in transactions, underwritings and other activities that involve market risk. The Bank is exposed to market risk through adverse movements in equity prices, foreign exchange and interest rates.
Access Bank manages market risk in line with its principal risks and control policy requirements approved by the Board Risk-Management Committee. The Board approves the risk appetite for trading and non-trading activities and risk limits are set within the context of the approved market risk appetite. The Bank’s market risk team monitors exposures against these limits.
The Bank’s GMD/CEO is responsible for approving specific position limits, which are sometimes specific medium-term investment cases and other times strategic (or have the potential of becoming strategic) in the medium term.
Each trading unit within the Bank adheres to the general rules set out by the Board of Directors. Moreover, each trading unit has its own set of working procedures and rules that further specify their targets, limits and scope in trading.
The position limits, or any changes to them, are proposed by the Bank’s Head of Trading and then accepted by the Bank’s Chief Risk Officer and reviewed by the Bank’s CEO. The size of each position limit is based on, among other factors, underlying liquidity, the Bank’s risk appetite, as well as legal limitations on individual positions imposed by authorities in Nigeria.
All market risks are reported to the Board Risk-Management Committee daily (through a dashBoard) and quarterly with recommendations made concerning the risk profile including risk appetite, limits and utilisation. The head of each business, assisted by the business risk-management team, is accountable for all market risks associated with its activities, which are reported to business risk governance and control committees. Oversight and support is provided to the business by the central market risk team.
Access Bank has a dedicated market risk team with the sole responsibility for implementing the market risk-control framework. Daily market-risk and stress-testing reports are produced for trading portfolios covering all risk categories including interest rate, equity and foreign exchange credit spread risk.
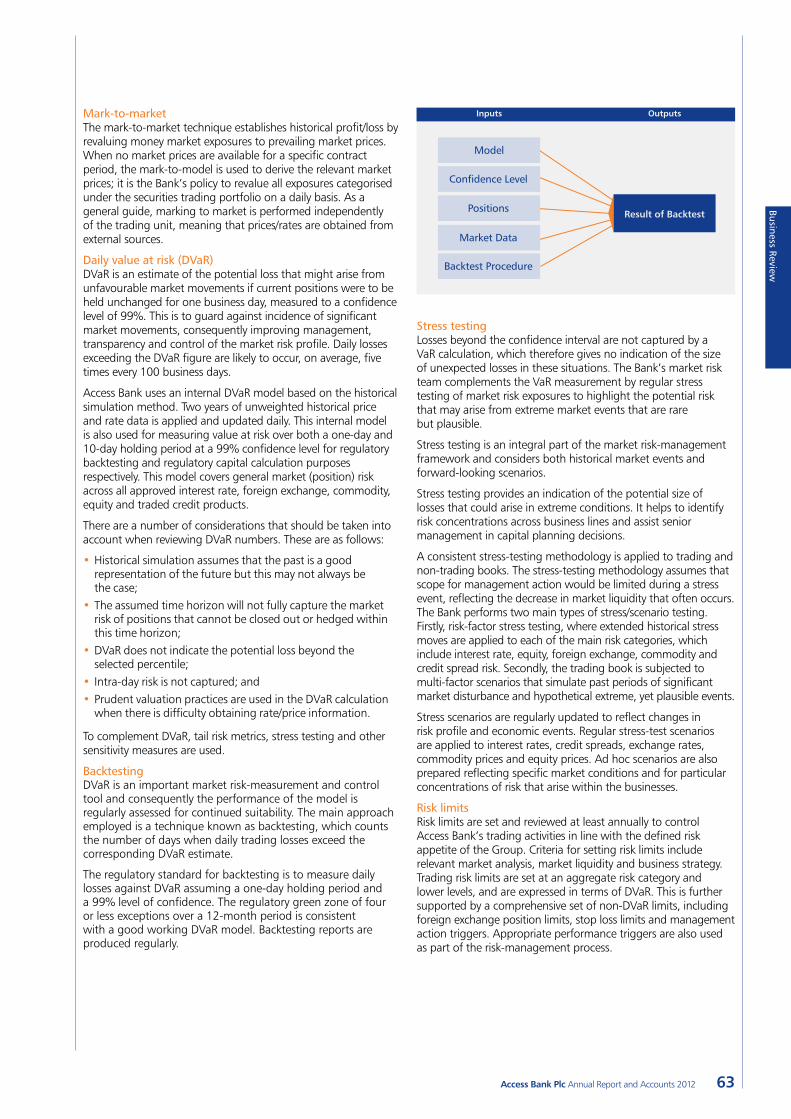
Business Review
63Access Bank Plc Annual Report and Accounts 2012
Result of Backtest
Model
Confidence Level
Positions
Market Data
Backtest Procedure
Inputs Outputs
Stress testingLosses beyond the confidence interval are not captured by a VaR calculation, which therefore gives no indication of the size of unexpected losses in these situations. The Bank’s market risk team complements the VaR measurement by regular stress testing of market risk exposures to highlight the potential risk that may arise from extreme market events that are rare but plausible.
Stress testing is an integral part of the market risk-management framework and considers both historical market events and forward-looking scenarios.
Stress testing provides an indication of the potential size of losses that could arise in extreme conditions. It helps to identify risk concentrations across business lines and assist senior management in capital planning decisions.
A consistent stress-testing methodology is applied to trading and non-trading books. The stress-testing methodology assumes that scope for management action would be limited during a stress event, reflecting the decrease in market liquidity that often occurs. The Bank performs two main types of stress/scenario testing. Firstly, risk-factor stress testing, where extended historical stress moves are applied to each of the main risk categories, which include interest rate, equity, foreign exchange, commodity and credit spread risk. Secondly, the trading book is subjected to multi-factor scenarios that simulate past periods of significant market disturbance and hypothetical extreme, yet plausible events.
Stress scenarios are regularly updated to reflect changes in risk profile and economic events. Regular stress-test scenarios are applied to interest rates, credit spreads, exchange rates, commodity prices and equity prices. Ad hoc scenarios are also prepared reflecting specific market conditions and for particular concentrations of risk that arise within the businesses.
Risk limitsRisk limits are set and reviewed at least annually to control Access Bank’s trading activities in line with the defined risk appetite of the Group. Criteria for setting risk limits include relevant market analysis, market liquidity and business strategy. Trading risk limits are set at an aggregate risk category and lower levels, and are expressed in terms of DVaR. This is further supported by a comprehensive set of non-DVaR limits, including foreign exchange position limits, stop loss limits and management action triggers. Appropriate performance triggers are also used as part of the risk-management process.
Mark-to-market The mark-to-market technique establishes historical profit/loss by revaluing money market exposures to prevailing market prices. When no market prices are available for a specific contract period, the mark-to-model is used to derive the relevant market prices; it is the Bank’s policy to revalue all exposures categorised under the securities trading portfolio on a daily basis. As a general guide, marking to market is performed independently of the trading unit, meaning that prices/rates are obtained from external sources.
Daily value at risk (DVaR) DVaR is an estimate of the potential loss that might arise from unfavourable market movements if current positions were to be held unchanged for one business day, measured to a confidence level of 99%. This is to guard against incidence of significant market movements, consequently improving management, transparency and control of the market risk profile. Daily losses exceeding the DVaR figure are likely to occur, on average, five times every 100 business days.
Access Bank uses an internal DVaR model based on the historical simulation method. Two years of unweighted historical price and rate data is applied and updated daily. This internal model is also used for measuring value at risk over both a one-day and 10-day holding period at a 99% confidence level for regulatory backtesting and regulatory capital calculation purposes respectively. This model covers general market (position) risk across all approved interest rate, foreign exchange, commodity, equity and traded credit products.
There are a number of considerations that should be taken into account when reviewing DVaR numbers. These are as follows:
•Historical simulation assumes that the past is a good representation of the future but this may not always be the case;
•The assumed time horizon will not fully capture the market risk of positions that cannot be closed out or hedged within this time horizon;
•DVaR does not indicate the potential loss beyond the selected percentile;
• Intra-day risk is not captured; and•Prudent valuation practices are used in the DVaR calculation
when there is difficulty obtaining rate/price information.
To complement DVaR, tail risk metrics, stress testing and other sensitivity measures are used.
Backtesting DVaR is an important market risk-measurement and control tool and consequently the performance of the model is regularly assessed for continued suitability. The main approach employed is a technique known as backtesting, which counts the number of days when daily trading losses exceed the corresponding DVaR estimate.
The regulatory standard for backtesting is to measure daily losses against DVaR assuming a one-day holding period and a 99% level of confidence. The regulatory green zone of four or less exceptions over a 12-month period is consistent with a good working DVaR model. Backtesting reports are produced regularly.
Managing Risk for a Sustainable Future continued
64 Access Bank Plc Annual Report and Accounts 2012
Open position limit (OPL): The Bank, in keeping with the prudency concept, sets its policy limit for Open Position at a level lower than the maximum OPL approved by the regulatory authority. In setting the internal OPL, the following considerations are imperative:
•The regulatory OPL;•The Bank’s tolerance and appetite for FX risk;•The size and depth of the FX market in Nigeria;•The degree of volatility of traded currencies; and•The Bank’s desired positioning in the relevant FX market
with requirements for international business support.
Management action trigger (MAT): This establishes decision points to confirm the Board of Directors’ tolerance for accepting trading risk losses on a cumulative basis. A MAT therefore takes into account actual cumulative profit/loss as well as potential losses and the loss tolerance is defined as a percentage of gross earnings.
Stop loss limit: This limit sets a maximum tolerable unrealised profit/loss to date which will trigger the closing of a position in order to avoid any further loss based on existing exposures. Positions are liquidated uniformly when stop loss limits are breached.
Dealer stop loss limit: This limit sets a maximum tolerable unrealised profit/loss to date based on existing exposures for a specific dealer. Positions are liquidated uniformly when the dealer stop limit is breached, independently of the global stop loss limit.
Value-at-risk limit (VaR): The normal VaR of the portfolio will be the Naira loss that will be exceeded 1% of the time over a one-day horizon. The time period may be changed depending on the volume of positions held and current market realities. At a maximum of 99% confidence level, and a holding period of one day, the bank maintains a VaR limit of 0.25% of gross earnings.
Interest-rate riskInterest-rate risk is the exposure of the Bank’s financial condition to adverse movements in interest rates, yield curves and credit spreads. The Bank is exposed to interest-rate risk through the interest-bearing assets and liabilities in its trading and banking books.
Access Bank’s objective for management of interest-rate risk in the banking book is to ensure a higher degree of interest-rate mismatch margin stability and lower interest-rate risk over an interest-rate cycle. This is achieved by hedging material exposures with the external market.
The Bank’s operations are subject to the risk of interest-rate fluctuations to the extent that interest-earning assets and interest-bearing liabilities mature or re-price at different times or in differing amounts. In the case of floating-rated assets and liabilities, the Bank is also exposed to basis risk, which is the difference in re-pricing characteristics of the various floating rate indices, such as the savings rate and 90-day NBOR and different types of interest. Non-traded interest-rate risk arises in the banking book from the provision of retail and wholesale (non-traded) banking products and services, as well as from certain structural exposures within the Group balance sheet, mainly due to re-pricing timing differences between assets, liabilities and equity. These risks impact both the earnings and the economic value of the Group. Overall non-trading interest- rate risk positions are managed by Treasury, which uses investment securities, advances to banks and deposits from banks to manage the overall position arising from the Group’s non-trading activities.
The OPLs using the Earnings at Risk approach are the principal tool used to measure and control market risk exposure within the Group’s trading portfolios. Specified limits have been set for open positions limits, which are the expected maximum exposure the Group is to be exposed to. Risk-management activities are aimed at optimising net interest income, given market interest rate levels consistent with the Bank’s business strategies.
Interest-rate risk is monitored centrally with a Gap report. A limits framework is in place to ensure that retained risk remains within approved appetite. Interest-rate risk also arises in each of the Africa subsidiary treasuries in the course of balance sheet management and facilitating customer activity. The risk is managed by local treasury functions, subject to modest risk limits and other controls.
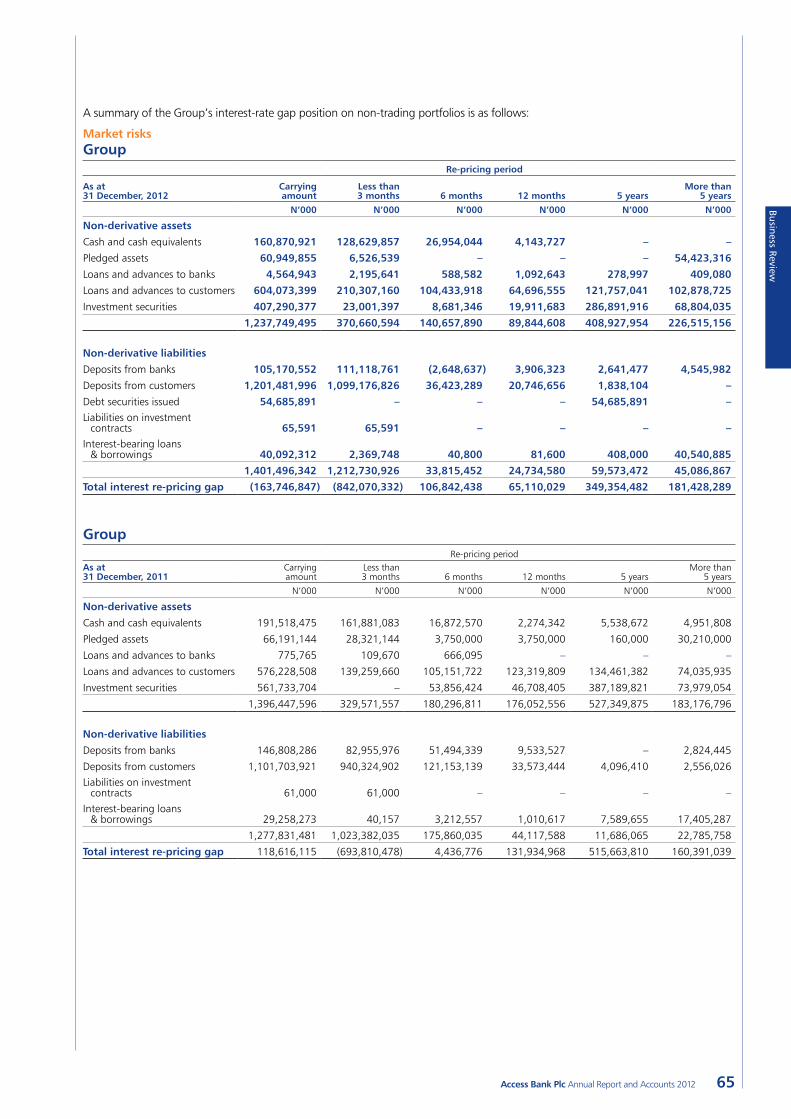
Business Review
65Access Bank Plc Annual Report and Accounts 2012
A summary of the Group’s interest-rate gap position on non-trading portfolios is as follows:
Market risksGroup
Re-pricing period
As at 31 December, 2012
Carrying amount
Less than 3 months 6 months 12 months 5 years
More than 5 years
N’000 N’000 N’000 N’000 N’000 N’000
Non-derivative assets
Cash and cash equivalents 160,870,921 128,629,857 26,954,044 4,143,727 – –
Pledged assets 60,949,855 6,526,539 – – – 54,423,316
Loans and advances to banks 4,564,943 2,195,641 588,582 1,092,643 278,997 409,080
Loans and advances to customers 604,073,399 210,307,160 104,433,918 64,696,555 121,757,041 102,878,725
Investment securities 407,290,377 23,001,397 8,681,346 19,911,683 286,891,916 68,804,035
1,237,749,495 370,660,594 140,657,890 89,844,608 408,927,954 226,515,156
Non-derivative liabilities
Deposits from banks 105,170,552 111,118,761 (2,648,637) 3,906,323 2,641,477 4,545,982
Deposits from customers 1,201,481,996 1,099,176,826 36,423,289 20,746,656 1,838,104 –
Debt securities issued 54,685,891 – – – 54,685,891 –Liabilities on investment
contracts 65,591 65,591 – – – –Interest-bearing loans
& borrowings 40,092,312 2,369,748 40,800 81,600 408,000 40,540,885
1,401,496,342 1,212,730,926 33,815,452 24,734,580 59,573,472 45,086,867
Total interest re-pricing gap (163,746,847) (842,070,332) 106,842,438 65,110,029 349,354,482 181,428,289
GroupRe-pricing period
As at 31 December, 2011
Carrying amount
Less than 3 months 6 months 12 months 5 years
More than 5 years
N’000 N’000 N’000 N’000 N’000 N’000
Non-derivative assets
Cash and cash equivalents 191,518,475 161,881,083 16,872,570 2,274,342 5,538,672 4,951,808
Pledged assets 66,191,144 28,321,144 3,750,000 3,750,000 160,000 30,210,000
Loans and advances to banks 775,765 109,670 666,095 – – –
Loans and advances to customers 576,228,508 139,259,660 105,151,722 123,319,809 134,461,382 74,035,935
Investment securities 561,733,704 – 53,856,424 46,708,405 387,189,821 73,979,054
1,396,447,596 329,571,557 180,296,811 176,052,556 527,349,875 183,176,796
Non-derivative liabilities
Deposits from banks 146,808,286 82,955,976 51,494,339 9,533,527 – 2,824,445
Deposits from customers 1,101,703,921 940,324,902 121,153,139 33,573,444 4,096,410 2,556,026Liabilities on investment
contracts 61,000 61,000 – – – –Interest-bearing loans
& borrowings 29,258,273 40,157 3,212,557 1,010,617 7,589,655 17,405,287
1,277,831,481 1,023,382,035 175,860,035 44,117,588 11,686,065 22,785,758
Total interest re-pricing gap 118,616,115 (693,810,478) 4,436,776 131,934,968 515,663,810 160,391,039
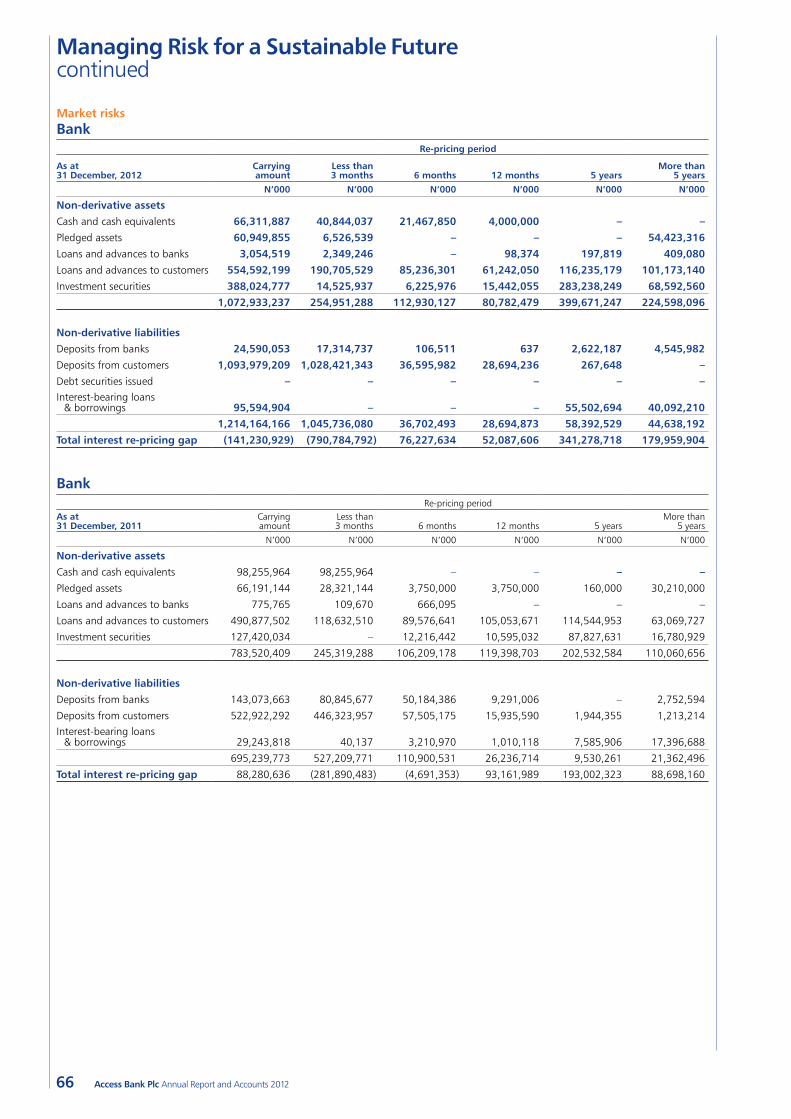
Managing Risk for a Sustainable Future continued
66 Access Bank Plc Annual Report and Accounts 2012
Market risksBank
Re-pricing period
As at 31 December, 2012
Carrying amount
Less than 3 months 6 months 12 months 5 years
More than 5 years
N’000 N’000 N’000 N’000 N’000 N’000
Non-derivative assets
Cash and cash equivalents 66,311,887 40,844,037 21,467,850 4,000,000 – –
Pledged assets 60,949,855 6,526,539 – – – 54,423,316
Loans and advances to banks 3,054,519 2,349,246 – 98,374 197,819 409,080
Loans and advances to customers 554,592,199 190,705,529 85,236,301 61,242,050 116,235,179 101,173,140
Investment securities 388,024,777 14,525,937 6,225,976 15,442,055 283,238,249 68,592,560
1,072,933,237 254,951,288 112,930,127 80,782,479 399,671,247 224,598,096
Non-derivative liabilities
Deposits from banks 24,590,053 17,314,737 106,511 637 2,622,187 4,545,982
Deposits from customers 1,093,979,209 1,028,421,343 36,595,982 28,694,236 267,648 –
Debt securities issued – – – – – –Interest-bearing loans
& borrowings 95,594,904 – – – 55,502,694 40,092,210
1,214,164,166 1,045,736,080 36,702,493 28,694,873 58,392,529 44,638,192
Total interest re-pricing gap (141,230,929) (790,784,792) 76,227,634 52,087,606 341,278,718 179,959,904
BankRe-pricing period
As at 31 December, 2011
Carrying amount
Less than 3 months 6 months 12 months 5 years
More than 5 years
N’000 N’000 N’000 N’000 N’000 N’000
Non-derivative assets
Cash and cash equivalents 98,255,964 98,255,964 – – – –
Pledged assets 66,191,144 28,321,144 3,750,000 3,750,000 160,000 30,210,000
Loans and advances to banks 775,765 109,670 666,095 – – –
Loans and advances to customers 490,877,502 118,632,510 89,576,641 105,053,671 114,544,953 63,069,727
Investment securities 127,420,034 – 12,216,442 10,595,032 87,827,631 16,780,929
783,520,409 245,319,288 106,209,178 119,398,703 202,532,584 110,060,656
Non-derivative liabilities
Deposits from banks 143,073,663 80,845,677 50,184,386 9,291,006 – 2,752,594
Deposits from customers 522,922,292 446,323,957 57,505,175 15,935,590 1,944,355 1,213,214Interest-bearing loans
& borrowings 29,243,818 40,137 3,210,970 1,010,118 7,585,906 17,396,688
695,239,773 527,209,771 110,900,531 26,236,714 9,530,261 21,362,496
Total interest re-pricing gap 88,280,636 (281,890,483) (4,691,353) 93,161,989 193,002,323 88,698,160
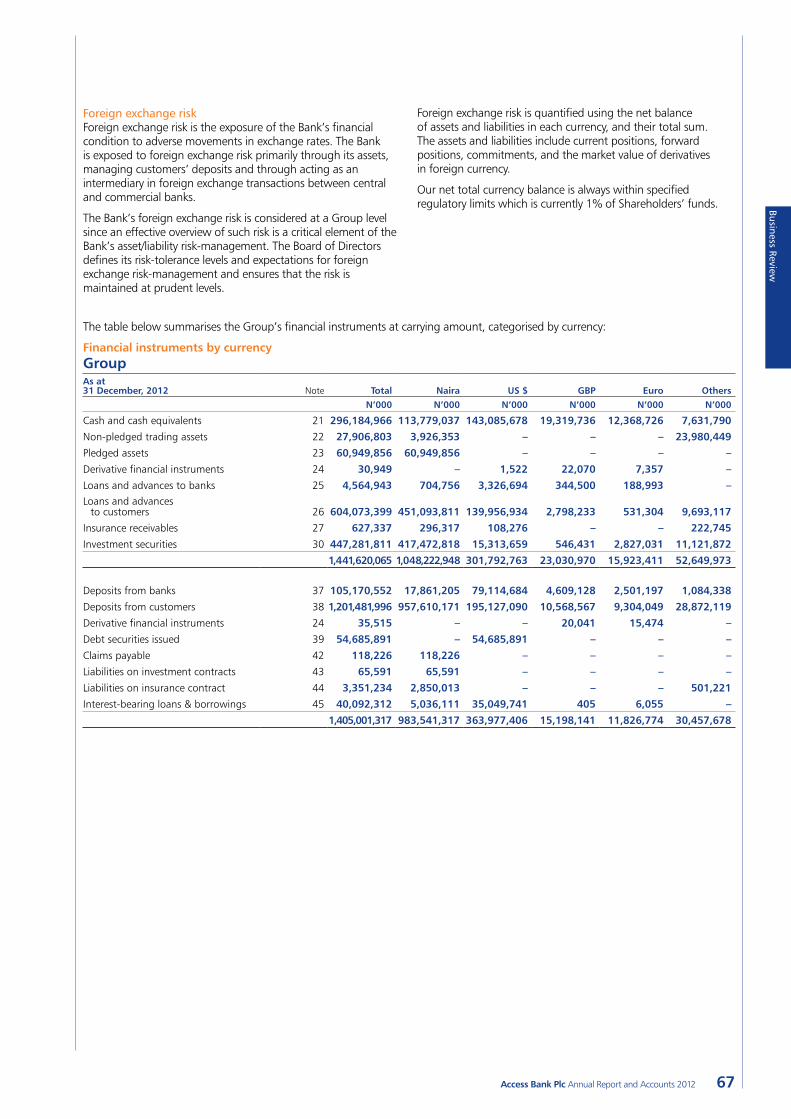
Business Review
67Access Bank Plc Annual Report and Accounts 2012
Foreign exchange riskForeign exchange risk is the exposure of the Bank’s financial condition to adverse movements in exchange rates. The Bank is exposed to foreign exchange risk primarily through its assets, managing customers’ deposits and through acting as an intermediary in foreign exchange transactions between central and commercial banks.
The Bank’s foreign exchange risk is considered at a Group level since an effective overview of such risk is a critical element of the Bank’s asset/liability risk-management. The Board of Directors defines its risk-tolerance levels and expectations for foreign exchange risk-management and ensures that the risk is maintained at prudent levels.
Foreign exchange risk is quantified using the net balance of assets and liabilities in each currency, and their total sum. The assets and liabilities include current positions, forward positions, commitments, and the market value of derivatives in foreign currency.
Our net total currency balance is always within specified regulatory limits which is currently 1% of Shareholders’ funds.
The table below summarises the Group’s financial instruments at carrying amount, categorised by currency:
Financial instruments by currencyGroupAs at 31 December, 2012 Note Total Naira US $ GBP Euro Others
N’000 N’000 N’000 N’000 N’000 N’000
Cash and cash equivalents 21 296,184,966 113,779,037 143,085,678 19,319,736 12,368,726 7,631,790
Non-pledged trading assets 22 27,906,803 3,926,353 – – – 23,980,449
Pledged assets 23 60,949,856 60,949,856 – – – –
Derivative financial instruments 24 30,949 – 1,522 22,070 7,357 –
Loans and advances to banks 25 4,564,943 704,756 3,326,694 344,500 188,993 –Loans and advances
to customers 26 604,073,399 451,093,811 139,956,934 2,798,233 531,304 9,693,117
Insurance receivables 27 627,337 296,317 108,276 – – 222,745
Investment securities 30 447,281,811 417,472,818 15,313,659 546,431 2,827,031 11,121,872
1,441,620,065 1,048,222,948 301,792,763 23,030,970 15,923,411 52,649,973
Deposits from banks 37 105,170,552 17,861,205 79,114,684 4,609,128 2,501,197 1,084,338
Deposits from customers 38 1,201,481,996 957,610,171 195,127,090 10,568,567 9,304,049 28,872,119
Derivative financial instruments 24 35,515 – – 20,041 15,474 –
Debt securities issued 39 54,685,891 – 54,685,891 – – –
Claims payable 42 118,226 118,226 – – – –
Liabilities on investment contracts 43 65,591 65,591 – – – –
Liabilities on insurance contract 44 3,351,234 2,850,013 – – – 501,221
Interest-bearing loans & borrowings 45 40,092,312 5,036,111 35,049,741 405 6,055 –
1,405,001,317 983,541,317 363,977,406 15,198,141 11,826,774 30,457,678
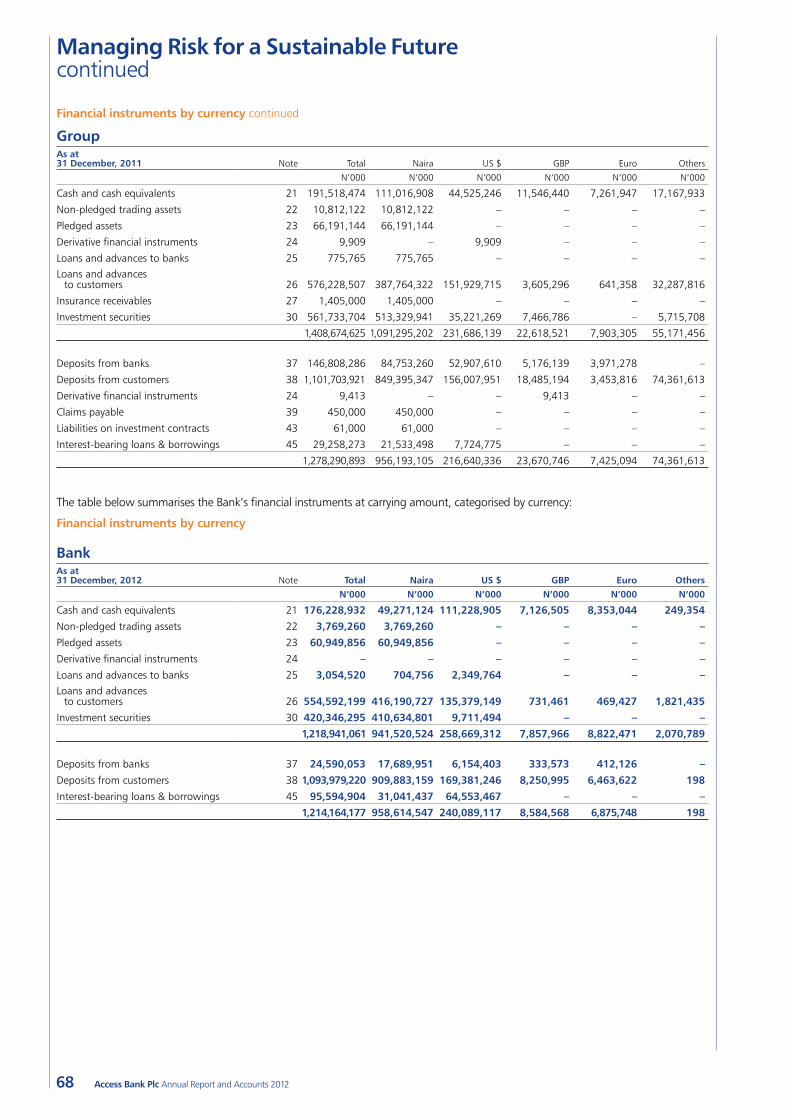
Managing Risk for a Sustainable Future continued
68 Access Bank Plc Annual Report and Accounts 2012
Financial instruments by currency continued
GroupAs at 31 December, 2011 Note Total Naira US $ GBP Euro Others
N’000 N’000 N’000 N’000 N’000 N’000
Cash and cash equivalents 21 191,518,474 111,016,908 44,525,246 11,546,440 7,261,947 17,167,933
Non-pledged trading assets 22 10,812,122 10,812,122 – – – –
Pledged assets 23 66,191,144 66,191,144 – – – –
Derivative financial instruments 24 9,909 – 9,909 – – –
Loans and advances to banks 25 775,765 775,765 – – – –Loans and advances
to customers 26 576,228,507 387,764,322 151,929,715 3,605,296 641,358 32,287,816
Insurance receivables 27 1,405,000 1,405,000 – – – –
Investment securities 30 561,733,704 513,329,941 35,221,269 7,466,786 – 5,715,708
1,408,674,625 1,091,295,202 231,686,139 22,618,521 7,903,305 55,171,456
Deposits from banks 37 146,808,286 84,753,260 52,907,610 5,176,139 3,971,278 –
Deposits from customers 38 1,101,703,921 849,395,347 156,007,951 18,485,194 3,453,816 74,361,613
Derivative financial instruments 24 9,413 – – 9,413 – –
Claims payable 39 450,000 450,000 – – – –
Liabilities on investment contracts 43 61,000 61,000 – – – –
Interest-bearing loans & borrowings 45 29,258,273 21,533,498 7,724,775 – – –
1,278,290,893 956,193,105 216,640,336 23,670,746 7,425,094 74,361,613
The table below summarises the Bank’s financial instruments at carrying amount, categorised by currency:
Financial instruments by currency
BankAs at 31 December, 2012 Note Total Naira US $ GBP Euro Others
N’000 N’000 N’000 N’000 N’000 N’000
Cash and cash equivalents 21 176,228,932 49,271,124 111,228,905 7,126,505 8,353,044 249,354
Non-pledged trading assets 22 3,769,260 3,769,260 – – – –
Pledged assets 23 60,949,856 60,949,856 – – – –
Derivative financial instruments 24 – – – – – –
Loans and advances to banks 25 3,054,520 704,756 2,349,764 – – –Loans and advances
to customers 26 554,592,199 416,190,727 135,379,149 731,461 469,427 1,821,435
Investment securities 30 420,346,295 410,634,801 9,711,494 – – –
1,218,941,061 941,520,524 258,669,312 7,857,966 8,822,471 2,070,789
Deposits from banks 37 24,590,053 17,689,951 6,154,403 333,573 412,126 –
Deposits from customers 38 1,093,979,220 909,883,159 169,381,246 8,250,995 6,463,622 198
Interest-bearing loans & borrowings 45 95,594,904 31,041,437 64,553,467 – – –
1,214,164,177 958,614,547 240,089,117 8,584,568 6,875,748 198
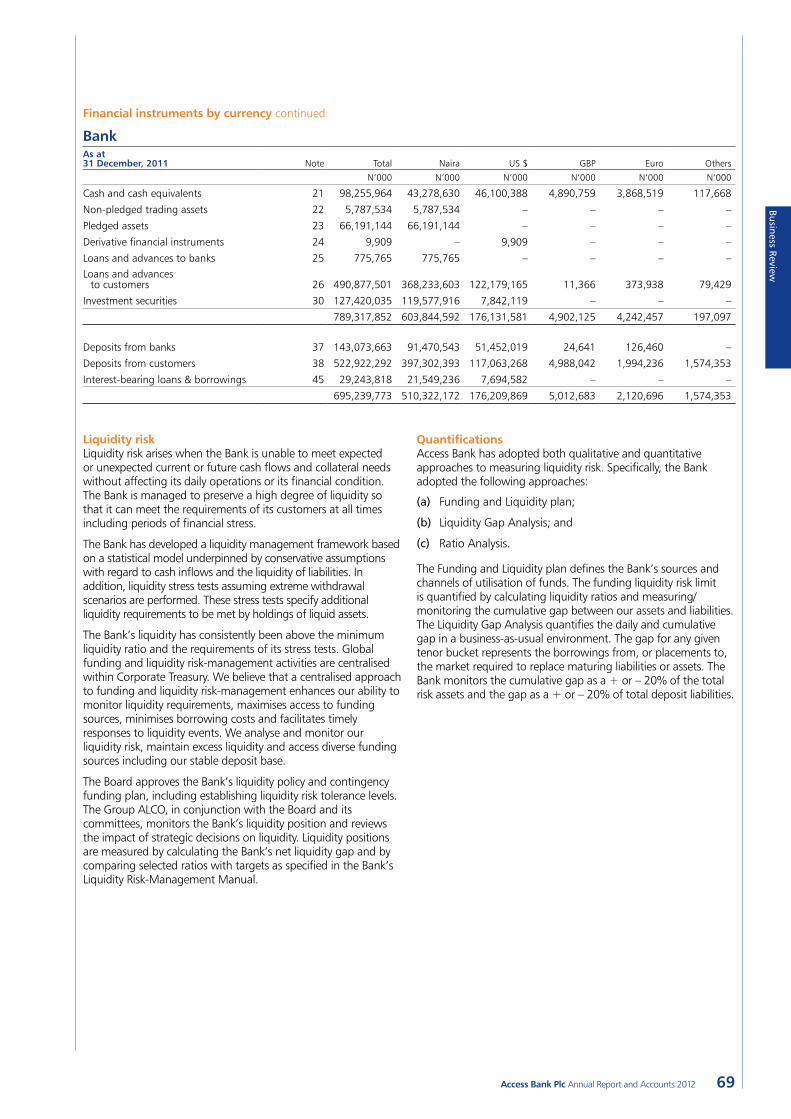
Business Review
69Access Bank Plc Annual Report and Accounts 2012
Financial instruments by currency continued
BankAs at 31 December, 2011 Note Total Naira US $ GBP Euro Others
N’000 N’000 N’000 N’000 N’000 N’000
Cash and cash equivalents 21 98,255,964 43,278,630 46,100,388 4,890,759 3,868,519 117,668
Non-pledged trading assets 22 5,787,534 5,787,534 – – – –
Pledged assets 23 66,191,144 66,191,144 – – – –
Derivative financial instruments 24 9,909 – 9,909 – – –
Loans and advances to banks 25 775,765 775,765 – – – –Loans and advances
to customers 26 490,877,501 368,233,603 122,179,165 11,366 373,938 79,429
Investment securities 30 127,420,035 119,577,916 7,842,119 – – –
789,317,852 603,844,592 176,131,581 4,902,125 4,242,457 197,097
Deposits from banks 37 143,073,663 91,470,543 51,452,019 24,641 126,460 –
Deposits from customers 38 522,922,292 397,302,393 117,063,268 4,988,042 1,994,236 1,574,353
Interest-bearing loans & borrowings 45 29,243,818 21,549,236 7,694,582 – – –
695,239,773 510,322,172 176,209,869 5,012,683 2,120,696 1,574,353
Liquidity riskLiquidity risk arises when the Bank is unable to meet expected or unexpected current or future cash flows and collateral needs without affecting its daily operations or its financial condition. The Bank is managed to preserve a high degree of liquidity so that it can meet the requirements of its customers at all times including periods of financial stress.
The Bank has developed a liquidity management framework based on a statistical model underpinned by conservative assumptions with regard to cash inflows and the liquidity of liabilities. In addition, liquidity stress tests assuming extreme withdrawal scenarios are performed. These stress tests specify additional liquidity requirements to be met by holdings of liquid assets.
The Bank’s liquidity has consistently been above the minimum liquidity ratio and the requirements of its stress tests. Global funding and liquidity risk-management activities are centralised within Corporate Treasury. We believe that a centralised approach to funding and liquidity risk-management enhances our ability to monitor liquidity requirements, maximises access to funding sources, minimises borrowing costs and facilitates timely responses to liquidity events. We analyse and monitor our liquidity risk, maintain excess liquidity and access diverse funding sources including our stable deposit base.
The Board approves the Bank’s liquidity policy and contingency funding plan, including establishing liquidity risk tolerance levels. The Group ALCO, in conjunction with the Board and its committees, monitors the Bank’s liquidity position and reviews the impact of strategic decisions on liquidity. Liquidity positions are measured by calculating the Bank’s net liquidity gap and by comparing selected ratios with targets as specified in the Bank’s Liquidity Risk-Management Manual.
QuantificationsAccess Bank has adopted both qualitative and quantitative approaches to measuring liquidity risk. Specifically, the Bank adopted the following approaches:
(a) Funding and Liquidity plan;
(b) Liquidity Gap Analysis; and
(c) Ratio Analysis.
The Funding and Liquidity plan defines the Bank’s sources and channels of utilisation of funds. The funding liquidity risk limit is quantified by calculating liquidity ratios and measuring/monitoring the cumulative gap between our assets and liabilities. The Liquidity Gap Analysis quantifies the daily and cumulative gap in a business-as-usual environment. The gap for any given tenor bucket represents the borrowings from, or placements to, the market required to replace maturing liabilities or assets. The Bank monitors the cumulative gap as a + or – 20% of the total risk assets and the gap as a + or – 20% of total deposit liabilities.
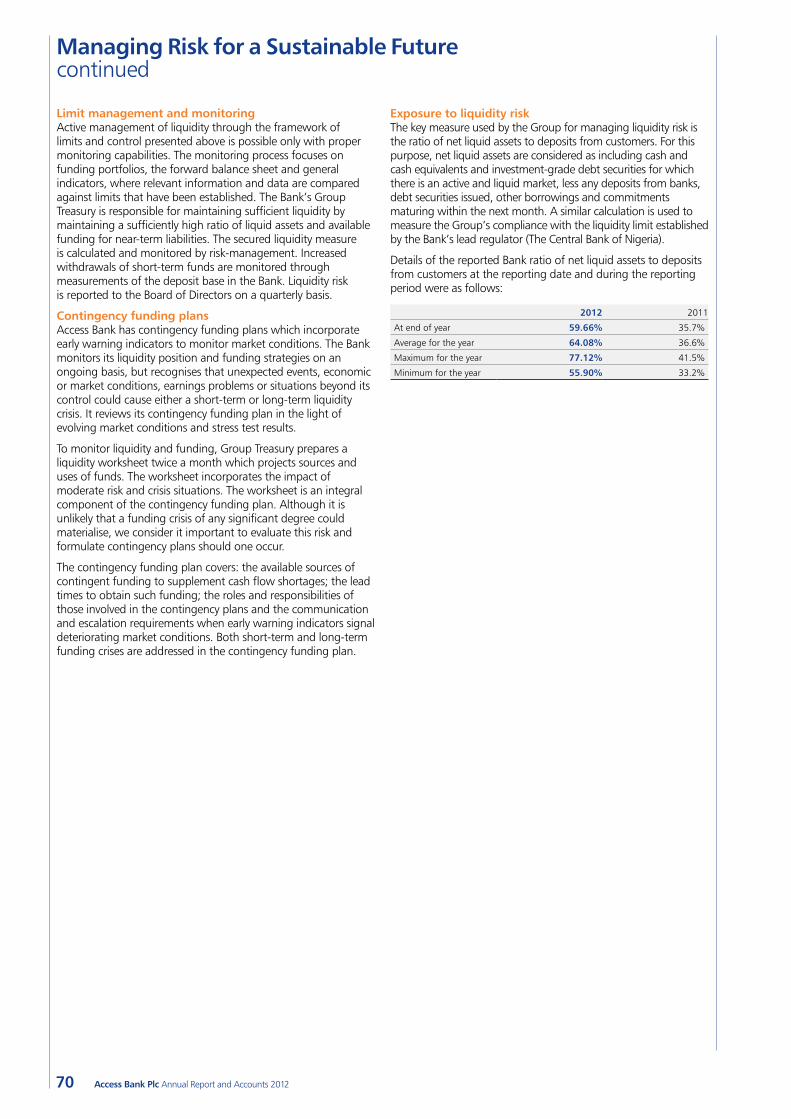
Managing Risk for a Sustainable Future continued
70 Access Bank Plc Annual Report and Accounts 2012
Limit management and monitoringActive management of liquidity through the framework of limits and control presented above is possible only with proper monitoring capabilities. The monitoring process focuses on funding portfolios, the forward balance sheet and general indicators, where relevant information and data are compared against limits that have been established. The Bank’s Group Treasury is responsible for maintaining sufficient liquidity by maintaining a sufficiently high ratio of liquid assets and available funding for near-term liabilities. The secured liquidity measure is calculated and monitored by risk-management. Increased withdrawals of short-term funds are monitored through measurements of the deposit base in the Bank. Liquidity risk is reported to the Board of Directors on a quarterly basis.
Contingency funding plansAccess Bank has contingency funding plans which incorporate early warning indicators to monitor market conditions. The Bank monitors its liquidity position and funding strategies on an ongoing basis, but recognises that unexpected events, economic or market conditions, earnings problems or situations beyond its control could cause either a short-term or long-term liquidity crisis. It reviews its contingency funding plan in the light of evolving market conditions and stress test results.
To monitor liquidity and funding, Group Treasury prepares a liquidity worksheet twice a month which projects sources and uses of funds. The worksheet incorporates the impact of moderate risk and crisis situations. The worksheet is an integral component of the contingency funding plan. Although it is unlikely that a funding crisis of any significant degree could materialise, we consider it important to evaluate this risk and formulate contingency plans should one occur.
The contingency funding plan covers: the available sources of contingent funding to supplement cash flow shortages; the lead times to obtain such funding; the roles and responsibilities of those involved in the contingency plans and the communication and escalation requirements when early warning indicators signal deteriorating market conditions. Both short-term and long-term funding crises are addressed in the contingency funding plan.
Exposure to liquidity riskThe key measure used by the Group for managing liquidity risk is the ratio of net liquid assets to deposits from customers. For this purpose, net liquid assets are considered as including cash and cash equivalents and investment-grade debt securities for which there is an active and liquid market, less any deposits from banks, debt securities issued, other borrowings and commitments maturing within the next month. A similar calculation is used to measure the Group’s compliance with the liquidity limit established by the Bank’s lead regulator (The Central Bank of Nigeria).
Details of the reported Bank ratio of net liquid assets to deposits from customers at the reporting date and during the reporting period were as follows:
2012 2011
At end of year 59.66% 35.7%
Average for the year 64.08% 36.6%
Maximum for the year 77.12% 41.5%
Minimum for the year 55.90% 33.2%
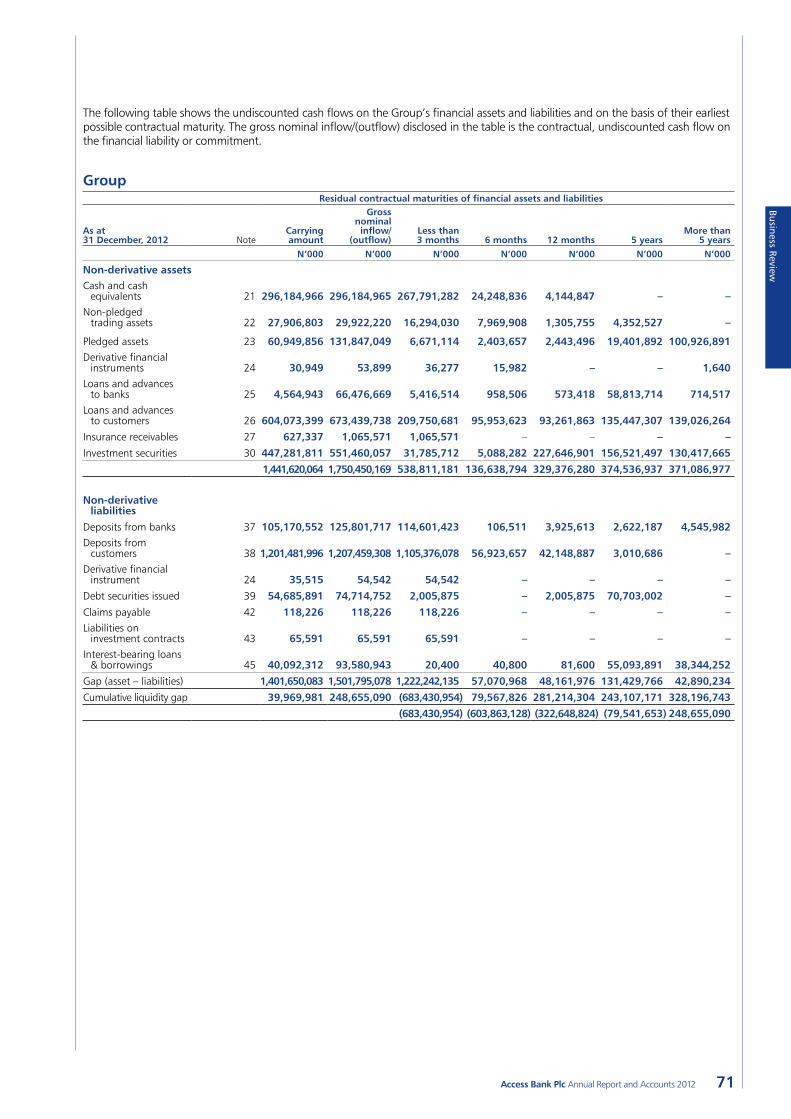
Business Review
71Access Bank Plc Annual Report and Accounts 2012
The following table shows the undiscounted cash flows on the Group’s financial assets and liabilities and on the basis of their earliest possible contractual maturity. The gross nominal inflow/(outflow) disclosed in the table is the contractual, undiscounted cash flow on the financial liability or commitment.
GroupResidual contractual maturities of financial assets and liabilities
As at 31 December, 2012 Note
Carrying amount
Gross nominal inflow/
(outflow) Less than 3 months 6 months 12 months 5 years
More than 5 years
N’000 N’000 N’000 N’000 N’000 N’000 N’000
Non-derivative assets Cash and cash
equivalents 21 296,184,966 296,184,965 267,791,282 24,248,836 4,144,847 – –Non-pledged
trading assets 22 27,906,803 29,922,220 16,294,030 7,969,908 1,305,755 4,352,527 –
Pledged assets 23 60,949,856 131,847,049 6,671,114 2,403,657 2,443,496 19,401,892 100,926,891Derivative financial
instruments 24 30,949 53,899 36,277 15,982 – – 1,640Loans and advances
to banks 25 4,564,943 66,476,669 5,416,514 958,506 573,418 58,813,714 714,517Loans and advances
to customers 26 604,073,399 673,439,738 209,750,681 95,953,623 93,261,863 135,447,307 139,026,264
Insurance receivables 27 627,337 1,065,571 1,065,571 – – – –
Investment securities 30 447,281,811 551,460,057 31,785,712 5,088,282 227,646,901 156,521,497 130,417,665
1,441,620,064 1,750,450,169 538,811,181 136,638,794 329,376,280 374,536,937 371,086,977
Non-derivative liabilities
Deposits from banks 37 105,170,552 125,801,717 114,601,423 106,511 3,925,613 2,622,187 4,545,982Deposits from
customers 38 1,201,481,996 1,207,459,308 1,105,376,078 56,923,657 42,148,887 3,010,686 –Derivative financial
instrument 24 35,515 54,542 54,542 – – – –
Debt securities issued 39 54,685,891 74,714,752 2,005,875 – 2,005,875 70,703,002 –
Claims payable 42 118,226 118,226 118,226 – – – –Liabilities on
investment contracts 43 65,591 65,591 65,591 – – – –Interest-bearing loans
& borrowings 45 40,092,312 93,580,943 20,400 40,800 81,600 55,093,891 38,344,252
Gap (asset – liabilities) 1,401,650,083 1,501,795,078 1,222,242,135 57,070,968 48,161,976 131,429,766 42,890,234
Cumulative liquidity gap 39,969,981 248,655,090 (683,430,954) 79,567,826 281,214,304 243,107,171 328,196,743
(683,430,954) (603,863,128) (322,648,824) (79,541,653) 248,655,090
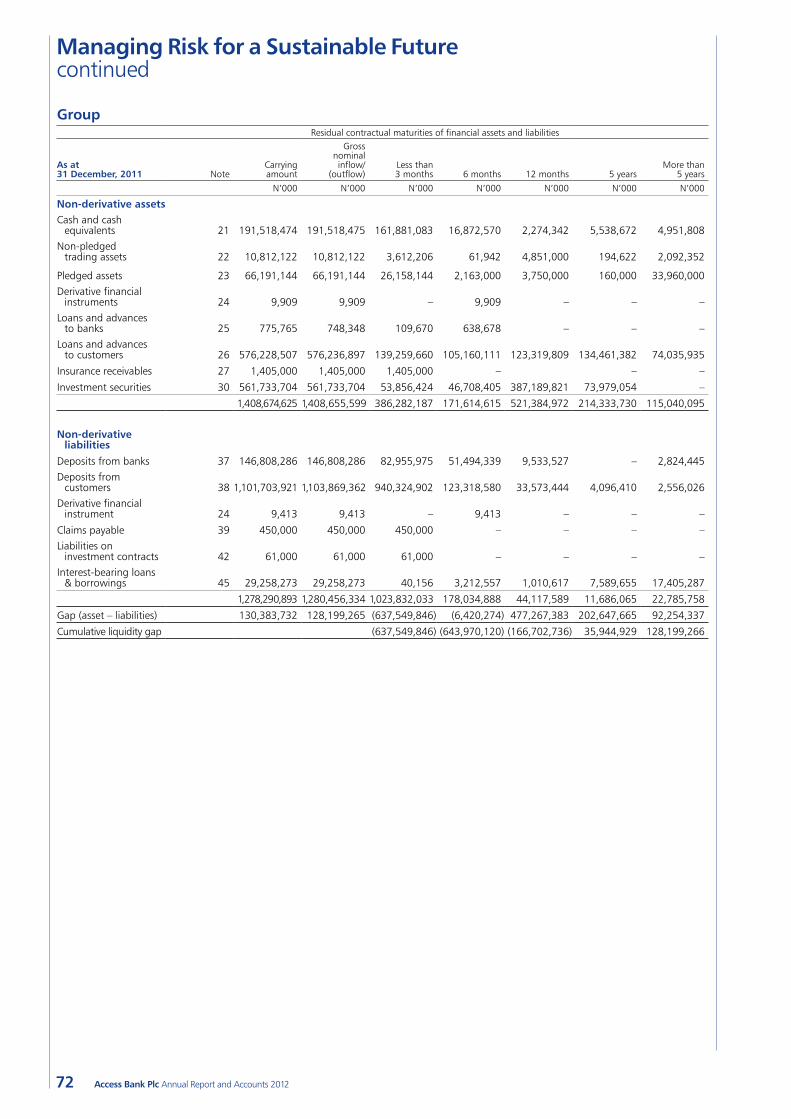
Managing Risk for a Sustainable Future continued
72 Access Bank Plc Annual Report and Accounts 2012
GroupResidual contractual maturities of financial assets and liabilities
As at 31 December, 2011 Note
Carrying amount
Gross nominal inflow/
(outflow) Less than 3 months 6 months 12 months 5 years
More than 5 years
N’000 N’000 N’000 N’000 N’000 N’000 N’000
Non-derivative assets Cash and cash
equivalents 21 191,518,474 191,518,475 161,881,083 16,872,570 2,274,342 5,538,672 4,951,808Non-pledged
trading assets 22 10,812,122 10,812,122 3,612,206 61,942 4,851,000 194,622 2,092,352
Pledged assets 23 66,191,144 66,191,144 26,158,144 2,163,000 3,750,000 160,000 33,960,000Derivative financial
instruments 24 9,909 9,909 – 9,909 – – –Loans and advances
to banks 25 775,765 748,348 109,670 638,678 – – –Loans and advances
to customers 26 576,228,507 576,236,897 139,259,660 105,160,111 123,319,809 134,461,382 74,035,935
Insurance receivables 27 1,405,000 1,405,000 1,405,000 – – –
Investment securities 30 561,733,704 561,733,704 53,856,424 46,708,405 387,189,821 73,979,054 –
1,408,674,625 1,408,655,599 386,282,187 171,614,615 521,384,972 214,333,730 115,040,095
Non-derivative liabilities
Deposits from banks 37 146,808,286 146,808,286 82,955,975 51,494,339 9,533,527 – 2,824,445 Deposits from
customers 38 1,101,703,921 1,103,869,362 940,324,902 123,318,580 33,573,444 4,096,410 2,556,026Derivative financial
instrument 24 9,413 9,413 – 9,413 – – –
Claims payable 39 450,000 450,000 450,000 – – – –Liabilities on
investment contracts 42 61,000 61,000 61,000 – – – –Interest-bearing loans
& borrowings 45 29,258,273 29,258,273 40,156 3,212,557 1,010,617 7,589,655 17,405,287
1,278,290,893 1,280,456,334 1,023,832,033 178,034,888 44,117,589 11,686,065 22,785,758
Gap (asset – liabilities) 130,383,732 128,199,265 (637,549,846) (6,420,274) 477,267,383 202,647,665 92,254,337
Cumulative liquidity gap (637,549,846) (643,970,120) (166,702,736) 35,944,929 128,199,266
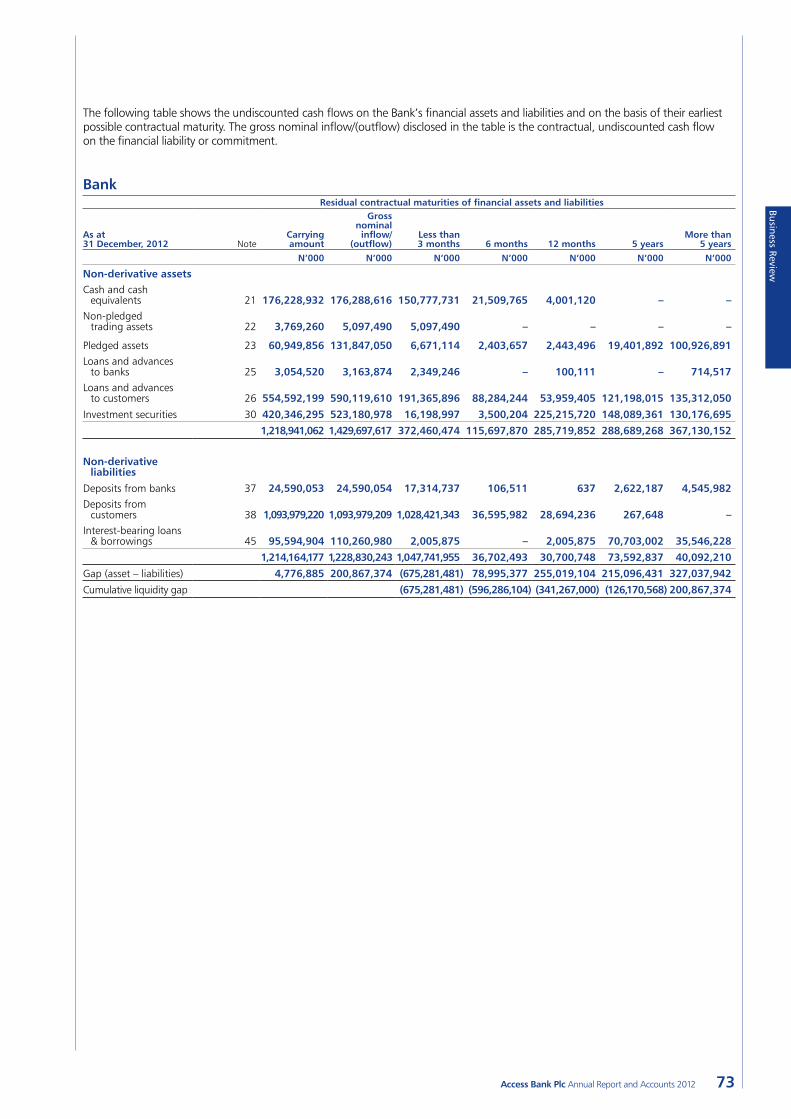
Business Review
73Access Bank Plc Annual Report and Accounts 2012
The following table shows the undiscounted cash flows on the Bank’s financial assets and liabilities and on the basis of their earliest possible contractual maturity. The gross nominal inflow/(outflow) disclosed in the table is the contractual, undiscounted cash flow on the financial liability or commitment.
BankResidual contractual maturities of financial assets and liabilities
As at 31 December, 2012 Note
Carrying amount
Gross nominal inflow/
(outflow) Less than 3 months 6 months 12 months 5 years
More than 5 years
N’000 N’000 N’000 N’000 N’000 N’000 N’000
Non-derivative assets Cash and cash
equivalents 21 176,228,932 176,288,616 150,777,731 21,509,765 4,001,120 – –Non-pledged
trading assets 22 3,769,260 5,097,490 5,097,490 – – – –
Pledged assets 23 60,949,856 131,847,050 6,671,114 2,403,657 2,443,496 19,401,892 100,926,891 Loans and advances
to banks 25 3,054,520 3,163,874 2,349,246 – 100,111 – 714,517Loans and advances
to customers 26 554,592,199 590,119,610 191,365,896 88,284,244 53,959,405 121,198,015 135,312,050
Investment securities 30 420,346,295 523,180,978 16,198,997 3,500,204 225,215,720 148,089,361 130,176,695
1,218,941,062 1,429,697,617 372,460,474 115,697,870 285,719,852 288,689,268 367,130,152
Non-derivative liabilities
Deposits from banks 37 24,590,053 24,590,054 17,314,737 106,511 637 2,622,187 4,545,982Deposits from
customers 38 1,093,979,220 1,093,979,209 1,028,421,343 36,595,982 28,694,236 267,648 –Interest-bearing loans
& borrowings 45 95,594,904 110,260,980 2,005,875 – 2,005,875 70,703,002 35,546,228
1,214,164,177 1,228,830,243 1,047,741,955 36,702,493 30,700,748 73,592,837 40,092,210
Gap (asset – liabilities) 4,776,885 200,867,374 (675,281,481) 78,995,377 255,019,104 215,096,431 327,037,942
Cumulative liquidity gap (675,281,481) (596,286,104) (341,267,000) (126,170,568) 200,867,374
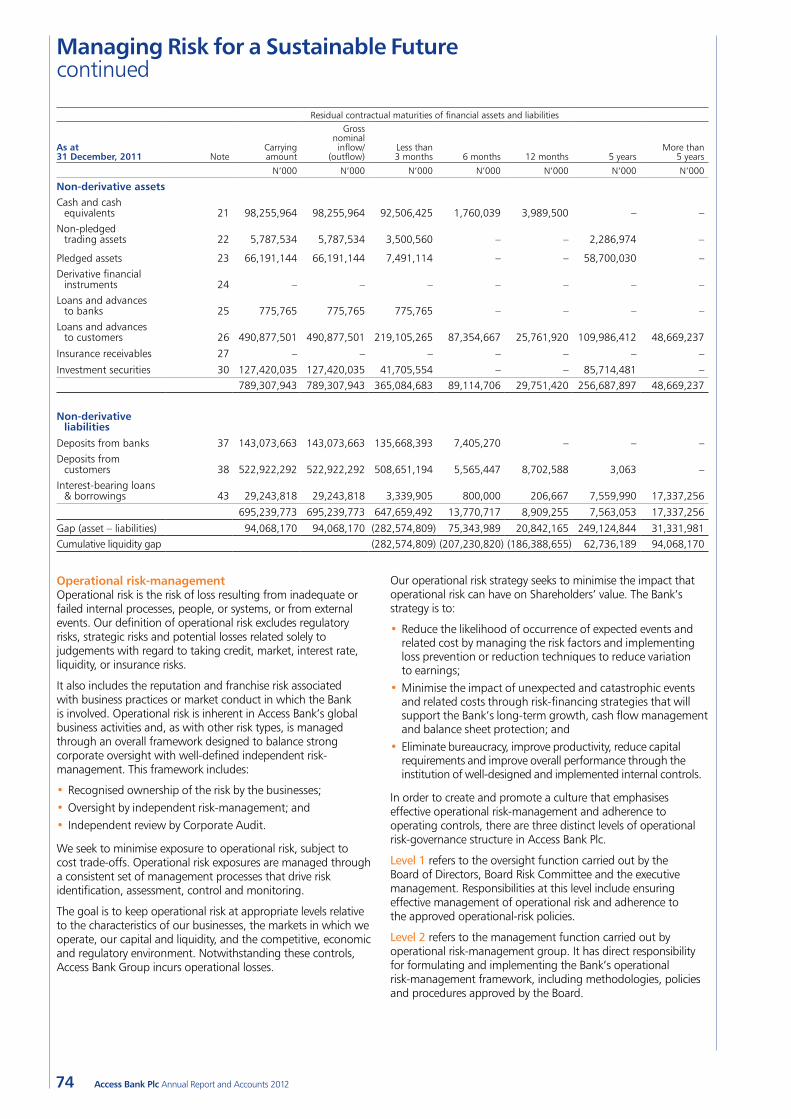
Managing Risk for a Sustainable Future continued
74 Access Bank Plc Annual Report and Accounts 2012
Residual contractual maturities of financial assets and liabilities
As at 31 December, 2011 Note
Carrying amount
Gross nominal inflow/
(outflow) Less than 3 months 6 months 12 months 5 years
More than 5 years
N’000 N’000 N’000 N’000 N’000 N’000 N’000
Non-derivative assets Cash and cash
equivalents 21 98,255,964 98,255,964 92,506,425 1,760,039 3,989,500 – –Non-pledged
trading assets 22 5,787,534 5,787,534 3,500,560 – – 2,286,974 –
Pledged assets 23 66,191,144 66,191,144 7,491,114 – – 58,700,030 –Derivative financial
instruments 24 – – – – – – –Loans and advances
to banks 25 775,765 775,765 775,765 – – – –Loans and advances
to customers 26 490,877,501 490,877,501 219,105,265 87,354,667 25,761,920 109,986,412 48,669,237
Insurance receivables 27 – – – – – – –
Investment securities 30 127,420,035 127,420,035 41,705,554 – – 85,714,481 –789,307,943 789,307,943 365,084,683 89,114,706 29,751,420 256,687,897 48,669,237
Non-derivative liabilities
Deposits from banks 37 143,073,663 143,073,663 135,668,393 7,405,270 – – –Deposits from
customers 38 522,922,292 522,922,292 508,651,194 5,565,447 8,702,588 3,063 –Interest-bearing loans
& borrowings 43 29,243,818 29,243,818 3,339,905 800,000 206,667 7,559,990 17,337,256
695,239,773 695,239,773 647,659,492 13,770,717 8,909,255 7,563,053 17,337,256
Gap (asset – liabilities) 94,068,170 94,068,170 (282,574,809) 75,343,989 20,842,165 249,124,844 31,331,981Cumulative liquidity gap (282,574,809) (207,230,820) (186,388,655) 62,736,189 94,068,170
Operational risk-managementOperational risk is the risk of loss resulting from inadequate or failed internal processes, people, or systems, or from external events. Our definition of operational risk excludes regulatory risks, strategic risks and potential losses related solely to judgements with regard to taking credit, market, interest rate, liquidity, or insurance risks.
It also includes the reputation and franchise risk associated with business practices or market conduct in which the Bank is involved. Operational risk is inherent in Access Bank’s global business activities and, as with other risk types, is managed through an overall framework designed to balance strong corporate oversight with well-defined independent risk-management. This framework includes:
•Recognised ownership of the risk by the businesses;•Oversight by independent risk-management; and• Independent review by Corporate Audit.
We seek to minimise exposure to operational risk, subject to cost trade-offs. Operational risk exposures are managed through a consistent set of management processes that drive risk identification, assessment, control and monitoring.
The goal is to keep operational risk at appropriate levels relative to the characteristics of our businesses, the markets in which we operate, our capital and liquidity, and the competitive, economic and regulatory environment. Notwithstanding these controls, Access Bank Group incurs operational losses.
Our operational risk strategy seeks to minimise the impact that operational risk can have on Shareholders’ value. The Bank’s strategy is to:
•Reduce the likelihood of occurrence of expected events and related cost by managing the risk factors and implementing loss prevention or reduction techniques to reduce variation to earnings;
•Minimise the impact of unexpected and catastrophic events and related costs through risk-financing strategies that will support the Bank’s long-term growth, cash flow management and balance sheet protection; and
•Eliminate bureaucracy, improve productivity, reduce capital requirements and improve overall performance through the institution of well-designed and implemented internal controls.
In order to create and promote a culture that emphasises effective operational risk-management and adherence to operating controls, there are three distinct levels of operational risk-governance structure in Access Bank Plc.
Level 1 refers to the oversight function carried out by the Board of Directors, Board Risk Committee and the executive management. Responsibilities at this level include ensuring effective management of operational risk and adherence to the approved operational-risk policies.
Level 2 refers to the management function carried out by operational risk-management group. It has direct responsibility for formulating and implementing the Bank’s operational risk-management framework, including methodologies, policies and procedures approved by the Board.
Business Review
75Access Bank Plc Annual Report and Accounts 2012
Level 3 refers to the operational function carried out by all business units and support functions in the Bank. These units/functions are fully responsible and accountable for the management of operational risk in their units. They work in liaison with operational risk-management to define and review controls to mitigate identified risks. Internal audit provides independent assessment and evaluation of the Bank’s operational risk-management framework. This periodic confirmation of the existence and utilisation of controls, in compliance with approved policies and procedures, provides assurance as to the effectiveness of the Bank’s operational risk-management framework. Some of the tools being used to assess, measure and monitor operational risks in the Bank include: a loss database of operational risk events; an effective risk and control self-assessment process that helps to analyse business activities and identify operational risks that could affect the achievement of business objectives; and key risk indicators that are used to monitor operational risks on an ongoing basis.
The Group’s operational risk frameworkThe Group’s current operational risk framework was implemented in 2007 to meet internal and regulatory requirements. There has been significant investment in the implementation of improved measurement and management approaches for operational risk to strengthen control, improve customer service, improve process efficiencies and minimise operating losses. The Group recognises the fact that it is neither cost-effective, nor possible, to attempt to eliminate all operational risks. Events of small significance are thus expected to occur and are accepted as inevitable with relevant budgeting for these losses being exercised where appropriate. Events of material significance are limited and the Group seeks to reduce the risk from these extreme events in a framework consistent with its agreed risk appetite. Processes are in place to monitor management and future mitigation of such events.
The role of the independent Operational Risk Department is to establish, implement and maintain the operational risk framework for the modelling and managing of the Group’s operational risk, while reinforcing and enabling operational risk-management culture throughout the Group. The aim is to integrate, based on international norms and best practices, all operational risk activities and to compile a reliable operational risk profile contributing to the Group’s risk-reward profile. The key advantage of the current framework is the financial quantification and modelling of operational risks. This functionality has significantly improved the Group’s operational risk measurement and management capabilities.
Management and control responsibilitiesThe first line of governance for managing operational risk rests with internal business units. Operational risk-management forms part of the day-to-day responsibilities of all business unit management teams. Business unit staff report any identified breakdowns in control and any risk events that may result in financial loss and/or reputation damage. Among others, business unit management teams are responsible for ensuring that processes for identifying and addressing ineffective controls and mitigation of risk events are implemented and executed. Operational risk teams form the secondary line of governance by ensuring that processes to identify weaknesses are effective and that identified weaknesses are acted upon. The Group operational risk profile is presented to the Board quarterly. Control effectiveness is monitored by the Enterprise Risk-Management Committee and by the Board; and the multi-layered system of defences ensures proactive operational risk-management.
Measuring and managing operational riskThe Group recognises the significance of operational risk and is committed to enhancing its measurement and management. Within the Group’s operational risk framework, qualitative and quantitative methodologies and tools are applied (Group-wide) to identify and assess operational risks and to provide management information for determining appropriate mitigation measures.
Risk event data collection and reportingA standard process is used Group-wide for the recognition, capture, assessment, analysis and reporting of risk events. This process is used to help identify where process and control requirements are needed to reduce the recurrence of risk events. Risk events are loaded onto a central database and reported monthly to the ERMC. The Group also uses a database of external public risk events and is part of a consortium of international banks that shares loss data information anonymously to assist in risk identification, assessment, modelling and benchmarking.
Risk and control self assessments In order to proactively identify and actively mitigate risks, the operational risk framework utilises Risk and Control Self Assessments (RCSAs). RCSAs are used at a granular level to identify relevant material risks and key controls mitigating these risks. The risks and controls are assessed on a quarterly basis and relevant action plans are put in place to treat, tolerate, terminate or transfer the risks, taking into account the relevant business risk appetites. The RCSA programme is extensive and covers the entire Group. The Internal Audit team further tests the effectiveness of the RCSAs within the normal course of auditing and relevant metrics are monitored and actioned where relevant.
Key risk indicators A comprehensive set of Key Risk Indicators (KRIs) are in place across the Group, with relevant and agreed thresholds set by the business. KRIs are monitored on a Group level, as well as business unit level, based on significance. Threshold breaches are managed in accordance with an agreed process across the Group.
ReportingBusiness units are required to report on both a regular and an event-driven basis. The reports include a profile of the key risks to their business objectives, an RCSA and KRI results, and operational risk events. Risk reports are presented to executive management and risk committees.
Allocating capital to business unitsAn allocation methodology is applied for allocating capital to business units (for instance, an allocation from Access Bank to the Commercial Banking Division, the Retail Banking Division, or the Institutional Banking Division). For each business unit, the allocation takes into consideration not only the size of the business unit, but also measures of the business unit’s control environment. This translates into a risk-sensitive allocation.
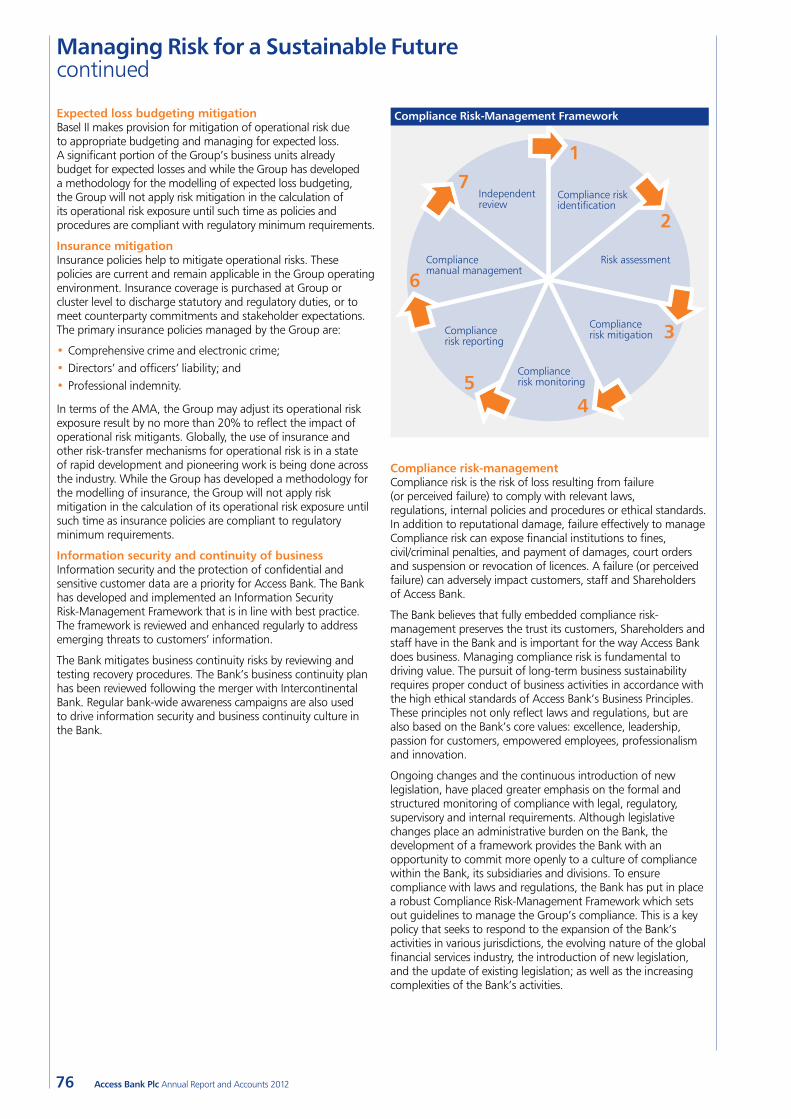
Managing Risk for a Sustainable Future continued
76 Access Bank Plc Annual Report and Accounts 2012
Expected loss budgeting mitigationBasel II makes provision for mitigation of operational risk due to appropriate budgeting and managing for expected loss. A significant portion of the Group’s business units already budget for expected losses and while the Group has developed a methodology for the modelling of expected loss budgeting, the Group will not apply risk mitigation in the calculation of its operational risk exposure until such time as policies and procedures are compliant with regulatory minimum requirements.
Insurance mitigationInsurance policies help to mitigate operational risks. These policies are current and remain applicable in the Group operating environment. Insurance coverage is purchased at Group or cluster level to discharge statutory and regulatory duties, or to meet counterparty commitments and stakeholder expectations. The primary insurance policies managed by the Group are:
•Comprehensive crime and electronic crime;•Directors’ and officers’ liability; and•Professional indemnity.
In terms of the AMA, the Group may adjust its operational risk exposure result by no more than 20% to reflect the impact of operational risk mitigants. Globally, the use of insurance and other risk-transfer mechanisms for operational risk is in a state of rapid development and pioneering work is being done across the industry. While the Group has developed a methodology for the modelling of insurance, the Group will not apply risk mitigation in the calculation of its operational risk exposure until such time as insurance policies are compliant to regulatory minimum requirements.
Information security and continuity of businessInformation security and the protection of confidential and sensitive customer data are a priority for Access Bank. The Bank has developed and implemented an Information Security Risk-Management Framework that is in line with best practice. The framework is reviewed and enhanced regularly to address emerging threats to customers’ information.
The Bank mitigates business continuity risks by reviewing and testing recovery procedures. The Bank’s business continuity plan has been reviewed following the merger with Intercontinental Bank. Regular bank-wide awareness campaigns are also used to drive information security and business continuity culture in the Bank.
Independentreview
Compliance riskidentification
Risk assessment
Compliance risk mitigation
Compliance risk monitoring
Compliance risk reporting
Compliance manual management
1
2
3
45
6
7
Compliance Risk-Management Framework
Compliance risk-managementCompliance risk is the risk of loss resulting from failure (or perceived failure) to comply with relevant laws, regulations, internal policies and procedures or ethical standards. In addition to reputational damage, failure effectively to manage Compliance risk can expose financial institutions to fines, civil/criminal penalties, and payment of damages, court orders and suspension or revocation of licences. A failure (or perceived failure) can adversely impact customers, staff and Shareholders of Access Bank.
The Bank believes that fully embedded compliance risk-management preserves the trust its customers, Shareholders and staff have in the Bank and is important for the way Access Bank does business. Managing compliance risk is fundamental to driving value. The pursuit of long-term business sustainability requires proper conduct of business activities in accordance with the high ethical standards of Access Bank’s Business Principles. These principles not only reflect laws and regulations, but are also based on the Bank’s core values: excellence, leadership, passion for customers, empowered employees, professionalism and innovation.
Ongoing changes and the continuous introduction of new legislation, have placed greater emphasis on the formal and structured monitoring of compliance with legal, regulatory, supervisory and internal requirements. Although legislative changes place an administrative burden on the Bank, the development of a framework provides the Bank with an opportunity to commit more openly to a culture of compliance within the Bank, its subsidiaries and divisions. To ensure compliance with laws and regulations, the Bank has put in place a robust Compliance Risk-Management Framework which sets out guidelines to manage the Group’s compliance. This is a key policy that seeks to respond to the expansion of the Bank’s activities in various jurisdictions, the evolving nature of the global financial services industry, the introduction of new legislation, and the update of existing legislation; as well as the increasing complexities of the Bank’s activities.
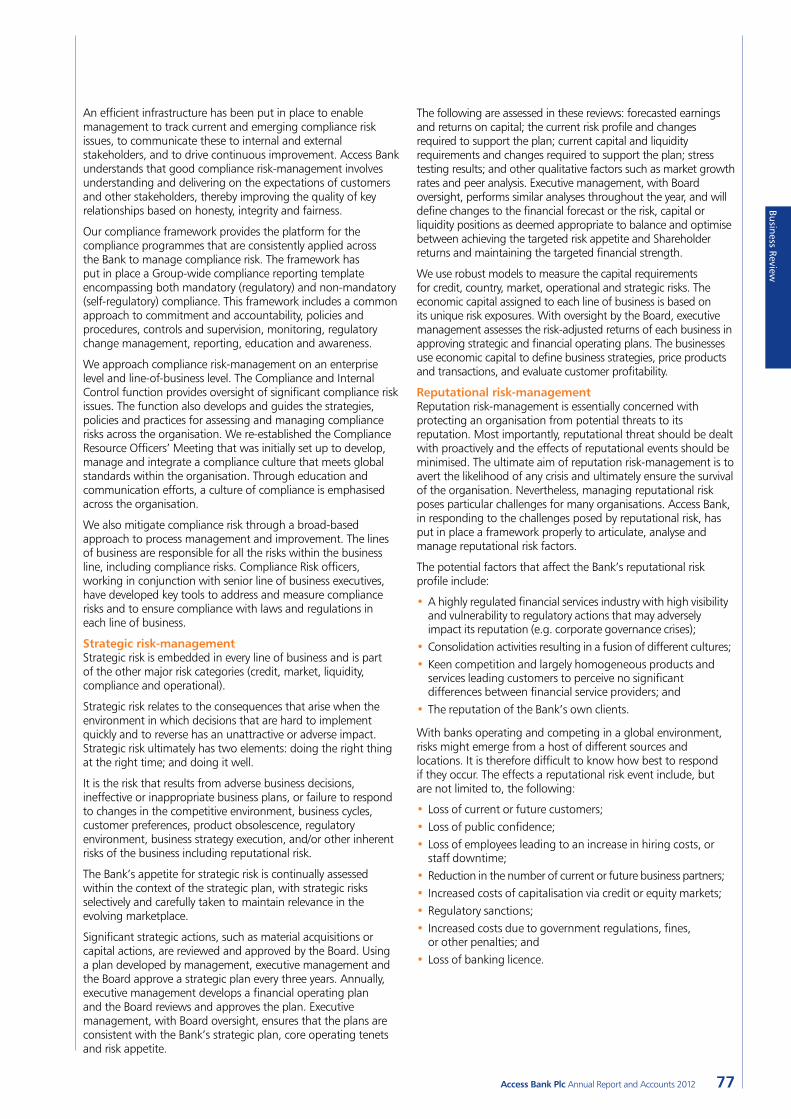
Business Review
77Access Bank Plc Annual Report and Accounts 2012
An efficient infrastructure has been put in place to enable management to track current and emerging compliance risk issues, to communicate these to internal and external stakeholders, and to drive continuous improvement. Access Bank understands that good compliance risk-management involves understanding and delivering on the expectations of customers and other stakeholders, thereby improving the quality of key relationships based on honesty, integrity and fairness.
Our compliance framework provides the platform for the compliance programmes that are consistently applied across the Bank to manage compliance risk. The framework has put in place a Group-wide compliance reporting template encompassing both mandatory (regulatory) and non-mandatory (self-regulatory) compliance. This framework includes a common approach to commitment and accountability, policies and procedures, controls and supervision, monitoring, regulatory change management, reporting, education and awareness.
We approach compliance risk-management on an enterprise level and line-of-business level. The Compliance and Internal Control function provides oversight of significant compliance risk issues. The function also develops and guides the strategies, policies and practices for assessing and managing compliance risks across the organisation. We re-established the Compliance Resource Officers’ Meeting that was initially set up to develop, manage and integrate a compliance culture that meets global standards within the organisation. Through education and communication efforts, a culture of compliance is emphasised across the organisation.
We also mitigate compliance risk through a broad-based approach to process management and improvement. The lines of business are responsible for all the risks within the business line, including compliance risks. Compliance Risk officers, working in conjunction with senior line of business executives, have developed key tools to address and measure compliance risks and to ensure compliance with laws and regulations in each line of business.
Strategic risk-managementStrategic risk is embedded in every line of business and is part of the other major risk categories (credit, market, liquidity, compliance and operational).
Strategic risk relates to the consequences that arise when the environment in which decisions that are hard to implement quickly and to reverse has an unattractive or adverse impact. Strategic risk ultimately has two elements: doing the right thing at the right time; and doing it well.
It is the risk that results from adverse business decisions, ineffective or inappropriate business plans, or failure to respond to changes in the competitive environment, business cycles, customer preferences, product obsolescence, regulatory environment, business strategy execution, and/or other inherent risks of the business including reputational risk.
The Bank’s appetite for strategic risk is continually assessed within the context of the strategic plan, with strategic risks selectively and carefully taken to maintain relevance in the evolving marketplace.
Significant strategic actions, such as material acquisitions or capital actions, are reviewed and approved by the Board. Using a plan developed by management, executive management and the Board approve a strategic plan every three years. Annually, executive management develops a financial operating plan and the Board reviews and approves the plan. Executive management, with Board oversight, ensures that the plans are consistent with the Bank’s strategic plan, core operating tenets and risk appetite.
The following are assessed in these reviews: forecasted earnings and returns on capital; the current risk profile and changes required to support the plan; current capital and liquidity requirements and changes required to support the plan; stress testing results; and other qualitative factors such as market growth rates and peer analysis. Executive management, with Board oversight, performs similar analyses throughout the year, and will define changes to the financial forecast or the risk, capital or liquidity positions as deemed appropriate to balance and optimise between achieving the targeted risk appetite and Shareholder returns and maintaining the targeted financial strength.
We use robust models to measure the capital requirements for credit, country, market, operational and strategic risks. The economic capital assigned to each line of business is based on its unique risk exposures. With oversight by the Board, executive management assesses the risk-adjusted returns of each business in approving strategic and financial operating plans. The businesses use economic capital to define business strategies, price products and transactions, and evaluate customer profitability.
Reputational risk-managementReputation risk-management is essentially concerned with protecting an organisation from potential threats to its reputation. Most importantly, reputational threat should be dealt with proactively and the effects of reputational events should be minimised. The ultimate aim of reputation risk-management is to avert the likelihood of any crisis and ultimately ensure the survival of the organisation. Nevertheless, managing reputational risk poses particular challenges for many organisations. Access Bank, in responding to the challenges posed by reputational risk, has put in place a framework properly to articulate, analyse and manage reputational risk factors.
The potential factors that affect the Bank’s reputational risk profile include:
•A highly regulated financial services industry with high visibility and vulnerability to regulatory actions that may adversely impact its reputation (e.g. corporate governance crises);
•Consolidation activities resulting in a fusion of different cultures; •Keen competition and largely homogeneous products and
services leading customers to perceive no significant differences between financial service providers; and
•The reputation of the Bank’s own clients.
With banks operating and competing in a global environment, risks might emerge from a host of different sources and locations. It is therefore difficult to know how best to respond if they occur. The effects a reputational risk event include, but are not limited to, the following:
•Loss of current or future customers;•Loss of public confidence;•Loss of employees leading to an increase in hiring costs, or
staff downtime;•Reduction in the number of current or future business partners;• Increased costs of capitalisation via credit or equity markets;•Regulatory sanctions;• Increased costs due to government regulations, fines,
or other penalties; and•Loss of banking licence.
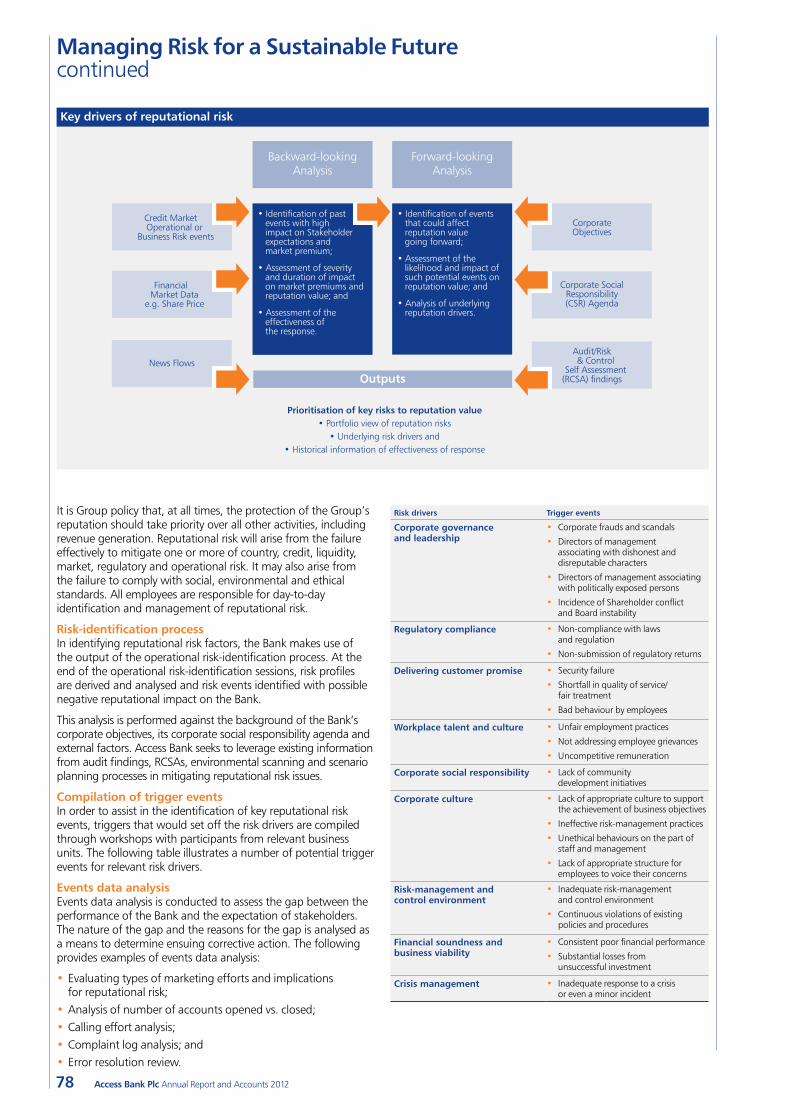
Managing Risk for a Sustainable Future continued
78 Access Bank Plc Annual Report and Accounts 2012
It is Group policy that, at all times, the protection of the Group’s reputation should take priority over all other activities, including revenue generation. Reputational risk will arise from the failure effectively to mitigate one or more of country, credit, liquidity, market, regulatory and operational risk. It may also arise from the failure to comply with social, environmental and ethical standards. All employees are responsible for day-to-day identification and management of reputational risk.
Risk-identification processIn identifying reputational risk factors, the Bank makes use of the output of the operational risk-identification process. At the end of the operational risk-identification sessions, risk profiles are derived and analysed and risk events identified with possible negative reputational impact on the Bank.
This analysis is performed against the background of the Bank’s corporate objectives, its corporate social responsibility agenda and external factors. Access Bank seeks to leverage existing information from audit findings, RCSAs, environmental scanning and scenario planning processes in mitigating reputational risk issues.
Compilation of trigger eventsIn order to assist in the identification of key reputational risk events, triggers that would set off the risk drivers are compiled through workshops with participants from relevant business units. The following table illustrates a number of potential trigger events for relevant risk drivers.
Events data analysisEvents data analysis is conducted to assess the gap between the performance of the Bank and the expectation of stakeholders. The nature of the gap and the reasons for the gap is analysed as a means to determine ensuing corrective action. The following provides examples of events data analysis:
•Evaluating types of marketing efforts and implications for reputational risk;
•Analysis of number of accounts opened vs. closed;•Calling effort analysis;•Complaint log analysis; and•Error resolution review.
Risk drivers Trigger events
Corporate governance and leadership
• Corporate frauds and scandals
• Directors of management associating with dishonest and disreputable characters
• Directors of management associating with politically exposed persons
• Incidence of Shareholder conflict and Board instability
Regulatory compliance • Non-compliance with laws and regulation
• Non-submission of regulatory returns
Delivering customer promise • Security failure
• Shortfall in quality of service/ fair treatment
• Bad behaviour by employees
Workplace talent and culture • Unfair employment practices
• Not addressing employee grievances
• Uncompetitive remuneration
Corporate social responsibility • Lack of community development initiatives
Corporate culture • Lack of appropriate culture to support the achievement of business objectives
• Ineffective risk-management practices
• Unethical behaviours on the part of staff and management
• Lack of appropriate structure for employees to voice their concerns
Risk-management and control environment
• Inadequate risk-management and control environment
• Continuous violations of existing policies and procedures
Financial soundness and business viability
• Consistent poor financial performance
• Substantial losses from unsuccessful investment
Crisis management • Inadequate response to a crisis or even a minor incident
• Identification of past events with high impact on Stakeholder expectations and market premium;
• Assessment of severity and duration of impact on market premiums and reputation value; and
• Assessment of the effectiveness of the response.
Prioritisation of key risks to reputation value• Portfolio view of reputation risks
• Underlying risk drivers and• Historical information of effectiveness of response
Credit Market Operational or
Business Risk events
Financial Market Data
e.g. Share Price
News Flows
Outputs
CorporateObjectives
Corporate SocialResponsibility (CSR) Agenda
Audit/Risk & Control
Self Assessment(RCSA) findings
• Identification of events that could affect reputation value going forward;
• Assessment of the likelihood and impact of such potential events on reputation value; and
• Analysis of underlying reputation drivers.
Backward-lookingAnalysis
Forward-lookingAnalysis
Key drivers of reputational risk
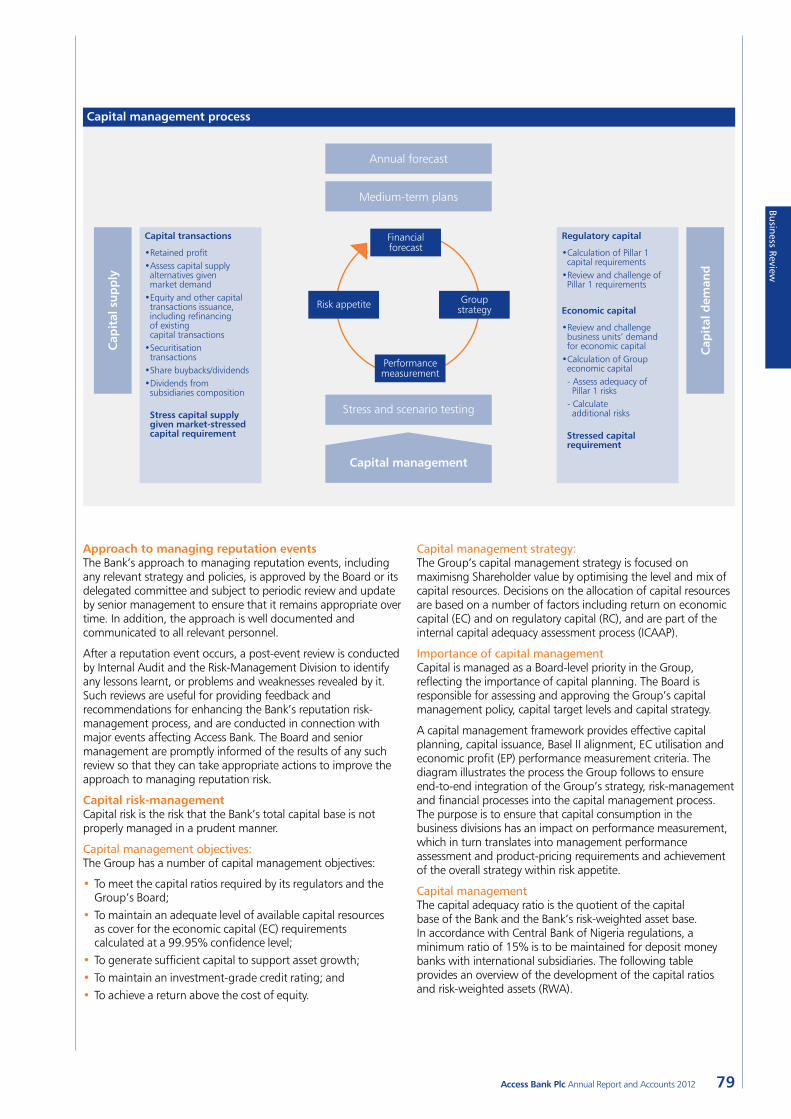
Business Review
79Access Bank Plc Annual Report and Accounts 2012
Approach to managing reputation eventsThe Bank’s approach to managing reputation events, including any relevant strategy and policies, is approved by the Board or its delegated committee and subject to periodic review and update by senior management to ensure that it remains appropriate over time. In addition, the approach is well documented and communicated to all relevant personnel.
After a reputation event occurs, a post-event review is conducted by Internal Audit and the Risk-Management Division to identify any lessons learnt, or problems and weaknesses revealed by it. Such reviews are useful for providing feedback and recommendations for enhancing the Bank’s reputation risk-management process, and are conducted in connection with major events affecting Access Bank. The Board and senior management are promptly informed of the results of any such review so that they can take appropriate actions to improve the approach to managing reputation risk.
Capital risk-managementCapital risk is the risk that the Bank’s total capital base is not properly managed in a prudent manner.
Capital management objectives:The Group has a number of capital management objectives:
•To meet the capital ratios required by its regulators and the Group’s Board;
•To maintain an adequate level of available capital resources as cover for the economic capital (EC) requirements calculated at a 99.95% confidence level;
•To generate sufficient capital to support asset growth;•To maintain an investment-grade credit rating; and•To achieve a return above the cost of equity.
Capital management strategy:The Group’s capital management strategy is focused on maximisng Shareholder value by optimising the level and mix of capital resources. Decisions on the allocation of capital resources are based on a number of factors including return on economic capital (EC) and on regulatory capital (RC), and are part of the internal capital adequacy assessment process (ICAAP).
Importance of capital managementCapital is managed as a Board-level priority in the Group, reflecting the importance of capital planning. The Board is responsible for assessing and approving the Group’s capital management policy, capital target levels and capital strategy.
A capital management framework provides effective capital planning, capital issuance, Basel II alignment, EC utilisation and economic profit (EP) performance measurement criteria. The diagram illustrates the process the Group follows to ensure end-to-end integration of the Group’s strategy, risk-management and financial processes into the capital management process. The purpose is to ensure that capital consumption in the business divisions has an impact on performance measurement, which in turn translates into management performance assessment and product-pricing requirements and achievement of the overall strategy within risk appetite.
Capital managementThe capital adequacy ratio is the quotient of the capital base of the Bank and the Bank’s risk-weighted asset base. In accordance with Central Bank of Nigeria regulations, a minimum ratio of 15% is to be maintained for deposit money banks with international subsidiaries. The following table provides an overview of the development of the capital ratios and risk-weighted assets (RWA).
Annual forecast
Cap
ital
su
pp
ly
Financialforecast
Capital transactions
•Retained profit•Assess capital supply alternatives given market demand
•Equity and other capital transactions issuance, including refinancing of existing capital transactions
•Securitisation transactions
•Share buybacks/dividends•Dividends from subsidiaries composition
Stress capital supply given market-stressed capital requirement
Regulatory capital
•Calculation of Pillar 1 capital requirements
•Review and challenge of Pillar 1 requirements
Economic capital
•Review and challenge business units’ demand for economic capital
•Calculation of Group economic capital
- Assess adequacy of Pillar 1 risks
- Calculate additional risks
Stressed capital requirement
Risk appetite Group strategy
Performancemeasurement
Cap
ital
dem
and
Medium-term plans
Stress and scenario testing
Capital management
Capital management process
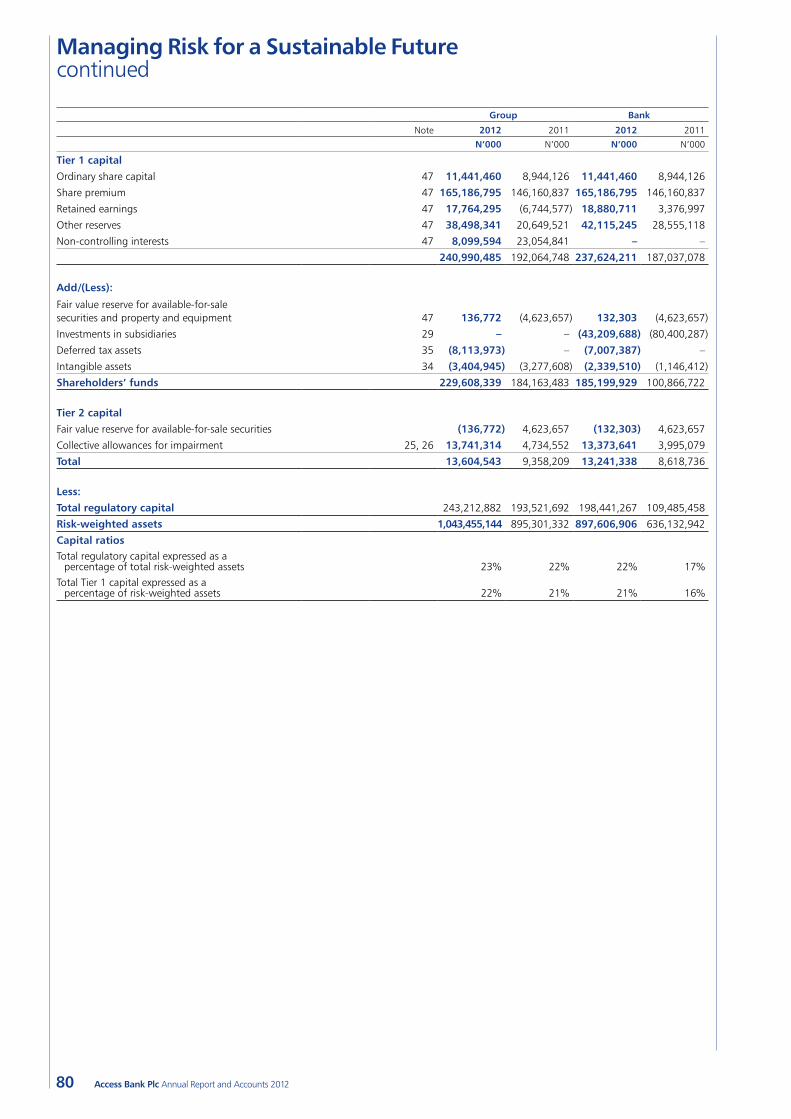
Managing Risk for a Sustainable Future continued
80 Access Bank Plc Annual Report and Accounts 2012
Group Bank
Note 2012 2011 2012 2011
N’000 N’000 N’000 N’000
Tier 1 capital
Ordinary share capital 47 11,441,460 8,944,126 11,441,460 8,944,126
Share premium 47 165,186,795 146,160,837 165,186,795 146,160,837
Retained earnings 47 17,764,295 (6,744,577) 18,880,711 3,376,997
Other reserves 47 38,498,341 20,649,521 42,115,245 28,555,118
Non-controlling interests 47 8,099,594 23,054,841 – –
240,990,485 192,064,748 237,624,211 187,037,078
Add/(Less):
Fair value reserve for available-for-sale securities and property and equipment 47 136,772 (4,623,657) 132,303 (4,623,657)
Investments in subsidiaries 29 – – (43,209,688) (80,400,287)
Deferred tax assets 35 (8,113,973) – (7,007,387) –
Intangible assets 34 (3,404,945) (3,277,608) (2,339,510) (1,146,412)
Shareholders’ funds 229,608,339 184,163,483 185,199,929 100,866,722
Tier 2 capital
Fair value reserve for available-for-sale securities (136,772) 4,623,657 (132,303) 4,623,657
Collective allowances for impairment 25, 26 13,741,314 4,734,552 13,373,641 3,995,079
Total 13,604,543 9,358,209 13,241,338 8,618,736
Less:
Total regulatory capital 243,212,882 193,521,692 198,441,267 109,485,458
Risk-weighted assets 1,043,455,144 895,301,332 897,606,906 636,132,942
Capital ratiosTotal regulatory capital expressed as a
percentage of total risk-weighted assets 23% 22% 22% 17%Total Tier 1 capital expressed as a
percentage of risk-weighted assets 22% 21% 21% 16%

Governance
81Access Bank Plc Annual Report and Accounts 2012
Board of Directors
1. Gbenga Oyebode, MFRChairmanMr Oyebode is the Managing Partner of Aluko & Oyebode (Barristers, Solicitors and Trademark Agents) with decades of experience in project finance; corporate law; energy and natural resources law; telecommunications and aviation law. He is the Chairman, Okomu Oil Palm Plc and also serves on the Board of MTN Nigeria Ltd and Crusader Insurance Plc.
Mr Oyebode holds a Master of Law degree from the University of Pennsylvania, Philadelphia USA (1982) and a Bachelor of Law degree from the University of Ife (1979).
He is a Barrister and Solicitor of the Supreme Court of Nigeria (admitted June 1980) and an Attorney-at-law of the Supreme Court of New York State (admitted November 1983). He is also a member of the Nigerian Bar Association and the American Bar Association and Council Member of the International Bar Association Section on Energy and Natural Resources Law.
2. Oritsedere Samuel OtubuNon-Executive DirectorMr Otubu is the Chairman of STACO Insurance Plc. He also serves on the Board of Food Emporium International – the franchisee of Barcelos food chain. He was a Director at DAAR Communications Plc.
He holds Masters and Bachelors degrees in Accounting and Finance respectively from the Houston Baptist University.
3. Babatunde Folawiyo, D.BA Non-Executive DirectorDr Folawiyo is the Group Managing Director of Yinka Folawiyo Group with business interests in the Power, Energy, Oil and Gas sectors. He also serves as a Director on the Board of MTN Nigeria Limited, Africa’s leading telecommunications company. Babatunde holds a Master of Law degree from the University College London (1985) and a Bachelor of Science degree in Economics from the London School of Economics.
He was called to the Bar of England and Wales in 1985. He started his law practice in Nigeria with the firm of Ogunsanya and Ogunsanya and in 1989 became the Group Executive Director of Yinka Folawiyo Group.
4. Emmanuel Ndubisi Chiejina Non-Executive DirectorMr Emmanuel Chiejina is the Chairman and CEO of AshBard Energy Company Limited and currently serves on the Board of STACO Insurance Plc. He retired as Deputy Managing Director of Elf Petroleum (Total E&P) in 2007.
Mr Emmanuel Chiejina is a graduate of Law from the University of Lagos (1975). He attended Professional Development Programmes at Columbia University, Cranfield Institute of Technology, European Institute of Business Administration (INSEAD), University of London, London Business School and Harvard Business School.
1
3
2
4

82 Access Bank Plc Annual Report and Accounts 2012
Board of Directors continued
5. Dr Mahmoud Isa-Dutse Non-Executive DirectorDr Mahmoud Isa-Dutse is a Director of Northern Nigeria Flour Mills Plc. His professional banking experience spans more than two decades. He retired in 2002 as an Executive Director at United Bank for Africa Plc where he was at various times in charge of Credit Risk Management, Investment Banking and Corporate Banking. He serves as a Senior Independent Director on the Board of Emerging Africa Infrastructure Fund.
Dr Mahmoud Isa-Dutse holds a PhD in Corporate Governance from the Manchester Business School, University of Manchester; an MBA from the Wharton Business School, University of Pennsylvania; and a BSc in Economics from Ahmadu Bello University, Zaria.
6. Mosun Belo-Olusoga, FCANon-Executive DirectorMrs Mosun Belo-Olusoga is the Principal Consultant/Programme Director of The KRC Limited. She served on the Board of Asset and Resource Management Company Limited and is the past Chairperson, Equipment and Leasing Association of Nigeria.
She had an illustrious banking career spanning nearly three decades. She retired from Guaranty Trust Bank Plc in 2006 as Executive Director, Investment Banking and was at various times responsible for Risk Management, Corporate and Commercial Banking, Investment Banking, Transaction Service and Settlements. She served as Acting Managing Director of Trust Bank of Africa Limited in 2003.
Mosun is a graduate of Economics from the University of Ibadan (1979). She qualified as a Chartered Accountant in 1983, winning the 1st place merit award and also the Society of Women Accountants of Nigeria prize for best qualifying candidate. She is a fellow of the Institute of Chartered Accountants of Nigeria and the Chartered Institute of Bankers of Nigeria.
7. Kemi OgunmefunNon-Executive Director Mrs Kemi Ogunmefun is the Managing Partner of Kemi Ogunmefun Law Office, a Canadian-based private legal practice specialising in immigration law, family law, real estate and corporate law. She served as the Chairperson of the Governance Committee of the Kinark Child and Family Services, a major Canadian child care trust.
Mrs Ogunmefun obtained her Bachelor of Law degree from the University of Lagos in 1974 and was called to the Nigerian Bar in 1975 and the Law Society of Upper Canada in 2004.
8. Dr Ernest Ndukwe, OFRIndependent Non-Executive DirectorDr Ndukwe was appointed by the Board in December 2012 and approved by the CBN in January 2013.
Dr Ndukwe is the current Co-Chair of the Presidential Committee on Strategy and Roadmap for universal broadband access in Nigeria, he is an accomplished Electrical/Electronics Engineer, with more than 36 years’ experience in the Telecommunications Industry. He was the Executive Vice-Chairman of the Nigerian Communications Commission (NCC) from 2000 to 2010.
His Board-level experience dates back to 1988 when he was appointed Commercial Director at General Telecom Plc, where he was later made Managing Director in 1989.
He is a graduate of the University of Ife and an alumnus of Lagos Business School. He also holds the fellowship awards of the Nigerian Society of Engineers, Nigerian Institute of Management (FNIM) and Nigerian Academy of Engineering. He is on the faculty of the Lagos Business School where he heads the Centre for Infrastructure Policy, Regulation and Advancement (CIPRA). His area of teaching interest includes strategic leadership with special focus on the character traits of CEOs that lead to business failures.
6
7
5
8

Governance
83Access Bank Plc Annual Report and Accounts 2012
9. Aigboje Aig-Imoukhuede, CONGroup Managing Director/CEOMr Aigboje Aig-Imoukhuede’s banking career spans over two decades. He spent more than 10 years at Guaranty Trust Bank Plc (GT Bank) and resigned in 2002 to lead a team as the Managing Director/Chief Executive Officer of Access Bank Plc with the mandate to transform the Bank into a world-class financial services provider.
Aigboje’s visionary leadership has seen the Bank rise to rank among the top four banks in Nigeria. In October 2007, Aigboje was named as one of the top 10 Most Respected CEOs in the annual PricewaterhouseCoopers Most Respected Companies and CEO Survey. In 2012, he won the 2011 Ernst & Young West Africa Entrepreneur of the Year Award.
Aigboje is an alumnus of Harvard Business School’s Executive Management Programme. He holds LLB and BL degrees from the University of Benin and the Nigeria Law School respectively. He is also an Honorary Fellow of the Chartered Institute of Bankers of Nigeria, Chairman of The Access Bank (UK) Ltd, Wapic Insurance Plc and Associated Discount House Ltd.
10. Herbert Wigwe, FCA Group Deputy Managing DirectorMr Herbert Wigwe started his professional career with Coopers and Lybrand Associates, an international firm of chartered accountants. He spent more than 10 years at Guaranty Trust Bank where he managed several portfolios including financial institutions, corporates and multinationals. He left Guaranty Trust Bank as an Executive Director to co-lead the transformation of Access Bank Plc in March 2002 as Deputy Managing Director.
Herbert is an alumnus of Harvard Business School’s Executive Management Programme. He holds a Masters degree in Banking and International Finance from the University College of North Wales; a Masters degree in Financial Economics from the University of London and a BSc degree in Accounting from the University of Nigeria, Nsukka. He is also a Fellow of the Institute of Chartered Accountants of Nigeria.
Herbert is the Chairman of Access Bank Ghana Ltd. He also serves on the Board of Central Securities Clearing System Plc.
11. Taukeme Koroye FCAExecutive Director, SubsidiariesMr Taukeme Edwin Koroye began his banking career with Nigeria International Bank (NIB) Limited (now Citibank Nigeria) in 1987, having obtained four years’ professional accounting experience with Price Waterhouse (now PricewaterhouseCoopers).
At NIB, his work experience spanned several departments, such as Corporate Finance, Corporate Banking, Internal Control, International Trade and Treasury Operations. He subsequently rose to the position of Vice President, Operations and Technology, prior to joining Access Bank Plc in 2002. He is a graduate of Business Administration from the University of Lagos; a fellow of the Institute of Chartered Accountants of Nigeria and an alumnus of Harvard Business School’s Executive Management Program.
12. Okey Nwuke FCAExecutive Director, Institutional Banking Mr Okey Nwuke began his banking career with Guaranty Trust Bank in 1991, where he worked in the Financial Control Unit and later rose to the position of Assistant General Manager, Commercial Banking Group East, before joining Access Bank Plc in 2002.
Okey holds a BSc degree in Accounting from the University of Nigeria and an MBA degree (Distinction) in International Banking & Finance from the University of Birmingham, United Kingdom. He is an associate member of the Chartered Institute of Taxation; an honorary member of the Chartered Institute of Bankers of Nigeria and a Fellow of the Institute of Chartered Accountants of Nigeria.
Okey has participated in leadership and professional development programmes at renowned global institutions of excellence including Harvard, INSEAD and IMD. Okey serves on the Board of Stanbic IBTC Pensions Managers Limited.
10
11
12
9

84 Access Bank Plc Annual Report and Accounts 2012
13. Obeahon OhiwereiExecutive Director, Commercial BankingMr Obeahon Ohiwerei began his banking career in 1991 with Guaranty Trust Bank, where his exceptional performance saw him rise to the position of a Manager within a short time.
He has worked with various banks including Equatorial Trust Bank, Pacific Bank, Continental Trust Bank and Standard Trust Bank. While at Standard Trust Bank, he was appointed the pioneer MD/CEO of Standard Trust Bank, Ghana in 2004.
Obeahon holds a Master’s degree in Business Administration and a Bachelor’s degree in Mathematics. He has attended several professional development programmes within and outside the country including Accenture Training Programme (USA), Harvard Business School (USA), Manchester Business School (UK) and Lagos Business School.
Obeahon serves on the Board of Access Bank’s banking subsidiaries in The Gambia and Sierra Leone.
14. Ebenezer OlufowoseExecutive Director, Financial Markets DivisionMr Ebenezer Olufowose’s banking experience spans nearly three decades with successful track records in Corporate and Investment Banking. He oversees the Bank’s treasury management, sales and trading, corporate restructuring, corporate finance and financial institutions businesses. He is a proven banker with an innate ability to originate and execute landmark transactions. Prior to joining Access Bank Plc in 2007, he was a Director with Citigroup and an Executive Director and Head of Corporate Finance & Investment Banking in Citibank Nigeria.
He began his professional career at NAL Merchant Bank in 1985 and thereafter joined First City Merchant Bank Ltd (FCMB) in 1990 initially as Manager and shortly thereafter as Head of the Bank’s Corporate Finance business. He joined Guaranty Trust Bank Plc (GT Bank) in 1995 with responsibility for the Bank’s Investment Banking business, amongst others. Before joining Citigroup in 2002, he was pioneer Managing Director of Guaranty Trust Bank (Gambia) Limited, the first subsidiary of GT Bank outside Nigeria. As pioneer Managing Director, on secondment from GT Bank, he was responsible for establishing the business proposition for GT Bank in the Gambia, obtaining the licence to operate, setting up and staffing the business.
He holds a first class honours degree in Economics from the University of Lagos, Nigeria and a Master’s degree in International Economics from the University of Sussex, Brighton, England, where he studied as a Sir Adam Thompson Scholar. He has attended courses at several renowned institutions including the Lagos Business School, the Institute of Management Development Lausanne, Switzerland, INSEAD Singapore and the Harvard Business School, Boston, USA.
15. Victor EtuokwuExecutive Director, Personal and Business BankingMr Victor Etuokwu has over 20 years’ banking experience across many functions including banking operations and information technology, internal control, general administration, retail banking, business acquisition and integration.
He joined Access Bank in July 2003 from Citibank Nigeria and was promoted to General Manager in February 2008. He has served the Bank in different capacities, leading several successful and critically important projects. The latest of such projects was the acquisition of a controlling equity interest in Intercontinental Bank Plc and the subsequent merger of both banks.
Mr Etuokwu holds BSc and MBA degrees from the University of Ibadan and University of Benin respectively. He is a Senior Honorary member of the Chartered Institute of Bankers of Nigeria.
Board of Directors continued
14
15
13
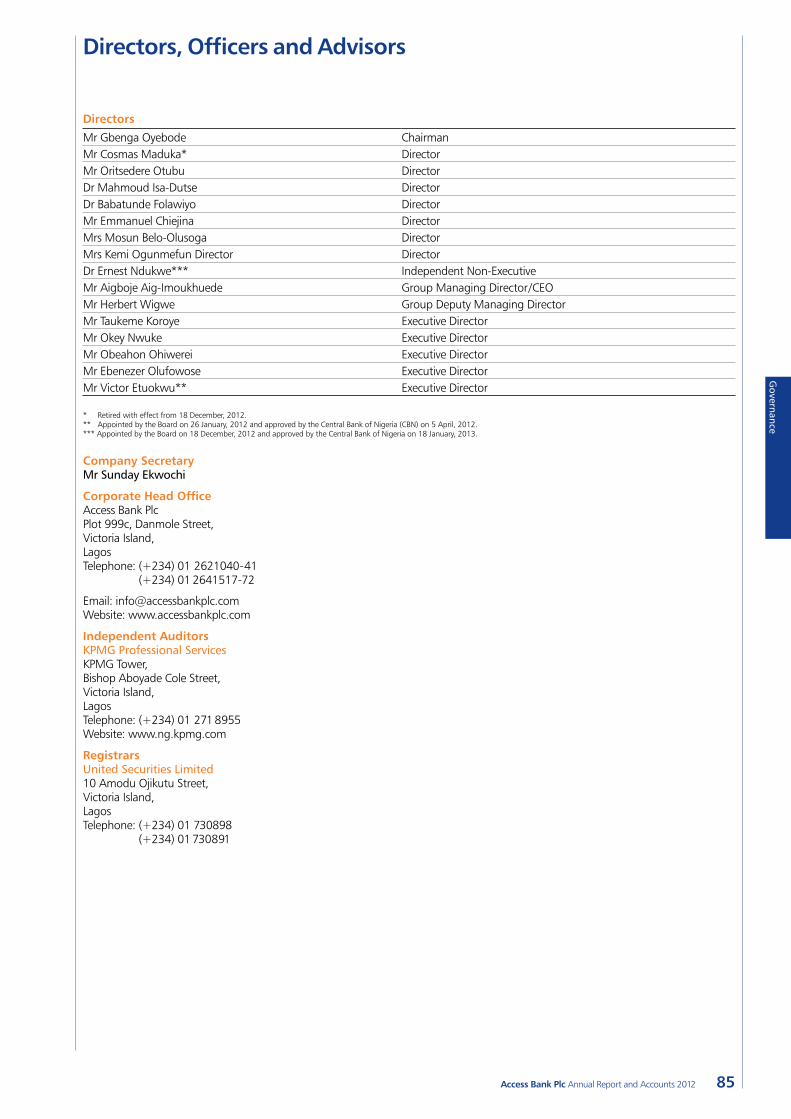
Governance
85Access Bank Plc Annual Report and Accounts 2012
Directors
Mr Gbenga Oyebode ChairmanMr Cosmas Maduka* DirectorMr Oritsedere Otubu DirectorDr Mahmoud Isa-Dutse DirectorDr Babatunde Folawiyo DirectorMr Emmanuel Chiejina DirectorMrs Mosun Belo-Olusoga DirectorMrs Kemi Ogunmefun Director DirectorDr Ernest Ndukwe*** Independent Non-ExecutiveMr Aigboje Aig-Imoukhuede Group Managing Director/CEOMr Herbert Wigwe Group Deputy Managing DirectorMr Taukeme Koroye Executive DirectorMr Okey Nwuke Executive DirectorMr Obeahon Ohiwerei Executive DirectorMr Ebenezer Olufowose Executive DirectorMr Victor Etuokwu** Executive Director
* Retired with effect from 18 December, 2012.** Appointed by the Board on 26 January, 2012 and approved by the Central Bank of Nigeria (CBN) on 5 April, 2012.*** Appointed by the Board on 18 December, 2012 and approved by the Central Bank of Nigeria on 18 January, 2013.
Company SecretaryMr Sunday Ekwochi
Corporate Head OfficeAccess Bank Plc Plot 999c, Danmole Street, Victoria Island, Lagos Telephone: (+234) 01 2621040-41 (+234) 01 2641517-72
Email: [email protected] Website: www.accessbankplc.com
Independent AuditorsKPMG Professional ServicesKPMG Tower, Bishop Aboyade Cole Street, Victoria Island, Lagos Telephone: (+234) 01 271 8955 Website: www.ng.kpmg.com
RegistrarsUnited Securities Limited10 Amodu Ojikutu Street, Victoria Island, Lagos Telephone: (+234) 01 730898 (+234) 01 730891
Directors, Officers and Advisors
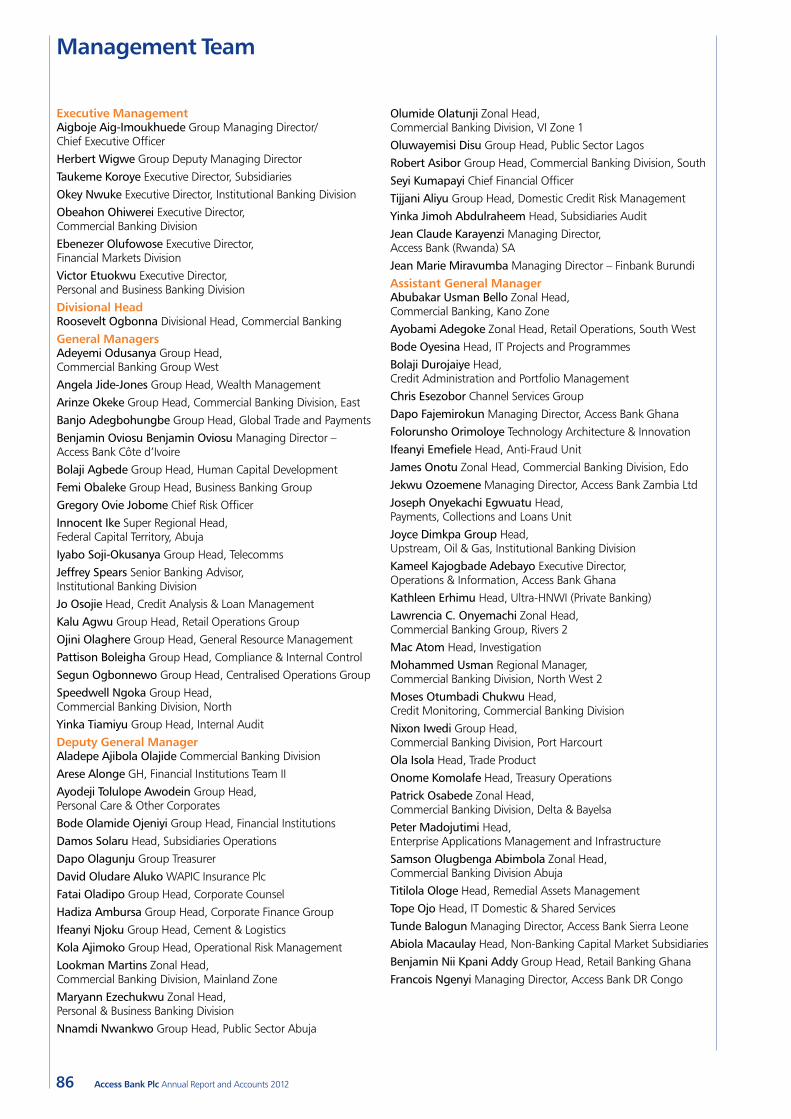
86 Access Bank Plc Annual Report and Accounts 2012
Executive ManagementAigboje Aig-Imoukhuede Group Managing Director/ Chief Executive OfficerHerbert Wigwe Group Deputy Managing DirectorTaukeme Koroye Executive Director, Subsidiaries Okey Nwuke Executive Director, Institutional Banking DivisionObeahon Ohiwerei Executive Director, Commercial Banking DivisionEbenezer Olufowose Executive Director, Financial Markets DivisionVictor Etuokwu Executive Director, Personal and Business Banking DivisionDivisional HeadRoosevelt Ogbonna Divisional Head, Commercial BankingGeneral ManagersAdeyemi Odusanya Group Head, Commercial Banking Group West Angela Jide-Jones Group Head, Wealth Management Arinze Okeke Group Head, Commercial Banking Division, EastBanjo Adegbohungbe Group Head, Global Trade and Payments Benjamin Oviosu Benjamin Oviosu Managing Director – Access Bank Côte d’IvoireBolaji Agbede Group Head, Human Capital DevelopmentFemi Obaleke Group Head, Business Banking GroupGregory Ovie Jobome Chief Risk OfficerInnocent Ike Super Regional Head, Federal Capital Territory, AbujaIyabo Soji-Okusanya Group Head, TelecommsJeffrey Spears Senior Banking Advisor, Institutional Banking DivisionJo Osojie Head, Credit Analysis & Loan ManagementKalu Agwu Group Head, Retail Operations GroupOjini Olaghere Group Head, General Resource ManagementPattison Boleigha Group Head, Compliance & Internal ControlSegun Ogbonnewo Group Head, Centralised Operations GroupSpeedwell Ngoka Group Head, Commercial Banking Division, NorthYinka Tiamiyu Group Head, Internal AuditDeputy General Manager Aladepe Ajibola Olajide Commercial Banking DivisionArese Alonge GH, Financial Institutions Team IIAyodeji Tolulope Awodein Group Head, Personal Care & Other CorporatesBode Olamide Ojeniyi Group Head, Financial InstitutionsDamos Solaru Head, Subsidiaries OperationsDapo Olagunju Group TreasurerDavid Oludare Aluko WAPIC Insurance Plc Fatai Oladipo Group Head, Corporate CounselHadiza Ambursa Group Head, Corporate Finance GroupIfeanyi Njoku Group Head, Cement & LogisticsKola Ajimoko Group Head, Operational Risk ManagementLookman Martins Zonal Head, Commercial Banking Division, Mainland ZoneMaryann Ezechukwu Zonal Head, Personal & Business Banking DivisionNnamdi Nwankwo Group Head, Public Sector Abuja
Olumide Olatunji Zonal Head, Commercial Banking Division, VI Zone 1Oluwayemisi Disu Group Head, Public Sector LagosRobert Asibor Group Head, Commercial Banking Division, SouthSeyi Kumapayi Chief Financial Officer Tijjani Aliyu Group Head, Domestic Credit Risk ManagementYinka Jimoh Abdulraheem Head, Subsidiaries AuditJean Claude Karayenzi Managing Director, Access Bank (Rwanda) SAJean Marie Miravumba Managing Director – Finbank BurundiAssistant General Manager Abubakar Usman Bello Zonal Head, Commercial Banking, Kano ZoneAyobami Adegoke Zonal Head, Retail Operations, South WestBode Oyesina Head, IT Projects and ProgrammesBolaji Durojaiye Head, Credit Administration and Portfolio ManagementChris Esezobor Channel Services GroupDapo Fajemirokun Managing Director, Access Bank GhanaFolorunsho Orimoloye Technology Architecture & InnovationIfeanyi Emefiele Head, Anti-Fraud UnitJames Onotu Zonal Head, Commercial Banking Division, EdoJekwu Ozoemene Managing Director, Access Bank Zambia LtdJoseph Onyekachi Egwuatu Head, Payments, Collections and Loans UnitJoyce Dimkpa Group Head, Upstream, Oil & Gas, Institutional Banking DivisionKameel Kajogbade Adebayo Executive Director, Operations & Information, Access Bank Ghana Kathleen Erhimu Head, Ultra-HNWI (Private Banking)Lawrencia C. Onyemachi Zonal Head, Commercial Banking Group, Rivers 2Mac Atom Head, InvestigationMohammed Usman Regional Manager, Commercial Banking Division, North West 2Moses Otumbadi Chukwu Head, Credit Monitoring, Commercial Banking Division Nixon Iwedi Group Head, Commercial Banking Division, Port HarcourtOla Isola Head, Trade ProductOnome Komolafe Head, Treasury OperationsPatrick Osabede Zonal Head, Commercial Banking Division, Delta & BayelsaPeter Madojutimi Head, Enterprise Applications Management and InfrastructureSamson Olugbenga Abimbola Zonal Head, Commercial Banking Division AbujaTitilola Ologe Head, Remedial Assets Management Tope Ojo Head, IT Domestic & Shared ServicesTunde Balogun Managing Director, Access Bank Sierra LeoneAbiola Macaulay Head, Non-Banking Capital Market SubsidiariesBenjamin Nii Kpani Addy Group Head, Retail Banking GhanaFrancois Ngenyi Managing Director, Access Bank DR Congo
Management Team
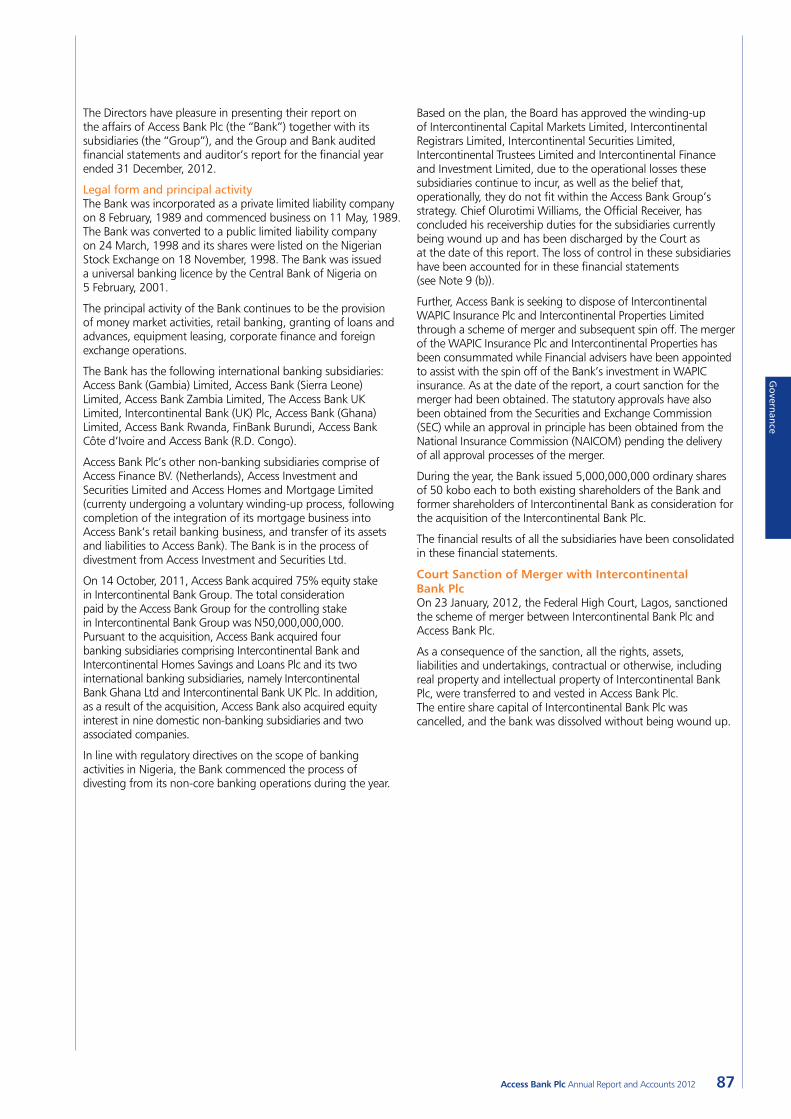
Governance
87Access Bank Plc Annual Report and Accounts 2012
The Directors have pleasure in presenting their report on the affairs of Access Bank Plc (the “Bank”) together with its subsidiaries (the “Group”), and the Group and Bank audited financial statements and auditor’s report for the financial year ended 31 December, 2012.
Legal form and principal activityThe Bank was incorporated as a private limited liability company on 8 February, 1989 and commenced business on 11 May, 1989. The Bank was converted to a public limited liability company on 24 March, 1998 and its shares were listed on the Nigerian Stock Exchange on 18 November, 1998. The Bank was issued a universal banking licence by the Central Bank of Nigeria on 5 February, 2001.
The principal activity of the Bank continues to be the provision of money market activities, retail banking, granting of loans and advances, equipment leasing, corporate finance and foreign exchange operations.
The Bank has the following international banking subsidiaries: Access Bank (Gambia) Limited, Access Bank (Sierra Leone) Limited, Access Bank Zambia Limited, The Access Bank UK Limited, Intercontinental Bank (UK) Plc, Access Bank (Ghana) Limited, Access Bank Rwanda, FinBank Burundi, Access Bank Côte d’Ivoire and Access Bank (R.D. Congo).
Access Bank Plc’s other non-banking subsidiaries comprise of Access Finance BV. (Netherlands), Access Investment and Securities Limited and Access Homes and Mortgage Limited (currenty undergoing a voluntary winding-up process, following completion of the integration of its mortgage business into Access Bank’s retail banking business, and transfer of its assets and liabilities to Access Bank). The Bank is in the process of divestment from Access Investment and Securities Ltd.
On 14 October, 2011, Access Bank acquired 75% equity stake in Intercontinental Bank Group. The total consideration paid by the Access Bank Group for the controlling stake in Intercontinental Bank Group was N50,000,000,000. Pursuant to the acquisition, Access Bank acquired four banking subsidiaries comprising Intercontinental Bank and Intercontinental Homes Savings and Loans Plc and its two international banking subsidiaries, namely Intercontinental Bank Ghana Ltd and Intercontinental Bank UK Plc. In addition, as a result of the acquisition, Access Bank also acquired equity interest in nine domestic non-banking subsidiaries and two associated companies.
In line with regulatory directives on the scope of banking activities in Nigeria, the Bank commenced the process of divesting from its non-core banking operations during the year.
Based on the plan, the Board has approved the winding-up of Intercontinental Capital Markets Limited, Intercontinental Registrars Limited, Intercontinental Securities Limited, Intercontinental Trustees Limited and Intercontinental Finance and Investment Limited, due to the operational losses these subsidiaries continue to incur, as well as the belief that, operationally, they do not fit within the Access Bank Group’s strategy. Chief Olurotimi Williams, the Official Receiver, has concluded his receivership duties for the subsidiaries currently being wound up and has been discharged by the Court as at the date of this report. The loss of control in these subsidiaries have been accounted for in these financial statements (see Note 9 (b)).
Further, Access Bank is seeking to dispose of Intercontinental WAPIC Insurance Plc and Intercontinental Properties Limited through a scheme of merger and subsequent spin off. The merger of the WAPIC Insurance Plc and Intercontinental Properties has been consummated while Financial advisers have been appointed to assist with the spin off of the Bank’s investment in WAPIC insurance. As at the date of the report, a court sanction for the merger had been obtained. The statutory approvals have also been obtained from the Securities and Exchange Commission (SEC) while an approval in principle has been obtained from the National Insurance Commission (NAICOM) pending the delivery of all approval processes of the merger.
During the year, the Bank issued 5,000,000,000 ordinary shares of 50 kobo each to both existing shareholders of the Bank and former shareholders of Intercontinental Bank as consideration for the acquisition of the Intercontinental Bank Plc.
The financial results of all the subsidiaries have been consolidated in these financial statements.
Court Sanction of Merger with Intercontinental Bank PlcOn 23 January, 2012, the Federal High Court, Lagos, sanctioned the scheme of merger between Intercontinental Bank Plc and Access Bank Plc.
As a consequence of the sanction, all the rights, assets, liabilities and undertakings, contractual or otherwise, including real property and intellectual property of Intercontinental Bank Plc, were transferred to and vested in Access Bank Plc. The entire share capital of Intercontinental Bank Plc was cancelled, and the bank was dissolved without being wound up.
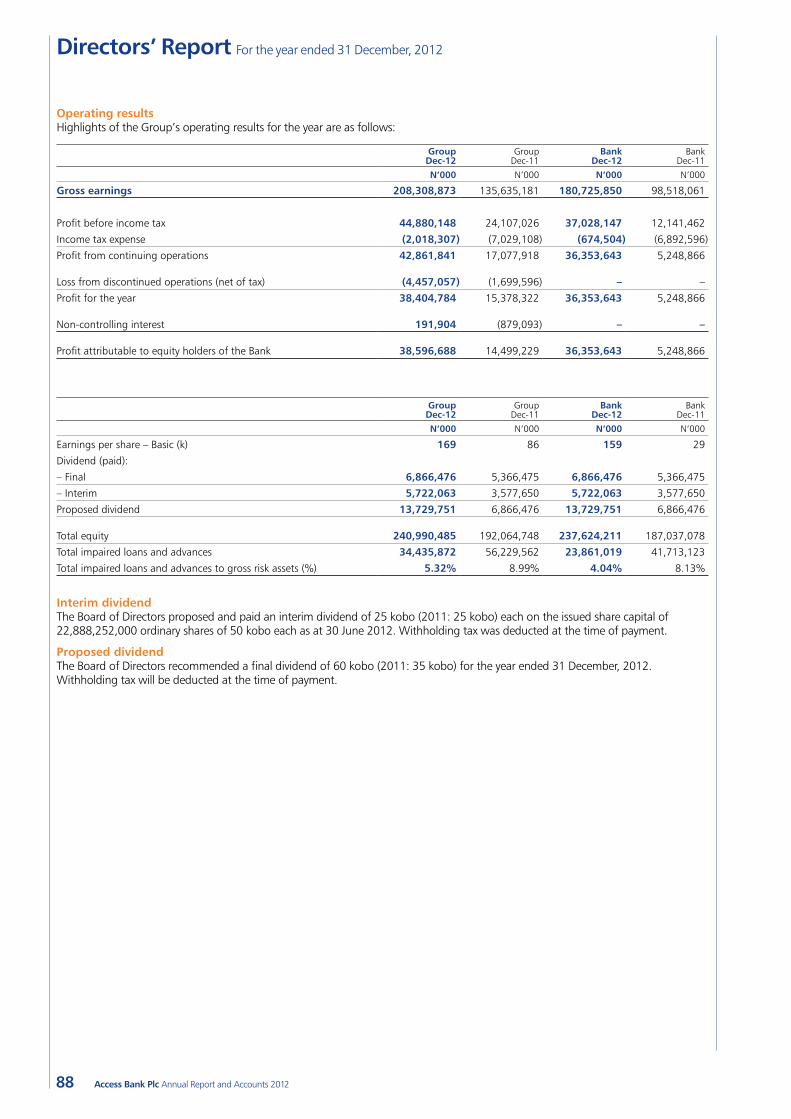
88 Access Bank Plc Annual Report and Accounts 2012
Operating resultsHighlights of the Group’s operating results for the year are as follows:
Group Dec-12
Group Dec-11
Bank Dec-12
Bank Dec-11
N’000 N’000 N’000 N’000
Gross earnings 208,308,873 135,635,181 180,725,850 98,518,061
Profit before income tax 44,880,148 24,107,026 37,028,147 12,141,462
Income tax expense (2,018,307) (7,029,108) (674,504) (6,892,596)
Profit from continuing operations 42,861,841 17,077,918 36,353,643 5,248,866
Loss from discontinued operations (net of tax) (4,457,057) (1,699,596) – –
Profit for the year 38,404,784 15,378,322 36,353,643 5,248,866
Non-controlling interest 191,904 (879,093) – –
Profit attributable to equity holders of the Bank 38,596,688 14,499,229 36,353,643 5,248,866
Group Dec-12
Group Dec-11
Bank Dec-12
Bank Dec-11
N’000 N’000 N’000 N’000
Earnings per share – Basic (k) 169 86 159 29
Dividend (paid):
– Final 6,866,476 5,366,475 6,866,476 5,366,475
– Interim 5,722,063 3,577,650 5,722,063 3,577,650
Proposed dividend 13,729,751 6,866,476 13,729,751 6,866,476
Total equity 240,990,485 192,064,748 237,624,211 187,037,078
Total impaired loans and advances 34,435,872 56,229,562 23,861,019 41,713,123
Total impaired loans and advances to gross risk assets (%) 5.32% 8.99% 4.04% 8.13%
Interim dividendThe Board of Directors proposed and paid an interim dividend of 25 kobo (2011: 25 kobo) each on the issued share capital of 22,888,252,000 ordinary shares of 50 kobo each as at 30 June 2012. Withholding tax was deducted at the time of payment.
Proposed dividendThe Board of Directors recommended a final dividend of 60 kobo (2011: 35 kobo) for the year ended 31 December, 2012. Withholding tax will be deducted at the time of payment.
Directors’ Report For the year ended 31 December, 2012
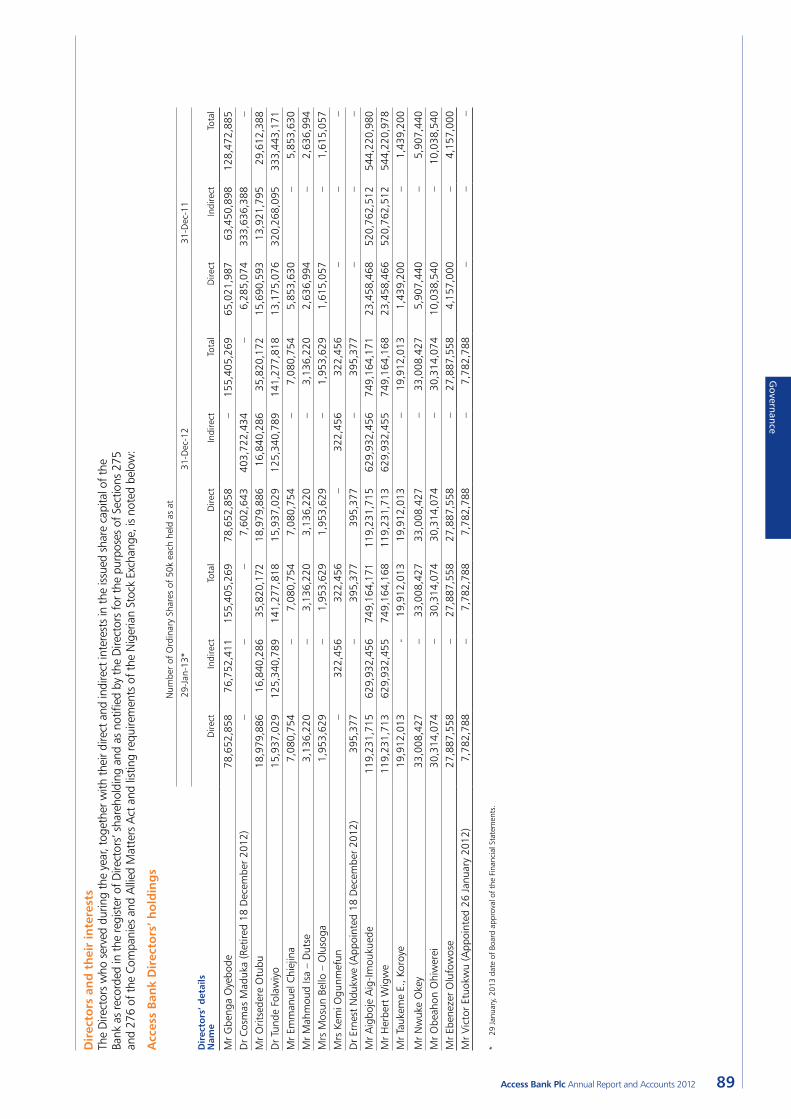
Governance
89Access Bank Plc Annual Report and Accounts 2012
Dir
ecto
rs a
nd
th
eir
inte
rest
sTh
e D
irect
ors
who
ser
ved
durin
g th
e ye
ar, t
oget
her w
ith th
eir d
irect
and
indi
rect
inte
rest
s in
the
issue
d sh
are
capi
tal o
f the
Ba
nk a
s re
cord
ed in
the
regi
ster
of D
irect
ors’
sha
reho
ldin
g an
d as
not
ified
by
the
Dire
ctor
s fo
r the
pur
pose
s of
Sec
tions
275
an
d 27
6 of
the
Com
pani
es a
nd A
llied
Mat
ters
Act
and
list
ing
requ
irem
ents
of t
he N
iger
ian
Stoc
k Ex
chan
ge, i
s no
ted
belo
w:
Acc
ess
Ban
k D
irec
tors
’ ho
ldin
gs
N
umbe
r of
Ord
inar
y Sh
ares
of
50k
each
hel
d as
at
29-J
an-1
3*31
-Dec
-12
31-D
ec-1
1
Dir
ecto
rs’ d
etai
ls
Nam
e D
irect
In
dire
ct
Tota
l D
irect
In
dire
ct
Tota
l D
irect
In
dire
ct
Tota
l
Mr
Gbe
nga
Oye
bode
78,
652,
858
76,
752,
411
155
,405
,269
7
8,65
2,85
8 –
155
,405
,269
6
5,02
1,98
7 6
3,45
0,89
8 1
28,4
72,8
85
Dr
Cosm
as M
aduk
a (R
etire
d 18
Dec
embe
r 20
12)
––
– 7
,602
,643
4
03,7
22,4
34
– 6
,285
,074
3
33,6
36,3
88
–M
r O
ritse
dere
Otu
bu 1
8,97
9,88
6 1
6,84
0,28
6 3
5,82
0,17
2 1
8,97
9,88
6 1
6,84
0,28
6 3
5,82
0,17
2 1
5,69
0,59
3 1
3,92
1,79
5 2
9,61
2,38
8 D
r Tu
nde
Fola
wiy
o 1
5,93
7,02
9 1
25,3
40,7
89
141
,277
,818
1
5,93
7,02
9 1
25,3
40,7
89
141
,277
,818
1
3,17
5,07
6 3
20,2
68,0
95
333
,443
,171
M
r Em
man
uel C
hiej
ina
7,0
80,7
54
– 7
,080
,754
7
,080
,754
–
7,0
80,7
54
5,8
53,6
30
– 5
,853
,630
M
r M
ahm
oud
Isa
– D
utse
3
,136
,220
–
3,1
36,2
20
3,1
36,2
20
– 3
,136
,220
2
,636
,994
–
2,6
36,9
94
Mrs
Mos
un B
ello
– O
luso
ga
1,9
53,6
29
– 1
,953
,629
1
,953
,629
–
1,9
53,6
29
1,6
15,0
57
– 1
,615
,057
M
rs K
emi O
gunm
efun
– 3
22,4
56
322
,456
–
322
,456
3
22,4
56
– –
– D
r Er
nest
Ndu
kwe
(App
oint
ed 1
8 D
ecem
ber
2012
) 3
95,3
77
– 3
95,3
77
395
,377
–
395
,377
–
–
– M
r A
igbo
je A
ig-Im
ouku
ede
119
,231
,715
6
29,9
32,4
56
749
,164
,171
1
19,2
31,7
15
629
,932
,456
7
49,1
64,1
71
23,
458,
468
520
,762
,512
5
44,2
20,9
80
Mr
Her
bert
Wig
we
119
,231
,713
6
29,9
32,4
55
749
,164
,168
1
19,2
31,7
13
629
,932
,455
7
49,1
64,1
68
23,
458,
466
520
,762
,512
5
44,2
20,9
78
Mr
Tauk
eme
E., K
oroy
e 1
9,91
2,01
3 -
19,
912,
013
19,
912,
013
– 1
9,91
2,01
3 1
,439
,200
–
1,4
39,2
00
Mr
Nw
uke
Oke
y 3
3,00
8,42
7 –
33,
008,
427
33,
008,
427
– 3
3,00
8,42
7 5
,907
,440
–
5,9
07,4
40
Mr
Obe
ahon
Ohi
wer
ei 3
0,31
4,07
4 –
30,
314,
074
30,
314,
074
– 3
0,31
4,07
4 1
0,03
8,54
0 –
10,
038,
540
Mr
Eben
ezer
Olu
fow
ose
27,
887,
558
– 2
7,88
7,55
8 2
7,88
7,55
8 –
27,
887,
558
4,1
57,0
00
– 4
,157
,000
M
r V
icto
r Et
uokw
u (A
ppoi
nted
26
Janu
ary
2012
) 7
,782
,788
–
7,7
82,7
88
7,7
82,7
88
– 7
,782
,788
–
– –
* 29
Janu
ary,
201
3 da
te o
f Boa
rd a
ppro
val o
f the
Fin
anci
al S
tate
men
ts.
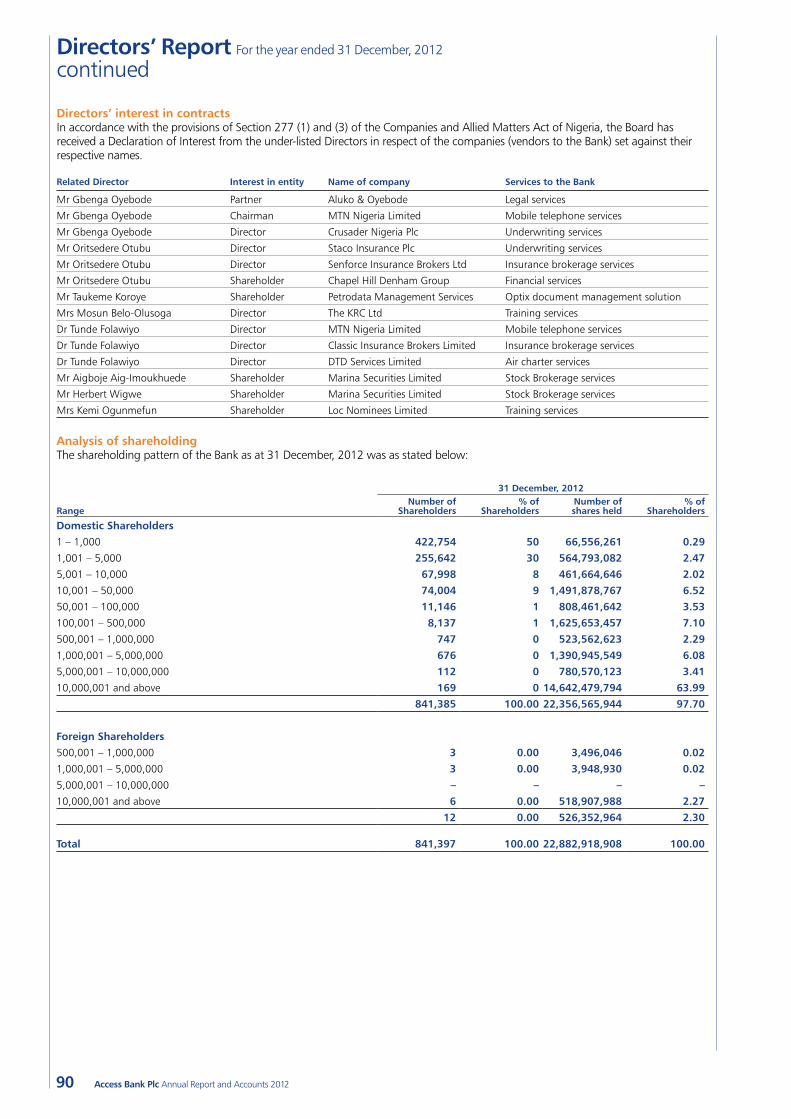
90 Access Bank Plc Annual Report and Accounts 2012
Directors’ Report For the year ended 31 December, 2012
continued
Directors’ interest in contractsIn accordance with the provisions of Section 277 (1) and (3) of the Companies and Allied Matters Act of Nigeria, the Board has received a Declaration of Interest from the under-listed Directors in respect of the companies (vendors to the Bank) set against their respective names.
Related Director Interest in entity Name of company Services to the Bank
Mr Gbenga Oyebode Partner Aluko & Oyebode Legal services
Mr Gbenga Oyebode Chairman MTN Nigeria Limited Mobile telephone services
Mr Gbenga Oyebode Director Crusader Nigeria Plc Underwriting services
Mr Oritsedere Otubu Director Staco Insurance Plc Underwriting services
Mr Oritsedere Otubu Director Senforce Insurance Brokers Ltd Insurance brokerage services
Mr Oritsedere Otubu Shareholder Chapel Hill Denham Group Financial services
Mr Taukeme Koroye Shareholder Petrodata Management Services Optix document management solution
Mrs Mosun Belo-Olusoga Director The KRC Ltd Training services
Dr Tunde Folawiyo Director MTN Nigeria Limited Mobile telephone services
Dr Tunde Folawiyo Director Classic Insurance Brokers Limited Insurance brokerage services
Dr Tunde Folawiyo Director DTD Services Limited Air charter services
Mr Aigboje Aig-Imoukhuede Shareholder Marina Securities Limited Stock Brokerage services
Mr Herbert Wigwe Shareholder Marina Securities Limited Stock Brokerage services
Mrs Kemi Ogunmefun Shareholder Loc Nominees Limited Training services
Analysis of shareholdingThe shareholding pattern of the Bank as at 31 December, 2012 was as stated below:
31 December, 2012
RangeNumber of
Shareholders% of
ShareholdersNumber of shares held
% of Shareholders
Domestic Shareholders
1 – 1,000 422,754 50 66,556,261 0.29
1,001 – 5,000 255,642 30 564,793,082 2.47
5,001 – 10,000 67,998 8 461,664,646 2.02
10,001 – 50,000 74,004 9 1,491,878,767 6.52
50,001 – 100,000 11,146 1 808,461,642 3.53
100,001 – 500,000 8,137 1 1,625,653,457 7.10
500,001 – 1,000,000 747 0 523,562,623 2.29
1,000,001 – 5,000,000 676 0 1,390,945,549 6.08
5,000,001 – 10,000,000 112 0 780,570,123 3.41
10,000,001 and above 169 0 14,642,479,794 63.99
841,385 100.00 22,356,565,944 97.70
Foreign Shareholders
500,001 – 1,000,000 3 0.00 3,496,046 0.02
1,000,001 – 5,000,000 3 0.00 3,948,930 0.02
5,000,001 – 10,000,000 – – – –
10,000,001 and above 6 0.00 518,907,988 2.27
12 0.00 526,352,964 2.30
Total 841,397 100.00 22,882,918,908 100.00
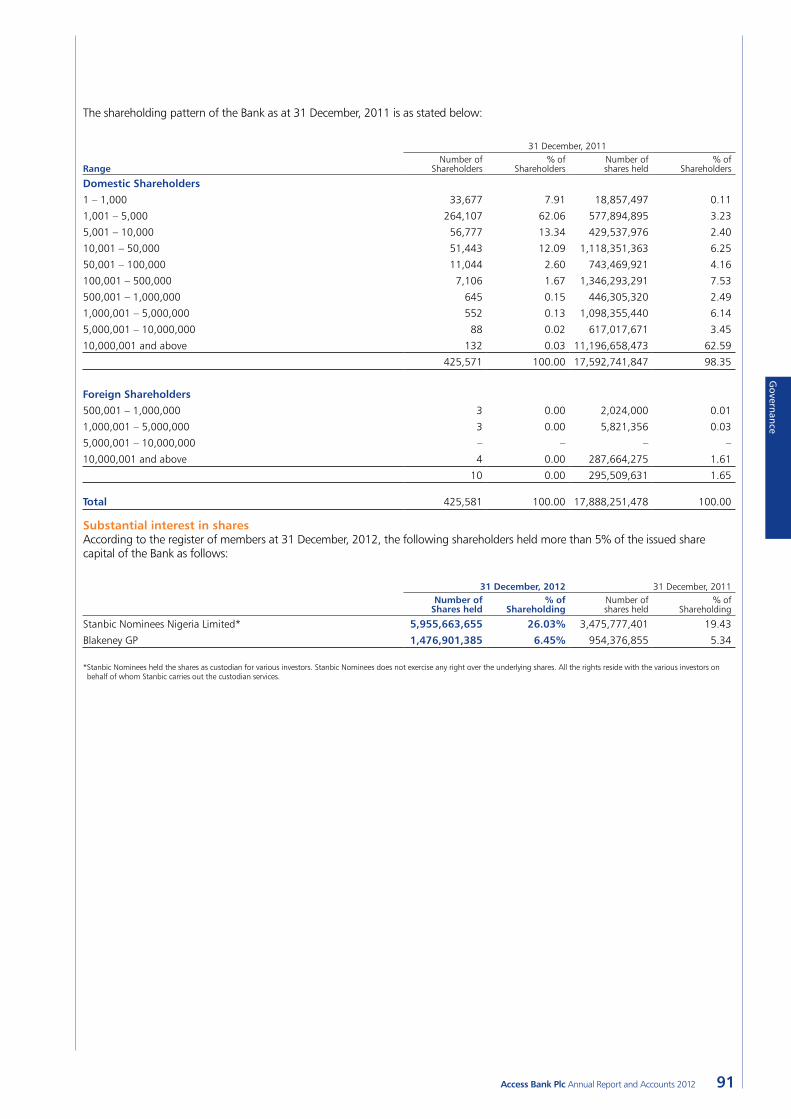
Governance
91Access Bank Plc Annual Report and Accounts 2012
The shareholding pattern of the Bank as at 31 December, 2011 is as stated below:
31 December, 2011
RangeNumber of
Shareholders% of
ShareholdersNumber of shares held
% of Shareholders
Domestic Shareholders
1 – 1,000 33,677 7.91 18,857,497 0.11
1,001 – 5,000 264,107 62.06 577,894,895 3.23
5,001 – 10,000 56,777 13.34 429,537,976 2.40
10,001 – 50,000 51,443 12.09 1,118,351,363 6.25
50,001 – 100,000 11,044 2.60 743,469,921 4.16
100,001 – 500,000 7,106 1.67 1,346,293,291 7.53
500,001 – 1,000,000 645 0.15 446,305,320 2.49
1,000,001 – 5,000,000 552 0.13 1,098,355,440 6.14
5,000,001 – 10,000,000 88 0.02 617,017,671 3.45
10,000,001 and above 132 0.03 11,196,658,473 62.59
425,571 100.00 17,592,741,847 98.35
Foreign Shareholders
500,001 – 1,000,000 3 0.00 2,024,000 0.01
1,000,001 – 5,000,000 3 0.00 5,821,356 0.03
5,000,001 – 10,000,000 – – – –
10,000,001 and above 4 0.00 287,664,275 1.61
10 0.00 295,509,631 1.65
Total 425,581 100.00 17,888,251,478 100.00
Substantial interest in sharesAccording to the register of members at 31 December, 2012, the following shareholders held more than 5% of the issued share capital of the Bank as follows:
31 December, 2012 31 December, 2011Number of
Shares held% of
ShareholdingNumber of shares held
% of Shareholding
Stanbic Nominees Nigeria Limited* 5,955,663,655 26.03% 3,475,777,401 19.43
Blakeney GP 1,476,901,385 6.45% 954,376,855 5.34
* Stanbic Nominees held the shares as custodian for various investors. Stanbic Nominees does not exercise any right over the underlying shares. All the rights reside with the various investors on behalf of whom Stanbic carries out the custodian services.
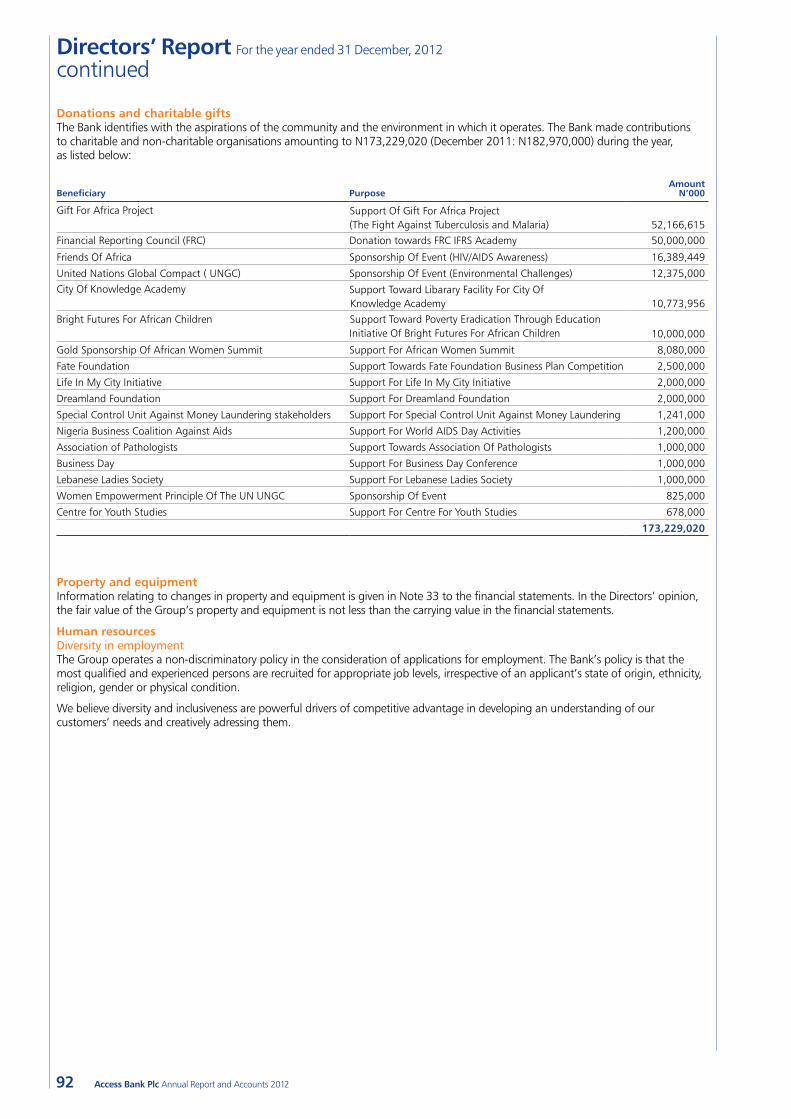
92 Access Bank Plc Annual Report and Accounts 2012
Donations and charitable giftsThe Bank identifies with the aspirations of the community and the environment in which it operates. The Bank made contributions to charitable and non-charitable organisations amounting to N173,229,020 (December 2011: N182,970,000) during the year, as listed below:
Beneficiary Purpose Amount
N’000
Gift For Africa Project Support Of Gift For Africa Project (The Fight Against Tuberculosis and Malaria) 52,166,615
Financial Reporting Council (FRC) Donation towards FRC IFRS Academy 50,000,000
Friends Of Africa Sponsorship Of Event (HIV/AIDS Awareness) 16,389,449
United Nations Global Compact ( UNGC) Sponsorship Of Event (Environmental Challenges) 12,375,000City Of Knowledge Academy Support Toward Libarary Facility For City Of
Knowledge Academy 10,773,956Bright Futures For African Children Support Toward Poverty Eradication Through Education
Initiative Of Bright Futures For African Children 10,000,000
Gold Sponsorship Of African Women Summit Support For African Women Summit 8,080,000
Fate Foundation Support Towards Fate Foundation Business Plan Competition 2,500,000
Life In My City Initiative Support For Life In My City Initiative 2,000,000
Dreamland Foundation Support For Dreamland Foundation 2,000,000
Special Control Unit Against Money Laundering stakeholders Support For Special Control Unit Against Money Laundering 1,241,000
Nigeria Business Coalition Against Aids Support For World AIDS Day Activities 1,200,000
Association of Pathologists Support Towards Association Of Pathologists 1,000,000
Business Day Support For Business Day Conference 1,000,000
Lebanese Ladies Society Support For Lebanese Ladies Society 1,000,000
Women Empowerment Principle Of The UN UNGC Sponsorship Of Event 825,000
Centre for Youth Studies Support For Centre For Youth Studies 678,000
173,229,020
Property and equipmentInformation relating to changes in property and equipment is given in Note 33 to the financial statements. In the Directors’ opinion, the fair value of the Group’s property and equipment is not less than the carrying value in the financial statements.
Human resourcesDiversity in employmentThe Group operates a non-discriminatory policy in the consideration of applications for employment. The Bank’s policy is that the most qualified and experienced persons are recruited for appropriate job levels, irrespective of an applicant’s state of origin, ethnicity, religion, gender or physical condition.
We believe diversity and inclusiveness are powerful drivers of competitive advantage in developing an understanding of our customers’ needs and creatively adressing them.
Directors’ Report For the year ended 31 December, 2012
continued
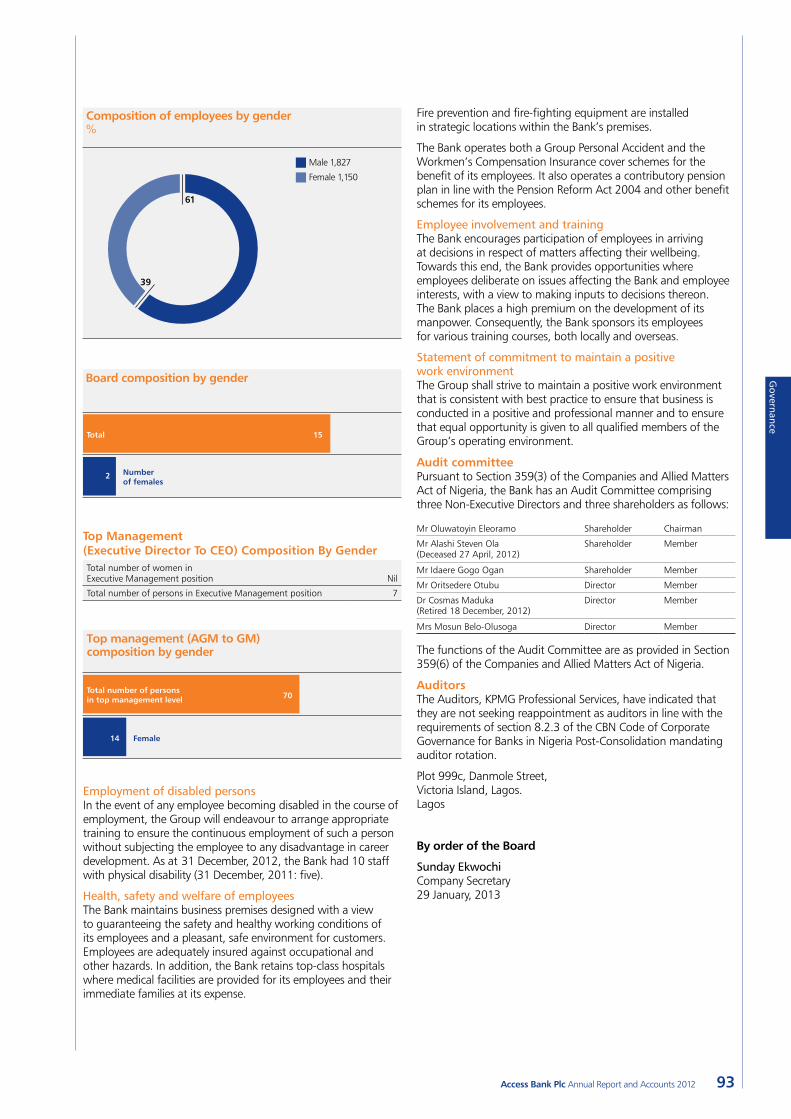
Governance
93Access Bank Plc Annual Report and Accounts 2012
Fire prevention and fire-fighting equipment are installed in strategic locations within the Bank’s premises.
The Bank operates both a Group Personal Accident and the Workmen’s Compensation Insurance cover schemes for the benefit of its employees. It also operates a contributory pension plan in line with the Pension Reform Act 2004 and other benefit schemes for its employees.
Employee involvement and trainingThe Bank encourages participation of employees in arriving at decisions in respect of matters affecting their wellbeing. Towards this end, the Bank provides opportunities where employees deliberate on issues affecting the Bank and employee interests, with a view to making inputs to decisions thereon. The Bank places a high premium on the development of its manpower. Consequently, the Bank sponsors its employees for various training courses, both locally and overseas.
Statement of commitment to maintain a positive work environmentThe Group shall strive to maintain a positive work environment that is consistent with best practice to ensure that business is conducted in a positive and professional manner and to ensure that equal opportunity is given to all qualified members of the Group’s operating environment.
Audit committeePursuant to Section 359(3) of the Companies and Allied Matters Act of Nigeria, the Bank has an Audit Committee comprising three Non-Executive Directors and three shareholders as follows:
Mr Oluwatoyin Eleoramo Shareholder Chairman
Mr Alashi Steven Ola (Deceased 27 April, 2012)
Shareholder Member
Mr Idaere Gogo Ogan Shareholder Member
Mr Oritsedere Otubu Director Member
Dr Cosmas Maduka (Retired 18 December, 2012)
Director Member
Mrs Mosun Belo-Olusoga Director Member
The functions of the Audit Committee are as provided in Section 359(6) of the Companies and Allied Matters Act of Nigeria.
AuditorsThe Auditors, KPMG Professional Services, have indicated that they are not seeking reappointment as auditors in line with the requirements of section 8.2.3 of the CBN Code of Corporate Governance for Banks in Nigeria Post-Consolidation mandating auditor rotation.
Plot 999c, Danmole Street, Victoria Island, Lagos. Lagos
By order of the Board
Sunday EkwochiCompany Secretary29 January, 2013
Composition of employees by gender
61
39
Male 1,827
Female 1,150
%
Board composition by gender
Total
Numberof females
15
2
Top Management (Executive Director To CEO) Composition By GenderTotal number of women in Executive Management position Nil
Total number of persons in Executive Management position 7
Top management (AGM to GM) composition by gender
Total number of personsin top management level
Female
70
14
Employment of disabled personsIn the event of any employee becoming disabled in the course of employment, the Group will endeavour to arrange appropriate training to ensure the continuous employment of such a person without subjecting the employee to any disadvantage in career development. As at 31 December, 2012, the Bank had 10 staff with physical disability (31 December, 2011: five).
Health, safety and welfare of employeesThe Bank maintains business premises designed with a view to guaranteeing the safety and healthy working conditions of its employees and a pleasant, safe environment for customers. Employees are adequately insured against occupational and other hazards. In addition, the Bank retains top-class hospitals where medical facilities are provided for its employees and their immediate families at its expense.
94 Access Bank Plc Annual Report and Accounts 2012
Statement of Directors’ responsibilities in relation to the financial statements for the year ended 31 December, 2012The Directors accept responsibility for the preparation of the annual financial statements set out on pages 38 to 80 and 106 to 185 that give a true and fair view in accordance with International Financial Reporting Standards (IFRS) and in the manner required by the Companies and Allied Matters Act of Nigeria, the Financial Reporting Council of Nigeria Act, 2011, the Banks and Other Financial Institutions Act of Nigeria and relevant Central Bank of Nigeria regulations.
The Directors further accept responsibility for maintaining adequate accounting records as required by the Companies and Allied Matters Act of Nigeria and for such internal control as the directors determine is necessary to enable the preparation of financial statements that are free from material misstatement whether due to fraud or error.
The Directors have made assessment of the Bank’s ability to continue as a going concern and have no reason to believe that the Bank will not remain a going concern in the year ahead.
Signed on behalf of the Board of Directors by:
DirectorMr Aigboje Aig-Imoukhuede29 January, 2013
DirectorMr Herbert Wigwe29 January, 2013
Chief Financial OfficerMr Oluseyi Kumapayi29 January, 2013
Report of the statutory audit committee
To the members of Access Bank Plc:
In accordance with the provisions of Section 359(6) of the Companies and Allied Matters Act of Nigeria, the members of the Audit Committee of Access Bank Plc hereby report on the financial statements for the year ended 31 December, 2012 as follows:
•We have exercised our statutory functions under section 359(6) of the Companies and Allied Matters Act of Nigeria and acknowledge the co-operation of management and staff in the conduct of these responsibilities.
•We are of the opinion that the accounting and reporting policies of the Bank and Group are in agreement with legal requirements and agreed ethical practices and that the scope and planning of both the external and internal audits for the year ended 31 December, 2012 were satisfactory and reinforce the Group’s internal control systems.
•We are satisfied that the Bank has complied with the provisions of Central Bank of Nigeria Circular BSD/1/2004 dated 18 February, 2004 on “Disclosure of insider related credits in the financial statements of banks”. We hereby confirm that an aggregate amount of N82,577,604,463 (December 2011: N90,005,622,784) was outstanding as at 31 December, 2012 which was neither past due, nor impaired, as at 31 December, 2012 (see Note 53).
•We have deliberated on the findings of the external auditors who have confirmed that necessary cooperation was received from management in the course of their final audit and we are satisfied with management’s responses thereon and with the effectiveness of the Bank’s system of accounting and internal control.
Mr Oluwatoyin EleoramoChairman, Audit Committee 29 January, 2013
Members of the Audit Committee are:Mr Oluwatoyin Eleoramo Shareholder Chairman
Mr Idaere Gogo Ogan Shareholder Member
Mr Oritsedere Otubu Director Member
Mrs Mosun Belo-Olusoga Director Member
In attendance:Sunday EkwochiSecretary
Directors’ Responsibilities and Statutory Audit Committee Report
Governance
95Access Bank Plc Annual Report and Accounts 2012
IntroductionOur corporate governance report provides us with the opportunity to explain to our stakeholders how the Bank has been governed during the year. It reports on how the Board has functioned and the workings of our systems and structures of governance.
Access Bank Plc (“Access Bank” or the “the Bank”) remains committed to implementing the best practice standards of corporate governance. The Bank and its subsidiaries (“the Group”) function under a governance framework that enables the Board to discharge its role of providing oversight and strategic counsel in tandem with its responsibility to ensure the Bank’s compliance with regulatory requirements and acceptable risk.
The Bank is mindful of its obligations under the relevant codes of corporate governance, such as the Central Bank of Nigeria’s (CBN) Code of Corporate Governance for Banks in Nigeria Post Consolidation (the CBN Code), the Securities and Exchange Commission’s Code of Corporate Governance (the SEC Code) and the post listing requirements of the Nigeria Stock Exchange. These codes, in addition to the Bank’s Board Charter, collectively provide the basis for promoting sound corporate governance in the Bank. Our core values of excellence, leadership, passion for customers, empowered employees, professionalism and innovation are the bedrock upon which we continue to build our corporate behaviour.
Performance evaluation The Bank’s performance on corporate governance is continuously being monitored and reported. We carry out monthly internal reviews of compliance with the CBN Code and submit the reports to the CBN. In addition, ongoing reviews of the Bank’s compliance with the SEC Code are carried out by the Risk Audit Unit and reported to the Board through the Risk Management Committee.
The Board has also established a system of independent annual evaluation of its own performance, and the performance of its committees and individual Directors. The evaluation is carried out by an independent consulting firm approved by the Board. In 2012, Accenture Limited was re-engaged to facilitate the Board performance evaluation. The Board is comfortable that Accenture Limited provides an objective evaluation, notwithstanding its position as one of the Bank’s strategy consultants.
The results of the Board performance evaluation were presented at the Board Meeting of 29 January, 2012 and confirmed that the Board continues to operate at a very high level of effectiveness and efficiency. The assessment of individual Directors is delivered by the Chairman. The cumulative results of the performance of the Board, and of the individual Directors on Board, are considered by the Board Governance & Remuneration Committee as a guide in deciding eligibility for re-election.
Appointment, retirement and re-election of DirectorsOn 18 December, 2012, the Board (pursuant to the powers vested in it by the Articles of Association) appointed Dr Ernest Ndukwe as Non-Executive Independent Director. His appointment has been approved by the CBN and will be tabled before shareholders during the Annual General Meeting (AGM) for approval as required by the Articles. Dr Ndukwe is an electrical/electronics engineer, with more than 36 years’ experience in the telecommunications industry. He was formerly Executive Vice-Chairman of the Nigerian Communications Commission (NCC) between 2000 and 2010. Dr Ndukwe brings significant public- and private-sector governance experience to his role in the Bank. His Board
level experience dates back to 1988 when he was appointed Commercial Director at General Telecom Plc, where he later became the Managing Director. He is a graduate of the University of Ife and an alumnus of Lagos Business School. He holds fellowship awards from the Nigerian Society of Engineers, the Nigerian Institute of Management and the Nigerian Academy of Engineering. He is also on the faculty of the Lagos Business School where he heads the Centre for Infrastructure Policy, Regulation and Advancement.
Dr Cosmas Maduka, following his completion of the maximum 12-year term as provided by the CBN Code, retired from the Board in December 2012.
In accordance with its Articles of Association, one third of all Non-Executive Directors (rounded down) are offered for re-election every year (depending on their tenure on the Board) together with Directors appointed by the Board since the last AGM. In keeping with this requirement, Mr Gbenga Oyebode, Dr Mahmoud Isa-Dutse and Mrs Mosun Belo-Olusoga will retire at this AGM and, being eligible for re-election, will stand for re-election.
The biographical details of the candidates for election and re-election are provided on pages 189 and 190 of this annual report.
Shareholders’ meetingShareholders’ meetings are duly convened and held in line with the Bank’s Articles of Association and existing statutory and regulatory regimes in an open manner, for the purpose of deliberating on issues affecting the Bank’s strategic direction. This occurs through a fair and transparent process and also serves as a medium for promoting interaction between the Board, Management and Shareholders. Attendance at the AGM is open to shareholders or their proxies, while proceedings at such meetings are usually monitored by members of the press, representatives of the Nigerian Stock Exchange, CBN and the Securities and Exchange Commission. The Board ensures that shareholders are provided with adequate notice of meetings. An Extraordinary General Meeting (EGM) may also be convened at the request of the Board or shareholders holding not less than 10% of the Bank’s paid-up capital.
Access to information and resourcesThere is ongoing engagement between Executive Management and the Board, and the heads of relevant strategic business units attend Board meetings to make presentations. The Bank’s external auditors attend meetings convened by the Board, the Board Audit Committee and the Shareholders Audit Committee. The Directors have unrestricted access to management and company information in addition to other resources to carry out their roles and responsibilities, including access to external professional advice at the Bank’s expense.
Investors’ Communication and Disclosure PolicyThe Bank has a robust Investors’ Communication and Disclosure Policy. As provided in the policy, the Board and Management ensures that communication with the investing public about the Bank and its subsidiaries is timely, factual, broadly disseminated, accurate and in accordance with all applicable legal and regulatory requirements. The Bank also has an Investor Relations Unit that deals with enquiries from shareholders. This is in addition to quarterly Investors’ Conference Calls that are held to provide local and international investors, as well as the analyst community, with up-to-date information on the Bank. The Bank’s reports and other communications to shareholders and other stakeholders are always issued in a plain, readable and understandable format, while its website www.accessbankplc.com is also regularly updated with both
Corporate Governance For the year ended 31 December, 2012
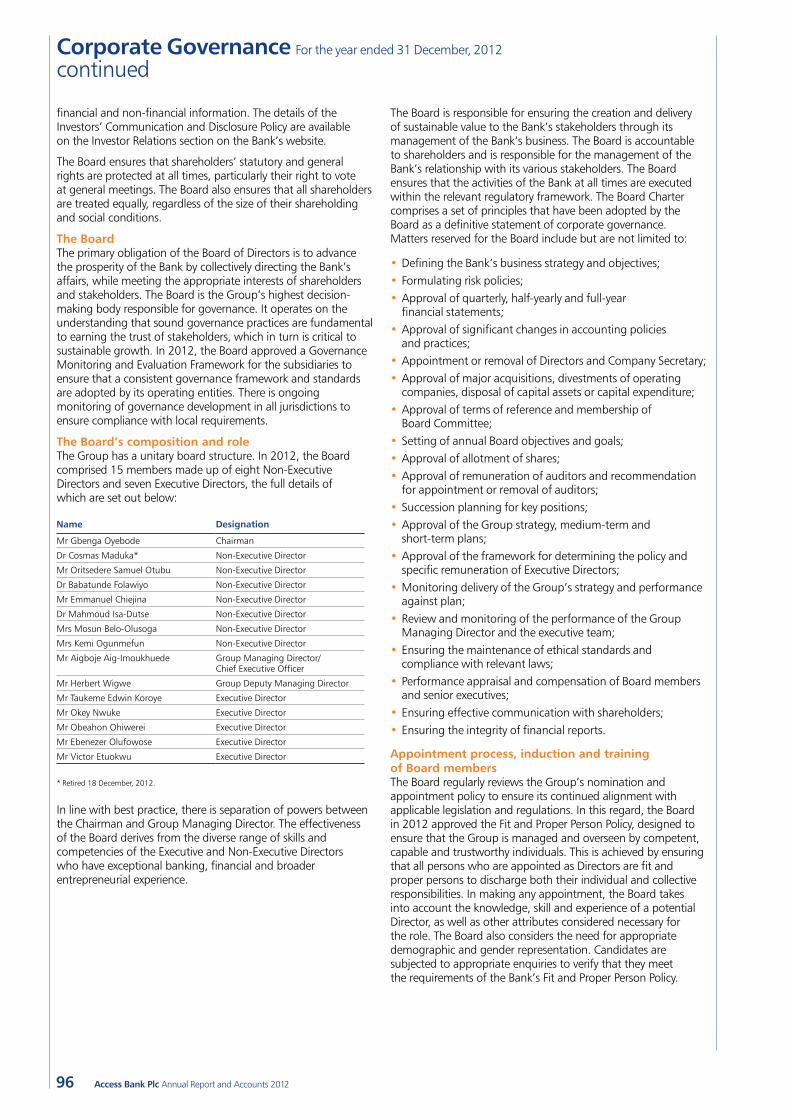
96 Access Bank Plc Annual Report and Accounts 2012
financial and non-financial information. The details of the Investors’ Communication and Disclosure Policy are available on the Investor Relations section on the Bank’s website.
The Board ensures that shareholders’ statutory and general rights are protected at all times, particularly their right to vote at general meetings. The Board also ensures that all shareholders are treated equally, regardless of the size of their shareholding and social conditions.
The BoardThe primary obligation of the Board of Directors is to advance the prosperity of the Bank by collectively directing the Bank’s affairs, while meeting the appropriate interests of shareholders and stakeholders. The Board is the Group’s highest decision-making body responsible for governance. It operates on the understanding that sound governance practices are fundamental to earning the trust of stakeholders, which in turn is critical to sustainable growth. In 2012, the Board approved a Governance Monitoring and Evaluation Framework for the subsidiaries to ensure that a consistent governance framework and standards are adopted by its operating entities. There is ongoing monitoring of governance development in all jurisdictions to ensure compliance with local requirements.
The Board’s composition and roleThe Group has a unitary board structure. In 2012, the Board comprised 15 members made up of eight Non-Executive Directors and seven Executive Directors, the full details of which are set out below:
Name Designation
Mr Gbenga Oyebode Chairman
Dr Cosmas Maduka* Non-Executive Director
Mr Oritsedere Samuel Otubu Non-Executive Director
Dr Babatunde Folawiyo Non-Executive Director
Mr Emmanuel Chiejina Non-Executive Director
Dr Mahmoud Isa-Dutse Non-Executive Director
Mrs Mosun Belo-Olusoga Non-Executive Director
Mrs Kemi Ogunmefun Non-Executive Director
Mr Aigboje Aig-Imoukhuede Group Managing Director/ Chief Executive Officer
Mr Herbert Wigwe Group Deputy Managing Director
Mr Taukeme Edwin Koroye Executive Director
Mr Okey Nwuke Executive Director
Mr Obeahon Ohiwerei Executive Director
Mr Ebenezer Olufowose Executive Director
Mr Victor Etuokwu Executive Director
* Retired 18 December, 2012.
In line with best practice, there is separation of powers between the Chairman and Group Managing Director. The effectiveness of the Board derives from the diverse range of skills and competencies of the Executive and Non-Executive Directors who have exceptional banking, financial and broader entrepreneurial experience.
The Board is responsible for ensuring the creation and delivery of sustainable value to the Bank’s stakeholders through its management of the Bank’s business. The Board is accountable to shareholders and is responsible for the management of the Bank’s relationship with its various stakeholders. The Board ensures that the activities of the Bank at all times are executed within the relevant regulatory framework. The Board Charter comprises a set of principles that have been adopted by the Board as a definitive statement of corporate governance. Matters reserved for the Board include but are not limited to:
•Defining the Bank’s business strategy and objectives;•Formulating risk policies;•Approval of quarterly, half-yearly and full-year
financial statements;•Approval of significant changes in accounting policies
and practices; •Appointment or removal of Directors and Company Secretary;•Approval of major acquisitions, divestments of operating
companies, disposal of capital assets or capital expenditure;•Approval of terms of reference and membership of
Board Committee;•Setting of annual Board objectives and goals;•Approval of allotment of shares; •Approval of remuneration of auditors and recommendation
for appointment or removal of auditors; •Succession planning for key positions; •Approval of the Group strategy, medium-term and
short-term plans;•Approval of the framework for determining the policy and
specific remuneration of Executive Directors; •Monitoring delivery of the Group’s strategy and performance
against plan;•Review and monitoring of the performance of the Group
Managing Director and the executive team;•Ensuring the maintenance of ethical standards and
compliance with relevant laws;•Performance appraisal and compensation of Board members
and senior executives; •Ensuring effective communication with shareholders;•Ensuring the integrity of financial reports.
Appointment process, induction and training of Board members The Board regularly reviews the Group’s nomination and appointment policy to ensure its continued alignment with applicable legislation and regulations. In this regard, the Board in 2012 approved the Fit and Proper Person Policy, designed to ensure that the Group is managed and overseen by competent, capable and trustworthy individuals. This is achieved by ensuring that all persons who are appointed as Directors are fit and proper persons to discharge both their individual and collective responsibilities. In making any appointment, the Board takes into account the knowledge, skill and experience of a potential Director, as well as other attributes considered necessary for the role. The Board also considers the need for appropriate demographic and gender representation. Candidates are subjected to appropriate enquiries to verify that they meet the requirements of the Bank’s Fit and Proper Person Policy.
Corporate Governance For the year ended 31 December, 2012
continued
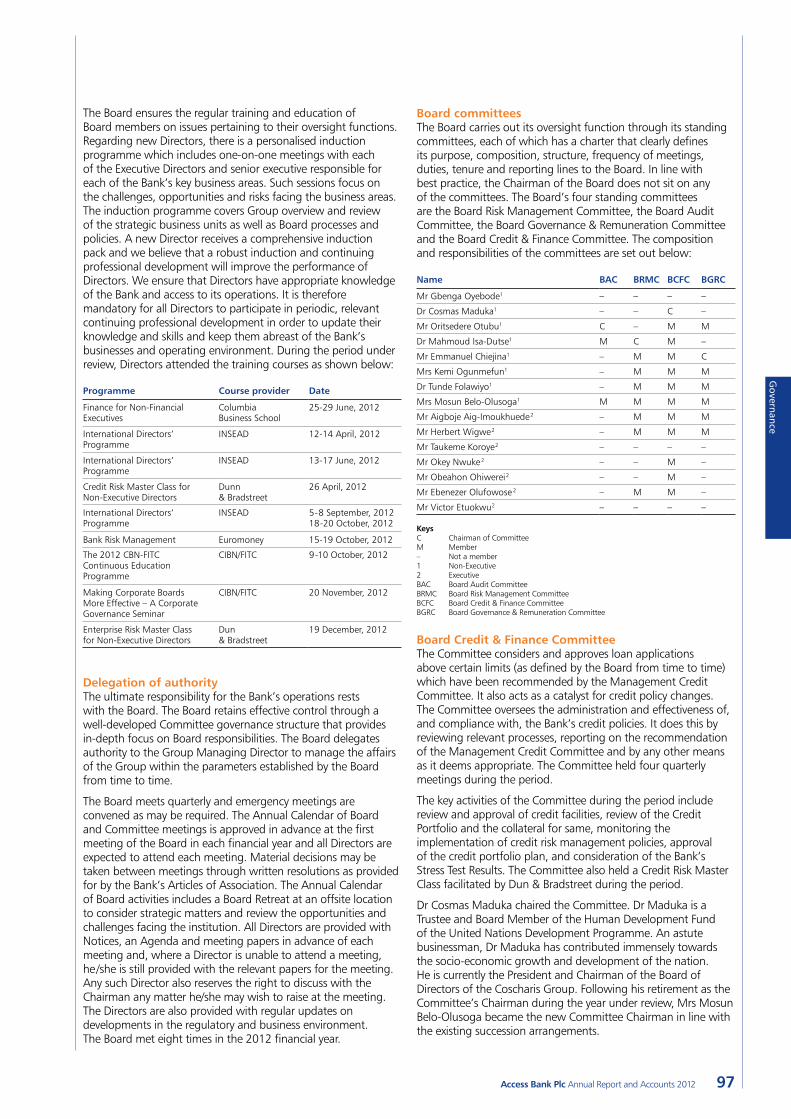
Governance
97Access Bank Plc Annual Report and Accounts 2012
Board committeesThe Board carries out its oversight function through its standing committees, each of which has a charter that clearly defines its purpose, composition, structure, frequency of meetings, duties, tenure and reporting lines to the Board. In line with best practice, the Chairman of the Board does not sit on any of the committees. The Board’s four standing committees are the Board Risk Management Committee, the Board Audit Committee, the Board Governance & Remuneration Committee and the Board Credit & Finance Committee. The composition and responsibilities of the committees are set out below:
Name BAC BRMC BCFC BGRC
Mr Gbenga Oyebode1 – – – –
Dr Cosmas Maduka1 – – C –
Mr Oritsedere Otubu1 C – M M
Dr Mahmoud Isa-Dutse1 M C M –
Mr Emmanuel Chiejina1 – M M C
Mrs Kemi Ogunmefun1 – M M M
Dr Tunde Folawiyo1 – M M M
Mrs Mosun Belo-Olusoga1 M M M M
Mr Aigboje Aig-Imoukhuede2 – M M M
Mr Herbert Wigwe2 – M M M
Mr Taukeme Koroye2 – – – –
Mr Okey Nwuke2 – – M –
Mr Obeahon Ohiwerei2 – – M –
Mr Ebenezer Olufowose 2 – M M –
Mr Victor Etuokwu2 – – – –
Keys C Chairman of Committee M Member – Not a member 1 Non-Executive 2 Executive BAC Board Audit Committee BRMC Board Risk Management Committee BCFC Board Credit & Finance Committee BGRC Board Governance & Remuneration Committee
Board Credit & Finance CommitteeThe Committee considers and approves loan applications above certain limits (as defined by the Board from time to time) which have been recommended by the Management Credit Committee. It also acts as a catalyst for credit policy changes. The Committee oversees the administration and effectiveness of, and compliance with, the Bank’s credit policies. It does this by reviewing relevant processes, reporting on the recommendation of the Management Credit Committee and by any other means as it deems appropriate. The Committee held four quarterly meetings during the period.
The key activities of the Committee during the period include review and approval of credit facilities, review of the Credit Portfolio and the collateral for same, monitoring the implementation of credit risk management policies, approval of the credit portfolio plan, and consideration of the Bank’s Stress Test Results. The Committee also held a Credit Risk Master Class facilitated by Dun & Bradstreet during the period.
Dr Cosmas Maduka chaired the Committee. Dr Maduka is a Trustee and Board Member of the Human Development Fund of the United Nations Development Programme. An astute businessman, Dr Maduka has contributed immensely towards the socio-economic growth and development of the nation. He is currently the President and Chairman of the Board of Directors of the Coscharis Group. Following his retirement as the Committee’s Chairman during the year under review, Mrs Mosun Belo-Olusoga became the new Committee Chairman in line with the existing succession arrangements.
The Board ensures the regular training and education of Board members on issues pertaining to their oversight functions. Regarding new Directors, there is a personalised induction programme which includes one-on-one meetings with each of the Executive Directors and senior executive responsible for each of the Bank’s key business areas. Such sessions focus on the challenges, opportunities and risks facing the business areas. The induction programme covers Group overview and review of the strategic business units as well as Board processes and policies. A new Director receives a comprehensive induction pack and we believe that a robust induction and continuing professional development will improve the performance of Directors. We ensure that Directors have appropriate knowledge of the Bank and access to its operations. It is therefore mandatory for all Directors to participate in periodic, relevant continuing professional development in order to update their knowledge and skills and keep them abreast of the Bank’s businesses and operating environment. During the period under review, Directors attended the training courses as shown below:
Programme Course provider Date
Finance for Non-Financial Executives
Columbia Business School
25-29 June, 2012
International Directors’ Programme
INSEAD 12-14 April, 2012
International Directors’ Programme
INSEAD 13-17 June, 2012
Credit Risk Master Class for Non-Executive Directors
Dunn & Bradstreet
26 April, 2012
International Directors’ Programme
INSEAD 5-8 September, 2012 18-20 October, 2012
Bank Risk Management Euromoney 15-19 October, 2012
The 2012 CBN-FITC Continuous Education Programme
CIBN/FITC 9-10 October, 2012
Making Corporate Boards More Effective – A Corporate Governance Seminar
CIBN/FITC 20 November, 2012
Enterprise Risk Master Class for Non-Executive Directors
Dun & Bradstreet
19 December, 2012
Delegation of authorityThe ultimate responsibility for the Bank’s operations rests with the Board. The Board retains effective control through a well-developed Committee governance structure that provides in-depth focus on Board responsibilities. The Board delegates authority to the Group Managing Director to manage the affairs of the Group within the parameters established by the Board from time to time.
The Board meets quarterly and emergency meetings are convened as may be required. The Annual Calendar of Board and Committee meetings is approved in advance at the first meeting of the Board in each financial year and all Directors are expected to attend each meeting. Material decisions may be taken between meetings through written resolutions as provided for by the Bank’s Articles of Association. The Annual Calendar of Board activities includes a Board Retreat at an offsite location to consider strategic matters and review the opportunities and challenges facing the institution. All Directors are provided with Notices, an Agenda and meeting papers in advance of each meeting and, where a Director is unable to attend a meeting, he/she is still provided with the relevant papers for the meeting. Any such Director also reserves the right to discuss with the Chairman any matter he/she may wish to raise at the meeting. The Directors are also provided with regular updates on developments in the regulatory and business environment. The Board met eight times in the 2012 financial year.
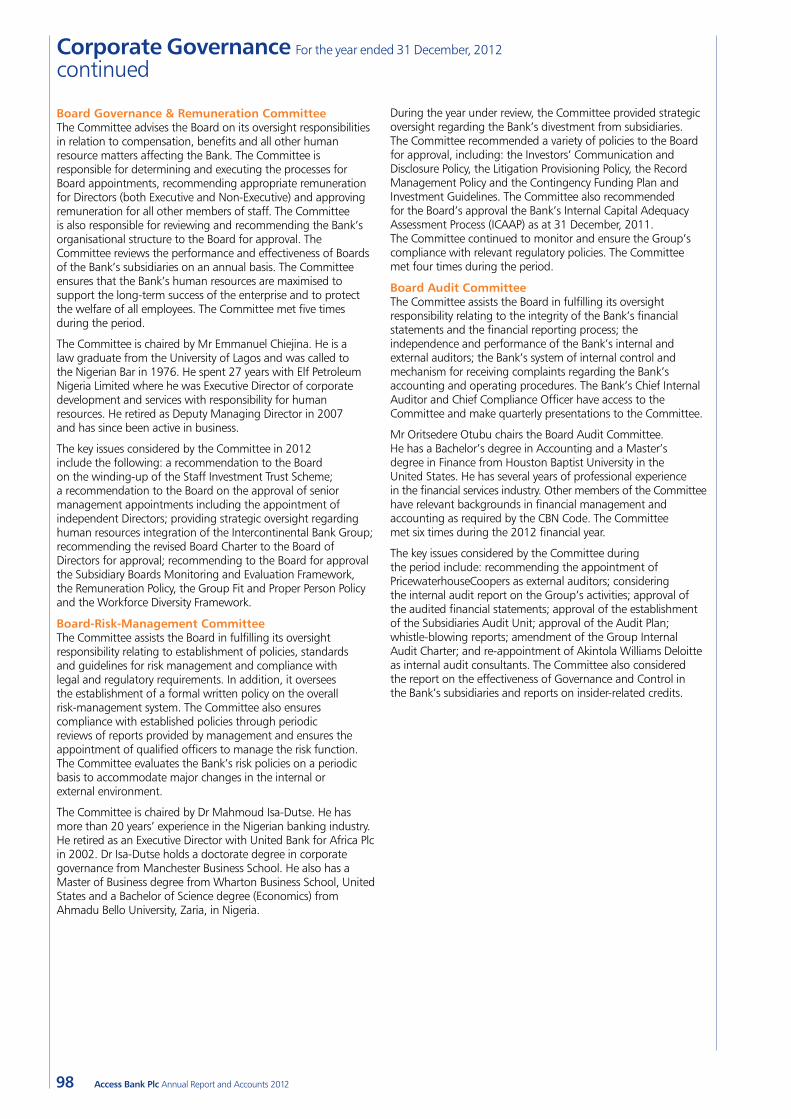
98 Access Bank Plc Annual Report and Accounts 2012
During the year under review, the Committee provided strategic oversight regarding the Bank’s divestment from subsidiaries. The Committee recommended a variety of policies to the Board for approval, including: the Investors’ Communication and Disclosure Policy, the Litigation Provisioning Policy, the Record Management Policy and the Contingency Funding Plan and Investment Guidelines. The Committee also recommended for the Board’s approval the Bank’s Internal Capital Adequacy Assessment Process (ICAAP) as at 31 December, 2011. The Committee continued to monitor and ensure the Group’s compliance with relevant regulatory policies. The Committee met four times during the period.
Board Audit CommitteeThe Committee assists the Board in fulfilling its oversight responsibility relating to the integrity of the Bank’s financial statements and the financial reporting process; the independence and performance of the Bank’s internal and external auditors; the Bank’s system of internal control and mechanism for receiving complaints regarding the Bank’s accounting and operating procedures. The Bank’s Chief Internal Auditor and Chief Compliance Officer have access to the Committee and make quarterly presentations to the Committee.
Mr Oritsedere Otubu chairs the Board Audit Committee. He has a Bachelor’s degree in Accounting and a Master’s degree in Finance from Houston Baptist University in the United States. He has several years of professional experience in the financial services industry. Other members of the Committee have relevant backgrounds in financial management and accounting as required by the CBN Code. The Committee met six times during the 2012 financial year.
The key issues considered by the Committee during the period include: recommending the appointment of PricewaterhouseCoopers as external auditors; considering the internal audit report on the Group’s activities; approval of the audited financial statements; approval of the establishment of the Subsidiaries Audit Unit; approval of the Audit Plan; whistle-blowing reports; amendment of the Group Internal Audit Charter; and re-appointment of Akintola Williams Deloitte as internal audit consultants. The Committee also considered the report on the effectiveness of Governance and Control in the Bank’s subsidiaries and reports on insider-related credits.
Board Governance & Remuneration CommitteeThe Committee advises the Board on its oversight responsibilities in relation to compensation, benefits and all other human resource matters affecting the Bank. The Committee is responsible for determining and executing the processes for Board appointments, recommending appropriate remuneration for Directors (both Executive and Non-Executive) and approving remuneration for all other members of staff. The Committee is also responsible for reviewing and recommending the Bank’s organisational structure to the Board for approval. The Committee reviews the performance and effectiveness of Boards of the Bank’s subsidiaries on an annual basis. The Committee ensures that the Bank’s human resources are maximised to support the long-term success of the enterprise and to protect the welfare of all employees. The Committee met five times during the period.
The Committee is chaired by Mr Emmanuel Chiejina. He is a law graduate from the University of Lagos and was called to the Nigerian Bar in 1976. He spent 27 years with Elf Petroleum Nigeria Limited where he was Executive Director of corporate development and services with responsibility for human resources. He retired as Deputy Managing Director in 2007 and has since been active in business.
The key issues considered by the Committee in 2012 include the following: a recommendation to the Board on the winding-up of the Staff Investment Trust Scheme; a recommendation to the Board on the approval of senior management appointments including the appointment of independent Directors; providing strategic oversight regarding human resources integration of the Intercontinental Bank Group; recommending the revised Board Charter to the Board of Directors for approval; recommending to the Board for approval the Subsidiary Boards Monitoring and Evaluation Framework, the Remuneration Policy, the Group Fit and Proper Person Policy and the Workforce Diversity Framework.
Board-Risk-Management CommitteeThe Committee assists the Board in fulfilling its oversight responsibility relating to establishment of policies, standards and guidelines for risk management and compliance with legal and regulatory requirements. In addition, it oversees the establishment of a formal written policy on the overall risk-management system. The Committee also ensures compliance with established policies through periodic reviews of reports provided by management and ensures the appointment of qualified officers to manage the risk function. The Committee evaluates the Bank’s risk policies on a periodic basis to accommodate major changes in the internal or external environment.
The Committee is chaired by Dr Mahmoud Isa-Dutse. He has more than 20 years’ experience in the Nigerian banking industry. He retired as an Executive Director with United Bank for Africa Plc in 2002. Dr Isa-Dutse holds a doctorate degree in corporate governance from Manchester Business School. He also has a Master of Business degree from Wharton Business School, United States and a Bachelor of Science degree (Economics) from Ahmadu Bello University, Zaria, in Nigeria.
Corporate Governance For the year ended 31 December, 2012
continued
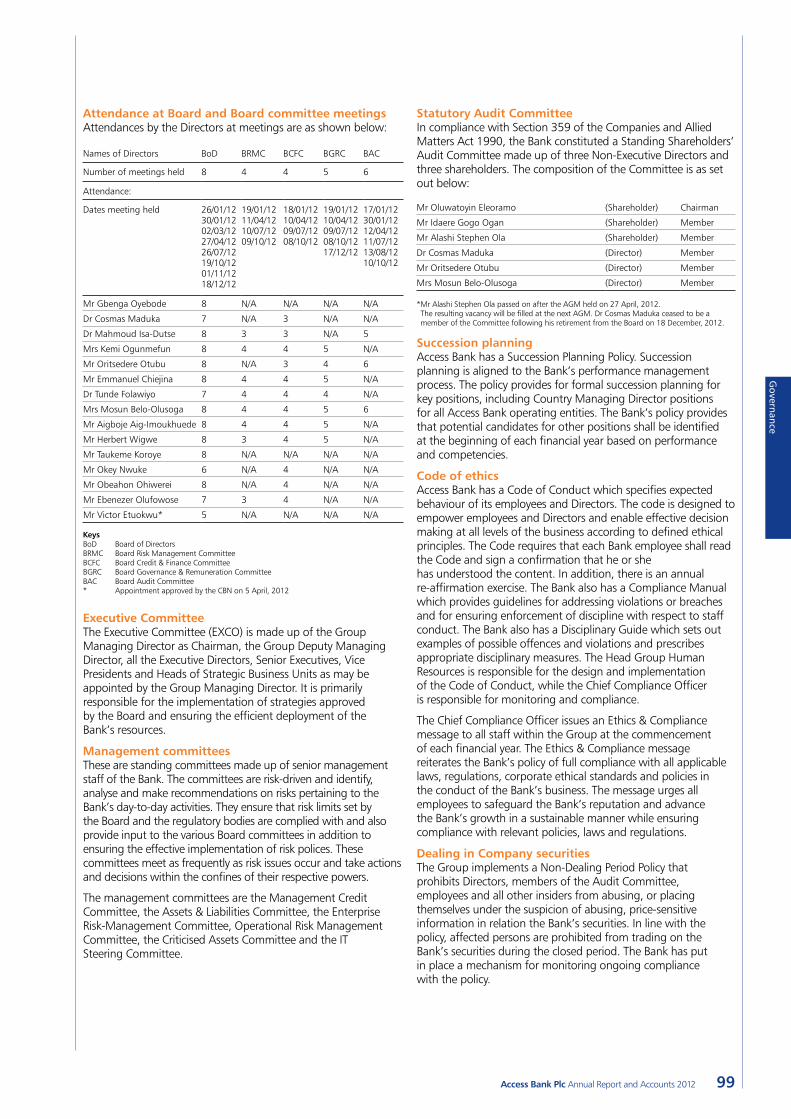
Governance
99Access Bank Plc Annual Report and Accounts 2012
Statutory Audit CommitteeIn compliance with Section 359 of the Companies and Allied Matters Act 1990, the Bank constituted a Standing Shareholders’ Audit Committee made up of three Non-Executive Directors and three shareholders. The composition of the Committee is as set out below:
Mr Oluwatoyin Eleoramo (Shareholder) Chairman
Mr Idaere Gogo Ogan (Shareholder) Member
Mr Alashi Stephen Ola (Shareholder) Member
Dr Cosmas Maduka (Director) Member
Mr Oritsedere Otubu (Director) Member
Mrs Mosun Belo-Olusoga (Director) Member
* Mr Alashi Stephen Ola passed on after the AGM held on 27 April, 2012. The resulting vacancy will be filled at the next AGM. Dr Cosmas Maduka ceased to be a member of the Committee following his retirement from the Board on 18 December, 2012.
Succession planningAccess Bank has a Succession Planning Policy. Succession planning is aligned to the Bank’s performance management process. The policy provides for formal succession planning for key positions, including Country Managing Director positions for all Access Bank operating entities. The Bank’s policy provides that potential candidates for other positions shall be identified at the beginning of each financial year based on performance and competencies.
Code of ethicsAccess Bank has a Code of Conduct which specifies expected behaviour of its employees and Directors. The code is designed to empower employees and Directors and enable effective decision making at all levels of the business according to defined ethical principles. The Code requires that each Bank employee shall read the Code and sign a confirmation that he or she has understood the content. In addition, there is an annual re-affirmation exercise. The Bank also has a Compliance Manual which provides guidelines for addressing violations or breaches and for ensuring enforcement of discipline with respect to staff conduct. The Bank also has a Disciplinary Guide which sets out examples of possible offences and violations and prescribes appropriate disciplinary measures. The Head Group Human Resources is responsible for the design and implementation of the Code of Conduct, while the Chief Compliance Officer is responsible for monitoring and compliance.
The Chief Compliance Officer issues an Ethics & Compliance message to all staff within the Group at the commencement of each financial year. The Ethics & Compliance message reiterates the Bank’s policy of full compliance with all applicable laws, regulations, corporate ethical standards and policies in the conduct of the Bank’s business. The message urges all employees to safeguard the Bank’s reputation and advance the Bank’s growth in a sustainable manner while ensuring compliance with relevant policies, laws and regulations.
Dealing in Company securitiesThe Group implements a Non-Dealing Period Policy that prohibits Directors, members of the Audit Committee, employees and all other insiders from abusing, or placing themselves under the suspicion of abusing, price-sensitive information in relation the Bank’s securities. In line with the policy, affected persons are prohibited from trading on the Bank’s securities during the closed period. The Bank has put in place a mechanism for monitoring ongoing compliance with the policy.
Attendance at Board and Board committee meetingsAttendances by the Directors at meetings are as shown below:
Names of Directors BoD BRMC BCFC BGRC BAC
Number of meetings held 8 4 4 5 6
Attendance:
Dates meeting held 26/01/1230/01/1202/03/1227/04/1226/07/1219/10/1201/11/1218/12/12
19/01/1211/04/1210/07/1209/10/12
18/01/1210/04/1209/07/1208/10/12
19/01/1210/04/1209/07/1208/10/1217/12/12
17/01/1230/01/1212/04/1211/07/1213/08/1210/10/12
Mr Gbenga Oyebode 8 N/A N/A N/A N/A
Dr Cosmas Maduka 7 N/A 3 N/A N/A
Dr Mahmoud Isa-Dutse 8 3 3 N/A 5
Mrs Kemi Ogunmefun 8 4 4 5 N/A
Mr Oritsedere Otubu 8 N/A 3 4 6
Mr Emmanuel Chiejina 8 4 4 5 N/A
Dr Tunde Folawiyo 7 4 4 4 N/A
Mrs Mosun Belo-Olusoga 8 4 4 5 6
Mr Aigboje Aig-Imoukhuede 8 4 4 5 N/A
Mr Herbert Wigwe 8 3 4 5 N/A
Mr Taukeme Koroye 8 N/A N/A N/A N/A
Mr Okey Nwuke 6 N/A 4 N/A N/A
Mr Obeahon Ohiwerei 8 N/A 4 N/A N/A
Mr Ebenezer Olufowose 7 3 4 N/A N/A
Mr Victor Etuokwu* 5 N/A N/A N/A N/A
Keys BoD Board of Directors BRMC Board Risk Management Committee BCFC Board Credit & Finance Committee BGRC Board Governance & Remuneration Committee BAC Board Audit Committee * Appointment approved by the CBN on 5 April, 2012
Executive CommitteeThe Executive Committee (EXCO) is made up of the Group Managing Director as Chairman, the Group Deputy Managing Director, all the Executive Directors, Senior Executives, Vice Presidents and Heads of Strategic Business Units as may be appointed by the Group Managing Director. It is primarily responsible for the implementation of strategies approved by the Board and ensuring the efficient deployment of the Bank’s resources.
Management committeesThese are standing committees made up of senior management staff of the Bank. The committees are risk-driven and identify, analyse and make recommendations on risks pertaining to the Bank’s day-to-day activities. They ensure that risk limits set by the Board and the regulatory bodies are complied with and also provide input to the various Board committees in addition to ensuring the effective implementation of risk polices. These committees meet as frequently as risk issues occur and take actions and decisions within the confines of their respective powers.
The management committees are the Management Credit Committee, the Assets & Liabilities Committee, the Enterprise Risk-Management Committee, Operational Risk Management Committee, the Criticised Assets Committee and the IT Steering Committee.
100 Access Bank Plc Annual Report and Accounts 2012
The Bank’s long-term incentive programme rewards Senior and executive officers for loyal service to the Bank exceeding 10 years. This is to ensure that executives share in the Bank’s success and focus on the Bank’s long-term success. The justification for a long-term incentive plan for senior and executive management is compelling, given recent industry developments. The stability, loyalty and commitment of senior and executive management need to be strengthened by a long-term retirement benefit. Therefore, in addition to statutory pension arrangements, the Bank has put in place a long-term incentive plan for senior and executive management employees.
Whistle-blowing procedureAccess Bank has a whistle-blowing policy which facilitates reporting of suspected breaches of the Bank’s internal policies, laws and regulations. The Bank has also designated a special email address and telephone hotline for whistle-blowing.
The Bank’s website also provides an avenue for lodging whistle-blower reports. Individuals who wish to report a suspected breach can click on the Customer Service link on the site, scroll down to the whistle-blower column, and then register – anonymously or otherwise – any allegations they want the Bank to investigate.
The Bank’s Chief Compliance Officer (CCO) is responsible for monitoring and reporting on whistle-blowing. Quarterly reports are rendered to the Board Audit Committee.
The Company SecretaryThe Company Secretary has the primary duty of assisting the Board and Management in developing and implementing good corporate governance standards. The Company Secretary ensures that there is timely and appropriate information dissemination within and to the Board, and is responsible for designing and implementing the induction programme for new Directors as well as the Directors’ annual training curriculum.
Customer complaints and resolutionThe Bank complies with the provision of the CBN Circular FPR/DIR/CIR/GEN/01/020 dated 16 August, 2011 regarding handling of consumer complaints.
Statement of Compliance The Bank is public limited liability and is therefore subject to the jurisdiction of the SEC Code as well as the CBN Code. In the event of any conflict between the provisions of the two codes regarding any matter, the Bank will defer to the provisions of the CBN Code as its primary regulator.
Regarding the minimum number of independent directors, the Bank complied with SEC Code which requires a minimum of one independent director but is yet to comply with the CBN Code that requires two independent Directors.
Remuneration statement The Report on Directors’ remuneration is as set out on page 150 of this Annual Report. The Group has established clear policy guidelines for the determination and administration of compensation. In line with the policy guidelines, the Bank seeks to attract and retain the best talent in the countries in which it operates. To achieve this, the Group seeks to position itself among the best companies in its industry, in terms of performance and employee rewards, in every market in which it operates. This principle will act as a general guide for the determination of compensation in each country. The objective of the policy is to ensure that the Bank’s salary structure, including short- and long-term incentives motivate sustained high performance and are linked to corporate performance. It is also designed to ensure that stakeholders are able to make a reasonable assessment of the Bank’s reward practices. It is the Group’s policy to fully comply with all local tax policies in the countries in which it operates.
Operating within the guidelines set by the principles above, compensation for country staff will be approved by the Board of Directors of each subsidiary based on local market conditions and on the requirements of local labour laws. Each subsidiary will therefore be required to conduct annual compensation surveys or obtain compensation statistics in their local markets to arrive at specific compensation structures for the local market. Compensation will be determined annually at the end of the financial year. All structural changes to compensation must be approved by the Group Office.
Total compensation provided to employees will typically include guaranteed and variable portions. The specific proportion of each will be defined at the country level. Guaranteed pay will include base pay and other guaranteed portions, while variable pay may be both performance-based and discretionary.
The Bank has put in place a performance bonus scheme which seeks to attract and retain high-performing employees. Awards to individuals are based on their job level, business unit performance and individual performance. Other determinants of the amount of individual bonus awards include pay levels for each skill set, which may in turn be influenced by the relative lack of a particular skill in a particular location.
The Bank complies fully with the Pension Reform Act regarding the provision of retirement benefits for all employees at all levels. Based on the approval of shareholders, the Bank is currently in the process of establishing an Employee Performance Share Plan which will award the Bank’s shares to its employees, subject to such terms and conditions as the Board of Directors may determine from time to time.
Corporate Governance For the year ended 31 December, 2012
continued
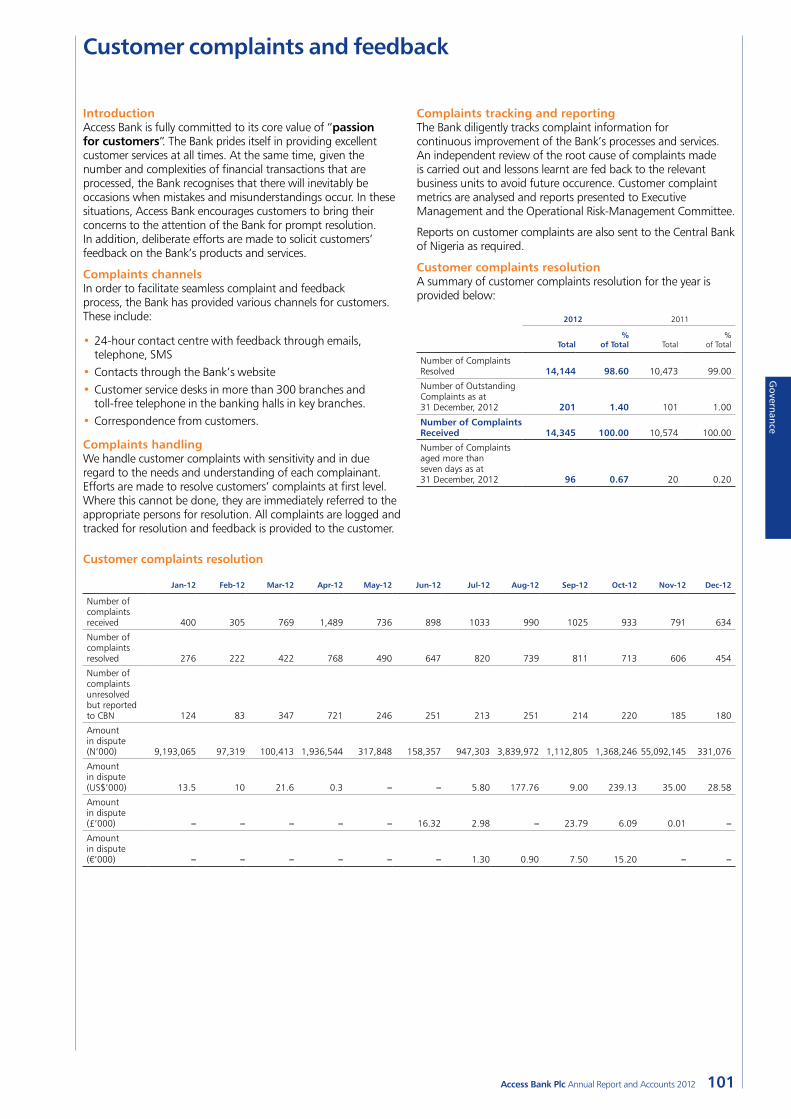
Governance
101Access Bank Plc Annual Report and Accounts 2012
IntroductionAccess Bank is fully committed to its core value of “passion for customers”. The Bank prides itself in providing excellent customer services at all times. At the same time, given the number and complexities of financial transactions that are processed, the Bank recognises that there will inevitably be occasions when mistakes and misunderstandings occur. In these situations, Access Bank encourages customers to bring their concerns to the attention of the Bank for prompt resolution. In addition, deliberate efforts are made to solicit customers’ feedback on the Bank’s products and services.
Complaints channelsIn order to facilitate seamless complaint and feedback process, the Bank has provided various channels for customers. These include:
•24-hour contact centre with feedback through emails, telephone, SMS
•Contacts through the Bank’s website•Customer service desks in more than 300 branches and
toll-free telephone in the banking halls in key branches.•Correspondence from customers.
Complaints handlingWe handle customer complaints with sensitivity and in due regard to the needs and understanding of each complainant. Efforts are made to resolve customers’ complaints at first level. Where this cannot be done, they are immediately referred to the appropriate persons for resolution. All complaints are logged and tracked for resolution and feedback is provided to the customer.
Complaints tracking and reportingThe Bank diligently tracks complaint information for continuous improvement of the Bank’s processes and services. An independent review of the root cause of complaints made is carried out and lessons learnt are fed back to the relevant business units to avoid future occurence. Customer complaint metrics are analysed and reports presented to Executive Management and the Operational Risk-Management Committee.
Reports on customer complaints are also sent to the Central Bank of Nigeria as required.
Customer complaints resolutionA summary of customer complaints resolution for the year is provided below:
2012 2011
Total%
of Total Total%
of Total
Number of Complaints Resolved 14,144 98.60 10,473 99.00
Number of Outstanding Complaints as at 31 December, 2012 201 1.40 101 1.00
Number of Complaints Received 14,345 100.00 10,574 100.00
Number of Complaints aged more than seven days as at 31 December, 2012 96 0.67 20 0.20
Customer complaints and feedback
Customer complaints resolution
Jan-12 Feb-12 Mar-12 Apr-12 May-12 Jun-12 Jul-12 Aug-12 Sep-12 Oct-12 Nov-12 Dec-12
Number of complaints received 400 305 769 1,489 736 898 1033 990 1025 933 791 634
Number of complaints resolved 276 222 422 768 490 647 820 739 811 713 606 454
Number of complaints unresolved but reported to CBN 124 83 347 721 246 251 213 251 214 220 185 180
Amount in dispute (N’000) 9,193,065 97,319 100,413 1,936,544 317,848 158,357 947,303 3,839,972 1,112,805 1,368,246 55,092,145 331,076
Amount in dispute (US$’000) 13.5 10 21.6 0.3 – – 5.80 177.76 9.00 239.13 35.00 28.58
Amount in dispute (£’000) – – – – – 16.32 2.98 – 23.79 6.09 0.01 –
Amount in dispute (€’000) – – – – – – 1.30 0.90 7.50 15.20 – –
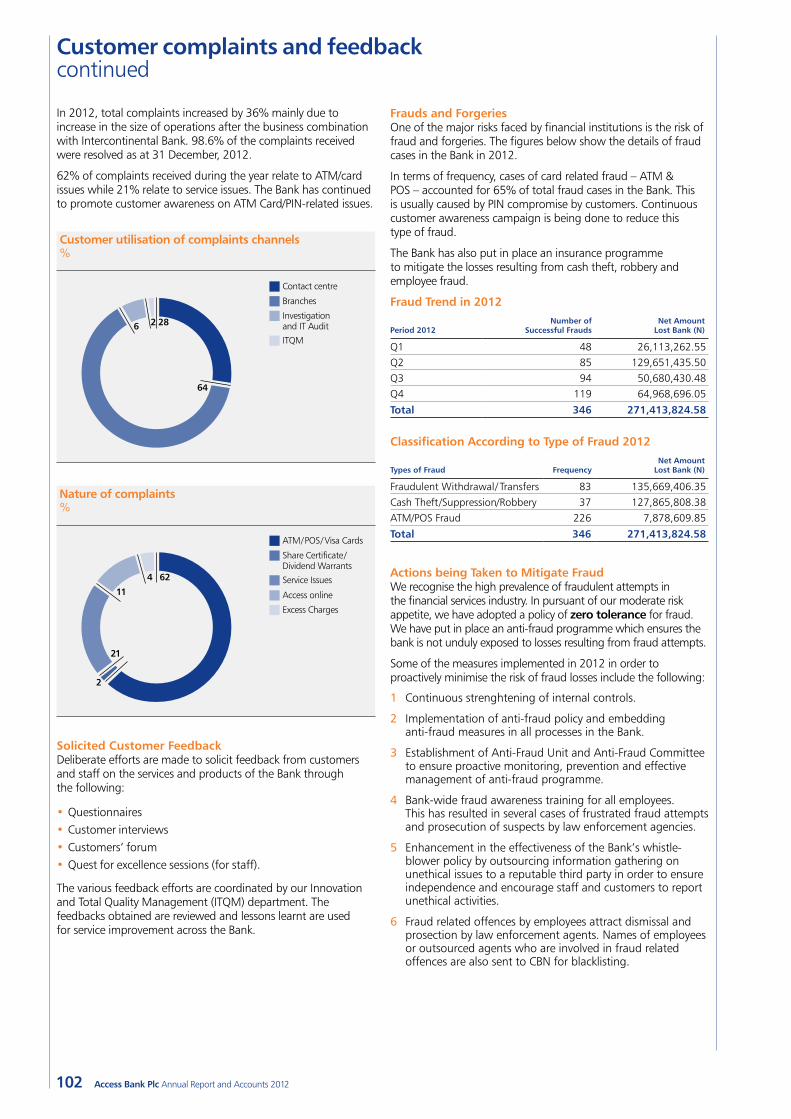
102 Access Bank Plc Annual Report and Accounts 2012
Frauds and Forgeries One of the major risks faced by financial institutions is the risk of fraud and forgeries. The figures below show the details of fraud cases in the Bank in 2012.
In terms of frequency, cases of card related fraud – ATM & POS – accounted for 65% of total fraud cases in the Bank. This is usually caused by PIN compromise by customers. Continuous customer awareness campaign is being done to reduce this type of fraud.
The Bank has also put in place an insurance programme to mitigate the losses resulting from cash theft, robbery and employee fraud.
Fraud Trend in 2012
Period 2012Number of
Successful FraudsNet Amount
Lost Bank (N)
Q1 48 26,113,262.55 Q2 85 129,651,435.50 Q3 94 50,680,430.48 Q4 119 64,968,696.05
Total 346 271,413,824.58
Classification According to Type of Fraud 2012
Types of Fraud FrequencyNet Amount
Lost Bank (N)
Fraudulent Withdrawal/ Transfers 83 135,669,406.35Cash Theft /Suppression/Robbery 37 127,865,808.38 ATM/POS Fraud 226 7,878,609.85
Total 346 271,413,824.58
Actions being Taken to Mitigate Fraud We recognise the high prevalence of fraudulent attempts in the financial services industry. In pursuant of our moderate risk appetite, we have adopted a policy of zero tolerance for fraud. We have put in place an anti-fraud programme which ensures the bank is not unduly exposed to losses resulting from fraud attempts.
Some of the measures implemented in 2012 in order to proactively minimise the risk of fraud losses include the following:
1 Continuous strenghtening of internal controls.
2 Implementation of anti-fraud policy and embedding anti-fraud measures in all processes in the Bank.
3 Establishment of Anti-Fraud Unit and Anti-Fraud Committee to ensure proactive monitoring, prevention and effective management of anti-fraud programme.
4 Bank-wide fraud awareness training for all employees. This has resulted in several cases of frustrated fraud attempts and prosecution of suspects by law enforcement agencies.
5 Enhancement in the effectiveness of the Bank’s whistle- blower policy by outsourcing information gathering on unethical issues to a reputable third party in order to ensure independence and encourage staff and customers to report unethical activities.
6 Fraud related offences by employees attract dismissal and prosection by law enforcement agents. Names of employees or outsourced agents who are involved in fraud related offences are also sent to CBN for blacklisting.
In 2012, total complaints increased by 36% mainly due to increase in the size of operations after the business combination with Intercontinental Bank. 98.6% of the complaints received were resolved as at 31 December, 2012.
62% of complaints received during the year relate to ATM/card issues while 21% relate to service issues. The Bank has continued to promote customer awareness on ATM Card/PIN-related issues.
Customer utilisation of complaints channels
286 2
64
Contact centre
Branches
Investigation and IT Audit
ITQM
%
Nature of complaints
62
11
21
4
2
ATM/POS/Visa Cards
Share Certificate/Dividend Warrants
Service Issues
Access online
Excess Charges
%
Solicited Customer FeedbackDeliberate efforts are made to solicit feedback from customers and staff on the services and products of the Bank through the following:
•Questionnaires•Customer interviews•Customers’ forum•Quest for excellence sessions (for staff).
The various feedback efforts are coordinated by our Innovation and Total Quality Management (ITQM) department. The feedbacks obtained are reviewed and lessons learnt are used for service improvement across the Bank.
Customer complaints and feedback continued
103Access Bank Plc Annual Report and Accounts 2012
Financial Statements
To the members of Access Bank Plc
We have audited the accompanying financial statements of Access Bank (“the Bank”) and its subsidiary companies (together “the Group”), which comprise the statements of financial position as at 31 December, 2012, and the statements of comprehensive income, statements of changes in equity, statements of cash flows and a summary of significant accounting policies and other explanatory information, as set out on pages 38 to 80 and 106 to 185.
Directors’ responsibility for the Financial StatementsThe Directors are responsible for the preparation of financial statements that give a true and fair view in accordance with International Financial Reporting Standards, in the manner required by the Companies and Allied Matters Act of Nigeria, the Financial Reporting Council of Nigeria Act, 2011, the Banks and Other Financial Institutions Act of Nigeria, and relevant Central Bank of Nigeria circulars, and for such internal control as management determines is necessary to enable the preparation of financial statements that are free from material misstatement, whether due to fraud or error.
Auditor’s responsibilityOur responsibility is to express an opinion on these financial statements based on our audit. We conducted our audit in accordance with International Standards on Auditing. Those standards require that we comply with ethical requirements and plan and perform the audit to obtain reasonable assurance about whether the financial statements are free from material misstatement.
An audit involves performing procedures to obtain audit evidence about the amounts and disclosures in the financial statements. The procedures selected depend on the auditor’s judgement, including the assessment of the risks of material misstatement of the financial statements, whether due to fraud or error. In making those risk assessments, the auditor considers internal control relevant to the entity’s preparation and fair presentation of the financial statements that give a true and fair view in order to design audit procedures that are appropriate in the circumstances, but not for the purpose of expressing an opinion on the effectiveness of the entity’s internal control. An audit also includes evaluating the appropriateness of accounting policies used and the reasonableness of accounting estimates made by management, as well as evaluating the overall presentation of the financial statements.
We believe that the audit evidence we have obtained is sufficient and appropriate to provide a basis for our opinion.
OpinionIn our opinion, these financial statements give a true and fair view of the financial position of Access Bank (“the Bank”) and its subsidiaries (together “the Group”) as at 31 December, 2012, and of the Group and Bank’s financial performance and cash flows for the year then ended in accordance with International Financial Reporting Standards in the manner required by the Companies and Allied Matters Act of Nigeria, the Financial Reporting Council of Nigeria Act, 2011, the Banks and Other Financial Institutions Act of Nigeria, and relevant Central Bank of Nigeria circulars.
Report on Other Legal and Regulatory RequirementsCompliance with the requirements of Schedule 6 of the Companies and Allied Matters Act of NigeriaIn our opinion, proper books of account have been kept by the Bank, so far as appears from our examination of those books and the Bank’s statement of financial position and statement of comprehensive income are in agreement with the books of account.
Compliance with Section 27 (2) of the Banks and Other Financial Institutions Act of Nigeria and Central Bank of Nigeria circular BSD/1/2004i. The Bank paid penalties in respect of contraventions
of the Banks and Other Financial Institutions Act during the year ended 31 December, 2012. Details of these contraventions and penalties paid are as disclosed in Note 55 to the financial statements.
ii. Related party transactions and balances are disclosed in Note 53 to the financial statements in compliance with the Central Bank of Nigeria circular BSD/1/2004.
12 March, 2013 Lagos, Nigeria
FRC/2012/ICAN/00000000428
KPMG
KPMG Tower Bishop Aboyade Cole Street Victoria Island Lagos
Independent Auditor’s Report
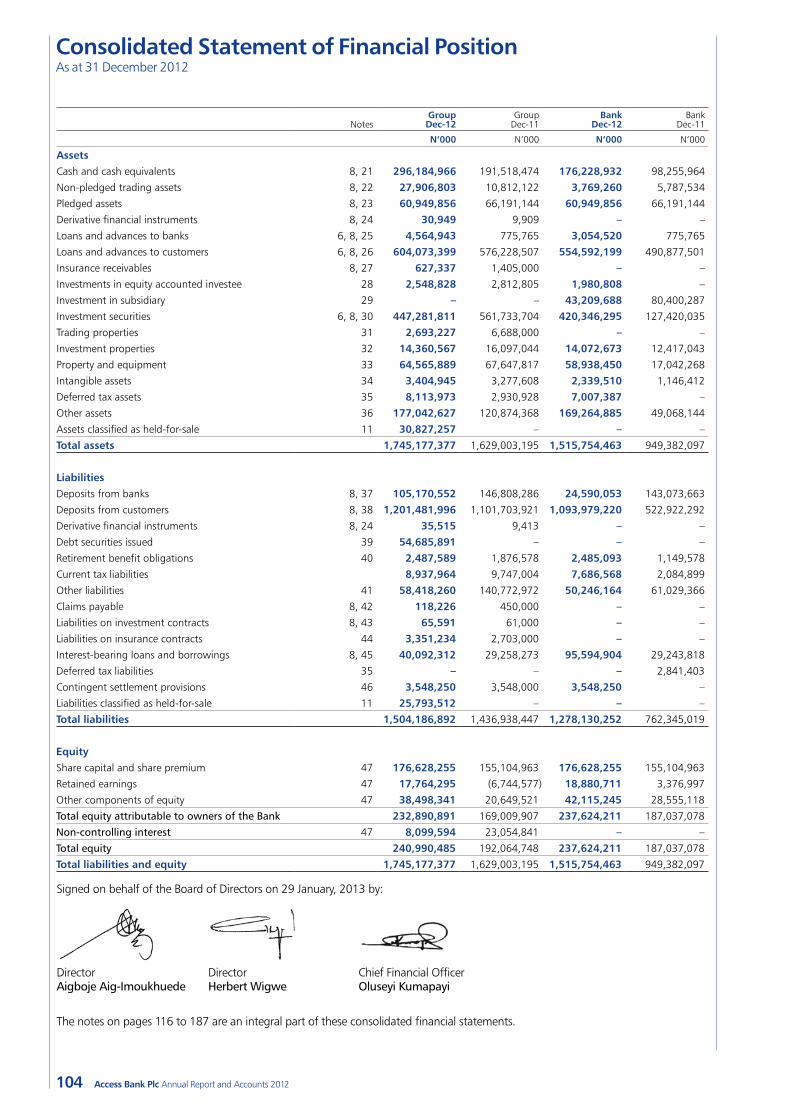
104 Access Bank Plc Annual Report and Accounts 2012
Notes Group Dec-12
Group Dec-11
Bank Dec-12
Bank Dec-11
N’000 N’000 N’000 N’000
AssetsCash and cash equivalents 8, 21 296,184,966 191,518,474 176,228,932 98,255,964
Non-pledged trading assets 8, 22 27,906,803 10,812,122 3,769,260 5,787,534
Pledged assets 8, 23 60,949,856 66,191,144 60,949,856 66,191,144
Derivative financial instruments 8, 24 30,949 9,909 – –
Loans and advances to banks 6, 8, 25 4,564,943 775,765 3,054,520 775,765
Loans and advances to customers 6, 8, 26 604,073,399 576,228,507 554,592,199 490,877,501
Insurance receivables 8, 27 627,337 1,405,000 – –
Investments in equity accounted investee 28 2,548,828 2,812,805 1,980,808 –
Investment in subsidiary 29 – – 43,209,688 80,400,287
Investment securities 6, 8, 30 447,281,811 561,733,704 420,346,295 127,420,035
Trading properties 31 2,693,227 6,688,000 – –
Investment properties 32 14,360,567 16,097,044 14,072,673 12,417,043
Property and equipment 33 64,565,889 67,647,817 58,938,450 17,042,268
Intangible assets 34 3,404,945 3,277,608 2,339,510 1,146,412
Deferred tax assets 35 8,113,973 2,930,928 7,007,387 –
Other assets 36 177,042,627 120,874,368 169,264,885 49,068,144
Assets classified as held-for-sale 11 30,827,257 – – –
Total assets 1,745,177,377 1,629,003,195 1,515,754,463 949,382,097
LiabilitiesDeposits from banks 8, 37 105,170,552 146,808,286 24,590,053 143,073,663
Deposits from customers 8, 38 1,201,481,996 1,101,703,921 1,093,979,220 522,922,292
Derivative financial instruments 8, 24 35,515 9,413 – –
Debt securities issued 39 54,685,891 – – –
Retirement benefit obligations 40 2,487,589 1,876,578 2,485,093 1,149,578
Current tax liabilities 8,937,964 9,747,004 7,686,568 2,084,899
Other liabilities 41 58,418,260 140,772,972 50,246,164 61,029,366
Claims payable 8, 42 118,226 450,000 – –
Liabilities on investment contracts 8, 43 65,591 61,000 – –
Liabilities on insurance contracts 44 3,351,234 2,703,000 – –
Interest-bearing loans and borrowings 8, 45 40,092,312 29,258,273 95,594,904 29,243,818
Deferred tax liabilities 35 – – – 2,841,403
Contingent settlement provisions 46 3,548,250 3,548,000 3,548,250 –
Liabilities classified as held-for-sale 11 25,793,512 – – –
Total liabilities 1,504,186,892 1,436,938,447 1,278,130,252 762,345,019
Equity
Share capital and share premium 47 176,628,255 155,104,963 176,628,255 155,104,963
Retained earnings 47 17,764,295 (6,744,577) 18,880,711 3,376,997
Other components of equity 47 38,498,341 20,649,521 42,115,245 28,555,118
Total equity attributable to owners of the Bank 232,890,891 169,009,907 237,624,211 187,037,078
Non-controlling interest 47 8,099,594 23,054,841 – –
Total equity 240,990,485 192,064,748 237,624,211 187,037,078
Total liabilities and equity 1,745,177,377 1,629,003,195 1,515,754,463 949,382,097
Signed on behalf of the Board of Directors on 29 January, 2013 by:
Director Director Chief Financial Officer Aigboje Aig-Imoukhuede Herbert Wigwe Oluseyi Kumapayi
The notes on pages 116 to 187 are an integral part of these consolidated financial statements.
Consolidated Statement of Financial PositionAs at 31 December 2012
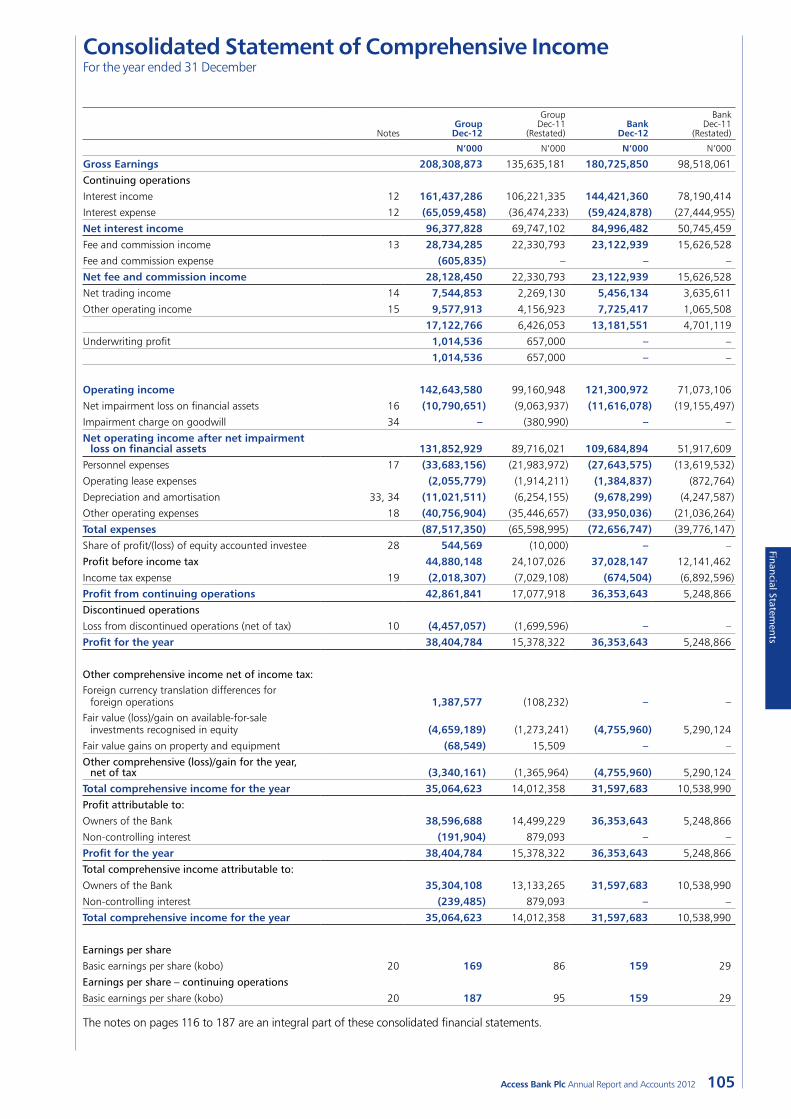
105Access Bank Plc Annual Report and Accounts 2012
Financial Statements
Notes Group Dec-12
Group Dec-11
(Restated) Bank
Dec-12
Bank Dec-11
(Restated)
N’000 N’000 N’000 N’000
Gross Earnings 208,308,873 135,635,181 180,725,850 98,518,061
Continuing operations
Interest income 12 161,437,286 106,221,335 144,421,360 78,190,414
Interest expense 12 (65,059,458) (36,474,233) (59,424,878) (27,444,955)
Net interest income 96,377,828 69,747,102 84,996,482 50,745,459
Fee and commission income 13 28,734,285 22,330,793 23,122,939 15,626,528
Fee and commission expense (605,835) – – –
Net fee and commission income 28,128,450 22,330,793 23,122,939 15,626,528
Net trading income 14 7,544,853 2,269,130 5,456,134 3,635,611
Other operating income 15 9,577,913 4,156,923 7,725,417 1,065,508
17,122,766 6,426,053 13,181,551 4,701,119
Underwriting profit 1,014,536 657,000 – –
1,014,536 657,000 – –
Operating income 142,643,580 99,160,948 121,300,972 71,073,106
Net impairment loss on financial assets 16 (10,790,651) (9,063,937) (11,616,078) (19,155,497)
Impairment charge on goodwill 34 – (380,990) – –
Net operating income after net impairment loss on financial assets 131,852,929 89,716,021 109,684,894 51,917,609
Personnel expenses 17 (33,683,156) (21,983,972) (27,643,575) (13,619,532)
Operating lease expenses (2,055,779) (1,914,211) (1,384,837) (872,764)
Depreciation and amortisation 33, 34 (11,021,511) (6,254,155) (9,678,299) (4,247,587)
Other operating expenses 18 (40,756,904) (35,446,657) (33,950,036) (21,036,264)
Total expenses (87,517,350) (65,598,995) (72,656,747) (39,776,147)
Share of profit/(loss) of equity accounted investee 28 544,569 (10,000) – –
Profit before income tax 44,880,148 24,107,026 37,028,147 12,141,462
Income tax expense 19 (2,018,307) (7,029,108) (674,504) (6,892,596)
Profit from continuing operations 42,861,841 17,077,918 36,353,643 5,248,866
Discontinued operations
Loss from discontinued operations (net of tax) 10 (4,457,057) (1,699,596) – –
Profit for the year 38,404,784 15,378,322 36,353,643 5,248,866
Other comprehensive income net of income tax:Foreign currency translation differences for
foreign operations 1,387,577 (108,232) – –Fair value (loss)/gain on available-for-sale
investments recognised in equity (4,659,189) (1,273,241) (4,755,960) 5,290,124
Fair value gains on property and equipment (68,549) 15,509 – –
Other comprehensive (loss)/gain for the year, net of tax (3,340,161) (1,365,964) (4,755,960) 5,290,124
Total comprehensive income for the year 35,064,623 14,012,358 31,597,683 10,538,990
Profit attributable to:
Owners of the Bank 38,596,688 14,499,229 36,353,643 5,248,866
Non-controlling interest (191,904) 879,093 – –
Profit for the year 38,404,784 15,378,322 36,353,643 5,248,866
Total comprehensive income attributable to:
Owners of the Bank 35,304,108 13,133,265 31,597,683 10,538,990
Non-controlling interest (239,485) 879,093 – –
Total comprehensive income for the year 35,064,623 14,012,358 31,597,683 10,538,990
Earnings per share
Basic earnings per share (kobo) 20 169 86 159 29
Earnings per share – continuing operations
Basic earnings per share (kobo) 20 187 95 159 29
The notes on pages 116 to 187 are an integral part of these consolidated financial statements.
Consolidated Statement of Comprehensive Income For the year ended 31 December
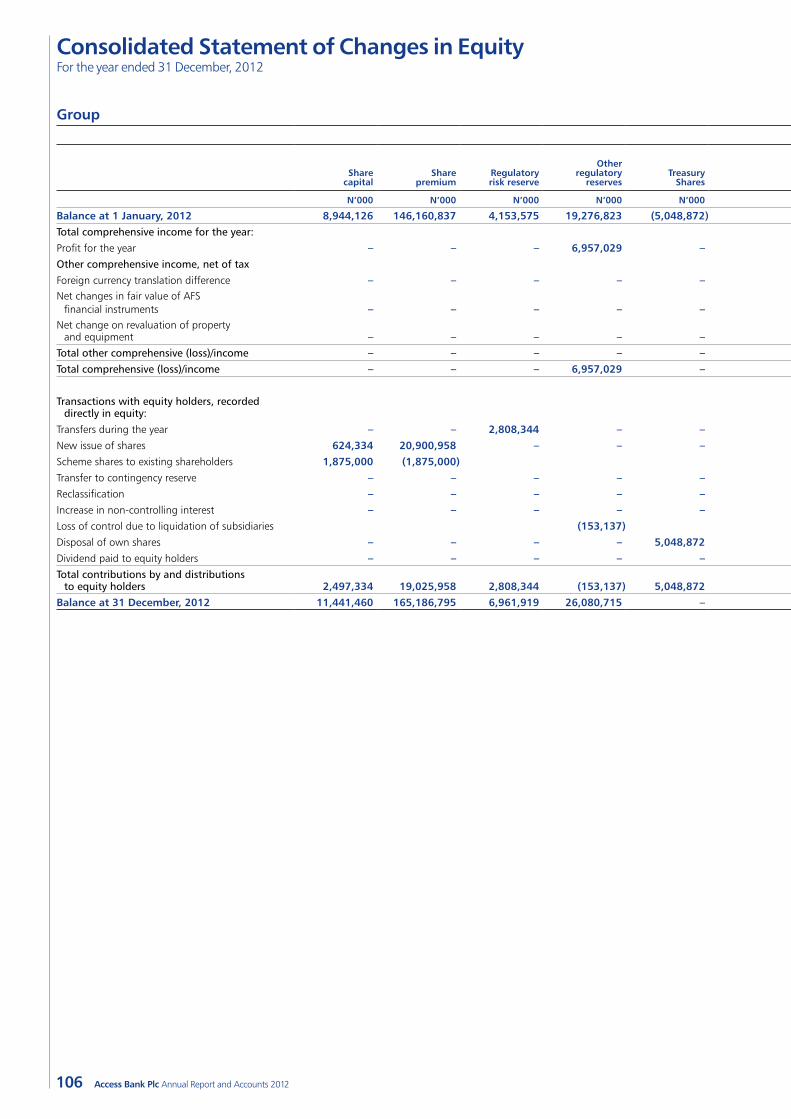
106 Access Bank Plc Annual Report and Accounts 2012
Group Attributable to the equity holders of the Bank
Share capital
Share premium
Regulatory risk reserve
Other regulatory
reserves Treasury
Shares Capital reserve
Fair value reserve
Contingency reserve
Foreign currency
translation reserve
Retained earnings Total
Non-controlling interest
Total equity
N’000 N’000 N’000 N’000 N’000 N’000 N’000 N’000 N’000 N’000 N’000 N’000 N’000
Balance at 1 January, 2012 8,944,126 146,160,837 4,153,575 19,276,823 (5,048,872) 3,489,080 (1,872,471) 586,000 65,385 (6,744,577) 169,009,906 23,054,841 192,064,747 Total comprehensive income for the year:
Profit for the year – – – 6,957,029 – – – – – 31,639,659 38,596,688 (191,904) 38,404,784Other comprehensive income, net of tax
Foreign currency translation difference – – – – – – – – 1,387,577 – 1,387,577 – 1,387,577 Net changes in fair value of AFS
financial instruments – – – – – – (4,659,189) – – – (4,659,189) – (4,659,189) Net change on revaluation of property
and equipment – – – – – – (68,549) – – – (68,549) – (68,549) Total other comprehensive (loss)/income – – – – – – (4,727,738) – 1,387,577 – (3,340,161) – (3,340,161) Total comprehensive (loss)/income – – – 6,957,029 – – (4,727,738) – 1,387,577 31,639,659 35,256,528 (191,904) 35,064,623
Transactions with equity holders, recorded directly in equity:
Transfers during the year – – 2,808,344 – – – – – – (2,808,344) – – –New issue of shares 624,334 20,900,958 – – – – – – – – 21,523,292 (21,523,292) –Scheme shares to existing shareholders 1,875,000 (1,875,000) – – –Transfer to contingency reserve – – – – – – – 64,437 – (64,437) – – –Reclassification – – – – – – 6,563,365 – – – 6,563,365 – 6,563,365 Increase in non-controlling interest – – – – – – – – – – – 5,679,732 5,679,732 Loss of control due to liquidation of subsidiaries (153,137) (99,928) 8,330,533 8,077,468 1,080,217 9,157,685 Disposal of own shares – – – – 5,048,872 – – – – – 5,048,872 – 5,048,872 Dividend paid to equity holders – – – – – – – – – (12,588,539) (12,588,539) – (12,588,539) Total contributions by and distributions
to equity holders 2,497,334 19,025,958 2,808,344 (153,137) 5,048,872 – 6,463,437 64,437 – (7,130,787) 28,624,458 (14,763,343) 13,861,116 Balance at 31 December, 2012 11,441,460 165,186,795 6,961,919 26,080,715 – 3,489,080 (136,772) 650,437 1,452,962 17,764,295 232,890,891 8,099,594 240,990,485
Consolidated Statement of Changes in EquityFor the year ended 31 December, 2012
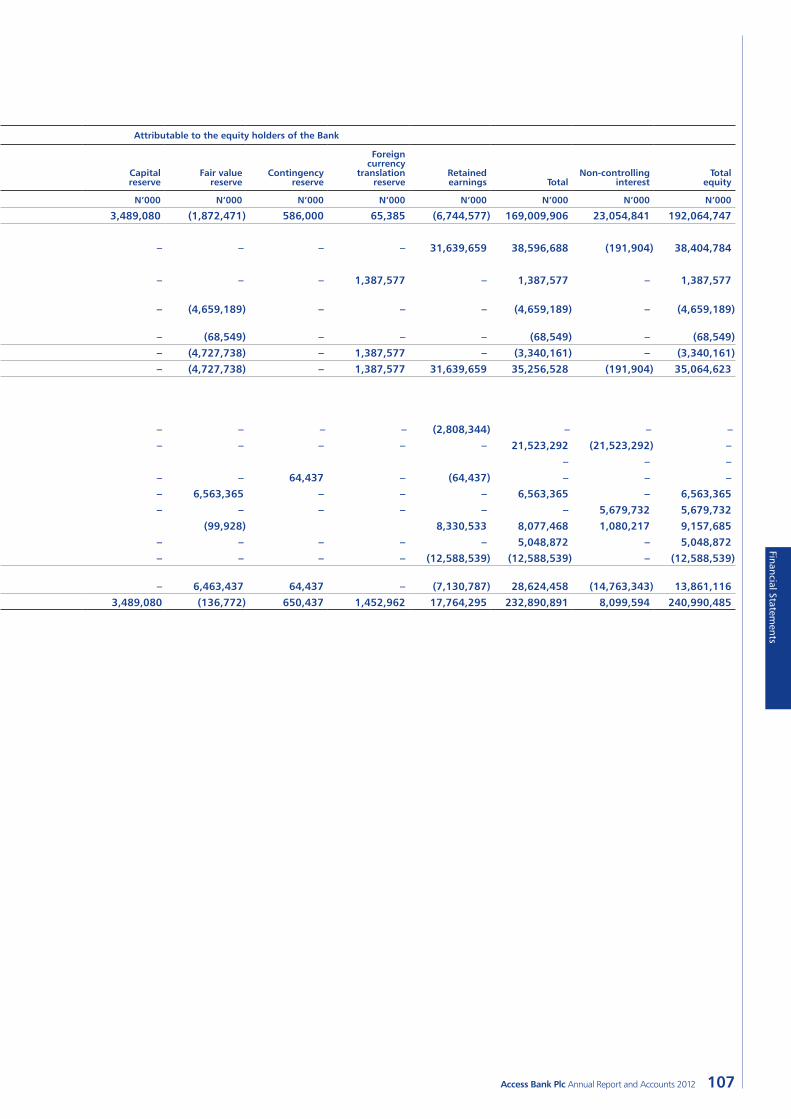
107Access Bank Plc Annual Report and Accounts 2012
Financial Statements
Group Attributable to the equity holders of the Bank
Share capital
Share premium
Regulatory risk reserve
Other regulatory
reserves Treasury
Shares Capital reserve
Fair value reserve
Contingency reserve
Foreign currency
translation reserve
Retained earnings Total
Non-controlling interest
Total equity
N’000 N’000 N’000 N’000 N’000 N’000 N’000 N’000 N’000 N’000 N’000 N’000 N’000
Balance at 1 January, 2012 8,944,126 146,160,837 4,153,575 19,276,823 (5,048,872) 3,489,080 (1,872,471) 586,000 65,385 (6,744,577) 169,009,906 23,054,841 192,064,747 Total comprehensive income for the year:
Profit for the year – – – 6,957,029 – – – – – 31,639,659 38,596,688 (191,904) 38,404,784Other comprehensive income, net of tax
Foreign currency translation difference – – – – – – – – 1,387,577 – 1,387,577 – 1,387,577 Net changes in fair value of AFS
financial instruments – – – – – – (4,659,189) – – – (4,659,189) – (4,659,189) Net change on revaluation of property
and equipment – – – – – – (68,549) – – – (68,549) – (68,549) Total other comprehensive (loss)/income – – – – – – (4,727,738) – 1,387,577 – (3,340,161) – (3,340,161) Total comprehensive (loss)/income – – – 6,957,029 – – (4,727,738) – 1,387,577 31,639,659 35,256,528 (191,904) 35,064,623
Transactions with equity holders, recorded directly in equity:
Transfers during the year – – 2,808,344 – – – – – – (2,808,344) – – –New issue of shares 624,334 20,900,958 – – – – – – – – 21,523,292 (21,523,292) –Scheme shares to existing shareholders 1,875,000 (1,875,000) – – –Transfer to contingency reserve – – – – – – – 64,437 – (64,437) – – –Reclassification – – – – – – 6,563,365 – – – 6,563,365 – 6,563,365 Increase in non-controlling interest – – – – – – – – – – – 5,679,732 5,679,732 Loss of control due to liquidation of subsidiaries (153,137) (99,928) 8,330,533 8,077,468 1,080,217 9,157,685 Disposal of own shares – – – – 5,048,872 – – – – – 5,048,872 – 5,048,872 Dividend paid to equity holders – – – – – – – – – (12,588,539) (12,588,539) – (12,588,539) Total contributions by and distributions
to equity holders 2,497,334 19,025,958 2,808,344 (153,137) 5,048,872 – 6,463,437 64,437 – (7,130,787) 28,624,458 (14,763,343) 13,861,116 Balance at 31 December, 2012 11,441,460 165,186,795 6,961,919 26,080,715 – 3,489,080 (136,772) 650,437 1,452,962 17,764,295 232,890,891 8,099,594 240,990,485
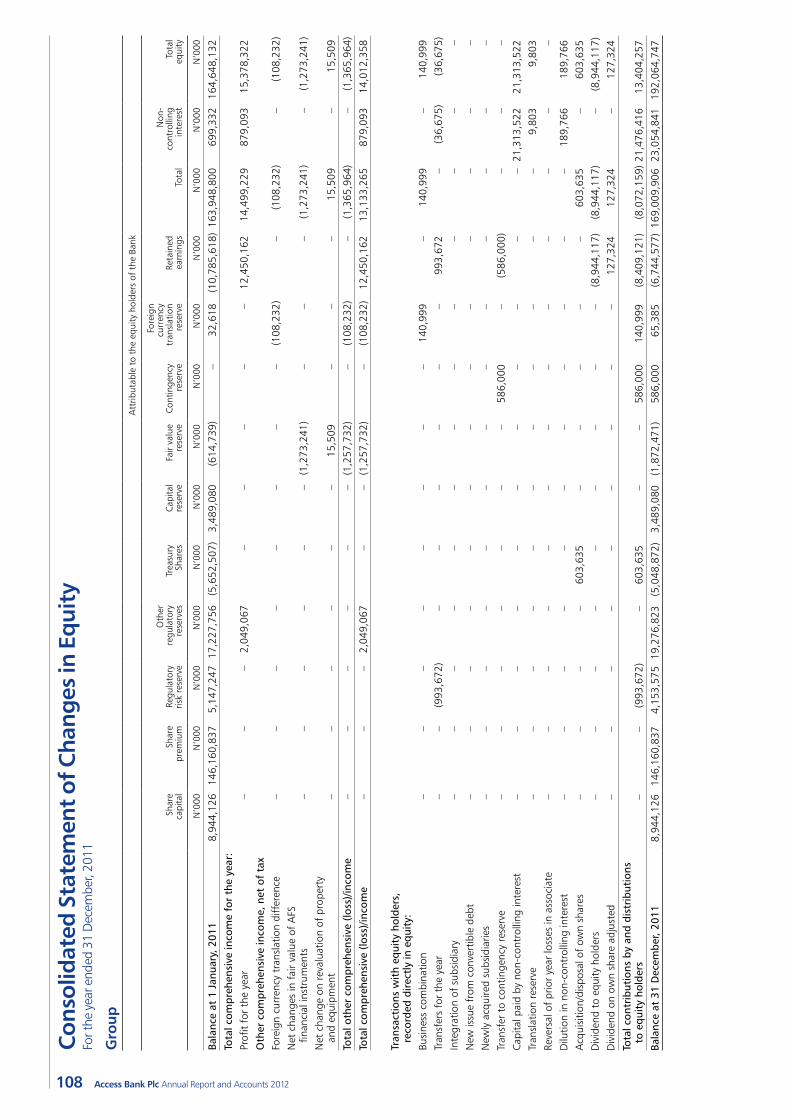
108 Access Bank Plc Annual Report and Accounts 2012
Con
solid
ated
Sta
tem
ent o
f Cha
nges
in E
qui
tyFo
r the
yea
r end
ed 3
1 D
ecem
ber,
2011
Gro
up
A
ttrib
utab
le t
o th
e eq
uity
hol
ders
of
the
Bank
Shar
e
capi
tal
Shar
e
prem
ium
Re
gula
tory
ris
k re
serv
e
Oth
er
regu
lato
ry
rese
rves
Tr
easu
ry
Shar
es
Capi
tal
rese
rve
Fair
valu
e
rese
rve
Cont
inge
ncy
re
serv
e
Fore
ign
curr
ency
tr
ansl
atio
n re
serv
e Re
tain
ed
earn
ings
To
tal
Non
-co
ntro
lling
in
tere
st
Tota
l eq
uity
N’0
00N
’000
N’0
00N
’000
N’0
00N
’000
N’0
00N
’000
N’0
00N
’000
N’0
00N
’000
N’0
00
Bala
nce
at 1
Jan
uary
, 201
1 8,
944,
126
146,
160,
837
5,14
7,24
7 17
,227
,756
(5
,652
,507
) 3,
489,
080
(614
,739
) –
32,6
18
(10,
785,
618)
163
,948
,800
69
9,33
2 16
4,64
8,13
2
Tota
l com
preh
ensi
ve in
com
e fo
r th
e ye
ar:
Profi
t fo
r th
e ye
ar
––
–2,
049,
067
––
––
–12
,450
,162
14
,499
,229
87
9,09
3 15
,378
,322
Oth
er c
ompr
ehen
sive
inco
me,
net
of
tax
Fore
ign
curr
ency
tra
nsla
tion
diff
eren
ce
––
––
––
––
(108
,232
) –
(108
,232
) –
(108
,232
) N
et c
hang
es in
fai
r va
lue
of A
FS
finan
cial
inst
rum
ents
––
––
––
(1,2
73,2
41)
––
–(1
,273
,241
) –
(1,2
73,2
41)
Net
cha
nge
on r
eval
uatio
n of
pro
pert
y
and
equi
pmen
t–
––
––
–15
,509
–
––
15,5
09
–15
,509
Tota
l oth
er c
ompr
ehen
sive
(lo
ss)/i
ncom
e –
––
––
–(1
,257
,732
) –
(108
,232
) –
(1,3
65,9
64)
–(1
,365
,964
)
Tota
l com
preh
ensi
ve (
loss
)/inc
ome
––
–2,
049,
067
––
(1,2
57,7
32)
–(1
08,2
32)
12,4
50,1
62
13,1
33,2
65
879,
093
14,0
12,3
58
Tran
sact
ions
wit
h eq
uity
hol
ders
, re
cord
ed d
irec
tly
in e
quit
y:Bu
sine
ss c
ombi
natio
n–
––
––
––
–14
0,99
9 –
140,
999
–14
0,99
9 Tr
ansf
ers
for
the
year
––
(993
,672
) –
––
––
–99
3,67
2 –
(36,
675)
(3
6,67
5)
Inte
grat
ion
of s
ubsi
diar
y–
––
––
––
––
––
––
New
issu
e fr
om c
onve
rtib
le d
ebt
––
––
––
––
––
––
–N
ewly
acq
uire
d su
bsid
iarie
s–
––
––
––
––
––
––
Tran
sfer
to
cont
inge
ncy
rese
rve
––
––
––
–58
6,00
0 –
(586
,000
) –
––
Capi
tal p
aid
by n
on-c
ontr
ollin
g in
tere
st–
––
––
––
––
––
21,3
13,5
22
21,3
13,5
22
Tran
slat
ion
rese
rve
––
––
––
––
––
–9,
803
9,80
3 Re
vers
al o
f pr
ior
year
loss
es in
ass
ocia
te–
––
––
––
––
––
––
Dilu
tion
in n
on-c
ontr
ollin
g in
tere
st–
––
––
––
––
––
189,
766
189,
766
Acq
uisi
tion/
disp
osal
of
own
shar
es–
––
–60
3,63
5 –
––
––
603,
635
–60
3,63
5 D
ivid
end
to e
quity
hol
ders
––
––
––
––
–(8
,944
,117
) (8
,944
,117
) –
(8,9
44,1
17)
Div
iden
d on
ow
n sh
are
adju
sted
––
––
––
––
–12
7,32
4 12
7,32
4 –
127,
324
Tota
l con
trib
utio
ns b
y an
d di
stri
buti
ons
to
equ
ity
hold
ers
––
(993
,672
) –
603,
635
––
586,
000
140,
999
(8,4
09,1
21)
(8,0
72,1
59)
21,4
76,4
16
13,4
04,2
57
Bala
nce
at 3
1 D
ecem
ber,
2011
8,
944,
126
146,
160,
837
4,15
3,57
5 19
,276
,823
(5
,048
,872
) 3,
489,
080
(1,8
72,4
71)
586,
000
65,3
85
(6,7
44,5
77)
169,
009,
906
23,0
54,8
41
192,
064,
747
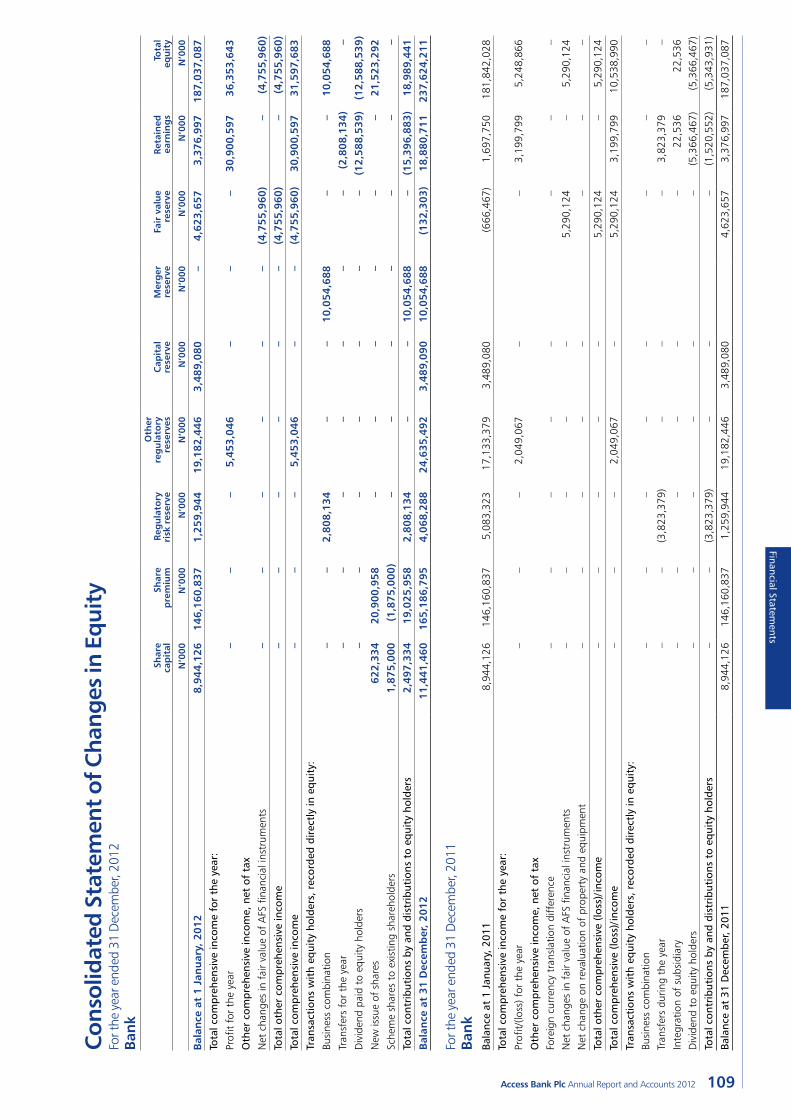
109Access Bank Plc Annual Report and Accounts 2012
Financial Statements
Con
solid
ated
Sta
tem
ent o
f Cha
nges
in E
qui
tyFo
r the
yea
r end
ed 3
1 D
ecem
ber,
2012
Ban
k
Shar
e
cap
ital
Sh
are
p
rem
ium
R
egu
lato
ry
risk
res
erve
Oth
er
reg
ula
tory
re
serv
es
Cap
ital
re
serv
e M
erg
er
rese
rve
Fair
val
ue
re
serv
e R
etai
ned
ea
rnin
gs
Tota
l eq
uit
y
N’0
00N
’000
N’0
00N
’000
N’0
00N
’000
N’0
00N
’000
N’0
00
Bal
ance
at
1 Ja
nu
ary,
201
28,
944,
126
146,
160,
837
1,25
9,94
4 19
,182
,446
3,
489,
080
– 4,
623,
657
3,37
6,99
7 18
7,03
7,08
7 To
tal c
ompr
ehen
sive
inco
me
for
the
year
:
Profi
t fo
r th
e ye
ar–
––
5,45
3,04
6 –
––
30,9
00,5
97
36,3
53,6
43
Oth
er c
ompr
ehen
sive
inco
me,
net
of
tax
Net
cha
nges
in f
air
valu
e of
AFS
fina
ncia
l ins
trum
ents
––
––
––
(4,7
55,9
60)
–(4
,755
,960
) To
tal o
ther
com
preh
ensi
ve in
com
e –
––
––
–(4
,755
,960
) –
(4,7
55,9
60)
Tota
l com
preh
ensi
ve in
com
e–
––
5,45
3,04
6 –
–(4
,755
,960
) 30
,900
,597
31
,597
,683
Tr
ansa
ctio
ns w
ith
equi
ty h
olde
rs, r
ecor
ded
dire
ctly
in e
quit
y:
Busi
ness
com
bina
tion
––
2,80
8,13
4–
– 10
,054
,688
–
–10
,054
,688
Tr
ansf
ers
for
the
year
––
– –
––
–(2
,808
,134
) –
Div
iden
d pa
id t
o eq
uity
hol
ders
––
––
––
–(1
2,58
8,53
9)
(12,
588,
539)
N
ew is
sue
of s
hare
s62
2,33
4 20
,900
,958
–
––
––
–21
,523
,292
Sc
hem
e sh
ares
to
exis
ting
shar
ehol
ders
1,87
5,00
0 (1
,875
,000
) –
––
––
––
Tota
l con
trib
utio
ns b
y an
d di
stri
buti
ons
to e
quit
y ho
lder
s 2,
497,
334
19,0
25,9
58
2,80
8,13
4 –
– 10
,054
,688
–
(15,
396,
883)
18
,989
,441
B
alan
ce a
t 31
Dec
emb
er, 2
012
11,4
41,4
60
165,
186,
795
4,06
8,28
8 24
,635
,492
3,
489,
090
10
,054
,688
(1
32,3
03)
18,8
80,7
11
237,
624,
211
For t
he y
ear e
nded
31
Dec
embe
r, 20
11Ba
nk
Bala
nce
at 1
Jan
uary
, 201
18,
944,
126
146,
160,
837
5,08
3,32
3 17
,133
,379
3,
489,
080
(666
,467
) 1,
697,
750
181,
842,
028
Tota
l com
preh
ensi
ve in
com
e fo
r th
e ye
ar:
Profi
t/(lo
ss) f
or t
he y
ear
––
–2,
049,
067
––
3,19
9,79
9 5,
248,
866
Oth
er c
ompr
ehen
sive
inco
me,
net
of
tax
Fore
ign
curr
ency
tra
nsla
tion
diff
eren
ce–
––
––
––
–N
et c
hang
es in
fai
r va
lue
of A
FS fi
nanc
ial i
nstr
umen
ts
––
––
–5,
290,
124
–5,
290,
124
Net
cha
nge
on r
eval
uatio
n of
pro
pert
y an
d eq
uipm
ent
––
––
––
––
Tota
l oth
er c
ompr
ehen
sive
(lo
ss)/
inco
me
––
––
–5,
290,
124
–5,
290,
124
Tota
l com
preh
ensi
ve (
loss
)/in
com
e–
––
2,04
9,06
7 –
5,29
0,12
4 3,
199,
799
10,5
38,9
90
Tran
sact
ions
wit
h eq
uity
hol
ders
, rec
orde
d di
rect
ly in
equ
ity:
Bu
sine
ss c
ombi
natio
n–
––
––
––
–Tr
ansf
ers
durin
g th
e ye
ar
––
(3,8
23,3
79)
––
–3,
823,
379
–In
tegr
atio
n of
sub
sidi
ary
––
––
––
22,5
36
22,5
36
Div
iden
d to
equ
ity h
olde
rs–
––
––
–(5
,366
,467
) (5
,366
,467
)
Tota
l con
trib
utio
ns b
y an
d di
stri
buti
ons
to e
quit
y ho
lder
s –
–(3
,823
,379
) –
––
(1,5
20,5
52)
(5,3
43,9
31)
Bala
nce
at 3
1 D
ecem
ber,
2011
8,94
4,12
6 14
6,16
0,83
7 1,
259,
944
19,1
82,4
46
3,48
9,08
0 4,
623,
657
3,37
6,99
7 18
7,03
7,08
7
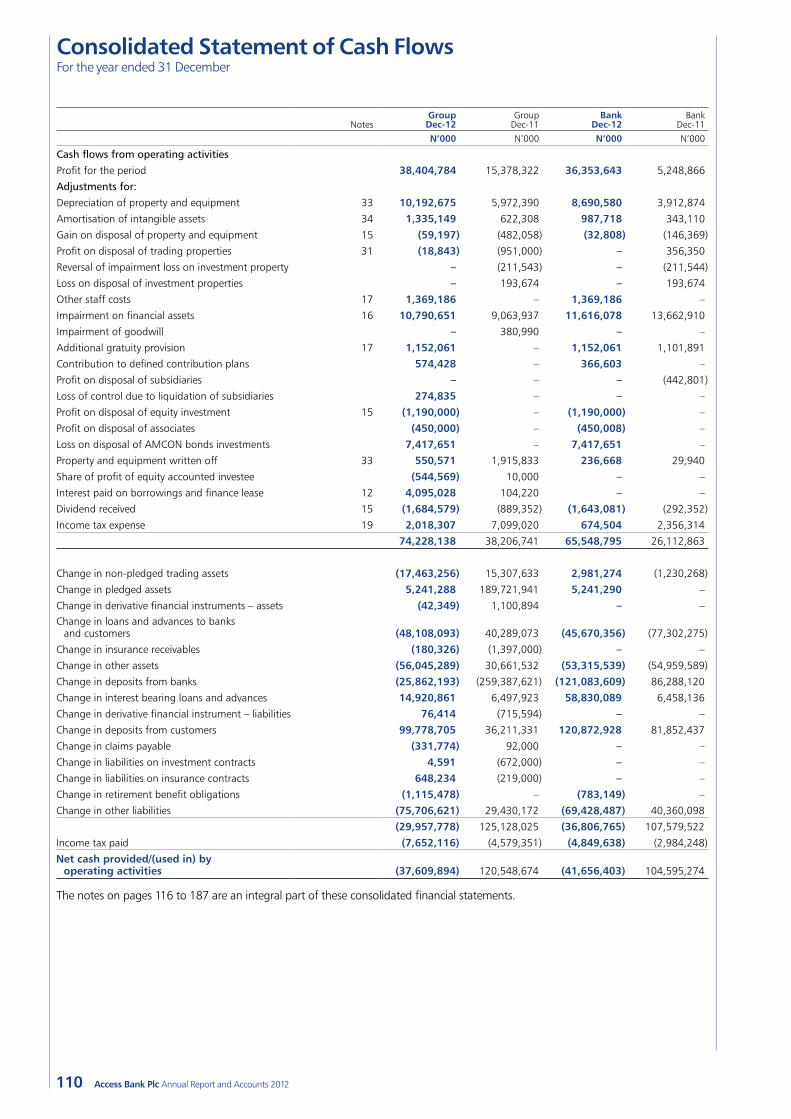
110 Access Bank Plc Annual Report and Accounts 2012
NotesGroup Dec-12
Group Dec-11
Bank Dec-12
Bank Dec-11
N’000 N’000 N’000 N’000
Cash flows from operating activities
Profit for the period 38,404,784 15,378,322 36,353,643 5,248,866
Adjustments for:
Depreciation of property and equipment 33 10,192,675 5,972,390 8,690,580 3,912,874
Amortisation of intangible assets 34 1,335,149 622,308 987,718 343,110
Gain on disposal of property and equipment 15 (59,197) (482,058) (32,808) (146,369)
Profit on disposal of trading properties 31 (18,843) (951,000) – 356,350
Reversal of impairment loss on investment property – (211,543) – (211,544)
Loss on disposal of investment properties – 193,674 – 193,674
Other staff costs 17 1,369,186 – 1,369,186 –
Impairment on financial assets 16 10,790,651 9,063,937 11,616,078 13,662,910
Impairment of goodwill – 380,990 – –
Additional gratuity provision 17 1,152,061 – 1,152,061 1,101,891
Contribution to defined contribution plans 574,428 – 366,603 –
Profit on disposal of subsidiaries – – – (442,801)
Loss of control due to liquidation of subsidiaries 274,835 – – –
Profit on disposal of equity investment 15 (1,190,000) – (1,190,000) –
Profit on disposal of associates (450,000) – (450,008) –
Loss on disposal of AMCON bonds investments 7,417,651 – 7,417,651 –
Property and equipment written off 33 550,571 1,915,833 236,668 29,940
Share of profit of equity accounted investee (544,569) 10,000 – –
Interest paid on borrowings and finance lease 12 4,095,028 104,220 – –
Dividend received 15 (1,684,579) (889,352) (1,643,081) (292,352)
Income tax expense 19 2,018,307 7,099,020 674,504 2,356,314
74,228,138 38,206,741 65,548,795 26,112,863
Change in non-pledged trading assets (17,463,256) 15,307,633 2,981,274 (1,230,268)
Change in pledged assets 5,241,288 189,721,941 5,241,290 –
Change in derivative financial instruments – assets (42,349) 1,100,894 – –Change in loans and advances to banks
and customers (48,108,093) 40,289,073 (45,670,356) (77,302,275)
Change in insurance receivables (180,326) (1,397,000) – –
Change in other assets (56,045,289) 30,661,532 (53,315,539) (54,959,589)
Change in deposits from banks (25,862,193) (259,387,621) (121,083,609) 86,288,120
Change in interest bearing loans and advances 14,920,861 6,497,923 58,830,089 6,458,136
Change in derivative financial instrument – liabilities 76,414 (715,594) – –
Change in deposits from customers 99,778,705 36,211,331 120,872,928 81,852,437
Change in claims payable (331,774) 92,000 – –
Change in liabilities on investment contracts 4,591 (672,000) – –
Change in liabilities on insurance contracts 648,234 (219,000) – –
Change in retirement benefit obligations (1,115,478) – (783,149) –
Change in other liabilities (75,706,621) 29,430,172 (69,428,487) 40,360,098
(29,957,778) 125,128,025 (36,806,765) 107,579,522
Income tax paid (7,652,116) (4,579,351) (4,849,638) (2,984,248)
Net cash provided/(used in) by operating activities (37,609,894) 120,548,674 (41,656,403) 104,595,274
The notes on pages 116 to 187 are an integral part of these consolidated financial statements.
Consolidated Statement of Cash FlowsFor the year ended 31 December
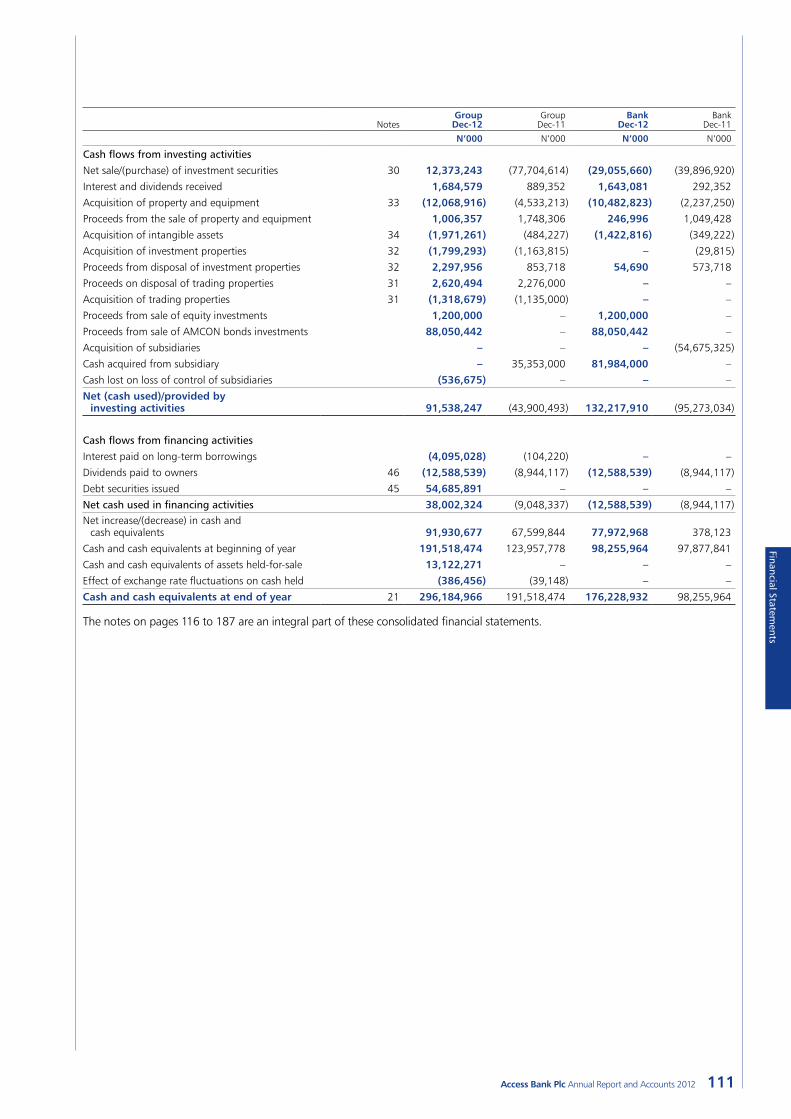
111Access Bank Plc Annual Report and Accounts 2012
Financial Statements
NotesGroup Dec-12
Group Dec-11
Bank Dec-12
Bank Dec-11
N’000 N’000 N’000 N’000
Cash flows from investing activities
Net sale/(purchase) of investment securities 30 12,373,243 (77,704,614) (29,055,660) (39,896,920)
Interest and dividends received 1,684,579 889,352 1,643,081 292,352
Acquisition of property and equipment 33 (12,068,916) (4,533,213) (10,482,823) (2,237,250)
Proceeds from the sale of property and equipment 1,006,357 1,748,306 246,996 1,049,428
Acquisition of intangible assets 34 (1,971,261) (484,227) (1,422,816) (349,222)
Acquisition of investment properties 32 (1,799,293) (1,163,815) – (29,815)
Proceeds from disposal of investment properties 32 2,297,956 853,718 54,690 573,718
Proceeds on disposal of trading properties 31 2,620,494 2,276,000 – –
Acquisition of trading properties 31 (1,318,679) (1,135,000) – –
Proceeds from sale of equity investments 1,200,000 – 1,200,000 –
Proceeds from sale of AMCON bonds investments 88,050,442 – 88,050,442 –
Acquisition of subsidiaries – – – (54,675,325)
Cash acquired from subsidiary – 35,353,000 81,984,000 –
Cash lost on loss of control of subsidiaries (536,675) – – –
Net (cash used)/provided by investing activities 91,538,247 (43,900,493) 132,217,910 (95,273,034)
Cash flows from financing activities
Interest paid on long-term borrowings (4,095,028) (104,220) – –
Dividends paid to owners 46 (12,588,539) (8,944,117) (12,588,539) (8,944,117)
Debt securities issued 45 54,685,891 – – –
Net cash used in financing activities 38,002,324 (9,048,337) (12,588,539) (8,944,117) Net increase/(decrease) in cash and
cash equivalents 91,930,677 67,599,844 77,972,968 378,123
Cash and cash equivalents at beginning of year 191,518,474 123,957,778 98,255,964 97,877,841
Cash and cash equivalents of assets held-for-sale 13,122,271 – – –
Effect of exchange rate fluctuations on cash held (386,456) (39,148) – –
Cash and cash equivalents at end of year 21 296,184,966 191,518,474 176,228,932 98,255,964
The notes on pages 116 to 187 are an integral part of these consolidated financial statements.
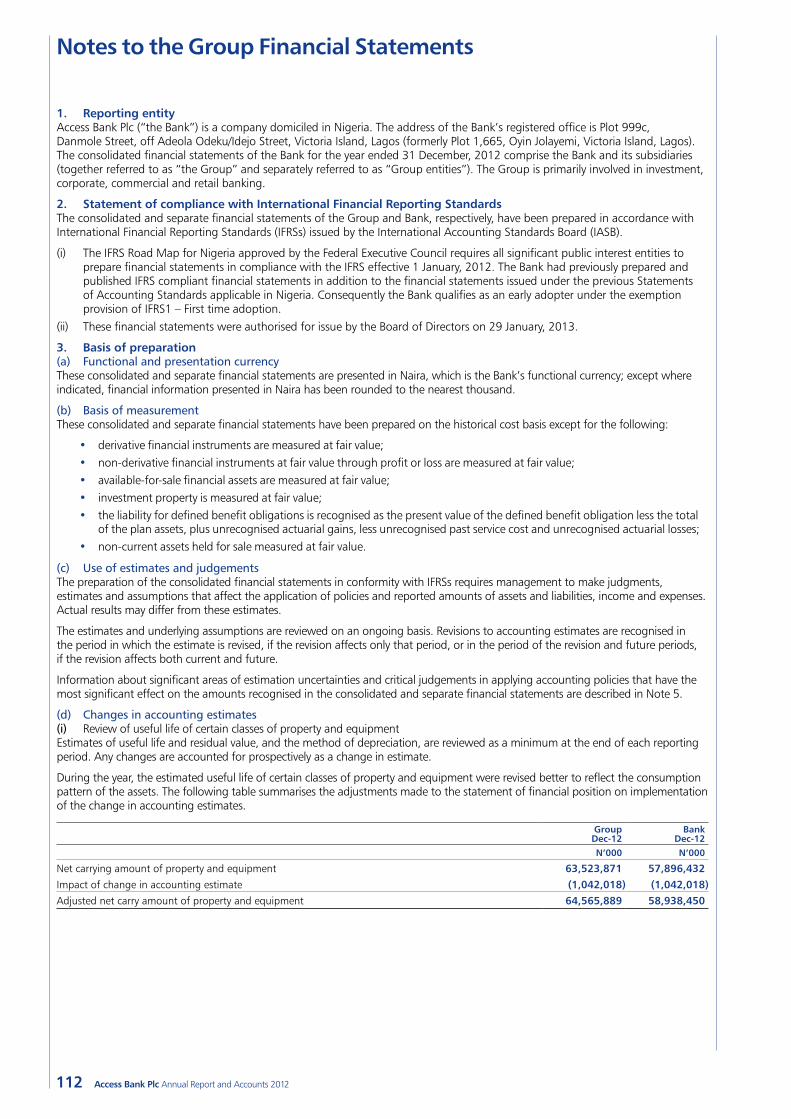
112 Access Bank Plc Annual Report and Accounts 2012
1. Reporting entityAccess Bank Plc (“the Bank”) is a company domiciled in Nigeria. The address of the Bank’s registered office is Plot 999c, Danmole Street, off Adeola Odeku/Idejo Street, Victoria Island, Lagos (formerly Plot 1,665, Oyin Jolayemi, Victoria Island, Lagos). The consolidated financial statements of the Bank for the year ended 31 December, 2012 comprise the Bank and its subsidiaries (together referred to as “the Group” and separately referred to as “Group entities”). The Group is primarily involved in investment, corporate, commercial and retail banking.
2. Statement of compliance with International Financial Reporting StandardsThe consolidated and separate financial statements of the Group and Bank, respectively, have been prepared in accordance with International Financial Reporting Standards (IFRSs) issued by the International Accounting Standards Board (IASB).
(i) The IFRS Road Map for Nigeria approved by the Federal Executive Council requires all significant public interest entities to prepare financial statements in compliance with the IFRS effective 1 January, 2012. The Bank had previously prepared and published IFRS compliant financial statements in addition to the financial statements issued under the previous Statements of Accounting Standards applicable in Nigeria. Consequently the Bank qualifies as an early adopter under the exemption provision of IFRS1 – First time adoption.
(ii) These financial statements were authorised for issue by the Board of Directors on 29 January, 2013.
3. Basis of preparation(a) Functional and presentation currencyThese consolidated and separate financial statements are presented in Naira, which is the Bank’s functional currency; except where indicated, financial information presented in Naira has been rounded to the nearest thousand.
(b) Basis of measurementThese consolidated and separate financial statements have been prepared on the historical cost basis except for the following:
• derivative financial instruments are measured at fair value;• non-derivative financial instruments at fair value through profit or loss are measured at fair value;• available-for-sale financial assets are measured at fair value;• investment property is measured at fair value;• the liability for defined benefit obligations is recognised as the present value of the defined benefit obligation less the total
of the plan assets, plus unrecognised actuarial gains, less unrecognised past service cost and unrecognised actuarial losses;• non-current assets held for sale measured at fair value.
(c) Use of estimates and judgementsThe preparation of the consolidated financial statements in conformity with IFRSs requires management to make judgments, estimates and assumptions that affect the application of policies and reported amounts of assets and liabilities, income and expenses. Actual results may differ from these estimates.
The estimates and underlying assumptions are reviewed on an ongoing basis. Revisions to accounting estimates are recognised in the period in which the estimate is revised, if the revision affects only that period, or in the period of the revision and future periods, if the revision affects both current and future.
Information about significant areas of estimation uncertainties and critical judgements in applying accounting policies that have the most significant effect on the amounts recognised in the consolidated and separate financial statements are described in Note 5.
(d) Changes in accounting estimates(i) Review of useful life of certain classes of property and equipmentEstimates of useful life and residual value, and the method of depreciation, are reviewed as a minimum at the end of each reporting period. Any changes are accounted for prospectively as a change in estimate.
During the year, the estimated useful life of certain classes of property and equipment were revised better to reflect the consumption pattern of the assets. The following table summarises the adjustments made to the statement of financial position on implementation of the change in accounting estimates.
Group Dec-12
Bank Dec-12
N’000 N’000
Net carrying amount of property and equipment 63,523,871 57,896,432Impact of change in accounting estimate (1,042,018) (1,042,018)Adjusted net carry amount of property and equipment 64,565,889 58,938,450
Notes to the Group Financial Statements
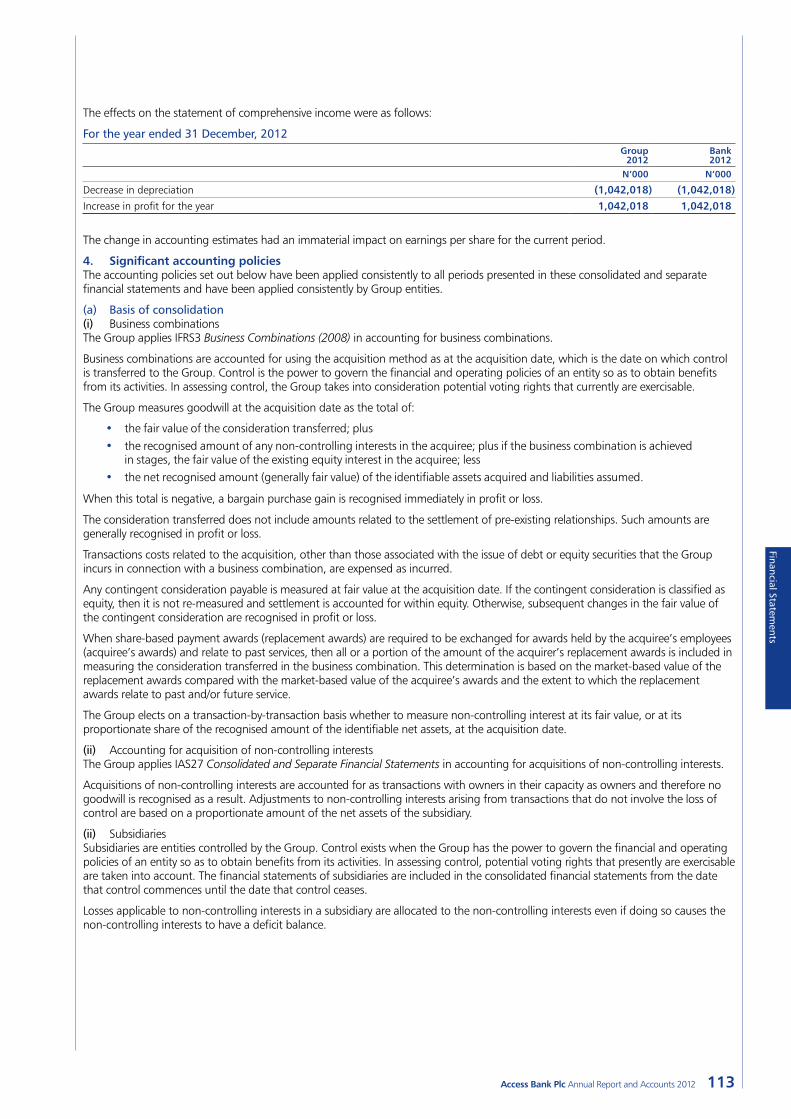
113Access Bank Plc Annual Report and Accounts 2012
Financial Statements
The effects on the statement of comprehensive income were as follows:
For the year ended 31 December, 2012 Group
2012Bank 2012
N’000 N’000
Decrease in depreciation (1,042,018) (1,042,018)Increase in profit for the year 1,042,018 1,042,018
The change in accounting estimates had an immaterial impact on earnings per share for the current period.
4. Significant accounting policiesThe accounting policies set out below have been applied consistently to all periods presented in these consolidated and separate financial statements and have been applied consistently by Group entities.
(a) Basis of consolidation(i) Business combinationsThe Group applies IFRS3 Business Combinations (2008) in accounting for business combinations.
Business combinations are accounted for using the acquisition method as at the acquisition date, which is the date on which control is transferred to the Group. Control is the power to govern the financial and operating policies of an entity so as to obtain benefits from its activities. In assessing control, the Group takes into consideration potential voting rights that currently are exercisable.
The Group measures goodwill at the acquisition date as the total of:
• the fair value of the consideration transferred; plus• the recognised amount of any non-controlling interests in the acquiree; plus if the business combination is achieved
in stages, the fair value of the existing equity interest in the acquiree; less• the net recognised amount (generally fair value) of the identifiable assets acquired and liabilities assumed.
When this total is negative, a bargain purchase gain is recognised immediately in profit or loss.
The consideration transferred does not include amounts related to the settlement of pre-existing relationships. Such amounts are generally recognised in profit or loss.
Transactions costs related to the acquisition, other than those associated with the issue of debt or equity securities that the Group incurs in connection with a business combination, are expensed as incurred.
Any contingent consideration payable is measured at fair value at the acquisition date. If the contingent consideration is classified as equity, then it is not re-measured and settlement is accounted for within equity. Otherwise, subsequent changes in the fair value of the contingent consideration are recognised in profit or loss.
When share-based payment awards (replacement awards) are required to be exchanged for awards held by the acquiree’s employees (acquiree’s awards) and relate to past services, then all or a portion of the amount of the acquirer’s replacement awards is included in measuring the consideration transferred in the business combination. This determination is based on the market-based value of the replacement awards compared with the market-based value of the acquiree’s awards and the extent to which the replacement awards relate to past and/or future service.
The Group elects on a transaction-by-transaction basis whether to measure non-controlling interest at its fair value, or at its proportionate share of the recognised amount of the identifiable net assets, at the acquisition date.
(ii) Accounting for acquisition of non-controlling interestsThe Group applies IAS27 Consolidated and Separate Financial Statements in accounting for acquisitions of non-controlling interests.
Acquisitions of non-controlling interests are accounted for as transactions with owners in their capacity as owners and therefore no goodwill is recognised as a result. Adjustments to non-controlling interests arising from transactions that do not involve the loss of control are based on a proportionate amount of the net assets of the subsidiary.
(ii) SubsidiariesSubsidiaries are entities controlled by the Group. Control exists when the Group has the power to govern the financial and operating policies of an entity so as to obtain benefits from its activities. In assessing control, potential voting rights that presently are exercisable are taken into account. The financial statements of subsidiaries are included in the consolidated financial statements from the date that control commences until the date that control ceases.
Losses applicable to non-controlling interests in a subsidiary are allocated to the non-controlling interests even if doing so causes the non-controlling interests to have a deficit balance.
114 Access Bank Plc Annual Report and Accounts 2012
(iii) Investment in associates (equity-accounted investees)Associates are those entities in which the Group has significant influence, but not control, over the financial and operating policies. Significant influence is presumed to exist when the Group holds between 20% and 50% of the voting power of another entity.
Investments in associates are accounted for using the equity method and are recognised initially at cost. The cost of the investment includes transaction costs.
When the Group’s share of losses exceeds its interest in an equity-accounted investee, the carrying amount of the investment, including any long-term interests that form part thereof, is reduced to zero, and the recognition of further losses is discontinued except to the extent that the Group has an obligation to, or has made payments on behalf of, the investee.
(iv) Special purpose entitiesSpecial purpose entities (SPEs) are entities that are created to accomplish a narrow and well-defined objective such as the execution of a specific borrowing or lending transaction. An SPE is consolidated if, based on an evaluation of the substance of its relationship with the Group and the SPE’s risks and rewards, the Group concludes that it controls the SPE.
The following circumstances may indicate a relationship in which, in substance, the Group controls and consequently consolidates an SPE:
• The activities of the SPE are being conducted on behalf of the Group according to its specific business needs so that the Group obtains benefits from the SPE’s operation.
• The Group has the decision-making powers to obtain the majority of the benefits of the activities of the SPE or, by setting up an ‘autopilot’ mechanism; the Group has delegated these decision-making powers.
• The Group has the rights to obtain the majority of the benefits of the SPE and therefore may be exposed to risks incident to the activities of the SPE.
• The Group retains the majority of the residual or ownership risks related to the SPE or its assets in order to obtain benefits from its activities.
The assessment of whether the Group has control over an SPE is carried out at inception and normally no further reassessment of control is carried out in the absence of changes in the structure or terms of the SPE, or additional transactions between the Group and the SPE. Day-to-day changes in market conditions normally do not lead to a reassessment of control. However, sometimes changes in market conditions may alter the substance of the relationship between the Group and the SPE, and in such instances the Group determines whether the change warrants a reassessment of control based on the specific facts and circumstances. Where the Group’s voluntary actions, such as lending amounts in excess of existing liquidity facilities or extending terms beyond those established originally, change the relationship between the Group and an SPE, the Group performs a reassessment of control over the SPE.
(v) Acquisitions from entities under common controlBusiness combinations arising from transfers of interests in entities that are under the control of the shareholder that controls the Group are accounted for as if the acquisition had occurred at the beginning of the earliest comparative year presented or, if later, at the date that common control was established; for this purpose comparatives are restated. The assets and liabilities acquired are recognised at the carrying amounts recognised previously in the Group controlling shareholder’s consolidated financial statements. The components of equity of the acquired entities are added to the same components within Group equity and any gain/loss arising is recognised directly in equity.
(vi) Loss of controlUpon the loss of control, the Group derecognises the assets and liabilities of the subsidiary, any non-controlling interests and the other components of equity related to the subsidiary. Any surplus or deficit arising on the loss of control is recognised in profit or loss. If the Group retains any interest in the previous subsidiary, then such interest is measured at fair value at the date that control is lost. Subsequently it is accounted for as an equity-accounted investee or in accordance with the Group’s accounting policy for financial instruments.
(vii) Transactions eliminated on consolidationIntra-group balances, transactions and any unrealised income and expenses (except for foreign currency translation gains or losses) arising from intra-group transactions, are eliminated in preparing the consolidated financial statements. Unrealised losses are eliminated in the same way as unrealised gains, but only to the extent that there is no evidence of impairment.
Notes to the Group Financial Statements continued
115Access Bank Plc Annual Report and Accounts 2012
Financial Statements
(b) Foreign currency(i) Foreign currency transactionsTransactions in foreign currencies are translated into the respective functional currencies of Group entities at spot exchange rates at the date of the transactions. Monetary assets and liabilities denominated in foreign currencies at each reporting date are retranslated to the functional currency at spot exchange rates as at that date. The foreign currency gain or loss on monetary items is the difference between amortised cost in the functional currency at the beginning of the year using the rates prevalent at the beginning, adjusted for effective interest and payments during the year, and the amortised cost in the functional currency at the year end using the rates prevalent at the year end. Non-monetary assets and liabilities that are measured in terms of historical cost in a foreign currency are translated using the spot exchange rate at the date of the transaction.
Non-monetary assets and liabilities denominated in foreign currencies that are measured at fair value are retranslated to the functional currency at the exchange rate at the date that the fair value was determined.
Foreign currency differences arising on retranslation are recognised in profit or loss, except for differences arising on the retranslation of available-for-sale equity instruments, which are recognised directly in other comprehensive income.
(ii) Foreign operationsThe assets and liabilities of foreign operations, including goodwill and fair value adjustments arising on acquisition, are translated to Naira at spot exchange rates at the reporting date. The income and expenses of foreign operations are translated to Naira at spot exchange rates at the dates of the transactions or at average rates of exchange where these approximate to actual rates.
Foreign currency differences on the translation of foreign operations are recognised in other comprehensive income and presented in the foreign currency translation reserve in equity. However, if the foreign operation is not wholly owned, the relevant proportion of the translation difference is allocated to non-controlling interests. When a foreign operation is disposed of, such that controls is lost, the cumulative amount in the foreign currency translation reserve related to that foreign operation is transferred to profit or loss as part of the gain or loss in disposal. On the partial disposal part of its interest in a foreign subsidiary that includes a foreign operation while retaining control, the relevant proportion of such cumulative amount is reattributed to non-controlling interests.
Foreign exchange gains or losses arising from a monetary item receivable from, or payable to, a foreign operation, the settlement of which is neither planned nor likely in the foreseeable future and which in substance is considered to form part of the net investment in the foreign operation, are recognised in other comprehensive income and foreign currency translation reserve in equity.
(c) InterestInterest income and expense are recognised in profit or loss using the effective interest method.
The effective interest rate is the rate that exactly discounts the estimated future cash payments and receipts through the expected life of the financial asset or liability (or, where appropriate, a shorter period) to the carrying amount of the financial asset or liability. When calculating the effective interest rate, the Group estimates future cash flows considering all contractual terms of the financial instruments but not future credit losses.
The calculation of the effective interest rate includes contractual fees and points paid or received, transaction costs, and discounts or premiums that are an integral part of the effective interest rate. Transaction costs are incremental costs that are directly attributable to the acquisition, issue or disposal of a financial asset or liability.
Interest income and expense presented in the statement of comprehensive income include:
• interest on financial assets and financial liabilities measured at amortised cost calculated on an effective interest rate basis;• interest on available-for-sale investment securities calculated on an effective interest basis.
Interest income and expense on all trading assets and liabilities are considered to be incidental to the Group’s trading operations and are presented together with all other changes in the fair value of trading assets and liabilities in net trading income.
Fair value changes on other derivatives held for risk-management purposes, and other financial assets and liabilities carried at fair value through profit or loss, are presented in net income from other financial instruments at fair value through profit or loss in the statement of comprehensive income.
(d) Fees and commissionFees and commission income and expenses that are integral to the effective interest rate on a financial asset or liability are included in the measurement of the effective interest rate.
Other fees and commission income, including account servicing fees, investment management and other fiduciary activity fees, sales commission, placement fees and syndication fees, are recognised as the related services are performed. When a loan commitment is not expected to result in the draw-down of a loan, loan commitment fees are recognised on a straight-line basis over the commitment period.
Other fees and commission expense relate mainly to transaction and service fees, which are expensed as the services are received.
116 Access Bank Plc Annual Report and Accounts 2012
Notes to the Group Financial Statements continued
(e) Net trading incomeNet trading income comprises gains less losses related to trading assets and liabilities, and includes all realised and unrealised fair value changes, interest, dividends and foreign exchange differences.
(f) Net income from other financial instruments at fair value through profit or lossNet income from other financial instruments at fair value through profit or loss relates to non-trading derivatives held for risk-management purposes that do not form part of qualifying hedge relationships and financial assets and liabilities designated at fair value through profit or loss, and includes all realised and unrealised fair value changes, interest, dividends and foreign exchange differences.
(g) DividendsDividend income is recognised when the right to receive income is established. Dividends are reflected as a component of net trading income, net income from other financial instruments at fair value through profit or loss or other operating income based on the underlying classification of the equity investment.
(h) Lease paymentsPayments made under operating leases are recognised in profit or loss on a straight-line basis over the term of the lease. Lease incentives received are recognised as an integral part of the total lease expense, over the term of the lease.
Minimum lease payments made under finance leases are apportioned between the finance expense and the reduction of the outstanding liability. The finance expense is allocated to each period during the lease term so as to produce a constant periodic rate of interest on the remaining balance of the liability. Contingent lease payments are accounted for by revising the minimum lease payments over the remaining term of the lease when the lease adjustment is confirmed.
(i) Income tax expenseIncome tax expense comprises current and deferred tax. Income tax expense is recognised in profit or loss except to the extent that it relates to items recognised directly in equity or in other comprehensive income.
– Current taxCurrent tax is the expected tax payable on taxable income or loss for the year, using tax rates enacted, or substantively enacted, at the reporting date, and any adjustment to tax payable in respect of previous years.
– Deferred taxDeferred tax is provided using the balance sheet method, providing for temporary differences between the carrying amounts of assets and liabilities for financial reporting purposes and the amounts used for taxation purposes. Deferred tax is not recognised for the following temporary differences:
• the initial recognition of goodwill;• the initial recognition of assets or liabilities in a transaction that is not a business combination and that affects neither
accounting nor taxable profit;• differences relating to investments in subsidiaries to the extent that they probably will not reverse in the foreseeable future.
Deferred tax is measured at the tax rates that are expected to be applied to the temporary differences when they reverse, based on laws that have been enacted, or substantively enacted, by the reporting date.
The measurement of deferred tax reflects the tax consequences that would follow the manner in which the Group expects, at the end of the reporting period, to recover or settle the carrying amount of its assets and liabilities. For investment property that is measured at fair value, the presumption that the carrying amount of the investment property will be recovered through sale has not been rebutted.
Deferred tax assets and liabilities are offset if there is a legally enforceable right to offset current tax liabilities against current tax assets, and they relate to income taxes levied by the same tax authority on the same taxable entity, or on different tax entities, but they intend to settle current tax laibilities and assets on a net basis or their tax assets and liabilities will be realised simultaneously.
A deferred tax asset is recognised only to the extent that it is probable that future taxable profits will be available against which the asset can be utilised. Deferred tax assets are reviewed at each reporting date and are reduced to the extent that it is no longer probable that the related tax benefit will be realised.
(j) Financial assets and liabilities(i) RecognitionThe Group initially recognises loans and advances, deposits, debt securities issued and subordinated liabilities on the date that they are originated. All other financial assets and liabilities (including assets and liabilities designated at fair value through profit or loss) are initially recognised on the trade date at which the Group becomes a party to the contractual provisions of the instrument.
A financial asset or financial liability is measured initially at fair value plus, for an item not at fair value through profit or loss, transaction costs that are directly attributable to its acquisition or issue.
117Access Bank Plc Annual Report and Accounts 2012
Financial Statements
(ii) ClassificationFinancial assetsThe Group classifies its financial assets in one of the following categories:
• loans and receivables;• held to maturity;• availabile-for-sale; or• at fair value through profit or loss and within the category as:
– held for trading; or – designated at fair value through profit or loss.
See Notes 4 (m) and (n (i, ii, iii)).
Financial liabilitiesThe Group classifies its financial liabilities, other than financial guarantees and loan commitments, as measured at amortised cost or fair value through profit or loss. See Note 4(v).
(iii) Derecognition Financial assetsThe Group derecognises a financial asset when the contractual rights to the cash flows from the financial asset expire, or when it transfers the financial asset in a transaction in which substantially all the risks and rewards of ownership of the financial asset are transferred or in which the Group neither transfers nor retains substantially all the risks and rewards of ownership and it does not retain control of the financial asset. Any interest in transferred financial assets that is created or retained by the Group is recognised as a separate asset or liability in the statement of financial position. On derecognition of a financial asset, the difference between the carrying amount of the asset (or the carrying amount allocated to the portion of the asset transferred), and the sum of (i) the consideration received (including any new asset obtained less any new liability assumed) and (ii) any cumulative gain or loss that had been recognised in other comprehensive income is recognised in profit or loss.
The Group enters into transactions whereby it transfers assets recognised on its financial position, but retains either all or substantially all of the risks and rewards of the transferred assets or a portion of them. If all, or substantially all, risks and rewards are retained, then the transferred assets are not derecognised from the financial position. Transfers of assets with retention of all, or substantially all, risks and rewards include, for example, securities lending and repurchase transactions.
When assets are sold to a third party with a concurrent total rate of return swap on the transferred assets, the transaction is accounted for as a secured financing transaction similar to repurchase transactions as the Group retains all or substantially all the risks and rewards of ownership of such assets.
In transactions in which the Group neither retains nor transfers substantially all the risks and rewards of ownership of a financial asset and it retains control over the asset, the Group continues to recognise the asset to the extent of its continuing involvement, determined by the extent to which it is exposed to changes in the value of the transferred asset.
In certain transactions, the Group retains the obligation to service the transferred financial asset for a fee. The transferred asset is derecognised if it meets the derecognition criteria. An asset or liability is recognised for the servicing contract, depending on whether the servicing fee is more than adequate (asset) or is less than adequate (liability) for performing the servicing.
Financial liabilitiesThe Group derecognises a financial liability when its contractual obligations are discharged or cancelled or expire.
(iv) OffsettingFinancial assets and liabilities are set off and the net amount presented in the statement of financial position when, and only when, the Group has a legal right to set off the amounts and intends either to settle on a net basis or to realise the asset and settle the liability simultaneously.
Income and expenses are presented on a net basis only when permitted under IFRSs, or for gains and losses arising from a group of similar transactions such as in the Group’s trading activity.
(v) Sale and repurchase agreementsSecurities sold subject to repurchase agreements (“repos”) remain on the statement of financial position; the counterparty liability is included in amounts due to other banks, deposits from banks, other deposits or deposits due to customers, as appropriate. Securities purchased under agreements to resell (“reverse repos”) are recorded as money market placement. The difference between sale and repurchase price is treated as interest and accrued over the life of the agreements using the effective interest method.
Securities lent to counterparties are also retained in the financial statements. Securities borrowed are not recognised in the financial statements, unless these are sold to third parties, in which case the purchase and sale are recorded with the gain or loss included in trading income.
118
Notes to the Group Financial Statements continued
Access Bank Plc Annual Report and Accounts 2012
(vi) Amortised cost measurementThe amortised cost of a financial asset or liability is the amount at which the financial asset or liability is measured at initial recognition, minus principal repayments, plus or minus the cumulative amortisation using the effective interest method of any difference between the initial amount recognised and the maturity amount, minus any reduction for impairment.
(vii) Fair value measurementFair value is the amount for which an asset could be exchanged, or a liability settled, between knowledgeable, willing parties in an arm’s-length transaction on the measurement date.
When available, the Group measures the fair value of an instrument using quoted prices in an active market for that instrument. A market is regarded as active if quoted prices are readily available and represent actual and regularly occurring market transactions on an arm’s-length basis.
If a market for a financial instrument is not active, the Group establishes fair value using valuation techniques. Valuation techniques include using recent arm’s-length transactions between knowledgeable, willing parties (if available), reference to the current fair value of other instruments that are substantially the same, and discounted cash flow analysis. The chosen valuation technique makes maximum use of market inputs, relies as little as possible on estimates specific to the Group, incorporates all factors that market participants would consider in setting a price, and is consistent with accepted economic methodologies for pricing financial instruments. Inputs to valuation techniques reasonably represent market expectations and measures of the risk-return factors inherent in the financial instrument. The Group calibrates valuation techniques and tests them for validity using prices from observable current market transactions in the same instrument or based on other available observable market data.
The best evidence of a financial instrument at initial recognition is the transaction price, i.e. the fair value of the consideration given or received, unless the fair value of that instrument is evidenced by comparison with other observable current market transactions in the same instrument (i.e. without modification or repackaging) or based on a valuation technique whose variables include only data from observable markets. When transaction price provides the best evidence of fair value at initial recognition, the financial instrument is initially measured at the transaction price and any difference between this price and the value initially obtained from a valuation model is subsequently recognised in profit or loss on an appropriate basis over the life of the instrument but not later than when the valuation is supported wholly by observable market data or the instrument is closed out.
Assets and long positions are measured at a bid price; liabilities and short positions are measured at an asking price. Where the Group has positions with offsetting risks, mid-market prices are used to measure the offsetting risk positions and a bid or asking price adjustment is applied only to the net open position as appropriate. Fair values reflect the credit risk of the instrument and include adjustments to take account of the credit risk of the Group entity and the counterparty, where appropriate. Fair value estimates obtained from models are adjusted for any other factors, such as liquidity risk or model uncertainties, to the extent that the Group believes a third-party market participant would take them into account in pricing a transaction.
(viii) Identification and measurement of impairmentAt each reporting date the Group assesses whether there is objective evidence that financial assets not carried at fair value through profit or loss are impaired. Financial assets are impaired when objective evidence demonstrates that a loss event has occurred after the initial recognition of the asset, and that the loss event has an impact on the future cash flows on the asset that can be estimated reliably.
Objective evidence that financial assets (including equity securities) are impaired can include significant financial difficulty of the obligor, default or delinquency by a borrower resulting in a breach of contract, restructuring of a loan or advance by the Group on terms that the Group would not otherwise consider, indications that a borrower or issuer will enter bankruptcy, the disappearance of an active market for a security, or other observable data relating to a group of assets such as adverse changes in the payment status of borrowers or issuers in the Group, or economic conditions that correlate with defaults in the Group. In addition, for an investment in an equity security, a significant or prolonged decline in its fair value below cost is objective evidence of impairment.
The Group considers evidence of impairment for loans and advances and held-to-maturity investments at both a specific asset and collective level. All individually significant loans and advances and held-to maturity investment securities are assessed for specific impairment. All individually significant loans and advances and held-to maturity investments found not to be specifically impaired are then collectively assessed for any impairment that has been incurred but not yet identified. Loans and advances and held-to-maturity investment securities that are not individually significant are collectively assessed for impairment by grouping together loans and advances and held-to-maturity investment securities (amortised cost) with similar characteristics.
In assessing collective impairment, the Group uses statistical modelling of historical trends of the probability of default, timing of recoveries and the amount of loss incurred, adjusted for management’s judgment as to whether current economic and credit conditions are such that the actual losses are likely to be greater or less than suggested by historical modelling. Default rates, loss rates and the expected timing of future recoveries are regularly benchmarked against actual outcomes to ensure that they remain appropriate.
Impairment losses on assets carried at amortised cost are measured as the difference between the carrying amount of the financial assets and the present value of estimated cash flows discounted at the assets’ original effective interest rate. Losses are recognised in profit or loss and reflected in an allowance account against loans and advances. Interest on the impaired asset continues to be recognised through the unwinding of the discount. When a subsequent event causes the amount of impairment loss to decrease, the impairment loss is reversed through profit or loss.
Impairment losses on available-for-sale investment securities are recognised by transferring the cumulative loss that has been recognised in other comprehensive income to profit or loss as a reclassification adjustment. The cumulative loss that is reclassified from other comprehensive income to profit or loss is the difference between the acquisition cost, net of any principal repayment and amortisation, and the current fair value, less any impairment loss previously recognised in profit or loss. Changes in impairment provisions attributable to time value are reflected as a component of interest income.
119Access Bank Plc Annual Report and Accounts 2012
Financial Statements
If, in subsequent period, the fair value of an impaired available-for-sale debt security increases and the increase can be objectively related to an event occurring after the impairment loss was recognised in profit or loss, the impairment loss is reversed, with the amount of reversal recognised in profit or loss. However, any subsequent recovery in the fair value of an impaired available-for-sale equity security in other comprehensive income.
(ix) Designation at fair value through profit or lossThe Group designates financial assets and liabilities at fair value through profit or loss in the following circumstances:
• The assets or liabilities are managed, evaluated and reported internally on a fair value basis.• The designation eliminates or significantly reduces an accounting mismatch which would otherwise arise.• The asset or liability contains an embedded derivative that significantly modifies the cash flows that would otherwise be
required under the contract.
Note 8 sets out the amount of each class of financial asset or liability that has been designated at fair value through profit or loss.
(k) Cash and cash equivalentsCash and cash equivalents include notes and coins on hand, unrestricted balances held with central banks and highly liquid financial assets with original maturities of less than three months, which are subject to insignificant risk of changes in their fair value, and are used by the Group in the management of its short-term commitments.
Cash and cash equivalents are carried at amortised cost in the statement of financial position.
(l) Trading assets and liabilitiesTrading assets and liabilities are those assets and liabilities that the Group acquires or incurs principally for the purpose of selling or repurchasing in the near term, or holds as part of a portfolio that is managed together for short-term profit or position taking.
Trading assets and liabilities are initially recognised and subsequently measured at fair value in the statement of financial position with transaction costs recognised in profit or loss. All changes in fair value are recognised as part of net trading income in profit or loss. Trading assets and liabilities are not reclassified subsequent to their initial recognition, as non-derivative financial assets, other than those designated at fair value through profit or loss (i.e. trading) category are reclassified if they are no longer held for the purpose of being sold or repurchased in the near term and the following conditions are met:
• If the financial asset would have met the definition of loans and receivables (if the financial asset had not been required to be classified as held-for-trading at initial recognition), then it may be reclassified if the Group has the intention and ability to hold the financial asset for the foreseeable future or until maturity.
• If the financial asset would not have met the definition of loans and receivable, then it may be reclassified out of the trading category only in rare circumstances.
(m) Loans and advancesLoans and advances are non-derivative financial assets with fixed or determinable payments that are not quoted in an active market and that the Group does not intend to sell immediately or in the near term.
When the Group is the lessor in a lease agreement that transfers substantially all of the risks and rewards incidental to ownership of an asset to the lessee, the arrangement is classified as a finance lease and a receivable equal to the net investment in the lease and recognised and presented within loans and advances.
When the Group purchases a financial asset and simultaneously enters into an agreement to resell the asset (or a substantially similar asset) at a fixed price on a future date (“reverse repo or stock borrowing”), the arrangement is accounted for as a loan or advance, and the underlying asset is not recognised in the Group’s financial statements.
Loans and advances are initially measured at fair value plus incremental direct transaction costs, and subsequently measured at their amortised cost using the effective interest method, except where the Group chooses to carry the loans and advances at fair value through profit or loss.
(n) Investment securitiesInvestment securities are initially measured at fair value plus, in case of investment securities not at fair value through profit or loss, incremental direct transaction costs and subsequently accounted for depending on their classification as either held-for-trading, held-to-maturity, fair value through profit or loss or available-for-sale.
(i) Held-to-maturityHeld-to-maturity investments are non-derivative assets with fixed or determinable payments and fixed maturity that the Group has the positive intent and ability to hold to maturity, and which are not designated at fair value through profit or loss or available-for-sale.
Held-to-maturity investments are carried at amortised cost using the effective interest method. Any sale or reclassification of a significant amount of held-to-maturity investments not close to their maturity would result in the reclassification of all held-to-maturity investments as available-for-sale, and prevent the Group from classifying investment securities as held-to-maturity for the current and the following two financial years. However, sales and reclassifications in any of the following circumstances would not trigger a reclassification:
• Sales or reclassification that are so close to maturity that changes on the market rate of interest would not have a significant effect on the financial asset’s fair value.
• Sales or reclassification after the Group has collected substantially all the asset’s original principal.• Sales or reclassification attributable to non-recurring isolated events beyond the Group’s control that could not have been
reasonably anticipated.
120
Notes to the Group Financial Statements continued
Access Bank Plc Annual Report and Accounts 2012
(ii) Fair value through profit or lossThe Group designates some investment securities at fair value with fair value changes recognised immediately in profit or loss as described in Note 4(j) (ix).
(iii) Available-for-saleAvailable-for-sale investments are non-derivative investments that are not designated as another category of financial assets. Unquoted equity securities whose fair value cannot be reliably measured are carried at cost. All other available-for-sale investments are carried at fair value.
Interest income is recognised in profit or loss using the effective interest method. Dividend income is recognised in profit or loss when the Group becomes entitled to the dividend. Foreign exchange gains or losses on available-for-sale debt security investments are recognised in profit or loss.
Other fair value changes are recognised directly in other comprehensive income until the investment is sold or impaired whereupon the cumulative gains and loses previously recognised in other comprehensive income are recognised to profit or loss as a reclassification adjustment.
A non-derivative financial asset may be reclassified from the available-for-sale category to the loans and receivable category if it otherwise would have met the definition of loans and receivables and if the Group has the intention and ability to hold that financial asset for the foreseeable future or until maturity.
(o) Derivatives held for risk-management purposesDerivatives held for risk-management purposes include all derivative assets and liabilities that are not classified as trading assets or liabilities. Derivatives are recognised initially at fair value; attributable transaction costs are recognised in profit or loss when incurred. Subsequent to initial recognition, derivatives are measured at fair value with changes in fair value recognised in profit or loss.
(p) Investment propertiesAn investment property is an investment in land or buildings held primarily for generating income or capital appreciation and not occupied substantially for use in the operations of the Group. An occupation of more than 15% of the property is considered substantial. Investment properties are carried in the balance sheet at their market value and revalued yearly on a systematic basis at least once every three years. Investment properties are not subject to periodic charge for depreciation.
When there has been a decline in value of an investment property, the carrying amount of the property is written down to recognise the loss. Such a reduction is charged to the profit and loss account. Reductions in carrying amount are reversed when there is an increase, following a revaluation in accordance with the Group’s policy, in the value of the investment property, or if the reasons for the reduction no longer exist.
An increase in carrying amount arising from the revaluation of investment property is credited to equity as revaluation surplus. To the extent that a decrease in carrying amount offsets a previous increase, for the same property that has been credited to revaluation surplus and not subsequently reversed or utilised, it is charged against that revaluation surplus, rather than the profit and loss account.
An increase on revaluation which is directly related to a previous decrease in carrying amount for the same property that was charged to the profit and loss account, is credited to profit and loss account to the extent that it offsets the previously recorded decrease. On disposal of an investment property, the difference between the net disposal proceeds and the carrying amount is charged or credited to the profit and loss account. Investment properties are disclosed separately from the property and equipment used for the purposes of the business.
(q) Property and equipment(i) Recognition and measurementItems of property and equipment are measured at cost less accumulated depreciation and accumulated impairment losses. Cost includes expenditures that are directly attributable to the acquisition of the asset.
When significant parts of an item of property or equipment have different useful lives, they are accounted for as separate items (major components) of property and equipment.
The gain or loss on disposal of an item of property and equipment is determined by comparing the proceeds from disposal with the carrying amount of property and equipment, and are recognised net within other income in profit or loss.
(ii) Subsequent costsSubsequent costs are included in the asset’s carrying amount or recognised as a separate asset, as appropriate, only when it is probable that the future economic benefits associated with the item will flow to the Group and its cost can be measured reliably. The costs of the day-to-day repairs and maintenance of property and equipment are recognised in profit or loss as incurred.
(iii) DepreciationDepreciation is recognised in profit or loss on a straight-line basis to write down the cost of items of property and equipment, to their residual values over the estimated useful lives. Leased assets under finance lease are depreciated over the shorter of the lease term and their useful lives.
Depreciation begins when an asset is available for use and ceases at the earlier of the date that the asset is derecognised or classified as held-for-sale in accordance with IFRS5. A non-current asset or disposal group is not depreciated while it is classified as held-for-sale.
121Access Bank Plc Annual Report and Accounts 2012
Financial Statements
The estimated useful lives for the current and comparative periods of significant items of property and equipment are as follows:
Leasehold land and buildings Over the shorter of the useful life of the item or lease termLeasehold improvements Over the shorter of the useful life of the item or lease termBuildings 60 yearsComputer hardware 4 yearsFurniture and fittings 5 yearsMotor vehicles 4 years
Capital work in progress is not depreciated. Upon completion it is transferred to the relevant asset category. Depreciation methods, useful lives and residual values are reassessed at each reporting date and adjusted if appropriate.
(iv) DerecognitionAn item of property and equipment is derecognised on disposal or when no future economic benefits are expected from its use or disposal. Any gain or loss arising on derecognition of the asset (calculated as the difference between the net disposal proceeds and the carrying amount of the asset) is included in profit or loss in the year the asset is derecognised.
(r) Intangible assets(i) GoodwillGoodwill that arises upon the acquisition of subsidiaries is included in intangible assets. For the measurement of goodwill at initial recognition, see Note 4 (a)(i). Goodwill has an indefinite useful life and it is tested annually for impairment. Subsequent to initial recognition, goodwill is measured at cost less accumulated impairment losses.
(ii) SoftwareSoftware acquired by the Group is stated at cost less accumulated amortisation and accumulated impairment losses. Expenditure on internally developed software is recognised as an asset when the Group is able to demonstrate its intention and ability to complete the development and use the software in a manner that will generate future economic benefits, and can reliably measure the costs to complete the development. The capitalised costs of internally developed software include all costs directly attributable to developing the software, and are amortised over its useful life. Internally developed software is stated at capitalised cost less accumulated amortisation and impairment.
Subsequent expenditure on software assets is capitalised only when it increases the future economic benefits embodied in the specific asset to which it relates. All other expenditure is expensed as incurred.
Amortisation is recognised in profit or loss on a straight-line basis over the estimated useful life of the software, from the date that it is available for use since this most closely reflects the expected pattern of consumption of future economic benefits embodied in the asset. The estimated useful life of software is between three and five years. Amortisation methods, useful lives and residual values are reviewed at each financial year-end and adjusted if appropriate.
(s) Leased assets – lesseeLeases in terms of which the Group assumes substantially all the risks and rewards incidental to ownership are classified as finance leases. Upon initial recognition the leased asset is measured at an amount equal to the lower of its fair value and the present value of the minimum lease payments. Subsequent to initial recognition, the asset is accounted for in accordance with the accounting policy applicable to that asset.
Other leases are operating leases and, except for investment property, the leased assets are not recognised in the Group’s statement of financial position. Investment property held under an operating lease is recognised in the Group’s statement of financial position at its fair value.
(t) Impairment of non-financial assetsThe carrying amounts of the Group’s non-financial assets other than goodwill and deferred tax assets, are reviewed at each reporting date to determine whether there is any indication of impairment. If any such indication exists then the asset’s recoverable amount is estimated. For goodwill and intangible assets that have indefinite useful lives or that are not yet available for use, the recoverable amount is estimated each year at the same time.
The recoverable amount of goodwill is estimated at each reporting date. An impairment loss is recognised if the carrying amount of an asset or its cash-generating unit exceeds its recoverable amount. In assessing value in use, the estimated future cash flows are discounted to their present value using a pre-tax discount rate that reflects current market assessments of the time value of money and the risks specific to the asset.
For the purpose of impairment testing, assets that cannot be tested individually are grouped together into the smallest group of assets that generates cash inflows from continuing use that are largely independent of cash inflows of other assets or groups of assets (the “cash-generating unit” or CGU). Subject to an operating segment ceiling test, for the purposes of goodwill impairment testing, CGUs to which goodwill has been allocated are aggregated so that the level at which impairment is tested reflects the lowest level at which goodwill is monitored for internal reporting purposes. Goodwill acquired in a business combination is allocated to the groups of CGUs that are expected to benefit from the synergies of the combination.
An impairment loss in respect of goodwill is not reversed. In respect of other assets, impairment losses recognised in prior periods are assessed at each reporting date for any indications that the loss has decreased or no longer exists. An impairment loss is reversed if there has been a change in the estimates used to determine the recoverable amount. An impairment loss is reversed only to the extent that the asset’s carrying amount does not exceed the carrying amount that would have been determined, net of depreciation or amortisation, if no impairment loss had been recognised.
122
Notes to the Group Financial Statements continued
Access Bank Plc Annual Report and Accounts 2012
(u) Assets held-for-sale or distributionNon-current assets, or disposal groups comprising assets and liabilities, that are expected to be recovered primarily through sale or distribution, rather than through continuing use, are classified as held-for-sale or distribution. Immediately before classification as held-for-sale or distribution, the assets, or components of a disposal group, are re-measured in accordance with the Group’s accounting policies. Thereafter generally the assets, or disposal group, are measured at the lower of their carrying amount and fair value less costs to sell. Any impairment loss on a disposal group is allocated first to goodwill, and then to the remaining assets and liabilities on a pro-rata basis, except that no loss is allocated to inventories, financial assets, deferred tax assets, employee benefit assets, investment property or biological assets, which continue to be measured in accordance with the Group’s accounting policies.
Impairment losses on initial classification as held-for-sale or distribution and subsequent gains and losses on re-measurement are recognised in profit or loss. Gains are not recognised in excess of any cumulative impairment loss.
Once classified as held-for-sale or distribution, intangible assets and property, plant and equipment are no longer amortised or depreciated, and any equity-accounted investee is no longer equity accounted.
(v) Deposits and debt securities issuedDeposits and debt securities issued are the Group’s sources of debt funding. When the Group sells a financial asset and simultaneously enters into a “repo” or “stock lending” agreement to repurchase the asset (or a similar asset) at a fixed price on a future date, the arrangement is accounted for as a deposit, and the underlying asset continues to be recognised in the Group’s financial statements.
The Group classifies capital instruments as financial liabilities or equity instruments in accordance with the substance of the contractual terms of the instrument.
Deposits and debt securities issued are initially measured at fair value minus incremental direct transaction costs, and subsequently measured at their amortised cost using the effective interest method, except where the Group designates liabilities at fair value through profit or loss.
(w) ProvisionsA provision is recognised if, as a result of a past event, the Group has a present legal or constructive obligation that can be estimated reliably, and it is probable that an outflow of economic benefits will be required to settle the obligation. Provisions are determined by discounting the expected future cash flows at a pre-tax rate that reflects current market assessments of the time value of money and, where appropriate, the risks specific to the liability. The unwinding of the discount is recognised as finance cost.
(i) RestructuringA provision for restructuring is recognised when the Group has approved a detailed and formal restructuring plan, and the restructuring either has commenced or has been announced publicly. Future operating costs are not provided for.
(ii) Onerous contractsA provision for onerous contracts is recognised when the expected benefits to be derived by the Group from a contract are lower than the unavoidable cost of meeting its obligations under the contract. The provision is measured at the present value of the lower of the expected cost of terminating the contract and the expected net cost of continuing with the contract. Before a provision is established, the Group recognises any impairment loss on the assets associated with that contract.
(x) Financial guaranteesFinancial guarantees are contracts that require the Group to make specified payments to reimburse the holder for a loss it incurs because a specified debtor fails to make payment when due in accordance with the terms of a debt instrument. Financial guarantee liabilities are initially recognised at their fair value, and the initial fair value is amortised over the life of the financial guarantee. The guarantee liability is subsequently carried at the higher of this amortised amount and the present value of any expected payment (when a payment under the guarantee has become probable). Financial guarantees are included within other liabilities.
(y) Employee benefits(i) Defined contribution plansA defined contribution plan is a post-employment benefit plan under which an entity pays fixed contributions into a separate entity and will have no legal or constructive obliagtion to pay further amounts. Obligations for contributions to defined contribution pension plans are recognised as an expense in profit or loss when they are due in respect of service rendered before the end of the reporting period. Prepaid contributions are recognised as an asset to the extent that a cash refund or a reduction in future payments is available. Contributions to a defined contribution plan that are due more than 12 months after the end of the reporting period in which the employees render the service are discounted to their present value at the reporting date.
The Bank operates a funded, defined contribution pension scheme for employees. Employees and the Bank contribute 7.5% of each of the qualifying staff salary in line with the provisions of the Pension Reforms Act 2004.
(ii) Termination benefitsTermination benefits are recognised as an expense when the Group is demonstrably committed, without realistic possibility of withdrawal, to a formal detailed plan to terminate employment before the normal retirement date. Termination benefits for voluntary redundancies are recognised if the Group has made an offer encouraging voluntary redundancy, it is probable that the offer will be accepted, and the number of acceptances can be estimated reliably. If benefits are payable more than 12 months after the reporting peeriod, then they are discounted to their present value.
(iii) Short-term employee benefitsShort-term employee benefit obligations are measured on an undiscounted basis and are expensed as the related service is provided.
A liability is recognised for the amount expected to be paid under short-term cash bonus or profit-sharing plans if the Group has a present legal or constructive obligation to pay this amount as a result of past service provided by the employee and the obligation can be estimated reliably.
123Access Bank Plc Annual Report and Accounts 2012
Financial Statements
(iv) Share-based payment transactionsThe Bank operates a cash-settled share-based compensation plan (i.e. share appreciation rights – SARs) for its management personnel. The management personnel are entitled to the share appreciation rights at a pre-determined price after spending five years in the Bank.
The fair value of the amount payable to employees in respect of share appreciation rights, which are settled in cash, is recognised as an expense, with a corresponding increase in liabilities, over the period in which the employees become unconditionally entitled to payment. The liability is re-measured at each reporting date and at settlement date. Any changes in the fair value of the liability are recognised as personnel expense in profit or loss.
During the year, the cash-settled share-based payment scheme was replaced by a new plan called Restricted Share Performance Plan (RSPP). Under the RSPP, shares of the Bank are awarded to employees based on their performance at no cost to them and the shares will have a vesting period of three years from date of award.
This new plan will be accounted for as an equity-settled transaction, where the Bank will recognise a cost and a corresponding increase in equity. The cost is recognised as an expense unless it qualifies for recognition as an asset. Initial estimates of the number of equity-settled instruments that are expected to vest are adjusted to current estimates and ultimately to the actual number of equity settled instruments that vest unless differences are due to market conditions.
The RSPP becomes effective in the next financial year i.e. 31 December, 2013.
(v) Long-term Incentive PlanThe Bank has a non-contributory, unfunded lump sum defined benefit plan for top executive management of the Bank from General Manager and above based on the number of years spent in these positions.
Depending on their grade, executive staff of the Bank, upon retirement, are entitled to certain benefits based on their length of stay on that grade. The Bank’s net obligation in respect of the long-term incentive scheme is calculated by estimating the amount of future benefits that eligible employees have earned in return for service in the current and prior periods. That benefit is discounted to determine its present value. The rate used to discount the post-employment benefit obligation is determined by reference to the yield on Nigerian Government Bonds, that have maturity dates approximating the terms of the Bank’s obligations.
The calculation is performed annually by a qualified actuary using the projected unit credit method. When the benefits of a plan are improved, the portion of the increased benefit relating to past service by employees is recognised in profit or loss on a straight-line basis over the average period until the benefits become vested. To the extent that the benefits vest immediately, the expense is recognised immediately in profit or loss. The Bank recognised all actuarial gains or losses and all expenses arising from defined benefit plan immediately in profit or loss.
(z) Insurance contracts and investment contractsThe Group issues contracts that transfer insurance risk, financial risk or both.
Insurance contracts are those contracts that transfer significant insurance risk.
The Group defines as significant insurance risk the possibility of having to pay benefits, on the occurrence of an insured event, that are significantly more than the benefits payable if the insured event did not occur.
Investment contracts are those contracts that transfer financial risk without significant insurance risk. Financial risk refers to the risk of a possible future change in the value of an asset or financial instrument due to a change in interest rate, commodity price, index of prices, foreign exchange rate or other measurable variable.
(i) Insurance contractsIn terms of IFRS4, insurance liabilities are measured under existing local practice at the date of adoption of IFRS4.
The Group had, prior to the adoption of IFRS4, valued insurance liabilities using certain actuarial techniques as described below. The Group has continued to value insurance liabilities in accordance with these.
Insurance contracts are classified into three broad categories, depending on the duration of the risk and the type of risk
Individual LifeThese contracts insure mainly against death. For the published accounts, the contracts are valued based on a gross premium valuation taking into account the present value of expected future premium, claim and associated expense cash flows.
Any resultant negative policy holder liabilities, measured on an individual policy level, are set to zero (“zeroised”) so as not to recognise profits prematurely.
Where the same policy includes both insurance and investment components and where the policy is classified as insurance, the insurance and investment benefits are valued separately.
Group LifeThese contracts insure against death on a group basis. These contracts are short term in nature and are typically renewed annually. For these contracts, gross premiums are recognised as revenue when due.
Outstanding claims provisionA full provision is made for the estimated cost of all claims notified, but not settled, at the reporting date, using the best information available at that time. Provision is also made for the cost of claims incurred but not reported (“IBNR”) until after the reporting date.
Similarly, provisions are made for “unallocated claims expenses” being the estimated administrative expenses that will be incurred after the reporting date in settling all claims outstanding as at the date, including IBNR. Differences between the provision for outstanding claims at a reporting date and the subsequent settlement are included in the Revenue Account of the following year.
124
Notes to the Group Financial Statements continued
Access Bank Plc Annual Report and Accounts 2012
(ii) Insurance contracts with Discretionary Participation FeaturesThe Group issues single premium contracts that provide primarily savings benefits to policy holders but also transfer insurance risk. The investment return credited to the policy holders is at the Group’s discretion, subject to fair oversight and a minimum guaranteed. These contracts are valued on a retrospective basis.
(iv) Liability adequacy testLiability adequacy tests are performed at each balance sheet date to ensure the adequacy of contract liabilities net of deferred acquisition cost. Current best estimates of future contractual cash flows, claims handling and administration costs, and investment returns from the assets backing the liabilities are taken into account in the tests. Any deficiency is immediately recognised in the income statement.
(v) ReinsuranceShort- and long-term insurance business is ceded to reinsurers under contracts to transfer part or all of one or more of the following risks: mortality, investment and expenses. All such contracts are dealt with as insurance contracts. The benefits to which the Group is entitled under its reinsurance contracts are recognised as reinsurance assets. The Group assesses reinsurance assets at each balance sheet date. If there is objective evidence of impairment, the carrying amount of the reinsurance asset is reduced accordingly, resulting in a charge to the income statement.
(aa) Share capital and reserves(i) Share issue costsIncremental costs directly attributable to the issue of an equity instrument are deducted from the initial measurement of the equity instruments.
(ii) Dividend on the Bank’s ordinary sharesDividends on ordinary shares are recognised in equity in the period when approved by the Bank’s Shareholders. Dividends for the year that are declared after the end of the reporting period are dealt with in the subsequent events note.
(iii) Treasury sharesWhere the Bank or any member of the Group purchases the Bank’s share capital, the consideration paid is deducted from the Shareholders’ equity as treasury shares until they are cancelled or disposed. Where such shares are subsequently sold or reissued, any consideration received is included in Shareholders’ equity.
(ab) Earnings per shareThe Group presents basic and diluted earnings per share (EPS) for its ordinary shares. Basic EPS is calculated by dividing the profit or loss attributable to ordinary shareholders of the Bank by the weighted average number of ordinary shares outstanding during the period. Diluted EPS is determined by adjusting the profit or loss attributable to ordinary shareholders and the weighted average number of ordinary shares outstanding for the effects of all dilutive potential ordinary shares, which comprise share options granted to employees.
(ac) Segment reportingAn operating segment is a component of the Group that engages in business activities from which it can earn revenues and incur expenses, including revenues and expenses that relate to transactions with any of the Group’s other components, whose operating results are reviewed regularly by the Executive Management Committee (being the chief operating decision-maker) to make decisions about resources allocated to each segment and assess its performance, and for which discrete financial information is available.
(ad) New standards and interpretations not yet adoptedAs at 31 December, 2012, a number of standards and interpretations, and amendments thereto, had been issued by the IASB which are not yet effective for these consolidated financial statements. Below, the most significant new standards are addressed:
IFRS9 Financial Instruments: Classification and MeasurementIFRS9 (2009) introduces new requirements for the classification and measurement of financial assets. IFRS9 (2010) introduces additions relating to financial liabilities. The IASB currently has an active project to make limited amendments to the classification and measurement requirements of IFRS9 and add new requirements to address the impairment of financial assets and hedge accounting.
The IFRS9 (2009) requirements represents a significant change from the existing requirements in IAS39 in respect of financial assets. The standard contains two primary measurement categories of financial assets: amortised cost and fair value. A financial asset would be measured at amortised cost if it is held within a business model whose objective is to hold assets in order to collect contractual cash flows, and the asset’s contractual terms give rise on specific dates to cash flows that are solely payments of principal and interest on the principal outstanding. All other financial assets would be measured at fair value. The standard eliminates the existing IAS39 categories of held to maturity, available-for-sale and loans and receivables. For an investment in equity investment which is not held for trading, the standard permits an irrevocable election, on initial recognition, on an individual share-by-share basis, to present all fair value changes from the investment in other comprehensive income. No amount recognised in other comprehensive income would ever be reclassified to profit or loss at a later date. However, dividend on such investments are recognised in profit or loss, rather than other comprehensive income, unless they clearly represent a partial recovery of the cost of the investments. Investments in equity instruments in respect of which an entity does not elect to present fair value changes in other comprehensive income would be measured at fair value with changes in fair value recognised in profit or loss.
The standard requires that derivatives embedded in contracts with a host that is a financial asset within the scope of the standard are not separated; instead the hybrid financial instrument is assessed in its entirety as to whether it should be measured at amortised cost or fair value.
125Access Bank Plc Annual Report and Accounts 2012
Financial Statements
IFRS9 (2010) introduces a new requirement in respect of financial liabilities designated under the fair value option generally to present fair value changes that are attributable to the liability’s credit risk in other comprehensive income rather than in profit or loss. Apart from this change, IFRS9 (2010) largely carries forward without substantive amendment the guidance on the classification and measurement of financial liabilities from IAS39.
IFRS9 is effective for annual periods beginning on or after 1 January, 2015 with early adoption permitted. The IASB decided to consider making limited amendments to IFRS9 to address practice and other issues.
The Bank is currently assessing the impact of both the first phase and the second phase on its financial statements.
IFRS10 Consolidated Financial StatementsIFRS10 replaces all of the consolidation guidance of IAS27 Consolidated and Separate Financial Statements and SIC12 Consolidation – Special Purpose Entities. Consolidation is required when there is control that is defined as a combination of power, exposure to variability in returns and a link between the two. IFRS10 is effective for annual periods beginning on or after 1 January, 2013. The Bank is currently reviewing IFRS10 to evaluate its impact to the Group
IFRS11 Joint ArrangementsIFRS11 overhauls the accounting for joint ventures and replaces IAS31 Interest in Joint Ventures and SIC13 Jointly Controlled Entities. It uses the principles of control in IFRS10 in defining joint control and whether joint control exists may change. The new standard does not allow proportional consolidation of joint entures and the equity method must be applied. IFRS11 is effective in annual periods beginning on or after 1 January, 2013. No impact is expected as the Bank does not have interests in any joint arrangements.
IFRS12 Disclosure of Interests in Other EntitiesIFRS12 includes all of the disclosure requirements for subsidiaries, joint arrangements, associated and structured entities. Changes include the requirement to disclose the judgments made to determine whether it controls another entity. IFRS12 is effective in annual periods beginning on or after 1 January, 2013. Early adoption of IFRS10, 11 and 12 is permitted but is required to take place simultaneously. Only IFRS12 can be early adopted without IFRS10 and 11. IFRS12 has not been early adopted but the Bank is currently assessing the disclosure requirements for interests in subsidiaries and associates in comparison with the existing disclosures.
IFRS13 Fair Value Measurement (2011)IFRS13 provides a single source of guidance on how fair value is measured, and replaces the fair value measurement guidance that is currently dispersed throughout IFRS. Subject to limited exceptions, IFRS13 is applied when fair value measurements or disclosures are required or permitted by other IFRSs. The Group is currently reviewing its methodologies for determining fair values (see Notes 5). Although many of the IFRS13 disclosure requirements regarding financial assets and financial liabilities are already required, the adoption of IFRS13 will require the Group to provide additional disclosures. These include fair value heirachy disclosures for non-financial assets/liabilities and disclosures on fair value measurements that are categorised in Level 3. IFRS13 is effective for annual periods beginning on or after 1 January 2013 with early adoption permitted. The Bank has not early adopted IFRS13 and it is currently evaluating its impact on assets and liabilites recognised at fair values.
Amendments to IFRS7 and IAS32 on offsetting financial assets and financial liabilities (2011)Disclosures – Offsetting Financial Assets and Financial Liabilities (amendments to IFRS7) introduces disclosures about the impact of netting arrangements on an entity’s financial position. The amendments are effective for annual periods beginning on or after 1 January, 2013 and interim periods within those annual periods. Based on the new disclosure requirements the Group will have to provide information about what amounts have been offset in the statement of financial position and the nature and extent of rights of set-off under master netting arrangements or similar arrangements.
Offsetting Financial Assets and Financial Liabilities (amendments to IAS32) clarify the offsetting criteria in IAS32 by explaining when an entity currently has a legally enforceable right to set-off and when gross settlement is equivalent to net settlement. The amendments are effective for annual periods beginning on or after 1 January, 2014 and interim periods within those annual periods. Earlier application is permitted.
Based on our initial assessment, the Group is not expecting a significant impact from the adoption of the amendments to IAS32. However, the adoption of the amendments to IFRS7 requires more extensive disclosures about rights of set off.
IAS19 Employee benefitsThe amended IAS19 states that changes in the defined benefit obligation and fair value of plan assets are recognised in the period as they occur. The “corridor“ method is eliminated and actuarial gains and losses and unrecognised past service costs are recognised directly in other comprehensive income. Because actuarial gains and losses are no longer deferred, affecting both the net defined benefit liability/asset and the amounts recognised in profit or loss are affected. The amended standard splits changes in defined benefit liabilities/assets in:
– Service cost (including past service costs, curtailments and settlements) – in profit or loss;
– Net interest costs (i.e. net interest on the net defined benefit liability) – in profit or loss;
– Remeasurement of the defined benefit liability/asset – in other comprehensive income.
The amended IAS19 is effective for periods beginning on or after 1 January, 2013. The Bank is currently assessing the impact of the amendments in its subsequent financial statements.
126
Notes to the Group Financial Statements continued
Access Bank Plc Annual Report and Accounts 2012
Improvements to IFRSsIn May 2012, the IASB issued improvements to IFRSs, an omnibus of amendments to its IFRSs. The amendments are effective for annual periods beginning on or after 1 January, 2013, with early adoption permitted. The amendments are listed below:
• IFRS1 First-time Adoption of International Financial Reporting Standards;• IAS1 Presentation of Financial Statements;• IAS16 Property Plant and Equipment;• IAS32 Financial Instruments: Presentation;• IAS34 Interim Financial Reporting.
5. Use of estimates and judgmentsThese disclosures supplement the commentary on financial risk management (see Note 6).
Key sources of estimation uncertainty(i) Allowances for credit lossesAssets accounted for at amortised cost are evaluated for impairment on a basis described in accounting policy 4(j)(viii).
The specific component of the total allowances for impairment applies to financial assets evaluated individually for impairment and is based upon management’s best estimate of the present value of the cash flows that are expected to be received. In estimating these cash flows, management makes judgments about a debtor’s financial situation and the net realisable value of any underlying collateral. Each impaired asset is assessed on its merits, and the workout strategy and estimate of cash flows considered recoverable are independently reviewed by the Credit Risk function.
A collective component of the total allowance is established for:
• Groups of homogeneous loans that are not considered individually significant; and• Groups of assets that are individually significant but were not found to be individually impaired (IBNR).
Collective allowance for groups of homogeneous loans is established using statistical modelling of historical trends of the probability of default, timing of recoveries and the amount of loss incurred, adjusted for management’s judgement as to whether current economic and credit conditions are such that the actual losses are likely to be greater or less than suggested by historical modelling. Default rates, loss rates and the expected timing of future recoveries are regularly benchmarked against actual outcomes to ensure that they remain appropriate.
Collective allowance for groups of assets that are individually significant but that were not found to be individually impaired cover credit losses inherent in portfolios of loans and advances and held-to-maturity investment securities with similar credit characteristics when there is objective evidence to suggest that they contain impaired loans and advances and held-to-maturity investment securities, but the individual impaired items cannot yet be identified. In assessing the need for collective loan loss allowances, management considers factors such as credit quality, portfolio size, concentrations, and economic factors. In order to estimate the required allowance, assumptions are made to define the way inherent losses are modelled and to determine the required input parameters, based on historical experience and current economic conditions. The accuracy of the allowances depends on estimates of future cash flows for specific counterparty allowances and the model assumptions and parameters used in determining collective allowances are estimated.
Investments in equity securities were evaluated for impairment on the basis described in Note 4(j)(viii).
(ii) Statement of prudential adjustmentsProvisions under prudential guidelines are determined using the time based provisioning regime prescribed by the Revised Central Bank of Nigeria (CBN) Prudential Guidelines. This is at variance with the incurred loss model required by IFRS under IAS 39. As a result of the differences in the methodology/provision regime, there will be variances in the impairments allowances required under the two methodologies.
Paragraph 12.4 of the revised Prudential Guidelines for Deposit Money Banks in Nigeria stipulates that Banks would be required to make provisions for loans as prescribed in the relevant IFRS Standards when IFRS is adopted. However, Banks would be required to comply with the following:
a) Provisions for loans recognised in the profit and loss account should be determined based on the requirements of IFRS. However, the IFRS provision should be compared with provisions determined under prudential guidelines and the expected impact/changes in general reserves should be treated as follows:
• Prudential Provisions is greater than IFRS provisions; the excess provision resulting should be transferred from the general reserve account to a “regulatory risk reserve”.
• Prudential Provisions is less than IFRS provisions; IFRS determined provision is charged to the statement of comprehensive income. The cumulative balance in the regulatory risk reserve is thereafter reversed to the general reserve account.
b) The non-distributable reserve should be classified under Tier 1 as part of the core capital.
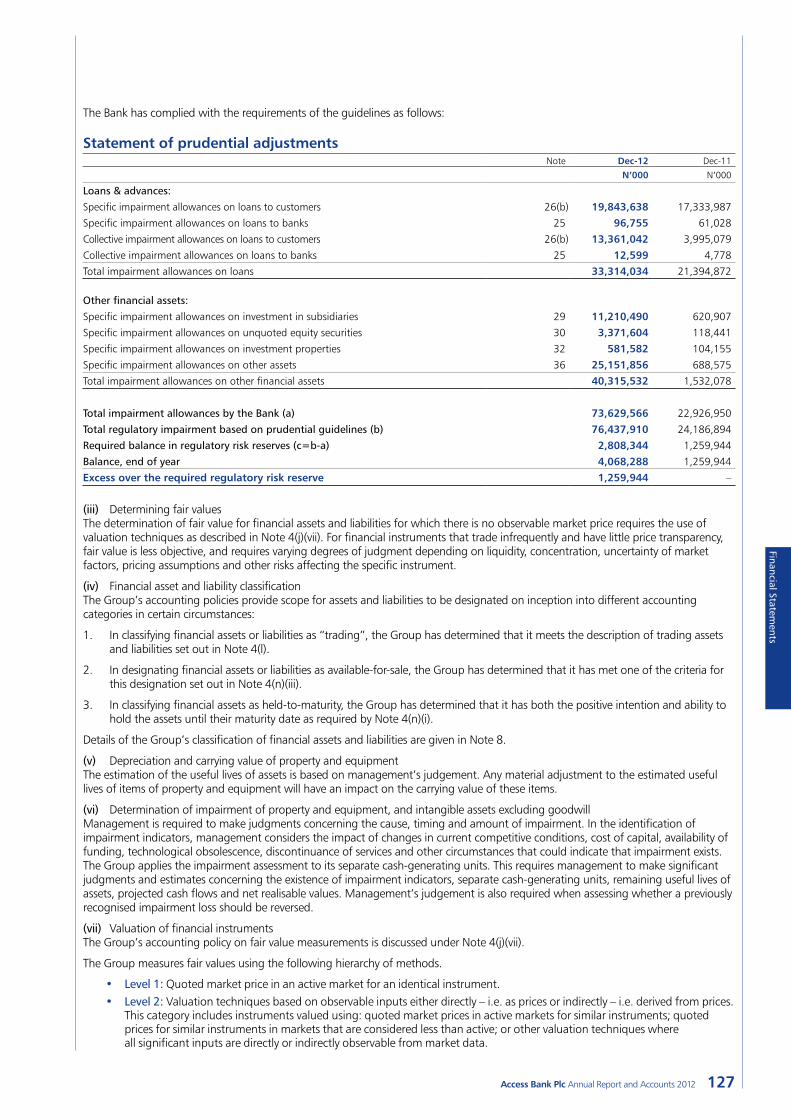
127Access Bank Plc Annual Report and Accounts 2012
Financial Statements
The Bank has complied with the requirements of the guidelines as follows:
Statement of prudential adjustmentsNote Dec-12 Dec-11
N’000 N’000
Loans & advances:
Specific impairment allowances on loans to customers 26(b) 19,843,638 17,333,987
Specific impairment allowances on loans to banks 25 96,755 61,028
Collective impairment allowances on loans to customers 26(b) 13,361,042 3,995,079
Collective impairment allowances on loans to banks 25 12,599 4,778
Total impairment allowances on loans 33,314,034 21,394,872
Other financial assets:
Specific impairment allowances on investment in subsidiaries 29 11,210,490 620,907
Specific impairment allowances on unquoted equity securities 30 3,371,604 118,441
Specific impairment allowances on investment properties 32 581,582 104,155
Specific impairment allowances on other assets 36 25,151,856 688,575
Total impairment allowances on other financial assets 40,315,532 1,532,078
Total impairment allowances by the Bank (a) 73,629,566 22,926,950
Total regulatory impairment based on prudential guidelines (b) 76,437,910 24,186,894
Required balance in regulatory risk reserves (c=b-a) 2,808,344 1,259,944
Balance, end of year 4,068,288 1,259,944
Excess over the required regulatory risk reserve 1,259,944 –
(iii) Determining fair valuesThe determination of fair value for financial assets and liabilities for which there is no observable market price requires the use of valuation techniques as described in Note 4(j)(vii). For financial instruments that trade infrequently and have little price transparency, fair value is less objective, and requires varying degrees of judgment depending on liquidity, concentration, uncertainty of market factors, pricing assumptions and other risks affecting the specific instrument.
(iv) Financial asset and liability classificationThe Group’s accounting policies provide scope for assets and liabilities to be designated on inception into different accounting categories in certain circumstances:
1. In classifying financial assets or liabilities as “trading”, the Group has determined that it meets the description of trading assets and liabilities set out in Note 4(l).
2. In designating financial assets or liabilities as available-for-sale, the Group has determined that it has met one of the criteria for this designation set out in Note 4(n)(iii).
3. In classifying financial assets as held-to-maturity, the Group has determined that it has both the positive intention and ability to hold the assets until their maturity date as required by Note 4(n)(i).
Details of the Group’s classification of financial assets and liabilities are given in Note 8.
(v) Depreciation and carrying value of property and equipmentThe estimation of the useful lives of assets is based on management’s judgement. Any material adjustment to the estimated useful lives of items of property and equipment will have an impact on the carrying value of these items.
(vi) Determination of impairment of property and equipment, and intangible assets excluding goodwillManagement is required to make judgments concerning the cause, timing and amount of impairment. In the identification of impairment indicators, management considers the impact of changes in current competitive conditions, cost of capital, availability of funding, technological obsolescence, discontinuance of services and other circumstances that could indicate that impairment exists. The Group applies the impairment assessment to its separate cash-generating units. This requires management to make significant judgments and estimates concerning the existence of impairment indicators, separate cash-generating units, remaining useful lives of assets, projected cash flows and net realisable values. Management’s judgement is also required when assessing whether a previously recognised impairment loss should be reversed.
(vii) Valuation of financial instrumentsThe Group’s accounting policy on fair value measurements is discussed under Note 4(j)(vii).
The Group measures fair values using the following hierarchy of methods.
• Level 1: Quoted market price in an active market for an identical instrument.• Level 2: Valuation techniques based on observable inputs either directly – i.e. as prices or indirectly – i.e. derived from prices.
This category includes instruments valued using: quoted market prices in active markets for similar instruments; quoted prices for similar instruments in markets that are considered less than active; or other valuation techniques where all significant inputs are directly or indirectly observable from market data.
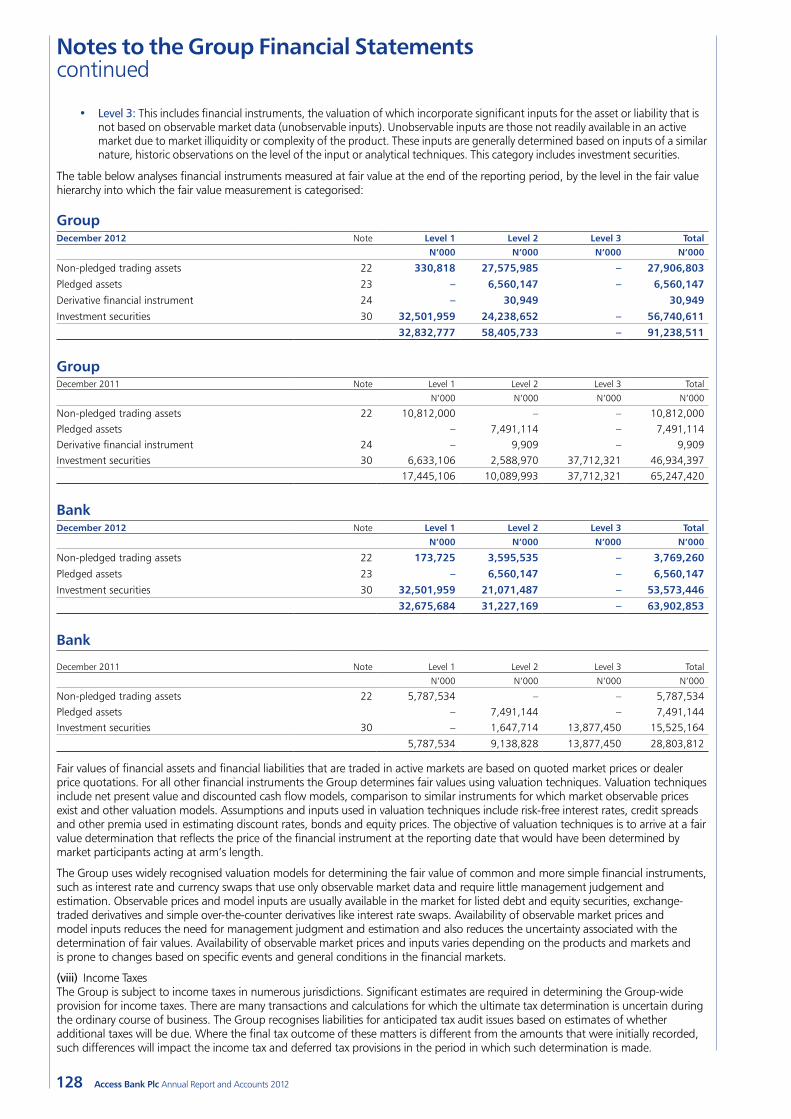
128
Notes to the Group Financial Statements continued
Access Bank Plc Annual Report and Accounts 2012
• Level 3: This includes financial instruments, the valuation of which incorporate significant inputs for the asset or liability that is not based on observable market data (unobservable inputs). Unobservable inputs are those not readily available in an active market due to market illiquidity or complexity of the product. These inputs are generally determined based on inputs of a similar nature, historic observations on the level of the input or analytical techniques. This category includes investment securities.
The table below analyses financial instruments measured at fair value at the end of the reporting period, by the level in the fair value hierarchy into which the fair value measurement is categorised:
GroupDecember 2012 Note Level 1 Level 2 Level 3 Total
N’000 N’000 N’000 N’000
Non-pledged trading assets 22 330,818 27,575,985 – 27,906,803Pledged assets 23 – 6,560,147 – 6,560,147Derivative financial instrument 24 – 30,949 30,949Investment securities 30 32,501,959 24,238,652 – 56,740,611
32,832,777 58,405,733 – 91,238,511
GroupDecember 2011 Note Level 1 Level 2 Level 3 Total
N’000 N’000 N’000 N’000
Non-pledged trading assets 22 10,812,000 – – 10,812,000Pledged assets – 7,491,114 – 7,491,114Derivative financial instrument 24 – 9,909 – 9,909Investment securities 30 6,633,106 2,588,970 37,712,321 46,934,397
17,445,106 10,089,993 37,712,321 65,247,420
BankDecember 2012 Note Level 1 Level 2 Level 3 Total
N’000 N’000 N’000 N’000
Non-pledged trading assets 22 173,725 3,595,535 – 3,769,260 Pledged assets 23 – 6,560,147 – 6,560,147Investment securities 30 32,501,959 21,071,487 – 53,573,446
32,675,684 31,227,169 – 63,902,853
Bank
December 2011 Note Level 1 Level 2 Level 3 Total
N’000 N’000 N’000 N’000
Non-pledged trading assets 22 5,787,534 – – 5,787,534 Pledged assets – 7,491,144 – 7,491,144Investment securities 30 – 1,647,714 13,877,450 15,525,164
5,787,534 9,138,828 13,877,450 28,803,812
Fair values of financial assets and financial liabilities that are traded in active markets are based on quoted market prices or dealer price quotations. For all other financial instruments the Group determines fair values using valuation techniques. Valuation techniques include net present value and discounted cash flow models, comparison to similar instruments for which market observable prices exist and other valuation models. Assumptions and inputs used in valuation techniques include risk-free interest rates, credit spreads and other premia used in estimating discount rates, bonds and equity prices. The objective of valuation techniques is to arrive at a fair value determination that reflects the price of the financial instrument at the reporting date that would have been determined by market participants acting at arm’s length.
The Group uses widely recognised valuation models for determining the fair value of common and more simple financial instruments, such as interest rate and currency swaps that use only observable market data and require little management judgement and estimation. Observable prices and model inputs are usually available in the market for listed debt and equity securities, exchange-traded derivatives and simple over-the-counter derivatives like interest rate swaps. Availability of observable market prices and model inputs reduces the need for management judgment and estimation and also reduces the uncertainty associated with the determination of fair values. Availability of observable market prices and inputs varies depending on the products and markets and is prone to changes based on specific events and general conditions in the financial markets.
(viii) Income TaxesThe Group is subject to income taxes in numerous jurisdictions. Significant estimates are required in determining the Group-wide provision for income taxes. There are many transactions and calculations for which the ultimate tax determination is uncertain during the ordinary course of business. The Group recognises liabilities for anticipated tax audit issues based on estimates of whether additional taxes will be due. Where the final tax outcome of these matters is different from the amounts that were initially recorded, such differences will impact the income tax and deferred tax provisions in the period in which such determination is made.
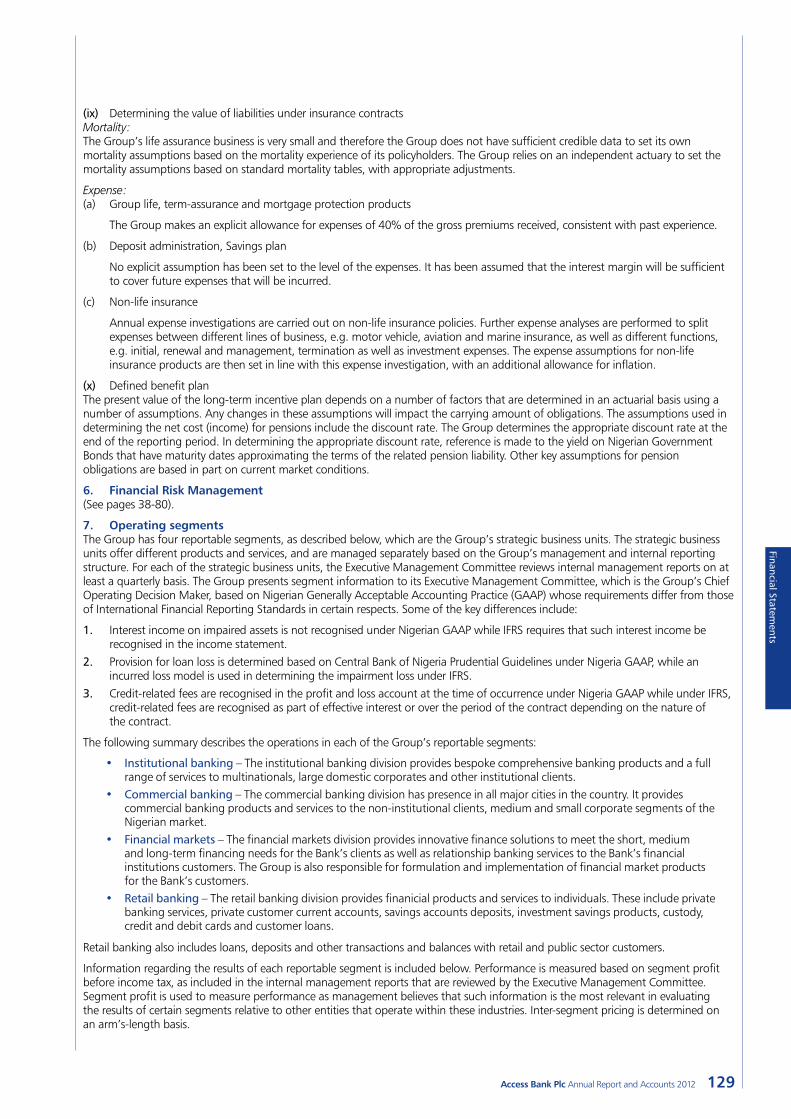
129Access Bank Plc Annual Report and Accounts 2012
Financial Statements
(ix) Determining the value of liabilities under insurance contractsMortality:The Group’s life assurance business is very small and therefore the Group does not have sufficient credible data to set its own mortality assumptions based on the mortality experience of its policyholders. The Group relies on an independent actuary to set the mortality assumptions based on standard mortality tables, with appropriate adjustments.
Expense:(a) Group life, term-assurance and mortgage protection products
The Group makes an explicit allowance for expenses of 40% of the gross premiums received, consistent with past experience.
(b) Deposit administration, Savings plan
No explicit assumption has been set to the level of the expenses. It has been assumed that the interest margin will be sufficient to cover future expenses that will be incurred.
(c) Non-life insurance
Annual expense investigations are carried out on non-life insurance policies. Further expense analyses are performed to split expenses between different lines of business, e.g. motor vehicle, aviation and marine insurance, as well as different functions, e.g. initial, renewal and management, termination as well as investment expenses. The expense assumptions for non-life insurance products are then set in line with this expense investigation, with an additional allowance for inflation.
(x) Defined benefit planThe present value of the long-term incentive plan depends on a number of factors that are determined in an actuarial basis using a number of assumptions. Any changes in these assumptions will impact the carrying amount of obligations. The assumptions used in determining the net cost (income) for pensions include the discount rate. The Group determines the appropriate discount rate at the end of the reporting period. In determining the appropriate discount rate, reference is made to the yield on Nigerian Government Bonds that have maturity dates approximating the terms of the related pension liability. Other key assumptions for pension obligations are based in part on current market conditions.
6. Financial Risk Management(See pages 38-80).
7. Operating segmentsThe Group has four reportable segments, as described below, which are the Group’s strategic business units. The strategic business units offer different products and services, and are managed separately based on the Group’s management and internal reporting structure. For each of the strategic business units, the Executive Management Committee reviews internal management reports on at least a quarterly basis. The Group presents segment information to its Executive Management Committee, which is the Group’s Chief Operating Decision Maker, based on Nigerian Generally Acceptable Accounting Practice (GAAP) whose requirements differ from those of International Financial Reporting Standards in certain respects. Some of the key differences include:
1. Interest income on impaired assets is not recognised under Nigerian GAAP while IFRS requires that such interest income be recognised in the income statement.
2. Provision for loan loss is determined based on Central Bank of Nigeria Prudential Guidelines under Nigeria GAAP, while an incurred loss model is used in determining the impairment loss under IFRS.
3. Credit-related fees are recognised in the profit and loss account at the time of occurrence under Nigeria GAAP while under IFRS, credit-related fees are recognised as part of effective interest or over the period of the contract depending on the nature of the contract.
The following summary describes the operations in each of the Group’s reportable segments:
• Institutional banking – The institutional banking division provides bespoke comprehensive banking products and a full range of services to multinationals, large domestic corporates and other institutional clients.
• Commercial banking – The commercial banking division has presence in all major cities in the country. It provides commercial banking products and services to the non-institutional clients, medium and small corporate segments of the Nigerian market.
• Financial markets – The financial markets division provides innovative finance solutions to meet the short, medium and long-term financing needs for the Bank’s clients as well as relationship banking services to the Bank’s financial institutions customers. The Group is also responsible for formulation and implementation of financial market products for the Bank’s customers.
• Retail banking – The retail banking division provides finanicial products and services to individuals. These include private banking services, private customer current accounts, savings accounts deposits, investment savings products, custody, credit and debit cards and customer loans.
Retail banking also includes loans, deposits and other transactions and balances with retail and public sector customers.
Information regarding the results of each reportable segment is included below. Performance is measured based on segment profit before income tax, as included in the internal management reports that are reviewed by the Executive Management Committee. Segment profit is used to measure performance as management believes that such information is the most relevant in evaluating the results of certain segments relative to other entities that operate within these industries. Inter-segment pricing is determined on an arm’s-length basis.
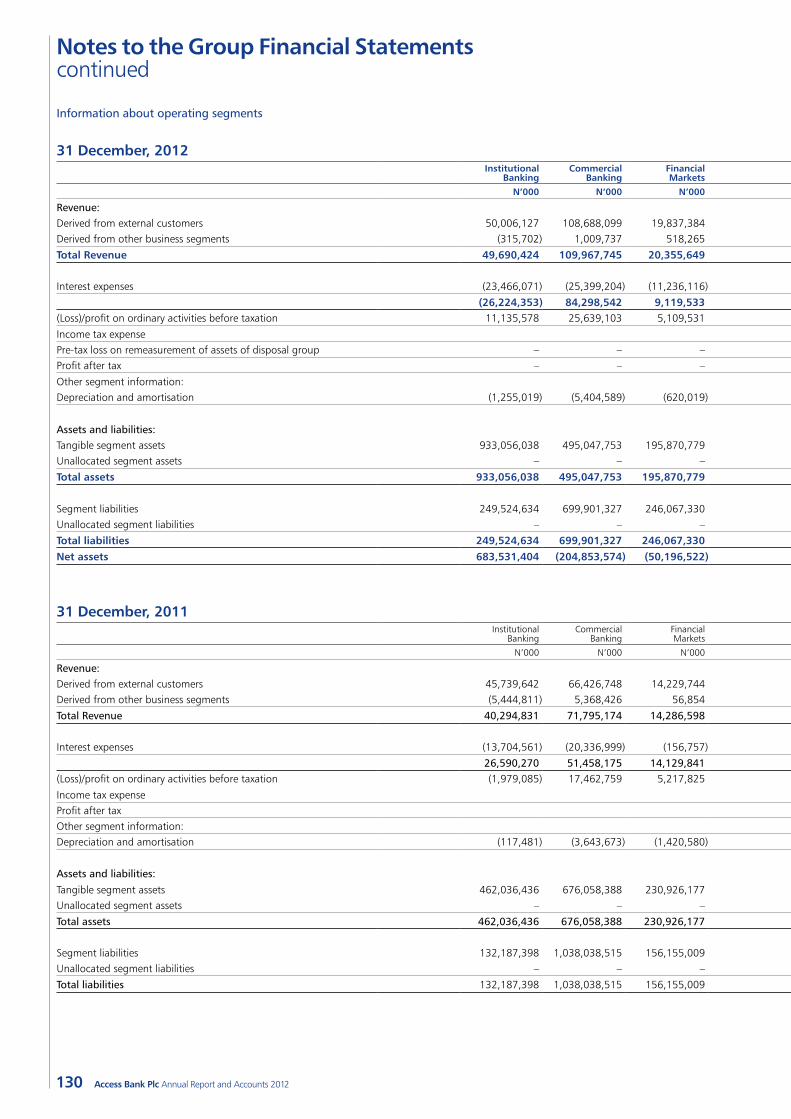
130
Notes to the Group Financial Statements continued
Access Bank Plc Annual Report and Accounts 2012
Information about operating segments
31 December, 2012Institutional
Banking Commercial
Banking Financial Markets
Retail Banking
Unallocated segments
Total continuing operations
Discontinued operations Total
N’000 N’000 N’000 N’000 N’000 N’000 N’000 N’000
Revenue:Derived from external customers 50,006,127 108,688,099 19,837,384 25,776,518 4,000,836 208,308,873 2,181,942 210,490,815Derived from other business segments (315,702) 1,009,737 518,265 (462,801) (749,498) – – –
Total Revenue 49,690,424 109,967,745 20,355,649 25,313,717 3,251,338 208,308,873 2,181,942 210,490,815
Interest expenses (23,466,071) (25,399,204) (11,236,116) (4,957,975) (92) (65,059,458) (471,002) (65,530,460)
(26,224,353) 84,298,542 9,119,533 20,355,742 3,251,246 143,249,415 1,710,940 144,960,355(Loss)/profit on ordinary activities before taxation 11,135,578 25,639,103 5,109,531 2,800,074 193,861 44,880,198 (4,116,440) 40,763,708
Income tax expense – – (2,018,307) (34,521) (2,052,828)Pre-tax loss on remeasurement of assets of disposal group – – – – – (306,096) (306,096)Profit after tax – – – – – 42,861,891 (4,457,057) 38,404,784
Other segment information: Depreciation and amortisation (1,255,019) (5,404,589) (620,019) (3,582,264) (159,619) (11,021,511) (305,442) (11,326,953)
Assets and liabilities: Tangible segment assets 933,056,038 495,047,753 195,870,779 30,319,137 60,056,414 1,714,350,120 30,827,257 1,745,177,377Unallocated segment assets – – – – – – – –
Total assets 933,056,038 495,047,753 195,870,779 30,319,137 60,056,414 1,714,350,120 30,827,257 1,745,177,377
Segment liabilities 249,524,634 699,901,327 246,067,330 263,383,693 19,516,397 1,478,393,380 25,793,512 1,504,186,892Unallocated segment liabilities – – – – – – – –
Total liabilities 249,524,634 699,901,327 246,067,330 263,383,693 19,516,397 1,478,393,380 25,793,512 1,504,186,892Net assets 683,531,404 (204,853,574) (50,196,522) (233,064,556) 40,540,017 235,956,740 5,033,745 240,990,485
31 December, 2011Institutional
Banking Commercial
Banking Financial Markets
Retail Banking
Unallocated segments
Total continuing operations
Discontinued operations Total
N’000 N’000 N’000 N’000 N’000 N’000 N’000 N’000
Revenue:Derived from external customers 45,739,642 66,426,748 14,229,744 5,630,829 2,176,812 134,203,775 2,723,184 136,926,959Derived from other business segments (5,444,811) 5,368,426 56,854 19,531 – – – –
Total Revenue 40,294,831 71,795,174 14,286,598 5,650,360 2,176,812 134,203,775 2,723,184 136,926,959
Interest expenses (13,704,561) (20,336,999) (156,757) (1,884,697) (404,309) (36,487,323) (552,032) (37,039,355)
26,590,270 51,458,175 14,129,841 3,765,663 1,772,503 97,716,452 2,171,152 99,887,604(Loss)/profit on ordinary activities before taxation (1,979,085) 17,462,759 5,217,825 1,275,933 (46,383) 21,931,049 (1,629,684) 20,301,365
Income tax expense (3,593,110)Profit after tax 16,708,255Other segment information: Depreciation and amortisation (117,481) (3,643,673) (1,420,580) (234,165) (224,637) (5,640,536) (340,543) (5,981,079)
Assets and liabilities:
Tangible segment assets 462,036,436 676,058,388 230,926,177 36,424,643 229,301,111 1,634,746,755 – 1,634,746,755Unallocated segment assets – – – – – – – –
Total assets 462,036,436 676,058,388 230,926,177 36,424,643 229,301,111 1,634,746,755 – 1,634,746,755
Segment liabilities 132,187,398 1,038,038,515 156,155,009 852,562,202 26,067,422 2,205,010,546 – 2,205,010,546Unallocated segment liabilities – – – – – – – –
Total liabilities 132,187,398 1,038,038,515 156,155,009 852,562,202 26,067,422 2,205,010,546 – 2,205,010,546
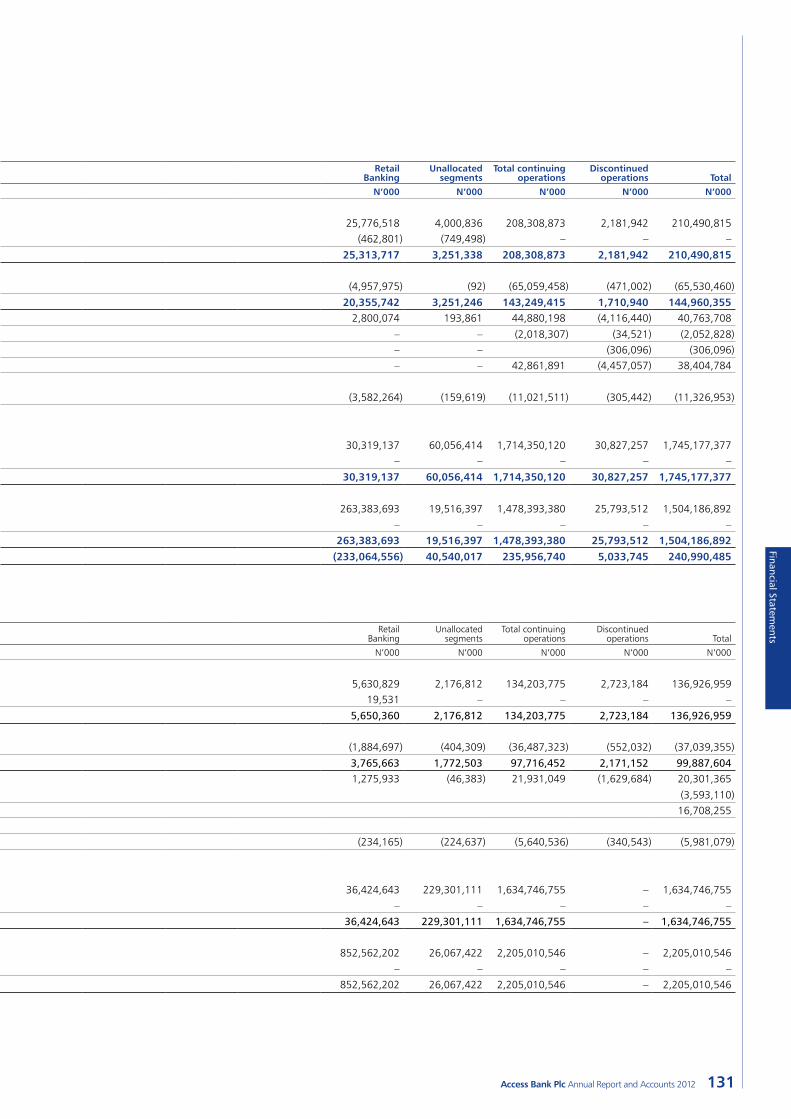
131Access Bank Plc Annual Report and Accounts 2012
Financial Statements
Information about operating segments
31 December, 2012Institutional
Banking Commercial
Banking Financial Markets
Retail Banking
Unallocated segments
Total continuing operations
Discontinued operations Total
N’000 N’000 N’000 N’000 N’000 N’000 N’000 N’000
Revenue:Derived from external customers 50,006,127 108,688,099 19,837,384 25,776,518 4,000,836 208,308,873 2,181,942 210,490,815Derived from other business segments (315,702) 1,009,737 518,265 (462,801) (749,498) – – –
Total Revenue 49,690,424 109,967,745 20,355,649 25,313,717 3,251,338 208,308,873 2,181,942 210,490,815
Interest expenses (23,466,071) (25,399,204) (11,236,116) (4,957,975) (92) (65,059,458) (471,002) (65,530,460)
(26,224,353) 84,298,542 9,119,533 20,355,742 3,251,246 143,249,415 1,710,940 144,960,355(Loss)/profit on ordinary activities before taxation 11,135,578 25,639,103 5,109,531 2,800,074 193,861 44,880,198 (4,116,440) 40,763,708
Income tax expense – – (2,018,307) (34,521) (2,052,828)Pre-tax loss on remeasurement of assets of disposal group – – – – – (306,096) (306,096)Profit after tax – – – – – 42,861,891 (4,457,057) 38,404,784
Other segment information: Depreciation and amortisation (1,255,019) (5,404,589) (620,019) (3,582,264) (159,619) (11,021,511) (305,442) (11,326,953)
Assets and liabilities: Tangible segment assets 933,056,038 495,047,753 195,870,779 30,319,137 60,056,414 1,714,350,120 30,827,257 1,745,177,377Unallocated segment assets – – – – – – – –
Total assets 933,056,038 495,047,753 195,870,779 30,319,137 60,056,414 1,714,350,120 30,827,257 1,745,177,377
Segment liabilities 249,524,634 699,901,327 246,067,330 263,383,693 19,516,397 1,478,393,380 25,793,512 1,504,186,892Unallocated segment liabilities – – – – – – – –
Total liabilities 249,524,634 699,901,327 246,067,330 263,383,693 19,516,397 1,478,393,380 25,793,512 1,504,186,892Net assets 683,531,404 (204,853,574) (50,196,522) (233,064,556) 40,540,017 235,956,740 5,033,745 240,990,485
31 December, 2011Institutional
Banking Commercial
Banking Financial Markets
Retail Banking
Unallocated segments
Total continuing operations
Discontinued operations Total
N’000 N’000 N’000 N’000 N’000 N’000 N’000 N’000
Revenue:Derived from external customers 45,739,642 66,426,748 14,229,744 5,630,829 2,176,812 134,203,775 2,723,184 136,926,959Derived from other business segments (5,444,811) 5,368,426 56,854 19,531 – – – –
Total Revenue 40,294,831 71,795,174 14,286,598 5,650,360 2,176,812 134,203,775 2,723,184 136,926,959
Interest expenses (13,704,561) (20,336,999) (156,757) (1,884,697) (404,309) (36,487,323) (552,032) (37,039,355)
26,590,270 51,458,175 14,129,841 3,765,663 1,772,503 97,716,452 2,171,152 99,887,604(Loss)/profit on ordinary activities before taxation (1,979,085) 17,462,759 5,217,825 1,275,933 (46,383) 21,931,049 (1,629,684) 20,301,365
Income tax expense (3,593,110)Profit after tax 16,708,255Other segment information: Depreciation and amortisation (117,481) (3,643,673) (1,420,580) (234,165) (224,637) (5,640,536) (340,543) (5,981,079)
Assets and liabilities:
Tangible segment assets 462,036,436 676,058,388 230,926,177 36,424,643 229,301,111 1,634,746,755 – 1,634,746,755Unallocated segment assets – – – – – – – –
Total assets 462,036,436 676,058,388 230,926,177 36,424,643 229,301,111 1,634,746,755 – 1,634,746,755
Segment liabilities 132,187,398 1,038,038,515 156,155,009 852,562,202 26,067,422 2,205,010,546 – 2,205,010,546Unallocated segment liabilities – – – – – – – –
Total liabilities 132,187,398 1,038,038,515 156,155,009 852,562,202 26,067,422 2,205,010,546 – 2,205,010,546
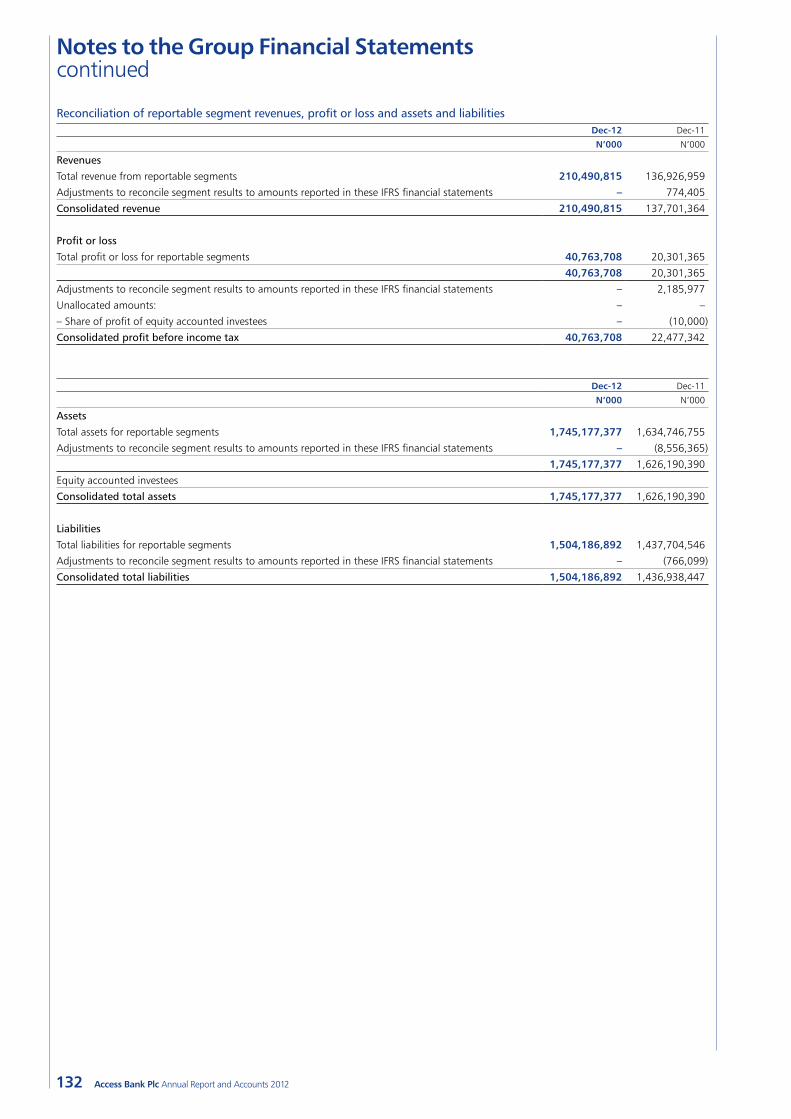
132
Notes to the Group Financial Statements continued
Access Bank Plc Annual Report and Accounts 2012
Reconciliation of reportable segment revenues, profit or loss and assets and liabilitiesDec-12 Dec-11
N’000 N’000
Revenues
Total revenue from reportable segments 210,490,815 136,926,959
Adjustments to reconcile segment results to amounts reported in these IFRS financial statements – 774,405
Consolidated revenue 210,490,815 137,701,364
Profit or loss
Total profit or loss for reportable segments 40,763,708 20,301,365
40,763,708 20,301,365
Adjustments to reconcile segment results to amounts reported in these IFRS financial statements – 2,185,977
Unallocated amounts: – –
– Share of profit of equity accounted investees – (10,000)
Consolidated profit before income tax 40,763,708 22,477,342
Dec-12 Dec-11
N’000 N’000
Assets
Total assets for reportable segments 1,745,177,377 1,634,746,755
Adjustments to reconcile segment results to amounts reported in these IFRS financial statements – (8,556,365)
1,745,177,377 1,626,190,390
Equity accounted investees
Consolidated total assets 1,745,177,377 1,626,190,390
Liabilities
Total liabilities for reportable segments 1,504,186,892 1,437,704,546
Adjustments to reconcile segment results to amounts reported in these IFRS financial statements – (766,099)
Consolidated total liabilities 1,504,186,892 1,436,938,447
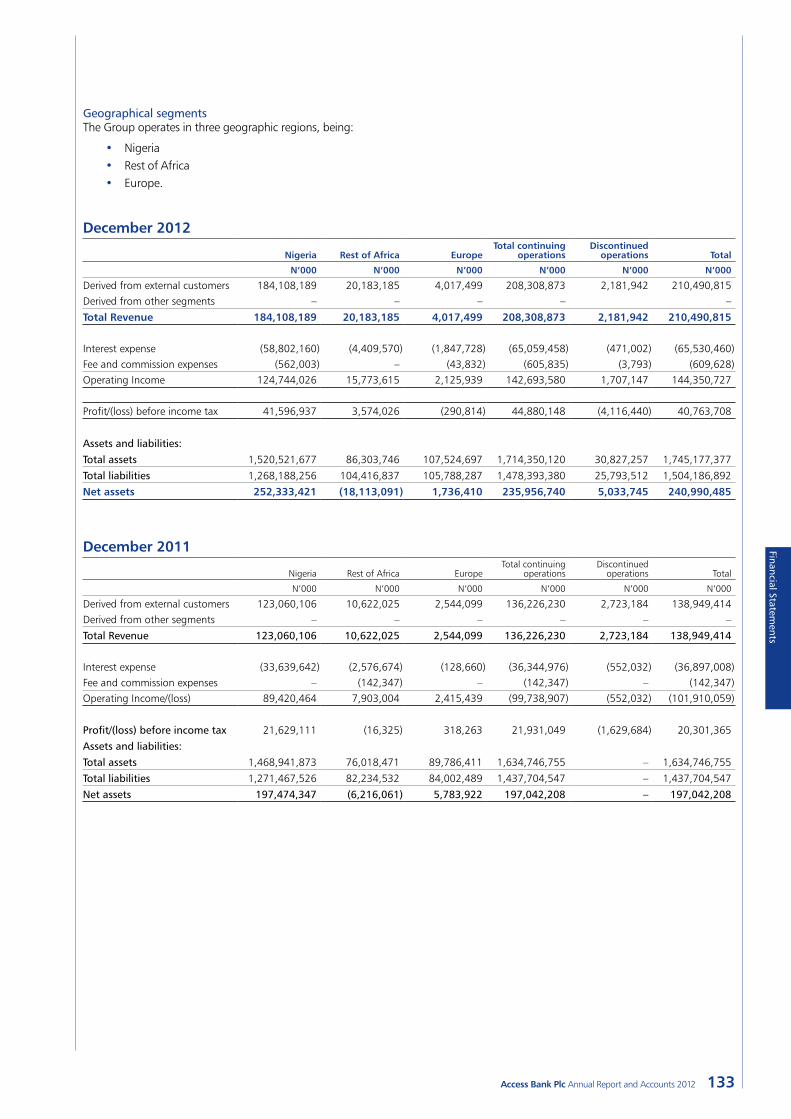
133Access Bank Plc Annual Report and Accounts 2012
Financial Statements
Geographical segmentsThe Group operates in three geographic regions, being:
• Nigeria• Rest of Africa• Europe.
December 2012
Nigeria Rest of Africa EuropeTotal continuing
operationsDiscontinued
operations Total
N’000 N’000 N’000 N’000 N’000 N’000
Derived from external customers 184,108,189 20,183,185 4,017,499 208,308,873 2,181,942 210,490,815Derived from other segments – – – – –
Total Revenue 184,108,189 20,183,185 4,017,499 208,308,873 2,181,942 210,490,815
Interest expense (58,802,160) (4,409,570) (1,847,728) (65,059,458) (471,002) (65,530,460)Fee and commission expenses (562,003) – (43,832) (605,835) (3,793) (609,628) Operating Income 124,744,026 15,773,615 2,125,939 142,693,580 1,707,147 144,350,727
Profit/(loss) before income tax 41,596,937 3,574,026 (290,814) 44,880,148 (4,116,440) 40,763,708
Assets and liabilities:
Total assets 1,520,521,677 86,303,746 107,524,697 1,714,350,120 30,827,257 1,745,177,377
Total liabilities 1,268,188,256 104,416,837 105,788,287 1,478,393,380 25,793,512 1,504,186,892
Net assets 252,333,421 (18,113,091) 1,736,410 235,956,740 5,033,745 240,990,485
December 2011
Nigeria Rest of Africa EuropeTotal continuing
operationsDiscontinued
operations Total
N’000 N’000 N’000 N’000 N’000 N’000
Derived from external customers 123,060,106 10,622,025 2,544,099 136,226,230 2,723,184 138,949,414Derived from other segments – – – – – –
Total Revenue 123,060,106 10,622,025 2,544,099 136,226,230 2,723,184 138,949,414
Interest expense (33,639,642) (2,576,674) (128,660) (36,344,976) (552,032) (36,897,008)Fee and commission expenses – (142,347) – (142,347) – (142,347)Operating Income/(loss) 89,420,464 7,903,004 2,415,439 (99,738,907) (552,032) (101,910,059)
Profit/(loss) before income tax 21,629,111 (16,325) 318,263 21,931,049 (1,629,684) 20,301,365
Assets and liabilities:
Total assets 1,468,941,873 76,018,471 89,786,411 1,634,746,755 – 1,634,746,755
Total liabilities 1,271,467,526 82,234,532 84,002,489 1,437,704,547 – 1,437,704,547
Net assets 197,474,347 (6,216,061) 5,783,922 197,042,208 – 197,042,208
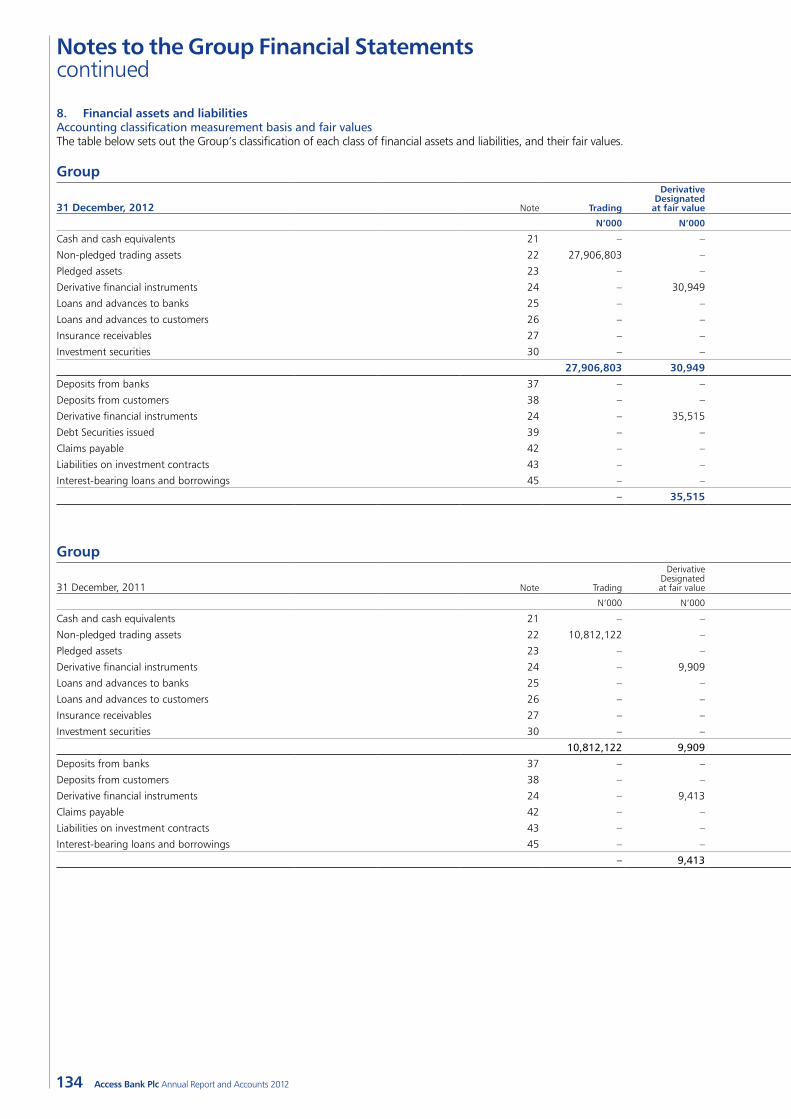
134
Notes to the Group Financial Statements continued
Access Bank Plc Annual Report and Accounts 2012
8. Financial assets and liabilitiesAccounting classification measurement basis and fair valuesThe table below sets out the Group’s classification of each class of financial assets and liabilities, and their fair values.
Group
31 December, 2012 Note Trading
Derivative Designated
at fair value Held-to- maturity
Loans and receivables at
amortised costAvailable-
for-sale
Other amortised
cost
Total carrying amount
Fair value
N’000 N’000 N’000 N’000 N’000 N’000 N’000 N’000
Cash and cash equivalents 21 – – – – – 296,184,966 296,184,966 296,184,966
Non-pledged trading assets 22 27,906,803 – – – – – 27,906,803 27,906,803
Pledged assets 23 – – 60,949,856 – – – 60,949,856 46,718,883
Derivative financial instruments 24 – 30,949 – – – – 30,949 30,949
Loans and advances to banks 25 – – – 4,564,943 – – 4,564,943 4,597,931
Loans and advances to customers 26 – – – 604,073,399 – – 604,073,399 634,389,210
Insurance receivables 27 – – – 627,337 – – 627,337 627,337
Investment securities 30 – – 390,541,200 – 56,740,611 – 447,281,811 410,215,324
27,906,803 30,949 451,491,056 609,265,679 56,740,611 296,184,966 1,441,620,064 1,420,671,403Deposits from banks 37 – – – – – 105,170,552 105,170,552 117,249,799
Deposits from customers 38 – – – – – 1,201,481,996 1,201,481,996 1,188,514,320
Derivative financial instruments 24 – 35,515 – – – – 35,515 35,515
Debt Securities issued 39 – – – – – 54,685,891 54,685,891 55,070,670
Claims payable 42 – – – – – 118,226 118,226 118,226
Liabilities on investment contracts 43 – – – – – 65,591 65,591 65,591
Interest-bearing loans and borrowings 45 – – – – – 40,092,312 40,092,312 58,034,715
– 35,515 – – – 1,401,614,568 1,401,650,083 1,419,088,836
Group
31 December, 2011 Note Trading
Derivative Designated at fair value
Held-to- maturity
Loans and receivables at
amortised costAvailable-
for-sale
Other amortised
cost
Total carrying amount
Fair value
N’000 N’000 N’000 N’000 N’000 N’000 N’000 N’000
Cash and cash equivalents 21 – – – – – 191,518,474 191,518,474 185,018,474
Non-pledged trading assets 22 10,812,122 – – – – – 10,812,122 10,812,122
Pledged assets 23 – – 66,191,144 – – – 66,191,144 60,442,599
Derivative financial instruments 24 – 9,909 – – – – 9,909 9,909
Loans and advances to banks 25 – – – 775,765 – – 775,765 760,636
Loans and advances to customers 26 – – – 576,228,507 – – 576,228,507 541,971,884
Insurance receivables 27 – – – 1,405,000 – – 1,405,000 1,405,000
Investment securities 30 – – 514,755,308 – 46,978,397 – 561,733,704 508,846,837
10,812,122 9,909 580,946,452 578,409,272 46,978,397 191,518,474 1,408,674,625 1,309,267,461
Deposits from banks 37 – – – – – 146,808,286 146,808,286 149,481,617
Deposits from customers 38 – – – – – 1,101,703,921 1,101,703,921 1,093,115,656
Derivative financial instruments 24 – 9,413 – – – – 9,413 9,413
Claims payable 42 – – – – – 450,000 450,000 395,000
Liabilities on investment contracts 43 – – – – – 61,000 61,000 59,000
Interest-bearing loans and borrowings 45 – – – – – 29,258,273 29,258,273 29,243,369
– 9,413 – – – 1,278,281,480 1,278,290,893 1,272,304,055
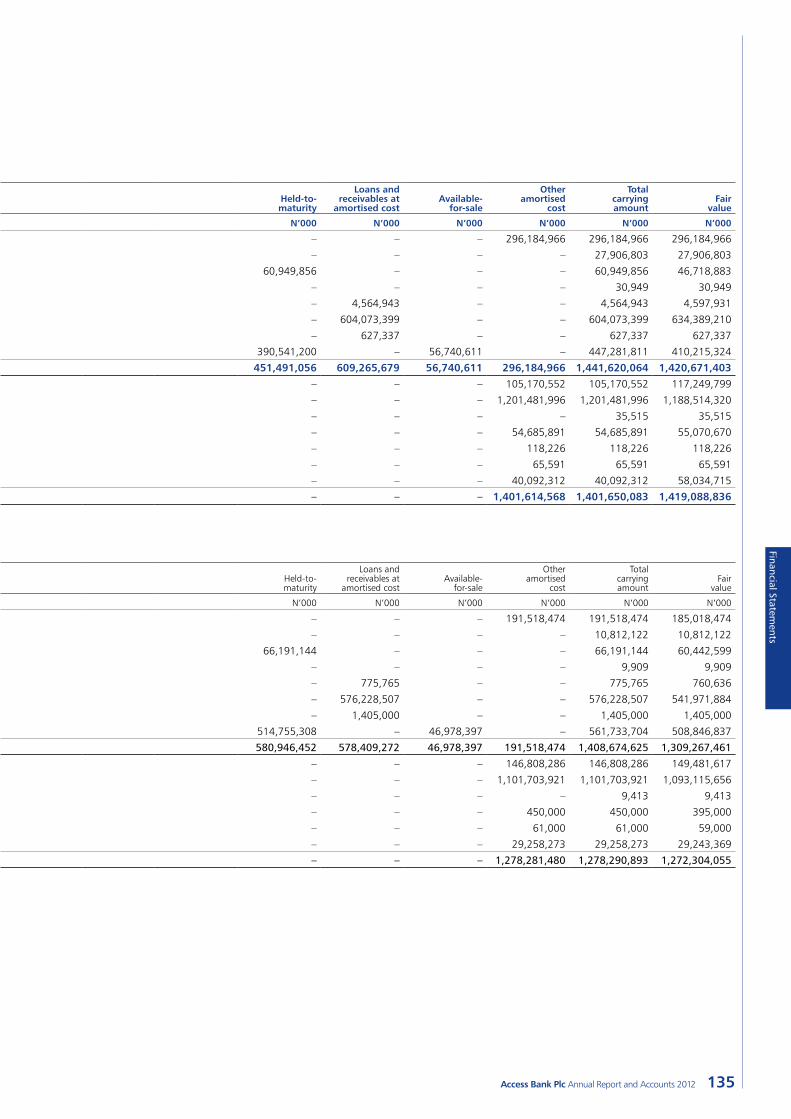
135Access Bank Plc Annual Report and Accounts 2012
Financial Statements
8. Financial assets and liabilitiesAccounting classification measurement basis and fair valuesThe table below sets out the Group’s classification of each class of financial assets and liabilities, and their fair values.
Group
31 December, 2012 Note Trading
Derivative Designated
at fair value Held-to- maturity
Loans and receivables at
amortised costAvailable-
for-sale
Other amortised
cost
Total carrying amount
Fair value
N’000 N’000 N’000 N’000 N’000 N’000 N’000 N’000
Cash and cash equivalents 21 – – – – – 296,184,966 296,184,966 296,184,966
Non-pledged trading assets 22 27,906,803 – – – – – 27,906,803 27,906,803
Pledged assets 23 – – 60,949,856 – – – 60,949,856 46,718,883
Derivative financial instruments 24 – 30,949 – – – – 30,949 30,949
Loans and advances to banks 25 – – – 4,564,943 – – 4,564,943 4,597,931
Loans and advances to customers 26 – – – 604,073,399 – – 604,073,399 634,389,210
Insurance receivables 27 – – – 627,337 – – 627,337 627,337
Investment securities 30 – – 390,541,200 – 56,740,611 – 447,281,811 410,215,324
27,906,803 30,949 451,491,056 609,265,679 56,740,611 296,184,966 1,441,620,064 1,420,671,403Deposits from banks 37 – – – – – 105,170,552 105,170,552 117,249,799
Deposits from customers 38 – – – – – 1,201,481,996 1,201,481,996 1,188,514,320
Derivative financial instruments 24 – 35,515 – – – – 35,515 35,515
Debt Securities issued 39 – – – – – 54,685,891 54,685,891 55,070,670
Claims payable 42 – – – – – 118,226 118,226 118,226
Liabilities on investment contracts 43 – – – – – 65,591 65,591 65,591
Interest-bearing loans and borrowings 45 – – – – – 40,092,312 40,092,312 58,034,715
– 35,515 – – – 1,401,614,568 1,401,650,083 1,419,088,836
Group
31 December, 2011 Note Trading
Derivative Designated at fair value
Held-to- maturity
Loans and receivables at
amortised costAvailable-
for-sale
Other amortised
cost
Total carrying amount
Fair value
N’000 N’000 N’000 N’000 N’000 N’000 N’000 N’000
Cash and cash equivalents 21 – – – – – 191,518,474 191,518,474 185,018,474
Non-pledged trading assets 22 10,812,122 – – – – – 10,812,122 10,812,122
Pledged assets 23 – – 66,191,144 – – – 66,191,144 60,442,599
Derivative financial instruments 24 – 9,909 – – – – 9,909 9,909
Loans and advances to banks 25 – – – 775,765 – – 775,765 760,636
Loans and advances to customers 26 – – – 576,228,507 – – 576,228,507 541,971,884
Insurance receivables 27 – – – 1,405,000 – – 1,405,000 1,405,000
Investment securities 30 – – 514,755,308 – 46,978,397 – 561,733,704 508,846,837
10,812,122 9,909 580,946,452 578,409,272 46,978,397 191,518,474 1,408,674,625 1,309,267,461
Deposits from banks 37 – – – – – 146,808,286 146,808,286 149,481,617
Deposits from customers 38 – – – – – 1,101,703,921 1,101,703,921 1,093,115,656
Derivative financial instruments 24 – 9,413 – – – – 9,413 9,413
Claims payable 42 – – – – – 450,000 450,000 395,000
Liabilities on investment contracts 43 – – – – – 61,000 61,000 59,000
Interest-bearing loans and borrowings 45 – – – – – 29,258,273 29,258,273 29,243,369
– 9,413 – – – 1,278,281,480 1,278,290,893 1,272,304,055
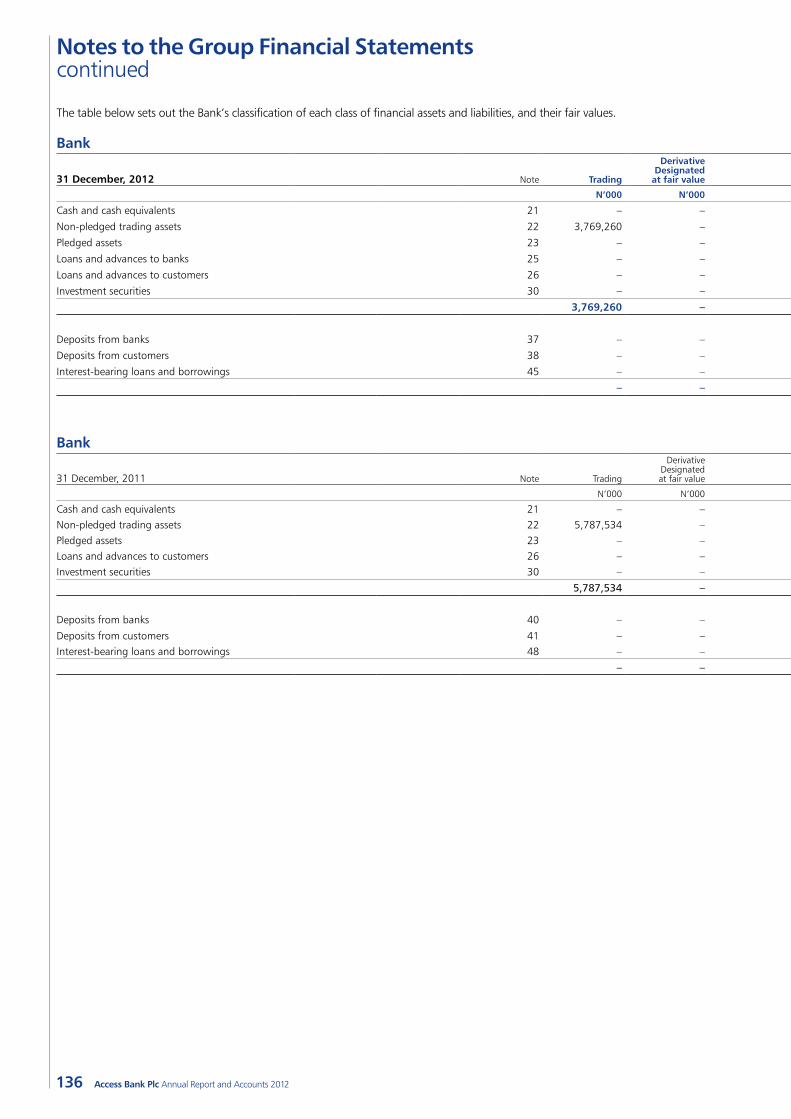
136
Notes to the Group Financial Statements continued
Access Bank Plc Annual Report and Accounts 2012
The table below sets out the Bank’s classification of each class of financial assets and liabilities, and their fair values.
Bank
31 December, 2012 Note Trading
Derivative Designated
at fair value Held-to- maturity
Loans and receivables at
amortised costAvailable-
for-sale
Other amortised
cost
Total carrying amount
Fair value
N’000 N’000 N’000 N’000 N’000 N’000 N’000 N’000
Cash and cash equivalents 21 – – – – – 176,228,932 176,228,932 176,228,932
Non-pledged trading assets 22 3,769,260 – – – – – 3,769,260 3,769,260
Pledged assets 23 – – 60,949,856 – – – 60,949,856 46,718,883
Loans and advances to banks 25 – – – 3,054,520 – – 3,054,520 3,054,520
Loans and advances to customers 26 – – – 554,592,198 – – 554,592,198 557,144,866
Investment securities 30 – – 366,772,849 – 53,573,446 – 420,346,295 382,608,406
3,769,260 – 427,722,705 557,646,718 53,573,446 176,228,932 1,218,941,061 1,169,524,867
Deposits from banks 37 – – – – – 24,590,053 24,590,053 16,190,124
Deposits from customers 38 – – – – – 1,093,979,220 1,093,979,220 1,083,040,794
Interest-bearing loans and borrowings 45 – – – – – 95,594,904 95,594,904 98,388,315
– – – – – 1,214,164,177 1,214,164,177 1,197,619,233
Bank
31 December, 2011 Note Trading
Derivative Designated at fair value
Held-to- maturity
Loans and receivables at
amortised costAvailable-
for-sale
Other amortised
cost
Total carrying amount
Fair value
N’000 N’000 N’000 N’000 N’000 N’000 N’000 N’000
Cash and cash equivalents 21 – – – – – 98,255,964 98,255,964 98,255,964 Non-pledged trading assets 22 5,787,534 – – – – – 5,787,534 5,787,534 Pledged assets 23 – – – – – 66,191,144 66,191,144 50,736,401 Loans and advances to customers 26 – – – 490,877,501 – – 490,877,501 493,136,904 Investment securities 30 – – 111,894,871 – 15,525,164 – 127,420,035 115,980,507
5,787,534 – 111,894,871 490,877,501 15,525,164 164,447,108 788,532,178 763,897,311
Deposits from banks 40 – – – – – 143,073,663 143,073,663 94,199,892
Deposits from customers 41 – – – – – 522,922,292 522,922,292 517,693,722 Interest-bearing loans and borrowings 48 – – – – – 29,243,818 29,243,818 30,098,361
– – – – – 695,239,773 695,239,773 641,991,976
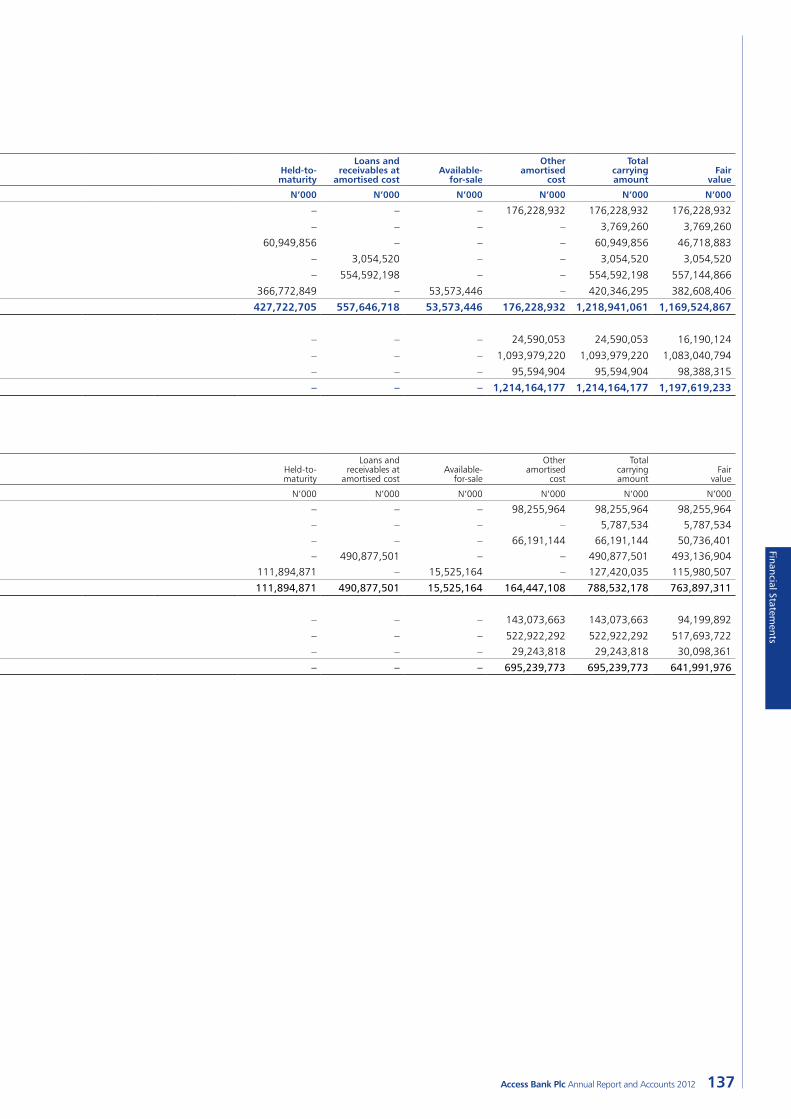
137Access Bank Plc Annual Report and Accounts 2012
Financial Statements
The table below sets out the Bank’s classification of each class of financial assets and liabilities, and their fair values.
Bank
31 December, 2012 Note Trading
Derivative Designated
at fair value Held-to- maturity
Loans and receivables at
amortised costAvailable-
for-sale
Other amortised
cost
Total carrying amount
Fair value
N’000 N’000 N’000 N’000 N’000 N’000 N’000 N’000
Cash and cash equivalents 21 – – – – – 176,228,932 176,228,932 176,228,932
Non-pledged trading assets 22 3,769,260 – – – – – 3,769,260 3,769,260
Pledged assets 23 – – 60,949,856 – – – 60,949,856 46,718,883
Loans and advances to banks 25 – – – 3,054,520 – – 3,054,520 3,054,520
Loans and advances to customers 26 – – – 554,592,198 – – 554,592,198 557,144,866
Investment securities 30 – – 366,772,849 – 53,573,446 – 420,346,295 382,608,406
3,769,260 – 427,722,705 557,646,718 53,573,446 176,228,932 1,218,941,061 1,169,524,867
Deposits from banks 37 – – – – – 24,590,053 24,590,053 16,190,124
Deposits from customers 38 – – – – – 1,093,979,220 1,093,979,220 1,083,040,794
Interest-bearing loans and borrowings 45 – – – – – 95,594,904 95,594,904 98,388,315
– – – – – 1,214,164,177 1,214,164,177 1,197,619,233
Bank
31 December, 2011 Note Trading
Derivative Designated at fair value
Held-to- maturity
Loans and receivables at
amortised costAvailable-
for-sale
Other amortised
cost
Total carrying amount
Fair value
N’000 N’000 N’000 N’000 N’000 N’000 N’000 N’000
Cash and cash equivalents 21 – – – – – 98,255,964 98,255,964 98,255,964 Non-pledged trading assets 22 5,787,534 – – – – – 5,787,534 5,787,534 Pledged assets 23 – – – – – 66,191,144 66,191,144 50,736,401 Loans and advances to customers 26 – – – 490,877,501 – – 490,877,501 493,136,904 Investment securities 30 – – 111,894,871 – 15,525,164 – 127,420,035 115,980,507
5,787,534 – 111,894,871 490,877,501 15,525,164 164,447,108 788,532,178 763,897,311
Deposits from banks 40 – – – – – 143,073,663 143,073,663 94,199,892
Deposits from customers 41 – – – – – 522,922,292 522,922,292 517,693,722 Interest-bearing loans and borrowings 48 – – – – – 29,243,818 29,243,818 30,098,361
– – – – – 695,239,773 695,239,773 641,991,976
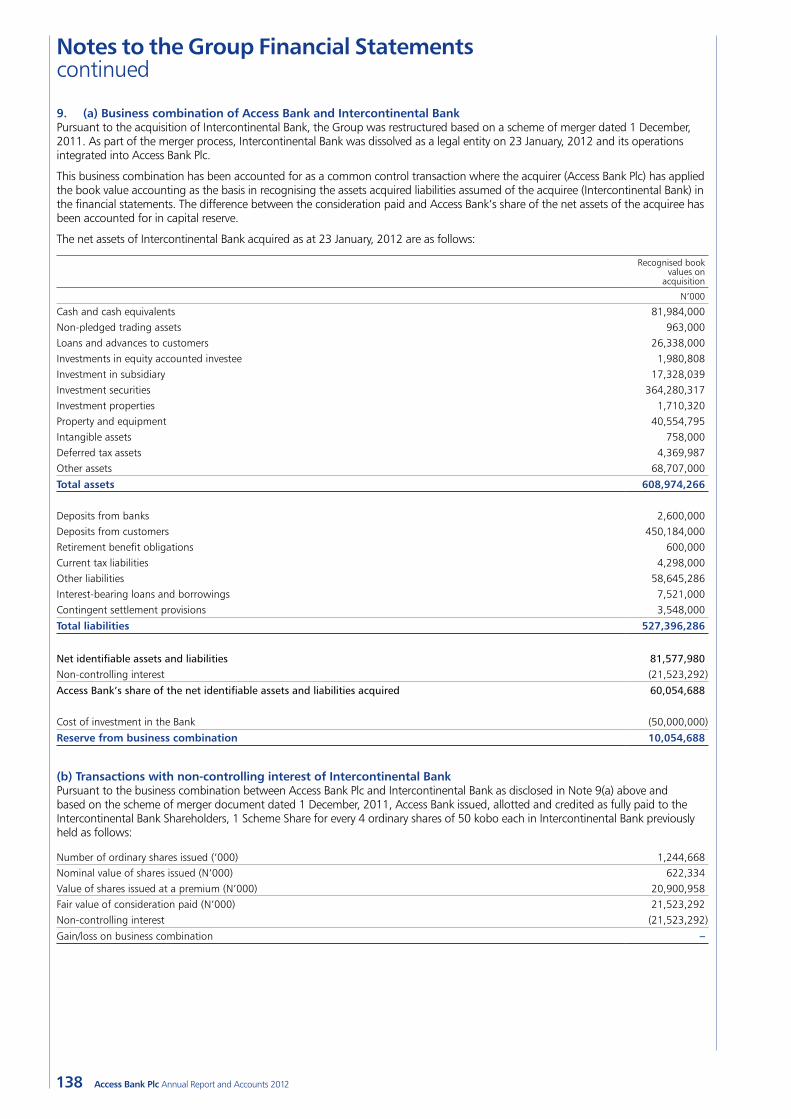
138
Notes to the Group Financial Statements continued
Access Bank Plc Annual Report and Accounts 2012
9. (a) Business combination of Access Bank and Intercontinental BankPursuant to the acquisition of Intercontinental Bank, the Group was restructured based on a scheme of merger dated 1 December, 2011. As part of the merger process, Intercontinental Bank was dissolved as a legal entity on 23 January, 2012 and its operations integrated into Access Bank Plc.
This business combination has been accounted for as a common control transaction where the acquirer (Access Bank Plc) has applied the book value accounting as the basis in recognising the assets acquired liabilities assumed of the acquiree (Intercontinental Bank) in the financial statements. The difference between the consideration paid and Access Bank’s share of the net assets of the acquiree has been accounted for in capital reserve.
The net assets of Intercontinental Bank acquired as at 23 January, 2012 are as follows:
Recognised book values on
acquisition
N’000
Cash and cash equivalents 81,984,000Non-pledged trading assets 963,000Loans and advances to customers 26,338,000Investments in equity accounted investee 1,980,808Investment in subsidiary 17,328,039Investment securities 364,280,317Investment properties 1,710,320Property and equipment 40,554,795Intangible assets 758,000 Deferred tax assets 4,369,987Other assets 68,707,000
Total assets 608,974,266
Deposits from banks 2,600,000 Deposits from customers 450,184,000Retirement benefit obligations 600,000 Current tax liabilities 4,298,000Other liabilities 58,645,286Interest-bearing loans and borrowings 7,521,000 Contingent settlement provisions 3,548,000
Total liabilities 527,396,286
Net identifiable assets and liabilities 81,577,980 Non-controlling interest (21,523,292)
Access Bank’s share of the net identifiable assets and liabilities acquired 60,054,688
Cost of investment in the Bank (50,000,000)
Reserve from business combination 10,054,688
(b) Transactions with non-controlling interest of Intercontinental BankPursuant to the business combination between Access Bank Plc and Intercontinental Bank as disclosed in Note 9(a) above and based on the scheme of merger document dated 1 December, 2011, Access Bank issued, allotted and credited as fully paid to the Intercontinental Bank Shareholders, 1 Scheme Share for every 4 ordinary shares of 50 kobo each in Intercontinental Bank previously held as follows:
Number of ordinary shares issued (‘000) 1,244,668Nominal value of shares issued (N’000) 622,334 Value of shares issued at a premium (N’000) 20,900,958 Fair value of consideration paid (N’000) 21,523,292Non-controlling interest (21,523,292)
Gain/loss on business combination –
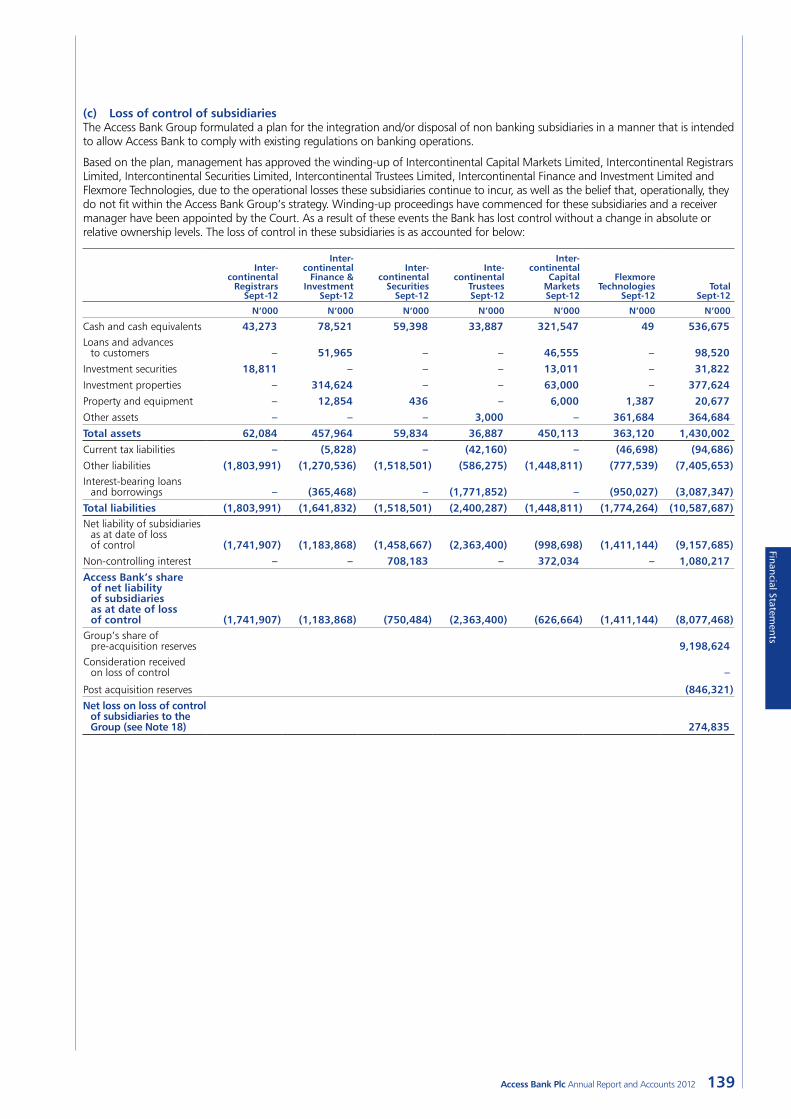
139Access Bank Plc Annual Report and Accounts 2012
Financial Statements
(c) Loss of control of subsidiariesThe Access Bank Group formulated a plan for the integration and/or disposal of non banking subsidiaries in a manner that is intended to allow Access Bank to comply with existing regulations on banking operations.
Based on the plan, management has approved the winding-up of Intercontinental Capital Markets Limited, Intercontinental Registrars Limited, Intercontinental Securities Limited, Intercontinental Trustees Limited, Intercontinental Finance and Investment Limited and Flexmore Technologies, due to the operational losses these subsidiaries continue to incur, as well as the belief that, operationally, they do not fit within the Access Bank Group’s strategy. Winding-up proceedings have commenced for these subsidiaries and a receiver manager have been appointed by the Court. As a result of these events the Bank has lost control without a change in absolute or relative ownership levels. The loss of control in these subsidiaries is as accounted for below:
Inter- continental
Registrars Sept-12
Inter- continental
Finance & Investment
Sept-12
Inter- continental
Securities Sept-12
Inte- continental
Trustees Sept-12
Inter- continental
Capital Markets Sept-12
Flexmore Technologies
Sept-12Total
Sept-12
N’000 N’000 N’000 N’000 N’000 N’000 N’000
Cash and cash equivalents 43,273 78,521 59,398 33,887 321,547 49 536,675Loans and advances
to customers – 51,965 – – 46,555 – 98,520Investment securities 18,811 – – – 13,011 – 31,822Investment properties – 314,624 – – 63,000 – 377,624Property and equipment – 12,854 436 – 6,000 1,387 20,677Other assets – – – 3,000 – 361,684 364,684Total assets 62,084 457,964 59,834 36,887 450,113 363,120 1,430,002Current tax liabilities – (5,828) – (42,160) – (46,698) (94,686)Other liabilities (1,803,991) (1,270,536) (1,518,501) (586,275) (1,448,811) (777,539) (7,405,653)Interest-bearing loans
and borrowings – (365,468) – (1,771,852) – (950,027) (3,087,347)Total liabilities (1,803,991) (1,641,832) (1,518,501) (2,400,287) (1,448,811) (1,774,264) (10,587,687)Net liability of subsidiaries
as at date of loss of control (1,741,907) (1,183,868) (1,458,667) (2,363,400) (998,698) (1,411,144) (9,157,685)
Non-controlling interest – – 708,183 – 372,034 – 1,080,217Access Bank’s share
of net liability of subsidiaries as at date of loss of control (1,741,907) (1,183,868) (750,484) (2,363,400) (626,664) (1,411,144) (8,077,468)
Group’s share of pre-acquisition reserves 9,198,624
Consideration received on loss of control –
Post acquisition reserves (846,321)Net loss on loss of control
of subsidiaries to the Group (see Note 18) 274,835
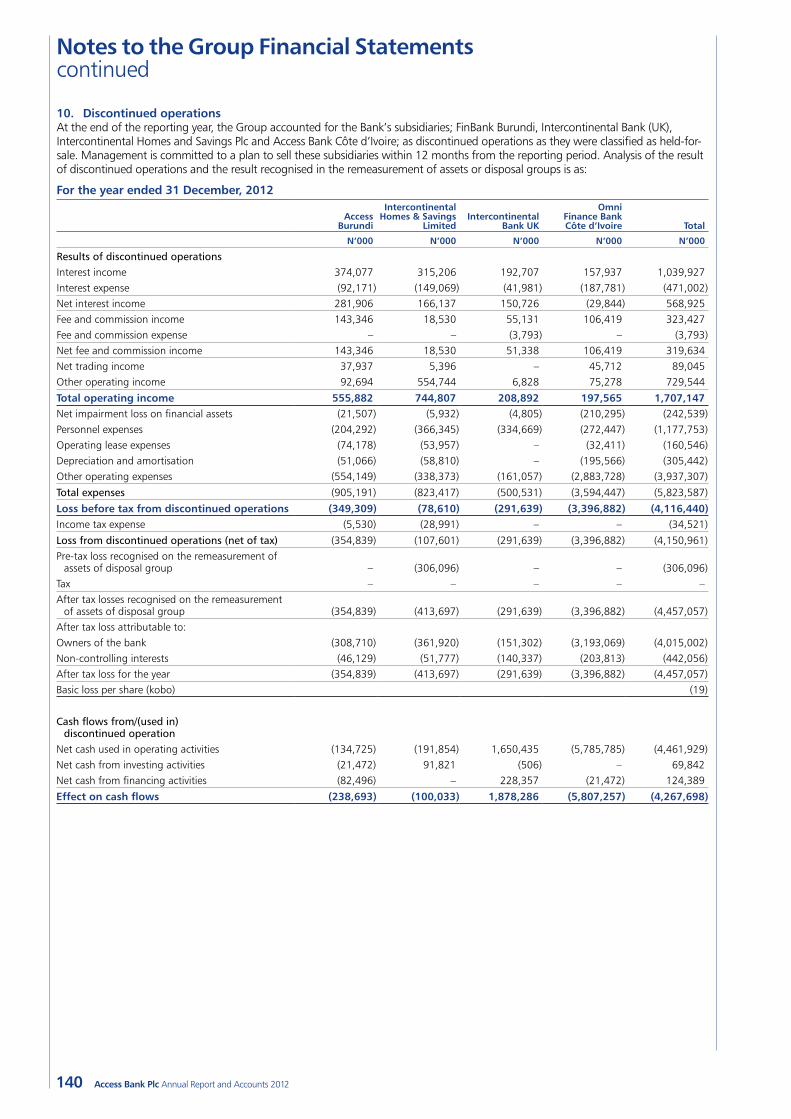
140
Notes to the Group Financial Statements continued
Access Bank Plc Annual Report and Accounts 2012
10. Discontinued operationsAt the end of the reporting year, the Group accounted for the Bank’s subsidiaries; FinBank Burundi, Intercontinental Bank (UK), Intercontinental Homes and Savings Plc and Access Bank Côte d’Ivoire; as discontinued operations as they were classified as held-for-sale. Management is committed to a plan to sell these subsidiaries within 12 months from the reporting period. Analysis of the result of discontinued operations and the result recognised in the remeasurement of assets or disposal groups is as:
For the year ended 31 December, 2012
Access Burundi
Intercontinental Homes & Savings
LimitedIntercontinental
Bank UK
Omni Finance Bank Côte d’Ivoire Total
N’000 N’000 N’000 N’000 N’000
Results of discontinued operationsInterest income 374,077 315,206 192,707 157,937 1,039,927 Interest expense (92,171) (149,069) (41,981) (187,781) (471,002) Net interest income 281,906 166,137 150,726 (29,844) 568,925Fee and commission income 143,346 18,530 55,131 106,419 323,427 Fee and commission expense – – (3,793) – (3,793) Net fee and commission income 143,346 18,530 51,338 106,419 319,634Net trading income 37,937 5,396 – 45,712 89,045 Other operating income 92,694 554,744 6,828 75,278 729,544
Total operating income 555,882 744,807 208,892 197,565 1,707,147Net impairment loss on financial assets (21,507) (5,932) (4,805) (210,295) (242,539) Personnel expenses (204,292) (366,345) (334,669) (272,447) (1,177,753) Operating lease expenses (74,178) (53,957) – (32,411) (160,546) Depreciation and amortisation (51,066) (58,810) – (195,566) (305,442) Other operating expenses (554,149) (338,373) (161,057) (2,883,728) (3,937,307)
Total expenses (905,191) (823,417) (500,531) (3,594,447) (5,823,587)
Loss before tax from discontinued operations (349,309) (78,610) (291,639) (3,396,882) (4,116,440) Income tax expense (5,530) (28,991) – – (34,521)
Loss from discontinued operations (net of tax) (354,839) (107,601) (291,639) (3,396,882) (4,150,961)Pre-tax loss recognised on the remeasurement of
assets of disposal group – (306,096) – – (306,096) Tax – – – – –After tax losses recognised on the remeasurement
of assets of disposal group (354,839) (413,697) (291,639) (3,396,882) (4,457,057)After tax loss attributable to:Owners of the bank (308,710) (361,920) (151,302) (3,193,069) (4,015,002)Non-controlling interests (46,129) (51,777) (140,337) (203,813) (442,056)After tax loss for the year (354,839) (413,697) (291,639) (3,396,882) (4,457,057)Basic loss per share (kobo) (19)
Cash flows from/(used in) discontinued operation
Net cash used in operating activities (134,725) (191,854) 1,650,435 (5,785,785) (4,461,929) Net cash from investing activities (21,472) 91,821 (506) – 69,842 Net cash from financing activities (82,496) – 228,357 (21,472) 124,389
Effect on cash flows (238,693) (100,033) 1,878,286 (5,807,257) (4,267,698)
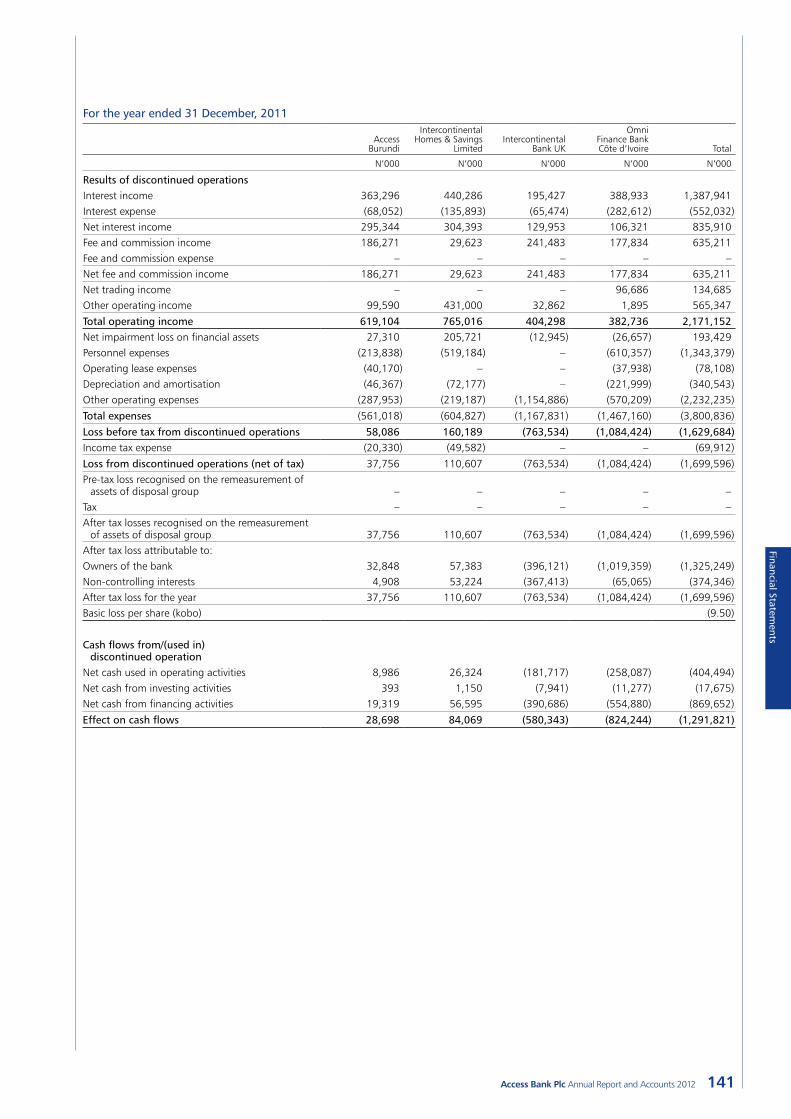
141Access Bank Plc Annual Report and Accounts 2012
Financial Statements
For the year ended 31 December, 2011
Access Burundi
Intercontinental Homes & Savings
LimitedIntercontinental
Bank UK
Omni Finance Bank Côte d’Ivoire Total
N’000 N’000 N’000 N’000 N’000
Results of discontinued operationsInterest income 363,296 440,286 195,427 388,933 1,387,941 Interest expense (68,052) (135,893) (65,474) (282,612) (552,032) Net interest income 295,344 304,393 129,953 106,321 835,910Fee and commission income 186,271 29,623 241,483 177,834 635,211 Fee and commission expense – – – – –Net fee and commission income 186,271 29,623 241,483 177,834 635,211Net trading income – – – 96,686 134,685 Other operating income 99,590 431,000 32,862 1,895 565,347
Total operating income 619,104 765,016 404,298 382,736 2,171,152Net impairment loss on financial assets 27,310 205,721 (12,945) (26,657) 193,429 Personnel expenses (213,838) (519,184) – (610,357) (1,343,379) Operating lease expenses (40,170) – – (37,938) (78,108) Depreciation and amortisation (46,367) (72,177) – (221,999) (340,543) Other operating expenses (287,953) (219,187) (1,154,886) (570,209) (2,232,235)
Total expenses (561,018) (604,827) (1,167,831) (1,467,160) (3,800,836)
Loss before tax from discontinued operations 58,086 160,189 (763,534) (1,084,424) (1,629,684) Income tax expense (20,330) (49,582) – – (69,912)
Loss from discontinued operations (net of tax) 37,756 110,607 (763,534) (1,084,424) (1,699,596)Pre-tax loss recognised on the remeasurement of
assets of disposal group – – – – –Tax – – – – –After tax losses recognised on the remeasurement
of assets of disposal group 37,756 110,607 (763,534) (1,084,424) (1,699,596)After tax loss attributable to:Owners of the bank 32,848 57,383 (396,121) (1,019,359) (1,325,249)Non-controlling interests 4,908 53,224 (367,413) (65,065) (374,346)After tax loss for the year 37,756 110,607 (763,534) (1,084,424) (1,699,596)Basic loss per share (kobo) (9.50)
Cash flows from/(used in) discontinued operation
Net cash used in operating activities 8,986 26,324 (181,717) (258,087) (404,494) Net cash from investing activities 393 1,150 (7,941) (11,277) (17,675) Net cash from financing activities 19,319 56,595 (390,686) (554,880) (869,652)
Effect on cash flows 28,698 84,069 (580,343) (824,244) (1,291,821)
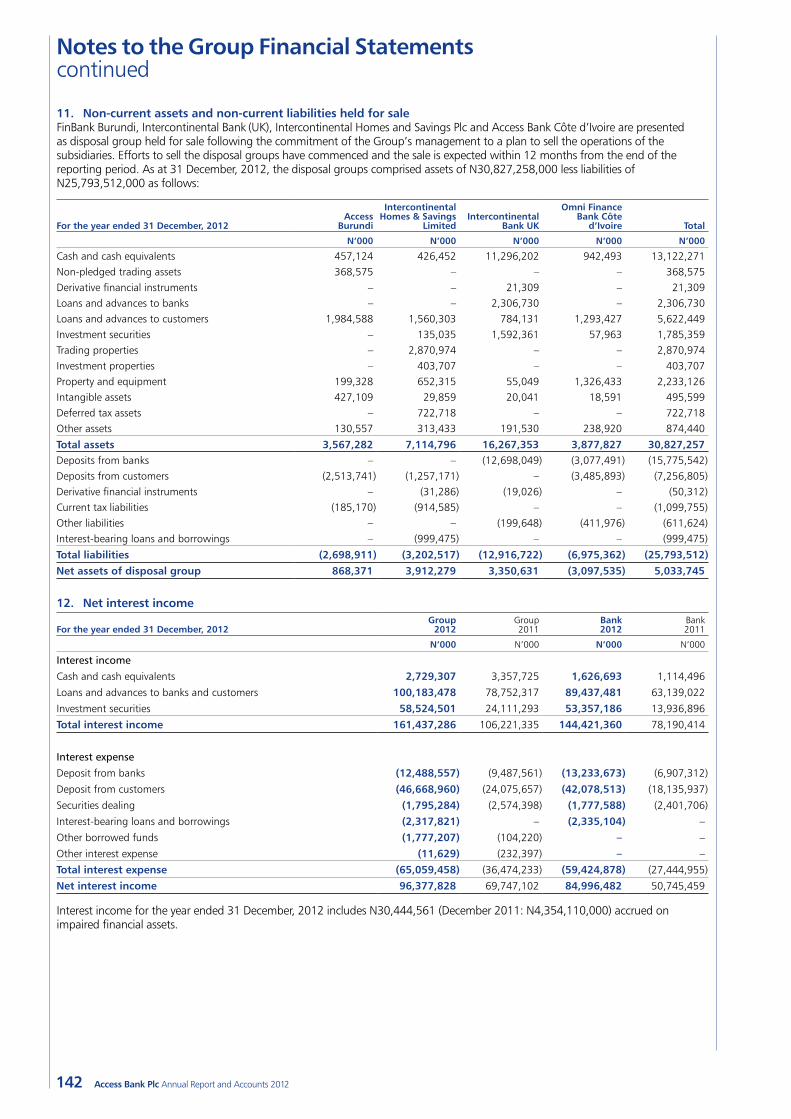
142
Notes to the Group Financial Statements continued
Access Bank Plc Annual Report and Accounts 2012
11. Non-current assets and non-current liabilities held for saleFinBank Burundi, Intercontinental Bank (UK), Intercontinental Homes and Savings Plc and Access Bank Côte d’Ivoire are presented as disposal group held for sale following the commitment of the Group’s management to a plan to sell the operations of the subsidiaries. Efforts to sell the disposal groups have commenced and the sale is expected within 12 months from the end of the reporting period. As at 31 December, 2012, the disposal groups comprised assets of N30,827,258,000 less liabilities of N25,793,512,000 as follows:
For the year ended 31 December, 2012Access
Burundi
Intercontinental Homes & Savings
LimitedIntercontinental
Bank UK
Omni Finance Bank Côte
d’Ivoire Total
N’000 N’000 N’000 N’000 N’000
Cash and cash equivalents 457,124 426,452 11,296,202 942,493 13,122,271 Non-pledged trading assets 368,575 – – – 368,575 Derivative financial instruments – – 21,309 – 21,309 Loans and advances to banks – – 2,306,730 – 2,306,730 Loans and advances to customers 1,984,588 1,560,303 784,131 1,293,427 5,622,449 Investment securities – 135,035 1,592,361 57,963 1,785,359 Trading properties – 2,870,974 – – 2,870,974 Investment properties – 403,707 – – 403,707 Property and equipment 199,328 652,315 55,049 1,326,433 2,233,126 Intangible assets 427,109 29,859 20,041 18,591 495,599 Deferred tax assets – 722,718 – – 722,718 Other assets 130,557 313,433 191,530 238,920 874,440
Total assets 3,567,282 7,114,796 16,267,353 3,877,827 30,827,257Deposits from banks – – (12,698,049) (3,077,491) (15,775,542) Deposits from customers (2,513,741) (1,257,171) – (3,485,893) (7,256,805) Derivative financial instruments – (31,286) (19,026) – (50,312) Current tax liabilities (185,170) (914,585) – – (1,099,755) Other liabilities – – (199,648) (411,976) (611,624) Interest-bearing loans and borrowings – (999,475) – – (999,475)
Total liabilities (2,698,911) (3,202,517) (12,916,722) (6,975,362) (25,793,512) Net assets of disposal group 868,371 3,912,279 3,350,631 (3,097,535) 5,033,745
12. Net interest income
For the year ended 31 December, 2012Group
2012 Group 2011
Bank 2012
Bank 2011
N’000 N’000 N’000 N’000
Interest income
Cash and cash equivalents 2,729,307 3,357,725 1,626,693 1,114,496
Loans and advances to banks and customers 100,183,478 78,752,317 89,437,481 63,139,022
Investment securities 58,524,501 24,111,293 53,357,186 13,936,896
Total interest income 161,437,286 106,221,335 144,421,360 78,190,414
Interest expense
Deposit from banks (12,488,557) (9,487,561) (13,233,673) (6,907,312)
Deposit from customers (46,668,960) (24,075,657) (42,078,513) (18,135,937)
Securities dealing (1,795,284) (2,574,398) (1,777,588) (2,401,706)
Interest-bearing loans and borrowings (2,317,821) – (2,335,104) –
Other borrowed funds (1,777,207) (104,220) – –
Other interest expense (11,629) (232,397) – –
Total interest expense (65,059,458) (36,474,233) (59,424,878) (27,444,955)
Net interest income 96,377,828 69,747,102 84,996,482 50,745,459
Interest income for the year ended 31 December, 2012 includes N30,444,561 (December 2011: N4,354,110,000) accrued on impaired financial assets.
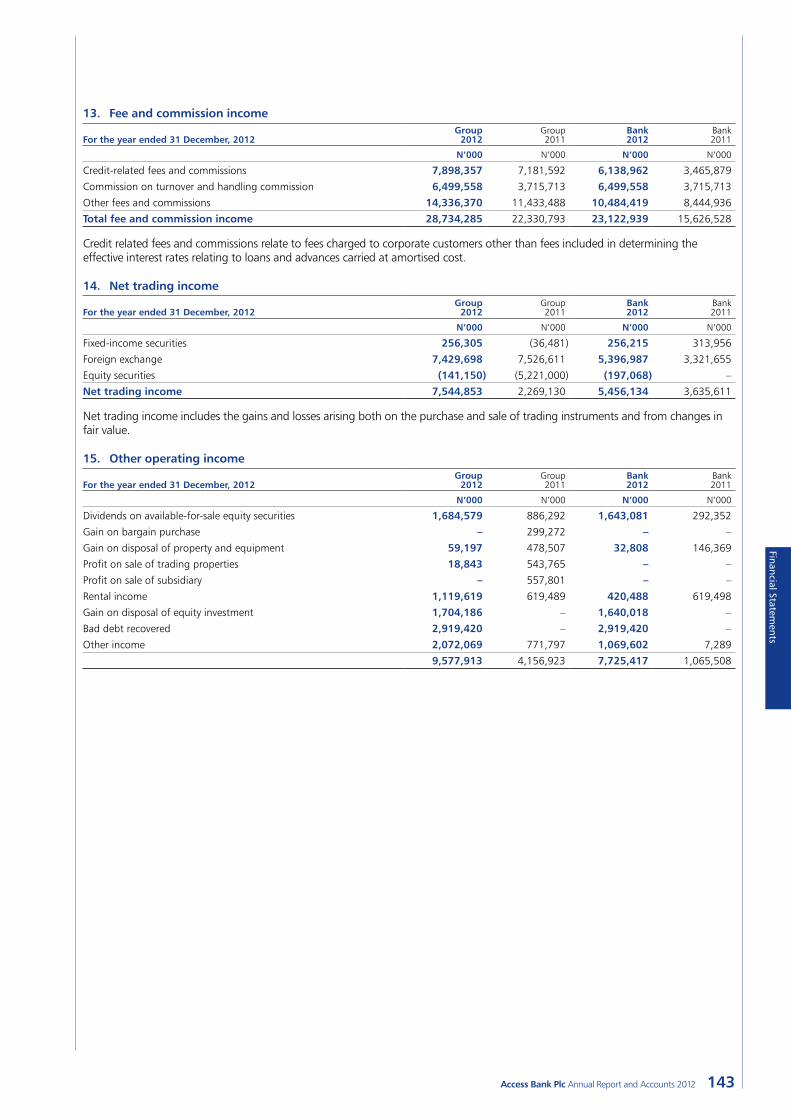
143Access Bank Plc Annual Report and Accounts 2012
Financial Statements
13. Fee and commission income
For the year ended 31 December, 2012Group
2012 Group 2011
Bank 2012
Bank 2011
N’000 N’000 N’000 N’000
Credit-related fees and commissions 7,898,357 7,181,592 6,138,962 3,465,879
Commission on turnover and handling commission 6,499,558 3,715,713 6,499,558 3,715,713
Other fees and commissions 14,336,370 11,433,488 10,484,419 8,444,936
Total fee and commission income 28,734,285 22,330,793 23,122,939 15,626,528
Credit related fees and commissions relate to fees charged to corporate customers other than fees included in determining the effective interest rates relating to loans and advances carried at amortised cost.
14. Net trading income
For the year ended 31 December, 2012Group
2012 Group 2011
Bank 2012
Bank 2011
N’000 N’000 N’000 N’000
Fixed-income securities 256,305 (36,481) 256,215 313,956
Foreign exchange 7,429,698 7,526,611 5,396,987 3,321,655
Equity securities (141,150) (5,221,000) (197,068) –
Net trading income 7,544,853 2,269,130 5,456,134 3,635,611
Net trading income includes the gains and losses arising both on the purchase and sale of trading instruments and from changes in fair value.
15. Other operating income
For the year ended 31 December, 2012Group
2012 Group 2011
Bank 2012
Bank 2011
N’000 N’000 N’000 N’000
Dividends on available-for-sale equity securities 1,684,579 886,292 1,643,081 292,352
Gain on bargain purchase – 299,272 – –
Gain on disposal of property and equipment 59,197 478,507 32,808 146,369
Profit on sale of trading properties 18,843 543,765 – –
Profit on sale of subsidiary – 557,801 – –
Rental income 1,119,619 619,489 420,488 619,498
Gain on disposal of equity investment 1,704,186 – 1,640,018 –
Bad debt recovered 2,919,420 – 2,919,420 –
Other income 2,072,069 771,797 1,069,602 7,289
9,577,913 4,156,923 7,725,417 1,065,508
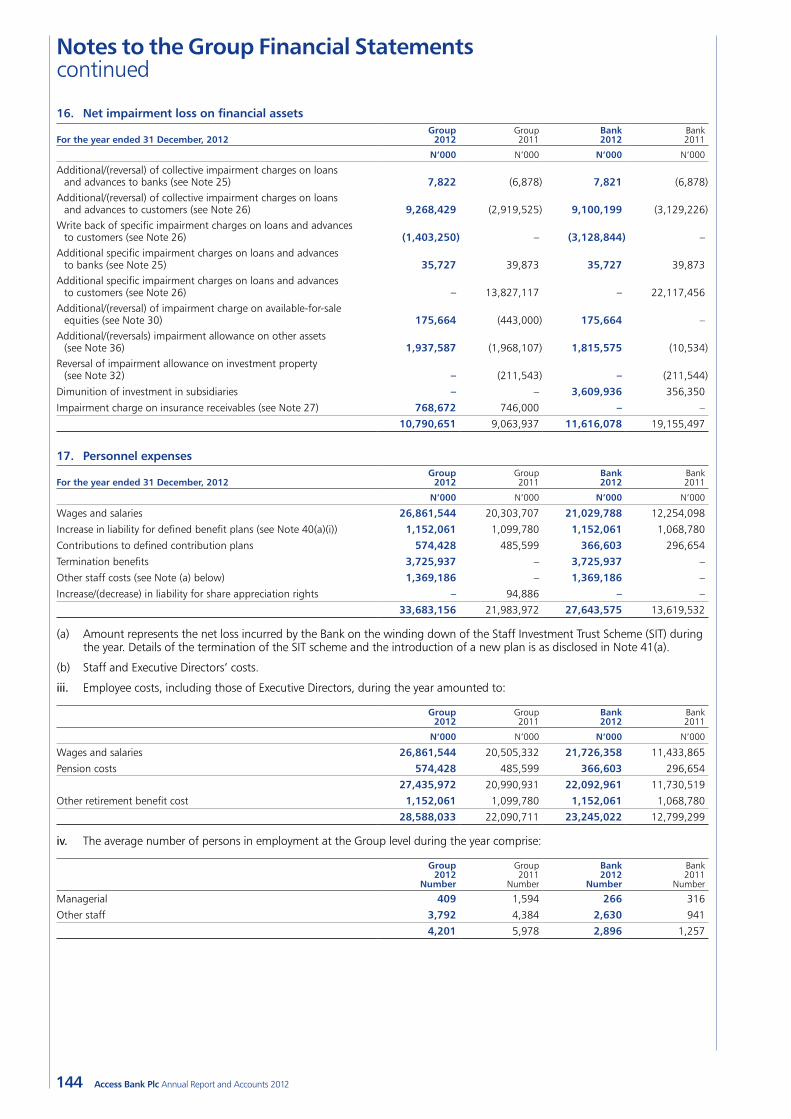
144
Notes to the Group Financial Statements continued
Access Bank Plc Annual Report and Accounts 2012
16. Net impairment loss on financial assets
For the year ended 31 December, 2012Group
2012 Group 2011
Bank 2012
Bank 2011
N’000 N’000 N’000 N’000
Additional/(reversal) of collective impairment charges on loans and advances to banks (see Note 25) 7,822 (6,878) 7,821 (6,878)
Additional/(reversal) of collective impairment charges on loans and advances to customers (see Note 26) 9,268,429 (2,919,525) 9,100,199 (3,129,226)
Write back of specific impairment charges on loans and advances to customers (see Note 26) (1,403,250) – (3,128,844) –
Additional specific impairment charges on loans and advances to banks (see Note 25) 35,727 39,873 35,727 39,873
Additional specific impairment charges on loans and advances to customers (see Note 26) – 13,827,117 – 22,117,456
Additional/(reversal) of impairment charge on available-for-sale equities (see Note 30) 175,664 (443,000) 175,664 –
Additional/(reversals) impairment allowance on other assets (see Note 36) 1,937,587 (1,968,107) 1,815,575 (10,534)
Reversal of impairment allowance on investment property (see Note 32) – (211,543) – (211,544)
Dimunition of investment in subsidiaries – – 3,609,936 356,350
Impairment charge on insurance receivables (see Note 27) 768,672 746,000 – –
10,790,651 9,063,937 11,616,078 19,155,497
17. Personnel expenses
For the year ended 31 December, 2012Group
2012 Group 2011
Bank 2012
Bank 2011
N’000 N’000 N’000 N’000
Wages and salaries 26,861,544 20,303,707 21,029,788 12,254,098
Increase in liability for defined benefit plans (see Note 40(a)(i)) 1,152,061 1,099,780 1,152,061 1,068,780
Contributions to defined contribution plans 574,428 485,599 366,603 296,654
Termination benefits 3,725,937 – 3,725,937 –
Other staff costs (see Note (a) below) 1,369,186 – 1,369,186 –
Increase/(decrease) in liability for share appreciation rights – 94,886 – –
33,683,156 21,983,972 27,643,575 13,619,532
(a) Amount represents the net loss incurred by the Bank on the winding down of the Staff Investment Trust Scheme (SIT) during the year. Details of the termination of the SIT scheme and the introduction of a new plan is as disclosed in Note 41(a).
(b) Staff and Executive Directors’ costs.
iii. Employee costs, including those of Executive Directors, during the year amounted to:
Group 2012
Group 2011
Bank 2012
Bank 2011
N’000 N’000 N’000 N’000
Wages and salaries 26,861,544 20,505,332 21,726,358 11,433,865
Pension costs 574,428 485,599 366,603 296,654
27,435,972 20,990,931 22,092,961 11,730,519
Other retirement benefit cost 1,152,061 1,099,780 1,152,061 1,068,780
28,588,033 22,090,711 23,245,022 12,799,299
iv. The average number of persons in employment at the Group level during the year comprise:
Group 2012
Number
Group 2011
Number
Bank 2012
Number
Bank 2011
Number
Managerial 409 1,594 266 316
Other staff 3,792 4,384 2,630 941
4,201 5,978 2,896 1,257
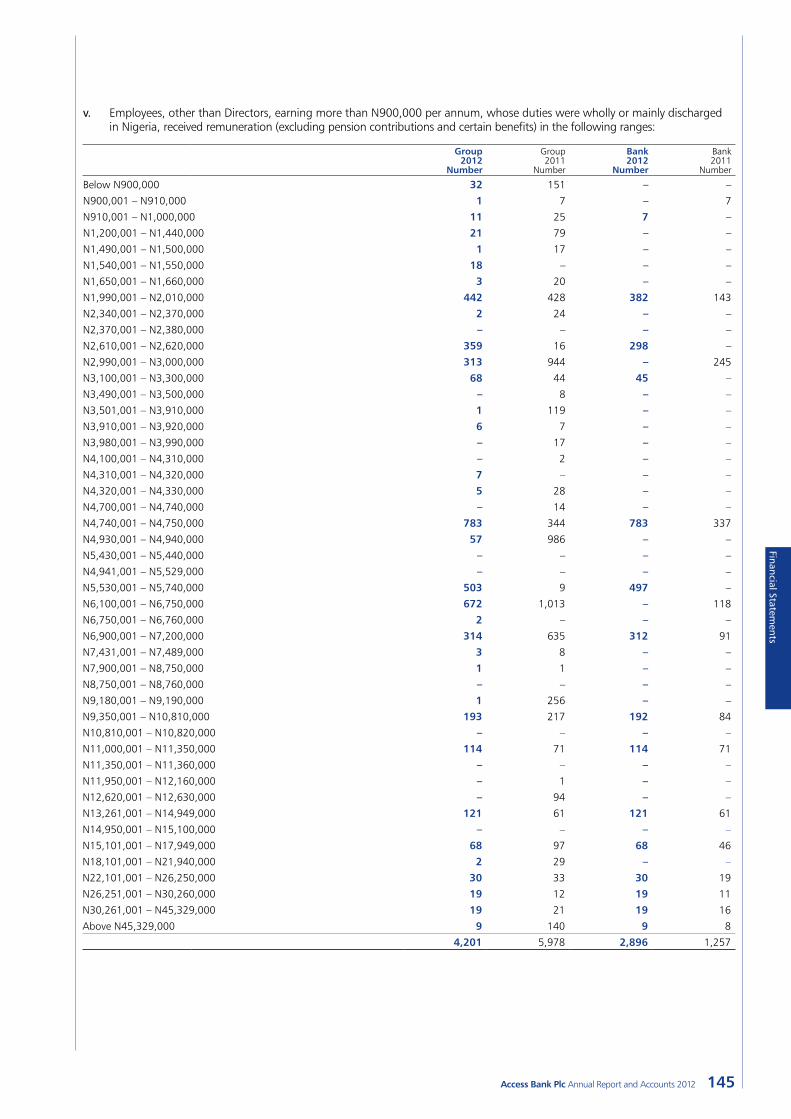
145Access Bank Plc Annual Report and Accounts 2012
Financial Statements
v. Employees, other than Directors, earning more than N900,000 per annum, whose duties were wholly or mainly discharged in Nigeria, received remuneration (excluding pension contributions and certain benefits) in the following ranges:
Group 2012
Number
Group 2011
Number
Bank 2012
Number
Bank 2011
Number
Below N900,000 32 151 – –
N900,001 – N910,000 1 7 – 7
N910,001 – N1,000,000 11 25 7 –
N1,200,001 – N1,440,000 21 79 – –
N1,490,001 – N1,500,000 1 17 – –
N1,540,001 – N1,550,000 18 – – –
N1,650,001 – N1,660,000 3 20 – –
N1,990,001 – N2,010,000 442 428 382 143
N2,340,001 – N2,370,000 2 24 – –
N2,370,001 – N2,380,000 – – – –
N2,610,001 – N2,620,000 359 16 298 –
N2,990,001 – N3,000,000 313 944 – 245
N3,100,001 – N3,300,000 68 44 45 –
N3,490,001 – N3,500,000 – 8 – –
N3,501,001 – N3,910,000 1 119 – –
N3,910,001 – N3,920,000 6 7 – –
N3,980,001 – N3,990,000 – 17 – –
N4,100,001 – N4,310,000 – 2 – –
N4,310,001 – N4,320,000 7 – – –
N4,320,001 – N4,330,000 5 28 – –
N4,700,001 – N4,740,000 – 14 – –
N4,740,001 – N4,750,000 783 344 783 337
N4,930,001 – N4,940,000 57 986 – –
N5,430,001 – N5,440,000 – – – –
N4,941,001 – N5,529,000 – – – –
N5,530,001 – N5,740,000 503 9 497 –
N6,100,001 – N6,750,000 672 1,013 – 118
N6,750,001 – N6,760,000 2 – – –
N6,900,001 – N7,200,000 314 635 312 91
N7,431,001 – N7,489,000 3 8 – –
N7,900,001 – N8,750,000 1 1 – –
N8,750,001 – N8,760,000 – – – –
N9,180,001 – N9,190,000 1 256 – –
N9,350,001 – N10,810,000 193 217 192 84
N10,810,001 – N10,820,000 – – – –
N11,000,001 – N11,350,000 114 71 114 71
N11,350,001 – N11,360,000 – – – –
N11,950,001 – N12,160,000 – 1 – –
N12,620,001 – N12,630,000 – 94 – –
N13,261,001 – N14,949,000 121 61 121 61
N14,950,001 – N15,100,000 – – – –
N15,101,001 – N17,949,000 68 97 68 46
N18,101,001 – N21,940,000 2 29 – –
N22,101,001 – N26,250,000 30 33 30 19
N26,251,001 – N30,260,000 19 12 19 11
N30,261,001 – N45,329,000 19 21 19 16
Above N45,329,000 9 140 9 8
4,201 5,978 2,896 1,257
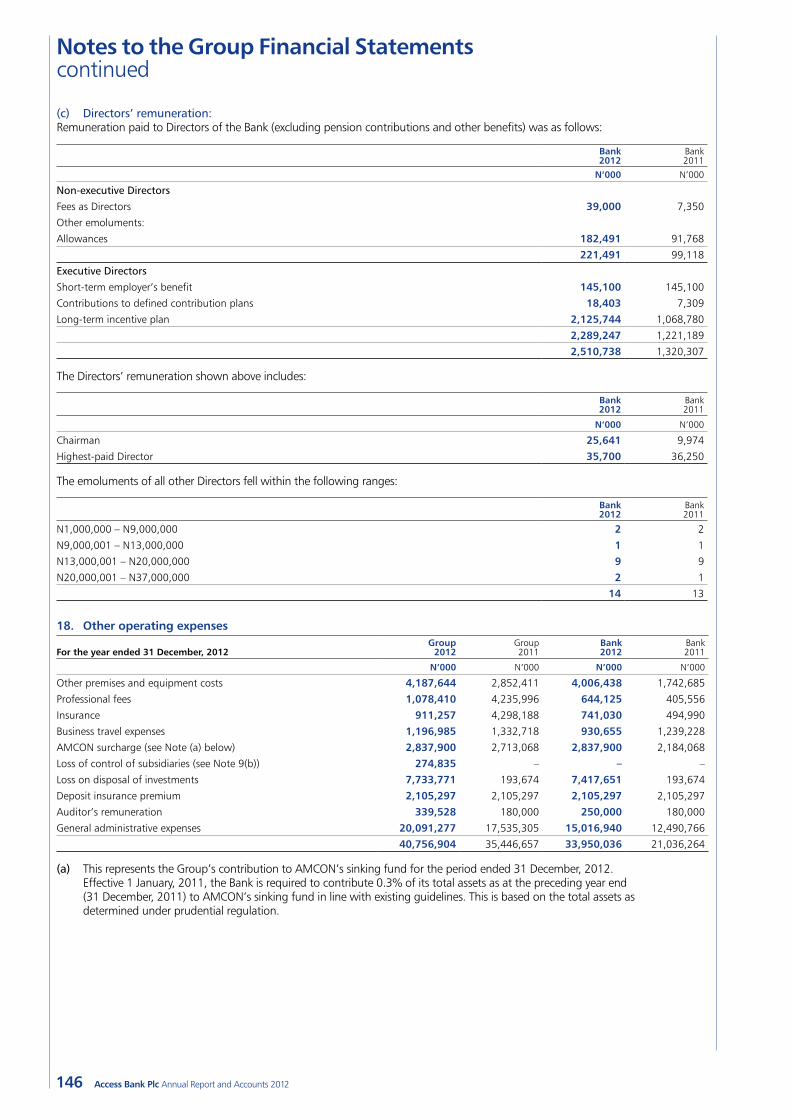
146
Notes to the Group Financial Statements continued
Access Bank Plc Annual Report and Accounts 2012
(c) Directors’ remuneration:Remuneration paid to Directors of the Bank (excluding pension contributions and other benefits) was as follows:
Bank 2012
Bank 2011
N’000 N’000
Non-executive Directors
Fees as Directors 39,000 7,350
Other emoluments:
Allowances 182,491 91,768
221,491 99,118
Executive Directors
Short-term employer’s benefit 145,100 145,100
Contributions to defined contribution plans 18,403 7,309
Long-term incentive plan 2,125,744 1,068,780
2,289,247 1,221,189
2,510,738 1,320,307
The Directors’ remuneration shown above includes:
Bank 2012
Bank 2011
N’000 N’000
Chairman 25,641 9,974
Highest-paid Director 35,700 36,250
The emoluments of all other Directors fell within the following ranges:
Bank 2012
Bank 2011
N1,000,000 – N9,000,000 2 2
N9,000,001 – N13,000,000 1 1
N13,000,001 – N20,000,000 9 9
N20,000,001 – N37,000,000 2 1
14 13
18. Other operating expenses
For the year ended 31 December, 2012Group
2012Group 2011
Bank 2012
Bank 2011
N’000 N’000 N’000 N’000
Other premises and equipment costs 4,187,644 2,852,411 4,006,438 1,742,685
Professional fees 1,078,410 4,235,996 644,125 405,556
Insurance 911,257 4,298,188 741,030 494,990
Business travel expenses 1,196,985 1,332,718 930,655 1,239,228
AMCON surcharge (see Note (a) below) 2,837,900 2,713,068 2,837,900 2,184,068
Loss of control of subsidiaries (see Note 9(b)) 274,835 – – –
Loss on disposal of investments 7,733,771 193,674 7,417,651 193,674
Deposit insurance premium 2,105,297 2,105,297 2,105,297 2,105,297
Auditor’s remuneration 339,528 180,000 250,000 180,000
General administrative expenses 20,091,277 17,535,305 15,016,940 12,490,766
40,756,904 35,446,657 33,950,036 21,036,264
(a) This represents the Group’s contribution to AMCON’s sinking fund for the period ended 31 December, 2012. Effective 1 January, 2011, the Bank is required to contribute 0.3% of its total assets as at the preceding year end (31 December, 2011) to AMCON’s sinking fund in line with existing guidelines. This is based on the total assets as determined under prudential regulation.
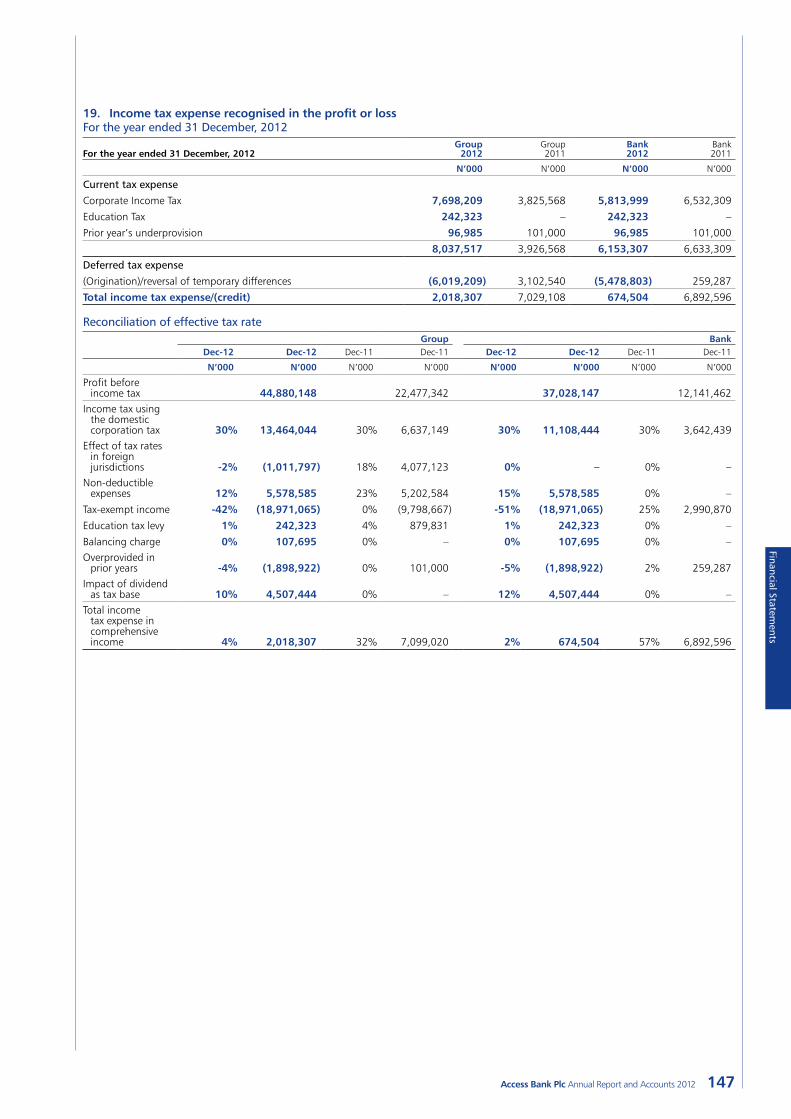
147Access Bank Plc Annual Report and Accounts 2012
Financial Statements
19. Income tax expense recognised in the profit or lossFor the year ended 31 December, 2012
For the year ended 31 December, 2012 Group
2012 Group
2011 Bank 2012
Bank 2011
N’000 N’000 N’000 N’000
Current tax expense
Corporate Income Tax 7,698,209 3,825,568 5,813,999 6,532,309
Education Tax 242,323 – 242,323 –
Prior year’s underprovision 96,985 101,000 96,985 101,000
8,037,517 3,926,568 6,153,307 6,633,309
Deferred tax expense
(Origination)/reversal of temporary differences (6,019,209) 3,102,540 (5,478,803) 259,287
Total income tax expense/(credit) 2,018,307 7,029,108 674,504 6,892,596
Reconciliation of effective tax rateGroup Bank
Dec-12 Dec-12 Dec-11 Dec-11 Dec-12 Dec-12 Dec-11 Dec-11
N’000 N’000 N’000 N’000 N’000 N’000 N’000 N’000
Profit before income tax 44,880,148 22,477,342 37,028,147 12,141,462
Income tax using the domestic corporation tax 30% 13,464,044 30% 6,637,149 30% 11,108,444 30% 3,642,439
Effect of tax rates in foreign jurisdictions -2% (1,011,797) 18% 4,077,123 0% – 0% –
Non-deductible expenses 12% 5,578,585 23% 5,202,584 15% 5,578,585 0% –
Tax-exempt income -42% (18,971,065) 0% (9,798,667) -51% (18,971,065) 25% 2,990,870
Education tax levy 1% 242,323 4% 879,831 1% 242,323 0% –
Balancing charge 0% 107,695 0% – 0% 107,695 0% –Overprovided in
prior years -4% (1,898,922) 0% 101,000 -5% (1,898,922) 2% 259,287 Impact of dividend
as tax base 10% 4,507,444 0% – 12% 4,507,444 0% –Total income
tax expense in comprehensive income 4% 2,018,307 32% 7,099,020 2% 674,504 57% 6,892,596
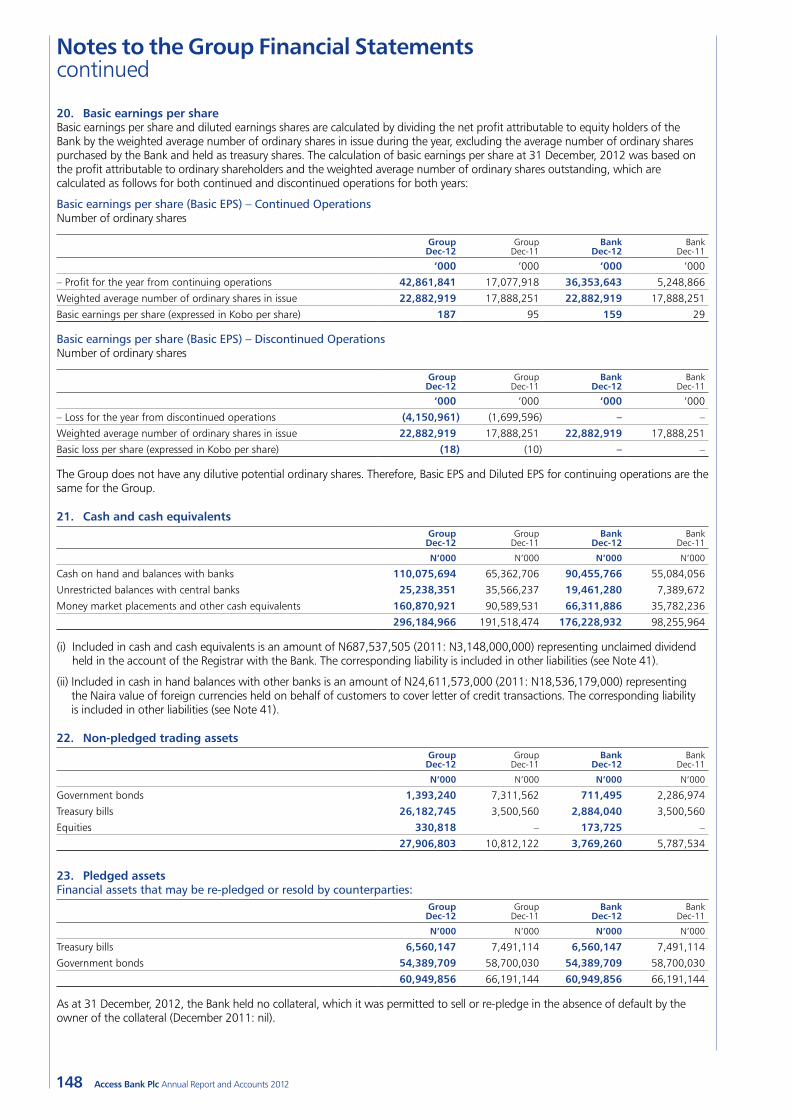
148
Notes to the Group Financial Statements continued
Access Bank Plc Annual Report and Accounts 2012
20. Basic earnings per shareBasic earnings per share and diluted earnings shares are calculated by dividing the net profit attributable to equity holders of the Bank by the weighted average number of ordinary shares in issue during the year, excluding the average number of ordinary shares purchased by the Bank and held as treasury shares. The calculation of basic earnings per share at 31 December, 2012 was based on the profit attributable to ordinary shareholders and the weighted average number of ordinary shares outstanding, which are calculated as follows for both continued and discontinued operations for both years:
Basic earnings per share (Basic EPS) – Continued OperationsNumber of ordinary shares
Group Dec-12
Group Dec-11
Bank Dec-12
Bank Dec-11
‘000 ‘000 ‘000 ‘000
– Profit for the year from continuing operations 42,861,841 17,077,918 36,353,643 5,248,866
Weighted average number of ordinary shares in issue 22,882,919 17,888,251 22,882,919 17,888,251
Basic earnings per share (expressed in Kobo per share) 187 95 159 29
Basic earnings per share (Basic EPS) – Discontinued OperationsNumber of ordinary shares
Group Dec-12
Group Dec-11
Bank Dec-12
Bank Dec-11
‘000 ‘000 ‘000 ‘000
– Loss for the year from discontinued operations (4,150,961) (1,699,596) – –
Weighted average number of ordinary shares in issue 22,882,919 17,888,251 22,882,919 17,888,251
Basic loss per share (expressed in Kobo per share) (18) (10) – –
The Group does not have any dilutive potential ordinary shares. Therefore, Basic EPS and Diluted EPS for continuing operations are the same for the Group.
21. Cash and cash equivalentsGroup Dec-12
Group Dec-11
Bank Dec-12
Bank Dec-11
N’000 N’000 N’000 N’000
Cash on hand and balances with banks 110,075,694 65,362,706 90,455,766 55,084,056
Unrestricted balances with central banks 25,238,351 35,566,237 19,461,280 7,389,672
Money market placements and other cash equivalents 160,870,921 90,589,531 66,311,886 35,782,236
296,184,966 191,518,474 176,228,932 98,255,964
(i) Included in cash and cash equivalents is an amount of N687,537,505 (2011: N3,148,000,000) representing unclaimed dividend held in the account of the Registrar with the Bank. The corresponding liability is included in other liabilities (see Note 41).
(ii) Included in cash in hand balances with other banks is an amount of N24,611,573,000 (2011: N18,536,179,000) representing the Naira value of foreign currencies held on behalf of customers to cover letter of credit transactions. The corresponding liability is included in other liabilities (see Note 41).
22. Non-pledged trading assetsGroup Dec-12
Group Dec-11
Bank Dec-12
Bank Dec-11
N’000 N’000 N’000 N’000
Government bonds 1,393,240 7,311,562 711,495 2,286,974
Treasury bills 26,182,745 3,500,560 2,884,040 3,500,560
Equities 330,818 – 173,725 –
27,906,803 10,812,122 3,769,260 5,787,534
23. Pledged assetsFinancial assets that may be re-pledged or resold by counterparties:
Group Dec-12
Group Dec-11
Bank Dec-12
Bank Dec-11
N’000 N’000 N’000 N’000
Treasury bills 6,560,147 7,491,114 6,560,147 7,491,114
Government bonds 54,389,709 58,700,030 54,389,709 58,700,030
60,949,856 66,191,144 60,949,856 66,191,144
As at 31 December, 2012, the Bank held no collateral, which it was permitted to sell or re-pledge in the absence of default by the owner of the collateral (December 2011: nil).
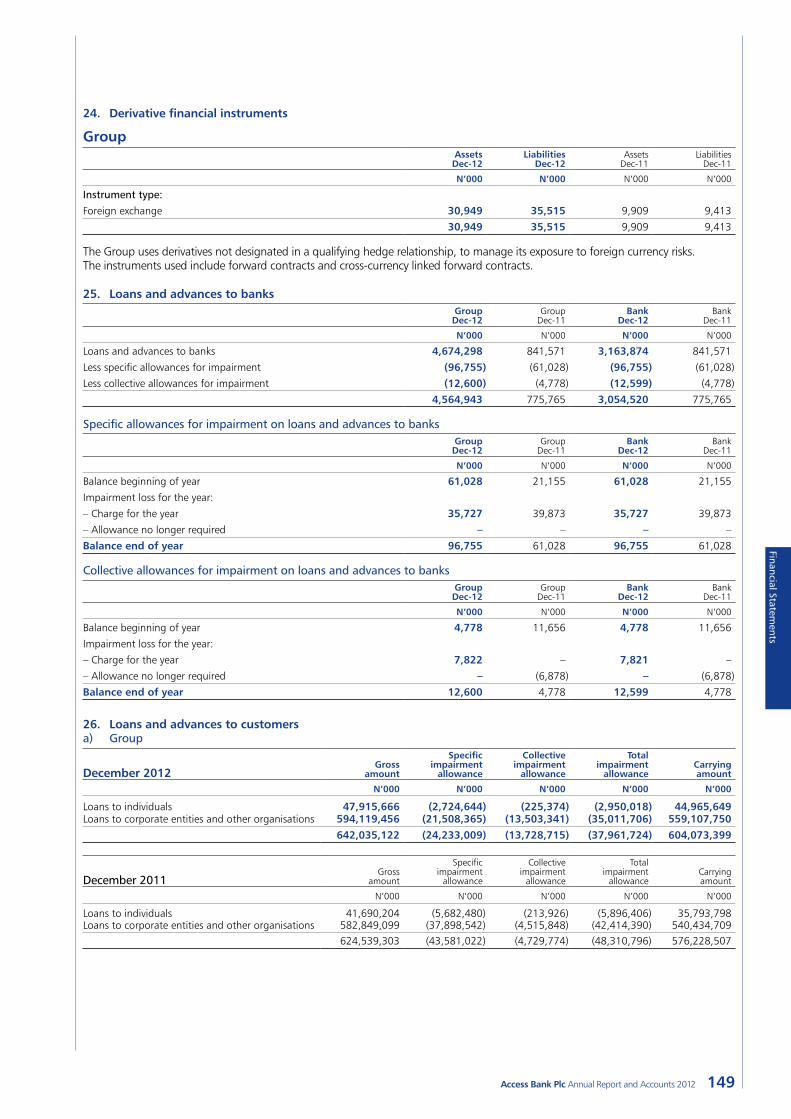
149Access Bank Plc Annual Report and Accounts 2012
Financial Statements
24. Derivative financial instruments
GroupAssets Dec-12
Liabilities Dec-12
Assets Dec-11
Liabilities Dec-11
N’000 N’000 N’000 N’000
Instrument type:
Foreign exchange 30,949 35,515 9,909 9,413
30,949 35,515 9,909 9,413
The Group uses derivatives not designated in a qualifying hedge relationship, to manage its exposure to foreign currency risks. The instruments used include forward contracts and cross-currency linked forward contracts.
25. Loans and advances to banksGroup Dec-12
Group Dec-11
Bank Dec-12
Bank Dec-11
N’000 N’000 N’000 N’000
Loans and advances to banks 4,674,298 841,571 3,163,874 841,571
Less specific allowances for impairment (96,755) (61,028) (96,755) (61,028)
Less collective allowances for impairment (12,600) (4,778) (12,599) (4,778)
4,564,943 775,765 3,054,520 775,765
Specific allowances for impairment on loans and advances to banksGroup Dec-12
Group Dec-11
Bank Dec-12
Bank Dec-11
N’000 N’000 N’000 N’000
Balance beginning of year 61,028 21,155 61,028 21,155
Impairment loss for the year:
– Charge for the year 35,727 39,873 35,727 39,873
– Allowance no longer required – – – –
Balance end of year 96,755 61,028 96,755 61,028
Collective allowances for impairment on loans and advances to banksGroup Dec-12
Group Dec-11
Bank Dec-12
Bank Dec-11
N’000 N’000 N’000 N’000
Balance beginning of year 4,778 11,656 4,778 11,656
Impairment loss for the year:
– Charge for the year 7,822 – 7,821 –
– Allowance no longer required – (6,878) – (6,878)
Balance end of year 12,600 4,778 12,599 4,778
26. Loans and advances to customersa) Group
December 2012 Gross
amount
Specificimpairment
allowance
Collectiveimpairment
allowance
Totalimpairment
allowanceCarryingamount
N’000 N’000 N’000 N’000 N’000
Loans to individuals 47,915,666 (2,724,644) (225,374) (2,950,018) 44,965,649 Loans to corporate entities and other organisations 594,119,456 (21,508,365) (13,503,341) (35,011,706) 559,107,750
642,035,122 (24,233,009) (13,728,715) (37,961,724) 604,073,399
December 2011Gross
amount
Specificimpairment
allowance
Collectiveimpairment
allowance
Totalimpairment
allowanceCarryingamount
N’000 N’000 N’000 N’000 N’000
Loans to individuals 41,690,204 (5,682,480) (213,926) (5,896,406) 35,793,798 Loans to corporate entities and other organisations 582,849,099 (37,898,542) (4,515,848) (42,414,390) 540,434,709
624,539,303 (43,581,022) (4,729,774) (48,310,796) 576,228,507
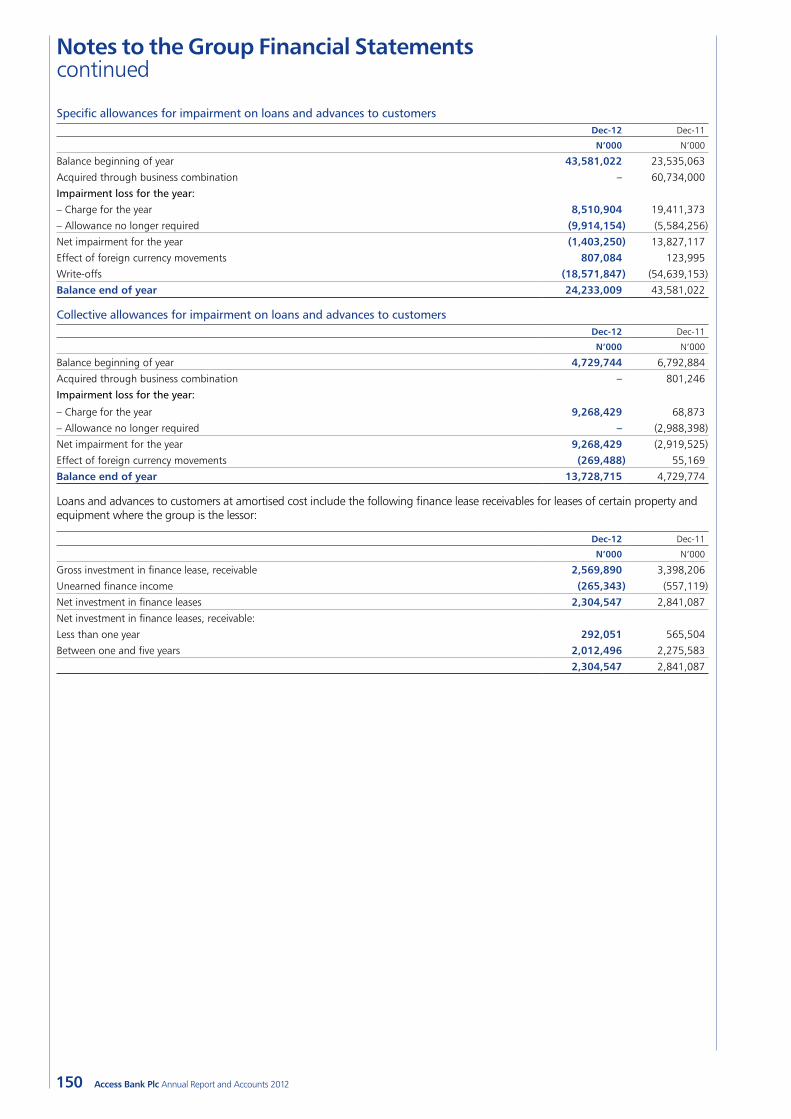
150
Notes to the Group Financial Statements continued
Access Bank Plc Annual Report and Accounts 2012
Specific allowances for impairment on loans and advances to customers Dec-12 Dec-11
N’000 N’000
Balance beginning of year 43,581,022 23,535,063
Acquired through business combination – 60,734,000
Impairment loss for the year:
– Charge for the year 8,510,904 19,411,373
– Allowance no longer required (9,914,154) (5,584,256)
Net impairment for the year (1,403,250) 13,827,117
Effect of foreign currency movements 807,084 123,995
Write-offs (18,571,847) (54,639,153)
Balance end of year 24,233,009 43,581,022
Collective allowances for impairment on loans and advances to customers Dec-12 Dec-11
N’000 N’000
Balance beginning of year 4,729,744 6,792,884
Acquired through business combination – 801,246
Impairment loss for the year:
– Charge for the year 9,268,429 68,873
– Allowance no longer required – (2,988,398)
Net impairment for the year 9,268,429 (2,919,525)
Effect of foreign currency movements (269,488) 55,169
Balance end of year 13,728,715 4,729,774
Loans and advances to customers at amortised cost include the following finance lease receivables for leases of certain property and equipment where the group is the lessor:
Dec-12 Dec-11
N’000 N’000
Gross investment in finance lease, receivable 2,569,890 3,398,206
Unearned finance income (265,343) (557,119)
Net investment in finance leases 2,304,547 2,841,087
Net investment in finance leases, receivable:
Less than one year 292,051 565,504
Between one and five years 2,012,496 2,275,583
2,304,547 2,841,087
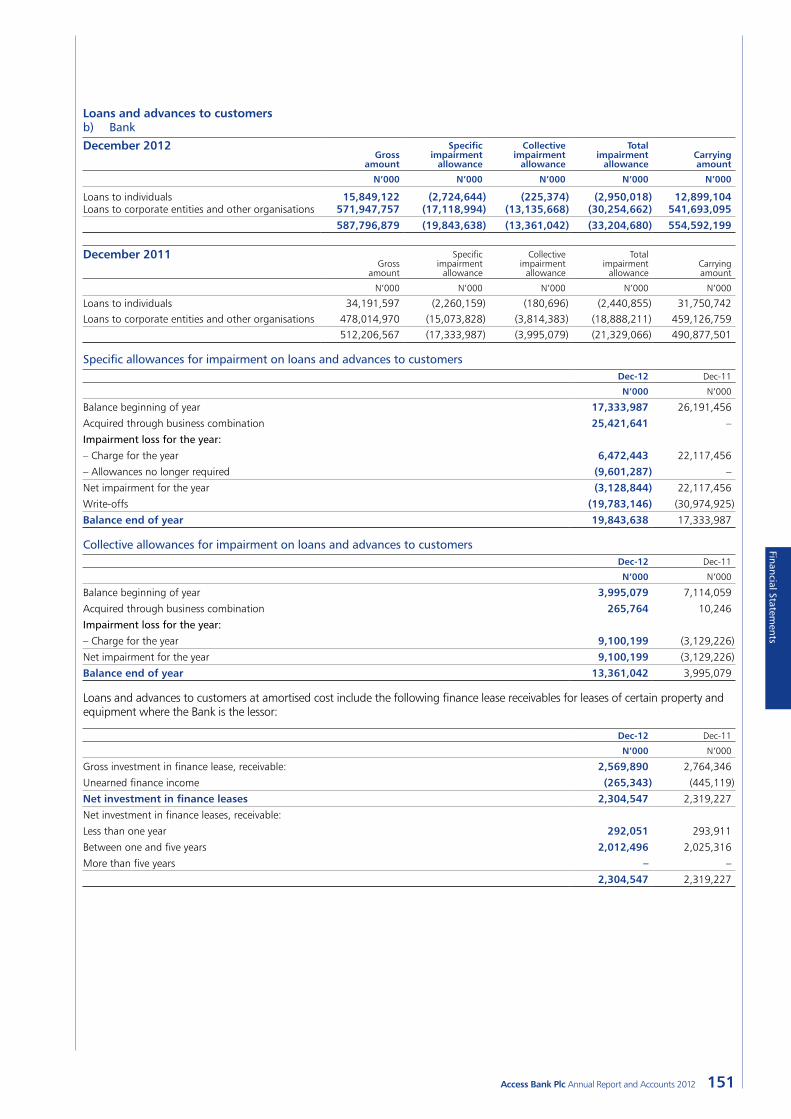
151Access Bank Plc Annual Report and Accounts 2012
Financial Statements
Loans and advances to customersb) Bank
December 2012 Gross
amount
Specificimpairment
allowance
Collectiveimpairment
allowance
Totalimpairment
allowanceCarryingamount
N’000 N’000 N’000 N’000 N’000
Loans to individuals 15,849,122 (2,724,644) (225,374) (2,950,018) 12,899,104 Loans to corporate entities and other organisations 571,947,757 (17,118,994) (13,135,668) (30,254,662) 541,693,095
587,796,879 (19,843,638) (13,361,042) (33,204,680) 554,592,199
December 2011Gross
amount
Specificimpairment
allowance
Collectiveimpairment
allowance
Totalimpairment
allowanceCarryingamount
N’000 N’000 N’000 N’000 N’000
Loans to individuals 34,191,597 (2,260,159) (180,696) (2,440,855) 31,750,742 Loans to corporate entities and other organisations 478,014,970 (15,073,828) (3,814,383) (18,888,211) 459,126,759
512,206,567 (17,333,987) (3,995,079) (21,329,066) 490,877,501
Specific allowances for impairment on loans and advances to customersDec-12 Dec-11
N’000 N’000
Balance beginning of year 17,333,987 26,191,456
Acquired through business combination 25,421,641 –
Impairment loss for the year:
– Charge for the year 6,472,443 22,117,456
– Allowances no longer required (9,601,287) –
Net impairment for the year (3,128,844) 22,117,456
Write-offs (19,783,146) (30,974,925)
Balance end of year 19,843,638 17,333,987
Collective allowances for impairment on loans and advances to customersDec-12 Dec-11
N’000 N’000
Balance beginning of year 3,995,079 7,114,059
Acquired through business combination 265,764 10,246
Impairment loss for the year:
– Charge for the year 9,100,199 (3,129,226)
Net impairment for the year 9,100,199 (3,129,226)
Balance end of year 13,361,042 3,995,079
Loans and advances to customers at amortised cost include the following finance lease receivables for leases of certain property and equipment where the Bank is the lessor:
Dec-12 Dec-11
N’000 N’000
Gross investment in finance lease, receivable: 2,569,890 2,764,346
Unearned finance income (265,343) (445,119)
Net investment in finance leases 2,304,547 2,319,227
Net investment in finance leases, receivable:
Less than one year 292,051 293,911
Between one and five years 2,012,496 2,025,316
More than five years – –
2,304,547 2,319,227
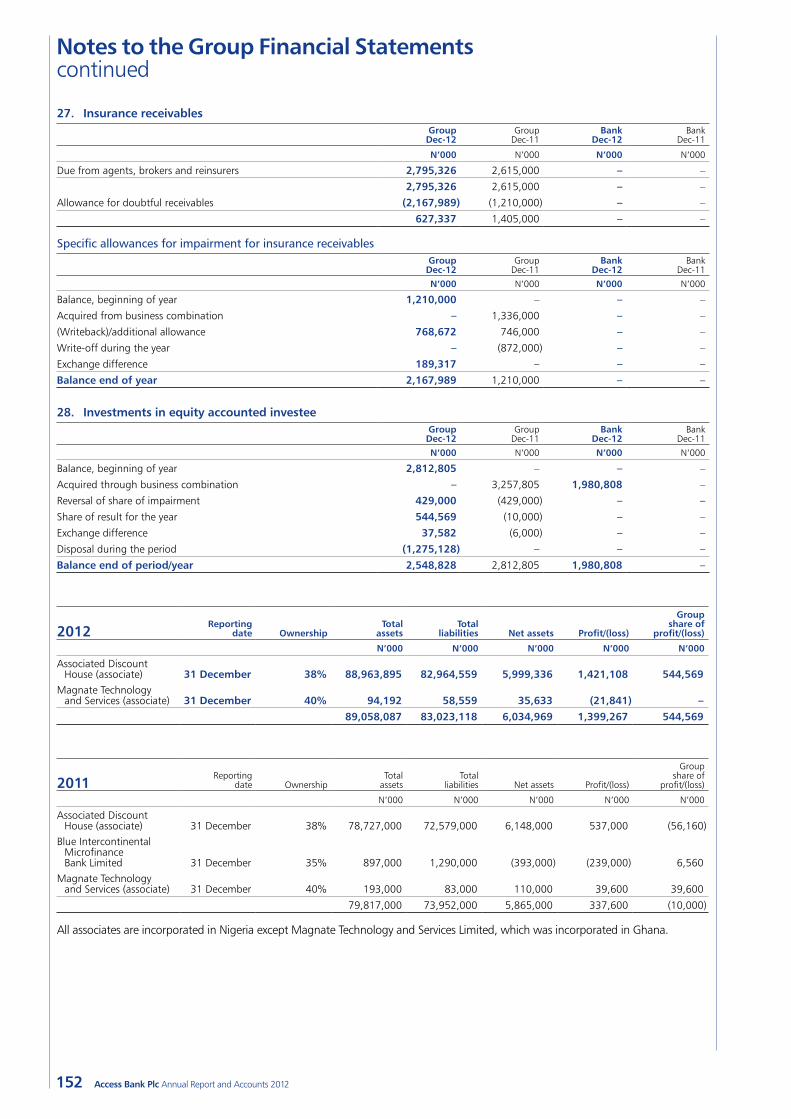
152
Notes to the Group Financial Statements continued
Access Bank Plc Annual Report and Accounts 2012
27. Insurance receivables
Group Dec-12
Group Dec-11
Bank Dec-12
Bank Dec-11
N’000 N’000 N’000 N’000
Due from agents, brokers and reinsurers 2,795,326 2,615,000 – –
2,795,326 2,615,000 – –
Allowance for doubtful receivables (2,167,989) (1,210,000) – –
627,337 1,405,000 – –
Specific allowances for impairment for insurance receivablesGroup Dec-12
Group Dec-11
Bank Dec-12
Bank Dec-11
N’000 N’000 N’000 N’000
Balance, beginning of year 1,210,000 – – –
Acquired from business combination – 1,336,000 – –
(Writeback)/additional allowance 768,672 746,000 – –
Write-off during the year – (872,000) – –
Exchange difference 189,317 – – –
Balance end of year 2,167,989 1,210,000 – –
28. Investments in equity accounted investeeGroup Dec-12
Group Dec-11
Bank Dec-12
Bank Dec-11
N’000 N’000 N’000 N’000
Balance, beginning of year 2,812,805 – – –
Acquired through business combination – 3,257,805 1,980,808 –
Reversal of share of impairment 429,000 (429,000) – –Share of result for the year 544,569 (10,000) – –
Exchange difference 37,582 (6,000) – –
Disposal during the period (1,275,128) – – –
Balance end of period/year 2,548,828 2,812,805 1,980,808 –
2012Reporting
date OwnershipTotal
assetsTotal
liabilities Net assets Profit/(loss)
Group share of
profit/(loss)
N’000 N’000 N’000 N’000 N’000
Associated Discount House (associate) 31 December 38% 88,963,895 82,964,559 5,999,336 1,421,108 544,569
Magnate Technology and Services (associate) 31 December 40% 94,192 58,559 35,633 (21,841) –
89,058,087 83,023,118 6,034,969 1,399,267 544,569
2011Reporting
date OwnershipTotal
assetsTotal
liabilities Net assets Profit/(loss)
Group share of
profit/(loss)
N’000 N’000 N’000 N’000 N’000
Associated Discount House (associate) 31 December 38% 78,727,000 72,579,000 6,148,000 537,000 (56,160)
Blue Intercontinental Microfinance Bank Limited 31 December 35% 897,000 1,290,000 (393,000) (239,000) 6,560
Magnate Technology and Services (associate) 31 December 40% 193,000 83,000 110,000 39,600 39,600
79,817,000 73,952,000 5,865,000 337,600 (10,000)
All associates are incorporated in Nigeria except Magnate Technology and Services Limited, which was incorporated in Ghana.
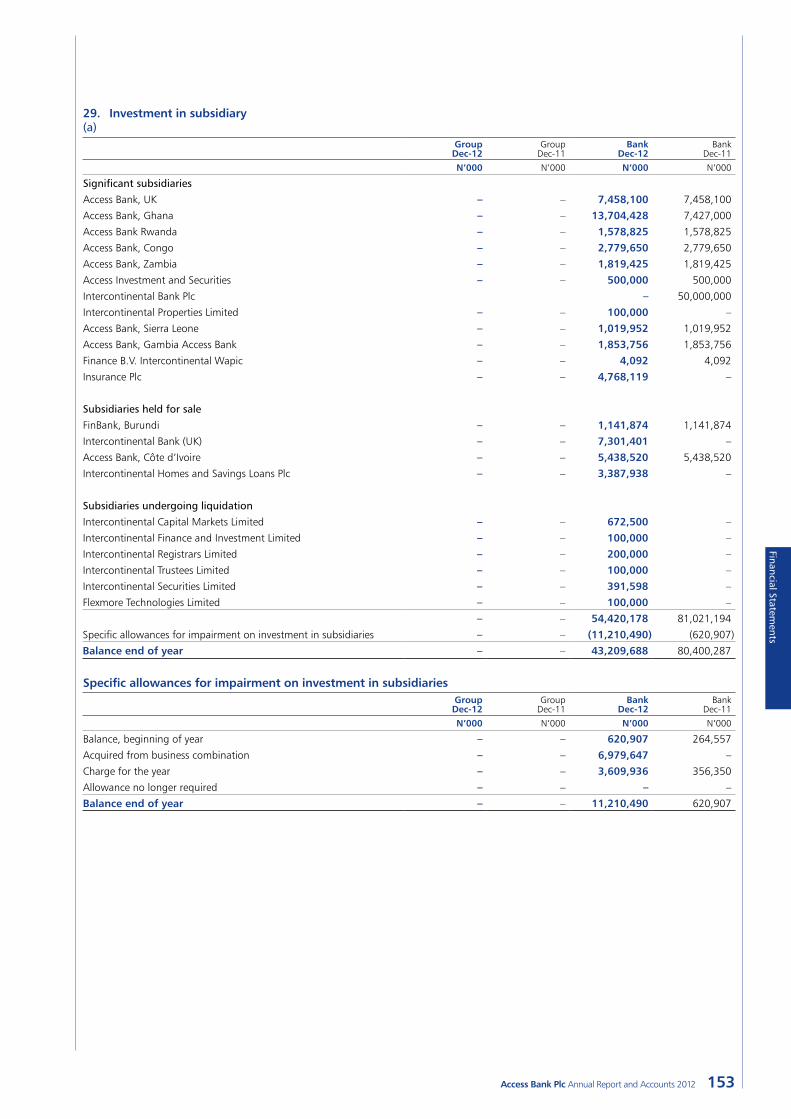
153Access Bank Plc Annual Report and Accounts 2012
Financial Statements
29. Investment in subsidiary(a)
Group Dec-12
Group Dec-11
Bank Dec-12
Bank Dec-11
N’000 N’000 N’000 N’000
Significant subsidiaries
Access Bank, UK – – 7,458,100 7,458,100
Access Bank, Ghana – – 13,704,428 7,427,000
Access Bank Rwanda – – 1,578,825 1,578,825
Access Bank, Congo – – 2,779,650 2,779,650
Access Bank, Zambia – – 1,819,425 1,819,425
Access Investment and Securities – – 500,000 500,000
Intercontinental Bank Plc – 50,000,000
Intercontinental Properties Limited – – 100,000 –
Access Bank, Sierra Leone – – 1,019,952 1,019,952
Access Bank, Gambia Access Bank – – 1,853,756 1,853,756
Finance B.V. Intercontinental Wapic – – 4,092 4,092
Insurance Plc – – 4,768,119 –
Subsidiaries held for sale
FinBank, Burundi – – 1,141,874 1,141,874
Intercontinental Bank (UK) – – 7,301,401 –
Access Bank, Côte d’Ivoire – – 5,438,520 5,438,520
Intercontinental Homes and Savings Loans Plc – – 3,387,938 –
Subsidiaries undergoing liquidation
Intercontinental Capital Markets Limited – – 672,500 –
Intercontinental Finance and Investment Limited – – 100,000 –
Intercontinental Registrars Limited – – 200,000 –
Intercontinental Trustees Limited – – 100,000 –
Intercontinental Securities Limited – – 391,598 –
Flexmore Technologies Limited – – 100,000 –
– – 54,420,178 81,021,194
Specific allowances for impairment on investment in subsidiaries – – (11,210,490) (620,907)
Balance end of year – – 43,209,688 80,400,287
Specific allowances for impairment on investment in subsidiaries
Group Dec-12
Group Dec-11
Bank Dec-12
Bank Dec-11
N’000 N’000 N’000 N’000
Balance, beginning of year – – 620,907 264,557
Acquired from business combination – – 6,979,647 –
Charge for the year – – 3,609,936 356,350
Allowance no longer required – – – –
Balance end of year – – 11,210,490 620,907
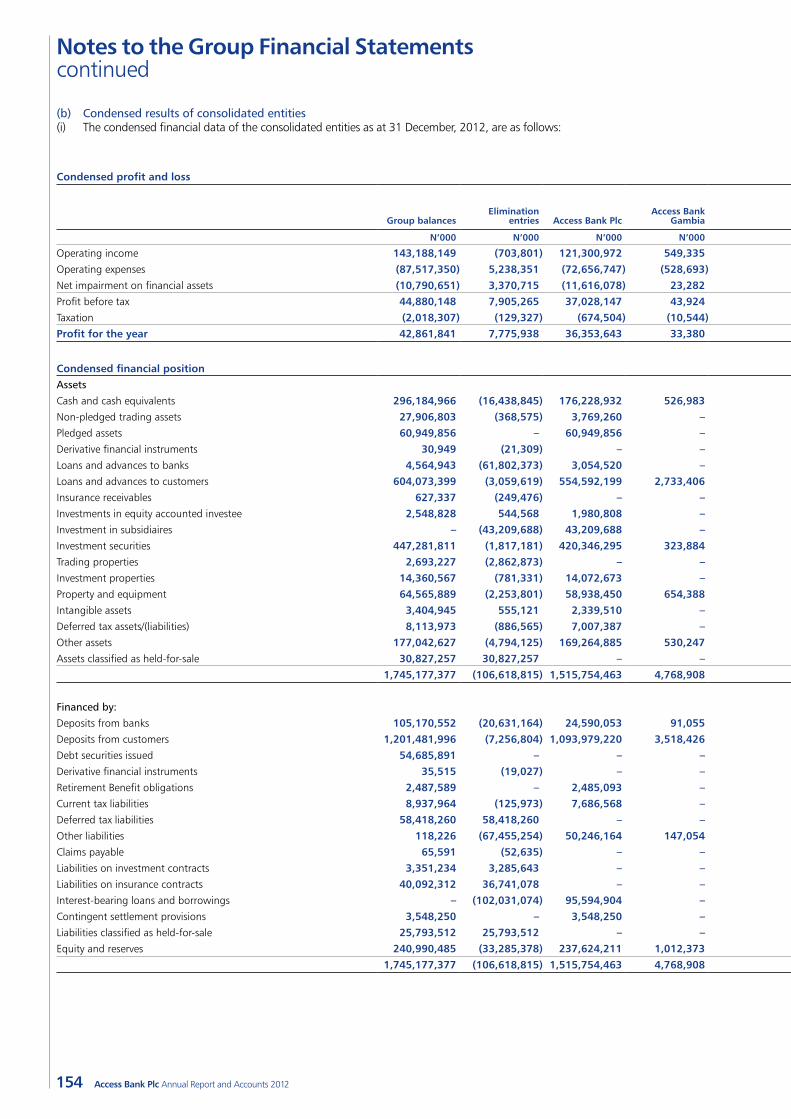
154
Notes to the Group Financial Statements continued
Access Bank Plc Annual Report and Accounts 2012
(b) Condensed results of consolidated entities(i) The condensed financial data of the consolidated entities as at 31 December, 2012, are as follows:
Condensed profit and loss 31 December, 2012
Group balancesElimination
entries Access Bank PlcAccess Bank
GambiaAccess BankSierra Leone
Access BankZambia
The AccessBank UK
Access BankRwanda
FinBankBurundi
Access BankCôte d’Ivoire
Access Bank(R.D. Congo)
Access Investment and
Securities
N’000 N’000 N’000 N’000 N’000 N’000 N’000 N’000 N’000 N’000 N’000 N’000
Operating income 143,188,149 (703,801) 121,300,972 549,335 534,337 993,067 2,631,380 1,378,163 554,386 192,997 943,121 –Operating expenses (87,517,350) 5,238,351 (72,656,747) (528,693) (394,156) (1,247,953) (2,404,415) (1,203,919) (883,685) (3,384,152) (1,116,419) –Net impairment on financial assets (10,790,651) 3,370,715 (11,616,078) 23,282 (52,288) 9,842 – 23,162 (21,507) 21,988 (38,953) –Profit before tax 44,880,148 7,905,265 37,028,147 43,924 87,893 (245,044) 226,965 197,406 (350,806) (3,169,167) (212,251) –Taxation (2,018,307) (129,327) (674,504) (10,544) 57,718 89,392 – (83,941) (5,530) – – –Profit for the year 42,861,841 7,775,938 36,353,643 33,380 145,611 (155,652) 226,965 113,465 (356,336) (3,169,167) (212,251) –
Condensed financial position 31 December, 2012Assets
Cash and cash equivalents 296,184,966 (16,438,845) 176,228,932 526,983 1,140,930 1,499,801 90,217,916 4,451,114 932,360 1,143,293 3,498,235 400,516Non-pledged trading assets 27,906,803 (368,575) 3,769,260 – – – – – 368,575 – – –Pledged assets 60,949,856 – 60,949,856 – – – – – – – – –Derivative financial instruments 30,949 (21,309) – – – – 30,949 – – – – –Loans and advances to banks 4,564,943 (61,802,373) 3,054,520 – – – 5,935,396 – – – – –Loans and advances to customers 604,073,399 (3,059,619) 554,592,199 2,733,406 410,458 2,573,996 11,860,898 2,932,674 1,984,588 1,525,711 3,272,997 –Insurance receivables 627,337 (249,476) – – – 3,054 – – – – – –Investments in equity accounted investee 2,548,828 544,568 1,980,808 – – – – – – – – –Investment in subsidiaires – (43,209,688) 43,209,688 – – – – – – – – –Investment securities 447,281,811 (1,817,181) 420,346,295 323,884 1,843,303 2,321,807 6,870,467 2,550,574 – 57,963 8,178,988 –Trading properties 2,693,227 (2,862,873) – – – – – – – – – –Investment properties 14,360,567 (781,331) 14,072,673 – – – – – – – – –Property and equipment 64,565,889 (2,253,801) 58,938,450 654,388 211,431 599,612 71,792 91,880 199,328 1,326,433 883,474 31,304Intangible assets 3,404,945 555,121 2,339,510 – 10,218 13,238 84,983 19,608 57,395 18,591 58,929 –Deferred tax assets/(liabilities) 8,113,973 (886,565) 7,007,387 – 85,652 632,531 225,523 – – – – –Other assets 177,042,627 (4,794,125) 169,264,885 530,247 137,837 2,011,103 664,393 161,879 130,557 238,920 720,045 181,548Assets classified as held-for-sale 30,827,257 30,827,257 – – – – – – – – – –
1,745,177,377 (106,618,815) 1,515,754,463 4,768,908 3,839,829 9,655,143 115,962,317 10,207,729 3,672,803 4,310,911 16,612,668 613,368
Financed by:
Deposits from banks 105,170,552 (20,631,164) 24,590,053 91,055 144,122 151,964 82,081,068 19,290 – 3,077,492 – –Deposits from customers 1,201,481,996 (7,256,804) 1,093,979,220 3,518,426 2,605,686 8,086,377 24,730,436 8,205,697 2,513,741 3,485,893 14,438,029 –Debt securities issued 54,685,891 – – – – – – – – – – –Derivative financial instruments 35,515 (19,027) – – – – 35,515 – – – – –Retirement Benefit obligations 2,487,589 – 2,485,093 – 2,496 – – – – – – –Current tax liabilities 8,937,964 (125,973) 7,686,568 – (61,023) – – 165 – – – 205Deferred tax liabilities 58,418,260 58,418,260 – – – – – – – – – –Other liabilities 118,226 (67,455,254) 50,246,164 147,054 203,471 238,120 385,089 188,263 187,337 419,136 368,833 84,050Claims payable 65,591 (52,635) – – – – – – – – – –Liabilities on investment contracts 3,351,234 3,285,643 – – – – – – – – – –Liabilities on insurance contracts 40,092,312 36,741,078 – – – – – – – – – –Interest-bearing loans and borrowings – (102,031,074) 95,594,904 – – – 2,349,348 – – – – –Contingent settlement provisions 3,548,250 – 3,548,250 – – – – – – – – –Liabilities classified as held-for-sale 25,793,512 25,793,512 – – – – – – – – – –Equity and reserves 240,990,485 (33,285,378) 237,624,211 1,012,373 945,077 1,178,682 6,380,861 1,794,314 971,725 (2,671,610) 1,805,806 529,113
1,745,177,377 (106,618,815) 1,515,754,463 4,768,908 3,839,829 9,655,143 115,962,317 10,207,729 3,672,803 4,310,911 16,612,668 613,368
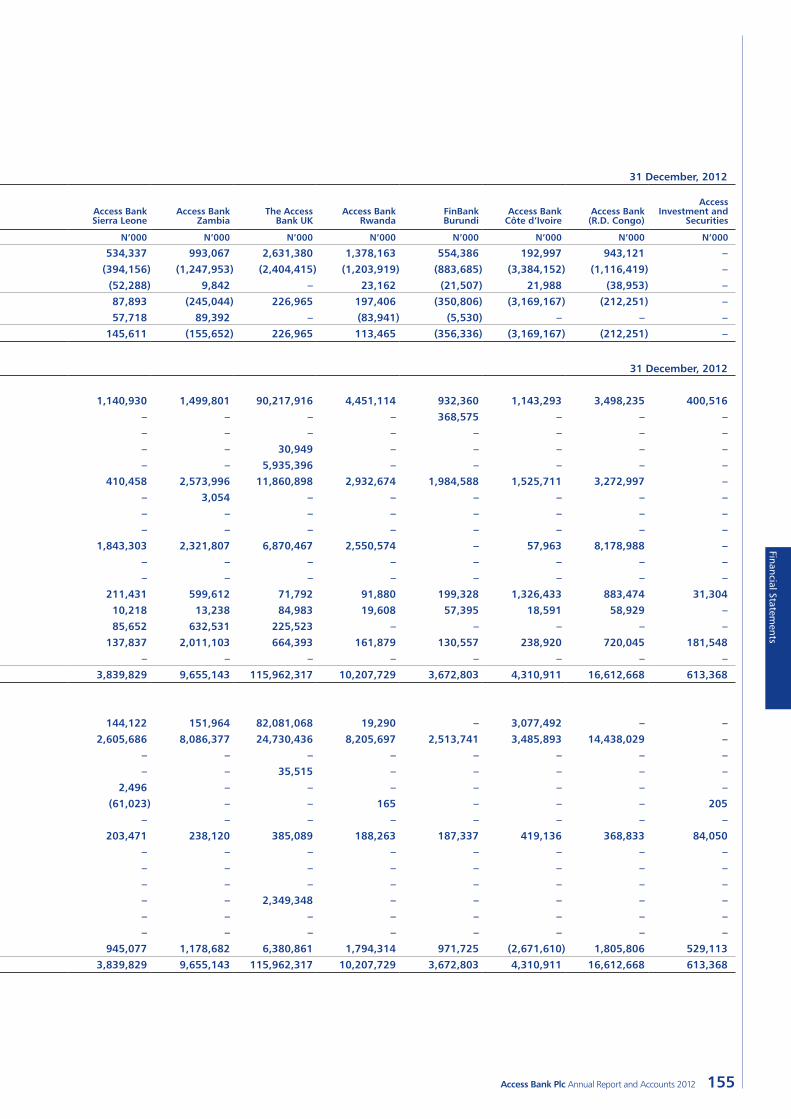
155Access Bank Plc Annual Report and Accounts 2012
Financial Statements
(b) Condensed results of consolidated entities(i) The condensed financial data of the consolidated entities as at 31 December, 2012, are as follows:
Condensed profit and loss 31 December, 2012
Group balancesElimination
entries Access Bank PlcAccess Bank
GambiaAccess BankSierra Leone
Access BankZambia
The AccessBank UK
Access BankRwanda
FinBankBurundi
Access BankCôte d’Ivoire
Access Bank(R.D. Congo)
Access Investment and
Securities
N’000 N’000 N’000 N’000 N’000 N’000 N’000 N’000 N’000 N’000 N’000 N’000
Operating income 143,188,149 (703,801) 121,300,972 549,335 534,337 993,067 2,631,380 1,378,163 554,386 192,997 943,121 –Operating expenses (87,517,350) 5,238,351 (72,656,747) (528,693) (394,156) (1,247,953) (2,404,415) (1,203,919) (883,685) (3,384,152) (1,116,419) –Net impairment on financial assets (10,790,651) 3,370,715 (11,616,078) 23,282 (52,288) 9,842 – 23,162 (21,507) 21,988 (38,953) –Profit before tax 44,880,148 7,905,265 37,028,147 43,924 87,893 (245,044) 226,965 197,406 (350,806) (3,169,167) (212,251) –Taxation (2,018,307) (129,327) (674,504) (10,544) 57,718 89,392 – (83,941) (5,530) – – –Profit for the year 42,861,841 7,775,938 36,353,643 33,380 145,611 (155,652) 226,965 113,465 (356,336) (3,169,167) (212,251) –
Condensed financial position 31 December, 2012Assets
Cash and cash equivalents 296,184,966 (16,438,845) 176,228,932 526,983 1,140,930 1,499,801 90,217,916 4,451,114 932,360 1,143,293 3,498,235 400,516Non-pledged trading assets 27,906,803 (368,575) 3,769,260 – – – – – 368,575 – – –Pledged assets 60,949,856 – 60,949,856 – – – – – – – – –Derivative financial instruments 30,949 (21,309) – – – – 30,949 – – – – –Loans and advances to banks 4,564,943 (61,802,373) 3,054,520 – – – 5,935,396 – – – – –Loans and advances to customers 604,073,399 (3,059,619) 554,592,199 2,733,406 410,458 2,573,996 11,860,898 2,932,674 1,984,588 1,525,711 3,272,997 –Insurance receivables 627,337 (249,476) – – – 3,054 – – – – – –Investments in equity accounted investee 2,548,828 544,568 1,980,808 – – – – – – – – –Investment in subsidiaires – (43,209,688) 43,209,688 – – – – – – – – –Investment securities 447,281,811 (1,817,181) 420,346,295 323,884 1,843,303 2,321,807 6,870,467 2,550,574 – 57,963 8,178,988 –Trading properties 2,693,227 (2,862,873) – – – – – – – – – –Investment properties 14,360,567 (781,331) 14,072,673 – – – – – – – – –Property and equipment 64,565,889 (2,253,801) 58,938,450 654,388 211,431 599,612 71,792 91,880 199,328 1,326,433 883,474 31,304Intangible assets 3,404,945 555,121 2,339,510 – 10,218 13,238 84,983 19,608 57,395 18,591 58,929 –Deferred tax assets/(liabilities) 8,113,973 (886,565) 7,007,387 – 85,652 632,531 225,523 – – – – –Other assets 177,042,627 (4,794,125) 169,264,885 530,247 137,837 2,011,103 664,393 161,879 130,557 238,920 720,045 181,548Assets classified as held-for-sale 30,827,257 30,827,257 – – – – – – – – – –
1,745,177,377 (106,618,815) 1,515,754,463 4,768,908 3,839,829 9,655,143 115,962,317 10,207,729 3,672,803 4,310,911 16,612,668 613,368
Financed by:
Deposits from banks 105,170,552 (20,631,164) 24,590,053 91,055 144,122 151,964 82,081,068 19,290 – 3,077,492 – –Deposits from customers 1,201,481,996 (7,256,804) 1,093,979,220 3,518,426 2,605,686 8,086,377 24,730,436 8,205,697 2,513,741 3,485,893 14,438,029 –Debt securities issued 54,685,891 – – – – – – – – – – –Derivative financial instruments 35,515 (19,027) – – – – 35,515 – – – – –Retirement Benefit obligations 2,487,589 – 2,485,093 – 2,496 – – – – – – –Current tax liabilities 8,937,964 (125,973) 7,686,568 – (61,023) – – 165 – – – 205Deferred tax liabilities 58,418,260 58,418,260 – – – – – – – – – –Other liabilities 118,226 (67,455,254) 50,246,164 147,054 203,471 238,120 385,089 188,263 187,337 419,136 368,833 84,050Claims payable 65,591 (52,635) – – – – – – – – – –Liabilities on investment contracts 3,351,234 3,285,643 – – – – – – – – – –Liabilities on insurance contracts 40,092,312 36,741,078 – – – – – – – – – –Interest-bearing loans and borrowings – (102,031,074) 95,594,904 – – – 2,349,348 – – – – –Contingent settlement provisions 3,548,250 – 3,548,250 – – – – – – – – –Liabilities classified as held-for-sale 25,793,512 25,793,512 – – – – – – – – – –Equity and reserves 240,990,485 (33,285,378) 237,624,211 1,012,373 945,077 1,178,682 6,380,861 1,794,314 971,725 (2,671,610) 1,805,806 529,113
1,745,177,377 (106,618,815) 1,515,754,463 4,768,908 3,839,829 9,655,143 115,962,317 10,207,729 3,672,803 4,310,911 16,612,668 613,368
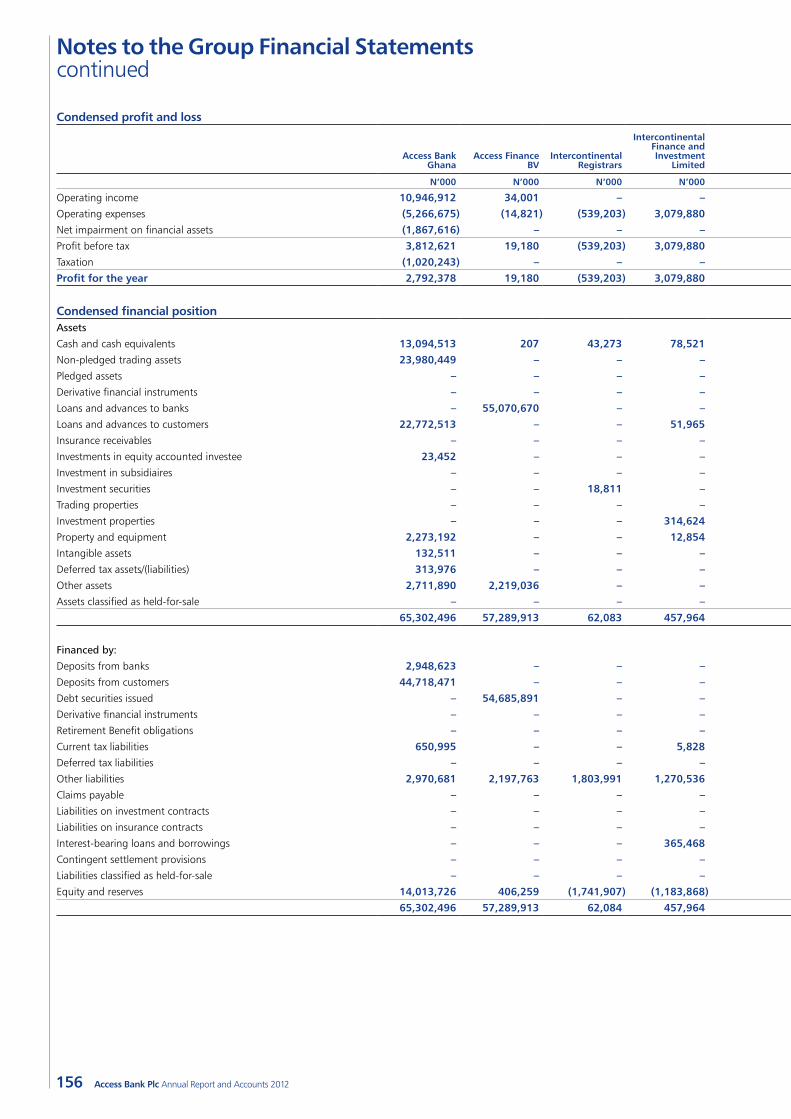
156
Notes to the Group Financial Statements continued
Access Bank Plc Annual Report and Accounts 2012
Condensed profit and loss 31 December, 2012
Access BankGhana
Access FinanceBV
Intercontinental Registrars
Intercontinental Finance and Investment
Limited
Intercontinental Homes and
SavingsIntercontinental
Bank UKIntercontinental
PropertiesIntercontinental
SecuritiesIntercontinental
Trustees
Intercontinental Capital Market
LimitedFlexmore
TechnologiesIntercontinental
WAPIC Insurance
N’000 N’000 N’000 N’000 N’000 N’000 N’000 N’000 N’000 N’000 N’000 N’000
Operating income 10,946,912 34,001 – – 744,807 208,892 536,748 – – – – 2,342,833 Operating expenses (5,266,675) (14,821) (539,203) 3,079,880 (817,485) (1,189,332) (288,307) (1,542,069) (850,148) (60,402) (44,464) (1,402,536) Net impairment on financial assets (1,867,616) – – – (5,932) (4,805) (19,608) – – – – (612,853) Profit before tax 3,812,621 19,180 (539,203) 3,079,880 (78,610) (985,245) 228,833 (1,542,069) (850,148) (60,402) (44,464) 327,444 Taxation (1,020,243) – – – (28,991) – (119,958) – – – – (92,379) Profit for the year 2,792,378 19,180 (539,203) 3,079,880 (107,601) (985,245) 108,875 (1,542,069) (850,148) (60,402) (44,464) 235,065
Condensed financial position 31 December, 2012Assets
Cash and cash equivalents 13,094,513 207 43,273 78,521 426,452 11,296,202 3,174,348 59,398 33,887 321,547 49 4,055,334 Non-pledged trading assets 23,980,449 – – – – – – – – – – 157,094 Pledged assets – – – – – – – – – – – –Derivative financial instruments – – – – – 21,309 – – – – – –Loans and advances to banks – 55,070,670 – – – 2,306,730 – – – – – –Loans and advances to customers 22,772,513 – – 51,965 1,560,303 784,131 30,625 – – 46,555 – –Insurance receivables – – – – – – – – – – – 873,759 Investments in equity accounted investee 23,452 – – – – – – – – – – –Investment in subsidiaires – – – – – – – – – – – –Investment securities – – 18,811 – 135,035 1,592,361 – – – 13,011 – 4,846,493 Trading properties – – – – 3,290,410 – 2,265,690 – – – – –Investment properties – – – 314,624 403,707 – – – – 63,000 – 287,894 Property and equipment 2,273,192 – – 12,854 652,315 55,049 211,202 436 – 6,000 1,387 599,163 Intangible assets 132,511 – – – 29,859 20,041 – – – – – 64,941 Deferred tax assets/(liabilities) 313,976 – – – 722,718 – – – – – – 12,751 Other assets 2,711,890 2,219,036 – – 313,433 191,530 57,539 – 3,000 – 361,684 1,937,226 Assets classified as held-for-sale – – – – – – – – – – – –
65,302,496 57,289,913 62,083 457,964 7,534,232 16,267,353 5,739,404 59,834 36,887 450,113 363,120 12,834,655
Financed by:
Deposits from banks 2,948,623 – – – – 12,698,049 – – – – – –Deposits from customers 44,718,471 – – – 1,257,171 – 1,199,653 – – – – –Debt securities issued – 54,685,891 – – – – – – – – – –Derivative financial instruments – – – – – 19,026 – – – – – –Retirement Benefit obligations – – – – – – – – – – – –Current tax liabilities 650,995 – – 5,828 31,286 – 284,873 – 42,160 – 46,698 376,182 Deferred tax liabilities – – – – – – – – – – – –Other liabilities 2,970,681 2,197,763 1,803,991 1,270,536 914,585 199,648 463,784 1,518,501 586,275 1,448,594 677,539 1,054,066 Claims payable – – – – – – – – – – – 118,226 Liabilities on investment contracts – – – – – – – – – – – 65,591 Liabilities on insurance contracts – – – – – – – – – – – 3,351,234 Interest-bearing loans and borrowings – – – 365,468 999,475 – – – 1,771,852 – 950,027 –Contingent settlement provisions – – – – – – – – – – – –Liabilities classified as held-for-sale – – – – – – – – – – – –Equity and reserves 14,013,726 406,259 (1,741,907) (1,183,868) 4,331,715 3,350,630 3,791,094 (1,458,667) (2,363,400) (998,481) (1,311,144) 7,869,356
65,302,496 57,289,913 62,084 457,964 7,534,232 16,267,353 5,739,404 59,834 36,887 450,113 363,120 12,834,655
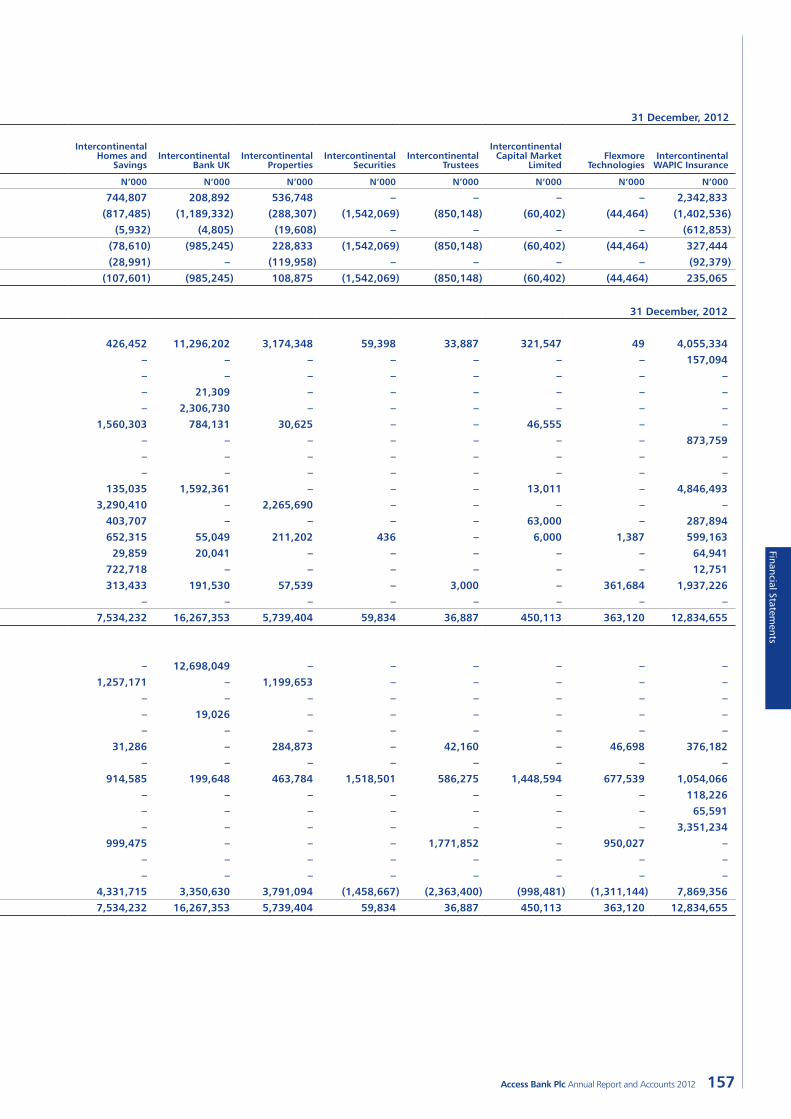
157Access Bank Plc Annual Report and Accounts 2012
Financial Statements
Condensed profit and loss 31 December, 2012
Access BankGhana
Access FinanceBV
Intercontinental Registrars
Intercontinental Finance and Investment
Limited
Intercontinental Homes and
SavingsIntercontinental
Bank UKIntercontinental
PropertiesIntercontinental
SecuritiesIntercontinental
Trustees
Intercontinental Capital Market
LimitedFlexmore
TechnologiesIntercontinental
WAPIC Insurance
N’000 N’000 N’000 N’000 N’000 N’000 N’000 N’000 N’000 N’000 N’000 N’000
Operating income 10,946,912 34,001 – – 744,807 208,892 536,748 – – – – 2,342,833 Operating expenses (5,266,675) (14,821) (539,203) 3,079,880 (817,485) (1,189,332) (288,307) (1,542,069) (850,148) (60,402) (44,464) (1,402,536) Net impairment on financial assets (1,867,616) – – – (5,932) (4,805) (19,608) – – – – (612,853) Profit before tax 3,812,621 19,180 (539,203) 3,079,880 (78,610) (985,245) 228,833 (1,542,069) (850,148) (60,402) (44,464) 327,444 Taxation (1,020,243) – – – (28,991) – (119,958) – – – – (92,379) Profit for the year 2,792,378 19,180 (539,203) 3,079,880 (107,601) (985,245) 108,875 (1,542,069) (850,148) (60,402) (44,464) 235,065
Condensed financial position 31 December, 2012Assets
Cash and cash equivalents 13,094,513 207 43,273 78,521 426,452 11,296,202 3,174,348 59,398 33,887 321,547 49 4,055,334 Non-pledged trading assets 23,980,449 – – – – – – – – – – 157,094 Pledged assets – – – – – – – – – – – –Derivative financial instruments – – – – – 21,309 – – – – – –Loans and advances to banks – 55,070,670 – – – 2,306,730 – – – – – –Loans and advances to customers 22,772,513 – – 51,965 1,560,303 784,131 30,625 – – 46,555 – –Insurance receivables – – – – – – – – – – – 873,759 Investments in equity accounted investee 23,452 – – – – – – – – – – –Investment in subsidiaires – – – – – – – – – – – –Investment securities – – 18,811 – 135,035 1,592,361 – – – 13,011 – 4,846,493 Trading properties – – – – 3,290,410 – 2,265,690 – – – – –Investment properties – – – 314,624 403,707 – – – – 63,000 – 287,894 Property and equipment 2,273,192 – – 12,854 652,315 55,049 211,202 436 – 6,000 1,387 599,163 Intangible assets 132,511 – – – 29,859 20,041 – – – – – 64,941 Deferred tax assets/(liabilities) 313,976 – – – 722,718 – – – – – – 12,751 Other assets 2,711,890 2,219,036 – – 313,433 191,530 57,539 – 3,000 – 361,684 1,937,226 Assets classified as held-for-sale – – – – – – – – – – – –
65,302,496 57,289,913 62,083 457,964 7,534,232 16,267,353 5,739,404 59,834 36,887 450,113 363,120 12,834,655
Financed by:
Deposits from banks 2,948,623 – – – – 12,698,049 – – – – – –Deposits from customers 44,718,471 – – – 1,257,171 – 1,199,653 – – – – –Debt securities issued – 54,685,891 – – – – – – – – – –Derivative financial instruments – – – – – 19,026 – – – – – –Retirement Benefit obligations – – – – – – – – – – – –Current tax liabilities 650,995 – – 5,828 31,286 – 284,873 – 42,160 – 46,698 376,182 Deferred tax liabilities – – – – – – – – – – – –Other liabilities 2,970,681 2,197,763 1,803,991 1,270,536 914,585 199,648 463,784 1,518,501 586,275 1,448,594 677,539 1,054,066 Claims payable – – – – – – – – – – – 118,226 Liabilities on investment contracts – – – – – – – – – – – 65,591 Liabilities on insurance contracts – – – – – – – – – – – 3,351,234 Interest-bearing loans and borrowings – – – 365,468 999,475 – – – 1,771,852 – 950,027 –Contingent settlement provisions – – – – – – – – – – – –Liabilities classified as held-for-sale – – – – – – – – – – – –Equity and reserves 14,013,726 406,259 (1,741,907) (1,183,868) 4,331,715 3,350,630 3,791,094 (1,458,667) (2,363,400) (998,481) (1,311,144) 7,869,356
65,302,496 57,289,913 62,084 457,964 7,534,232 16,267,353 5,739,404 59,834 36,887 450,113 363,120 12,834,655
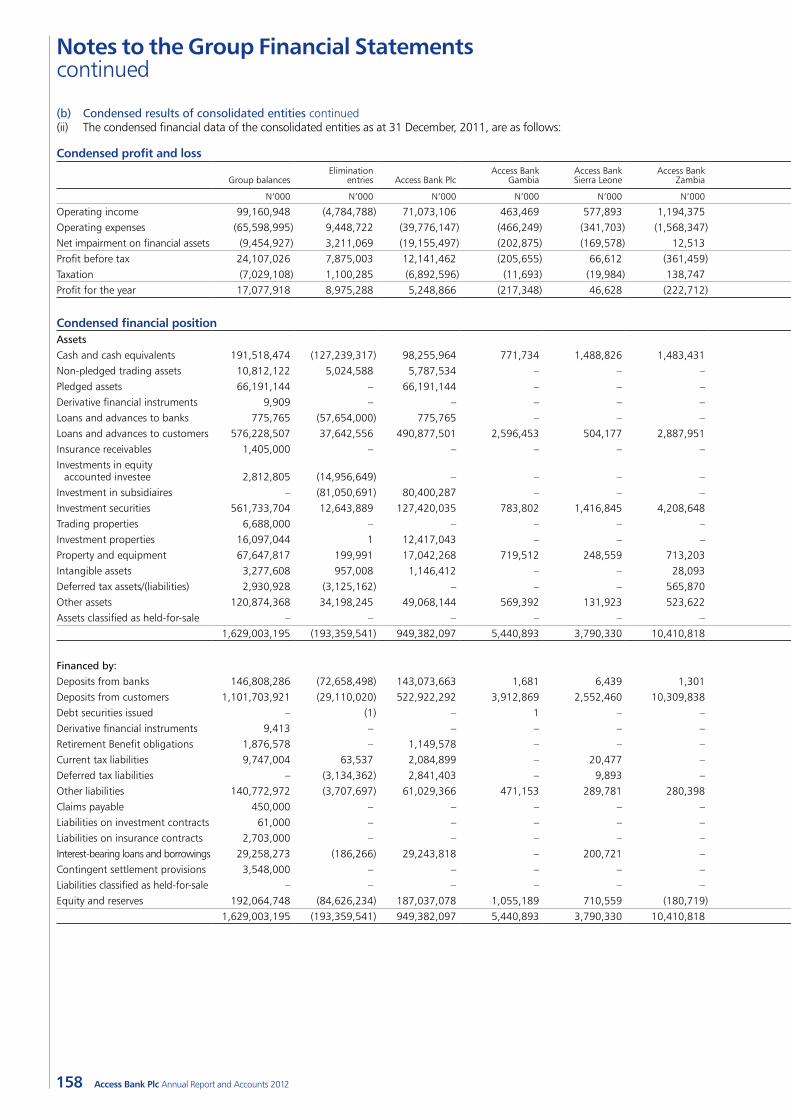
158
Notes to the Group Financial Statements continued
Access Bank Plc Annual Report and Accounts 2012
(b) Condensed results of consolidated entities continued(ii) The condensed financial data of the consolidated entities as at 31 December, 2011, are as follows:
Condensed profit and loss 31 December, 2011
Group balancesElimination
entries Access Bank PlcAccess Bank
GambiaAccess Bank Sierra Leone
Access Bank Zambia
The Access Bank UK
Access BankRwanda
FinBank Burundi
Access BankCôte d’Ivoire
Access Bank (R.D. Congo)
Access Investment and Securities
Access Bank Ghana
Intercontinental Bank (3 months)
N’000 N’000 N’000 N’000 N’000 N’000 N’000 N’000 N’000 N’000 N’000 N’000 N’000 N’000
Operating income 99,160,948 (4,784,788) 71,073,106 463,469 577,893 1,194,375 2,415,440 1,352,933 619,101 382,735 943,121 – 2,564,563 22,359,000 Operating expenses (65,598,995) 9,448,722 (39,776,147) (466,249) (341,703) (1,568,347) (2,096,926) (1,079,836) (588,327) (1,440,503) (1,116,419) – (1,136,261) (25,437,000) Net impairment on financial assets (9,454,927) 3,211,069 (19,155,497) (202,875) (169,578) 12,513 – (30,162) 27,310 (26,657) (38,953) – (231,097) 7,149,000 Profit before tax 24,107,026 7,875,003 12,141,462 (205,655) 66,612 (361,459) 318,514 242,935 58,084 (1,084,425) (212,251) – 1,197,205 4,071,000 Taxation (7,029,108) 1,100,285 (6,892,596) (11,693) (19,984) 138,747 – (86,003) (20,330) – – – (332,534) (905,000) Profit for the year 17,077,918 8,975,288 5,248,866 (217,348) 46,628 (222,712) 318,514 156,932 37,754 (1,084,425) (212,251) – 864,671 3,166,000
Condensed financial position 31 December, 2011AssetsCash and cash equivalents 191,518,474 (127,239,317) 98,255,964 771,734 1,488,826 1,483,431 56,596,922 8,477,147 1,695,770 4,934,770 1,286,560 400,516 3,853,151 139,513,000 Non-pledged trading assets 10,812,122 5,024,588 5,787,534 – – – – – – – – – – –Pledged assets 66,191,144 – 66,191,144 – – – – – – – – – – –Derivative financial instruments 9,909 – – – – – 9,909 – – – – – – –Loans and advances to banks 775,765 (57,654,000) 775,765 – – – – – – – – – 57,654,000 Loans and advances to customers 576,228,507 37,642,556 490,877,501 2,596,453 504,177 2,887,951 23,136,678 3,215,888 2,295,569 3,213,658 2,157,215 – 7,700,861 –Insurance receivables 1,405,000 – – – – – – – – – – – – 1,405,000 Investments in equity
accounted investee 2,812,805 (14,956,649) – – – – – – – – – – 14,982,649 2,786,805 Investment in subsidiaires – (81,050,691) 80,400,287 – – – – – 650,404 – – – – –Investment securities 561,733,704 12,643,889 127,420,035 783,802 1,416,845 4,208,648 8,733,228 2,793,573 – 141,223 986,169 – – 402,606,292 Trading properties 6,688,000 – – – – – – – – – – – – 6,688,000 Investment properties 16,097,044 1 12,417,043 – – – – – – – – – – 3,680,000 Property and equipment 67,647,817 199,991 17,042,268 719,512 248,559 713,203 88,435 105,427 226,979 1,828,381 1,055,374 31,304 789,589 44,598,795 Intangible assets 3,277,608 957,008 1,146,412 – – 28,093 112,959 31,657 – 39,014 – – 63,465 899,000 Deferred tax assets/(liabilities) 2,930,928 (3,125,162) – – – 565,870 220,220 – – – – – – 5,270,000 Other assets 120,874,368 34,198,245 49,068,144 569,392 131,923 523,622 887,814 151,230 165,567 234,980 435,050 181,343 758,058 33,569,000 Assets classified as held-for-sale – – – – – – – – – – – – – –
1,629,003,195 (193,359,541) 949,382,097 5,440,893 3,790,330 10,410,818 89,786,165 14,774,922 5,034,289 10,392,026 5,920,368 613,163 28,147,773 698,669,892
Financed by:Deposits from banks 146,808,286 (72,658,498) 143,073,663 1,681 6,439 1,301 59,938,362 30,485 – 2,824,264 – – 639,589 12,951,000 Deposits from customers 1,101,703,921 (29,110,020) 522,922,292 3,912,869 2,552,460 10,309,838 23,692,800 12,322,743 3,537,328 7,972,961 3,430,299 – 16,701,351 523,459,000 Debt securities issued – (1) – 1 – – – – – – – – – –Derivative financial instruments 9,413 – – – – – 9,413 – – – – – – –Retirement Benefit obligations 1,876,578 – 1,149,578 – – – – – – – – – – 727,000 Current tax liabilities 9,747,004 63,537 2,084,899 – 20,477 – – 75,170 19,338 – – – 38,583 7,445,000 Deferred tax liabilities – (3,134,362) 2,841,403 – 9,893 – – – – – – – 9,066 274,000 Other liabilities 140,772,972 (3,707,697) 61,029,366 471,153 289,781 280,398 361,916 609,696 285,675 1,433,429 434,739 84,050 827,467 78,372,999 Claims payable 450,000 – – – – – – – – – – – – 450,000 Liabilities on investment contracts 61,000 – – – – – – – – – – – – 61,000 Liabilities on insurance contracts 2,703,000 – – – – – – – – – – – – 2,703,000 Interest-bearing loans and borrowings 29,258,273 (186,266) 29,243,818 – 200,721 – – – – – – – – –Contingent settlement provisions 3,548,000 – – – – – – – – – – – – 3,548,000 Liabilities classified as held-for-sale – – – – – – – – – – – – – –Equity and reserves 192,064,748 (84,626,234) 187,037,078 1,055,189 710,559 (180,719) 5,783,674 1,736,828 1,191,948 (1,838,628) 2,055,330 529,113 9,931,717 68,678,893
1,629,003,195 (193,359,541) 949,382,097 5,440,893 3,790,330 10,410,818 89,786,165 14,774,922 5,034,289 10,392,026 5,920,368 613,163 28,147,773 698,669,892
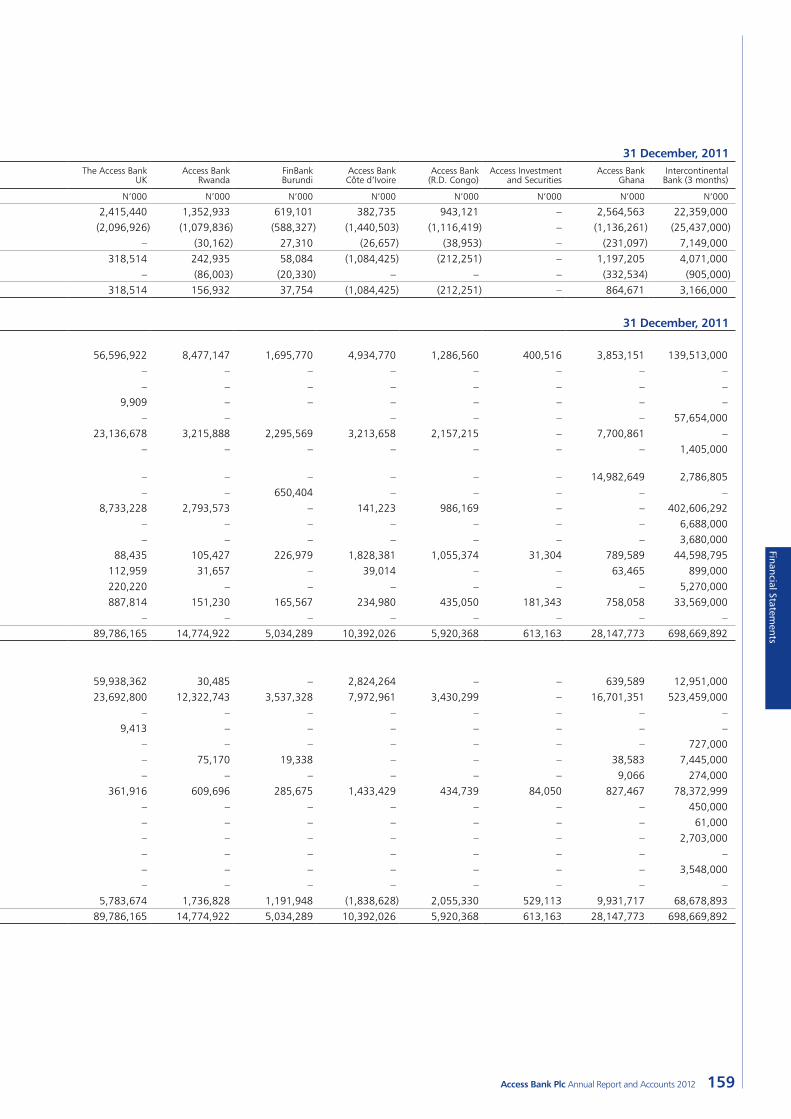
159Access Bank Plc Annual Report and Accounts 2012
Financial Statements
(b) Condensed results of consolidated entities continued(ii) The condensed financial data of the consolidated entities as at 31 December, 2011, are as follows:
Condensed profit and loss 31 December, 2011
Group balancesElimination
entries Access Bank PlcAccess Bank
GambiaAccess Bank Sierra Leone
Access Bank Zambia
The Access Bank UK
Access BankRwanda
FinBank Burundi
Access BankCôte d’Ivoire
Access Bank (R.D. Congo)
Access Investment and Securities
Access Bank Ghana
Intercontinental Bank (3 months)
N’000 N’000 N’000 N’000 N’000 N’000 N’000 N’000 N’000 N’000 N’000 N’000 N’000 N’000
Operating income 99,160,948 (4,784,788) 71,073,106 463,469 577,893 1,194,375 2,415,440 1,352,933 619,101 382,735 943,121 – 2,564,563 22,359,000 Operating expenses (65,598,995) 9,448,722 (39,776,147) (466,249) (341,703) (1,568,347) (2,096,926) (1,079,836) (588,327) (1,440,503) (1,116,419) – (1,136,261) (25,437,000) Net impairment on financial assets (9,454,927) 3,211,069 (19,155,497) (202,875) (169,578) 12,513 – (30,162) 27,310 (26,657) (38,953) – (231,097) 7,149,000 Profit before tax 24,107,026 7,875,003 12,141,462 (205,655) 66,612 (361,459) 318,514 242,935 58,084 (1,084,425) (212,251) – 1,197,205 4,071,000 Taxation (7,029,108) 1,100,285 (6,892,596) (11,693) (19,984) 138,747 – (86,003) (20,330) – – – (332,534) (905,000) Profit for the year 17,077,918 8,975,288 5,248,866 (217,348) 46,628 (222,712) 318,514 156,932 37,754 (1,084,425) (212,251) – 864,671 3,166,000
Condensed financial position 31 December, 2011AssetsCash and cash equivalents 191,518,474 (127,239,317) 98,255,964 771,734 1,488,826 1,483,431 56,596,922 8,477,147 1,695,770 4,934,770 1,286,560 400,516 3,853,151 139,513,000 Non-pledged trading assets 10,812,122 5,024,588 5,787,534 – – – – – – – – – – –Pledged assets 66,191,144 – 66,191,144 – – – – – – – – – – –Derivative financial instruments 9,909 – – – – – 9,909 – – – – – – –Loans and advances to banks 775,765 (57,654,000) 775,765 – – – – – – – – – 57,654,000 Loans and advances to customers 576,228,507 37,642,556 490,877,501 2,596,453 504,177 2,887,951 23,136,678 3,215,888 2,295,569 3,213,658 2,157,215 – 7,700,861 –Insurance receivables 1,405,000 – – – – – – – – – – – – 1,405,000 Investments in equity
accounted investee 2,812,805 (14,956,649) – – – – – – – – – – 14,982,649 2,786,805 Investment in subsidiaires – (81,050,691) 80,400,287 – – – – – 650,404 – – – – –Investment securities 561,733,704 12,643,889 127,420,035 783,802 1,416,845 4,208,648 8,733,228 2,793,573 – 141,223 986,169 – – 402,606,292 Trading properties 6,688,000 – – – – – – – – – – – – 6,688,000 Investment properties 16,097,044 1 12,417,043 – – – – – – – – – – 3,680,000 Property and equipment 67,647,817 199,991 17,042,268 719,512 248,559 713,203 88,435 105,427 226,979 1,828,381 1,055,374 31,304 789,589 44,598,795 Intangible assets 3,277,608 957,008 1,146,412 – – 28,093 112,959 31,657 – 39,014 – – 63,465 899,000 Deferred tax assets/(liabilities) 2,930,928 (3,125,162) – – – 565,870 220,220 – – – – – – 5,270,000 Other assets 120,874,368 34,198,245 49,068,144 569,392 131,923 523,622 887,814 151,230 165,567 234,980 435,050 181,343 758,058 33,569,000 Assets classified as held-for-sale – – – – – – – – – – – – – –
1,629,003,195 (193,359,541) 949,382,097 5,440,893 3,790,330 10,410,818 89,786,165 14,774,922 5,034,289 10,392,026 5,920,368 613,163 28,147,773 698,669,892
Financed by:Deposits from banks 146,808,286 (72,658,498) 143,073,663 1,681 6,439 1,301 59,938,362 30,485 – 2,824,264 – – 639,589 12,951,000 Deposits from customers 1,101,703,921 (29,110,020) 522,922,292 3,912,869 2,552,460 10,309,838 23,692,800 12,322,743 3,537,328 7,972,961 3,430,299 – 16,701,351 523,459,000 Debt securities issued – (1) – 1 – – – – – – – – – –Derivative financial instruments 9,413 – – – – – 9,413 – – – – – – –Retirement Benefit obligations 1,876,578 – 1,149,578 – – – – – – – – – – 727,000 Current tax liabilities 9,747,004 63,537 2,084,899 – 20,477 – – 75,170 19,338 – – – 38,583 7,445,000 Deferred tax liabilities – (3,134,362) 2,841,403 – 9,893 – – – – – – – 9,066 274,000 Other liabilities 140,772,972 (3,707,697) 61,029,366 471,153 289,781 280,398 361,916 609,696 285,675 1,433,429 434,739 84,050 827,467 78,372,999 Claims payable 450,000 – – – – – – – – – – – – 450,000 Liabilities on investment contracts 61,000 – – – – – – – – – – – – 61,000 Liabilities on insurance contracts 2,703,000 – – – – – – – – – – – – 2,703,000 Interest-bearing loans and borrowings 29,258,273 (186,266) 29,243,818 – 200,721 – – – – – – – – –Contingent settlement provisions 3,548,000 – – – – – – – – – – – – 3,548,000 Liabilities classified as held-for-sale – – – – – – – – – – – – – –Equity and reserves 192,064,748 (84,626,234) 187,037,078 1,055,189 710,559 (180,719) 5,783,674 1,736,828 1,191,948 (1,838,628) 2,055,330 529,113 9,931,717 68,678,893
1,629,003,195 (193,359,541) 949,382,097 5,440,893 3,790,330 10,410,818 89,786,165 14,774,922 5,034,289 10,392,026 5,920,368 613,163 28,147,773 698,669,892
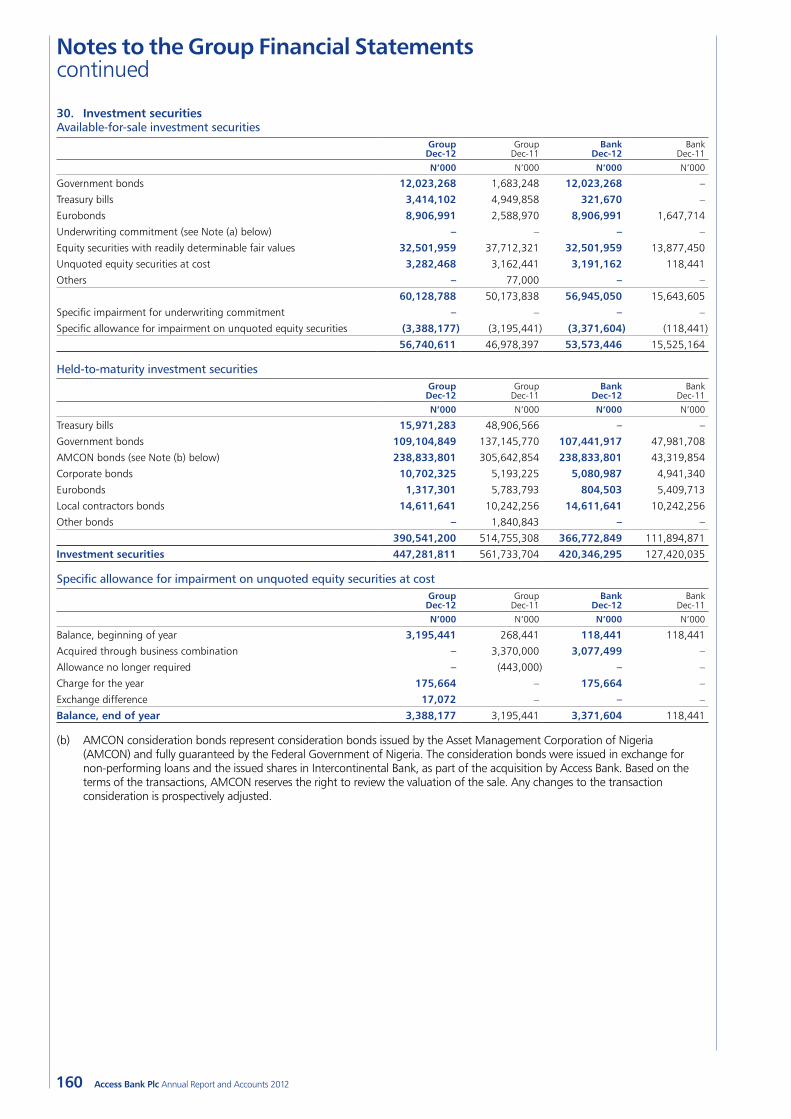
160
Notes to the Group Financial Statements continued
Access Bank Plc Annual Report and Accounts 2012
30. Investment securitiesAvailable-for-sale investment securities
Group Dec-12
Group Dec-11
Bank Dec-12
Bank Dec-11
N’000 N’000 N’000 N’000
Government bonds 12,023,268 1,683,248 12,023,268 –
Treasury bills 3,414,102 4,949,858 321,670 –
Eurobonds 8,906,991 2,588,970 8,906,991 1,647,714
Underwriting commitment (see Note (a) below) – – – –
Equity securities with readily determinable fair values 32,501,959 37,712,321 32,501,959 13,877,450
Unquoted equity securities at cost 3,282,468 3,162,441 3,191,162 118,441
Others – 77,000 – –
60,128,788 50,173,838 56,945,050 15,643,605
Specific impairment for underwriting commitment – – – –
Specific allowance for impairment on unquoted equity securities (3,388,177) (3,195,441) (3,371,604) (118,441)
56,740,611 46,978,397 53,573,446 15,525,164
Held-to-maturity investment securities
Group Dec-12
Group Dec-11
Bank Dec-12
Bank Dec-11
N’000 N’000 N’000 N’000
Treasury bills 15,971,283 48,906,566 – –
Government bonds 109,104,849 137,145,770 107,441,917 47,981,708
AMCON bonds (see Note (b) below) 238,833,801 305,642,854 238,833,801 43,319,854
Corporate bonds 10,702,325 5,193,225 5,080,987 4,941,340
Eurobonds 1,317,301 5,783,793 804,503 5,409,713
Local contractors bonds 14,611,641 10,242,256 14,611,641 10,242,256
Other bonds – 1,840,843 – –
390,541,200 514,755,308 366,772,849 111,894,871
Investment securities 447,281,811 561,733,704 420,346,295 127,420,035
Specific allowance for impairment on unquoted equity securities at cost
Group Dec-12
Group Dec-11
Bank Dec-12
Bank Dec-11
N’000 N’000 N’000 N’000
Balance, beginning of year 3,195,441 268,441 118,441 118,441
Acquired through business combination – 3,370,000 3,077,499 –
Allowance no longer required – (443,000) – –
Charge for the year 175,664 – 175,664 –
Exchange difference 17,072 – – –
Balance, end of year 3,388,177 3,195,441 3,371,604 118,441
(b) AMCON consideration bonds represent consideration bonds issued by the Asset Management Corporation of Nigeria (AMCON) and fully guaranteed by the Federal Government of Nigeria. The consideration bonds were issued in exchange for non-performing loans and the issued shares in Intercontinental Bank, as part of the acquisition by Access Bank. Based on the terms of the transactions, AMCON reserves the right to review the valuation of the sale. Any changes to the transaction consideration is prospectively adjusted.
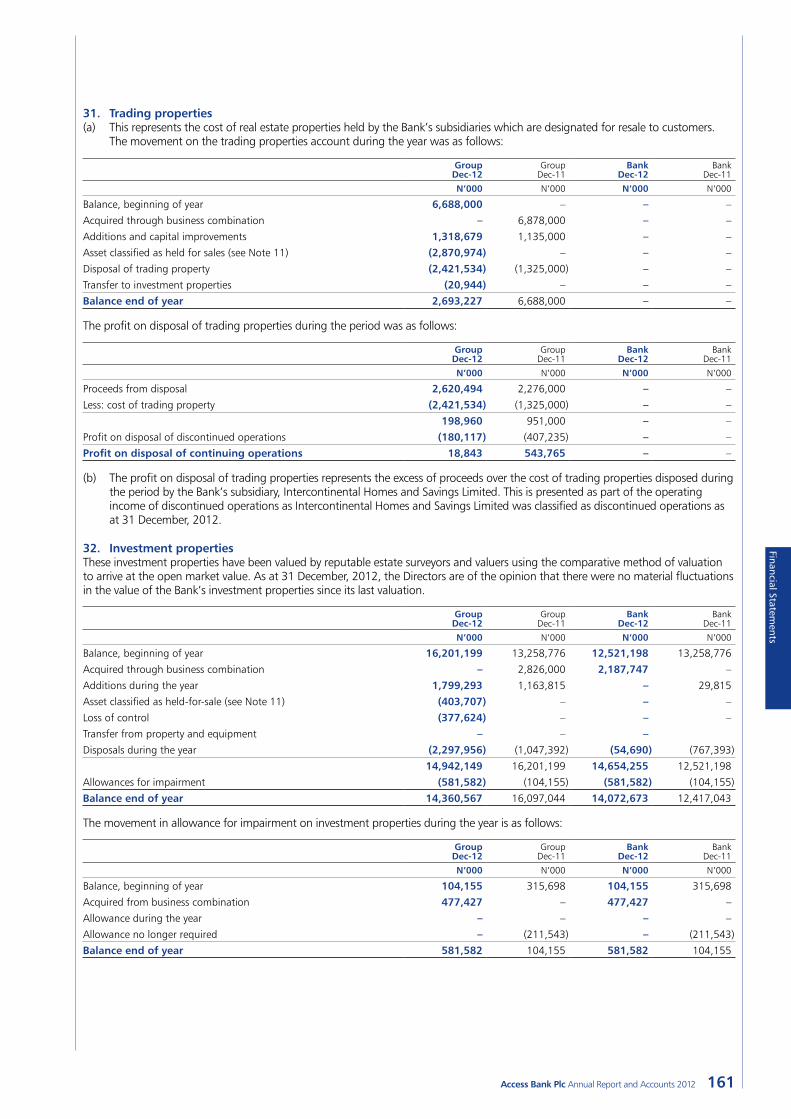
161Access Bank Plc Annual Report and Accounts 2012
Financial Statements
31. Trading properties(a) This represents the cost of real estate properties held by the Bank’s subsidiaries which are designated for resale to customers.
The movement on the trading properties account during the year was as follows:
Group Dec-12
Group Dec-11
Bank Dec-12
Bank Dec-11
N’000 N’000 N’000 N’000
Balance, beginning of year 6,688,000 – – –
Acquired through business combination – 6,878,000 – –
Additions and capital improvements 1,318,679 1,135,000 – –
Asset classified as held for sales (see Note 11) (2,870,974) – – –
Disposal of trading property (2,421,534) (1,325,000) – –
Transfer to investment properties (20,944) – – –
Balance end of year 2,693,227 6,688,000 – –
The profit on disposal of trading properties during the period was as follows:
Group Dec-12
Group Dec-11
Bank Dec-12
Bank Dec-11
N’000 N’000 N’000 N’000
Proceeds from disposal 2,620,494 2,276,000 – –
Less: cost of trading property (2,421,534) (1,325,000) – –
198,960 951,000 – –
Profit on disposal of discontinued operations (180,117) (407,235) – –
Profit on disposal of continuing operations 18,843 543,765 – –
(b) The profit on disposal of trading properties represents the excess of proceeds over the cost of trading properties disposed during the period by the Bank’s subsidiary, Intercontinental Homes and Savings Limited. This is presented as part of the operating income of discontinued operations as Intercontinental Homes and Savings Limited was classified as discontinued operations as at 31 December, 2012.
32. Investment propertiesThese investment properties have been valued by reputable estate surveyors and valuers using the comparative method of valuation to arrive at the open market value. As at 31 December, 2012, the Directors are of the opinion that there were no material fluctuations in the value of the Bank’s investment properties since its last valuation.
Group Dec-12
Group Dec-11
Bank Dec-12
Bank Dec-11
N’000 N’000 N’000 N’000
Balance, beginning of year 16,201,199 13,258,776 12,521,198 13,258,776
Acquired through business combination – 2,826,000 2,187,747 –
Additions during the year 1,799,293 1,163,815 – 29,815
Asset classified as held-for-sale (see Note 11) (403,707) – – –
Loss of control (377,624) – – –
Transfer from property and equipment – – –Disposals during the year (2,297,956) (1,047,392) (54,690) (767,393)
14,942,149 16,201,199 14,654,255 12,521,198
Allowances for impairment (581,582) (104,155) (581,582) (104,155)
Balance end of year 14,360,567 16,097,044 14,072,673 12,417,043
The movement in allowance for impairment on investment properties during the year is as follows:
Group Dec-12
Group Dec-11
Bank Dec-12
Bank Dec-11
N’000 N’000 N’000 N’000
Balance, beginning of year 104,155 315,698 104,155 315,698
Acquired from business combination 477,427 – 477,427 –
Allowance during the year – – – –
Allowance no longer required – (211,543) – (211,543)
Balance end of year 581,582 104,155 581,582 104,155
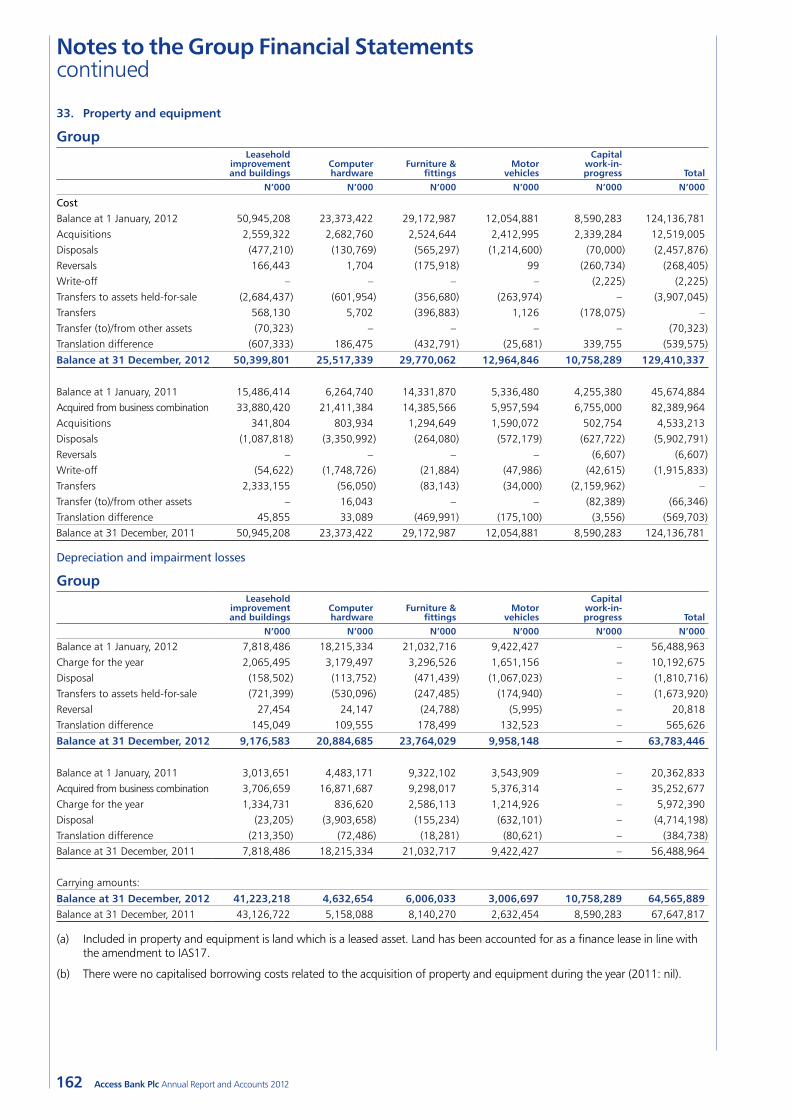
162
Notes to the Group Financial Statements continued
Access Bank Plc Annual Report and Accounts 2012
33. Property and equipment
GroupLeasehold
improvement and buildings
Computer hardware
Furniture & fittings
Motor vehicles
Capital work-in- progress Total
N’000 N’000 N’000 N’000 N’000 N’000
Cost Balance at 1 January, 2012 50,945,208 23,373,422 29,172,987 12,054,881 8,590,283 124,136,781 Acquisitions 2,559,322 2,682,760 2,524,644 2,412,995 2,339,284 12,519,005 Disposals (477,210) (130,769) (565,297) (1,214,600) (70,000) (2,457,876) Reversals 166,443 1,704 (175,918) 99 (260,734) (268,405) Write-off – – – – (2,225) (2,225) Transfers to assets held-for-sale (2,684,437) (601,954) (356,680) (263,974) – (3,907,045) Transfers 568,130 5,702 (396,883) 1,126 (178,075) –Transfer (to)/from other assets (70,323) – – – – (70,323) Translation difference (607,333) 186,475 (432,791) (25,681) 339,755 (539,575)
Balance at 31 December, 2012 50,399,801 25,517,339 29,770,062 12,964,846 10,758,289 129,410,337
Balance at 1 January, 2011 15,486,414 6,264,740 14,331,870 5,336,480 4,255,380 45,674,884 Acquired from business combination 33,880,420 21,411,384 14,385,566 5,957,594 6,755,000 82,389,964 Acquisitions 341,804 803,934 1,294,649 1,590,072 502,754 4,533,213 Disposals (1,087,818) (3,350,992) (264,080) (572,179) (627,722) (5,902,791) Reversals – – – – (6,607) (6,607) Write-off (54,622) (1,748,726) (21,884) (47,986) (42,615) (1,915,833) Transfers 2,333,155 (56,050) (83,143) (34,000) (2,159,962) –Transfer (to)/from other assets – 16,043 – – (82,389) (66,346) Translation difference 45,855 33,089 (469,991) (175,100) (3,556) (569,703) Balance at 31 December, 2011 50,945,208 23,373,422 29,172,987 12,054,881 8,590,283 124,136,781
Depreciation and impairment losses
Group
Leasehold improvement and buildings
Computer hardware
Furniture & fittings
Motor vehicles
Capital work-in- progress Total
N’000 N’000 N’000 N’000 N’000 N’000
Balance at 1 January, 2012 7,818,486 18,215,334 21,032,716 9,422,427 – 56,488,963 Charge for the year 2,065,495 3,179,497 3,296,526 1,651,156 – 10,192,675 Disposal (158,502) (113,752) (471,439) (1,067,023) – (1,810,716) Transfers to assets held-for-sale (721,399) (530,096) (247,485) (174,940) – (1,673,920) Reversal 27,454 24,147 (24,788) (5,995) – 20,818 Translation difference 145,049 109,555 178,499 132,523 – 565,626
Balance at 31 December, 2012 9,176,583 20,884,685 23,764,029 9,958,148 – 63,783,446
Balance at 1 January, 2011 3,013,651 4,483,171 9,322,102 3,543,909 – 20,362,833 Acquired from business combination 3,706,659 16,871,687 9,298,017 5,376,314 – 35,252,677 Charge for the year 1,334,731 836,620 2,586,113 1,214,926 – 5,972,390 Disposal (23,205) (3,903,658) (155,234) (632,101) – (4,714,198) Translation difference (213,350) (72,486) (18,281) (80,621) – (384,738) Balance at 31 December, 2011 7,818,486 18,215,334 21,032,717 9,422,427 – 56,488,964
Carrying amounts:
Balance at 31 December, 2012 41,223,218 4,632,654 6,006,033 3,006,697 10,758,289 64,565,889 Balance at 31 December, 2011 43,126,722 5,158,088 8,140,270 2,632,454 8,590,283 67,647,817
(a) Included in property and equipment is land which is a leased asset. Land has been accounted for as a finance lease in line with the amendment to IAS17.
(b) There were no capitalised borrowing costs related to the acquisition of property and equipment during the year (2011: nil).
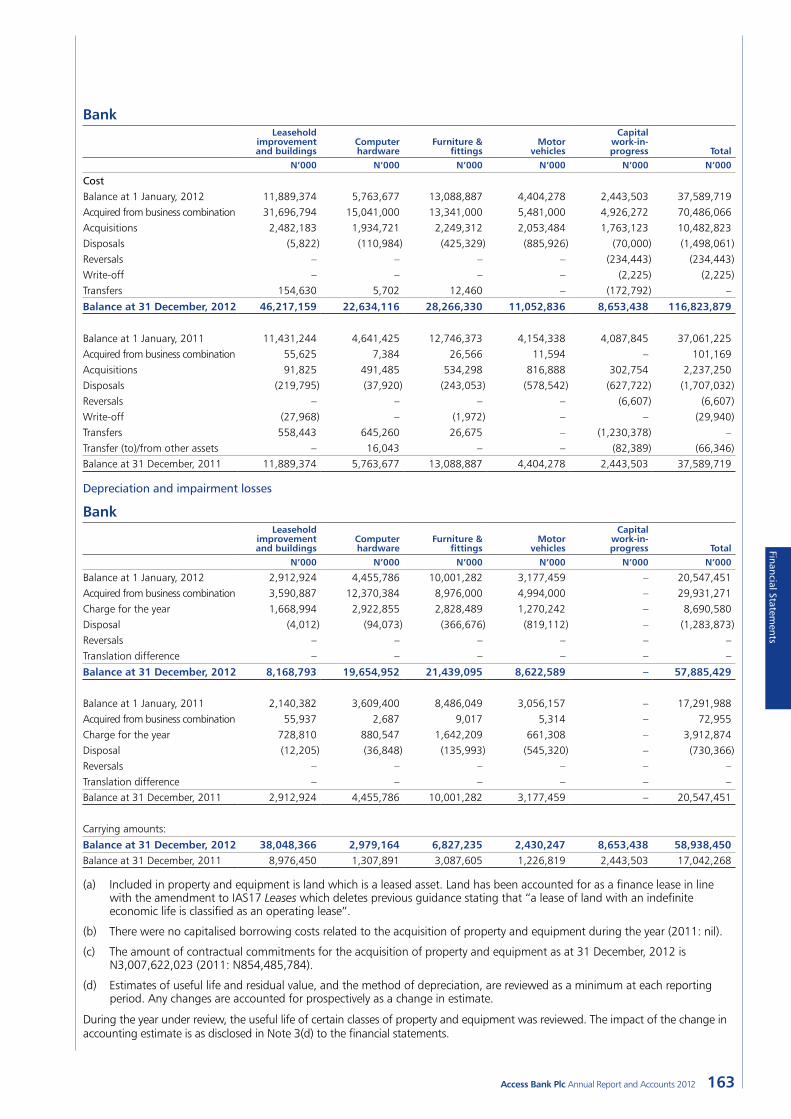
163Access Bank Plc Annual Report and Accounts 2012
Financial Statements
Bank
Leasehold improvement and buildings
Computer hardware
Furniture & fittings
Motor vehicles
Capital work-in- progress Total
N’000 N’000 N’000 N’000 N’000 N’000
Cost Balance at 1 January, 2012 11,889,374 5,763,677 13,088,887 4,404,278 2,443,503 37,589,719 Acquired from business combination 31,696,794 15,041,000 13,341,000 5,481,000 4,926,272 70,486,066 Acquisitions 2,482,183 1,934,721 2,249,312 2,053,484 1,763,123 10,482,823 Disposals (5,822) (110,984) (425,329) (885,926) (70,000) (1,498,061) Reversals – – – – (234,443) (234,443) Write-off – – – – (2,225) (2,225) Transfers 154,630 5,702 12,460 – (172,792) –
Balance at 31 December, 2012 46,217,159 22,634,116 28,266,330 11,052,836 8,653,438 116,823,879
Balance at 1 January, 2011 11,431,244 4,641,425 12,746,373 4,154,338 4,087,845 37,061,225 Acquired from business combination 55,625 7,384 26,566 11,594 – 101,169 Acquisitions 91,825 491,485 534,298 816,888 302,754 2,237,250 Disposals (219,795) (37,920) (243,053) (578,542) (627,722) (1,707,032) Reversals – – – – (6,607) (6,607) Write-off (27,968) – (1,972) – – (29,940) Transfers 558,443 645,260 26,675 – (1,230,378) –Transfer (to)/from other assets – 16,043 – – (82,389) (66,346) Balance at 31 December, 2011 11,889,374 5,763,677 13,088,887 4,404,278 2,443,503 37,589,719
Depreciation and impairment losses
Bank
Leasehold improvement and buildings
Computer hardware
Furniture & fittings
Motor vehicles
Capital work-in- progress Total
N’000 N’000 N’000 N’000 N’000 N’000
Balance at 1 January, 2012 2,912,924 4,455,786 10,001,282 3,177,459 – 20,547,451 Acquired from business combination 3,590,887 12,370,384 8,976,000 4,994,000 – 29,931,271 Charge for the year 1,668,994 2,922,855 2,828,489 1,270,242 – 8,690,580 Disposal (4,012) (94,073) (366,676) (819,112) – (1,283,873) Reversals – – – – – –Translation difference – – – – – –
Balance at 31 December, 2012 8,168,793 19,654,952 21,439,095 8,622,589 – 57,885,429
Balance at 1 January, 2011 2,140,382 3,609,400 8,486,049 3,056,157 – 17,291,988 Acquired from business combination 55,937 2,687 9,017 5,314 – 72,955 Charge for the year 728,810 880,547 1,642,209 661,308 – 3,912,874 Disposal (12,205) (36,848) (135,993) (545,320) – (730,366) Reversals – – – – – –Translation difference – – – – – –Balance at 31 December, 2011 2,912,924 4,455,786 10,001,282 3,177,459 – 20,547,451
Carrying amounts:
Balance at 31 December, 2012 38,048,366 2,979,164 6,827,235 2,430,247 8,653,438 58,938,450 Balance at 31 December, 2011 8,976,450 1,307,891 3,087,605 1,226,819 2,443,503 17,042,268
(a) Included in property and equipment is land which is a leased asset. Land has been accounted for as a finance lease in line with the amendment to IAS17 Leases which deletes previous guidance stating that “a lease of land with an indefinite economic life is classified as an operating lease”.
(b) There were no capitalised borrowing costs related to the acquisition of property and equipment during the year (2011: nil).
(c) The amount of contractual commitments for the acquisition of property and equipment as at 31 December, 2012 is N3,007,622,023 (2011: N854,485,784).
(d) Estimates of useful life and residual value, and the method of depreciation, are reviewed as a minimum at each reporting period. Any changes are accounted for prospectively as a change in estimate.
During the year under review, the useful life of certain classes of property and equipment was reviewed. The impact of the change in accounting estimate is as disclosed in Note 3(d) to the financial statements.
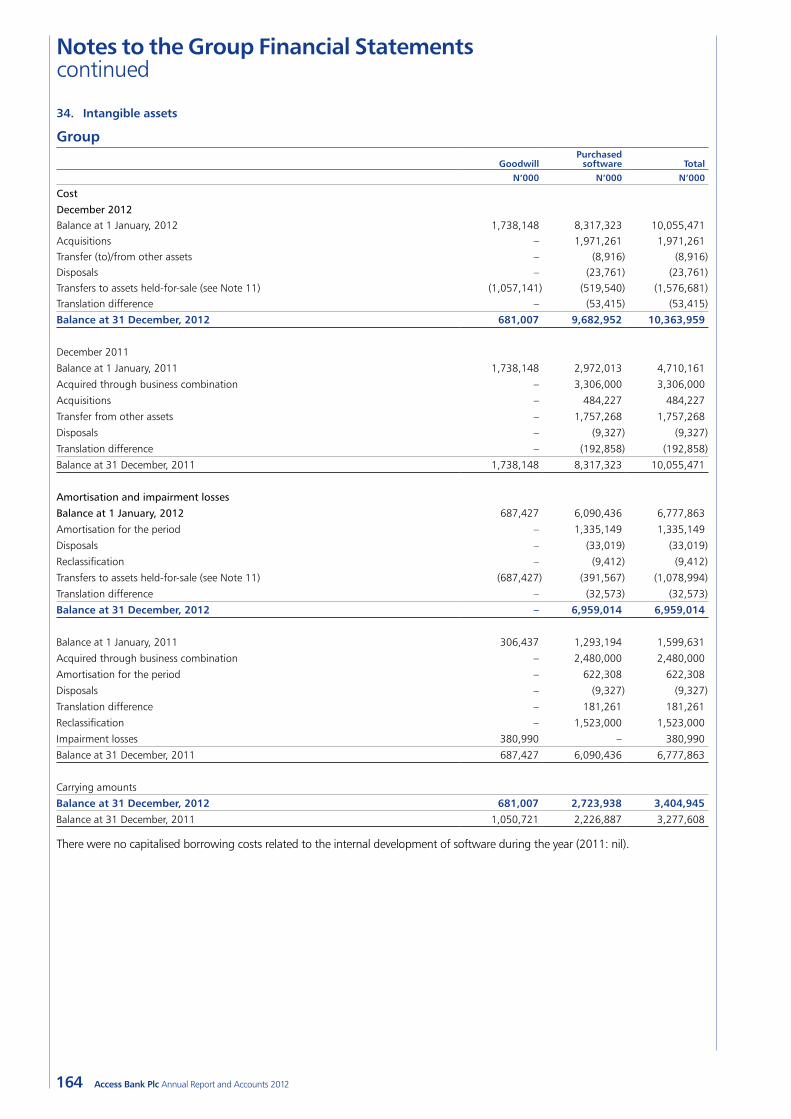
164
Notes to the Group Financial Statements continued
Access Bank Plc Annual Report and Accounts 2012
34. Intangible assets
Group
Goodwill Purchased
software TotalN’000 N’000 N’000
Cost
December 2012Balance at 1 January, 2012 1,738,148 8,317,323 10,055,471 Acquisitions – 1,971,261 1,971,261 Transfer (to)/from other assets – (8,916) (8,916) Disposals – (23,761) (23,761) Transfers to assets held-for-sale (see Note 11) (1,057,141) (519,540) (1,576,681) Translation difference – (53,415) (53,415)
Balance at 31 December, 2012 681,007 9,682,952 10,363,959
December 2011
Balance at 1 January, 2011 1,738,148 2,972,013 4,710,161
Acquired through business combination – 3,306,000 3,306,000
Acquisitions – 484,227 484,227
Transfer from other assets – 1,757,268 1,757,268
Disposals – (9,327) (9,327)
Translation difference – (192,858) (192,858)
Balance at 31 December, 2011 1,738,148 8,317,323 10,055,471
Amortisation and impairment losses
Balance at 1 January, 2012 687,427 6,090,436 6,777,863
Amortisation for the period – 1,335,149 1,335,149
Disposals – (33,019) (33,019)
Reclassification – (9,412) (9,412)
Transfers to assets held-for-sale (see Note 11) (687,427) (391,567) (1,078,994)
Translation difference – (32,573) (32,573)
Balance at 31 December, 2012 – 6,959,014 6,959,014
Balance at 1 January, 2011 306,437 1,293,194 1,599,631
Acquired through business combination – 2,480,000 2,480,000
Amortisation for the period – 622,308 622,308
Disposals – (9,327) (9,327)
Translation difference – 181,261 181,261
Reclassification – 1,523,000 1,523,000
Impairment losses 380,990 – 380,990
Balance at 31 December, 2011 687,427 6,090,436 6,777,863
Carrying amounts
Balance at 31 December, 2012 681,007 2,723,938 3,404,945 Balance at 31 December, 2011 1,050,721 2,226,887 3,277,608
There were no capitalised borrowing costs related to the internal development of software during the year (2011: nil).
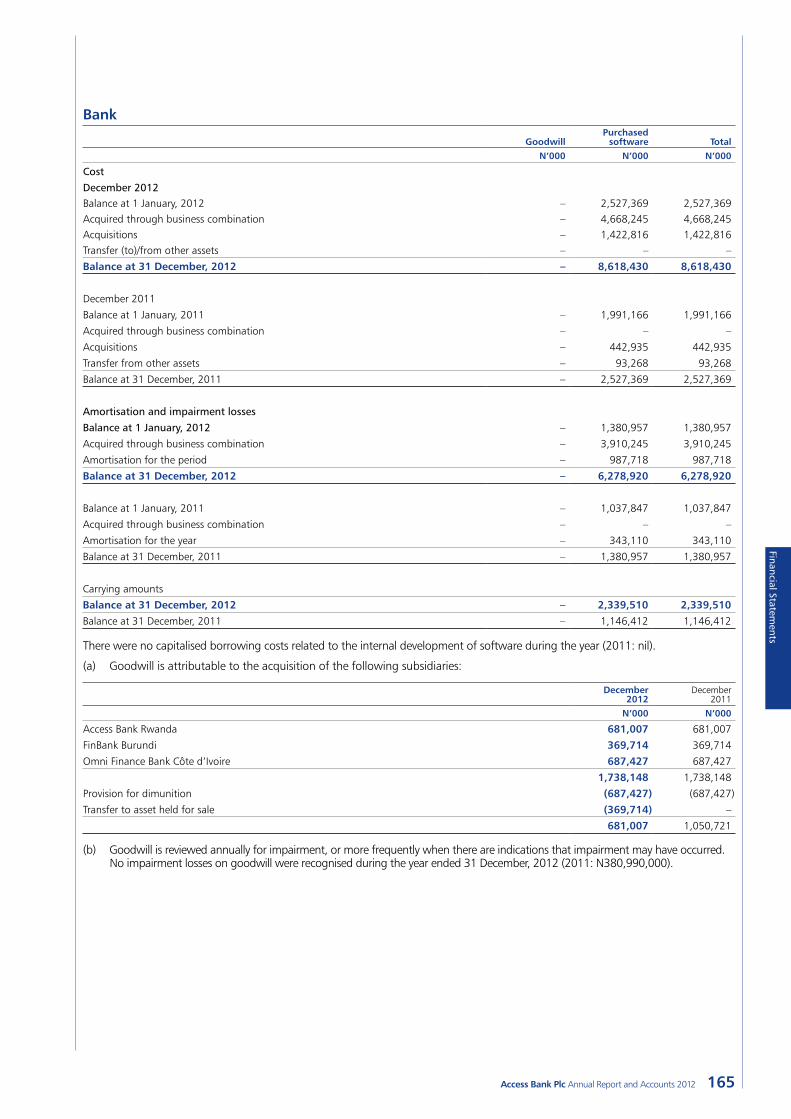
165Access Bank Plc Annual Report and Accounts 2012
Financial Statements
Bank
Goodwill Purchased
software TotalN’000 N’000 N’000
Cost
December 2012Balance at 1 January, 2012 – 2,527,369 2,527,369 Acquired through business combination – 4,668,245 4,668,245 Acquisitions – 1,422,816 1,422,816 Transfer (to)/from other assets – – –
Balance at 31 December, 2012 – 8,618,430 8,618,430
December 2011
Balance at 1 January, 2011 – 1,991,166 1,991,166
Acquired through business combination – – –
Acquisitions – 442,935 442,935
Transfer from other assets – 93,268 93,268
Balance at 31 December, 2011 – 2,527,369 2,527,369
Amortisation and impairment losses
Balance at 1 January, 2012 – 1,380,957 1,380,957
Acquired through business combination – 3,910,245 3,910,245
Amortisation for the period – 987,718 987,718
Balance at 31 December, 2012 – 6,278,920 6,278,920
Balance at 1 January, 2011 – 1,037,847 1,037,847
Acquired through business combination – – –
Amortisation for the year – 343,110 343,110
Balance at 31 December, 2011 – 1,380,957 1,380,957
Carrying amounts
Balance at 31 December, 2012 – 2,339,510 2,339,510 Balance at 31 December, 2011 – 1,146,412 1,146,412
There were no capitalised borrowing costs related to the internal development of software during the year (2011: nil).
(a) Goodwill is attributable to the acquisition of the following subsidiaries:
December2012
December2011
N’000 N’000
Access Bank Rwanda 681,007 681,007
FinBank Burundi 369,714 369,714
Omni Finance Bank Côte d’Ivoire 687,427 687,427
1,738,148 1,738,148
Provision for dimunition (687,427) (687,427)
Transfer to asset held for sale (369,714) –
681,007 1,050,721
(b) Goodwill is reviewed annually for impairment, or more frequently when there are indications that impairment may have occurred. No impairment losses on goodwill were recognised during the year ended 31 December, 2012 (2011: N380,990,000).
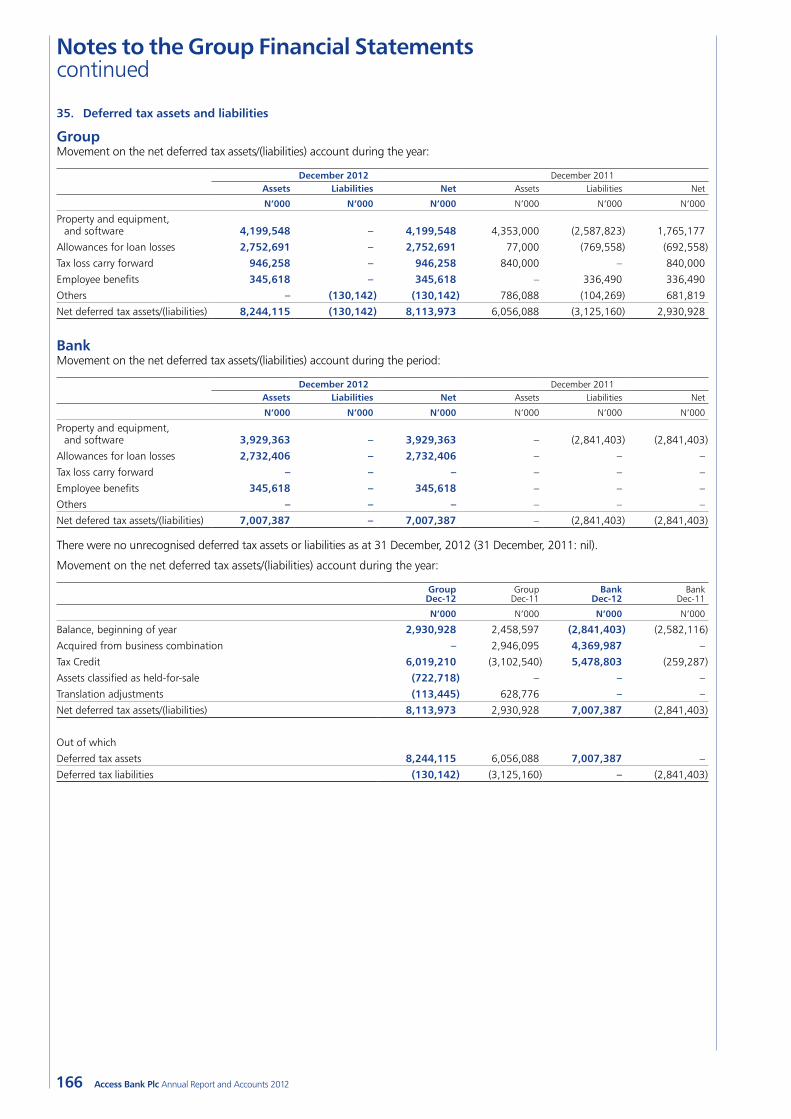
166
Notes to the Group Financial Statements continued
Access Bank Plc Annual Report and Accounts 2012
35. Deferred tax assets and liabilities
GroupMovement on the net deferred tax assets/(liabilities) account during the year:
December 2012 December 2011Assets Liabilities Net Assets Liabilities Net
N’000 N’000 N’000 N’000 N’000 N’000
Property and equipment, and software 4,199,548 – 4,199,548 4,353,000 (2,587,823) 1,765,177
Allowances for loan losses 2,752,691 – 2,752,691 77,000 (769,558) (692,558)
Tax loss carry forward 946,258 – 946,258 840,000 – 840,000
Employee benefits 345,618 – 345,618 – 336,490 336,490
Others – (130,142) (130,142) 786,088 (104,269) 681,819
Net deferred tax assets/(liabilities) 8,244,115 (130,142) 8,113,973 6,056,088 (3,125,160) 2,930,928
BankMovement on the net deferred tax assets/(liabilities) account during the period:
December 2012 December 2011Assets Liabilities Net Assets Liabilities Net
N’000 N’000 N’000 N’000 N’000 N’000
Property and equipment, and software 3,929,363 – 3,929,363 – (2,841,403) (2,841,403)
Allowances for loan losses 2,732,406 – 2,732,406 – – –
Tax loss carry forward – – – – – –
Employee benefits 345,618 – 345,618 – – –
Others – – – – – –
Net defered tax assets/(liabilities) 7,007,387 – 7,007,387 – (2,841,403) (2,841,403)
There were no unrecognised deferred tax assets or liabilities as at 31 December, 2012 (31 December, 2011: nil).
Movement on the net deferred tax assets/(liabilities) account during the year:
Group Dec-12
Group Dec-11
Bank Dec-12
Bank Dec-11
N’000 N’000 N’000 N’000
Balance, beginning of year 2,930,928 2,458,597 (2,841,403) (2,582,116)
Acquired from business combination – 2,946,095 4,369,987 –
Tax Credit 6,019,210 (3,102,540) 5,478,803 (259,287)
Assets classified as held-for-sale (722,718) – – –
Translation adjustments (113,445) 628,776 – –
Net deferred tax assets/(liabilities) 8,113,973 2,930,928 7,007,387 (2,841,403)
Out of which
Deferred tax assets 8,244,115 6,056,088 7,007,387 –
Deferred tax liabilities (130,142) (3,125,160) – (2,841,403)
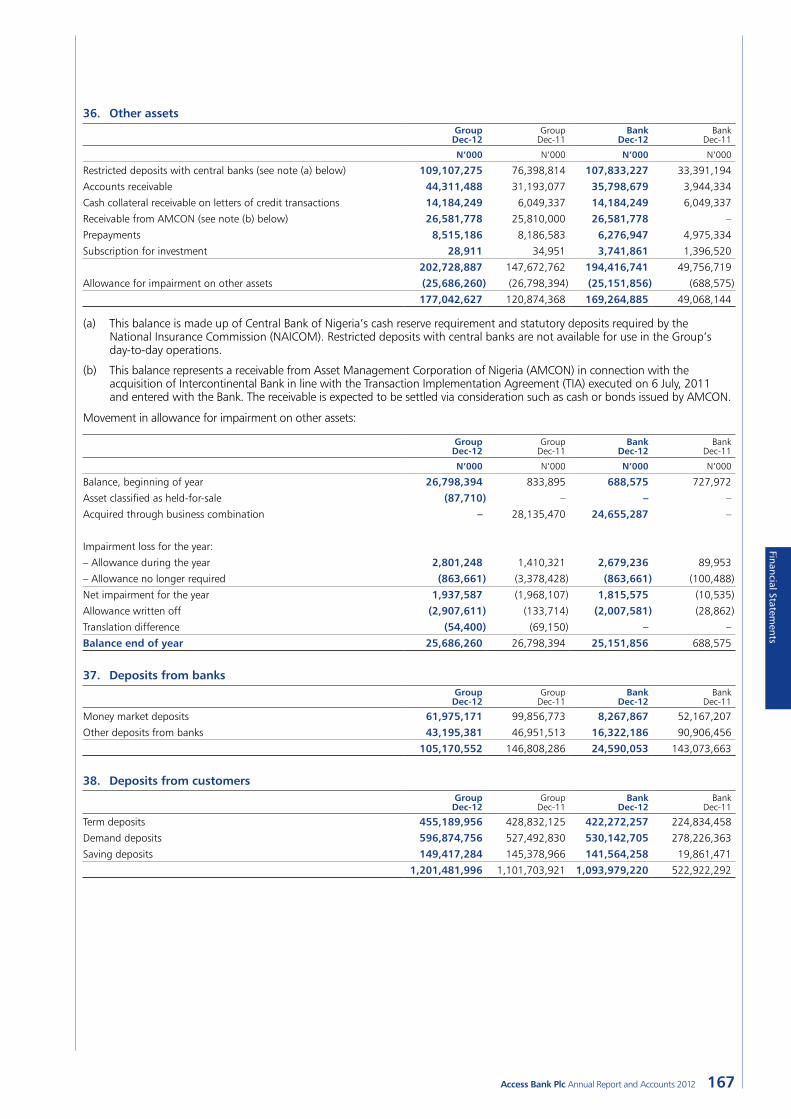
167Access Bank Plc Annual Report and Accounts 2012
Financial Statements
36. Other assetsGroup Dec-12
Group Dec-11
Bank Dec-12
Bank Dec-11
N’000 N’000 N’000 N’000
Restricted deposits with central banks (see note (a) below) 109,107,275 76,398,814 107,833,227 33,391,194
Accounts receivable 44,311,488 31,193,077 35,798,679 3,944,334
Cash collateral receivable on letters of credit transactions 14,184,249 6,049,337 14,184,249 6,049,337
Receivable from AMCON (see note (b) below) 26,581,778 25,810,000 26,581,778 –
Prepayments 8,515,186 8,186,583 6,276,947 4,975,334
Subscription for investment 28,911 34,951 3,741,861 1,396,520
202,728,887 147,672,762 194,416,741 49,756,719
Allowance for impairment on other assets (25,686,260) (26,798,394) (25,151,856) (688,575)
177,042,627 120,874,368 169,264,885 49,068,144
(a) This balance is made up of Central Bank of Nigeria’s cash reserve requirement and statutory deposits required by the National Insurance Commission (NAICOM). Restricted deposits with central banks are not available for use in the Group’s day-to-day operations.
(b) This balance represents a receivable from Asset Management Corporation of Nigeria (AMCON) in connection with the acquisition of Intercontinental Bank in line with the Transaction Implementation Agreement (TIA) executed on 6 July, 2011 and entered with the Bank. The receivable is expected to be settled via consideration such as cash or bonds issued by AMCON.
Movement in allowance for impairment on other assets:
Group Dec-12
Group Dec-11
Bank Dec-12
Bank Dec-11
N’000 N’000 N’000 N’000
Balance, beginning of year 26,798,394 833,895 688,575 727,972
Asset classified as held-for-sale (87,710) – – –
Acquired through business combination – 28,135,470 24,655,287 –
Impairment loss for the year:
– Allowance during the year 2,801,248 1,410,321 2,679,236 89,953
– Allowance no longer required (863,661) (3,378,428) (863,661) (100,488)
Net impairment for the year 1,937,587 (1,968,107) 1,815,575 (10,535)
Allowance written off (2,907,611) (133,714) (2,007,581) (28,862)
Translation difference (54,400) (69,150) – –
Balance end of year 25,686,260 26,798,394 25,151,856 688,575
37. Deposits from banksGroup Dec-12
Group Dec-11
Bank Dec-12
Bank Dec-11
Money market deposits 61,975,171 99,856,773 8,267,867 52,167,207
Other deposits from banks 43,195,381 46,951,513 16,322,186 90,906,456
105,170,552 146,808,286 24,590,053 143,073,663
38. Deposits from customersGroup Dec-12
Group Dec-11
Bank Dec-12
Bank Dec-11
Term deposits 455,189,956 428,832,125 422,272,257 224,834,458
Demand deposits 596,874,756 527,492,830 530,142,705 278,226,363
Saving deposits 149,417,284 145,378,966 141,564,258 19,861,471
1,201,481,996 1,101,703,921 1,093,979,220 522,922,292
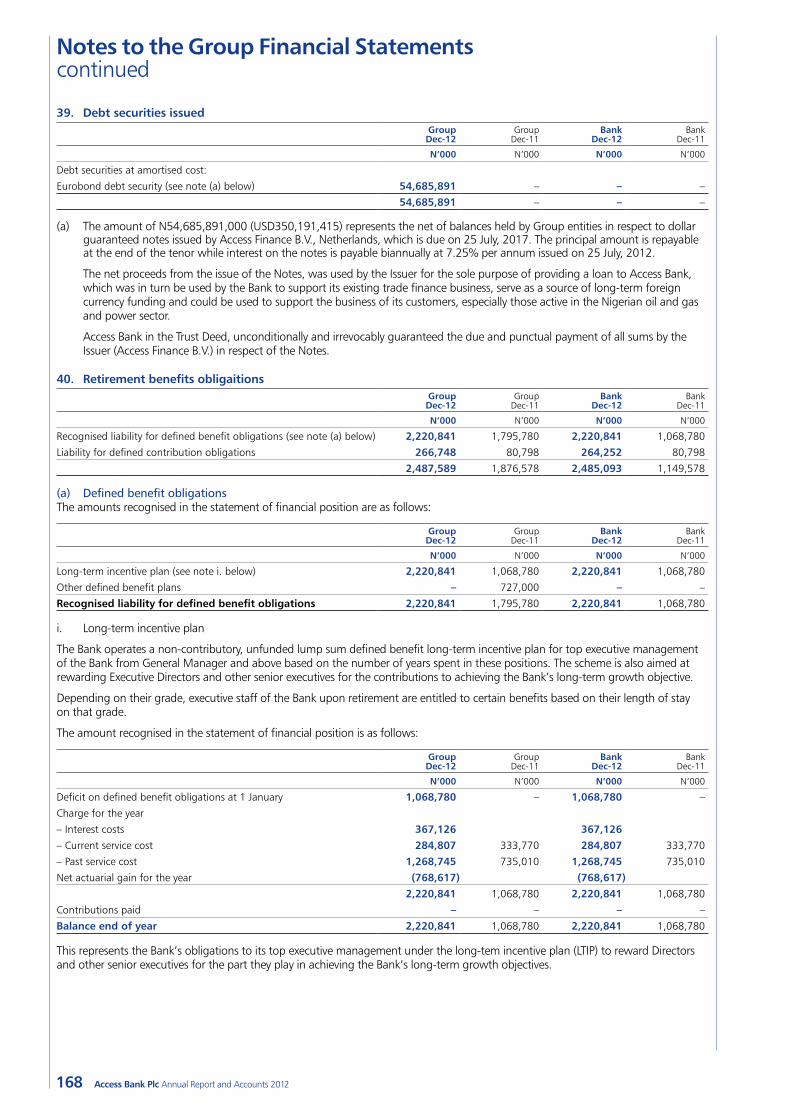
168
Notes to the Group Financial Statements continued
Access Bank Plc Annual Report and Accounts 2012
39. Debt securities issuedGroup Dec-12
Group Dec-11
Bank Dec-12
Bank Dec-11
N’000 N’000 N’000 N’000
Debt securities at amortised cost:
Eurobond debt security (see note (a) below) 54,685,891 – – –
54,685,891 – – –
(a) The amount of N54,685,891,000 (USD350,191,415) represents the net of balances held by Group entities in respect to dollar guaranteed notes issued by Access Finance B.V., Netherlands, which is due on 25 July, 2017. The principal amount is repayable at the end of the tenor while interest on the notes is payable biannually at 7.25% per annum issued on 25 July, 2012.
The net proceeds from the issue of the Notes, was used by the Issuer for the sole purpose of providing a loan to Access Bank, which was in turn be used by the Bank to support its existing trade finance business, serve as a source of long-term foreign currency funding and could be used to support the business of its customers, especially those active in the Nigerian oil and gas and power sector.
Access Bank in the Trust Deed, unconditionally and irrevocably guaranteed the due and punctual payment of all sums by the Issuer (Access Finance B.V.) in respect of the Notes.
40. Retirement benefits obligaitionsGroup Dec-12
Group Dec-11
Bank Dec-12
Bank Dec-11
N’000 N’000 N’000 N’000
Recognised liability for defined benefit obligations (see note (a) below) 2,220,841 1,795,780 2,220,841 1,068,780
Liability for defined contribution obligations 266,748 80,798 264,252 80,798
2,487,589 1,876,578 2,485,093 1,149,578
(a) Defined benefit obligationsThe amounts recognised in the statement of financial position are as follows:
Group Dec-12
Group Dec-11
Bank Dec-12
Bank Dec-11
N’000 N’000 N’000 N’000
Long-term incentive plan (see note i. below) 2,220,841 1,068,780 2,220,841 1,068,780
Other defined benefit plans – 727,000 – –
Recognised liability for defined benefit obligations 2,220,841 1,795,780 2,220,841 1,068,780
i. Long-term incentive plan
The Bank operates a non-contributory, unfunded lump sum defined benefit long-term incentive plan for top executive management of the Bank from General Manager and above based on the number of years spent in these positions. The scheme is also aimed at rewarding Executive Directors and other senior executives for the contributions to achieving the Bank’s long-term growth objective.
Depending on their grade, executive staff of the Bank upon retirement are entitled to certain benefits based on their length of stay on that grade.
The amount recognised in the statement of financial position is as follows:
Group Dec-12
Group Dec-11
Bank Dec-12
Bank Dec-11
N’000 N’000 N’000 N’000
Deficit on defined benefit obligations at 1 January 1,068,780 – 1,068,780 –
Charge for the year
– Interest costs 367,126 367,126– Current service cost 284,807 333,770 284,807 333,770
– Past service cost 1,268,745 735,010 1,268,745 735,010
Net actuarial gain for the year (768,617) (768,617)2,220,841 1,068,780 2,220,841 1,068,780
Contributions paid – – – –
Balance end of year 2,220,841 1,068,780 2,220,841 1,068,780
This represents the Bank’s obligations to its top executive management under the long-tem incentive plan (LTIP) to reward Directors and other senior executives for the part they play in achieving the Bank’s long-term growth objectives.
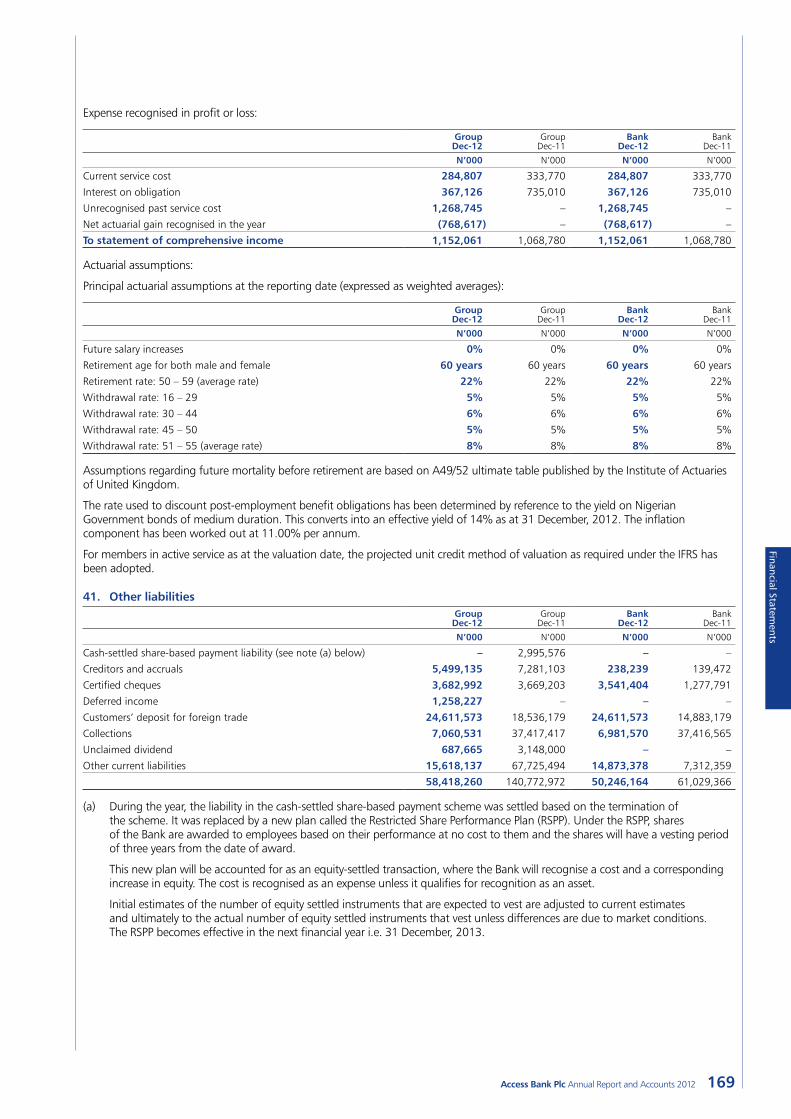
169Access Bank Plc Annual Report and Accounts 2012
Financial Statements
Expense recognised in profit or loss:
Group Dec-12
Group Dec-11
Bank Dec-12
Bank Dec-11
N’000 N’000 N’000 N’000
Current service cost 284,807 333,770 284,807 333,770
Interest on obligation 367,126 735,010 367,126 735,010
Unrecognised past service cost 1,268,745 – 1,268,745 –
Net actuarial gain recognised in the year (768,617) – (768,617) –
To statement of comprehensive income 1,152,061 1,068,780 1,152,061 1,068,780
Actuarial assumptions:
Principal actuarial assumptions at the reporting date (expressed as weighted averages):
Group Dec-12
Group Dec-11
Bank Dec-12
Bank Dec-11
N’000 N’000 N’000 N’000
Future salary increases 0% 0% 0% 0%
Retirement age for both male and female 60 years 60 years 60 years 60 years
Retirement rate: 50 – 59 (average rate) 22% 22% 22% 22%
Withdrawal rate: 16 – 29 5% 5% 5% 5%
Withdrawal rate: 30 – 44 6% 6% 6% 6%
Withdrawal rate: 45 – 50 5% 5% 5% 5%
Withdrawal rate: 51 – 55 (average rate) 8% 8% 8% 8%
Assumptions regarding future mortality before retirement are based on A49/52 ultimate table published by the Institute of Actuaries of United Kingdom.
The rate used to discount post-employment benefit obligations has been determined by reference to the yield on Nigerian Government bonds of medium duration. This converts into an effective yield of 14% as at 31 December, 2012. The inflation component has been worked out at 11.00% per annum.
For members in active service as at the valuation date, the projected unit credit method of valuation as required under the IFRS has been adopted.
41. Other liabilitiesGroup Dec-12
Group Dec-11
Bank Dec-12
Bank Dec-11
N’000 N’000 N’000 N’000
Cash-settled share-based payment liability (see note (a) below) – 2,995,576 – –
Creditors and accruals 5,499,135 7,281,103 238,239 139,472
Certified cheques 3,682,992 3,669,203 3,541,404 1,277,791
Deferred income 1,258,227 – – –
Customers’ deposit for foreign trade 24,611,573 18,536,179 24,611,573 14,883,179
Collections 7,060,531 37,417,417 6,981,570 37,416,565
Unclaimed dividend 687,665 3,148,000 – –
Other current liabilities 15,618,137 67,725,494 14,873,378 7,312,359
58,418,260 140,772,972 50,246,164 61,029,366
(a) During the year, the liability in the cash-settled share-based payment scheme was settled based on the termination of the scheme. It was replaced by a new plan called the Restricted Share Performance Plan (RSPP). Under the RSPP, shares of the Bank are awarded to employees based on their performance at no cost to them and the shares will have a vesting period of three years from the date of award.
This new plan will be accounted for as an equity-settled transaction, where the Bank will recognise a cost and a corresponding increase in equity. The cost is recognised as an expense unless it qualifies for recognition as an asset.
Initial estimates of the number of equity settled instruments that are expected to vest are adjusted to current estimates and ultimately to the actual number of equity settled instruments that vest unless differences are due to market conditions. The RSPP becomes effective in the next financial year i.e. 31 December, 2013.
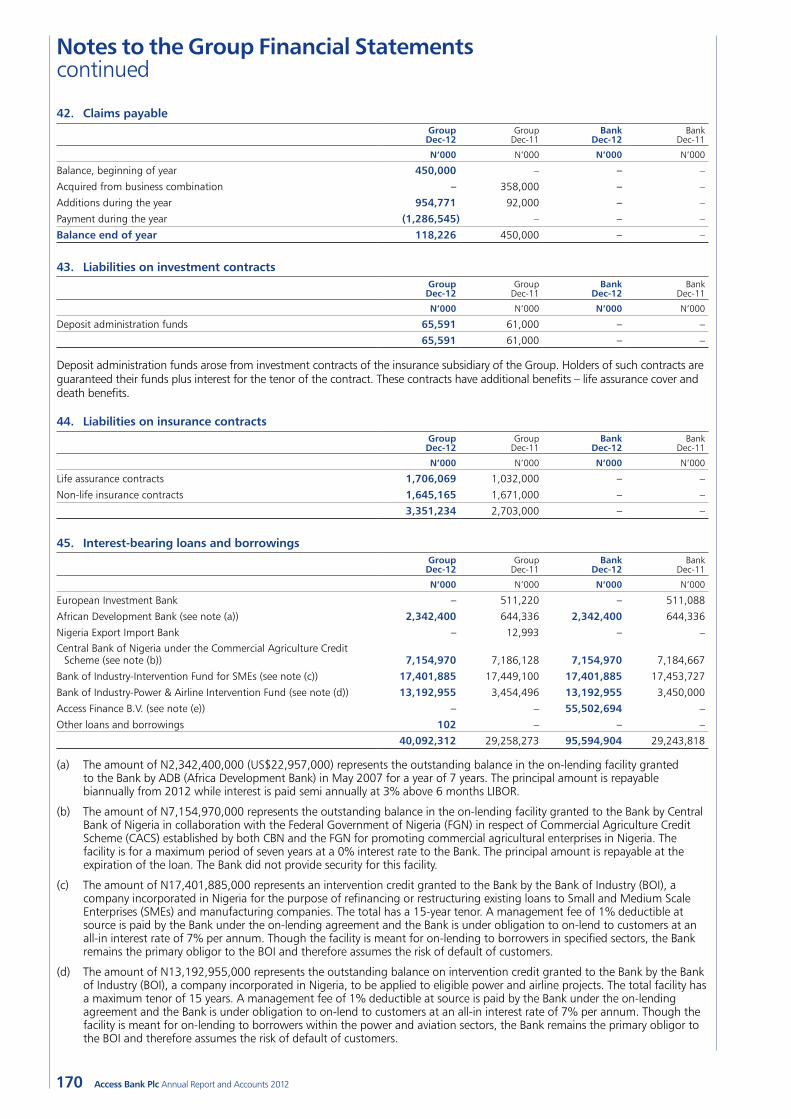
170
Notes to the Group Financial Statements continued
Access Bank Plc Annual Report and Accounts 2012
42. Claims payableGroup Dec-12
Group Dec-11
Bank Dec-12
Bank Dec-11
N’000 N’000 N’000 N’000
Balance, beginning of year 450,000 – – –
Acquired from business combination – 358,000 – –
Additions during the year 954,771 92,000 – –
Payment during the year (1,286,545) – – –
Balance end of year 118,226 450,000 – –
43. Liabilities on investment contractsGroup Dec-12
Group Dec-11
Bank Dec-12
Bank Dec-11
N’000 N’000 N’000 N’000
Deposit administration funds 65,591 61,000 – –
65,591 61,000 – –
Deposit administration funds arose from investment contracts of the insurance subsidiary of the Group. Holders of such contracts are guaranteed their funds plus interest for the tenor of the contract. These contracts have additional benefits – life assurance cover and death benefits.
44. Liabilities on insurance contractsGroup Dec-12
Group Dec-11
Bank Dec-12
Bank Dec-11
N’000 N’000 N’000 N’000
Life assurance contracts 1,706,069 1,032,000 – –
Non-life insurance contracts 1,645,165 1,671,000 – –
3,351,234 2,703,000 – –
45. Interest-bearing loans and borrowingsGroup Dec-12
Group Dec-11
Bank Dec-12
Bank Dec-11
N’000 N’000 N’000 N’000
European Investment Bank – 511,220 – 511,088
African Development Bank (see note (a)) 2,342,400 644,336 2,342,400 644,336
Nigeria Export Import Bank – 12,993 – –Central Bank of Nigeria under the Commercial Agriculture Credit
Scheme (see note (b)) 7,154,970 7,186,128 7,154,970 7,184,667
Bank of Industry-Intervention Fund for SMEs (see note (c)) 17,401,885 17,449,100 17,401,885 17,453,727
Bank of Industry-Power & Airline Intervention Fund (see note (d)) 13,192,955 3,454,496 13,192,955 3,450,000
Access Finance B.V. (see note (e)) – – 55,502,694 –
Other loans and borrowings 102 – – –
40,092,312 29,258,273 95,594,904 29,243,818
(a) The amount of N2,342,400,000 (US$22,957,000) represents the outstanding balance in the on-lending facility granted to the Bank by ADB (Africa Development Bank) in May 2007 for a year of 7 years. The principal amount is repayable biannually from 2012 while interest is paid semi annually at 3% above 6 months LIBOR.
(b) The amount of N7,154,970,000 represents the outstanding balance in the on-lending facility granted to the Bank by Central Bank of Nigeria in collaboration with the Federal Government of Nigeria (FGN) in respect of Commercial Agriculture Credit Scheme (CACS) established by both CBN and the FGN for promoting commercial agricultural enterprises in Nigeria. The facility is for a maximum period of seven years at a 0% interest rate to the Bank. The principal amount is repayable at the expiration of the loan. The Bank did not provide security for this facility.
(c) The amount of N17,401,885,000 represents an intervention credit granted to the Bank by the Bank of Industry (BOI), a company incorporated in Nigeria for the purpose of refinancing or restructuring existing loans to Small and Medium Scale Enterprises (SMEs) and manufacturing companies. The total has a 15-year tenor. A management fee of 1% deductible at source is paid by the Bank under the on-lending agreement and the Bank is under obligation to on-lend to customers at an all-in interest rate of 7% per annum. Though the facility is meant for on-lending to borrowers in specified sectors, the Bank remains the primary obligor to the BOI and therefore assumes the risk of default of customers.
(d) The amount of N13,192,955,000 represents the outstanding balance on intervention credit granted to the Bank by the Bank of Industry (BOI), a company incorporated in Nigeria, to be applied to eligible power and airline projects. The total facility has a maximum tenor of 15 years. A management fee of 1% deductible at source is paid by the Bank under the on-lending agreement and the Bank is under obligation to on-lend to customers at an all-in interest rate of 7% per annum. Though the facility is meant for on-lending to borrowers within the power and aviation sectors, the Bank remains the primary obligor to the BOI and therefore assumes the risk of default of customers.
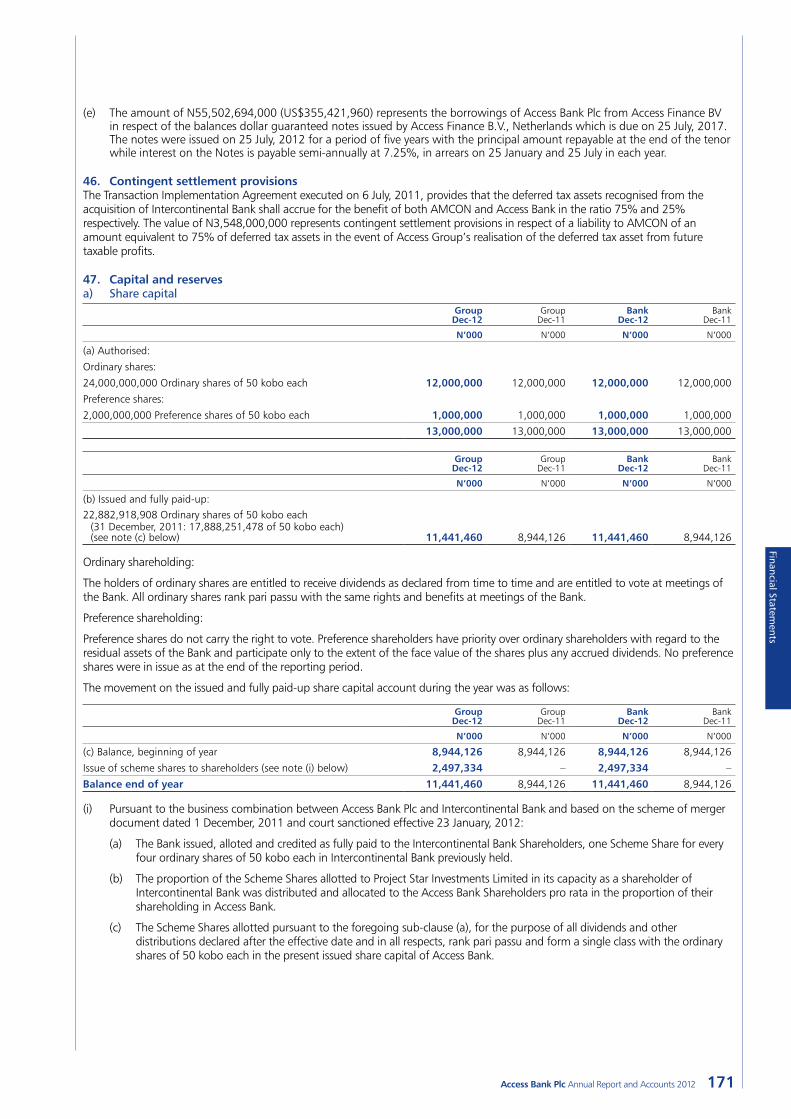
171Access Bank Plc Annual Report and Accounts 2012
Financial Statements
(e) The amount of N55,502,694,000 (US$355,421,960) represents the borrowings of Access Bank Plc from Access Finance BV in respect of the balances dollar guaranteed notes issued by Access Finance B.V., Netherlands which is due on 25 July, 2017. The notes were issued on 25 July, 2012 for a period of five years with the principal amount repayable at the end of the tenor while interest on the Notes is payable semi-annually at 7.25%, in arrears on 25 January and 25 July in each year.
46. Contingent settlement provisionsThe Transaction Implementation Agreement executed on 6 July, 2011, provides that the deferred tax assets recognised from the acquisition of Intercontinental Bank shall accrue for the benefit of both AMCON and Access Bank in the ratio 75% and 25% respectively. The value of₦N3,548,000,000 represents contingent settlement provisions in respect of a liability to AMCON of an amount equivalent to 75% of deferred tax assets in the event of Access Group’s realisation of the deferred tax asset from future taxable profits.
47. Capital and reservesa) Share capital
Group Dec-12
Group Dec-11
Bank Dec-12
Bank Dec-11
N’000 N’000 N’000 N’000
(a) Authorised:
Ordinary shares:
24,000,000,000 Ordinary shares of 50 kobo each 12,000,000 12,000,000 12,000,000 12,000,000
Preference shares:
2,000,000,000 Preference shares of 50 kobo each 1,000,000 1,000,000 1,000,000 1,000,000
13,000,000 13,000,000 13,000,000 13,000,000
Group Dec-12
Group Dec-11
Bank Dec-12
Bank Dec-11
N’000 N’000 N’000 N’000
(b) Issued and fully paid-up:22,882,918,908 Ordinary shares of 50 kobo each
(31 December, 2011: 17,888,251,478 of 50 kobo each) (see note (c) below) 11,441,460 8,944,126 11,441,460 8,944,126
Ordinary shareholding:
The holders of ordinary shares are entitled to receive dividends as declared from time to time and are entitled to vote at meetings of the Bank. All ordinary shares rank pari passu with the same rights and benefits at meetings of the Bank.
Preference shareholding:
Preference shares do not carry the right to vote. Preference shareholders have priority over ordinary shareholders with regard to the residual assets of the Bank and participate only to the extent of the face value of the shares plus any accrued dividends. No preference shares were in issue as at the end of the reporting period.
The movement on the issued and fully paid-up share capital account during the year was as follows:
Group Dec-12
Group Dec-11
Bank Dec-12
Bank Dec-11
N’000 N’000 N’000 N’000
(c) Balance, beginning of year 8,944,126 8,944,126 8,944,126 8,944,126
Issue of scheme shares to shareholders (see note (i) below) 2,497,334 – 2,497,334 –
Balance end of year 11,441,460 8,944,126 11,441,460 8,944,126
(i) Pursuant to the business combination between Access Bank Plc and Intercontinental Bank and based on the scheme of merger document dated 1 December, 2011 and court sanctioned effective 23 January, 2012:
(a) The Bank issued, alloted and credited as fully paid to the Intercontinental Bank Shareholders, one Scheme Share for every four ordinary shares of 50 kobo each in Intercontinental Bank previously held.
(b) The proportion of the Scheme Shares allotted to Project Star Investments Limited in its capacity as a shareholder of Intercontinental Bank was distributed and allocated to the Access Bank Shareholders pro rata in the proportion of their shareholding in Access Bank.
(c) The Scheme Shares allotted pursuant to the foregoing sub-clause (a), for the purpose of all dividends and other distributions declared after the effective date and in all respects, rank pari passu and form a single class with the ordinary shares of 50 kobo each in the present issued share capital of Access Bank.
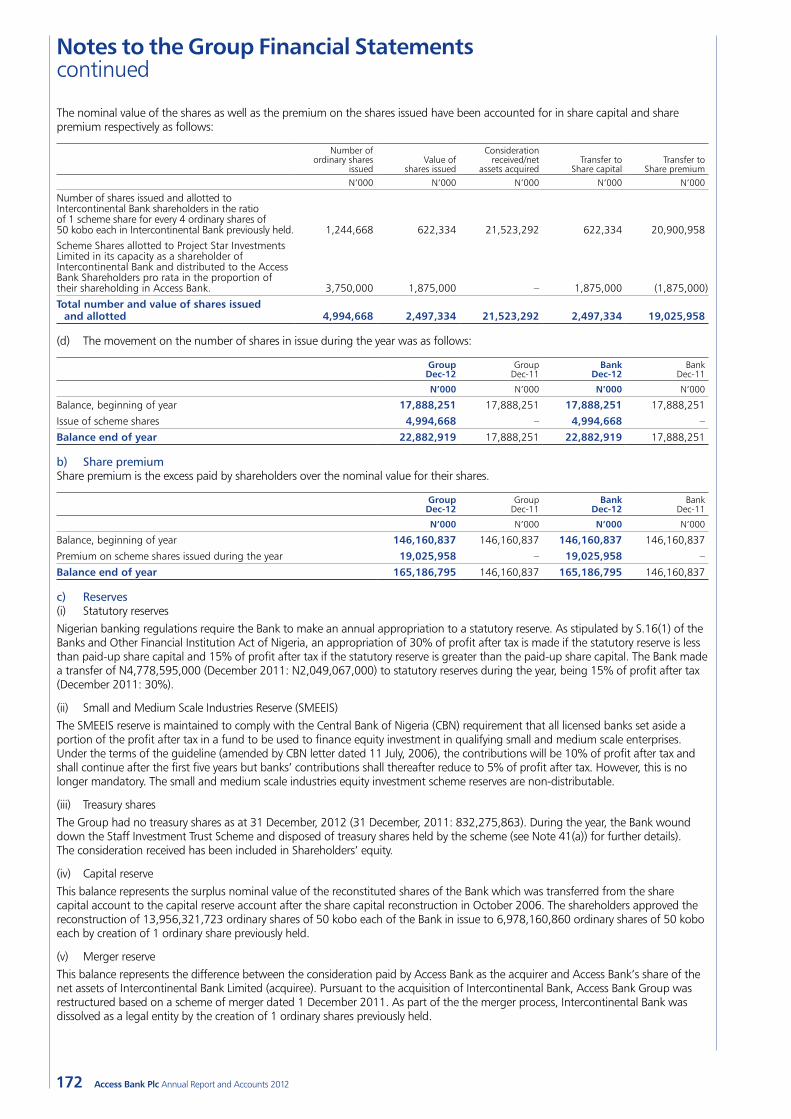
172
Notes to the Group Financial Statements continued
Access Bank Plc Annual Report and Accounts 2012
The nominal value of the shares as well as the premium on the shares issued have been accounted for in share capital and share premium respectively as follows:
Number of ordinary shares
issuedValue of
shares issued
Consideration received/net
assets acquired Transfer to
Share capitalTransfer to
Share premiumN’000 N’000 N’000 N’000 N’000
Number of shares issued and allotted to Intercontinental Bank shareholders in the ratio of 1 scheme share for every 4 ordinary shares of 50 kobo each in Intercontinental Bank previously held. 1,244,668 622,334 21,523,292 622,334 20,900,958Scheme Shares allotted to Project Star Investments Limited in its capacity as a shareholder of Intercontinental Bank and distributed to the Access Bank Shareholders pro rata in the proportion of their shareholding in Access Bank. 3,750,000 1,875,000 – 1,875,000 (1,875,000)
Total number and value of shares issued and allotted 4,994,668 2,497,334 21,523,292 2,497,334 19,025,958
(d) The movement on the number of shares in issue during the year was as follows:
Group Dec-12
Group Dec-11
Bank Dec-12
Bank Dec-11
N’000 N’000 N’000 N’000
Balance, beginning of year 17,888,251 17,888,251 17,888,251 17,888,251
Issue of scheme shares 4,994,668 – 4,994,668 –
Balance end of year 22,882,919 17,888,251 22,882,919 17,888,251
b) Share premiumShare premium is the excess paid by shareholders over the nominal value for their shares.
Group Dec-12
Group Dec-11
Bank Dec-12
Bank Dec-11
N’000 N’000 N’000 N’000
Balance, beginning of year 146,160,837 146,160,837 146,160,837 146,160,837
Premium on scheme shares issued during the year 19,025,958 – 19,025,958 –
Balance end of year 165,186,795 146,160,837 165,186,795 146,160,837
c) Reserves(i) Statutory reservesNigerian banking regulations require the Bank to make an annual appropriation to a statutory reserve. As stipulated by S.16(1) of the Banks and Other Financial Institution Act of Nigeria, an appropriation of 30% of profit after tax is made if the statutory reserve is less than paid-up share capital and 15% of profit after tax if the statutory reserve is greater than the paid-up share capital. The Bank made a transfer of N4,778,595,000 (December 2011: N2,049,067,000) to statutory reserves during the year, being 15% of profit after tax (December 2011: 30%).
(ii) Small and Medium Scale Industries Reserve (SMEEIS)The SMEEIS reserve is maintained to comply with the Central Bank of Nigeria (CBN) requirement that all licensed banks set aside a portion of the profit after tax in a fund to be used to finance equity investment in qualifying small and medium scale enterprises. Under the terms of the guideline (amended by CBN letter dated 11 July, 2006), the contributions will be 10% of profit after tax and shall continue after the first five years but banks’ contributions shall thereafter reduce to 5% of profit after tax. However, this is no longer mandatory. The small and medium scale industries equity investment scheme reserves are non-distributable.
(iii) Treasury sharesThe Group had no treasury shares as at 31 December, 2012 (31 December, 2011: 832,275,863). During the year, the Bank wound down the Staff Investment Trust Scheme and disposed of treasury shares held by the scheme (see Note 41(a)) for further details). The consideration received has been included in Shareholders’ equity.
(iv) Capital reserveThis balance represents the surplus nominal value of the reconstituted shares of the Bank which was transferred from the share capital account to the capital reserve account after the share capital reconstruction in October 2006. The shareholders approved the reconstruction of 13,956,321,723 ordinary shares of 50 kobo each of the Bank in issue to 6,978,160,860 ordinary shares of 50 kobo each by creation of 1 ordinary share previously held.
(v) Merger reserveThis balance represents the difference between the consideration paid by Access Bank as the acquirer and Access Bank’s share of the net assets of Intercontinental Bank Limited (acquiree). Pursuant to the acquisition of Intercontinental Bank, Access Bank Group was restructured based on a scheme of merger dated 1 December 2011. As part of the the merger process, Intercontinental Bank was dissolved as a legal entity by the creation of 1 ordinary shares previously held.
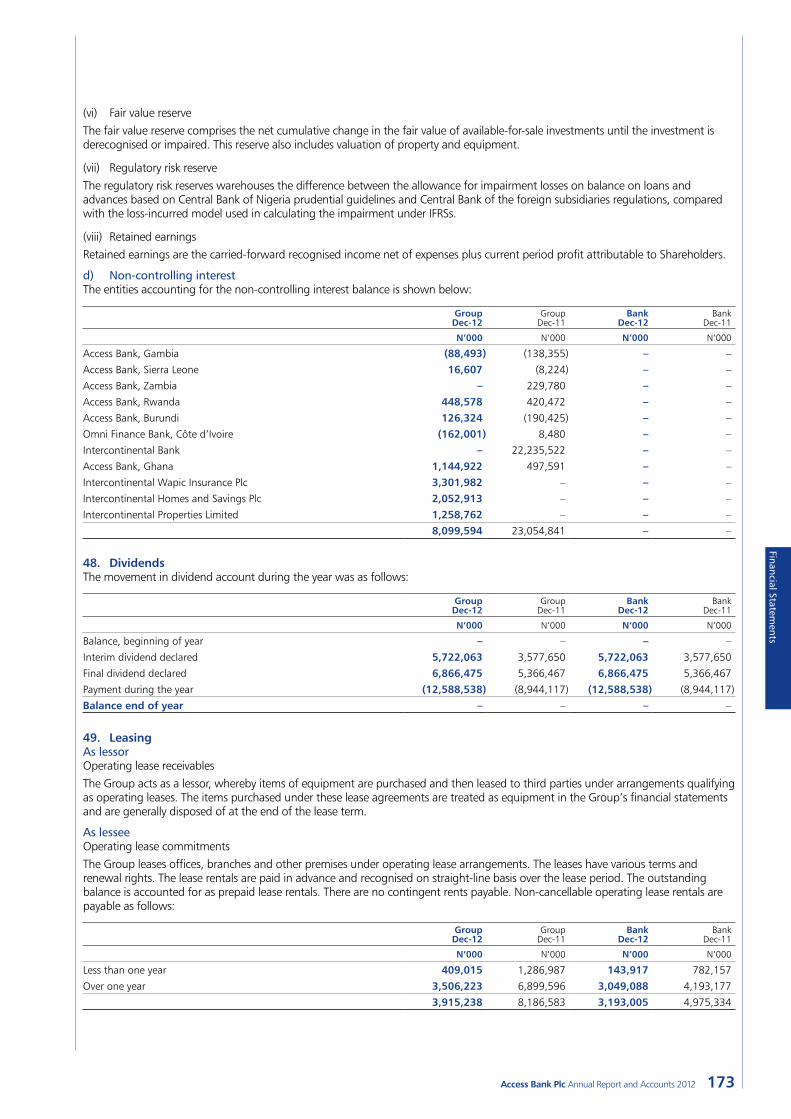
173Access Bank Plc Annual Report and Accounts 2012
Financial Statements
(vi) Fair value reserveThe fair value reserve comprises the net cumulative change in the fair value of available-for-sale investments until the investment is derecognised or impaired. This reserve also includes valuation of property and equipment.
(vii) Regulatory risk reserveThe regulatory risk reserves warehouses the difference between the allowance for impairment losses on balance on loans and advances based on Central Bank of Nigeria prudential guidelines and Central Bank of the foreign subsidiaries regulations, compared with the loss-incurred model used in calculating the impairment under IFRSs.
(viii) Retained earningsRetained earnings are the carried-forward recognised income net of expenses plus current period profit attributable to Shareholders.
d) Non-controlling interestThe entities accounting for the non-controlling interest balance is shown below:
Group Dec-12
Group Dec-11
Bank Dec-12
Bank Dec-11
N’000 N’000 N’000 N’000
Access Bank, Gambia (88,493) (138,355) – –
Access Bank, Sierra Leone 16,607 (8,224) – –
Access Bank, Zambia – 229,780 – –
Access Bank, Rwanda 448,578 420,472 – –
Access Bank, Burundi 126,324 (190,425) – –
Omni Finance Bank, Côte d’Ivoire (162,001) 8,480 – –
Intercontinental Bank – 22,235,522 – –
Access Bank, Ghana 1,144,922 497,591 – –
Intercontinental Wapic Insurance Plc 3,301,982 – – –
Intercontinental Homes and Savings Plc 2,052,913 – – –
Intercontinental Properties Limited 1,258,762 – – –
8,099,594 23,054,841 – –
48. DividendsThe movement in dividend account during the year was as follows:
Group Dec-12
Group Dec-11
Bank Dec-12
Bank Dec-11
N’000 N’000 N’000 N’000
Balance, beginning of year – – – –
Interim dividend declared 5,722,063 3,577,650 5,722,063 3,577,650
Final dividend declared 6,866,475 5,366,467 6,866,475 5,366,467
Payment during the year (12,588,538) (8,944,117) (12,588,538) (8,944,117)
Balance end of year – – – –
49. LeasingAs lessorOperating lease receivablesThe Group acts as a lessor, whereby items of equipment are purchased and then leased to third parties under arrangements qualifying as operating leases. The items purchased under these lease agreements are treated as equipment in the Group’s financial statements and are generally disposed of at the end of the lease term.
As lesseeOperating lease commitmentsThe Group leases offices, branches and other premises under operating lease arrangements. The leases have various terms and renewal rights. The lease rentals are paid in advance and recognised on straight-line basis over the lease period. The outstanding balance is accounted for as prepaid lease rentals. There are no contingent rents payable. Non-cancellable operating lease rentals are payable as follows:
Group Dec-12
Group Dec-11
Bank Dec-12
Bank Dec-11
N’000 N’000 N’000 N’000
Less than one year 409,015 1,286,987 143,917 782,157
Over one year 3,506,223 6,899,596 3,049,088 4,193,177
3,915,238 8,186,583 3,193,005 4,975,334
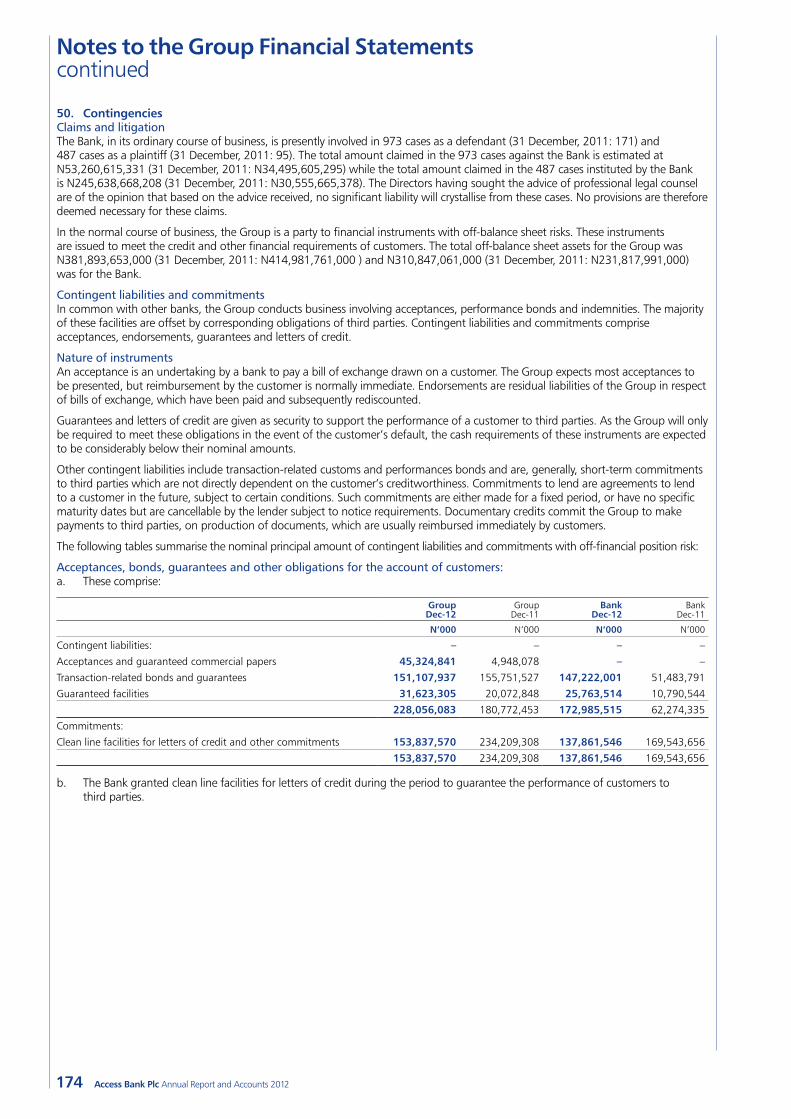
174
Notes to the Group Financial Statements continued
Access Bank Plc Annual Report and Accounts 2012
50. ContingenciesClaims and litigationThe Bank, in its ordinary course of business, is presently involved in 973 cases as a defendant (31 December, 2011: 171) and 487 cases as a plaintiff (31 December, 2011: 95). The total amount claimed in the 973 cases against the Bank is estimated at N53,260,615,331 (31 December, 2011: N34,495,605,295) while the total amount claimed in the 487 cases instituted by the Bank is N245,638,668,208 (31 December, 2011: N30,555,665,378). The Directors having sought the advice of professional legal counsel are of the opinion that based on the advice received, no significant liability will crystallise from these cases. No provisions are therefore deemed necessary for these claims.
In the normal course of business, the Group is a party to financial instruments with off-balance sheet risks. These instruments are issued to meet the credit and other financial requirements of customers. The total off-balance sheet assets for the Group was N381,893,653,000 (31 December, 2011: N414,981,761,000 ) and N310,847,061,000 (31 December, 2011: N231,817,991,000) was for the Bank.
Contingent liabilities and commitmentsIn common with other banks, the Group conducts business involving acceptances, performance bonds and indemnities. The majority of these facilities are offset by corresponding obligations of third parties. Contingent liabilities and commitments comprise acceptances, endorsements, guarantees and letters of credit.
Nature of instrumentsAn acceptance is an undertaking by a bank to pay a bill of exchange drawn on a customer. The Group expects most acceptances to be presented, but reimbursement by the customer is normally immediate. Endorsements are residual liabilities of the Group in respect of bills of exchange, which have been paid and subsequently rediscounted.
Guarantees and letters of credit are given as security to support the performance of a customer to third parties. As the Group will only be required to meet these obligations in the event of the customer’s default, the cash requirements of these instruments are expected to be considerably below their nominal amounts.
Other contingent liabilities include transaction-related customs and performances bonds and are, generally, short-term commitments to third parties which are not directly dependent on the customer’s creditworthiness. Commitments to lend are agreements to lend to a customer in the future, subject to certain conditions. Such commitments are either made for a fixed period, or have no specific maturity dates but are cancellable by the lender subject to notice requirements. Documentary credits commit the Group to make payments to third parties, on production of documents, which are usually reimbursed immediately by customers.
The following tables summarise the nominal principal amount of contingent liabilities and commitments with off-financial position risk:
Acceptances, bonds, guarantees and other obligations for the account of customers:a. These comprise:
Group Dec-12
Group Dec-11
Bank Dec-12
Bank Dec-11
N’000 N’000 N’000 N’000
Contingent liabilities: – – – –
Acceptances and guaranteed commercial papers 45,324,841 4,948,078 – –
Transaction-related bonds and guarantees 151,107,937 155,751,527 147,222,001 51,483,791
Guaranteed facilities 31,623,305 20,072,848 25,763,514 10,790,544
228,056,083 180,772,453 172,985,515 62,274,335
Commitments:
Clean line facilities for letters of credit and other commitments 153,837,570 234,209,308 137,861,546 169,543,656
153,837,570 234,209,308 137,861,546 169,543,656
b. The Bank granted clean line facilities for letters of credit during the period to guarantee the performance of customers to third parties.
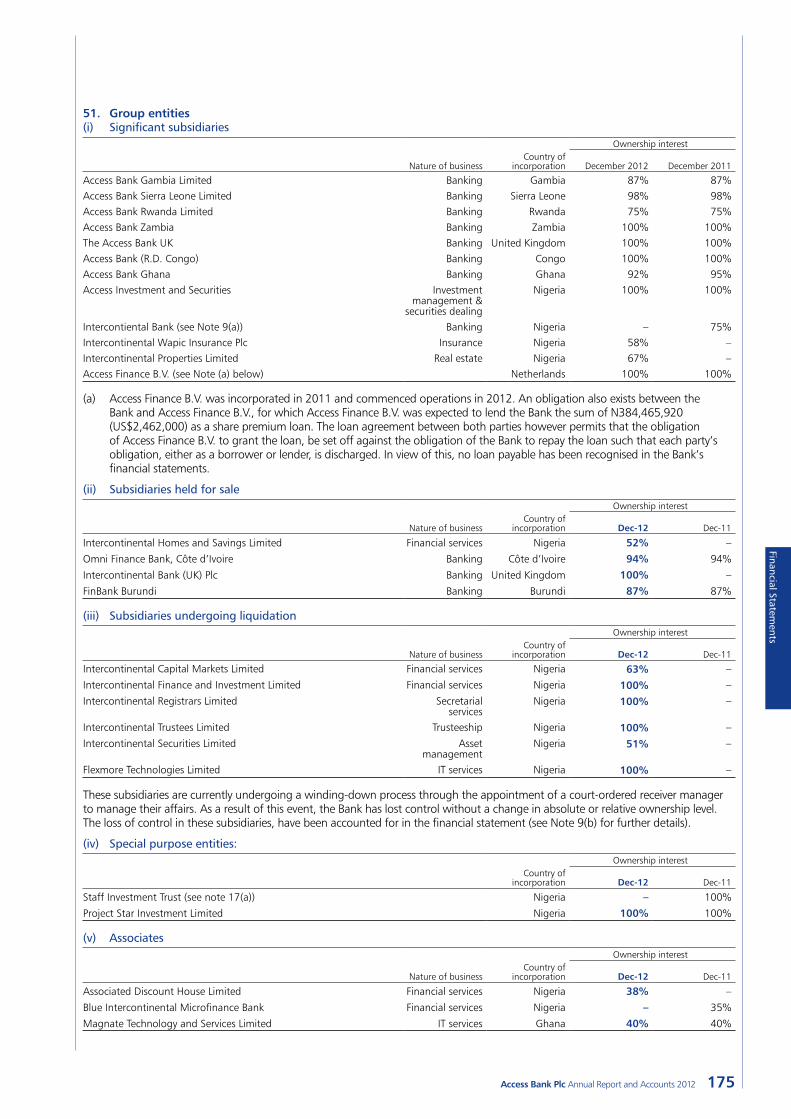
175Access Bank Plc Annual Report and Accounts 2012
Financial Statements
51. Group entities(i) Significant subsidiaries
Ownership interest
Nature of businessCountry of
incorporation December 2012
December 2011
Access Bank Gambia Limited Banking Gambia 87% 87%Access Bank Sierra Leone Limited Banking Sierra Leone 98% 98%Access Bank Rwanda Limited Banking Rwanda 75% 75%Access Bank Zambia Banking Zambia 100% 100%The Access Bank UK Banking United Kingdom 100% 100%Access Bank (R.D. Congo) Banking Congo 100% 100%Access Bank Ghana Banking Ghana 92% 95%Access Investment and Securities Investment
management &securities dealing
Nigeria 100% 100%
Intercontiental Bank (see Note 9(a)) Banking Nigeria – 75%Intercontinental Wapic Insurance Plc Insurance Nigeria 58% –Intercontinental Properties Limited Real estate Nigeria 67% –Access Finance B.V. (see Note (a) below) Netherlands 100% 100%
(a) Access Finance B.V. was incorporated in 2011 and commenced operations in 2012. An obligation also exists between the Bank and Access Finance B.V., for which Access Finance B.V. was expected to lend the Bank the sum of N384,465,920 (US$2,462,000) as a share premium loan. The loan agreement between both parties however permits that the obligation of Access Finance B.V. to grant the loan, be set off against the obligation of the Bank to repay the loan such that each party’s obligation, either as a borrower or lender, is discharged. In view of this, no loan payable has been recognised in the Bank’s financial statements.
(ii) Subsidiaries held for saleOwnership interest
Nature of businessCountry of
incorporation Dec-12
Dec-11
Intercontinental Homes and Savings Limited Financial services Nigeria 52% –
Omni Finance Bank, Côte d’Ivoire Banking Côte d’Ivoire 94% 94%
Intercontinental Bank (UK) Plc Banking United Kingdom 100% –
FinBank Burundi Banking Burundi 87% 87%
(iii) Subsidiaries undergoing liquidationOwnership interest
Nature of businessCountry of
incorporation Dec-12
Dec-11
Intercontinental Capital Markets Limited Financial services Nigeria 63% –
Intercontinental Finance and Investment Limited Financial services Nigeria 100% –
Intercontinental Registrars Limited Secretarialservices
Nigeria 100% –
Intercontinental Trustees Limited Trusteeship Nigeria 100% –
Intercontinental Securities Limited Assetmanagement
Nigeria 51% –
Flexmore Technologies Limited IT services Nigeria 100% –
These subsidiaries are currently undergoing a winding-down process through the appointment of a court-ordered receiver manager to manage their affairs. As a result of this event, the Bank has lost control without a change in absolute or relative ownership level. The loss of control in these subsidiaries, have been accounted for in the financial statement (see Note 9(b) for further details).
(iv) Special purpose entities:Ownership interest
Country of incorporation Dec-12
Dec-11
Staff Investment Trust (see note 17(a)) Nigeria – 100%
Project Star Investment Limited Nigeria 100% 100%
(v) AssociatesOwnership interest
Nature of businessCountry of
incorporation Dec-12
Dec-11
Associated Discount House Limited Financial services Nigeria 38% –
Blue Intercontinental Microfinance Bank Financial services Nigeria – 35%
Magnate Technology and Services Limited IT services Ghana 40% 40%
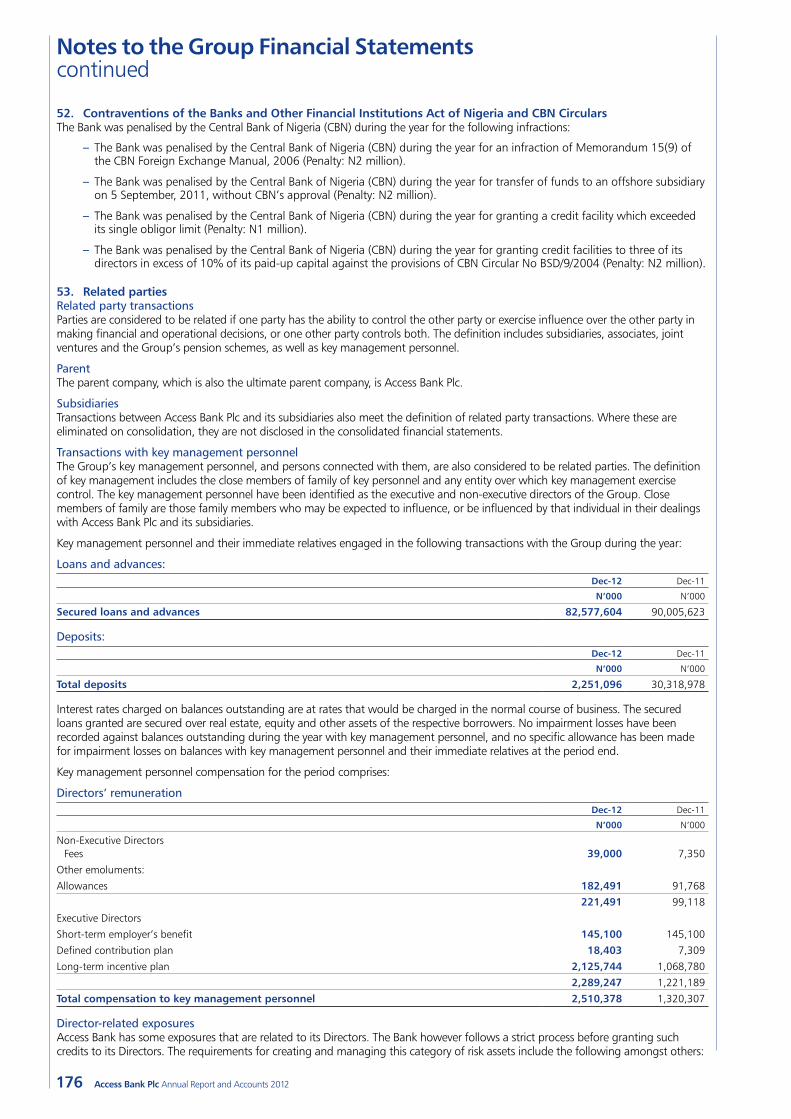
176
Notes to the Group Financial Statements continued
Access Bank Plc Annual Report and Accounts 2012
52. Contraventions of the Banks and Other Financial Institutions Act of Nigeria and CBN CircularsThe Bank was penalised by the Central Bank of Nigeria (CBN) during the year for the following infractions:
– The Bank was penalised by the Central Bank of Nigeria (CBN) during the year for an infraction of Memorandum 15(9) of the CBN Foreign Exchange Manual, 2006 (Penalty: N2 million).
– The Bank was penalised by the Central Bank of Nigeria (CBN) during the year for transfer of funds to an offshore subsidiary on 5 September, 2011, without CBN’s approval (Penalty: N2 million).
– The Bank was penalised by the Central Bank of Nigeria (CBN) during the year for granting a credit facility which exceeded its single obligor limit (Penalty: N1 million).
– The Bank was penalised by the Central Bank of Nigeria (CBN) during the year for granting credit facilities to three of its directors in excess of 10% of its paid-up capital against the provisions of CBN Circular No BSD/9/2004 (Penalty: N2 million).
53. Related partiesRelated party transactionsParties are considered to be related if one party has the ability to control the other party or exercise influence over the other party in making financial and operational decisions, or one other party controls both. The definition includes subsidiaries, associates, joint ventures and the Group’s pension schemes, as well as key management personnel.
ParentThe parent company, which is also the ultimate parent company, is Access Bank Plc.
SubsidiariesTransactions between Access Bank Plc and its subsidiaries also meet the definition of related party transactions. Where these are eliminated on consolidation, they are not disclosed in the consolidated financial statements.
Transactions with key management personnelThe Group’s key management personnel, and persons connected with them, are also considered to be related parties. The definition of key management includes the close members of family of key personnel and any entity over which key management exercise control. The key management personnel have been identified as the executive and non-executive directors of the Group. Close members of family are those family members who may be expected to influence, or be influenced by that individual in their dealings with Access Bank Plc and its subsidiaries.
Key management personnel and their immediate relatives engaged in the following transactions with the Group during the year:
Loans and advances: Dec-12 Dec-11
N’000 N’000
Secured loans and advances 82,577,604 90,005,623
Deposits: Dec-12 Dec-11
N’000 N’000
Total deposits 2,251,096 30,318,978
Interest rates charged on balances outstanding are at rates that would be charged in the normal course of business. The secured loans granted are secured over real estate, equity and other assets of the respective borrowers. No impairment losses have been recorded against balances outstanding during the year with key management personnel, and no specific allowance has been made for impairment losses on balances with key management personnel and their immediate relatives at the period end.
Key management personnel compensation for the period comprises:
Directors’ remuneration Dec-12 Dec-11
N’000 N’000
Non-Executive Directors Fees 39,000 7,350
Other emoluments:
Allowances 182,491 91,768
221,491 99,118
Executive Directors
Short-term employer’s benefit 145,100 145,100
Defined contribution plan 18,403 7,309
Long-term incentive plan 2,125,744 1,068,780
2,289,247 1,221,189
Total compensation to key management personnel 2,510,378 1,320,307
Director-related exposuresAccess Bank has some exposures that are related to its Directors. The Bank however follows a strict process before granting such credits to its Directors. The requirements for creating and managing this category of risk assets include the following amongst others:
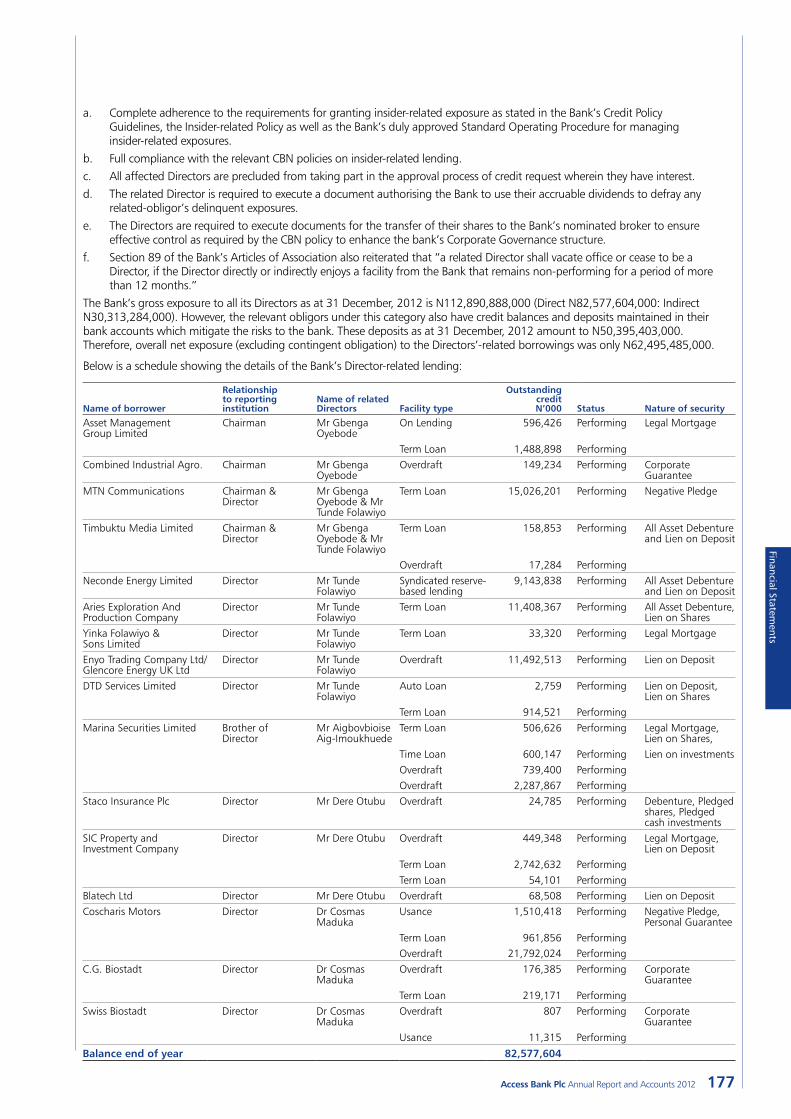
177Access Bank Plc Annual Report and Accounts 2012
Financial Statements
a. Complete adherence to the requirements for granting insider-related exposure as stated in the Bank’s Credit Policy Guidelines, the Insider-related Policy as well as the Bank’s duly approved Standard Operating Procedure for managing insider-related exposures.
b. Full compliance with the relevant CBN policies on insider-related lending.c. All affected Directors are precluded from taking part in the approval process of credit request wherein they have interest.d. The related Director is required to execute a document authorising the Bank to use their accruable dividends to defray any
related-obligor’s delinquent exposures.e. The Directors are required to execute documents for the transfer of their shares to the Bank’s nominated broker to ensure
effective control as required by the CBN policy to enhance the bank’s Corporate Governance structure.f. Section 89 of the Bank’s Articles of Association also reiterated that “a related Director shall vacate office or cease to be a
Director, if the Director directly or indirectly enjoys a facility from the Bank that remains non-performing for a period of more than 12 months.”
The Bank’s gross exposure to all its Directors as at 31 December, 2012 is N112,890,888,000 (Direct N82,577,604,000: Indirect N30,313,284,000). However, the relevant obligors under this category also have credit balances and deposits maintained in their bank accounts which mitigate the risks to the bank. These deposits as at 31 December, 2012 amount to N50,395,403,000. Therefore, overall net exposure (excluding contingent obligation) to the Directors’-related borrowings was only N62,495,485,000.
Below is a schedule showing the details of the Bank’s Director-related lending:
Name of borrower
Relationship to reporting institution
Name of related Directors Facility type
Outstanding credit N’000 Status Nature of security
Asset Management Group Limited
Chairman Mr Gbenga Oyebode
On Lending 596,426 Performing Legal Mortgage
Term Loan 1,488,898 PerformingCombined Industrial Agro. Chairman Mr Gbenga
OyebodeOverdraft 149,234 Performing Corporate
GuaranteeMTN Communications Chairman &
DirectorMr Gbenga Oyebode & Mr Tunde Folawiyo
Term Loan 15,026,201 Performing Negative Pledge
Timbuktu Media Limited Chairman & Director
Mr Gbenga Oyebode & Mr Tunde Folawiyo
Term Loan 158,853 Performing All Asset Debenture and Lien on Deposit
Overdraft 17,284 PerformingNeconde Energy Limited Director Mr Tunde
FolawiyoSyndicated reserve- based lending
9,143,838 Performing All Asset Debenture and Lien on Deposit
Aries Exploration And Production Company
Director Mr Tunde Folawiyo
Term Loan 11,408,367 Performing All Asset Debenture, Lien on Shares
Yinka Folawiyo & Sons Limited
Director Mr Tunde Folawiyo
Term Loan 33,320 Performing Legal Mortgage
Enyo Trading Company Ltd/Glencore Energy UK Ltd
Director Mr Tunde Folawiyo
Overdraft 11,492,513 Performing Lien on Deposit
DTD Services Limited Director Mr Tunde Folawiyo
Auto Loan 2,759 Performing Lien on Deposit, Lien on Shares
Term Loan 914,521 PerformingMarina Securities Limited Brother of
DirectorMr Aigbovbioise Aig-Imoukhuede
Term Loan 506,626 Performing Legal Mortgage, Lien on Shares,
Time Loan 600,147 Performing Lien on investmentsOverdraft 739,400 PerformingOverdraft 2,287,867 Performing
Staco Insurance Plc Director Mr Dere Otubu Overdraft 24,785 Performing Debenture, Pledged shares, Pledged cash investments
SIC Property and Investment Company
Director Mr Dere Otubu Overdraft 449,348 Performing Legal Mortgage, Lien on Deposit
Term Loan 2,742,632 PerformingTerm Loan 54,101 Performing
Blatech Ltd Director Mr Dere Otubu Overdraft 68,508 Performing Lien on DepositCoscharis Motors Director Dr Cosmas
MadukaUsance 1,510,418 Performing Negative Pledge,
Personal GuaranteeTerm Loan 961,856 PerformingOverdraft 21,792,024 Performing
C.G. Biostadt Director Dr Cosmas Maduka
Overdraft 176,385 Performing Corporate Guarantee
Term Loan 219,171 PerformingSwiss Biostadt Director Dr Cosmas
MadukaOverdraft 807 Performing Corporate
GuaranteeUsance 11,315 Performing
Balance end of year 82,577,604
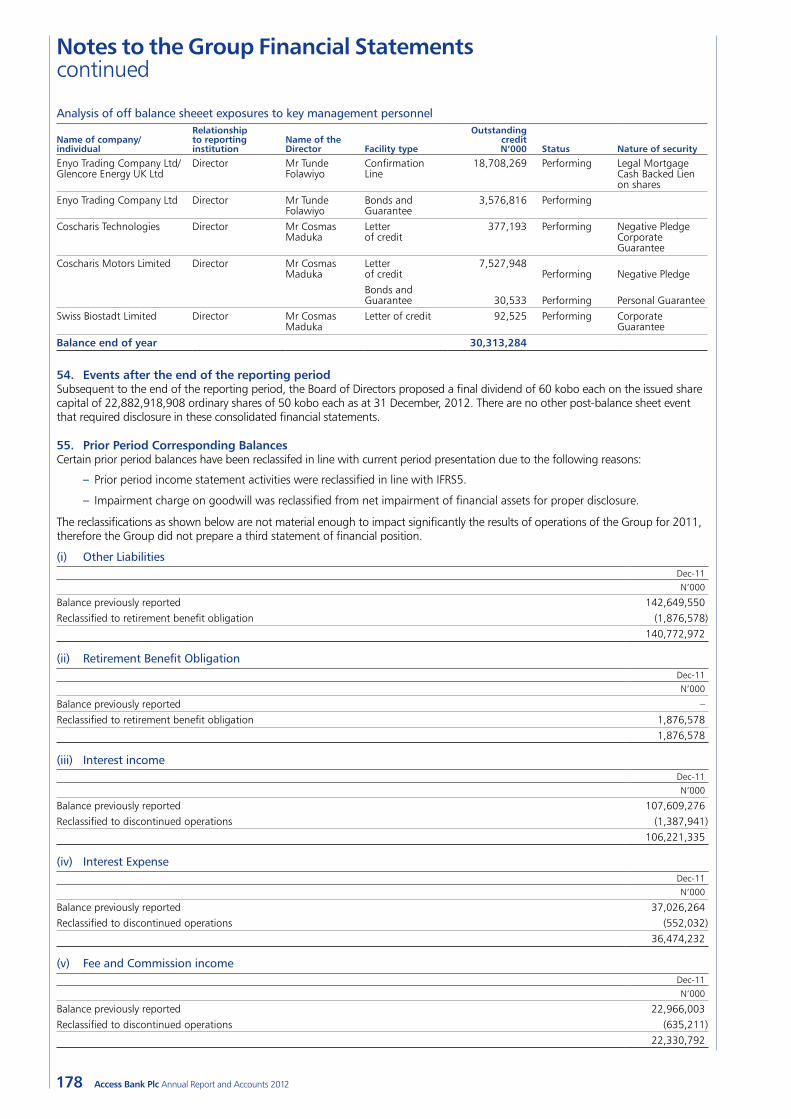
178
Notes to the Group Financial Statements continued
Access Bank Plc Annual Report and Accounts 2012
Analysis of off balance sheeet exposures to key management personnel
Name of company/ individual
Relationship to reporting institution
Name of the Director Facility type
Outstanding credit N’000 Status Nature of security
Enyo Trading Company Ltd/Glencore Energy UK Ltd
Director Mr Tunde Folawiyo
Confirmation Line
18,708,269 Performing Legal Mortgage Cash Backed Lien on shares
Enyo Trading Company Ltd Director Mr Tunde Folawiyo
Bonds and Guarantee
3,576,816 Performing
Coscharis Technologies Director Mr Cosmas Maduka
Letter of credit
377,193 Performing Negative Pledge Corporate Guarantee
Coscharis Motors Limited Director Mr Cosmas Maduka
Letter of credit
7,527,948 Performing Negative Pledge
Bonds and Guarantee 30,533 Performing Personal Guarantee
Swiss Biostadt Limited Director Mr Cosmas Maduka
Letter of credit 92,525 Performing Corporate Guarantee
Balance end of year 30,313,284
54. Events after the end of the reporting periodSubsequent to the end of the reporting period, the Board of Directors proposed a final dividend of 60 kobo each on the issued share capital of 22,882,918,908 ordinary shares of 50 kobo each as at 31 December, 2012. There are no other post-balance sheet event that required disclosure in these consolidated financial statements.
55. Prior Period Corresponding BalancesCertain prior period balances have been reclassifed in line with current period presentation due to the following reasons:
– Prior period income statement activities were reclassified in line with IFRS5.
– Impairment charge on goodwill was reclassified from net impairment of financial assets for proper disclosure.
The reclassifications as shown below are not material enough to impact significantly the results of operations of the Group for 2011, therefore the Group did not prepare a third statement of financial position.
(i) Other Liabilities Dec-11
N’000
Balance previously reported 142,649,550Reclassified to retirement benefit obligation (1,876,578)
140,772,972
(ii) Retirement Benefit Obligation Dec-11
N’000
Balance previously reported –Reclassified to retirement benefit obligation 1,876,578
1,876,578
(iii) Interest income Dec-11
N’000
Balance previously reported 107,609,276Reclassified to discontinued operations (1,387,941)
106,221,335
(iv) Interest Expense Dec-11
N’000
Balance previously reported 37,026,264Reclassified to discontinued operations (552,032)
36,474,232
(v) Fee and Commission income Dec-11
N’000
Balance previously reported 22,966,003Reclassified to discontinued operations (635,211)
22,330,792
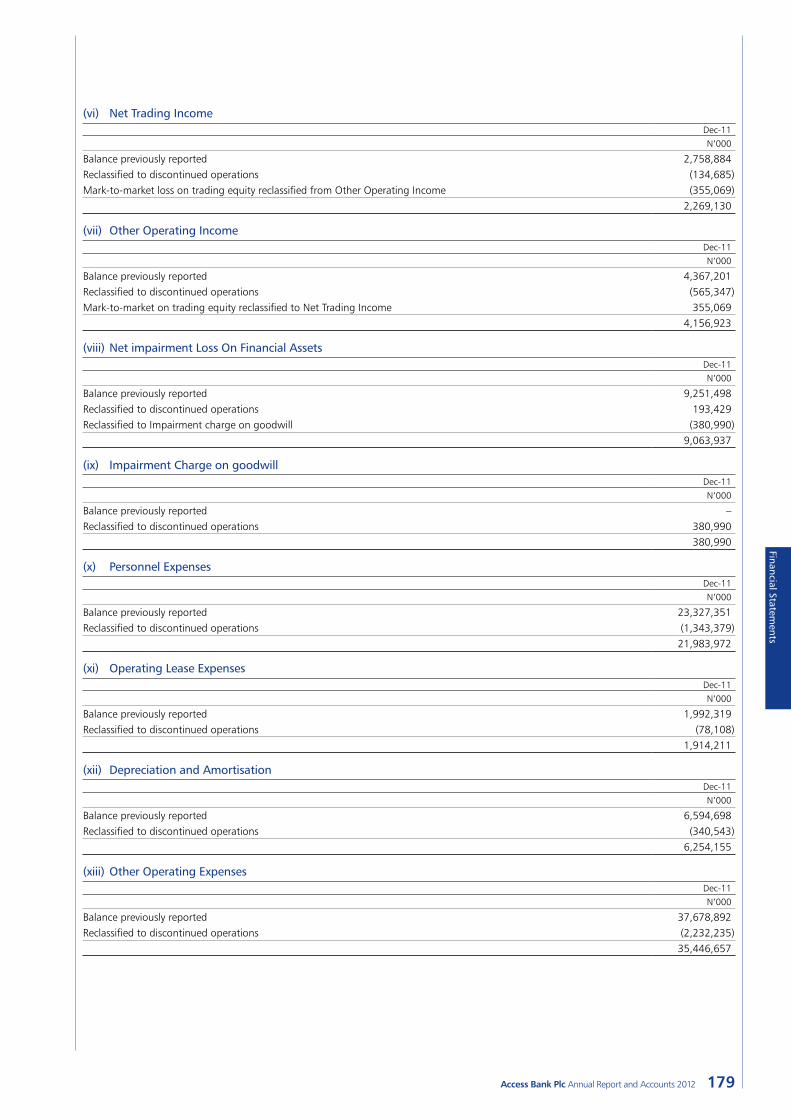
179Access Bank Plc Annual Report and Accounts 2012
Financial Statements
(vi) Net Trading Income Dec-11
N’000
Balance previously reported 2,758,884Reclassified to discontinued operations (134,685)Mark-to-market loss on trading equity reclassified from Other Operating Income (355,069)
2,269,130
(vii) Other Operating Income Dec-11
N’000
Balance previously reported 4,367,201Reclassified to discontinued operations (565,347)Mark-to-market on trading equity reclassified to Net Trading Income 355,069
4,156,923
(viii) Net impairment Loss On Financial Assets Dec-11
N’000
Balance previously reported 9,251,498Reclassified to discontinued operations 193,429Reclassified to Impairment charge on goodwill (380,990)
9,063,937
(ix) Impairment Charge on goodwill Dec-11
N’000
Balance previously reported –Reclassified to discontinued operations 380,990
380,990
(x) Personnel Expenses Dec-11
N’000
Balance previously reported 23,327,351Reclassified to discontinued operations (1,343,379)
21,983,972
(xi) Operating Lease Expenses Dec-11
N’000
Balance previously reported 1,992,319Reclassified to discontinued operations (78,108)
1,914,211
(xii) Depreciation and Amortisation Dec-11
N’000
Balance previously reported 6,594,698Reclassified to discontinued operations (340,543)
6,254,155
(xiii) Other Operating Expenses Dec-11
N’000
Balance previously reported 37,678,892Reclassified to discontinued operations (2,232,235)
35,446,657
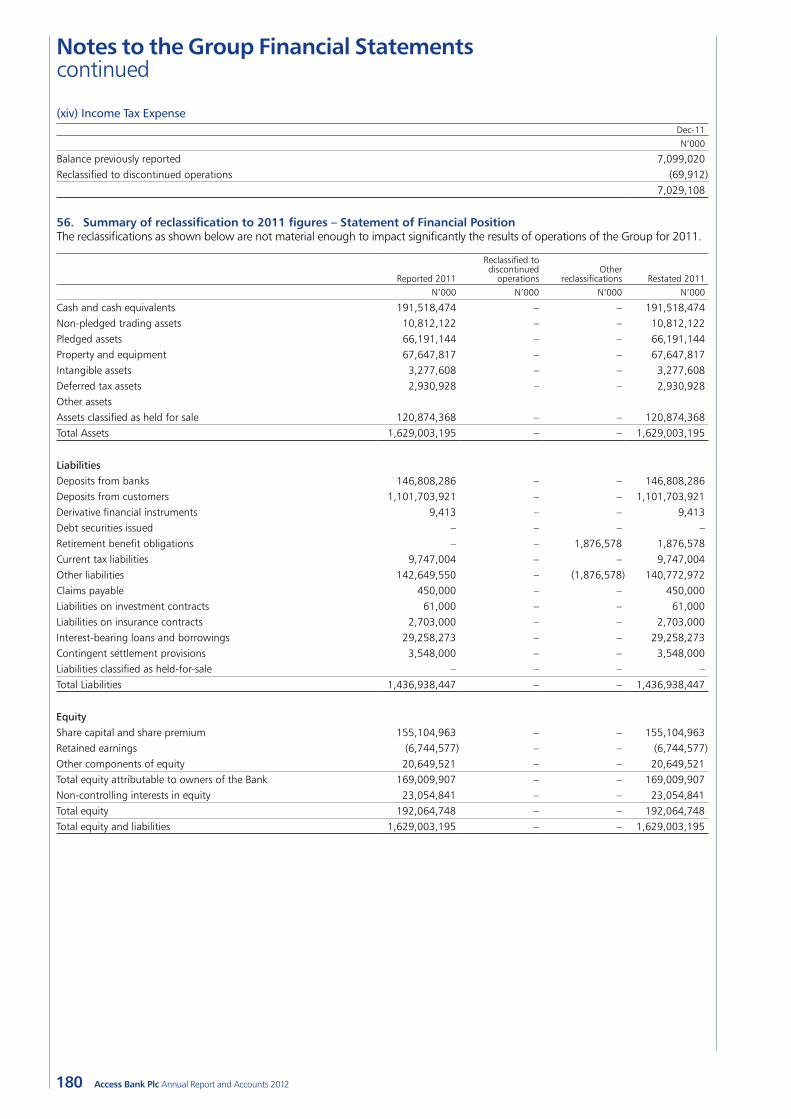
180
Notes to the Group Financial Statements continued
Access Bank Plc Annual Report and Accounts 2012
(xiv) Income Tax Expense Dec-11
N’000
Balance previously reported 7,099,020Reclassified to discontinued operations (69,912)
7,029,108
56. Summary of reclassification to 2011 figures – Statement of Financial PositionThe reclassifications as shown below are not material enough to impact significantly the results of operations of the Group for 2011.
Reported 2011
Reclassified to discontinued
operationsOther
reclassifications Restated 2011N’000 N’000 N’000 N’000
Cash and cash equivalents 191,518,474 – – 191,518,474Non-pledged trading assets 10,812,122 – – 10,812,122Pledged assets 66,191,144 – – 66,191,144Property and equipment 67,647,817 – – 67,647,817Intangible assets 3,277,608 – – 3,277,608Deferred tax assets 2,930,928 – – 2,930,928Other assetsAssets classified as held for sale 120,874,368 – – 120,874,368Total Assets 1,629,003,195 – – 1,629,003,195
LiabilitiesDeposits from banks 146,808,286 – – 146,808,286Deposits from customers 1,101,703,921 – – 1,101,703,921Derivative financial instruments 9,413 – – 9,413Debt securities issued – – – –Retirement benefit obligations – – 1,876,578 1,876,578Current tax liabilities 9,747,004 – – 9,747,004Other liabilities 142,649,550 – (1,876,578) 140,772,972Claims payable 450,000 – – 450,000Liabilities on investment contracts 61,000 – – 61,000Liabilities on insurance contracts 2,703,000 – – 2,703,000Interest-bearing loans and borrowings 29,258,273 – – 29,258,273Contingent settlement provisions 3,548,000 – – 3,548,000Liabilities classified as held-for-sale – – – –Total Liabilities 1,436,938,447 – – 1,436,938,447
EquityShare capital and share premium 155,104,963 – – 155,104,963Retained earnings (6,744,577) – – (6,744,577)Other components of equity 20,649,521 – – 20,649,521Total equity attributable to owners of the Bank 169,009,907 – – 169,009,907Non-controlling interests in equity 23,054,841 – – 23,054,841Total equity 192,064,748 – – 192,064,748Total equity and liabilities 1,629,003,195 – – 1,629,003,195
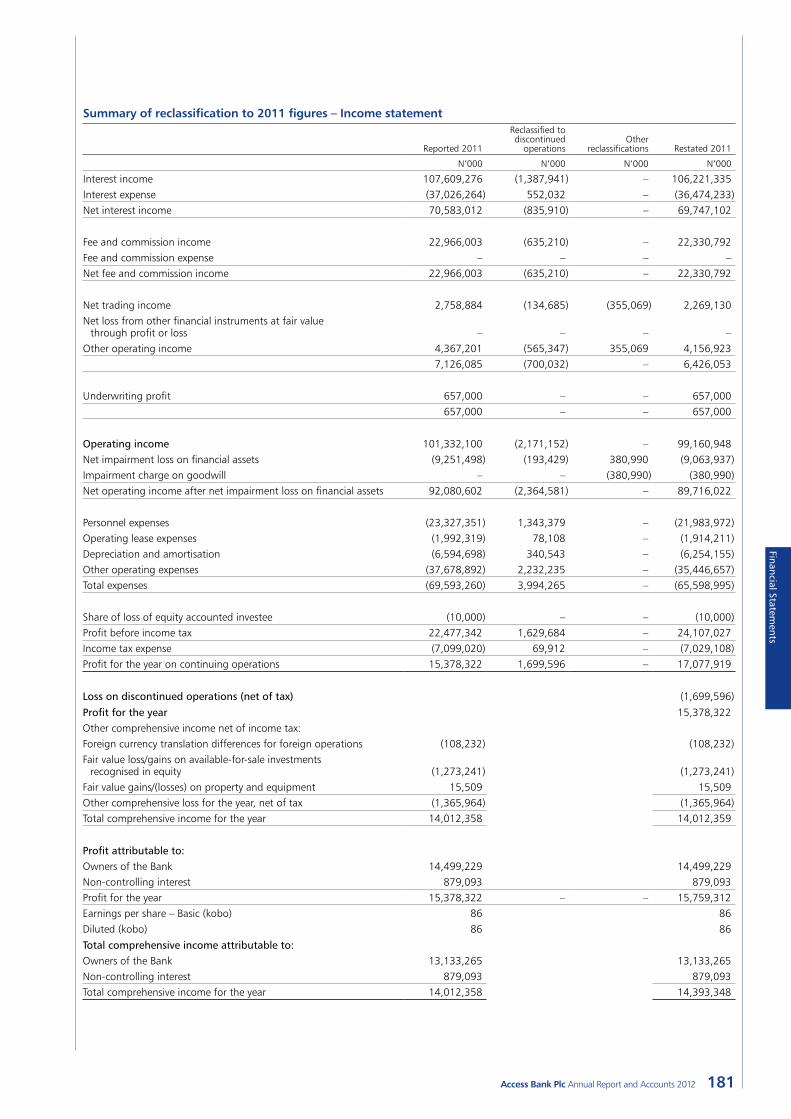
181Access Bank Plc Annual Report and Accounts 2012
Financial Statements
Summary of reclassification to 2011 figures – Income statement
Reported 2011
Reclassified to discontinued
operationsOther
reclassifications Restated 2011
N’000 N’000 N’000 N’000
Interest income 107,609,276 (1,387,941) – 106,221,335Interest expense (37,026,264) 552,032 – (36,474,233)Net interest income 70,583,012 (835,910) – 69,747,102
Fee and commission income 22,966,003 (635,210) – 22,330,792Fee and commission expense – – – –Net fee and commission income 22,966,003 (635,210) – 22,330,792
Net trading income 2,758,884 (134,685) (355,069) 2,269,130Net loss from other financial instruments at fair value
through profit or loss – – – –Other operating income 4,367,201 (565,347) 355,069 4,156,923
7,126,085 (700,032) – 6,426,053
Underwriting profit 657,000 – – 657,000657,000 – – 657,000
Operating income 101,332,100 (2,171,152) – 99,160,948Net impairment loss on financial assets (9,251,498) (193,429) 380,990 (9,063,937)Impairment charge on goodwill – – (380,990) (380,990)Net operating income after net impairment loss on financial assets 92,080,602 (2,364,581) – 89,716,022
Personnel expenses (23,327,351) 1,343,379 – (21,983,972)Operating lease expenses (1,992,319) 78,108 – (1,914,211)Depreciation and amortisation (6,594,698) 340,543 – (6,254,155)Other operating expenses (37,678,892) 2,232,235 – (35,446,657)Total expenses (69,593,260) 3,994,265 – (65,598,995)
Share of loss of equity accounted investee (10,000) – – (10,000)Profit before income tax 22,477,342 1,629,684 – 24,107,027Income tax expense (7,099,020) 69,912 – (7,029,108)Profit for the year on continuing operations 15,378,322 1,699,596 – 17,077,919
Loss on discontinued operations (net of tax) (1,699,596)
Profit for the year 15,378,322Other comprehensive income net of income tax:Foreign currency translation differences for foreign operations (108,232) (108,232)Fair value loss/gains on available-for-sale investments
recognised in equity (1,273,241) (1,273,241)Fair value gains/(losses) on property and equipment 15,509 15,509Other comprehensive loss for the year, net of tax (1,365,964) (1,365,964)Total comprehensive income for the year 14,012,358 14,012,359
Profit attributable to:Owners of the Bank 14,499,229 14,499,229Non-controlling interest 879,093 879,093Profit for the year 15,378,322 – – 15,759,312Earnings per share – Basic (kobo) 86 86Diluted (kobo) 86 86
Total comprehensive income attributable to:Owners of the Bank 13,133,265 13,133,265Non-controlling interest 879,093 879,093Total comprehensive income for the year 14,012,358 14,393,348
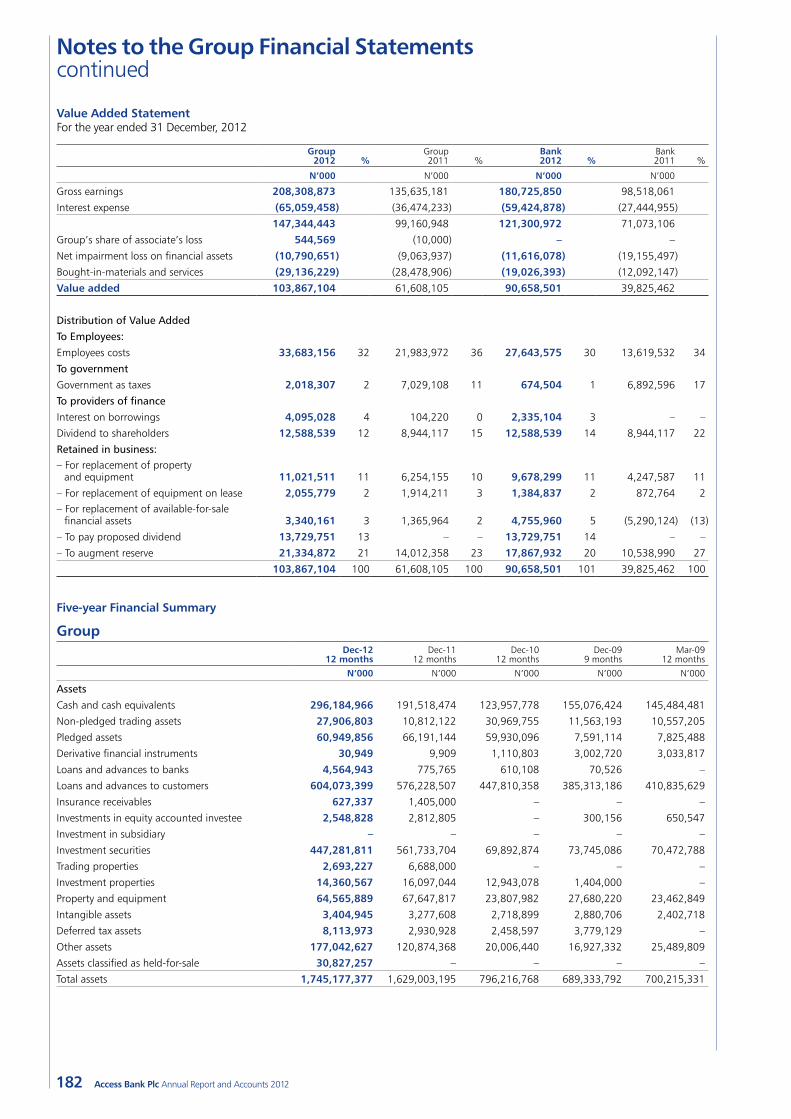
182
Notes to the Group Financial Statements continued
Access Bank Plc Annual Report and Accounts 2012
Value Added StatementFor the year ended 31 December, 2012
Group 2012 %
Group 2011 %
Bank 2012 %
Bank 2011 %
N’000 N’000 N’000 N’000
Gross earnings 208,308,873 135,635,181 180,725,850 98,518,061
Interest expense (65,059,458) (36,474,233) (59,424,878) (27,444,955)
147,344,443 99,160,948 121,300,972 71,073,106
Group’s share of associate’s loss 544,569 (10,000) – –
Net impairment loss on financial assets (10,790,651) (9,063,937) (11,616,078) (19,155,497)
Bought-in-materials and services (29,136,229) (28,478,906) (19,026,393) (12,092,147)
Value added 103,867,104 61,608,105 90,658,501 39,825,462
Distribution of Value Added
To Employees:
Employees costs 33,683,156 32 21,983,972 36 27,643,575 30 13,619,532 34
To government
Government as taxes 2,018,307 2 7,029,108 11 674,504 1 6,892,596 17
To providers of finance
Interest on borrowings 4,095,028 4 104,220 0 2,335,104 3 – –
Dividend to shareholders 12,588,539 12 8,944,117 15 12,588,539 14 8,944,117 22
Retained in business:– For replacement of property
and equipment 11,021,511 11 6,254,155 10 9,678,299 11 4,247,587 11
– For replacement of equipment on lease 2,055,779 2 1,914,211 3 1,384,837 2 872,764 2– For replacement of available-for-sale
financial assets 3,340,161 3 1,365,964 2 4,755,960 5 (5,290,124) (13)
– To pay proposed dividend 13,729,751 13 – – 13,729,751 14 – –
– To augment reserve 21,334,872 21 14,012,358 23 17,867,932 20 10,538,990 27
103,867,104 100 61,608,105 100 90,658,501 101 39,825,462 100
Five-year Financial Summary
Group
Dec-12
12 monthsDec-11
12 monthsDec-10
12 monthsDec-09
9 monthsMar-09
12 months
N’000 N’000 N’000 N’000 N’000
Assets
Cash and cash equivalents 296,184,966 191,518,474 123,957,778 155,076,424 145,484,481
Non-pledged trading assets 27,906,803 10,812,122 30,969,755 11,563,193 10,557,205
Pledged assets 60,949,856 66,191,144 59,930,096 7,591,114 7,825,488
Derivative financial instruments 30,949 9,909 1,110,803 3,002,720 3,033,817
Loans and advances to banks 4,564,943 775,765 610,108 70,526 –
Loans and advances to customers 604,073,399 576,228,507 447,810,358 385,313,186 410,835,629
Insurance receivables 627,337 1,405,000 – – –
Investments in equity accounted investee 2,548,828 2,812,805 – 300,156 650,547
Investment in subsidiary – – – – –
Investment securities 447,281,811 561,733,704 69,892,874 73,745,086 70,472,788
Trading properties 2,693,227 6,688,000 – – –
Investment properties 14,360,567 16,097,044 12,943,078 1,404,000 –
Property and equipment 64,565,889 67,647,817 23,807,982 27,680,220 23,462,849
Intangible assets 3,404,945 3,277,608 2,718,899 2,880,706 2,402,718
Deferred tax assets 8,113,973 2,930,928 2,458,597 3,779,129 –
Other assets 177,042,627 120,874,368 20,006,440 16,927,332 25,489,809
Assets classified as held-for-sale 30,827,257 – – – –
Total assets 1,745,177,377 1,629,003,195 796,216,768 689,333,792 700,215,331
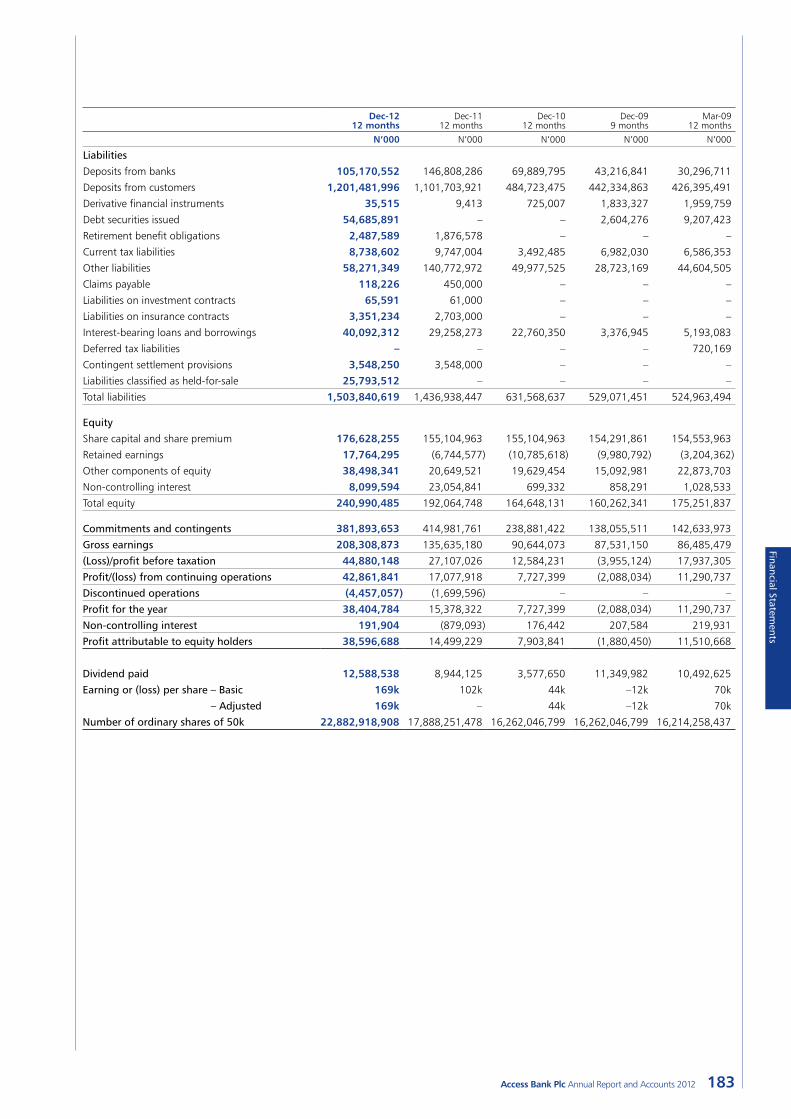
183Access Bank Plc Annual Report and Accounts 2012
Financial Statements
Dec-12
12 monthsDec-11
12 monthsDec-10
12 monthsDec-09
9 monthsMar-09
12 months
N’000 N’000 N’000 N’000 N’000
Liabilities
Deposits from banks 105,170,552 146,808,286 69,889,795 43,216,841 30,296,711
Deposits from customers 1,201,481,996 1,101,703,921 484,723,475 442,334,863 426,395,491
Derivative financial instruments 35,515 9,413 725,007 1,833,327 1,959,759
Debt securities issued 54,685,891 – – 2,604,276 9,207,423
Retirement benefit obligations 2,487,589 1,876,578 – – –
Current tax liabilities 8,738,602 9,747,004 3,492,485 6,982,030 6,586,353
Other liabilities 58,271,349 140,772,972 49,977,525 28,723,169 44,604,505
Claims payable 118,226 450,000 – – –
Liabilities on investment contracts 65,591 61,000 – – –
Liabilities on insurance contracts 3,351,234 2,703,000 – – –
Interest-bearing loans and borrowings 40,092,312 29,258,273 22,760,350 3,376,945 5,193,083
Deferred tax liabilities – – – – 720,169
Contingent settlement provisions 3,548,250 3,548,000 – – –
Liabilities classified as held-for-sale 25,793,512 – – – –
Total liabilities 1,503,840,619 1,436,938,447 631,568,637 529,071,451 524,963,494
Equity
Share capital and share premium 176,628,255 155,104,963 155,104,963 154,291,861 154,553,963
Retained earnings 17,764,295 (6,744,577) (10,785,618) (9,980,792) (3,204,362)
Other components of equity 38,498,341 20,649,521 19,629,454 15,092,981 22,873,703
Non-controlling interest 8,099,594 23,054,841 699,332 858,291 1,028,533
Total equity 240,990,485 192,064,748 164,648,131 160,262,341 175,251,837
Commitments and contingents 381,893,653 414,981,761 238,881,422 138,055,511 142,633,973
Gross earnings 208,308,873 135,635,180 90,644,073 87,531,150 86,485,479
(Loss)/profit before taxation 44,880,148 27,107,026 12,584,231 (3,955,124) 17,937,305
Profit/(loss) from continuing operations 42,861,841 17,077,918 7,727,399 (2,088,034) 11,290,737
Discontinued operations (4,457,057) (1,699,596) – – –
Profit for the year 38,404,784 15,378,322 7,727,399 (2,088,034) 11,290,737
Non-controlling interest 191,904 (879,093) 176,442 207,584 219,931
Profit attributable to equity holders 38,596,688 14,499,229 7,903,841 (1,880,450) 11,510,668
Dividend paid 12,588,538 8,944,125 3,577,650 11,349,982 10,492,625
Earning or (loss) per share – Basic 169k 102k 44k –12k 70k
– Adjusted 169k – 44k –12k 70k
Number of ordinary shares of 50k 22,882,918,908 17,888,251,478 16,262,046,799 16,262,046,799 16,214,258,437
184 Access Bank Plc Annual Report and Accounts 2012
NOTICE IS HEREBY GIVEN that the 24th Annual General Meeting of members of ACCESS BANK PLC will be held at Oriental Hotel, Lekki, Lagos /Epe – Expressway, Lagos on Thursday, 25 April, 2013 at 10:00 a.m. to consider and if thought fit pass the following as ordinary resolutions:
A. Ordinary business1. To receive the Audited Financial Statements for the year ended 31 December, 2012 and the Reports of the Directors,
Auditors and Audit Committee thereon.2. To declare a final dividend.3. To re-elect Mr Gbenga Oyebode MFR as a Non-Executive Director.4. To re-elect Dr Mahmoud Isa-Dutse as a Non-Executive Director.5. To re-elect Mrs Mosun Belo-Olusoga as a Non-Executive Director.6. To elect Dr Ernest Chukwuka-Anene Ndukwe, who was appointed an Independent Non-Executive Director by the Board since the
last Annual General Meeting.7. To appoint Messrs PricewaterhouseCoopers as the Auditors to the Company; in place of the retiring Auditors, KPMG Professional services.8. To authorise the Directors to fix the remuneration of the Auditors.9. To elect/re-elect members of the Audit Committee.
B. Special business To consider and if thought fit pass the following resolutions as Ordinary Resolutions:
10. That the Directors’ fees for the financial year ending 31 December, 2013 be and is hereby fixed at N41,500,000.00 (forty one million five hundred thousand Naira only).
11. That subject to required regulatory approvals, the Directors be and are hereby authorised to distribute to members of the Bank, the Bank’s equity interest in the Issued Share Capital of Wapic Insurance Plc (‘WAPIC shares’) to ensure compliance with the Central Bank of Nigeria Regulation 3, 2010 on the Scope of Banking Activities and Ancillary Matters.
12. That the Directors be and are hereby authorised to appoint professional advisers and take such steps as may be required to give effect to the transaction referred to in Resolutions 11 above upon such terms and conditions as the Directors may approve.
ProxyA member entitled to attend and vote at the Annual General Meeting is entitled to appoint a proxy to attend and vote in his/her stead. A Proxy need not also be a member. A proxy form is attached to the Notice and it is valid for the purpose of the meeting. All instruments of proxy should be duly stamped at the Stamp Duties Office and deposited at the office of the Registrars, United Securities Limited, No.10, Amodu Ojikutu Street, Victoria Island, Lagos, not later than 48 hours prior to the time of the meeting.
Dated this 2nd day of April 2013.
By order of the Board
Sunday EkwochiCompany Secretary Plot 999c, Danmole Street, Victoria Island, Lagos
NotesDividendIf the dividend recommended by the Directors is declared, it will be payable on 25 April, 2013 to shareholders whose names appear on the Register of Members as at 16 April, 2013. Shareholders who have completed the e-dividend mandate form will receive a direct credit of their dividend into their bank accounts immediately after the Annual General Meeting. Shareholders who have not signed on to the e-dividend payment option are advised to complete the e-dividend mandate form available on the Bank’s website at http://www.accessbankplc.com/pages/downloadcentre.asp or from http://www.unitedsecuritieslimited.com/download-forms/mandate-for-e-dividend-payment-008.aspx. The duly completed form should be returned to United Securities Limited, Plot 10, Amodu Ojikutu Street, Victoria Island Lagos, P.M.B 12753, Marina, Lagos or to the nearest Access Bank branch.
Closure of Register of MembersThe Register of Members and Transfer Books of the Bank will be closed on 17 April, 2013 to enable the Registrar to prepare for the payment of dividend.
Audit CommitteeThe Audit Committee consists of 3 shareholders and 3 Directors. In accordance with S.359(5) of the Companies and Allied Matters Act, 2004, any member may nominate a shareholder for election as a member of the Audit Committee by giving notice in writing of such nomination to the Company Secretary at least 21 days before the Annual General Meeting.
Shareholders’ InformationNotice of Annual General Meeting
185Access Bank Plc Annual Report and Accounts 2012
Shareholder information
Explanatory Notes to the Proposed Resolutions
The Notes below provide explanations of the proposed resolutions.
Resolutions 1-12 are being proposed as ordinary resolutions. This means that for each of the resolutions to be passed a simple majority of votes in favour of the resolution is required. Please note that if you abstain from voting you will not be counted in the calculation of the proportion of votes ‘for‘ or ‘against’ a resolution.
Resolution 1: Annual Report and AccountsThe Directors are required under Section 345 (1) of the Companies and Allied Matters Act 1990 to lay before the Company in General Meeting for each financial year copies of the financial statements of the Company made up to a date not exceeding nine months previous to the date of the meeting.
Resolution 2: Declaration of Final Dividend By Section 379 (1) of the Companies and Allied Matters Act 1990, the General Meeting has the power to approve or decrease the final dividend recommended by the Directors but cannot increase the amount. If the 60 kobo final dividend per ordinary share recommended by the Directors is approved, the final dividend net of withholding tax will be payable on 25 April, 2013 to those Shareholders registered on the Company’s register of Shareholders as at 16 April, 2013.
Resolutions 3-6: Election and Re-election of Directors Your Company’s Articles of Association require one-third of all Non-Executive Directors (rounded down) to stand for re-election every year (depending on their tenure on the Board) together with Directors appointed by the Board since the last Annual General Meeting (AGM). In keeping with this requirement, Messrs Gbenga Oyebode, Mahmoud Isa-Dutse and Mrs Mosun Belo-Olusoga will retire at this AGM and, being eligible for re-election, will submit themselves for re-election. It is hereby confirmed that following a formal evaluation, their performance continues to be effective and that they continue to demonstrate commitment to the role of Non-Executive Director.
The Board, pursuant to the powers vested on it by the Articles of Association, has appointed Dr Ernest Chukwuka-Anene Ndukwe as a Non-Executive Director, subject to all regulatory and Shareholders’ approvals. He brings robust experience in private and public sector governance to his role. His appointment has been approved by the Central Bank of Nigeria (CBN). As required by the Articles of Association, Dr Ndukwe’s appointment will be tabled before the Shareholders at the AGM for approval.
The Board considers all the Directors submitting themselves for election and re-election as highly experienced and having a good understanding of the financial services industry. Given their experience and background, the Board believes that they will continue to make valuable contributions to the Bank.
The biographical details of each Director standing for election or re-election are set out below. The Board recommends that these Directors should be elected or re-elected to maintain the appropriate balance of skill, knowledge and experience on the Board.
Mr Gbenga Oyebode MFR – Non-Executive DirectorHis appointment to the Board was approved by the CBN in July 2003. Gbenga is the Chairman of the Bank and the managing partner of Aluko & Oyebode with responsibility for coordinating the various practice areas of the Firm. In addition to his managerial role at Aluko & Oyebode, he heads the Firm’s corporate and energy practice areas. Gbenga has extensive experience in corporate and commercial practice with a special emphasis on oil and gas and power projects, foreign investment, privatisation, telecommunications, project finance and aviation. Gbenga has also been involved in the negotiation of complex commercial agreements for a wide variety of transactions and is a member of the Chartered Institute of Arbitrators.
Gbenga obtained his Bachelor of Law degree from Obafemi Awolowo University Ile-Ife in 1979 and was called to the Nigerian Bar in 1980. In 1982, he obtained a Masters of Law Degree from the University of Pennsylvania, Philadelphia, USA and was called to the New York Bar in 1983. He received the distinguished National Honour of Member of the Order of the Federal Republic of Nigeria (MFR) in December 2001. He is also a member of the American Society of International Law and a Council Member of the International Bar Association Section on Energy and Natural Resources Law. He is the Chairman, Okomu Oil Palm Plc, and also serves on the Board of MTN Nigeria and Crusader Insurance Plc. He is aged 54 as at the date of this AGM.
Dr Mahmoud Isa-Dutse – Non-Executive DirectorHis appointment to the Board was approved by the CBN in June 2005. He is the Chairman of the Risk Management Committee and also sits on the Board Audit Committee and the Board Credit & Finance Committee.
Dr Isa-Dutse holds a PhD in Corporate Governance from the Manchester Business School, University of Manchester; an MBA from Wharton Business School, University of University of Pennsylvania; and a BSc in Economics from Ahmadu Bello University, Zaria.
His professional banking experience spans over two decades. He retired in 2002 as an Executive Director at United Bank of Africa Plc where he was at various times in charge of Credit Risk Management, Investment Banking and Corporate Banking.
He is a Director of Northern Nigeria Flour Mills Plc, Kano and serves as a Senior Independent Non-Executive Director of the Emerging Africa Infrastructure Fund.
He is aged 57 as at the date of this AGM.
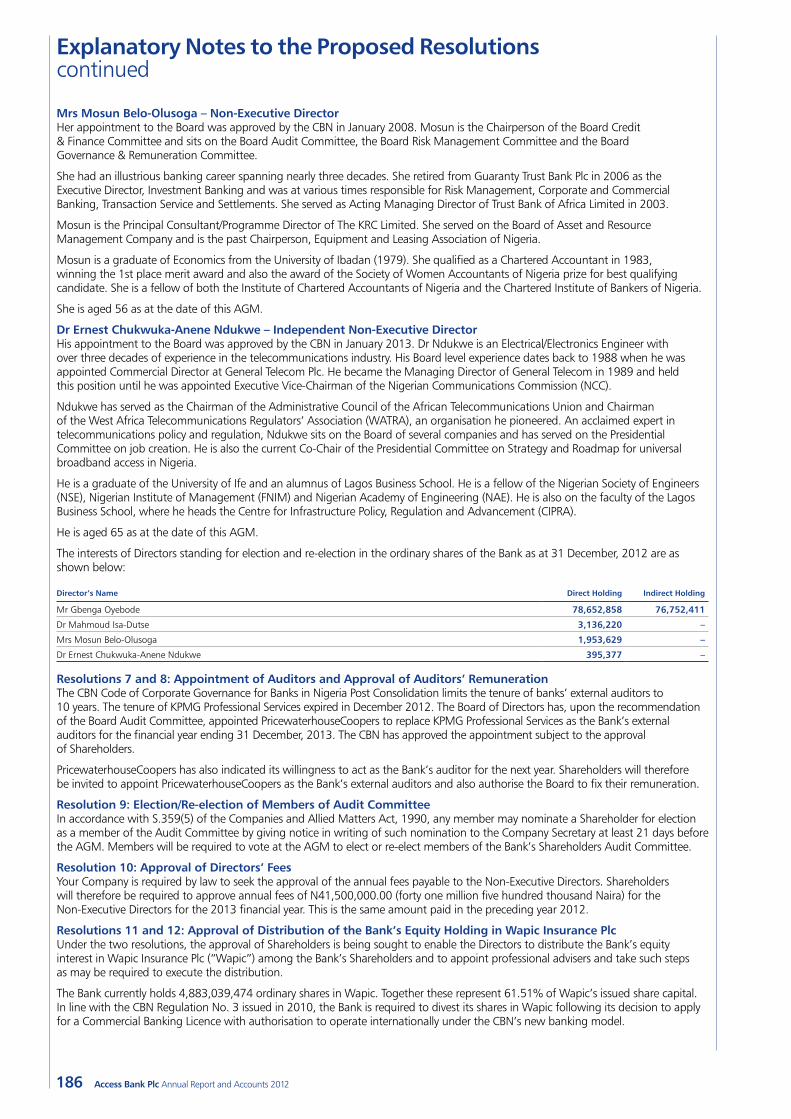
186 Access Bank Plc Annual Report and Accounts 2012
Mrs Mosun Belo-Olusoga – Non-Executive DirectorHer appointment to the Board was approved by the CBN in January 2008. Mosun is the Chairperson of the Board Credit & Finance Committee and sits on the Board Audit Committee, the Board Risk Management Committee and the Board Governance & Remuneration Committee.
She had an illustrious banking career spanning nearly three decades. She retired from Guaranty Trust Bank Plc in 2006 as the Executive Director, Investment Banking and was at various times responsible for Risk Management, Corporate and Commercial Banking, Transaction Service and Settlements. She served as Acting Managing Director of Trust Bank of Africa Limited in 2003.
Mosun is the Principal Consultant/Programme Director of The KRC Limited. She served on the Board of Asset and Resource Management Company and is the past Chairperson, Equipment and Leasing Association of Nigeria.
Mosun is a graduate of Economics from the University of Ibadan (1979). She qualified as a Chartered Accountant in 1983, winning the 1st place merit award and also the award of the Society of Women Accountants of Nigeria prize for best qualifying candidate. She is a fellow of both the Institute of Chartered Accountants of Nigeria and the Chartered Institute of Bankers of Nigeria.
She is aged 56 as at the date of this AGM.
Dr Ernest Chukwuka-Anene Ndukwe – Independent Non-Executive DirectorHis appointment to the Board was approved by the CBN in January 2013. Dr Ndukwe is an Electrical/Electronics Engineer with over three decades of experience in the telecommunications industry. His Board level experience dates back to 1988 when he was appointed Commercial Director at General Telecom Plc. He became the Managing Director of General Telecom in 1989 and held this position until he was appointed Executive Vice-Chairman of the Nigerian Communications Commission (NCC).
Ndukwe has served as the Chairman of the Administrative Council of the African Telecommunications Union and Chairman of the West Africa Telecommunications Regulators’ Association (WATRA), an organisation he pioneered. An acclaimed expert in telecommunications policy and regulation, Ndukwe sits on the Board of several companies and has served on the Presidential Committee on job creation. He is also the current Co-Chair of the Presidential Committee on Strategy and Roadmap for universal broadband access in Nigeria.
He is a graduate of the University of Ife and an alumnus of Lagos Business School. He is a fellow of the Nigerian Society of Engineers (NSE), Nigerian Institute of Management (FNIM) and Nigerian Academy of Engineering (NAE). He is also on the faculty of the Lagos Business School, where he heads the Centre for Infrastructure Policy, Regulation and Advancement (CIPRA).
He is aged 65 as at the date of this AGM.
The interests of Directors standing for election and re-election in the ordinary shares of the Bank as at 31 December, 2012 are as shown below:
Director’s Name Direct Holding Indirect Holding
Mr Gbenga Oyebode 78,652,858 76,752,411
Dr Mahmoud Isa-Dutse 3,136,220 –
Mrs Mosun Belo-Olusoga 1,953,629 –
Dr Ernest Chukwuka-Anene Ndukwe 395,377 –
Resolutions 7 and 8: Appointment of Auditors and Approval of Auditors’ RemunerationThe CBN Code of Corporate Governance for Banks in Nigeria Post Consolidation limits the tenure of banks’ external auditors to 10 years. The tenure of KPMG Professional Services expired in December 2012. The Board of Directors has, upon the recommendation of the Board Audit Committee, appointed PricewaterhouseCoopers to replace KPMG Professional Services as the Bank’s external auditors for the financial year ending 31 December, 2013. The CBN has approved the appointment subject to the approval of Shareholders.
PricewaterhouseCoopers has also indicated its willingness to act as the Bank’s auditor for the next year. Shareholders will therefore be invited to appoint PricewaterhouseCoopers as the Bank’s external auditors and also authorise the Board to fix their remuneration.
Resolution 9: Election/Re-election of Members of Audit CommitteeIn accordance with S.359(5) of the Companies and Allied Matters Act, 1990, any member may nominate a Shareholder for election as a member of the Audit Committee by giving notice in writing of such nomination to the Company Secretary at least 21 days before the AGM. Members will be required to vote at the AGM to elect or re-elect members of the Bank’s Shareholders Audit Committee.
Resolution 10: Approval of Directors’ Fees Your Company is required by law to seek the approval of the annual fees payable to the Non-Executive Directors. Shareholders will therefore be required to approve annual fees of N41,500,000.00 (forty one million five hundred thousand Naira) for the Non-Executive Directors for the 2013 financial year. This is the same amount paid in the preceding year 2012.
Resolutions 11 and 12: Approval of Distribution of the Bank’s Equity Holding in Wapic Insurance PlcUnder the two resolutions, the approval of Shareholders is being sought to enable the Directors to distribute the Bank’s equity interest in Wapic Insurance Plc (“Wapic”) among the Bank’s Shareholders and to appoint professional advisers and take such steps as may be required to execute the distribution.
The Bank currently holds 4,883,039,474 ordinary shares in Wapic. Together these represent 61.51% of Wapic’s issued share capital. In line with the CBN Regulation No. 3 issued in 2010, the Bank is required to divest its shares in Wapic following its decision to apply for a Commercial Banking Licence with authorisation to operate internationally under the CBN’s new banking model.
Explanatory Notes to the Proposed Resolutions continued
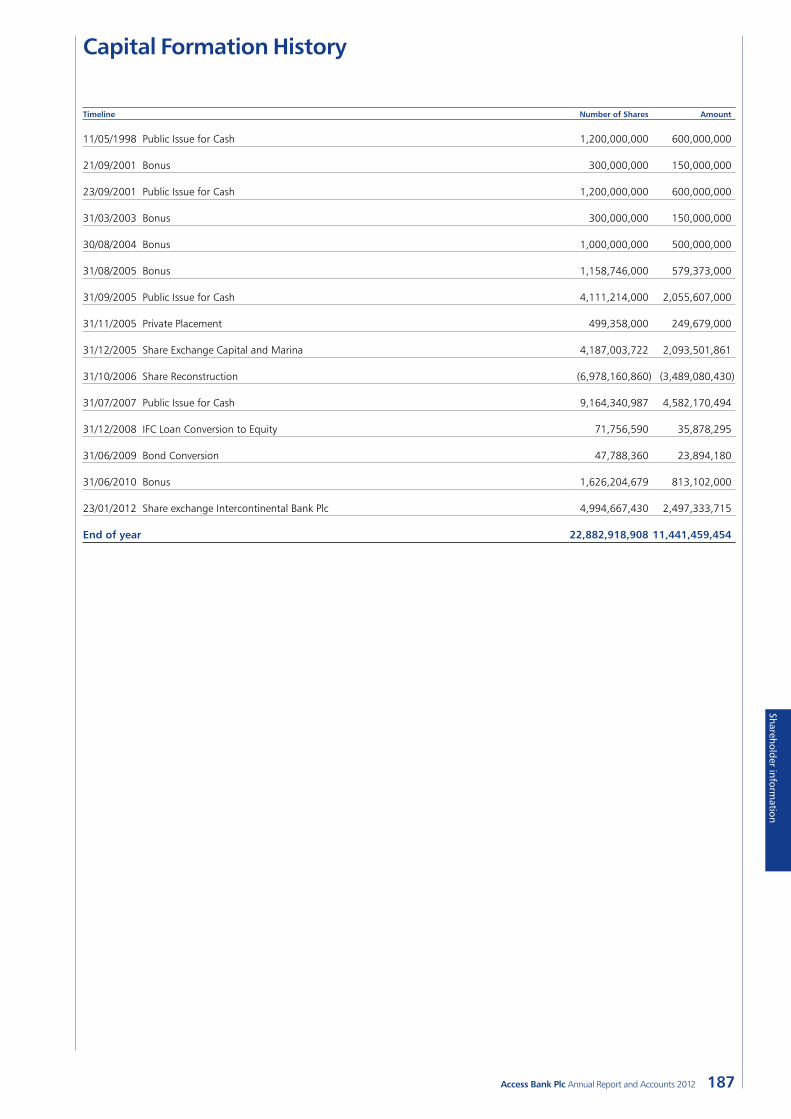
187Access Bank Plc Annual Report and Accounts 2012
Shareholder information
Capital Formation History
Timeline Number of Shares Amount
11/05/1998 Public Issue for Cash 1,200,000,000 600,000,000
21/09/2001 Bonus 300,000,000 150,000,000
23/09/2001 Public Issue for Cash 1,200,000,000 600,000,000
31/03/2003 Bonus 300,000,000 150,000,000
30/08/2004 Bonus 1,000,000,000 500,000,000
31/08/2005 Bonus 1,158,746,000 579,373,000
31/09/2005 Public Issue for Cash 4,111,214,000 2,055,607,000
31/11/2005 Private Placement 499,358,000 249,679,000
31/12/2005 Share Exchange Capital and Marina 4,187,003,722 2,093,501,861
31/10/2006 Share Reconstruction (6,978,160,860) (3,489,080,430)
31/07/2007 Public Issue for Cash 9,164,340,987 4,582,170,494
31/12/2008 IFC Loan Conversion to Equity 71,756,590 35,878,295
31/06/2009 Bond Conversion 47,788,360 23,894,180
31/06/2010 Bonus 1,626,204,679 813,102,000
23/01/2012 Share exchange Intercontinental Bank Plc 4,994,667,430 2,497,333,715
End of year 22,882,918,908 11,441,459,454

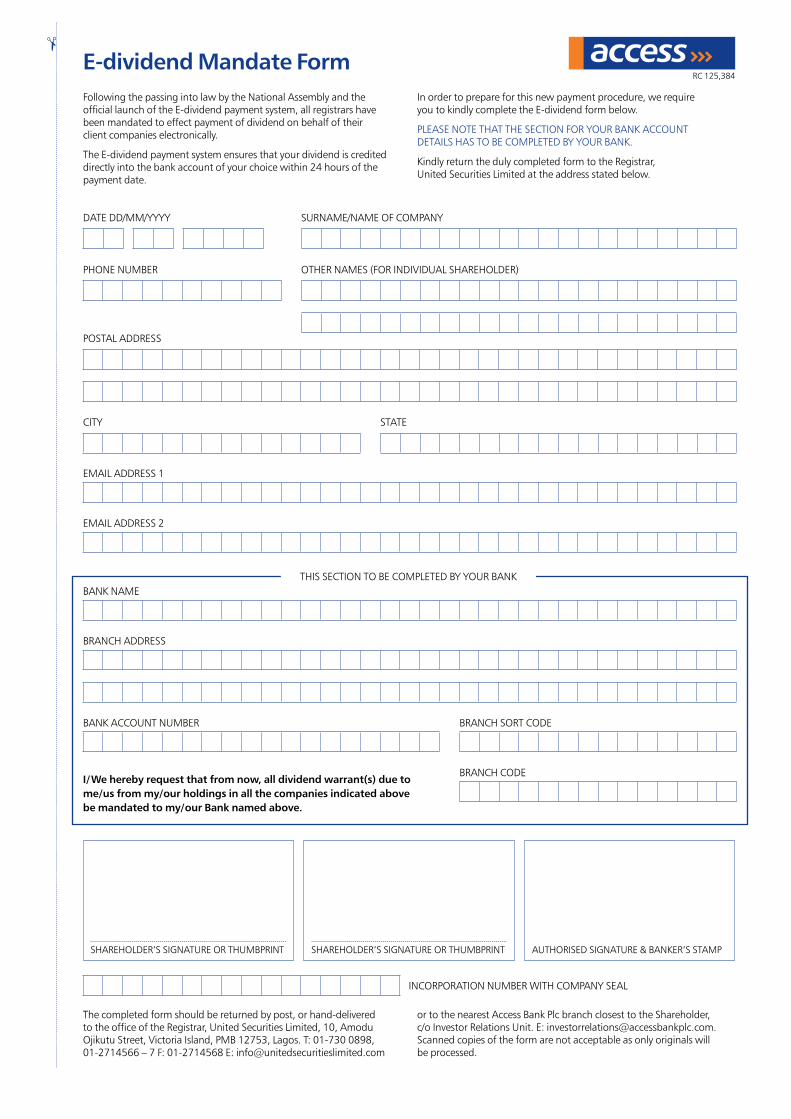
E-dividend Mandate FormFollowing the passing into law by the National Assembly and the official launch of the E-dividend payment system, all registrars have been mandated to effect payment of dividend on behalf of their client companies electronically.
The E-dividend payment system ensures that your dividend is credited directly into the bank account of your choice within 24 hours of the payment date.
In order to prepare for this new payment procedure, we require you to kindly complete the E-dividend form below.
PLEASE NOTE THAT THE SECTION FOR YOUR BANK ACCOUNT DETAILS HAS TO BE COMPLETED BY YOUR BANK.
Kindly return the duly completed form to the Registrar, United Securities Limited at the address stated below.
DATE DD/MM/YYYY SURNAME/NAME OF COMPANY
PHONE NUMBER OTHER NAMES (FOR INDIvIDUAL SHAREHOLDER)
POSTAL ADDRESS
CITY STATE
EMAIL ADDRESS 1
EMAIL ADDRESS 2
BANK NAME
BRANCH ADDRESS
BANK ACCOUNT NUMBER BRANCH SORT CODE
I/We hereby request that from now, all dividend warrant(s) due to me/us from my/our holdings in all the companies indicated above be mandated to my/our Bank named above.
BRANCH CODE
THIS SECTION TO BE COMPLETED BY YOUR BANK
SHAREHOLDER’S SIgNATURE OR THUMBPRINT SHAREHOLDER’S SIgNATURE OR THUMBPRINT AUTHORISED SIgNATURE & BANKER’S STAMP
INCORPORATION NUMBER wITH COMPANY SEAL
The completed form should be returned by post, or hand-delivered to the office of the Registrar, United Securities Limited, 10, Amodu Ojikutu Street, victoria Island, PMB 12753, Lagos. T: 01-730 0898, 01-2714566 – 7 F: 01-2714568 E: [email protected]
or to the nearest Access Bank Plc branch closest to the Shareholder, c/o Investor Relations Unit. E: [email protected]. Scanned copies of the form are not acceptable as only originals will be processed.
✃
RC 125,384

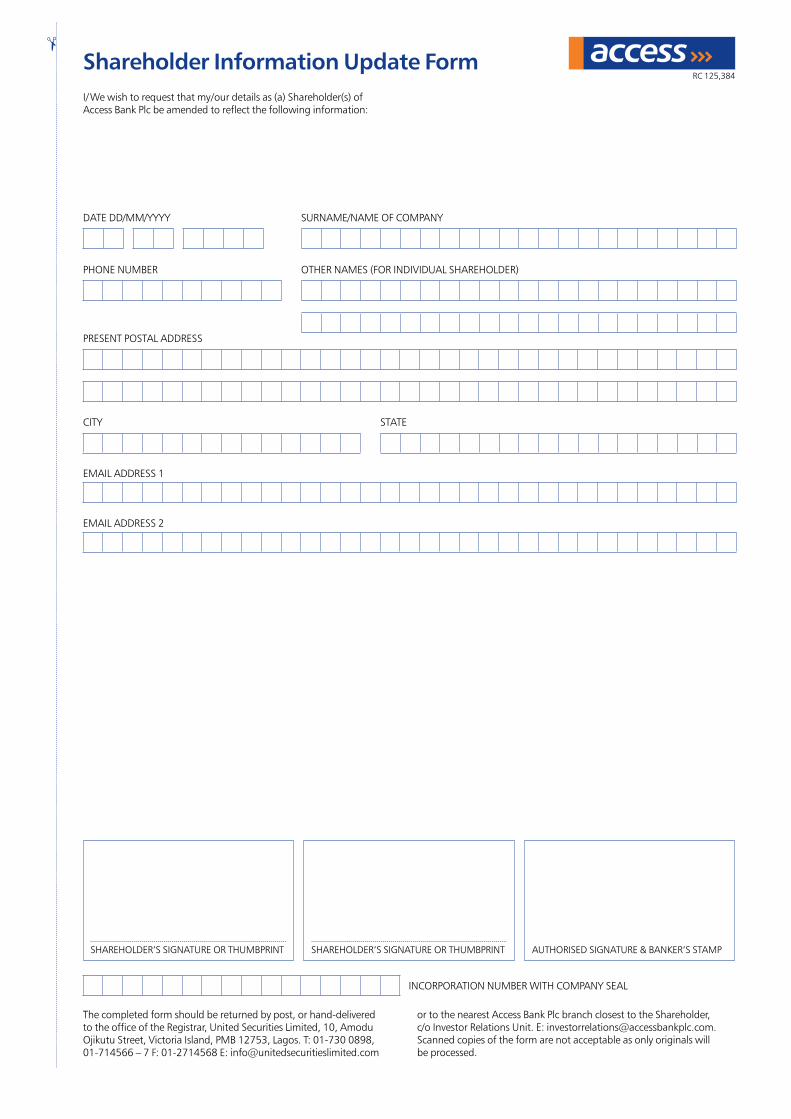
Shareholder Information Update FormI/we wish to request that my/our details as (a) Shareholder(s) of Access Bank Plc be amended to reflect the following information:
DATE DD/MM/YYYY SURNAME/NAME OF COMPANY
PHONE NUMBER OTHER NAMES (FOR INDIvIDUAL SHAREHOLDER)
PRESENT POSTAL ADDRESS
CITY STATE
EMAIL ADDRESS 1
EMAIL ADDRESS 2
SHAREHOLDER’S SIgNATURE OR THUMBPRINT SHAREHOLDER’S SIgNATURE OR THUMBPRINT AUTHORISED SIgNATURE & BANKER’S STAMP
INCORPORATION NUMBER wITH COMPANY SEAL
The completed form should be returned by post, or hand-delivered to the office of the Registrar, United Securities Limited, 10, Amodu Ojikutu Street, victoria Island, PMB 12753, Lagos. T: 01-730 0898, 01-714566 – 7 F: 01-2714568 E: [email protected]
or to the nearest Access Bank Plc branch closest to the Shareholder, c/o Investor Relations Unit. E: [email protected]. Scanned copies of the form are not acceptable as only originals will be processed.
✃
RC 125,384

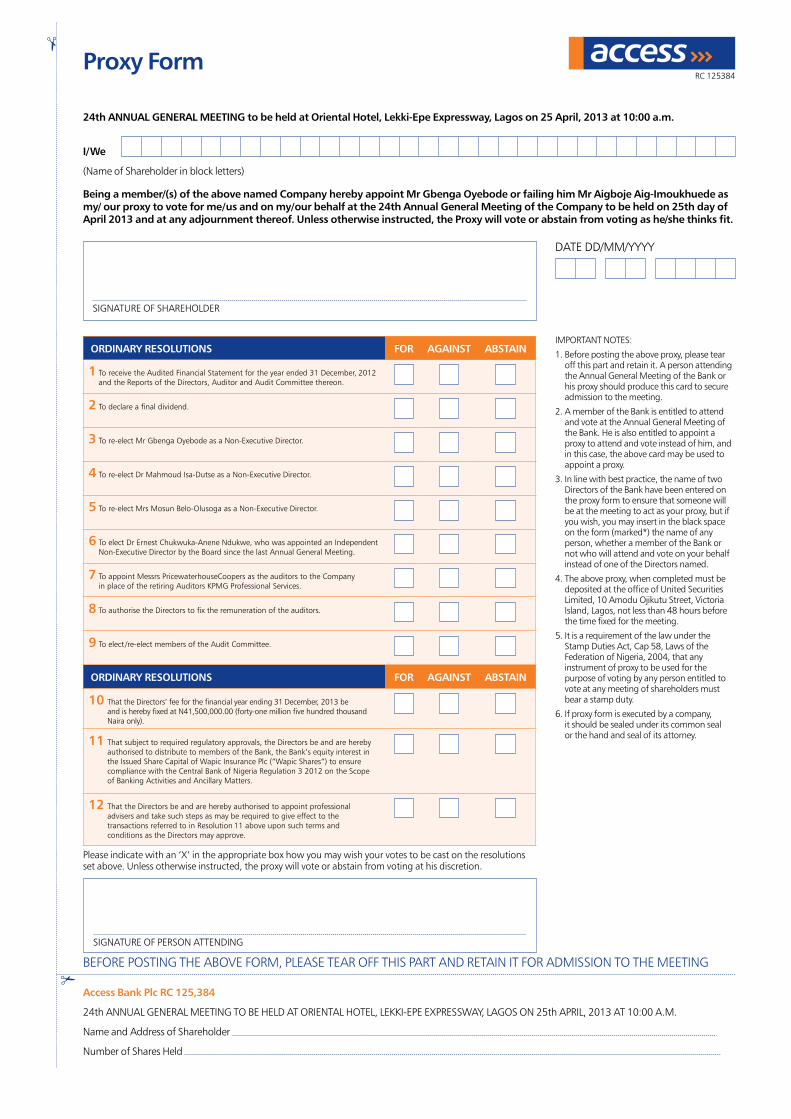
Proxy Form
24th ANNUAL GENERAL MEETING to be held at Oriental Hotel, Lekki-Epe Expressway, Lagos on 25 April, 2013 at 10:00 a.m.
DATE DD/MM/YYYY
✃
I/We
(Name of Shareholder in block letters)
Being a member/(s) of the above named Company hereby appoint Mr Gbenga Oyebode or failing him Mr Aigboje Aig-Imoukhuede as my/ our proxy to vote for me/us and on my/our behalf at the 24th Annual General Meeting of the Company to be held on 25th day of April 2013 and at any adjournment thereof. Unless otherwise instructed, the Proxy will vote or abstain from voting as he/she thinks fit.
SIgNATURE OF SHAREHOLDER
ORdINARy RESOLUTIONS FOR AGAINST ABSTAIN
1 To receive the Audited Financial Statement for the year ended 31 December, 2012 and the Reports of the Directors, Auditor and Audit Committee thereon.
2 To declare a final dividend.
3 To re-elect Mr gbenga Oyebode as a Non-Executive Director.
4 To re-elect Dr Mahmoud Isa-Dutse as a Non-Executive Director.
5 To re-elect Mrs Mosun Belo-Olusoga as a Non-Executive Director.
6 To elect Dr Ernest Chukwuka-Anene Ndukwe, who was appointed an Independent Non-Executive Director by the Board since the last Annual general Meeting.
7 To appoint Messrs PricewaterhouseCoopers as the auditors to the Company in place of the retiring Auditors KPMg Professional Services.
8 To authorise the Directors to fix the remuneration of the auditors.
9 To elect /re-elect members of the Audit Committee.
ORdINARy RESOLUTIONS FOR AGAINST ABSTAIN
10 That the Directors’ fee for the financial year ending 31 December, 2013 be and is hereby fixed at N41,500,000.00 (forty-one million five hundred thousand Naira only).
11 That subject to required regulatory approvals, the Directors be and are hereby authorised to distribute to members of the Bank, the Bank’s equity interest in the Issued Share Capital of wapic Insurance Plc (“wapic Shares”) to ensure compliance with the Central Bank of Nigeria Regulation 3 2012 on the Scope of Banking Activities and Ancillary Matters.
12 That the Directors be and are hereby authorised to appoint professional advisers and take such steps as may be required to give effect to the transactions referred to in Resolution 11 above upon such terms and conditions as the Directors may approve.
IMPORTANT NOTES:
1. Before posting the above proxy, please tear off this part and retain it. A person attending the Annual general Meeting of the Bank or his proxy should produce this card to secure admission to the meeting.
2. A member of the Bank is entitled to attend and vote at the Annual general Meeting of the Bank. He is also entitled to appoint a proxy to attend and vote instead of him, and in this case, the above card may be used to appoint a proxy.
3. In line with best practice, the name of two Directors of the Bank have been entered on the proxy form to ensure that someone will be at the meeting to act as your proxy, but if you wish, you may insert in the black space on the form (marked*) the name of any person, whether a member of the Bank or not who will attend and vote on your behalf instead of one of the Directors named.
4. The above proxy, when completed must be deposited at the office of United Securities Limited, 10 Amodu Ojikutu Street, victoria Island, Lagos, not less than 48 hours before the time fixed for the meeting.
5. It is a requirement of the law under the Stamp Duties Act, Cap 58, Laws of the Federation of Nigeria, 2004, that any instrument of proxy to be used for the purpose of voting by any person entitled to vote at any meeting of shareholders must bear a stamp duty.
6. If proxy form is executed by a company, it should be sealed under its common seal or the hand and seal of its attorney.
SIgNATURE OF PERSON ATTENDINg
BEFORE POSTINg THE ABOvE FORM, PLEASE TEAR OFF THIS PART AND RETAIN IT FOR ADMISSION TO THE MEETINg
Access Bank Plc RC 125,384
24th ANNUAL gENERAL MEETINg TO BE HELD AT ORIENTAL HOTEL, LEKKI-EPE EXPRESSwAY, LAgOS ON 25th APRIL, 2013 AT 10:00 A.M.
Name and Address of Shareholder
Number of Shares Held
✃
RC 125384
Please indicate with an ‘X’ in the appropriate box how you may wish your votes to be cast on the resolutions set above. Unless otherwise instructed, the proxy will vote or abstain from voting at his discretion.

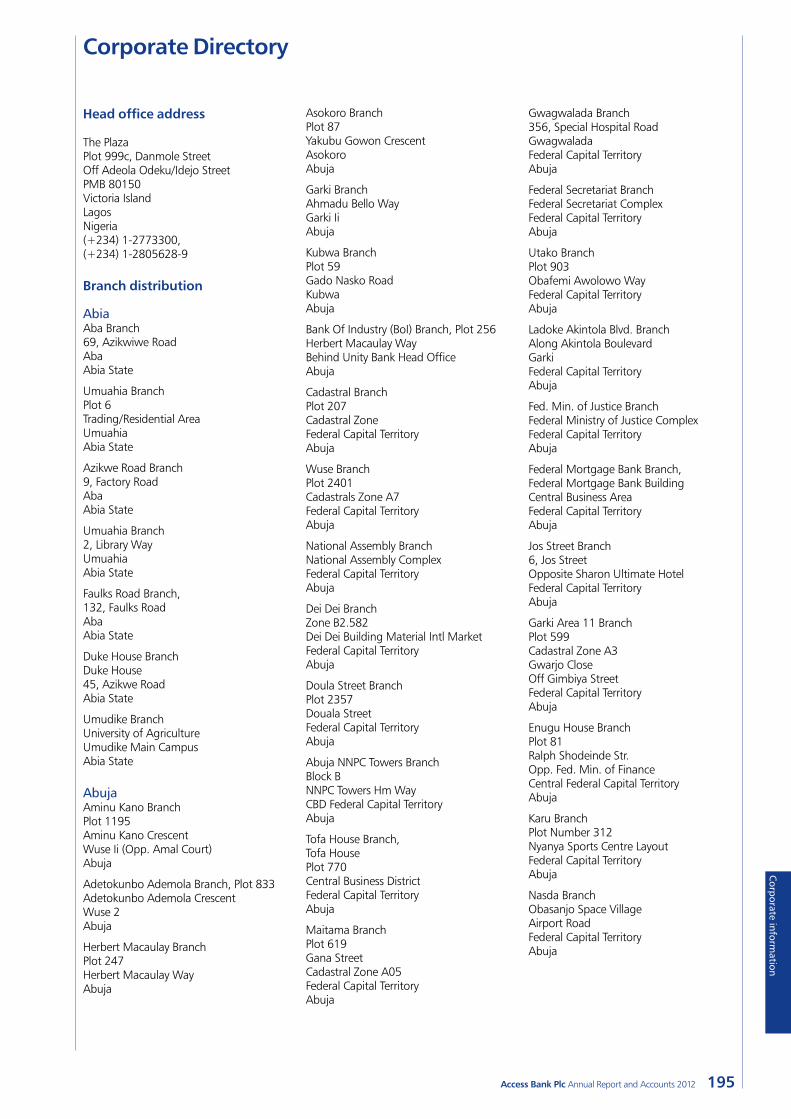
195Access Bank Plc Annual Report and Accounts 2012
Corporate inform
ation
Corporate Directory
Head office address
The Plaza Plot 999c, Danmole Street Off Adeola Odeku/Idejo Street PMB 80150 Victoria Island Lagos Nigeria (+234) 1-2773300, (+234) 1-2805628-9
Branch distribution
AbiaAba Branch 69, Azikwiwe Road Aba Abia State
Umuahia Branch Plot 6 Trading/Residential Area Umuahia Abia State
Azikwe Road Branch 9, Factory Road Aba Abia State
Umuahia Branch 2, Library Way Umuahia Abia State
Faulks Road Branch, 132, Faulks Road Aba Abia State
Duke House Branch Duke House 45, Azikwe Road Abia State
Umudike Branch University of Agriculture Umudike Main Campus Abia State
AbujaAminu Kano Branch Plot 1195 Aminu Kano Crescent Wuse Ii (Opp. Amal Court) Abuja
Adetokunbo Ademola Branch, Plot 833 Adetokunbo Ademola Crescent Wuse 2 Abuja
Herbert Macaulay Branch Plot 247 Herbert Macaulay Way Abuja
Asokoro Branch Plot 87 Yakubu Gowon Crescent Asokoro Abuja
Garki Branch Ahmadu Bello Way Garki Ii Abuja
Kubwa Branch Plot 59 Gado Nasko Road Kubwa Abuja
Bank Of Industry (BoI) Branch, Plot 256 Herbert Macaulay Way Behind Unity Bank Head Office Abuja
Cadastral Branch Plot 207 Cadastral Zone Federal Capital Territory Abuja
Wuse Branch Plot 2401 Cadastrals Zone A7 Federal Capital Territory Abuja
National Assembly Branch National Assembly Complex Federal Capital Territory Abuja
Dei Dei Branch Zone B2.582 Dei Dei Building Material Intl Market Federal Capital Territory Abuja
Doula Street Branch Plot 2357 Douala Street Federal Capital Territory Abuja
Abuja NNPC Towers Branch Block B NNPC Towers Hm Way CBD Federal Capital Territory Abuja
Tofa House Branch, Tofa House Plot 770 Central Business District Federal Capital Territory Abuja
Maitama Branch Plot 619 Gana Street Cadastral Zone A05 Federal Capital Territory Abuja
Gwagwalada Branch 356, Special Hospital Road Gwagwalada Federal Capital Territory Abuja
Federal Secretariat Branch Federal Secretariat Complex Federal Capital Territory Abuja
Utako Branch Plot 903 Obafemi Awolowo Way Federal Capital Territory Abuja
Ladoke Akintola Blvd. Branch Along Akintola Boulevard Garki Federal Capital Territory Abuja
Fed. Min. of Justice Branch Federal Ministry of Justice Complex Federal Capital Territory Abuja
Federal Mortgage Bank Branch, Federal Mortgage Bank Building Central Business Area Federal Capital Territory Abuja
Jos Street Branch 6, Jos Street Opposite Sharon Ultimate Hotel Federal Capital Territory Abuja
Garki Area 11 Branch Plot 599 Cadastral Zone A3 Gwarjo Close Off Gimbiya Street Federal Capital Territory Abuja
Enugu House Branch Plot 81 Ralph Shodeinde Str. Opp. Fed. Min. of Finance Central Federal Capital Territory Abuja
Karu Branch Plot Number 312 Nyanya Sports Centre Layout Federal Capital Territory Abuja
Nasda Branch Obasanjo Space Village Airport Road Federal Capital Territory Abuja
196 Access Bank Plc Annual Report and Accounts 2012
Abuja continued Durumi Branch Plot 1037 Shafa Shopping Centre By Old Federal Secretariat Federal Capital Territory, Abuja
AdamawaYola Branch 30 Abubakar Atiku Way Adamawa State
Akwa IbomOron Branch Along Oron Road Etiema Street Akwa Ibom State
Ikot Ekpene Branch 1, Abak Road Akwa Ibom State
Wellington Bassey Branch 21, Wellington Bassey Way Akwa Ibom State
Aka Road Branch 32, Aka Road Akwa Ibom State
Eket Branch Along Grace Bill Road Akwa Ibom State
AnambraNew Market Road Branch 30, Nnewi Road Anambra State
Edo Ezemewi Rd Branch 15, Edo Ezemewi Road Anambra State
Bridge Head Branch 48, Port Harcourt Road Bridge Head Onitsha Anambra State
Ekwulobia Main Branch Uga Road Ekwulobia Aguata Lga Anambra State
New Market Road Branch 14, New Market Road Onitsha Anambra State
Umunze Branch Umunze Ogbunka Road Orumba North Local Govt. Anambra State
Awka 2 Branch Km 41 Enugu-Onithsa Expressway Regina Caeli Junction Awka Anambra State
Ihiala Branch Ihiala Anambra State
Up Iweka Branch Up Iweka Onitsha Anambra State
Ogidi Branch Building Material Market Anambra State
Unizik Branch Bank Plaza Nnamdi Azikiwe University Awka Anambra State
Stock Exchange Branch Nigeria Stock Exchange Complex Onitsha Anambra State
BauchiBauchi Branch 5, Bank Road Bauchi State
BayelsaYenagoa Major Axis Branch Km 6 Mbiama/Yenagoa Road Bayelsa State
Mbiama Yenagoa Road Branch Mbiama/Yenogoa Road Onopa Yenogoa Bayelsa State
BenueMakurdi Branch 83, Old Otukpo Road Benue State
Gboko Branch Benue Cement Factory Km 72 Makurdi-Gboko Road Benue State
Oturkpo Branch 19, Federal Road Oturkpo Benue State
Gboko Main Branch 5/7, J.S. Tarka Way Gboko Benue State
Makurdi 2 Branch Adjacent To Living Faith Church Benue State
Zaki Ibiam Branch Y- Junction Katsina Ala Road Zakibiam Benue State
BornoMaiduguri Branch Sir Kashim Ibrahim Way Maiduguri Borno State
Bama Branch Along Bama-Mubi Road Bama Borno State
Cross RiverCalabar Road Branch 10, Calabar Road Pmb 1270 Cross River State
Ogoja Branch Hospital Road Ogoja Cross River State
DeltaNnebisi Road Branch 417B, Nnebisi Road Asaba Delta State
Agbor Branch 126, Old Asaba Road Delta State
Deco Road Branch Robson Shopping Complex Deco Road Delta State
Effururn Branch 80, Effurun-Sapele Road Effurun Delta State
Sapele Branch Warri Road Sapele Delta State
EbonyiAbakaliki Branch 44, Ogoja Road Abakaliki Ebonyi State
Abakaliki Branch 41, Ogoja Road Abakaliki Ebonyi State
EdoBenin Branch 45, Akpakpava Street Benin Edo State
Mission Road Branch 135, Akpapava Road Benin Edo State
Corporate Directorycontinued
197Access Bank Plc Annual Report and Accounts 2012
Corporate inform
ation
Textile Mill Road Branch 74, Edo Textile Mill Road Benin Edo State
Uniben Branch Ransome Kuti Road University Of Benin Edo State
Okada Branch New Site Igbinedion University Campus Okada Edo State
Auchi Branch Beside Federal Polytechnic Auchi Iyekhei/Polytechnic Road Edo State
Ekpoma Branch 6, Akhere Lane Edo State
Sapele Road Branch 164, Sapele Road Opposite NPDC Sapele Edo State
Uselu Branch 170, Uselu Lagos Road Edo State
EkitiIjero Ekiti Branch Ijero Ekiti Ijero Computer Centre Market Square Ekiti State
Ado Ekiti Branch 144, Secretariar/Iyin Road Ekiti State
AnambraAwka Branch 222, Zik Avenue Awka Enugu State
EnuguOkpara Avenue Branch 5, Okpara Avenue Enugu Enugu State
Enugu Road Branch 12, Enugu Road Enugu Enugu State
Kenyatta Branch 16, Kenyatta Street Uwani Enugu State
Esut Branch Enugu State University Enugu Enugu State
Agbani Road Branch Agbani Road Enugu Enugu State
UNN Nsukka Branch University Of Nigeria Nsukka Enugu State
Abakaliki Road Branch Abakaliki Road Enugu Enugu State
Abakpa Nike Branch Abakpa Nike Enugu Enugu State
Ogui Road Branch 67, Ogui Road By Nnamdi Azikiwe Stadium Enugu Enugu State
UNN Enugu Campus Branch University Of Nigeria Enugu Campus Enugu State
GombeAshaka Branch Ashaka Cement Factory Gombe State
Gombe Branch 24, New Market Road Gombe State
Dukku Branch Dukku Local Government Secretariat Gombe State
Yamaltu Deba Branch Deba Gra Yamaltu Deba Lga Gombe State
Kumo Branch Emir Palace Road Kumo Akko Lga Gombe State
ImoWetheral Road Branch 117, Wetheral Road Close To Dan Anyiam Stadium Owerri Imo State
Nekede Branch Federal Polytechnic Nekede Imo State
Orlu Branch 4A, Bank Road Orlu Imo State
Bank Road Branch Bank Road Owerri Imo State
Mbaise Branch Eke-Ahiara Junction Mbaise Imo State
JigawaDutse Branch Plot 10/11 Sani Abacha Way Dutse Jigawa State
KadunaKaduna Branch 16/20, Bida Road Kaduna State
Ali Akilu Road Branch 26D, Ali Akilu Road Kaduna Kaduna State
Kachia Road Kaduna Branch 314, Kachia Road Kaduna Kaduna State
Ahmadu Bello Way Branch A2, Ahmadu Bello Way Kaduna Kaduna State
NNPC Refinery Kaduna Branch, NNPC Kaduna Kaduna State
Gumi Main Market, Branch Gumi Main Market Kaduna Kaduna State
Kafanchan Branch Kafanchan Kaduna State
Ungwan Rimi Branch Along Kwato Road Ungwan Rimi Gra Kaduna Kaduna State
KanoKano Branch 12B, Post Office Road Kano State
Murtala Mohammed Way Kano Branch 146, Murtala Mohammed Way Kano Kano State
198 Access Bank Plc Annual Report and Accounts 2012
Kano continued Bello Road, Kano Branch 24, Bello Road Kano Kano State
3B Bank Road Branch 3B Bank Road Kano Kano State
Katin Kwari Branch Ibrahim Taiwo Road By Aib Kano Kano State
Bayero University Branch Main Campus Bayero University Kano Kano State
Aminu Kano Teaching Hospital Branch, Aminu Kano Teaching Hospital Kano Kano State
Bichi Branch Along Katsina Road By Bichi Junction Kano Kano State
Kazaure Branch Along Kano-Duara Road Kano Kano State
France Road Branch 17/18, France Road Kano Kano State
KatsinaKatsina Branch 106, Ibb Way Katsina Katsina State
Katsina Branch Ibb Way Opp. NUM International Bank Katsina Katsina State
Funtua Branch Zaria Road Katsina Katsina State
Malumfashi Branch Along Funtua Road Near Total Filling Station Katsina State
Daura Branch Along Kano Road Besides Nitel Office Katsina State
KebbiBirnin Kebbi Branch 1, Jos Road G.R.A. Birnin Kebbi
KogiObajana Branch Opposite Dangote Cement Factory Kogi State
Okene Branch Along Kogi Road Kogi State
Lokoja Branch 82, Lokoja Kabba Road Lokoja Kogi State
KwaraIlorin Branch Stadium Shopping Complex Taiwo Road Ilorin Kwara State
Folawiyo Street Branch 24, Wahab Folawiyo Unity Road Ilorin Kwara State
Reservation Road Branch 29A, Reservation Road Gra Ilorin Kwara State
LagosBurma Road Apapa Branch 4, Burma Road Apapa Lagos State
Idumota Branch 6, Obun Eko Street Idumota Lagos State
Broad Street Branch 134 /136, Broad Street Lagos Lagos State
Ikorodu Branch 7, Ayangburen Road Ikorodu Lagos State
Allen Branch 84, Allen Avenue Ikeja Lagos State
Victoria Island Branch Plot 1665 Oyin Jolayemi Street Victoria Island
Onikan Branch 30, King George V Road Onikan Lagos State
Commercial Road Branch 8/10, Commercial Road Opposite Eleganza Plaza Apapa Lagos State
Old Ojo Branch 153, Old Ojo Road Kuje-Amuwo Agboju Lagos State
Palm Avenue Branch 4, Palm Avenue Mushin Lagos State
Simbiat Abiola Branch 20, Simbiat Abiola Road Ikeja Lagos State
Adetokunbo Ademola Branch, 30A, Adetokunbo Ademola Victoria Island Lagos State
Aspamda Branch Zone B R4, Mercy Café Aspamda Plaza Trade Fair Complex Lagos State
Maryland Branch 6, Mobolaji Bank Anthony Way Ikeja Lagos State
Ogunlana Drive Branch 150, Ogunlana Drive Surulere Lagos State
Ligali Ayorinde Branch Plot 15 Ligali Ayorinde Street Victoria Island Lagos State
Point Road Branch, Ib, Point Road Apapa Lagos State
Ogba Branch 40A /40B, Ogba Ijaiye Road Ogba Lagos State
Idi-Araba Branch College Of Medicine Ishaga Road Idi-Araba Lagos State
Corporate Directorycontinued

199Access Bank Plc Annual Report and Accounts 2012
Corporate inform
ation
Agbara Branch Bank Road Agbara Industrial Estate Agbara Lagos State
Adeyemo Alakija Branch Commerce House 1, Idowu Taylor Street Victoria Island Lagos State
Lekki Chevron Branch Beside Chevron Roundabout Along Lekki-Epe Expressway Lagos State
Marina BoI Branch Bank of Industry Building 23B, Broad Street Marina Lagos State
Awolowo Road Branch 58, Awolowo Road Ikoyi Lagos State
Alausa Branch 183, Obafemi Awolowo Road Alausa Ikeja Lagos State
Creek Road Branch, 39, Creek Road Apapa Lagos State
Idejo Branch Plot 161E Idejo Street Off Adeola Odeku Victoria Island Lagos State
Agudosi Branch 4, Agudosi Street Off Ojo Road Alaba International Market Lagos State
Toyin Branch 54, Toyin Street Ikeja Lagos State
Matori Branch 125, Ladipo Street Mushin Lagos State
Alfred Rewane Road Branch 1, Kingsway Road Ikoyi Lagos State
Adeniran Ogunsanya Branch, 71, Adeniran Ogunsanya Street Surulere Lagos State
Maza Maza Branch, 17, Sikiru Otunba Street Old Ojo Road Lagos-Badagry Expressway Lagos State
Adeola Hopewell Branch Plot 1697 Adeola Hopewell Victoria Island Lagos State
Marina Branch 48, Marina Street Lagos State
Issa Williams Branch 27/29, Issa Wiliams Street Lagos Island Lagos State
Ikorodu Branch 32, Lagos Road Ikorodu Lagos State
Atiku Abubakar Hall Branch ICC, Lagos International TFC Lagos-Badagry Expressway Lagos State
Tejuosho Branch 31, Tejuosho Street Yaba Lagos State
Dopemu Branch 92, Lagos-Abeokuta Expressway Dopemu Lagos State
Festac Branch 4th Avenue Festac Lagos State
Oba Akran Branch 23-25, Oba Akran Avenue Ikeja Lagos State
Awolowo Road Branch 87, Awolowo Road Lagos State
Moloney Branch 34, Moloney Street Lagos Island Lagos State
Isolo Branch 113, Okota Road Okota Lagos State
Ilupeju Branch 11, Town Planning Way Ilupeju Lagos State
Adeniyi Jones Branch 65, Adeniyi Jones Ikeja Lagos State
Gbagada Branch Plot 286 Oshodi-Apapa Expressway Gbagada Phase I Lagos State
Lekki 1 Branch Plot 7, Blk 2 Oniru Private Estate By Maroko Bus Stop Lagos State
Ajose Adeogun Branch 287, Ajose Adeogun Street Victoria Island Lagos State
Ikorodu Road Branch 38/40, Ikorodu Road Jibowu Lagos State
Nahco Branch Nahco Complex 1 Murtala Mohammed International Airport Ikeja Lagos State
Wharf Road Branch 13-15, Wharf Road Apapa Lagos State
Opebi Branch 23, Opebi Road Ikeja Lagos State
Ketu Branch 533, Ikorodu Road Ketu Lagos State
Orile Coker Branch, 3, Alhaji Owokoniran Street Orile Coker Lagos State
Alaba Branch 44/45, Alaba International Market Road Lagos State
Agege Branch 653, Abeokuta Express Road Abule Taylor Abule-Egba Lagos State
Obafemi Awolowo Way Branch 77, Obafemi Awolowo Way Lagos State
Kosoko Branch 52/54, Kosoko Street Lagos Island Lagos State
Ojota Branch 1A, Ogudu Road Ojota Lagos State
200 Access Bank Plc Annual Report and Accounts 2012
Lagos continuedAdetokunboh Ademola Branch, Plot 1408A, Adetokunbo Ademola Street Victoria Island Lagos State
Nnamdi Azikwe Branch 68, Nnamdi Azikwe Street Idumota Lagos State
Egbeda Branch 35, Akowonjo Road Egbeda Lagos State
Ojuelegba Branch 78, Ojuelegba Road Tejuosho Lagos State
Oyingbo Branch 7, Coates Street Lagos State
Ikotun Branch 4, Ikotun Junction Ikotun Lagos State
Shomolu Branch 47, Market /Odunlami Street Shomolu Lagos State
Old Alaba Motor Park Branch Old Alaba Motor Park Off Ojo Igbede Alaba International Market Lagos State
Oroyinyin Branch 3, Oroyinyin Street Idumota Lagos State
Olodi-Apapa Branch Plot 24 Opposite Ibru Jetty Apapa Lagos State
Iddo Branch Iddo Shopping Complex Iddo Lagos State
Allen Branch 13, Allen Avenue Ikeja Lagos State
Adeola Odeku Branch 44, Adeola Odeku Street Victoria Island Lagos State
Trade Fair Branch Opposite Zone F Block 1 Aspamda Lagos State
Bode Thomas Branch 42, Bode Thomas Street Surulere Lagos State
Ijeshatedo Branch Ijeshatedo Surulere Lagos State
Mushin Branch 279, Agege Motor Road Mushin Lagos State
Unilag Branch University of Lagos Akoka, Lagos State
Oregun Branch 51, Kudirat Abiola Way Oregun Lagos State
Ire Akari Branch 1, Godwin Omonua Street Ire Akari Estate Lagos State
Sabo Yaba Branch 290, Herbert Macaulay Way Sabo-Yaba Lagos State
Muri Okunola Branch 211, Muri Okunola Street Victoria Island Lagos State
Saka Tinubu Branch 44A, Saka Tinubu Street Off Adeola Odeku Street Lagos State
Lawanson Branch 87, Itire/Lawanson Road Surulere Lagos State
Iju Branch 134, Water Works Road Iju-Ishaga Lagos State
Oshodi Branch Olorunsogo Oshodi Lagos State
Ojodu Berger Branch Plot 101 Isheri Road Ojodu Lagos State
Ajao Estate Branch, Airport Road Ajao Estate Lagos State
Broad Street Ii Branch 32, Broad Street Lagos Island Lagos State
Ifako-Gbagada Branch 6, Diya Street Ifako-Gbagada Lagos State
St. Finbarrs Branch 67, St. Finbarrs Road Chemist Bus Stop Yaba Lagos State
Aguda Branch 5, Enitan Street Surulere Lagos State
Ikota Branch Suite E 79-81 and 116-118 VGC Ikota Shopping Complex Lagos State
Satellite Town Branch Opposite Tantalizers Old Ojo Road Abule Ado Satellite Town Lagos State
Lasu Branch Lagos State University Ojo Lagos State
Alagbado Branch Daniel Farm Km32, Lagos-Abeokuta Expressway Agege Lagos State
Odogunyan Branch Opposite 2nd Gate Lagos Polytechnic Lagos State
Ayobo Branch Along Ayobo/Ipaja Road Opposite Deeper Life Bible Church Ayobo Lagos State
Ejigbo Branch Along Ejigbo/Ikotun Road Opposite NNPC Junction Ejigbo Lagos State
Idimu Branch 71, Egbeda/Idimu Road Idimu Lagos State
Daleko Branch Daleko Market Complex Daleko Lagos State
Corporate Directorycontinued
201Access Bank Plc Annual Report and Accounts 2012
Corporate inform
ation
Adeniji Adele Branch Oba Adeniji Adele Plaza Adeniji Adele Road Lagos Island Lagos State
Adeola Odeku Branch 11A, Adeola Odeku Street Victoria Island Lagos State
Ilupeju Branch 25A, Ilupeju By-Pass Ilupeju Lagos State
NasarawaLafia Branch Jos Road Lafia Nasarawa State
Mararaba Branch Plot 3316 Abuja Keffi Expressway Mararaba Nasarawa State
NigerSuleja Branch NNPC/PPMC Depot Suleja Niger State
Minna Branch 2, Old Airway Road Off Boso Road Minna Niger State
Suleja Branch Suleman Barau Road Opposite Gamco Motors Niger State
Bida Branch Along BCC Road Niger State
OgunOke Ilewo Branch 1, Lilubu Street Oke Ilewo Ibara Ogun State
RCCG Camp Branch, Redemption Camp Km 46/85 Lagos-Ibadan Expressway Mowe Ogun State
Fajuyi Road Branch 1-5, Fajuyi Road Sapon Ogun State
Otta Branch 145, Lagos-Abeokuta Expressway Sango Otta Ogun State
Ijebu-Ode Branch 19, Ibadan Road Ijebu Ode Ogun State
Sagamu Branch 71, Akarigbo Road Sagamu Ogun State
Covenant Branch Opposite Covenant University Otta Ogun State
Ilaro Branch Ona Ola Quarters Opposite Fire Station Ilaro Ogun State
OndoAdo Owo Road Branch 11, Ado Owo Road Ondo State
Oba Adesida Road Branch 126, Oba Adesida Road Akure Ondo State
Ondo Branch Yaba Ondo Ondo State
Adekunle Ajasin University Campus Branch Adekunle Ajasin University Campus Ondo State
OsunOshogbo Branch 2, Obafemi Awolowo Road Igbonna Osun State
Ile Ife Branch 26, Aderemi Road Ile Ife Osun State
Oau Branch Obafemi Awolowo University Campus Ile Ife Osun State
Ilesha Branch 107A, Orinkiran Street Oshogbo Road Osun State
OyoDugbe Market Branch 1, Jimoh Odutola Street Dugbe Market Ibadan Oyo State
Iwo Road Branch 37, Iwo Road Ibadan Oyo State
New Court Branch 34, New Court Road Dugbe Oyo State
Bodija Branch Plot 6 University Crescent Ui Second Road Ibadan Oyo State
Ogbomoso Branch, Apake Area Ogbomoso Oyo State
Iwo Road Branch 4, Iwo Road Ibadan Oyo State
Ekotedo Branch 50, Adekunle Fajuyi Road Ekotedo Iya-Olobe Oyo State
UCH Ibadan Branch, Beside Blood Bank UCH Ibadan Oyo State
Challenge Branch Challenge Roundabout Ibadan Oyo State
Oyo Branch Beside Conoil Filling Station Ilorin-Ogbomosho Expressway Oyo State
Ojoo Branch Old Ibadan-Oyo Road Besides Olona Filling Station Oyo State
Ring Road Branch Opposite Mobil Filling Station Ring Road Ibadan Oyo State
Bodija Branch Plot 32 Bodija Ui Road Bodija Ibadan Oyo State
202 Access Bank Plc Annual Report and Accounts 2012
PlateauBank Road Branch 37, Beach Road Plateau State
Jos 2 Branch 1, Murtala Mohammed Way Jos Plateau State
Bukuru Branch Bukuru-Jos Road Bukuru Jos South Local Plateau State
RiversAgip Road Branch No 1, Agip Road Mile 4 Rumueme Port Harcourt Rivers State
Bank Road Branch 10A, Bank Road Rivers State Judiciary Port Harcourt Rivers State
Bonny Cash Centre, 64, Hospital Road Bonny Island Rivers State
Trans Amadi Branch Plot 10 Trans Amadi Industrial Layout Near Erijoy Hotel Port Harcourt Rivers State
Olu Obasanjo Branch 329, Olu Obasanjo Road Port Harcourt Rivers State
Azikiwe Road Branch 12, Azikiwe Road Port Harcourt Rivers State
Rumuokoro Branch 679, Ikwerre Road Rumuokoro Port Harcourt Rivers State
Eleme Branch PPMC Depot Eleme Rivers State
Olu Obasanjo Branch 2 Plot 9 Olu Obasanjo Road Port Harcourt Rivers State
Trans Amadi Branch 41, Trans Amadi Industrial Layout Port Harcourt Rivers State
Rumukurishi Branch Plot 382, Port Harcourt-Aba Expressway Port Harcourt Rivers State
Uniport Branch University of Port Harcourt Port Harcourt Rivers State
Ikokwu Branch Ikowku Rivers State
Obigbo Branch Obigbo Rivers State
Woji Branch Woji Rivers State
Garrison Branch 82/88, Aba Road Beside MTN Building Port Harcourt Rivers State
Eastern Bulkcement Branch By Eastern Bulkcement Company Ltd Wofe Road Rivers State
Azikiwe Road Branch 5, Azikiwe Road Near Government House Port Harcourt Rivers State
Rsust Branch River State University Science and Technology Port Harcourt Rivers State
SokotoSokoto Branch Opposite Afribank Plc Maiduguri Road Sokoto Sokoto State
Sokoto Branch 20, Abdullahi Fodio Road Sokoto Sokoto State
Usman Danfodio University Branch Main Campus Usman Danfodio University Sokoto Sokoto State
TarabaJalingo Branch 57B, Hammaruwa Way Jalingo Taraba State
Jalingo Branch 240, Hammaruwa Way Jalingo Taraba State
YobeDamaturu Branch 12B, Maiduguri Road Along Potiskum Damaturu Road Damaturu Yobe State
Biu Branch I, Damaturu Road Biu Yobe State
ZamfaraGusau Branch Canteen Road Beside Fbn Gusau Zamfara State
Talata Mafara Branch Sokoto Road Opposite LGA Office Zamfara State
Corporate Directorycontinued

203Access Bank Plc Annual Report and Accounts 2012
Corporate inform
ation
ATM locations
Access Bank Plc,15 Azikiwe Road Aba, Abia, BranchAccess Bank Plc, 2, Library Way Umuahia Abia, BranchAccess Bank Plc, 132, Faulks Road Aba Abia State, Abia, Branch Access Bank Plc, Duke House 45 Azikwe Road Abia State, Abia, BranchAccess Bank Plc, 69 Azikwiwe Road Aba, Abia, BranchAccess Bank Plc, Plot 6 Trading/Residential Area Umuahia, Abia, BranchAccess Bank Plc, Plot 207 Cadastral Zone Federal Capital Territory Abuja, Abuja, BranchAccess Bank Plc, Plot 2401 Cadastrals Zone A7, Abuja, BranchAccess Bank Plc, National Assembly White House Basement Abuja, Abuja, Branch Access Bank Plc, Zone B2.582, Dei Dei Building Material Intl Market Federal Capital Territory, Abuja, BranchAccess Bank Plc, Erisco Bonpet Plaza Wuse Market, Abuja, BranchAccess Bank Plc, Block B NNPC Towers Hm Way CBD Federal Capital Territory, Abuja, BranchAccess Bank Plc, Tofa House Plot 770 Central Business District Federal Capital Territory, Abuja, BranchAccess Bank Plc, Plot 619, Gana Street Cadastral Zone A05 Cadastral Zone A0 Federal Capital Territory, Abuja, BranchAccess Bank Plc, 356, Special Hospital Road Gwagwalada Federal Capital Territory, Abuja, BranchAccess Bank Plc, Federal Secretariat Complex, Abuja, BranchAccess Bank Plc, Plot 903 Obafemi Awolowo Way Federal Capital Territory,, Abuja, BranchAccess Bank Plc, along Akintola Boulevard Garki Federal Capital Territory, Abuja, BranchAccess Bank Plc, Federal Ministry of Justice Complex Federal Capital Territory Abuja, Abuja, BranchAccess Bank Plc, Federal Mortgage Bank Building Central Business Area Federal Capital Territory, Abuja, BranchAccess Bank Plc, 6 Jos Street opposite Sharon Ultimate Hotel Federal Capital Territory, Abuja, BranchAccess Bank Plc, Plot 599, Cadastral Zone A3 Gwarjo Close off Gimbiya Street, Abuja, BranchAccess Bank Plc, Plot 81 Ralph Shodeinde Str Opp Fed Min of Finance Central Federal Capital Territory, Abuja, Branch
Access Bank Plc, Plot Number 312, Nyanya Sports Centre Layout, Abuja, BranchAccess Bank Plc, Obasanjo Space Village Airport Road Federal Capital Territory, Abuja, BranchAccess Bank Plc, Plot 1037, Shafa Shopping Centre by Old Federal Secretariat, Federal Capital Territory, Abuja, BranchAccess Bank Plc, 13/15 Atiku Abubakar (Mubi) Road, Adamawa, BranchAccess Bank Plc, Along Oron Road Etiema Street, Akwa Ibom State, Akwa Ibom, BranchAccess Bank Plc, 1 Abak Road, Akwa Ibom, BranchAccess Bank Plc, PPMC Depot, Akwa Ibom, BranchAccess Bank Plc, 45 Muritala Mohammed Way, Akwa Ibom, BranchAccess Bank Plc, 32, Aka Road opposite Gulf Bank Akwa Ibom State, Akwa Ibom, BranchAccess Bank Plc, along Grace Bill Road Akwa Ibom State, Akwa Ibom, BranchAccess Bank Plc, 30 Nnewi Road Anambra State Onistha 1, Anambra, BranchAccess Bank Plc, Block 015 Zone 1 Edo Ezemewi Road, Nnewi, Anambra, BranchAccess Bank Plc, 222 Zik Avenue, Anambra, BranchAccess Bank Plc, 48 Port Harcourt Road Bridge Head Anambra State, Anambra, BranchAccess Bank Plc, Uga Road, Ekwulobia Ekwulobia Aguata Lga, Anambra, BranchAccess Bank Plc, 62 New Market Road, Anambra, BranchAccess Bank Plc, Umunze Ogbunka Road Orumba North Local Govt Anambra State, Anambra, BranchAccess Bank Plc, 1 Ajaekwe Street Odoagba, Anambra, BranchAccess Bank Plc, Ihiala Branch Anambra State, Anambra, BranchAccess Bank Plc, Up Iweka Onitsha (Electronic Mkt Branch), Anambra, BranchAccess Bank Plc, Building Material Market, Anambra, BranchAccess Bank Plc, Nnamdi Azikiwe University Awka Anambra State, Anambra, BranchAccess Bank Plc, Nigeria Stock Exchange Complex Onitsha Anambra State, Anambra, BranchAccess Bank Plc, University of Agriculture Umudike Main Campus Abia State, Anambra, BranchAccess Bank Plc, 1 Ajaekwe Street Odoagba, Anambra, BranchAccess Bank Plc, 24 Muritala Mohammed Way Bauchi, Bauchi, Branch
Access Bank Plc, along Kano-Duara Rd, Bauchi, BranchAccess Bank Plc, Plot 3, Onopa Commercial Layout Onopa, Bayelsa, BranchAccess Bank Plc, Km 6, Mbiama/ Yenagoa Road, Bayesla, BranchAccess Bank Plc, 5 Ogiri Oko Road G.R.A, Benue, BranchAccess Bank Plc, Benue Cement Factory Km 72, Makurdi-Gboko Road, Benue, BranchAccess Bank Plc, 19, Federal Road Oturkpo Benue State, Benue, BranchAccess Bank Plc, 5/7 J.S. Tarka Way NUM Intl Bank, Katsina State, Benue, BranchAccess Bank Plc, Y-Junction Katsina Ala Road Zaki Ibiam Benue State, Benue, BranchAccess Bank Plc, 45 Muritala Mohammed Way, Cross, BranchAccess Bank Plc, Hospital Road Ogoja Cross River State, Cross, BranchAccess Bank Plc, 45 Muritala Mohammed Way, Cross River, BranchOffsite, Unicem Factory, Calabar, Cross River, OffsiteAccess Bank Plc, 16/18 Bogobiri Road, Cross Rivers, BranchAccess Bank Plc, 304 Nnebisi Road, Delta, BranchAccess Bank Plc, 126, Old Asaba Road Asaba Road, Delta State, Delta, BranchAccess Bank Plc, Robson Shopping Complex Deco Road Delta State, Delta, BranchAccess Bank Plc, I Damaturu Road Biu Yobe/Borno, Delta, BranchAccess Bank Plc, Warri Road Sapele Delta State, Delta, BranchAccess Bank Plc, 44 Ogoja Road, Ebonyi, BranchAccess Bank Plc, 41 Ogoja Road, Ebonyi, BranchAccess Bank Plc, 135 Akpapava Road, Edo, BranchAccess Bank Plc, 74 Edo Textile Mill Road, Edo, BranchAccess Bank Plc, Alumni Centre University of Benin Ugbowo Benin City, Edo, BranchAccess Bank Plc, 23 Airport Road Benin Edo, Edo, BranchOffsite, 3, Oroyinyin Street Idumota Lagos, Edo, Offsite Access Bank Plc, New Site Igbinedion University Campus Edo State, Edo, BranchAccess Bank Plc, beside Fed Poly Auchi I Iyekhei /Polytechnic Road, Edo, BranchAccess Bank Plc, 6 Akhere Lane Edo State, Edo, Branch
204 Access Bank Plc Annual Report and Accounts 2012
ATM locations continuedAccess Bank Plc, 45 Akpakpava Street, Edo, BranchAccess Bank Plc, 164 Sapele Road, opposite NPDC, Sapele Road, Edo, BranchAccess Bank Plc, 170 Uselu Lagos Road, Edo, BranchAccess Bank Plc, Plot 5, Commercial Block A Along New Iyin Road, Ekiti, BranchAccess Bank Plc, 5 Okpara Avenue, Enugu State Enugu 1, Enugu, BranchAccess Bank Plc, 12 Enugu Road, Enugu, BranchAccess Bank Plc, 42 Kenyatta Street, Enugu State, Enugu, BranchAccess Bank Plc, Enugu State University Agbani Town Enugu State, Enugu, BranchAccess Bank Plc, Agbani Road Agbani Main Town Enugu, Enugu, BranchAccess Bank Plc, University of Nigeria Nsukka Enugu State, Enugu, BranchAccess Bank Plc, Abakpa Nike Enugu Enugu State, Enugu, BranchAccess Bank Plc, 67 Ogui Road by Nnamdi Azikiwe Stadium, Enugu, BranchAccess Bank Plc, University of Nigeria Enugu Campus, Enugu, BranchAccess Bank Plc, Plot 1195 Aminu Kano Crescent Wuse Ii (opp. Amal Court), Fct, BranchAccess Bank Plc, Plot 833 Adetokunbo Ademola Crsnt. Wuse 2, Fct, BranchAccess Bank Plc, Plot 247 Herbert Macaulay Way, Fct, BranchAccess Bank Plc, National Assembly White House Basement Abuja, Fct, BranchAccess Bank Plc, Ahmadu Bello Way Garki Ii Abuja, Fct, BranchAccess Bank Plc, Plot 87 Yakubu Gowon Crescent Asokoro, Fct, BranchAccess Bank Plc, Plot 59, Gado Nasko Road Kubwa, Fct, BranchAccess Bank Plc, Erisco Bonpet Plaza Wuse Market, Fct, BranchAccess Bank Plc, Plot 256 Herbert Macaulay Way behind Unity Bank Head Office Abuja Nigeria, Fct, BranchAccess Bank Plc, 8 New Market Road, Gombe, BranchAccess Bank Plc, Dukku Local Government Secretariat, Gombe State, Gombe, BranchAccess Bank Plc, Deba Gra, Yamaltu Deba Lga, Gombe, BranchAccess Bank Plc, Ashaka Cement Factory, Gombe, BranchAccess Bank Plc, 18 Wetheral Road, Imo, BranchAccess Bank Plc, Federal Polytechnic Nekede Imo State, Imo, Branch
Access Bank Plc, Eke-Ahiara Junction Mbaise, Imo, BranchAccess Bank Plc, Plot 10/11 Sani Abacha Way Dutse, Jigawa, BranchAccess Bank Plc, 26D Ali Akilu Road Kaduna State, Kaduna, BranchAccess Bank Plc, 16, River Road, Zaria, Kaduna, BranchAccess Bank Plc, 314 Kachia Road Kaduna Kaduna State, Kaduna, BranchAccess Bank Plc, A2 Ahmadu Bello Way Kaduna State, Kaduna, BranchAccess Bank Plc, NNPC Kaduna Kaduna State, Kaduna, BranchAccess Bank Plc, Gumi Main Market, Kaduna, BranchOffsite, Kafanchan, Kaduna, Offsite Access Bank Plc, 7, Kwato Road Ungwan Rimi Gra Kaduna State, Kaduna, BranchAccess Bank Plc, 16/20 Bida Road, Kaduna, BranchAccess Bank Plc, 146 Murtala Mohmd Way Kano State, Kano, BranchOffsite, 26D Ali Akilu Road Kaduna State, Kano, Offsite Access Bank Plc, 24 Bello Road Kano Kano State, Kano, BranchAccess Bank Plc, 3B Bank Road Kano State, Kano, BranchAccess Bank Plc, Ibrahim Taiwo Road by Aib Kano State, Kano, BranchAccess Bank Plc, Main Campus Bayero University Kano State, Kano, BranchAccess Bank Plc, Aminu Kano Teaching Hospital Kano State, Kano, BranchAccess Bank Plc, Zaria Road, Katsina State, Kano, BranchAccess Bank Plc, Kafanchan, Kano, BranchAccess Bank Plc, along Katsina Road by Bichi Junction Kano State, Kano, BranchAccess Bank Plc, 17/18 France Road Kano Kano State, Kano, BranchAccess Bank Plc, 12B Post Office Road, Kano, BranchOffsite, 13/15 Atiku Abubakar (Mubi) Road, Katsina, OffsiteAccess Bank Plc, Ibb Way opp. NUM Intl Bank, Katsina, BranchAccess Bank Plc, along Funtua Road near Total Filling Station Katsina, Katsina, BranchAccess Bank Plc, along Kano Road besides Nitel Office Katsina State, Katsina, BranchAccess Bank Plc, 106 Ibb Way, Katsina, BranchAccess Bank Plc, 1 Jos Road G.R.A, Kebbi, BranchAccess Bank Plc, Obajana Cement Factory, Kogi, Branch
Access Bank Plc, along Kogi Road, Kogi, BranchAccess Bank Plc, 82 Lokoja Kabba Road Lokoja, Kogi, BranchAccess Bank Plc, 24 Wahab Folawiyo Unity Road, Kwara, BranchAccess Bank Plc, 29A Reservation Road Gra Ilorin, Kwara, BranchAccess Bank Plc, Stadium Shopping Complex Taiwo Road Ilorin, Kwara, BranchAccess Bank Plc, 183, Obafemi Awolowo Road Lagos State, Lagos, BranchAccess Bank Plc, 24A Creek Road Apapa, Lagos, BranchAccess Bank Plc, Plot 1617, Damole/Idejo Street Victoria Island, Lagos, BranchAccess Bank Plc, 4 Agudosi St, off Ojo Road Alaba Intl Market Lagos State, Lagos, BranchAccess Bank Plc, 54 Toyin Street Lagos State, Lagos, BranchAccess Bank Plc, 125 Ladipo Street Lagos State, Lagos, BranchAccess Bank Plc, 1, Kingsway Road Ikoyi, Lagos State, Lagos, BranchAccess Bank Plc, 71 Adeniran Ogunsanya Street Surulere, Lagos State, Lagos, BranchAccess Bank Plc, 17 Sikiru Otunba St Old Ojo Road Lagos Badagry Expressway, Lagos, BranchAccess Bank Plc, Plot 1697 Adeola Hopewell Victoria Island, Lagos, BranchAccess Bank Plc, 48, Marina Street, Lagos State, Lagos, BranchAccess Bank Plc, 16 Apongbon Street, Apongbon, Lagos, BranchAccess Bank Plc, 32 Lagos Road, Lagos, BranchAccess Bank Plc, Conia House opposite Kano Plaza Trade Fair Complex, Lagos, BranchAccess Bank Plc, Teju Osho Street, Yaba, Lagos, BranchAccess Bank Plc, 92 Lagos/Abeokuta Expressway, Lagos, BranchAccess Bank Plc, Plot 650A 32 Road 3rd Avenue Festac Town, Lagos, BranchAccess Bank Plc, 23-25 Oba Akran Avenue, Lagos, BranchAccess Bank Plc, 87, Awolowo Road, Lagos, BranchAccess Bank Plc, 34, Moloney Street, Lagos, BranchAccess Bank Plc, 113, Okota Road, Lagos, BranchAccess Bank Plc, 11, Town Planning Way Ilupeju Lagos State, Lagos, BranchAccess Bank Plc, Plot 286, Oshodi Apapa Expressway Gbagada Phase I Lagos State, Lagos, Branch
Corporate Directorycontinued

205Access Bank Plc Annual Report and Accounts 2012
Corporate inform
ation
Access Bank Plc, Plot 7, Blk 2, Oniru Private Estate by Maroko Bus Stop Lagos State, Lagos, BranchAccess Bank Plc, 287, Ajose Adeogun Street Victoria Island, Lagos, BranchAccess Bank Plc, 38/40 Ikorodu Road Jibowu Lagos State, Lagos, BranchOffsite, Nahco Complex 1 Murtala Mohammed International Airport Road, Ikeja Lagos State, Lagos, Offsite Access Bank Plc, 13-15 Wharf Road Apapa Lagos State, Lagos, BranchAccess Bank Plc, 23, Opebi Road, Lagos, BranchAccess Bank Plc, 533, Ikorodu Road Ketu, Lagos, BranchAccess Bank Plc, 3, Alhaji Owokoniran Street Orile Coker Lagos State, Lagos, Branch Access Bank Plc, Shop A65 Alaba Intl Market Ojo, Lagos, BranchAccess Bank Plc, 653 Abeokuta Express Road Abule Taylor Abule-Egba Lagos State, Lagos, BranchAccess Bank Plc, 77 Obafemi Awolowo Way (Man House), Lagos State, Lagos, BranchAccess Bank Plc, 52/54 Kosoko Street Lagos State, Lagos, BranchAccess Bank Plc, 1A Ogudu Road, Lagos State, Lagos, BranchAccess Bank Plc, Plot 1408A Adetokunbo Ademola Street Victoria Island, Lagos, BranchAccess Bank Plc, 68 Nnamdi Azikwe Road Street Idumota Lagos State, Lagos, BranchAccess Bank Plc, 35 Akowonjo Road Lagos State, Lagos, BranchAccess Bank Plc, 78 Ojuelegba Road Tejuosho Lagos State, Lagos, BranchAccess Bank Plc, Iddo Shopping Complex Iddo, Lagos, Lagos, BranchAccess Bank Plc, 4 Ikotun Junction Ikotun Lagos State, Lagos, BranchAccess Bank Plc, 47, Mkt/Odunlami Street Lagos State, Lagos, BranchAccess Bank Plc, Old Alaba Motor Park Off Ojo Igbede Lagos State, Lagos, BranchAccess Bank Plc, 3, Oroyinyin Street Idumota Lagos, Lagos, BranchAccess Bank Plc, 8 Apapa Express Way Ibafon Coconut, Lagos, BranchAccess Bank Plc, Muritala Mohamed Way Oyingbo Ebute-Metta, Lagos, BranchAccess Bank Plc, 13, Allen Avenue Ikeja Lagos, Lagos, BranchAccess Bank Plc, 44, Adeola Odeku Street, Lagos, BranchAccess Bank Plc, Opposite Zone F Block 1, Lagos State, Lagos, Branch
Access Bank Plc, Ijeshatedo Surulere Lagos State, Lagos, BranchAccess Bank Plc, 279, Agege Motor Road Mushin Lagos State, Lagos, BranchAccess Bank Plc, University of Lagos Akoka Lagos State, Lagos, BranchAccess Bank Plc, 51, Kudirat Abiola Way Oregun Road Lagos State, Lagos, BranchAccess Bank Plc, 1 Godwin Omonua Street Ire Akari Estate Lagos State, Lagos, BranchAccess Bank Plc, 290, Herbert Macaulay Way Sabo Lagos State, Lagos, BranchAccess Bank Plc, 211 Muri Okunola Street Victoria Island Lagos State, Lagos, BranchAccess Bank Plc, 44A Saka Tinubu Street off Adeola Odeku Street Victoria Island Lagos, Lagos, BranchAccess Bank Plc, 87 Itire/Lawanson Road Surulere, Lagos, BranchAccess Bank Plc, 134 Water Works Road Iju-Ishaga, Lagos, BranchAccess Bank Plc, Olorunsogo Oshodi, Lagos, BranchAccess Bank Plc, Plot 101, Isheri Road Lagos State, Lagos, BranchAccess Bank Plc, 18 Osolo Way Ajao, Lagos, BranchAccess Bank Plc, 32, Broad Street, Lagos, BranchAccess Bank Plc, 6 Diya Street, Lagos, BranchAccess Bank Plc, 67 St Finbarrs Road Chemist Bus Stop, Lagos, BranchAccess Bank Plc, Plot 1/3 Enitan Street Surulere, Lagos, BranchAccess Bank Plc, Ikota Shopping Complex Lekki, Lagos, BranchAccess Bank Plc, opposite Tantalizers Old Ojo Road Abule Ado Lagos State, Lagos, BranchAccess Bank Plc, Lagos State University Ojo Lagos State, Lagos, BranchAccess Bank Plc, Daniel Farm Km32 Lagos Abeokuta Agege Lagos State, Lagos, BranchAccess Bank Plc, opp. 2nd Gate Lagos Polytechnic Lagos State, Lagos, BranchAccess Bank Plc, along Ejigbo/Ikotun Road Opp NNPC Junction Lagos State, Lagos, BranchAccess Bank Plc, 71 Egbeda/Idimu Road Idimu Lagos State, Lagos, BranchAccess Bank Plc, Daleko Market Complex Daleko Market, Lagos, BranchAccess Bank Plc, Oba Adeniji Adele Plaza Adeniji Adele Road Lagos State, Lagos, BranchAccess Bank Plc, 4 Burma Road Apapa, Lagos, Branch
Access Bank Plc, 6 Obun Eko Street Idumota, Lagos, BranchAccess Bank Plc, 134/136 Broad Street, Lagos, BranchAccess Bank Plc, Plot 1/3 Enitan Street Surulere, Lagos, BranchOffsite, Bagco Factory, Iganmu, Surulere, Lagos, OffsiteAccess Bank Plc, 7 Ayangburen Road Ikorodu, Lagos, BranchAccess Bank Plc, 84 Allen Avenue Ikeja, Lagos, BranchOffsite, Newco Factory Oba Akran, Lagos, OffsiteOffsite, Unico Factory, Oba Akran, Lagos, OffsiteAccess Bank Plc, Plot 1665 Oyin Jolayemi Street, Victoria Island, Lagos, BranchOffsite, Oko Awo Street, Karim Kotun Street, Victoria Island, Lagos, OffsiteOffsite, Oladele Olashore Street, Off Oyin Jolayemi, Victoria Island, Lagos, OffsiteAccess Bank Plc, 30 King George V Road Onikan, Lagos, BranchAccess Bank Plc, Plot 1617, Damole/Idejo Street Victoria Island, Lagos, BranchAccess Bank Plc, 8/10 Commercial Road, Lagos, BranchAccess Bank Plc, 53 Adeniyi Jones Street Ikeja, Lagos, BranchOffsite, Dangote Adstart Factory, Oba Akran, Lagos, OffsiteOffsite, Dangote Agrosack Factory, Oba Akaran, Lagos, OffsiteAccess Bank Plc, Kirikiri Lighter Terminal 2 Tincan Island, Lagos, BranchAccess Bank Plc, 153 Old Ojo Road Kuje-Amuwo Agboju, Lagos, BranchAccess Bank Plc, 171 Abeokuta Expressway Iyana Ipaja Ipaja, Lagos, BranchAccess Bank Plc, 4 Palm Avenue Mushin, Lagos, BranchAccess Bank Plc, 20 Simbiat Abiola Road Ikeja, Lagos, BranchAccess Bank Plc, 30A Adetokunbo Ademola Victoria Island, Lagos, BranchAccess Bank Plc, Zone B R4 Mercy Cafe Aspamda Plaza Trade Fair Complex, Lagos, BranchAccess Bank Plc, 6 Mobolaji Bank-Anthony Way Ikeja, Lagos, BranchAccess Bank Plc, 150 Ogunlana Drive Surulere, Lagos, BranchAccess Bank Plc, Plot 650A 32 Road 3rd Avenue Festac Town, Lagos, BranchAccess Bank Plc, Plot 15 Ligali Ayorinde, Lagos, BranchAccess Bank Plc, 25A Ilupeju Bye-Pass Ilupeju, Lagos, Branch
206 Access Bank Plc Annual Report and Accounts 2012
ATM locations continuedAccess Bank Plc, I Point Road, Apapa, Lagos, Lagos, BranchAccess Bank Plc, 40A/40B Ogba Ijaiye Road Ogba, Lagos, BranchAccess Bank Plc, 18 Osolo Way Ajao, Lagos, BranchAccess Bank Plc, College of Medicine Ishaga Road Idi-Araba, Lagos, BranchAccess Bank Plc, Commerce House 1 Idowu Taylor Street, Lagos, BranchAccess Bank Plc, Idowu Taylor, Street, Victoria Island, Lagos, OffsiteAccess Bank Plc, beside Chevron Round About along Lekki-Epe Expressway, Lagos, BranchAccess Bank Plc, Bank of Industry Building Broad Street, Marina, Lagos, BranchAccess Bank Plc, 11A, Adeola Odeku Street Victoria Island, Lagos, BranchAccess Bank Plc, 58 Awolowo Road Ikoyi, Lagos, BranchAccess Bank Plc, 32 Jos Road, Nasarawa, BranchAccess Bank Plc, Plot 3316, Abuja Keffi Expressway Mararaba Nasarawa State, Nasarawa, BranchAccess Bank Plc, 2 Old Airway Road off Boso Road, Niger, BranchAccess Bank Plc, Suleman Barau Road Opposite Gamco Motors, Niger, BranchAccess Bank Plc, Along BCC Road Niger State, Niger, BranchAccess Bank Plc, Nicon Building 1 Bank Road Minna, Niger, BranchAccess Bank Plc, NNPC Suleja Depot, Niger, BranchAccess Bank Plc, Redemption Camp Km 46/85 Lagos/Ibadan Express Way Ogun State, Ogun, BranchAccess Bank Plc, 14 Lalubu Street Oke – Ilewo Abeokuta, Ogun, BranchAccess Bank Plc, 145, Lagos-Abeokuta Express Way Ogun State, Ogun, BranchAccess Bank Plc, 19, Ibadan Road Ogun State, Ogun, BranchAccess Bank Plc, 71, Akarigbo Rd Sagamu Ogun State, Ogun, BranchAccess Bank Plc, opposite Covenant University Otta Ogun State, Ogun, BranchAccess Bank Plc, Ona Ola Quarters opposite Fire Station Ogun State, Ogun, BranchAccess Bank Plc, Wempco Factory, Ibafo, Ogun, OffsiteAccess Bank Plc, Bank Road Agbara Industrial Estate, Ogun, BranchAccess Bank Plc, 11 Ado Owo Road, Ondo State, Ondo, Branch
Access Bank Plc, Plot 5, Commercial Block A along New Iyin Road, Ondo, BranchAccess Bank Plc, No 17 Oyemekun Road Akure, Ondo, BranchAccess Bank Plc, Yaba Ondo, Ondo, Branch Access Bank Plc, Adekunle Ajasin University Campus, Ondo, BranchAccess Bank Plc, Plot 2 Aiyedun Layout Gbongan, Osun, BranchAccess Bank Plc, 26 Aderemi Road Osun State Ile Ife, Osun, BranchAccess Bank Plc, Obafemi Awolowo University Campus Osun State, Osun, BranchAccess Bank Plc, 107A, Orinkiran Street Oshogbo Road, Osun, BranchAccess Bank Plc, 34 New Court Road Dugbe, Oyo, BranchAccess Bank Plc, Plot 6 University Crescent, Oyo, BranchAccess Bank Plc, Apake Area, Ogbomoso Oyo State, Oyo, BranchAccess Bank Plc, 4, Iwo Road Ibadan Oyo State, Oyo, BranchAccess Bank Plc, 50 Adekunle Fajuyi Road Eko Tedo Iya-Olobe, Oyo, BranchAccess Bank Plc, beside Blood Bank UCH Ibadan, Oyo State Oyo State, Oyo, BranchAccess Bank Plc, Challenge Roundabout Ibadan Oyo State, Oyo, BranchAccess Bank Plc, Old Ibadan/Oyo Road besides Olona Filling Station Oyo State, Oyo, BranchAccess Bank Plc, opposite Mobil Filling Station Ring Road Oyo State, Oyo, BranchAccess Bank Plc, 1 Jimoh Odutola Street Dugbe Market, Oyo, BranchAccess Bank Plc, 37 Iwo Road, Oyo, BranchAccess Bank Plc, Plot 32 Bodija Ui Road Bodija, Oyo, BranchAccess Bank Plc, 37, Beach Road, Jos, Plateau, BranchAccess Bank Plc, 28A Rwang Pam Road, Plateau, BranchAccess Bank Plc, Yelwa Junction Bukuru, Plateau, BranchAccess Bank Plc, PPMC Depot, Rivers, BranchAccess Bank Plc, Plot 9 Olu Obasanjo Road PHC Rivers State, Rivers, BranchAccess Bank Plc, Plot 446/447 Trans Amadi Industrial Layout Port Harcourt, Rivers, BranchAccess Bank Plc, Plot 382, Port Harcourt- Aba Expres Port Harcourt Rivers State, Rivers, Branch
Access Bank Plc, University of Port-Harcourt Port-Harcourt Rivers State, Rivers, BranchAccess Bank Plc, Ikowku Rivers State, Rivers, BranchAccess Bank Plc, Obigbo, Rivers State, Rivers, BranchAccess Bank Plc, Woji, Rivers State, Rivers, BranchAccess Bank Plc, 82/88 Aba Road beside Mtn Building Opp. Tarpaulin House Rivers State, Rivers, BranchAccess Bank Plc, by Eastern Bulkcement Coy Ltd Wofe Road Rivers State, Rivers, BranchAccess Bank Plc, 5, Azikiwe Road near Government House Rivers State, Rivers, BranchAccess Bank Plc, River State University of Science and Technology Rivers State, Rivers, BranchAccess Bank Plc, Plot 10 Trans Amadi Industrial Layout near Erijoy Hotel, Rivers, BranchAccess Bank Plc, 329A Olu Obasanjo Road Port-Harcourt, Rivers, BranchAccess Bank Plc, 12 Azikiwe Road, Rivers, BranchAccess Bank Plc, 64 Hospital Road, Rivers, BranchAccess Bank Plc, No 1 Agip Road beside Kilimanjaro Mile 4 Rumueme, Rivers, BranchAccess Bank Plc, Bank Road opposite High Court, Rivers, BranchAccess Bank Plc, 679 Ikwerre Road Rumuokoro Round About, Rivers, BranchAccess Bank Plc, 20 Abdullahi Fodio Road, Sokoto, BranchAccess Bank Plc, Main Campus Usman Danfodio University, Sokoto, BranchAccess Bank Plc, opp. Afribank Plc Maiduguri Road Sokoto, Sokoto, BranchAccess Bank Plc, 57B Hammaruwa Way Jalingo, Taraba, BranchAccess Bank Plc, 12B Maiduguri Road along Potiskum Damaturu Road, Yobe, BranchAccess Bank Plc, 10 Sani Abacha Way, Zamfara, Branch
Corporate Directorycontinued
207Access Bank Plc Annual Report and Accounts 2012
Corporate inform
ation
Subsidiaries’ addresses
Access Bank Côte d’Ivoire Immeuble Woodin Center Avenue Nogues Abidjan Plateau, 01 BP 6928 Abidjan 01 T: (+225) 20 31 58 30 F: (+225) 20 22 56 41 E: [email protected] W: www.accessbankplc.com/ci
Access Bank (D.R. Congo) Sárl158, Avenue de la Démocratie Kinshasa, Gombe Democratic Republic of the Congo T: (+243) 81 22 22 111–14 F: (+243) 81 22 22 116 E: [email protected] W: www.accessbankplc.com/cd
Access Bank (Gambia) LimitedHead Office 47, Kairaba Avenue Fajara, K.S.M.D. P.O. Box 3177 Serrekunda The Gambia T: (+220) 4398227, 4399022 F: (+220) 4396640 E: [email protected] W: www.accessbankplc.com/gm
Access Bank (Ghana) Limited Starlets ‘91 Road Opposite Accra Sports Stadium P.O. Box GP 353 Osu, Accra Ghana T: (+233) 302 684 860 E: [email protected] W: www.accessbankplc.com/gh T: (+233) 302 200 868
Access Bank (Rwanda) Limited3rd Floor, UTC Building Avenue de la Paix P.O. Box 2059 Kigali, Rwanda T: (+250) 252 500089/90-94 F: (+250) 252 575761, 572501 E: [email protected] or [email protected] W: www.accessbankplc.com/rw
Access Bank (Sierra Leone) LimitedHead Office 30, Siaka Stevens Street Freetown Sierra Leone T: (+232) 25 334933 F: (+232) 22 220119 E: [email protected] W: www.accessbankplc.com/sl
Access Bank (Zambia) Limited Plot 682, Cairo Road Northend P.O. Box 35273 Lusaka Zambia T: (+260) 211 227941 F: (+260) 211 22996, 227956 E: [email protected] W: www.accessbankplc.com/zm
The Access Bank UK LimitedHead Office 1, Cornhill London EC3V 3ND United Kingdom E: [email protected] W: www.theaccessbankukltd.co.uk
Mailing AddressThe Access Bank UK Limited 4, Royal Court Gadbrook Park Northwich Cheshire CW9 7UT United Kingdom
FinBank SA16, Boulevard de La Liberté Place de I’Indépendence B.P. 2998 Bujumbura-Burundi Burundi T: (+257) 22 24 32 06 F: (+257) 22 24 32 07 E: [email protected] W: www.finbankburundi.com
Non-banking subsidiaries’ addresses
Intercontinental Properties Limited274, Murtala Mohammed Way Herbert Macaulay Street Alagomeji, Yaba, Lagos E: info@intercontinentalproperties limited.com W: www.intercontinentalproperties limited.com T: 01-2771459
Wapic Insurance Plc119, Awolowo Road Ikoyi, Lagos E: [email protected] W: www.intercontinentalwapicinsplc.com T: 01-4615153, 01-4611637, 01-8119857 F: 01-4613433
Intercontinental Life Assurance Company Limited6, Hughes Avenue Alagomeji, Yaba, Lagos T: 01-4611637, 01-8119857, 01-4615153 F: 01-4630754 W: www.intercontinentallifeng.com
Intercontinental Homes Savings & Loans Limited26, Adeola Hopewell Street, Victoria Island, Lagos T: 01-2771127, 01-2770037 E: [email protected] W: www.intercontinentalhomes.com
208 Access Bank Plc Annual Report and Accounts 2012
Correspondent banks
Bank of BeirutNig. Rep Office 5 Alfred Rewane Street Ikoyi, Lagos
Bank of ChinaNo. 1, Fuxingmen Nei Da Jie Beijing P. R. China 100818
BNP PARIBAS Paris37, Place du Marché Saint-Honoré-75031 Paris Cedex 01 France
Byblos Bank, LondonSuite 5, Berkeley Square House Berkeley Square London W1J 6BS, UK
CitiBank LondonCitigroup Center, Canada Square Canary Wharf London E14 5LB, UK
CitiBank New York 111, Wall Street 19th Floor/Zone 1 New York NY 10043 USA
CommerzBank AGCorporate Banking Structured Export and Trade Finance Kaiserplatz 60311 Frankfurt am Main Germany
Credit Suisse AG Giesshübelstrasse 30 P.O. Box 100 CH-8070 Zurich
Danske Bank2-12, Holmens Kanal DK-1092 Copenhagen K Denmark
Deutsche Bank6, Bishopsgate London EC2N 4DA, UK
FBN UK28, Finsbury Circus London EC2M 7DT, UK
Handelssbanken Int. (Svenska)SE-106 70 Stockholm Sweden
HSBC BankJohannesburg Branch 2, Exchange Square 85, Mauder Street Sandound, Sandton, 2196. S.A.
IFC2121, Pennsylvania Av. NW Washington DC 20433 USA
ING 24, Avenue Marmix, B – 1000 Brussels, Belgium
J.P. MorganTrinity Tower 9, Thomas More Street London E1W 1YT, UK
KBC Bank BelgiumKBC Bank NV Havenlan 12 1080 Brussels, Belgium
Mashreq BankPost Box 1250 Dubai, U.A.E.
Nordea BankHamngatan 10, SE-105 71 Stockholm Sweden
Standard Bank of South Africa25, Saver Street Johannesburg 2001, S.A.
Standard Chartered Bank, London22, Billiter Street London EC3M 2RY, UK
Sumitomo Mitsui Banking Corporation Europe Limited99, Queen Victoria Street London EC4V 4EH, UK
The Access Bank UK Limited1, Cornhill London EC3V 3ND, UK
UBS P.O. Box CH – 8098 Zurich
Union Bank UK 14-18, Copthall Avenue London EC2R 7DJ, UK
United Bank for Africa 40, East 52nd Street New York 10022-5911, USA
WESTLB AG, GermanyHerzogstrasse 15, 40217 Dusseldorf Post Office 40199 Dusseldorf, Germany
Zenith Bank (UK) Limited39, Cornhill London EC3V 3ND, UK
Corporate Directorycontinued

Designed and produced by MerchantCantos, www.merchantcantos.com
Printed by Empress Litho Limited Printed on Greencoat 55 Silk which is carbon balanced paper. This means the carbon intensity has been measured through the production process and an equivalent carbon credit (offset) has been purchased. It is made from 55% recovered fibre, diverting waste from landfill, and contains material sourced from responsibly managed forests together with recycled fibre, certified in accordance with the FSC (Forest Stewardship Council). It is manufactured to the ISO 14001 international standard, minimising negative impacts on the environment.

Access Bank PlcThe Plaza Plot 999c, Danmole Street Off Adeola Odeku/Idejo Street PMB 80150 Victoria Island Lagos Nigeria T: (+234) 1-2773300,
(+234) 1-2805628-9
www.accessbankplc.com